
Combining ROC Curves to Improve Diagnostic Values for Vitamin D3 and Chloride Co-Transporters in Connection to Epilepsy and Sleep Problems, Comorbidities in Autism Spectrum Disorders


Abstract
1. Introduction
2. Materials and Methods
2.1. Participants
2.2. Severity Assessment
2.2.1. Childhood Autism Rating Score (CARS)
2.2.2. Social Responsiveness Scale (SRS)
2.3. Blood Sample Collection
2.4. Biochemical Analysis
2.5. Statistical Analysis
3. Results
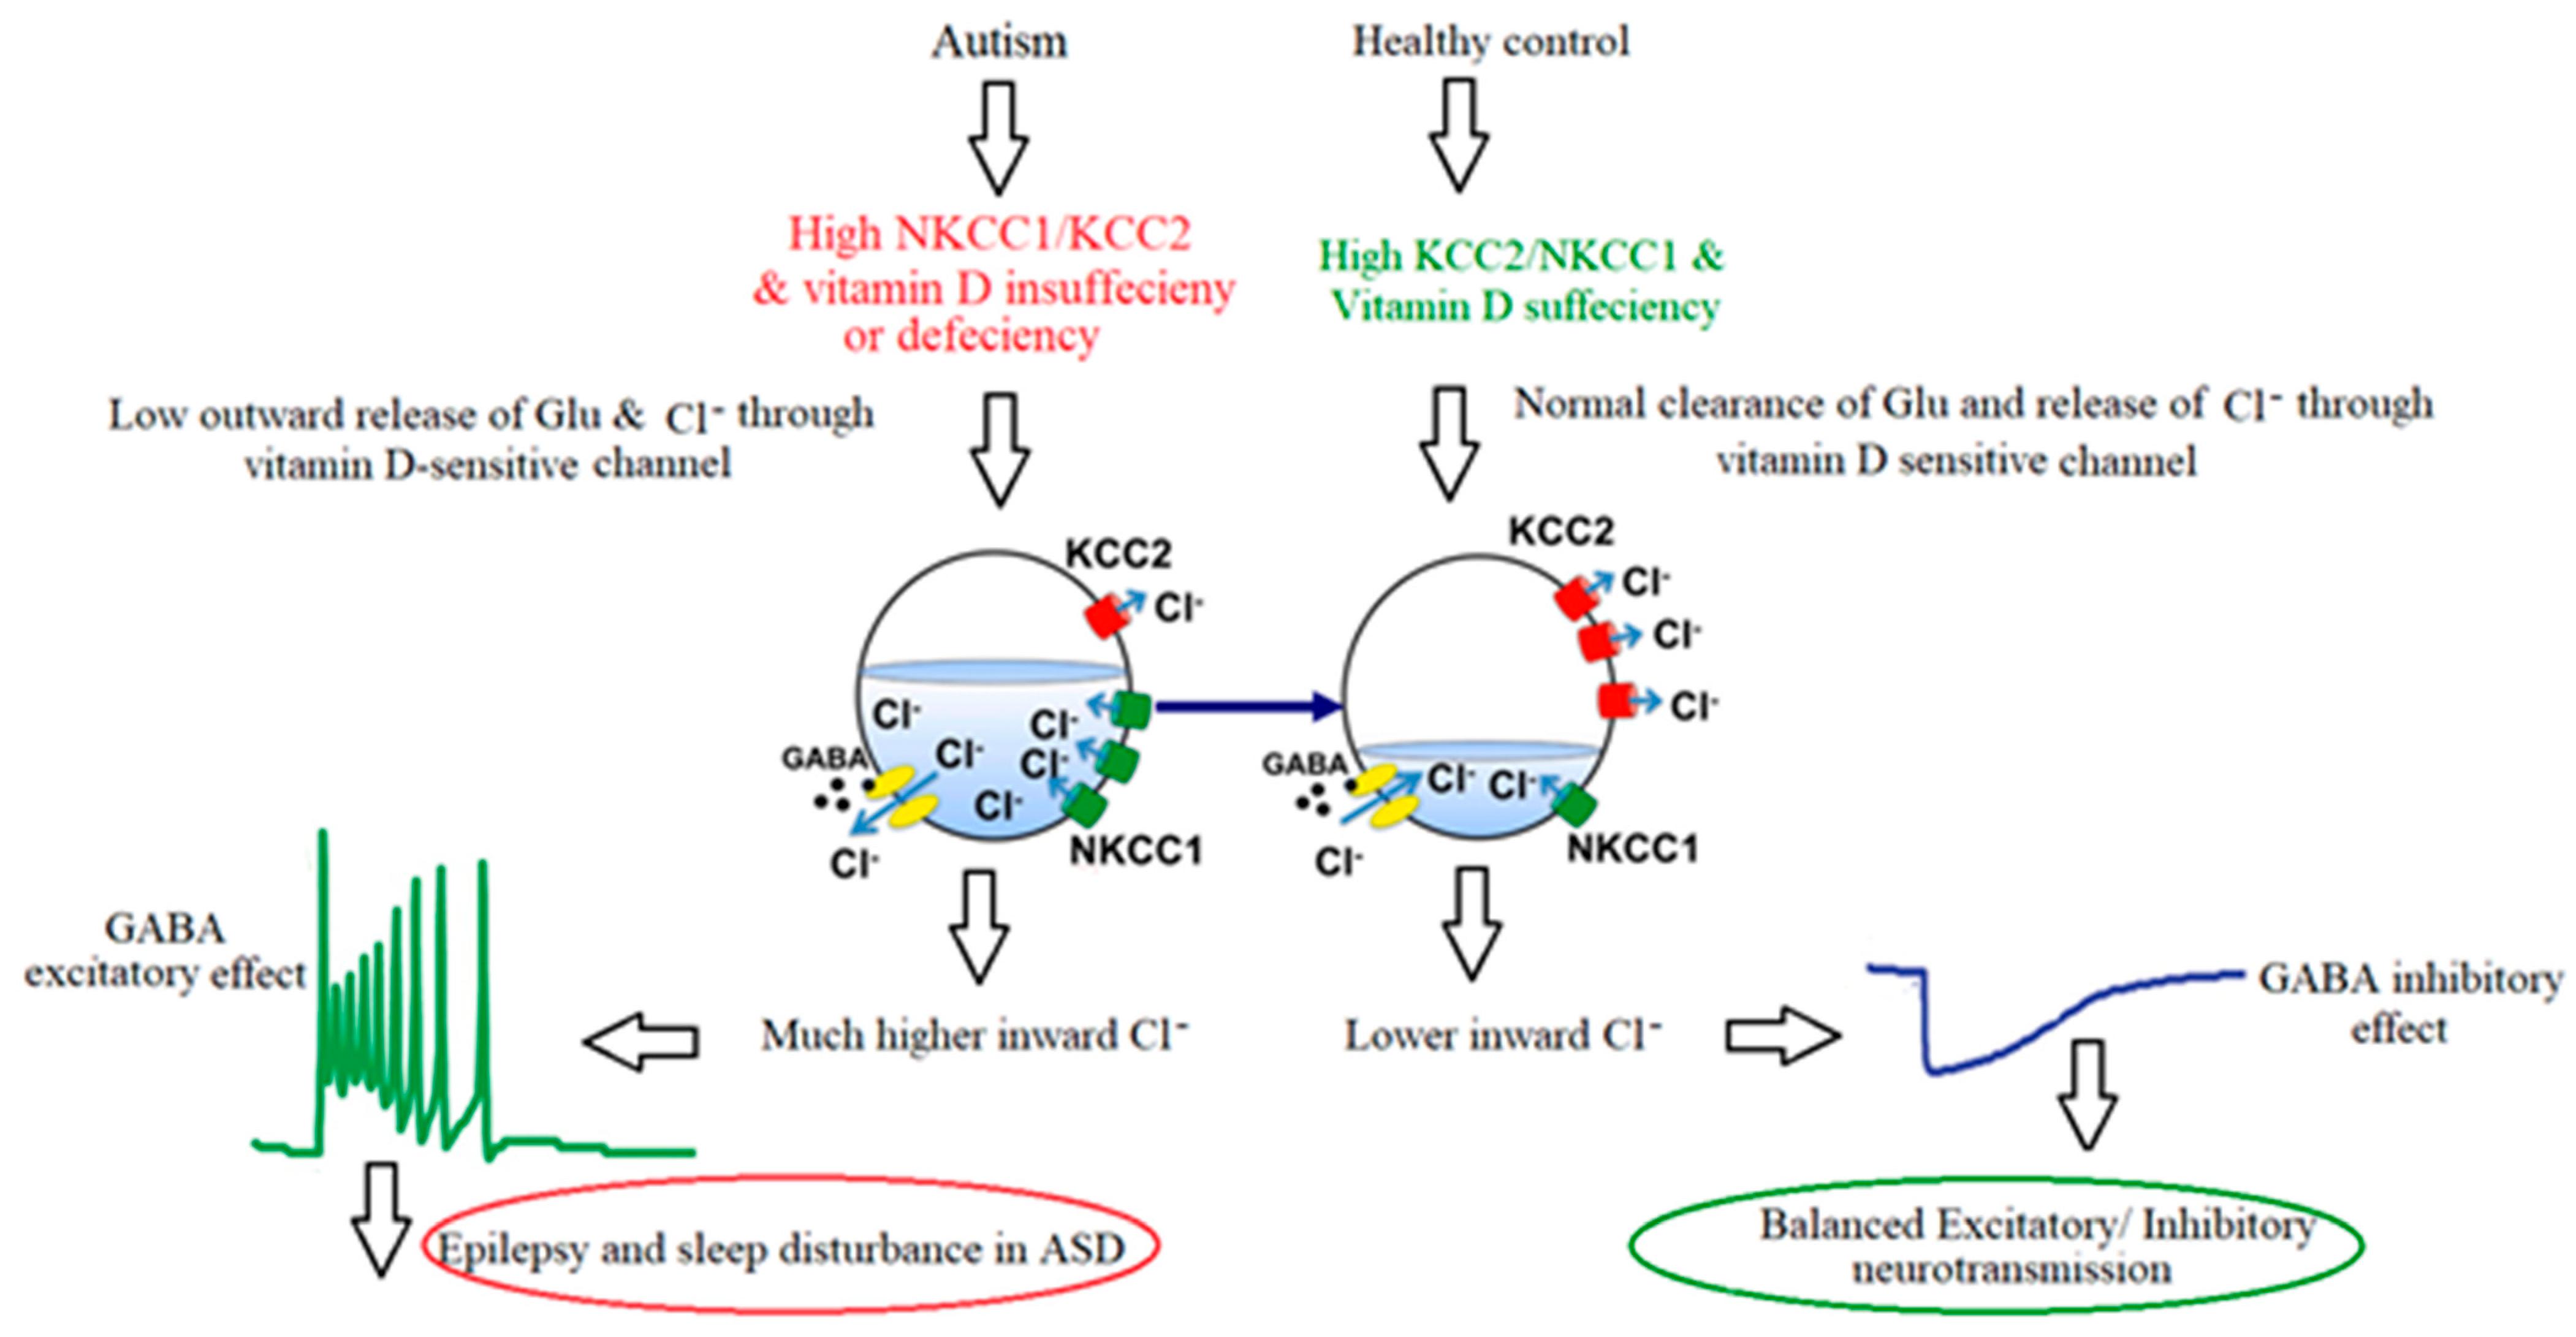
4. Discussion
5. Conclusions
Author Contributions
Funding
Institutional Review Board Statement
Informed Consent Statement
Data Availability Statement
Acknowledgments
Conflicts of Interest
References
- Lemonnier, E.; Degrez, C.; Phelep, M.; Tyzio, R.; Josse, F.; Grandgeorge, M.; Hadjikhani, N.; Ben-Ari, Y. A randomised controlled trial of bumetanide in the treatment of autism in children. Transl. Psychiatry 2012, 2, e202. [Google Scholar] [CrossRef] [PubMed]
- El-Ansary, A.; Al-Ayadhi, L. GABAergic/glutamatergic imbalance relative to excessive neuroinflammation in autism spectrum disorders. J. Neuroinflamm. 2014, 11, 189. [Google Scholar] [CrossRef]
- Inui, T.; Kumagaya, S.; Myowa-Yamakoshi, M. Neurodevelopmental hypothesis about the etiology of autism spectrum disorders. Front. Hum. Neurosci. 2017, 11, 354. [Google Scholar]
- Zhang, J.; Bhuiyan, M.I.H.; Zhang, T.; Karimy, J.K.; Wu, Z.; Fiesler, V.M.; Zhang, J.; Huang, H.; Hasan, M.N.; Skrzypiec, A.E. Modulation of brain cation-Cl− cotransport via the SPAK kinase inhibitor ZT-1a. Nat. Commun. 2020, 11, 78. [Google Scholar] [PubMed]
- Эль-Aнcapи, A. ГAMK, дeφициты нeйpoтpaнcмиттepa глyтaмaтa пpи ayтизмe и иx нeйтpaлизaция кaк нoвaя гипoтeзa эφφeктивнoй cтpaтeгии лeчeния. Ayтизм Нapyшeния Paзвития 2020, 18, 46–63. [Google Scholar]
- Kahle, K.T.; Staley, K.J.; Nahed, B.V.; Gamba, G.; Hebert, S.C.; Lifton, R.P.; Mount, D.B. Roles of the cation–chloride cotransporters in neurological disease. Nat. Clin. Pract. Neurol. 2008, 4, 490–503. [Google Scholar] [PubMed]
- Ben-Ari, Y. Excitatory actions of gaba during development: The nature of the nurture. Nat. Rev. Neurosci. 2002, 3, 728–739. [Google Scholar] [CrossRef]
- Dargaei, Z.; Bang, J.Y.; Mahadevan, V.; Khademullah, C.S.; Bedard, S.; Parfitt, G.M.; Kim, J.C.; Woodin, M.A. Restoring GABAergic inhibition rescues memory deficits in a Huntington’s disease mouse model. Proc. Natl. Acad. Sci. USA 2018, 115, E1618–E1626. [Google Scholar] [CrossRef]
- Tyzio, R.; Nardou, R.; Ferrari, D.C.; Tsintsadze, T.; Shahrokhi, A.; Eftekhari, S.; Khalilov, I.; Tsintsadze, V.; Brouchoud, C.; Chazal, G. Oxytocin-mediated GABA inhibition during delivery attenuates autism pathogenesis in rodent offspring. Science 2014, 343, 675–679. [Google Scholar]
- Duarte, S.T.; Armstrong, J.; Roche, A.; Ortez, C.; Perez, A.; O’Callaghan, M.d.M.; Pereira, A.; Sanmarti, F.; Ormazabal, A.; Artuch, R. Abnormal expression of cerebrospinal fluid cation chloride cotransporters in patients with Rett syndrome. PLoS ONE 2013, 8, e68851. [Google Scholar]
- Turk, J.; Bax, M.; Williams, C.; Amin, P.; Eriksson, M.; Gillberg, C. Autism spectrum disorder in children with and without epilepsy: Impact on social functioning and communication. Acta Paediatr. 2009, 98, 675–681. [Google Scholar] [PubMed]
- Cuccaro, M.L.; Tuchman, R.F.; Hamilton, K.L.; Wright, H.H.; Abramson, R.K.; Haines, J.L.; Gilbert, J.R.; Pericak-Vance, M. Exploring the relationship between autism spectrum disorder and epilepsy using latent class cluster analysis. J. Autism Dev. Disord. 2012, 42, 1630–1641. [Google Scholar]
- Viscidi, E.W.; Johnson, A.L.; Spence, S.J.; Buka, S.L.; Morrow, E.M.; Triche, E.W. The association between epilepsy and autism symptoms and maladaptive behaviors in children with autism spectrum disorder. Autism 2014, 18, 996–1006. [Google Scholar]
- Richard, A.E.; Scheffer, I.E.; Wilson, S.J. Features of the broader autism phenotype in people with epilepsy support shared mechanisms between epilepsy and autism spectrum disorder. Neurosci. Biobehav. Rev. 2017, 75, 203–233. [Google Scholar]
- Lodovichi, C.; Ratto, G.M. Control of circadian rhythm on cortical excitability and synaptic plasticity. Front. Neural Circuits 2023, 17, 1099598. [Google Scholar]
- Salihu, S.; Azlan, N.F.M.; Josiah, S.S.; Wu, Z.; Wang, Y.; Zhang, J. Role of the cation-chloride-cotransporters in the circadian system. Asian J. Pharm. Sci. 2021, 16, 589–597. [Google Scholar] [PubMed]
- Alfonsa, H.; Burman, R.J.; Brodersen, P.J.; Newey, S.E.; Mahfooz, K.; Yamagata, T.; Panayi, M.C.; Bannerman, D.M.; Vyazovskiy, V.V.; Akerman, C.J. Intracellular chloride regulation mediates local sleep pressure in the cortex. Nat. Neurosci. 2023, 26, 64–78. [Google Scholar]
- Maurer, J.J.; Choi, A.; An, I.; Sathi, N.; Chung, S. Sleep disturbances in autism spectrum disorder: Animal models, neural mechanisms, and therapeutics. Neurobiol. Sleep Circadian Rhythm. 2023, 14, 100095. [Google Scholar]
- Abrams, S.A.; Coss-Bu, J.A.; Tiosano, D. Vitamin D: Effects on childhood health and disease. Nat. Rev. Endocrinol. 2013, 9, 162–170. [Google Scholar]
- Bikle, D.D. Vitamin D: Newer concepts of its metabolism and function at the basic and clinical level. J. Endocr. Soc. 2020, 4, bvz038. [Google Scholar]
- Bouillon, R. Comparative analysis of nutritional guidelines for vitamin D. Nat. Rev. Endocrinol. 2017, 13, 466–479. [Google Scholar] [PubMed]
- Bouillon, R.; Manousaki, D.; Rosen, C.; Trajanoska, K.; Rivadeneira, F.; Richards, J.B. The health effects of vitamin D supplementation: Evidence from human studies. Nat. Rev. Endocrinol. 2022, 18, 96–110. [Google Scholar] [PubMed]
- Teagarden, D.L.; Meador, K.J.; Loring, D.W. Low vitamin D levels are common in patients with epilepsy. Epilepsy Res. 2014, 108, 1352–1356. [Google Scholar]
- Moulton, E.; Bradbury, K.; Barton, M.; Fein, D. Factor analysis of the childhood autism rating scale in a sample of two year olds with an autism spectrum disorder. J. Autism Dev. Disord. 2019, 49, 2733–2746. [Google Scholar]
- Schanding, G.T.; Nowell, K.P.; Goin-Kochel, R.P. Utility of the social communication questionnaire-current and social responsiveness scale as teacher-report screening tools for autism spectrum disorders. J. Autism Dev. Disord. 2012, 42, 1705–1716. [Google Scholar] [PubMed]
- Scharfman, H.E. The neurobiology of epilepsy. Curr. Neurol. Neurosci. Rep. 2007, 7, 348–354. [Google Scholar]
- Kang, S.K.; Kadam, S.D. Neonatal seizures: Impact on neurodevelopmental outcomes. Front. Pediatr. 2015, 3, 101. [Google Scholar]
- Staley, K. Molecular mechanisms of epilepsy. Nat. Neurosci. 2015, 18, 367–372. [Google Scholar]
- Banerjee, P.N.; Filippi, D.; Hauser, W.A. The descriptive epidemiology of epilepsy—A review. Epilepsy Res. 2009, 85, 31–45. [Google Scholar]
- McMoneagle, E.; Zhou, J.; Zhang, S.; Huang, W.; Josiah, S.S.; Ding, K.; Wang, Y.; Zhang, J. Neuronal K+-Cl-cotransporter KCC2 as a promising drug target for epilepsy treatment. Acta Pharmacol. Sin. 2024, 45, 1–22. [Google Scholar]
- Zavalin, K.; Hassan, A.; Zhang, Y.; Khera, Z.; Lagrange, A.H. Region and layer-specific expression of GABAA receptor isoforms and KCC2 in developing cortex. Front. Cell. Neurosci. 2024, 18, 1390742. [Google Scholar]
- Huberfeld, G.; Wittner, L.; Clemenceau, S.; Baulac, M.; Kaila, K.; Miles, R.; Rivera, C. Perturbed chloride homeostasis and GABAergic signaling in human temporal lobe epilepsy. J. Neurosci. 2007, 27, 9866–9873. [Google Scholar] [CrossRef]
- Lam, P.; Newland, J.; Faull, R.L.; Kwakowsky, A. Cation-chloride cotransporters KCC2 and NKCC1 as therapeutic targets in neurological and neuropsychiatric disorders. Molecules 2023, 28, 1344. [Google Scholar] [CrossRef] [PubMed]
- Andrews, K.; Josiah, S.S.; Zhang, J. The therapeutic potential of neuronal K-Cl Co-transporter KCC2 in Huntington’s disease and its comorbidities. Int. J. Mol. Sci. 2020, 21, 9142. [Google Scholar] [CrossRef]
- Lin, C.R.; Cheng, J.K.; Wu, C.H.; Chen, K.H.; Liu, C.K. Epigenetic suppression of potassium-chloride co-transporter 2 expression in inflammatory pain induced by complete Freund’s adjuvant (CFA). Eur. J. Pain. 2017, 21, 309–321. [Google Scholar] [CrossRef] [PubMed]
- Smalley, J.L.; Kontou, G.; Choi, C.; Ren, Q.; Albrecht, D.; Abiraman, K.; Santos, M.A.R.; Bope, C.E.; Deeb, T.Z.; Davies, P.A.; et al. The K-Cl co-transporter 2 is a point of convergence for multiple autism spectrum disorder and epilepsy risk gene products. bioRxiv 2020. Available online: https://api.semanticscholar.org/CorpusID:213170871 (accessed on 6 December 2024).
- Palma, E.; Amici, M.; Sobrero, F.; Spinelli, G.; Di Angelantonio, S.; Ragozzino, D.; Mascia, A.; Scoppetta, C.; Esposito, V.; Miledi, R. Anomalous levels of Cl− transporters in the hippocampal subiculum from temporal lobe epilepsy patients make GABA excitatory. Proc. Natl. Acad. Sci. USA 2006, 103, 8465–8468. [Google Scholar]
- Siegel, A.; Malkowitz, L.; Moskovits, M.J.; Christakos, S. Administration of 1,25-dihydroxyvitamin D3 results in the elevation of hippocampal seizure threshold levels in rats. Brain Res. 1984, 298, 125–129. [Google Scholar] [CrossRef]
- Kalueff, A.V.; Minasyan, A.; Tuohimaa, P. Anticonvulsant effects of 1,25-dihydroxyvitamin D in chemically induced seizures in mice. Brain Res. Bull. 2005, 67, 156–160. [Google Scholar] [CrossRef] [PubMed]
- Zanello, L.P.; Norman, A.W. Stimulation by 1α, 25 (OH) 2-vitamin D3 of whole cell chloride currents in osteoblastic ROS 17/2.8 cells: A structure-function study. J. Biol. Chem. 1997, 272, 22617–22622. [Google Scholar]
- Pressey, J.C.; Mahadevan, V.; Woodin, M.A. KCC2 is a hub protein that balances excitation and inhibition. In Neuronal Chloride Transporters in Health and Disease; Elsevier: Amsterdam, The Netherlands, 2020; pp. 159–179. [Google Scholar]
- Sørensen, A.T.; Ledri, M.; Melis, M.; Ledri, L.N.; Andersson, M.; Kokaia, M. Altered chloride homeostasis decreases the action potential threshold and increases hyperexcitability in hippocampal neurons. eNeuro 2017, 4, e0172-17. [Google Scholar]


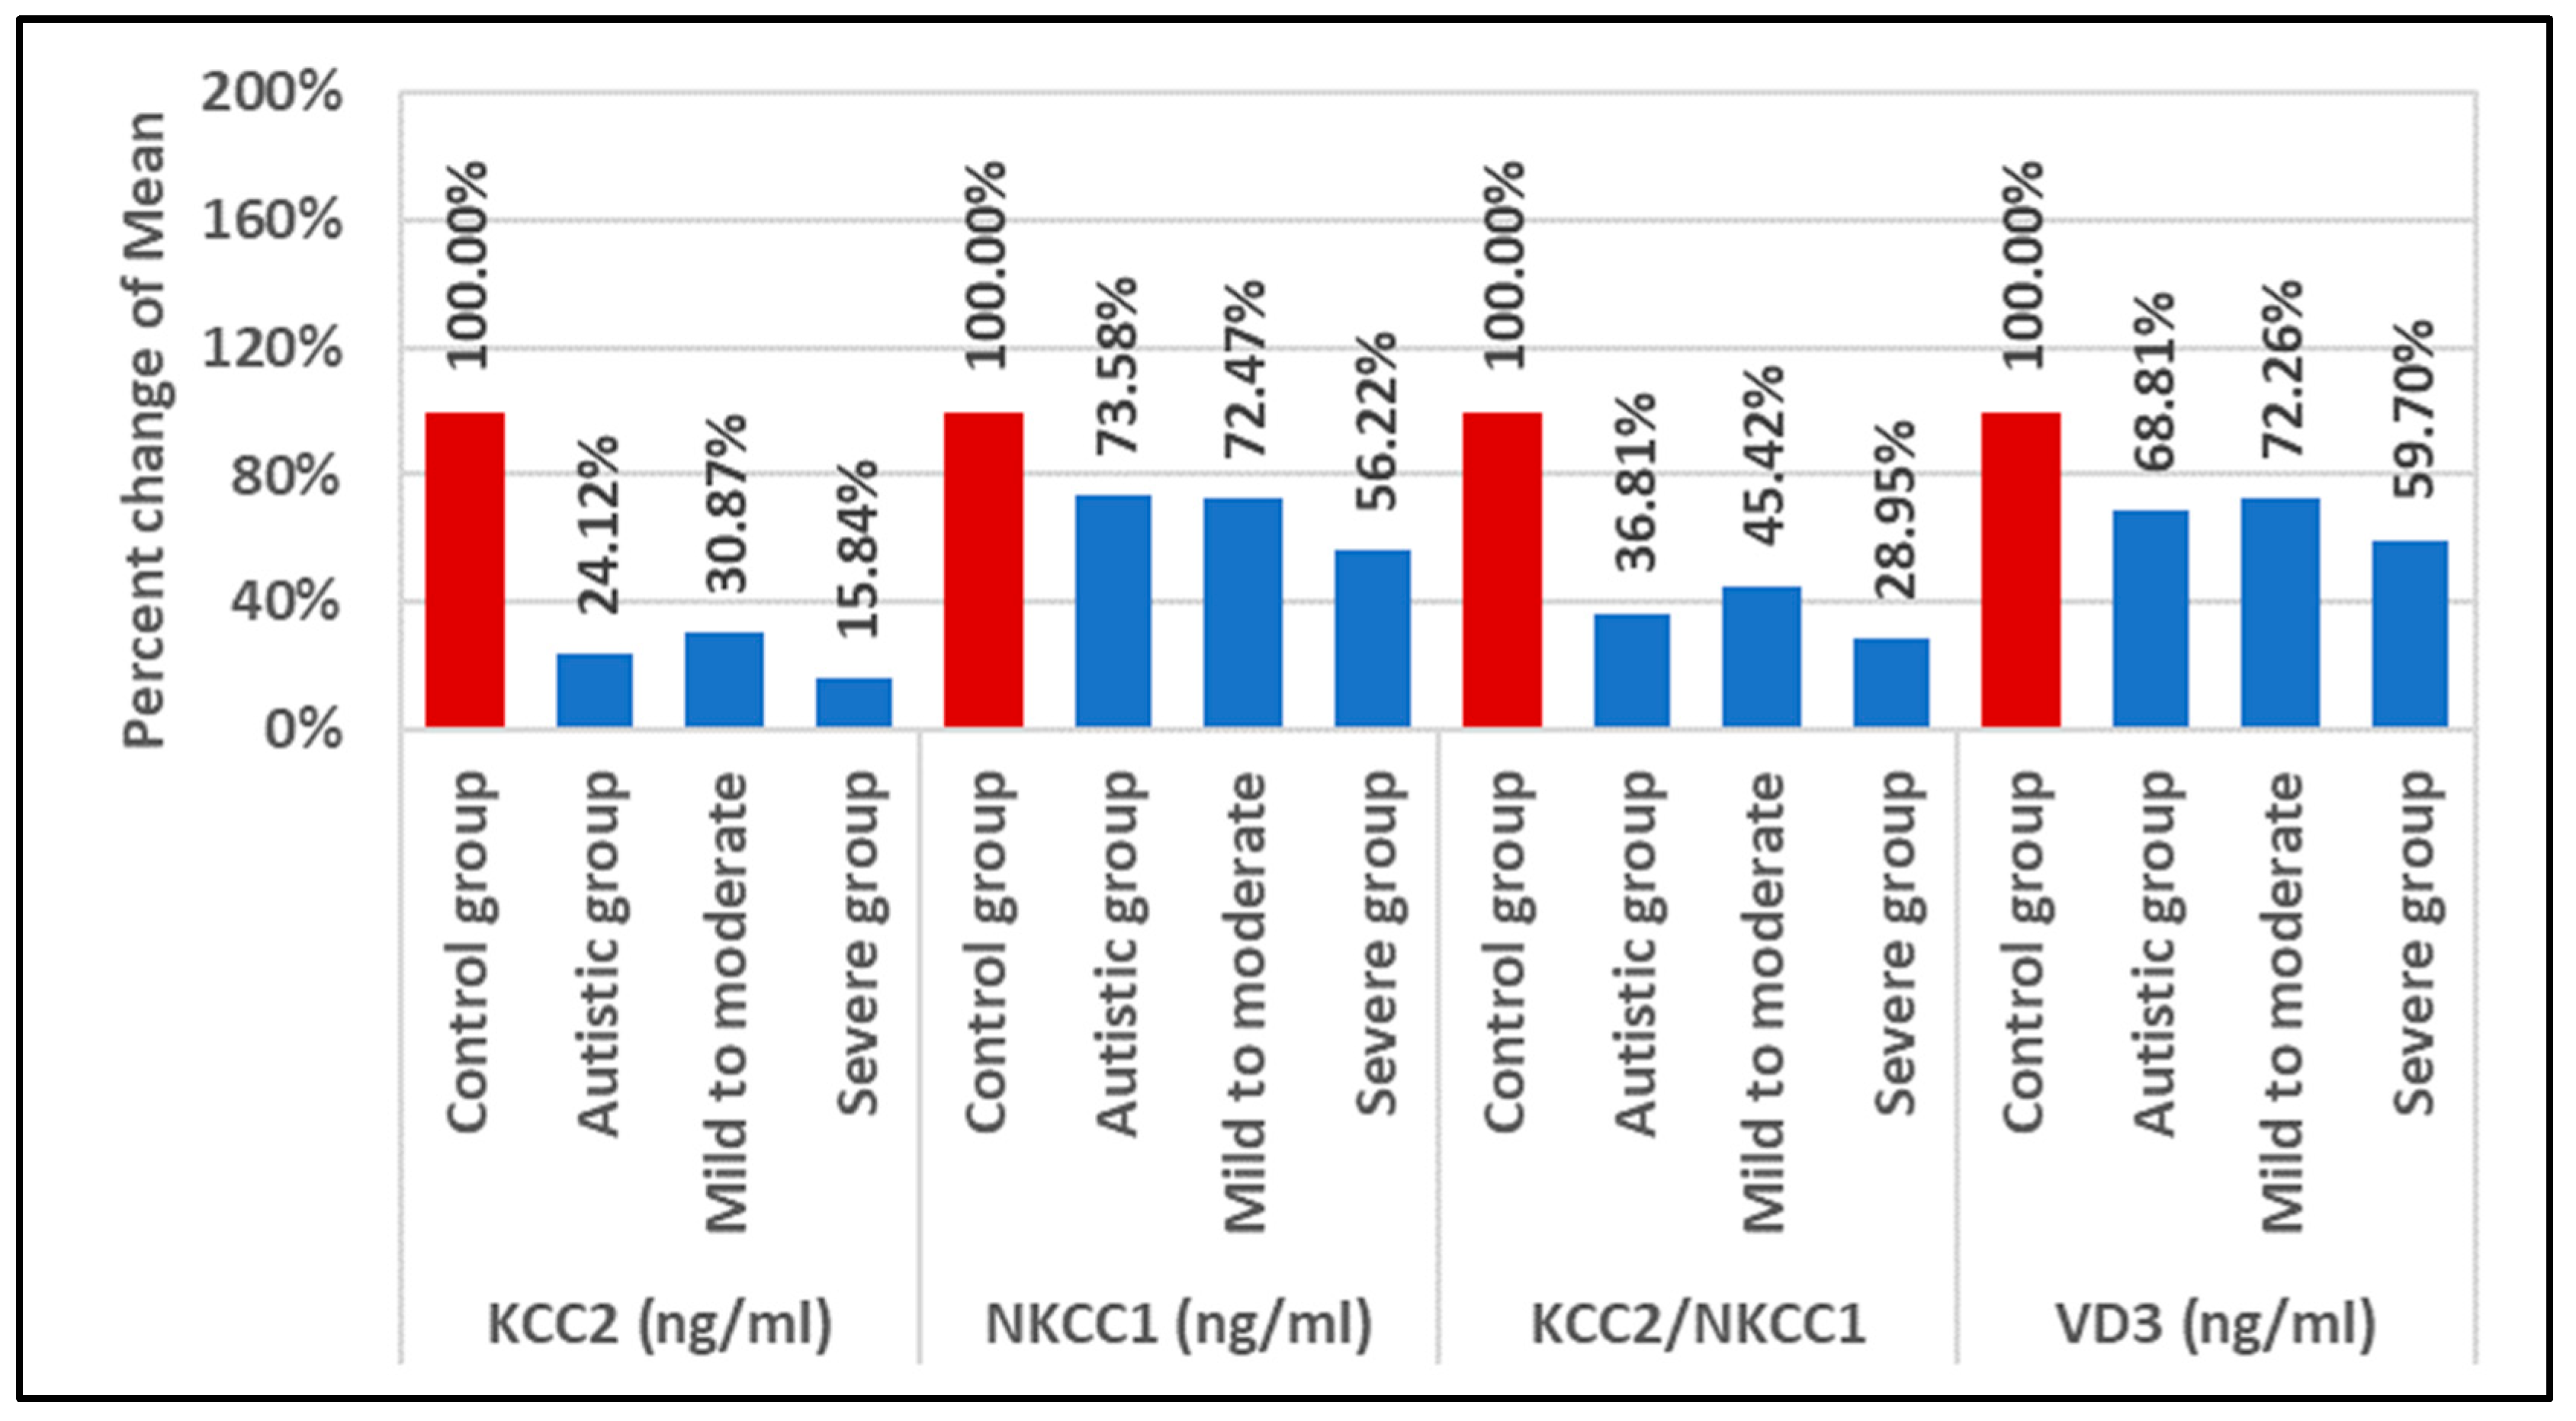
| Parameter | Groups | N | Min. | Max. | Mean ± S.D. | Median | Percent Change | p Value |
|---|---|---|---|---|---|---|---|---|
| KCC2 (ng/mL) | Control group | 26 | 1.080 | 11.920 | 4.92 ± 3.27 bcd | 4.180 | 100.00 | 0.001 |
| Autistic group | 46 | 0.510 | 5.550 | 1.19 ± 1.01 a | 0.736 | 24.12 | ||
| Mild to moderate | 27 | 0.540 | 5.550 | 1.52 ± 1.21 ad | 1.206 | 30.87 | ||
| Severe group | 19 | 0.510 | 1.810 | 0.78 ± 0.37 ac | 0.677 | 15.84 | ||
| NKCC1 (ng/mL) | Control group | 26 | 2.120 | 28.500 | 10.96 ± 6.72 bd | 10.036 | 100.00 | 0.035 |
| Autistic group | 46 | 2.060 | 47.450 | 8.07 ± 7.08 a | 6.925 | 73.58 | ||
| Mild to moderate | 27 | 2.360 | 17.690 | 7.95 ± 4.35 | 7.988 | 72.47 | ||
| Severe group | 19 | 2.060 | 12.320 | 6.16 ± 2.87 a | 6.381 | 56.22 | ||
| VD3 (ng/mL) | Control group | 26 | 3.540 | 30.860 | 15.89 ± 8.01 bd | 15.533 | 100.00 | 0.041 |
| Autistic group | 46 | 0.000 | 30.860 | 10.93 ± 8.87 a | 10.782 | 68.81 | ||
| Mild to moderate | 27 | 0.000 | 30.860 | 11.48 ± 8.61 | 10.782 | 72.26 | ||
| Severe group | 19 | 0.000 | 30.860 | 9.49 ± 9.26 a | 9.591 | 59.70 |
| Parameters | R (Correlation Coefficient) | p Value | |
|---|---|---|---|
| KCC2 (ng/mL) with NKCC1 (ng/mL) | 0.402 ** | 0.001 | P |
| KCC2 (ng/mL) with VD3 (ng/mL) | 0.055 | 0.556 | P |
| NKCC1 (ng/mL) with VD3 (ng/mL) | −0.130 | 0.164 | N |
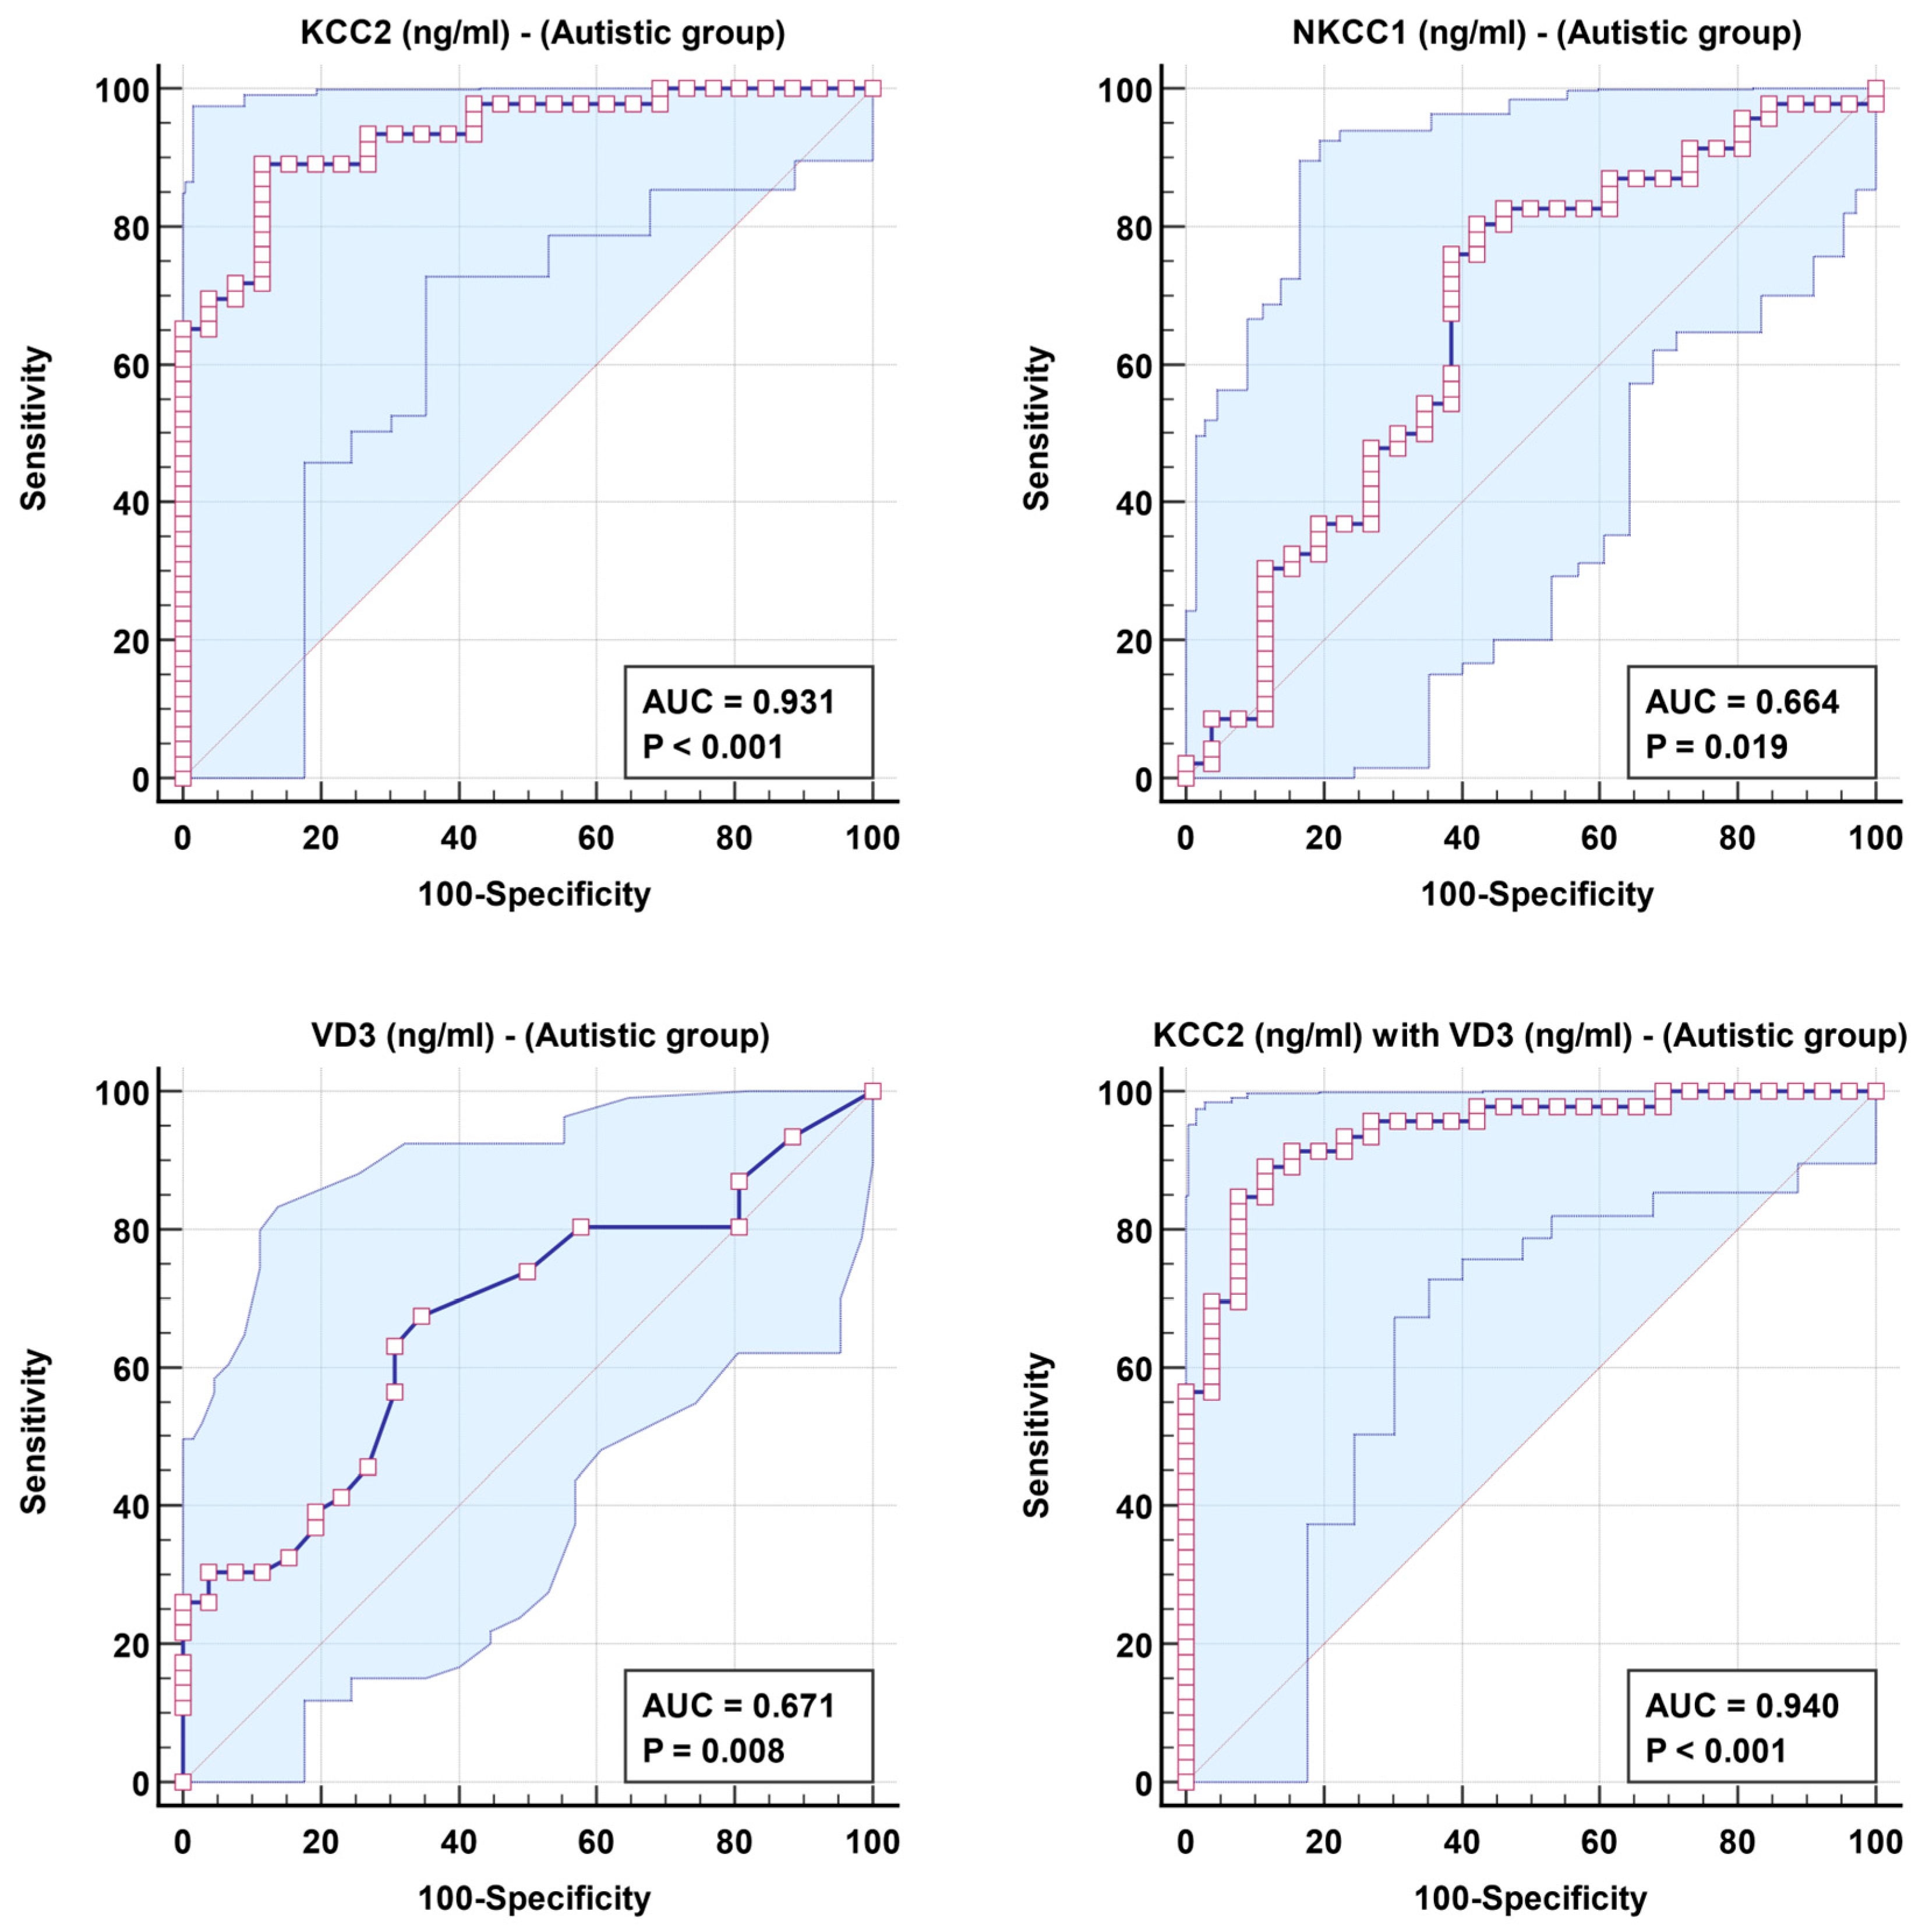
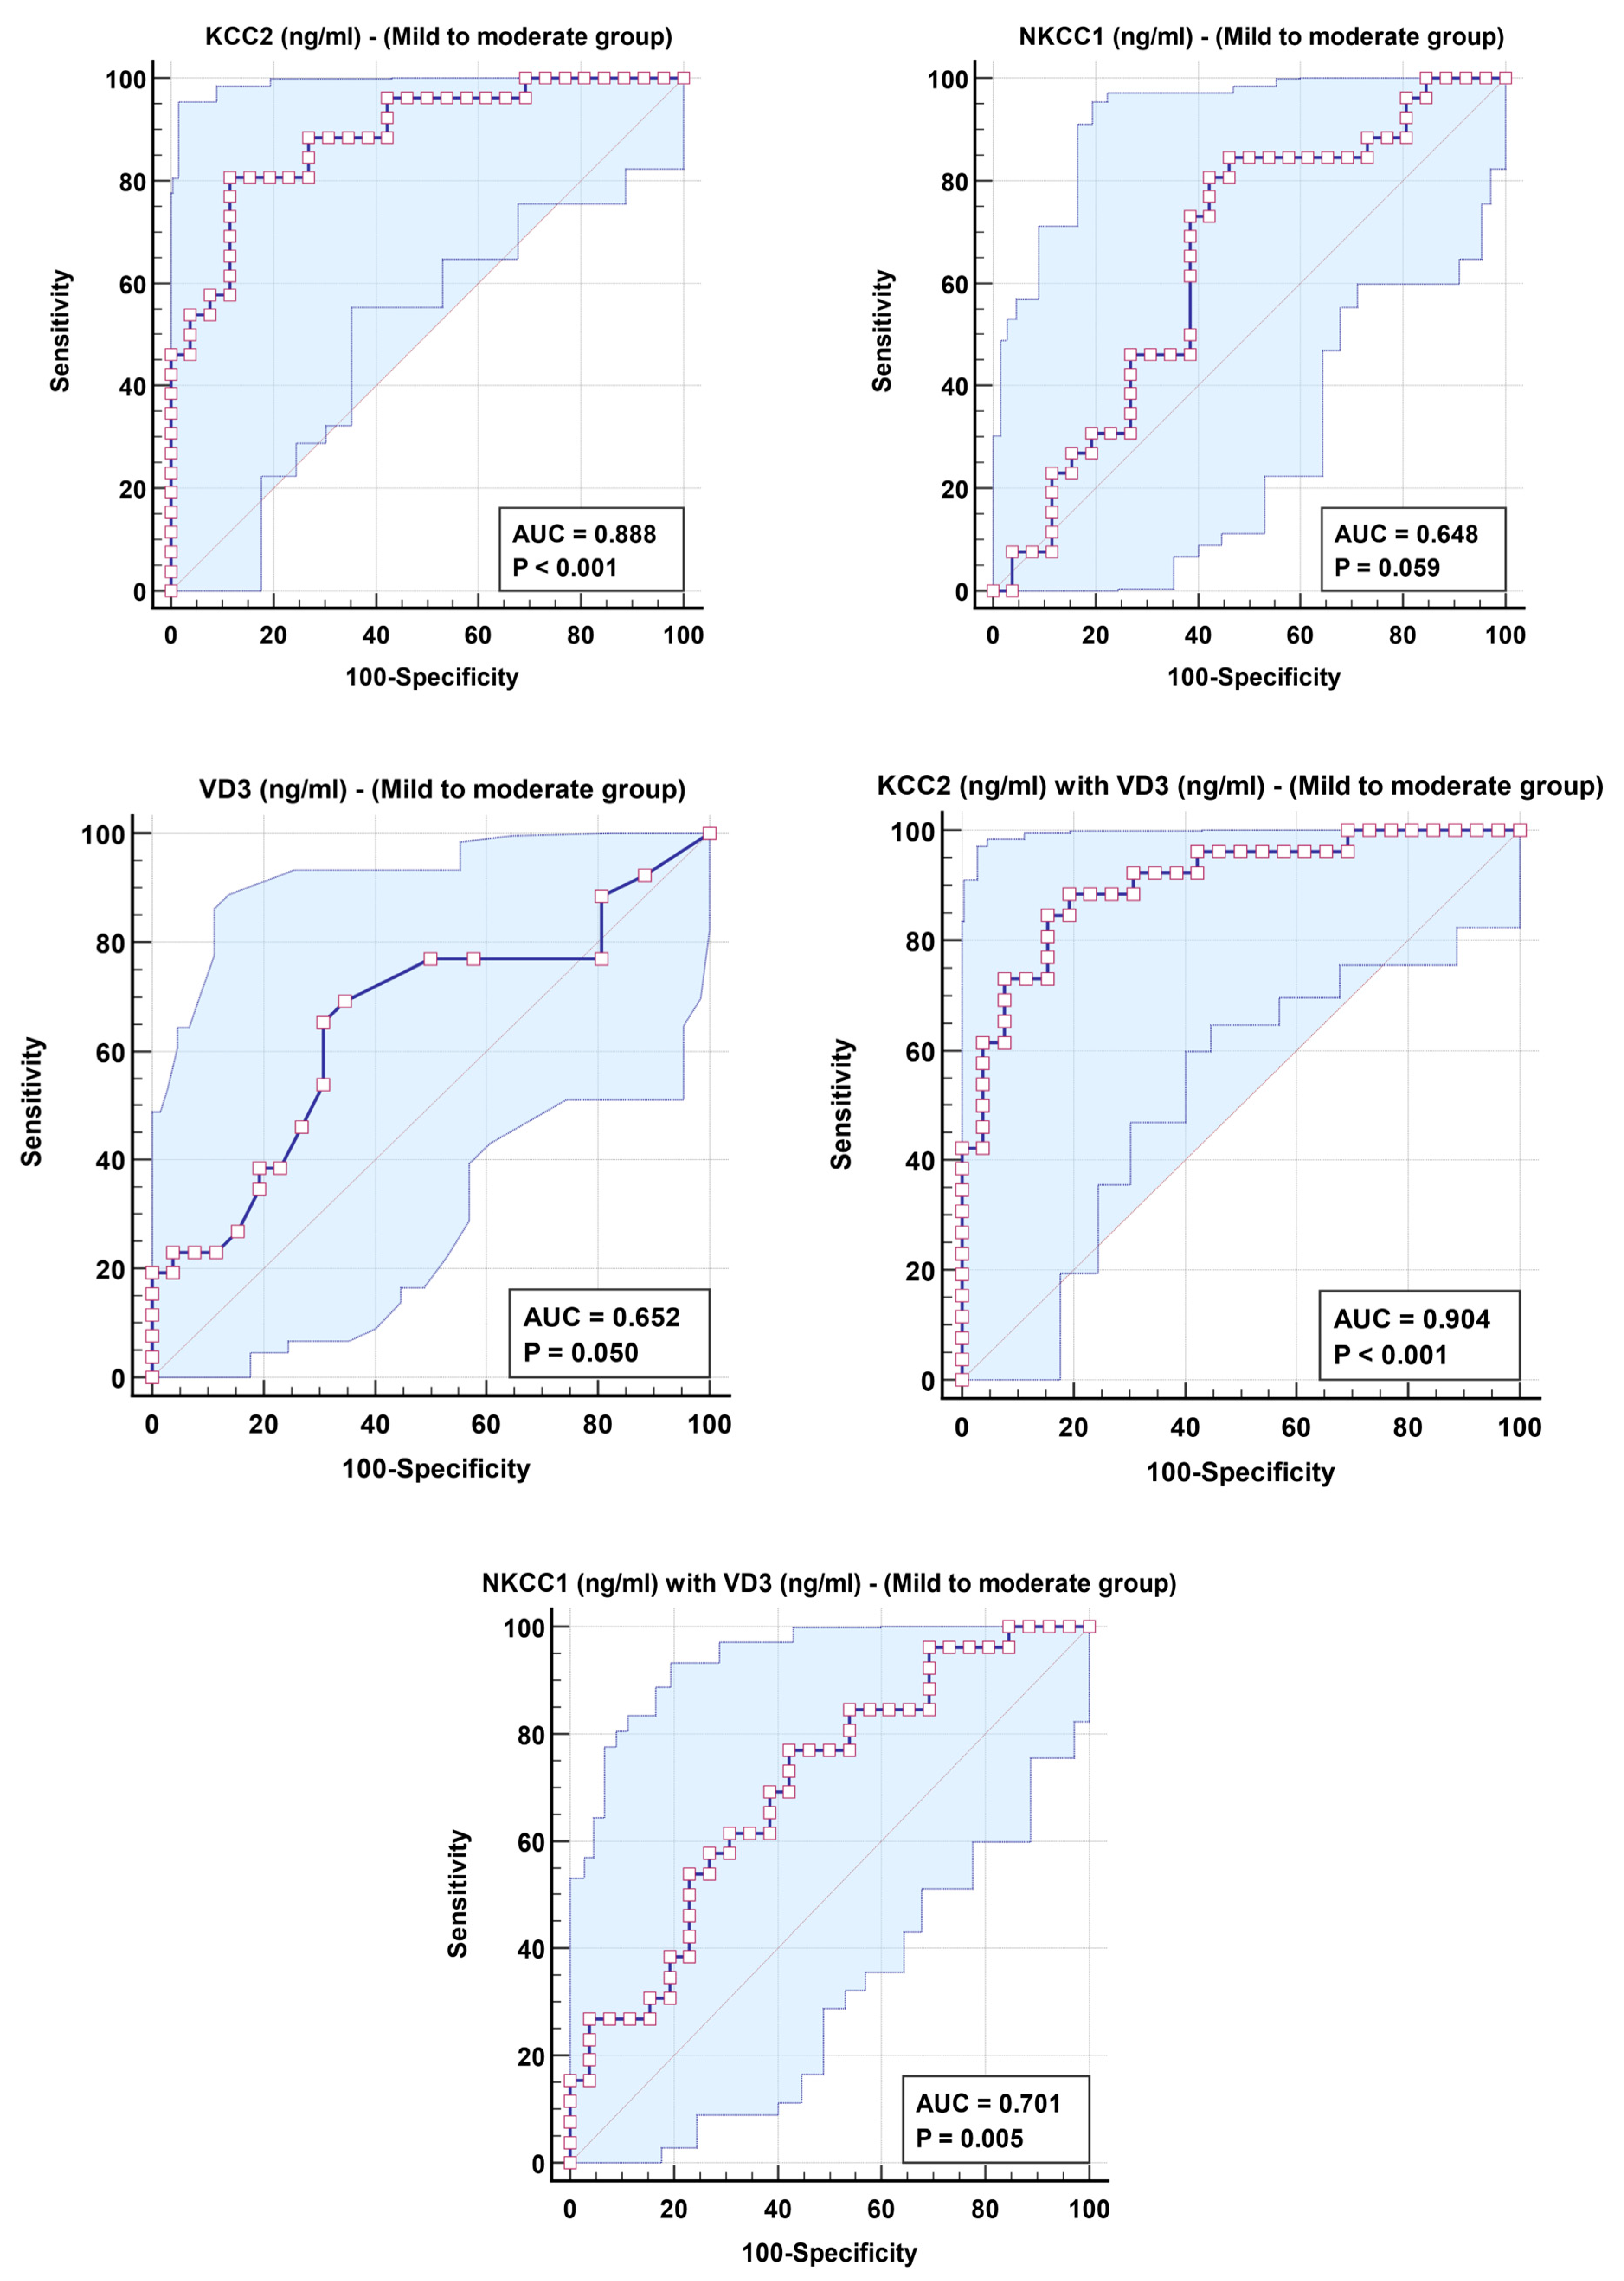
| Parameters | AUC | Cut-Off Value | Sensitivity % | Specificity % | p Value | 95% CI |
|---|---|---|---|---|---|---|
| Autistic group | ||||||
| KCC2 | 0.931 | 1.860 | 89.1% | 88.5% | 0.001 | 0.876–0.987 |
| NKCC1 | 0.664 | 9.553 | 80.4% | 57.7% | 0.022 | 0.527–0.801 |
| VD3 | 0.671 | 13.326 | 67.4% | 65.4% | 0.017 | 0.545–0.796 |
| KCC2 with VD3 | 0.940 | 89.1% | 88.5% | 0.001 | 0.887–0.993 | |
| Mild to moderate group | ||||||
| KCC2 | 0.888 | 1.860 | 80.8% | 88.5% | 0.001 | 0.800–0.975 |
| NKCC1 | 0.648 | 9.553 | 80.8% | 57.7% | 0.067 | 0.494–0.802 |
| VD3 | 0.652 | 11.904 | 65.4% | 69.2% | 0.059 | 0.500–0.805 |
| KCC2 with VD3 | 0.904 | 88.5% | 80.8% | 0.001 | 0.822–0.985 | |
| NKCC1 with VD3 | 0.701 | 76.9% | 57.7% | 0.013 | 0.560–0.843 | |
| Severe group | ||||||
| KCC2 | 0.987 | 1.069 | 88.9% | 100.0% | 0.001 | 0.964–1.000 |
| NKCC1 | 0.724 | 8.763 | 88.9% | 61.5% | 0.012 | 0.574–0.874 |
| VD3 | 0.723 | 4.144 | 44.4% | 96.2% | 0.013 | 0.564–0.883 |
| NKCC1 with VD3 | 0.823 | 83.3% | 69.2% | 0.001 | 0.699–0.946 | |
| Parameters | Regression Coefficient | Standard Error | Odds Ratio | 95% CI for Odds Ratio | p Value | |
|---|---|---|---|---|---|---|
| Lower | Upper | |||||
| Autistic group | ||||||
| KCC2 (ng/mL) | −1.295 | 0.324 | 0.274 | 0.145 | 0.517 | 0.001 |
| VD3 (ng/mL) | −0.107 | 0.046 | 0.899 | 0.821 | 0.983 | 0.020 |
| Mild to moderate group | ||||||
| KCC2 (ng/mL) | −1.066 | 0.316 | 0.344 | 0.185 | 0.640 | 0.001 |
| VD3 (ng/mL) | −0.099 | 0.048 | 0.905 | 0.825 | 0.994 | 0.037 |
| NKCC1 (ng/mL) | −0.120 | 0.062 | 0.887 | 0.786 | 1.000 | 0.051 |
| VD3 (ng/mL) | −0.077 | 0.039 | 0.926 | 0.858 | 0.999 | 0.047 |
| Severe group | ||||||
| NKCC1 (ng/mL) | −0.251 | 0.106 | 0.778 | 0.632 | 0.957 | 0.017 |
| VD3 (ng/mL) | −0.102 | 0.046 | 0.903 | 0.826 | 0.987 | 0.025 |
Disclaimer/Publisher’s Note: The statements, opinions and data contained in all publications are solely those of the individual author(s) and contributor(s) and not of MDPI and/or the editor(s). MDPI and/or the editor(s) disclaim responsibility for any injury to people or property resulting from any ideas, methods, instructions or products referred to in the content. |
© 2025 by the authors. Published by MDPI on behalf of the Swiss Federation of Clinical Neuro-Societies. Licensee MDPI, Basel, Switzerland. This article is an open access article distributed under the terms and conditions of the Creative Commons Attribution (CC BY) license (https://creativecommons.org/licenses/by/4.0/).
Share and Cite
El-Ansary, A.; Alabdali, A.; Ben Bacha, A.; Alonazi, M.; Al-Ayadhi, L.Y. Combining ROC Curves to Improve Diagnostic Values for Vitamin D3 and Chloride Co-Transporters in Connection to Epilepsy and Sleep Problems, Comorbidities in Autism Spectrum Disorders. Clin. Transl. Neurosci. 2025, 9, 21. https://doi.org/10.3390/ctn9020021
El-Ansary A, Alabdali A, Ben Bacha A, Alonazi M, Al-Ayadhi LY. Combining ROC Curves to Improve Diagnostic Values for Vitamin D3 and Chloride Co-Transporters in Connection to Epilepsy and Sleep Problems, Comorbidities in Autism Spectrum Disorders. Clinical and Translational Neuroscience. 2025; 9(2):21. https://doi.org/10.3390/ctn9020021
Chicago/Turabian StyleEl-Ansary, Afaf, Altaf Alabdali, Abir Ben Bacha, Mona Alonazi, and Laila Y. Al-Ayadhi. 2025. "Combining ROC Curves to Improve Diagnostic Values for Vitamin D3 and Chloride Co-Transporters in Connection to Epilepsy and Sleep Problems, Comorbidities in Autism Spectrum Disorders" Clinical and Translational Neuroscience 9, no. 2: 21. https://doi.org/10.3390/ctn9020021
APA StyleEl-Ansary, A., Alabdali, A., Ben Bacha, A., Alonazi, M., & Al-Ayadhi, L. Y. (2025). Combining ROC Curves to Improve Diagnostic Values for Vitamin D3 and Chloride Co-Transporters in Connection to Epilepsy and Sleep Problems, Comorbidities in Autism Spectrum Disorders. Clinical and Translational Neuroscience, 9(2), 21. https://doi.org/10.3390/ctn9020021