Article

Are Self-Reported Sensations During tACS Linked to Cortical Excitability Measured by Transcranial Magnetic Stimulation? A Pilot Study in an Older Adult Sample

1
Department of Psychiatry, Carolina Center for Neurostimulation, University of North Carolina at Chapel Hill, Chapel Hill, NC 27599, USA
2
Department of Neurology, Inselspital, Sleep-Wake-Epilepsy-Center, Bern University Hospital, University of Bern, 3010 Bern, Switzerland
3
Neuroscience Center, University of North Carolina, Chapel Hill, NC 27599, USA
4
Department of Cell Biology and Physiology, University of North Carolina, Chapel Hill, NC 27599, USA
5
Department of Biomedical Engineering, University of North Carolina, Chapel Hill, NC 27599, USA
6
Department of Neurology, University of North Carolina, Chapel Hill, NC 27599, USA
*
Author to whom correspondence should be addressed.
Clin. Transl. Neurosci. 2025, 9(2), 20; https://doi.org/10.3390/ctn9020020
Submission received: 19 January 2025 / Revised: 13 March 2025 / Accepted: 26 March 2025 / Published: 1 April 2025

Abstract

:
Stimulation-induced sensations including the perception of flickering lights (phosphenes) and scalp tingling are commonly reported in studies on transcranial alternating current stimulation (tACS). So far, these sensations have been considered benign side-effects of stimulation that may interfere with the blinding of participants in trials. It remains unknown what shapes the susceptibility to such side-effects. We hypothesized that cortical excitability predicts their intensity. Hence, we investigated the relationship between sensations during tACS and the motor threshold measured by transcranial magnetic stimulation (TMS). Nine healthy participants aged 50 and older underwent two tACS sessions at 21 Hz and 40 Hz as part of a cross-over pilot study. The stimulation amplitude was individualized to tolerability. Sensations were assessed post-session to calculate correlation with TMS-determined motor thresholds. Stimulation sensations (a flickering light and tingling scalp sensation) correlated with brain excitability as determined by the TMS motor threshold (r = −0.51, p = 0.03, N = 9). The findings suggest a relationship between the intensity of tACS-induced sensations and cortical excitability. Tailoring tACS intensity to individual tolerability and excitability thresholds may enhance the efficacy of tACS by ensuring a more consistent and effective dose relative to endogenous cortical excitability.

1. Introduction

Transcranial alternating current stimulation (tACS) is increasingly used in both research and clinical settings [1], yet there is currently no standard approach for calibrating the stimulation intensity to individual participants. This lack of calibration is unusual given how other non-invasive brain stimulation modalities are adjusted in stimulation intensity based on excitability metrics such as the motor threshold for transcranial magnetic stimulation (TMS). One straightforward but rarely used approach is to calibrate the tACS amplitude based on reported side-effects in terms of tACS-induced sensory experiences, such as visual phenomena and skins sensations. Yet, it remains unclear if these sensory experiences reflect underlying cortical excitability. Specifically, if these sensations map onto brain excitability as measured by TMS, there could be implications for optimizing tACS dosing to enhance its efficacy and tolerability.
It is well established that tACS commonly induces sensory experiences, particularly visual phenomena such as phosphenes (often experienced as “flickering lights”) and skin sensations [2]. Although these symptoms are transient, they typically persist throughout the stimulation session [3]. The type and intensity of these sensations depend on the specific stimulation parameters used [4,5,6]. Interestingly, these sensory experiences during tACS have been suggested to relate to neural activation without direct evidence. For example, phosphenes have been used as indicators of neural engagement in a study exploring amplitude-modulated tACS without direct experimental support for such a relationship [7]. Understanding the nature of sensory experiences during tACS is also critical for considerations about the effective blinding of stimulation conditions in tACS studies. While sham stimulation is often used as a control, we would argue that its effectiveness can be compromised if participants easily distinguish it from real stimulation due to sensory experiences induced by tACS.
Given this context, we here examined whether the occurrence of stimulation-related sensory experiences correlates with an objective measure of neuronal activation, namely the motor threshold determined by TMS. We focused on reports of “flickering lights” (phosphenes), and “tingling” (scalp sensations) as these are among the most commonly reported sensations during tACS and are likely due to direct stimulation of the retina [4,8,9] and peripheral cutaneous nerves, respectively. In this paper, we use the terms “phosphenes” and “flickering lights” interchangeably as participants commonly describe phosphenes as flickering visual sensations during transcranial electrical stimulation. We did not include other skin sensations like “itching” or “burning” as they are less frequently reported in tACS studies. We hypothesized that the intensity of perceived phosphenes and tingling during tACS correlate with the TMS motor threshold. While the origin of these sensations likely involves the direct stimulation of peripheral nerves, the perception and intensity of these sensations depend on cortical processing. Sensory signals from the periphery are subject to modulation by neural excitability, which can shape the subjective experience of stimulation. Individual differences in cortical excitability may therefore influence the strength of perceived sensations regardless of whether the initial trigger is peripheral or central in nature.

2. Materials and Methods

2.1. Participants

Healthy individuals over the age of 50 were recruited between June and November 2023 through online advertisements (ClinicalTrials.gov, Research For Me, and social media posts), email listservs, and flyers distributed in senior living communities. We examined an older cohort given the recent reports of tACS as a potentially effective treatment for cognitive impairment associated with neurodegeneration.

2.2. Transcranial Alternating Current Stimulation (tACS)

This cross-over study consisted of two stimulation sessions, each lasting one hour. Both tACS sessions were conducted at the same time of day for each participant. One session involved a target stimulation frequency of 40 Hz, commonly used in the context of cognitive tasks, while the other used a control frequency of 21 Hz, which was non-harmonic to the target frequency. The sessions were spaced 6.56 ± 0.26 days (mean ± standard error) apart to allow for the washout of any effects from the previous session. The order of frequencies was randomized for each participant using a MATLAB R2017b script, which implemented a random permutation approach (randperm) to assign session order in a cross-over design. Participants were assigned to either receive 40 Hz in the first session and 21 Hz in the second or vice versa. Both the investigator and the participants were blinded to the stimulation condition, making this a double-blind study.
tACS was administered using a Neuroconn multiple channel (MC) stimulator (Neuroconn Ltd., Ilmenau, Germany). Two 4.5 × 4.5 cm stimulation electrodes were placed with 10–20 paste (Aurora, CO, USA) over each temporal lobe (T7 and P7, and T8 and P8, according to the International 10/20-EEG system [10]) to deliver alternating bilateral stimulation (T7 and P7 in-phase; T8 and P8 in-phase). The maximum stimulation amplitude was set at 2 mA peak-to-peak. The stimulation amplitude was individually adjusted as follows. The experimenter initially set the amplitude to 2 mA (ramp-on 60 s, continuous stimulation 60 s, no ramp-off) and asked the participant if they could tolerate the stimulation at this amplitude for one hour. If not, the amplitude was reduced by 0.25 mA and the procedure was repeated until the participant confirmed they could tolerate the stimulation. This process was carried out for both the 21 Hz and 40 Hz frequencies, with the lower tolerated amplitude used for both sessions, and a ramp-on of 20s and a ramp-off of 20s. The actual stimulation amplitudes used ranged from 1.25 to 2 mA, with a mean amplitude of 1.75 mA across all participants.

2.3. Stimulation Sensations

Assessment of sensory experiences during tACS was conducted after each one-hour stimulation session using a questionnaire derived from an internal lab questionnaire, supplemented by items from Giustiniani et al. [11]. Participants rated the intensity of 16 sensations on a scale from 0 to 4 (0: none, 1: low, 2: medium, 3: high, and 4: very high) and indicated the perceived relationship of each sensation to the stimulation (no relation, remote, possible, probable, and definite).

2.4. Motor Thresholding

Additionally, participants’ individual motor thresholds were determined using TMS with a MAGPro X100 device (for detailed procedure, see Appendix A). This was conducted independently of the tACS sessions to avoid any influence of tACS on motor threshold measurements. To reduce variability in cortical excitability, participants were instructed to maintain their usual caffeine intake on the day of testing. Furthermore, we recorded participants’ sleep duration the night before testing; however, this variable was recorded for exploratory purposes only and was not part of our primary analysis.

2.5. Data Analysis

Statistical analysis was performed using R. Descriptive statistics were applied as appropriate. T-tests were used to compare symptoms between the different stimulation frequencies. Pearson correlation coefficients were calculated to assess the relationship between subjectively reported stimulation sensations and TMS motor thresholds, and Fisher’s z-transformation was used to compare correlations. To ensure robustness, we also performed Spearman correlation, which yielded highly similar results, confirming that our findings were not dependent on the choice of correlation method. A p-value of <0.05 was considered statistically significant. No multiple-comparisons correction was applied, as this study was exploratory in nature, and the small sample size (N = 9) made correction overly conservative. The reported p-values should be interpreted with this consideration in mind.

3. Results

3.1. Participant Characteristics

From out of eleven participants, complete data, including on tACS and TMS motor thresholding, were collected from nine individuals. One participant was excluded because they had completed only one tACS session. While within-subject comparisons were not performed in this specific analysis, the main study from which this dataset was derived had been designed for within-subject analyses, and we aimed to maintain consistency with this study framework. Another participant had not undergone motor thresholding and was therefore excluded from the correlation analysis. The average age of these nine participants was 69 years (standard deviation: ±7.14 years; range: 58–79 years; six males, three females).

3.2. Reported Sensations During tACS

Phosphenes (“flickering lights”) and “tingling” were the most frequently reported sensations during both 21 Hz and 40 Hz stimulation sessions (Table 1).

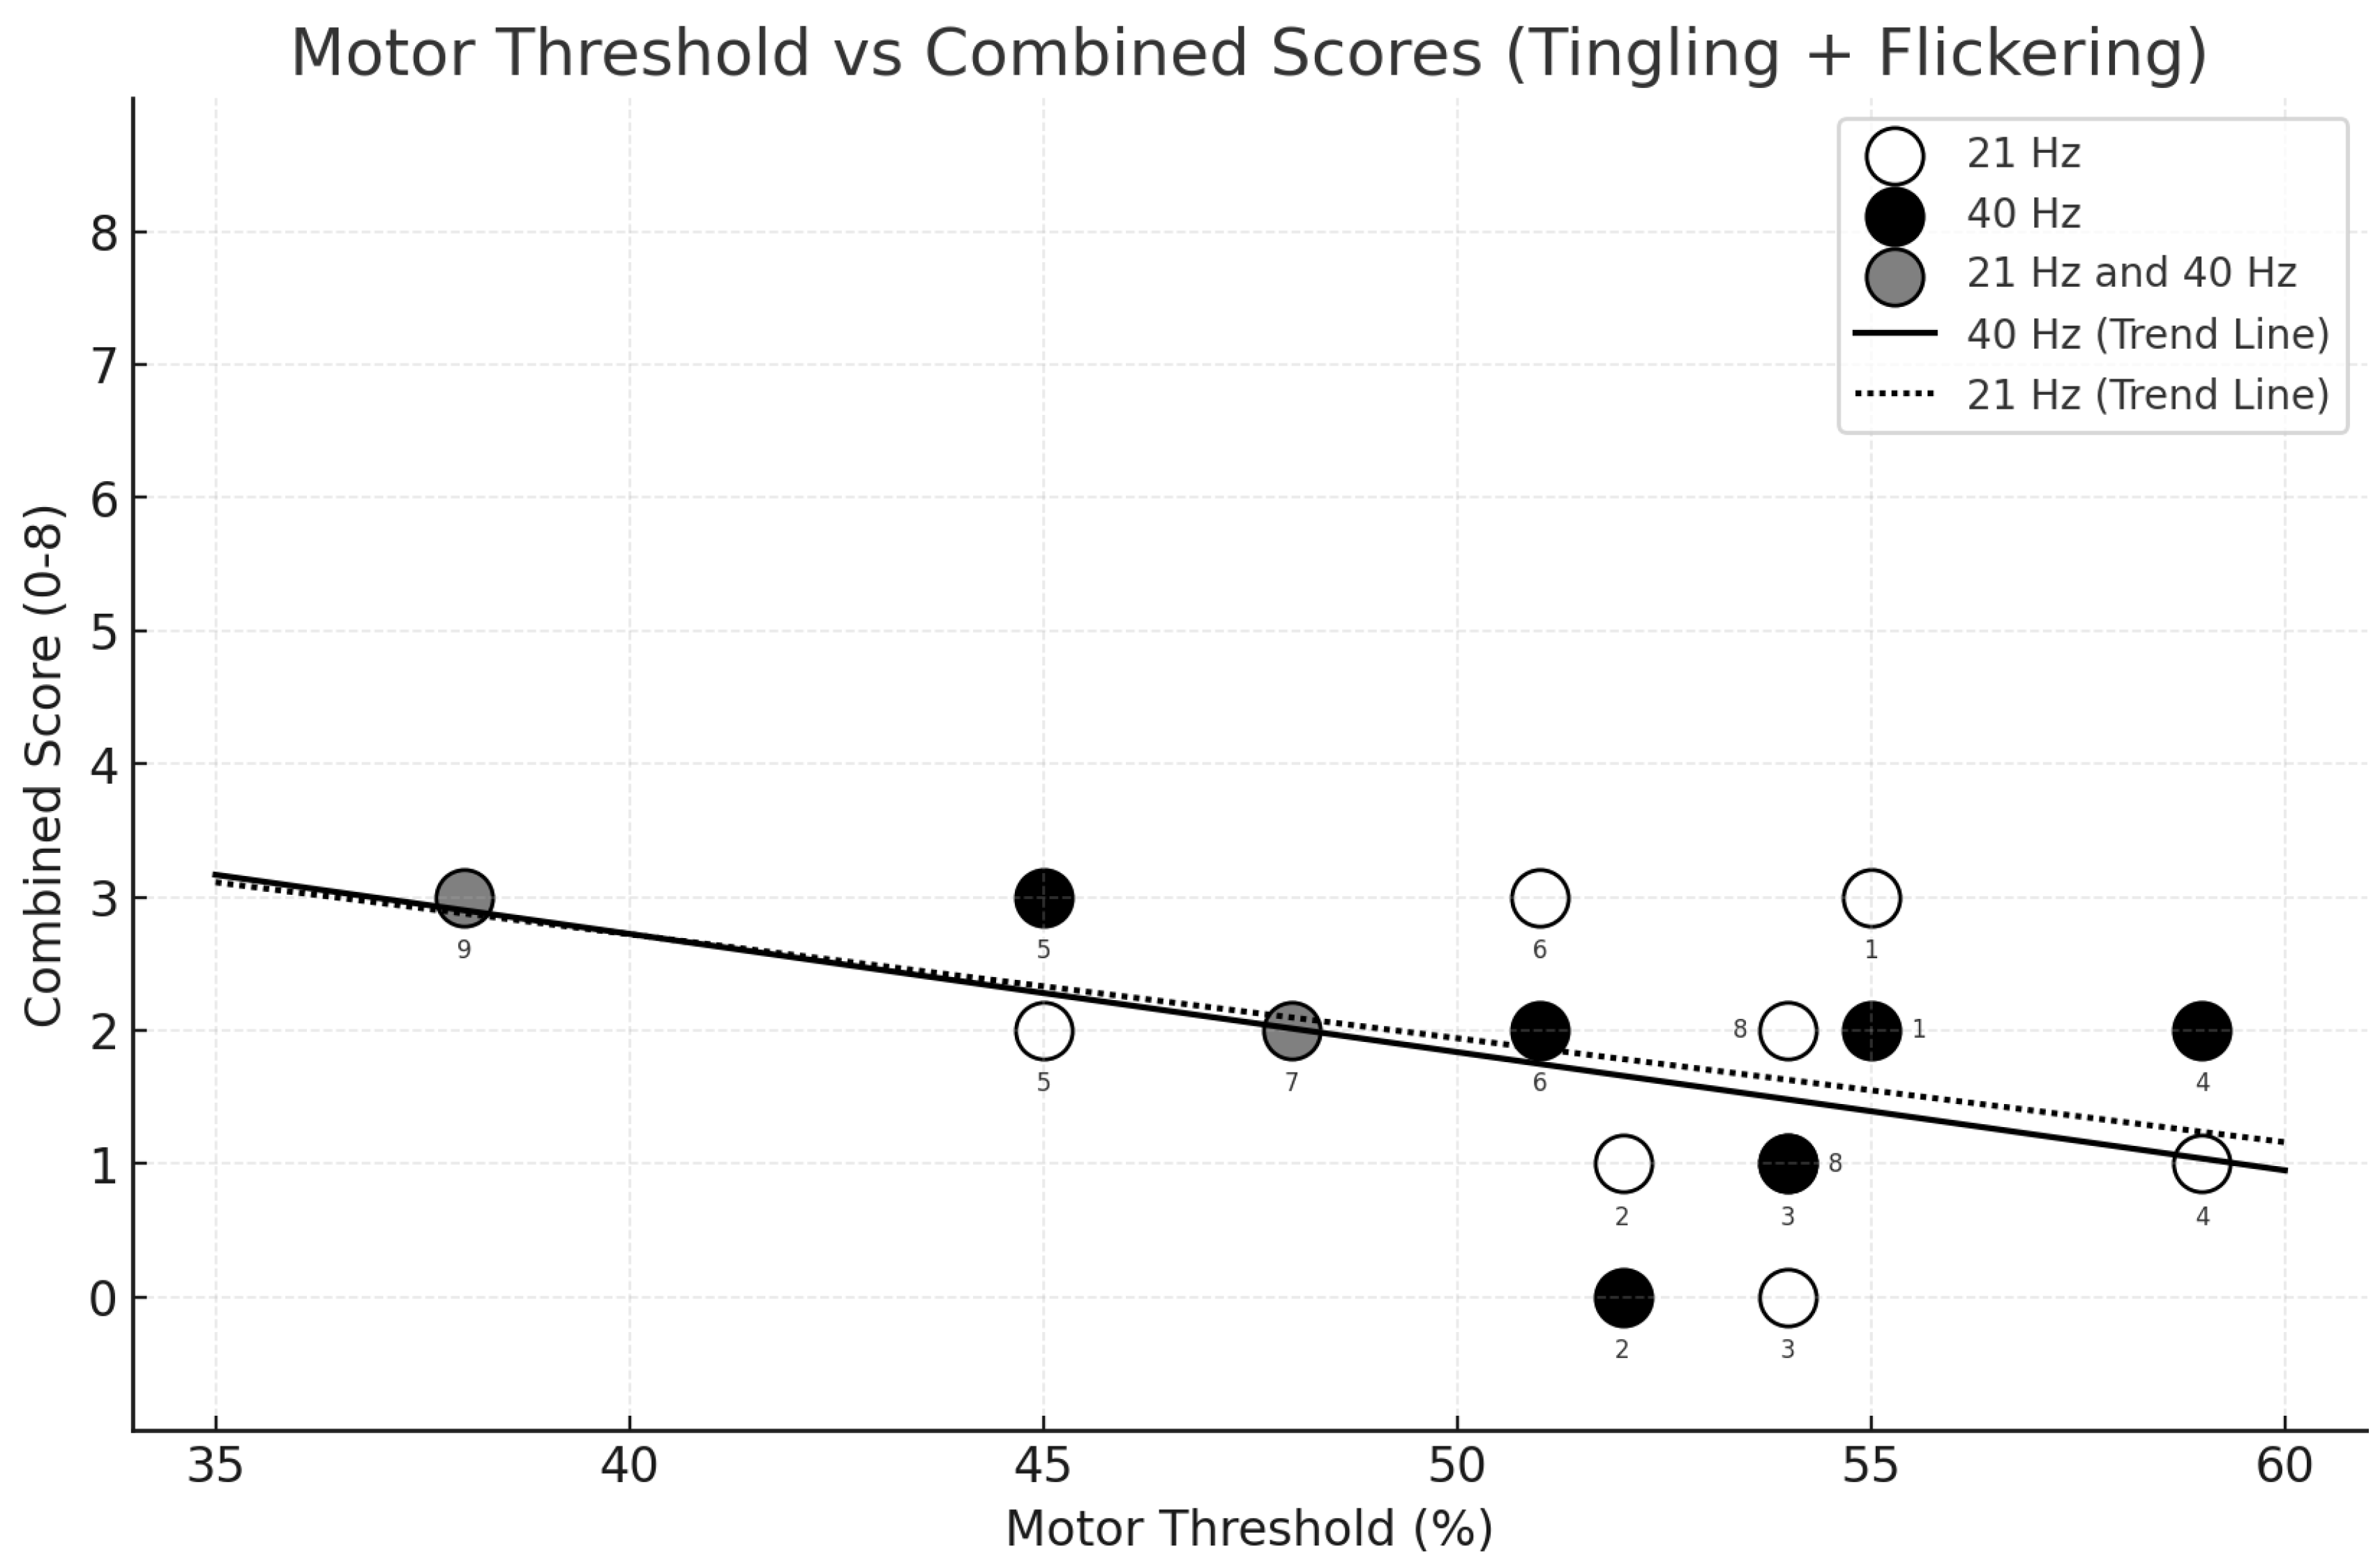
3.3. Relationship Between Sensation Intensity and Motor Threshold

This initial observation led us to examine whether the intensity of these sensations was related to the participants’ motor thresholds as measured by TMS. The median intensity rating of phosphenes was 1.0 (IQR: 1.0–2.0) during 21 Hz stimulation and 1.0 (IQR: 1.0–1.0) during 40 Hz stimulation. For tingling sensations, the median intensity was 1.0 (IQR: 0.0–1.0) during both 21 Hz and 40 Hz stimulation. The motor threshold across participants was, on average, 50.7% (range 38–59%). In our analysis, we found that when combining data from both 21 Hz and 40 Hz stimulation sessions, there was a significant moderate–strong negative correlation between the TMS motor threshold and the combined intensity of phosphenes and tingling (r = −0.51, p = 0.03, and N = 18 from nine participants; Figure 1). This finding suggests that individuals with higher cortical excitability indexed by lower motor thresholds experience more intense stimulation sensations during tACS administered at the maximum tolerated amplitude. Importantly, no significant correlation was found between the motor threshold and tolerated current intensity used for stimulation (for 21 Hz: r = −0.38, p = 0.32; for 40 Hz: r = −0.26, p = 0.5).
We then examined the correlations at each stimulation frequency separately. Although the correlations for phosphenes did not reach statistical significance, they were consistent in showing a moderate negative trend (21 Hz: r = −0.48, p = 0.19; 40 Hz: r = −0.51, p = 0.16). In contrast, the correlation between motor threshold and tingling intensity was weaker at both frequencies (21 Hz: r = −0.28, p = 0.47; 40 Hz: r = −0.32, p = 0.41), indicating that phosphenes may be more robust markers of cortical excitability.
We next asked if there was a relationship between all queried sensations and cortical excitability. To focus on the perceived effects of stimulation, we narrowed the analysis to the severity of sensations that participants rated as “definitely” related to the stimulation. At 21 Hz, the severity of these sensations showed a strong negative correlation with the motor threshold (r = −0.68, p = 0.05), indicating that lower thresholds were associated with more intense sensations. Surprisingly, at 40 Hz, the correlation was positive but weaker and non-significant (r = 0.32, p = 0.40). Notably, the correlation at 21 Hz was significantly different from that at 40 Hz (p = 0.04). When we broadened our criteria to include sensations rated as either “definitely” or “probably” related to stimulation, we again observed a negative correlation at 21 Hz (r = −0.64), although this did not reach statistical significance (p = 0.06). At 40 Hz, there was still no significant correlation (r = 0.03, p = 0.95). Despite similar proportions of sensations rated as “definitely” or “probably” related to stimulation at both frequencies (21 Hz: 46.6%, 40 Hz: 47.4%), more sensations were rated as “definitely” related at 21 Hz (23.3%) compared to 40 Hz (13.2%). However, the intensity of “definitely” related sensations did not differ significantly between the two frequencies (p = 0.55), suggesting that while participants more frequently associated certain sensations with the 21 Hz stimulation, the perceived strength of these sensations was comparable across both frequencies. Together, these results support focusing on phosphenes and tingling scalp sensations as markers of cortical excitability, especially when different stimulation conditions are used in the same study.
To assess whether applied stimulation intensity influenced sensation ratings independently of cortical excitability, we examined the correlation between current amplitude (mA) and reported sensation intensities. No significant correlations were observed (all p-values > 0.05), suggesting that absolute stimulation intensity does not strongly predict the perception of tACS-induced sensations. The strongest correlation was found for flickering sensations at 21 Hz (r = 0.41, p = 0.26), but this did not reach statistical significance. These findings indicate that individual differences in cortical excitability may constitute a more important factor than stimulation intensity alone.

4. Discussion

In this pilot study, we explored the relationship between self-reported tACS-induced sensations and cortical excitability as measured by the TMS motor threshold. Despite the initial individualization of stimulation amplitudes to ensure tolerance, we observed a moderate negative correlation between the intensity of phosphenes and the TMS motor threshold at both stimulation frequencies (21 Hz and 40 Hz), with a stronger correlation for phosphenes. This finding suggests that participants with a higher TMS threshold experienced fewer tACS-induced sensations than those with a lower motor threshold. The correlation became significant when combining data across both sensations and stimulation frequencies, indicating that the small sample size may have limited the detection of this effect in individual analyses.
This observation aligns with our hypothesis, suggesting a consistent relationship between individual excitability across different neuronal structures, which varies significantly between individuals. Neuronal excitability is known to fluctuate due to various factors such as age or time of day [12]. Additionally, variability in motor threshold determination by different investigators could have introduced variability in our results. Nevertheless, the observed negative correlation supports the concept that tACS-induced sensations may indeed reflect underlying cortical excitability.
We also examined how all the sensations that participants identified as “definitely” related to the stimulation correlated with the motor threshold. Our results indicated that these sensations were more intense in individuals with a lower motor threshold at 21 Hz, but not at 40 Hz. Notably, sensations during 21 Hz stimulation were more often rated as “definite” compared to those at 40 Hz. Previous research has shown that both visual and skin sensations are most pronounced in the beta frequency band, especially around 20 Hz [5]. This raises the possibility that sensations at 21 Hz tACS were more noticeable and thus more accurately assessed as stimulation-induced. However, within our sample, the intensity of sensations definitively associated with stimulation did not significantly differ between the two frequencies. We hypothesize that the moderate correlation between sensation intensity at 21 Hz and lower motor thresholds may have been due to the more pronounced nature of stimulation-induced sensations at 21 Hz while the sensations reported during 40 Hz stimulation may have been less specific or more difficult for participants to attribute accurately to the stimulation. This frequency-dependent variability in the correlation between stimulation-related sensations and the motor threshold leads us to conclude that the titration of the stimulation should not include all sensations but should focus specifically on phosphenes and possibly tingling, at least within the frequency range studied here. These findings align with previous research: phosphene attributes, for example, have been shown to vary systematically with stimulation frequency and, in some studies, also with intensity [13]. However, in our study, we did not observe a significant correlation between stimulation amplitude and sensation intensity, suggesting that individual differences in excitability may play a more prominent role in shaping sensory perception. The frequency-dependent nature of these effects may reflect distinct interactions between tACS and endogenous neural oscillations. Lower frequencies, such as those in the alpha range (~10 Hz), are thought to interact more with intrinsic alpha rhythms while higher frequencies (e.g., 40 Hz) may modulate gamma-band activity, potentially influencing sensory perception through different neural mechanisms [14].
Additionally, our results support the use of a control frequency rather than sham stimulation in controlled tACS studies, given the noticeable symptoms associated with both stimulation frequencies. Sham stimulation can be problematic because participants often detect the absence of sensory experiences, such as phosphenes or tingling, which compromises blinding and introduces bias. In contrast, using a control frequency is more likely to maintain participant blinding by eliciting similar sensations. However, we acknowledge that including a sham condition would have strengthened our findings by allowing a direct comparison between true stimulation effects and placebo responses. Future studies should incorporate both a control frequency and a sham condition to further validate this approach. Although the neuromodulatory effects of the control frequency are not fully understood, it serves as a more effective comparator by reducing the likelihood of unblinding and enhancing the reliability of study outcomes.
One significant limitation of this study was the small sample size of nine participants. Future research should include more participants to confirm the generalizability of these results. A further limitation of this study was that cortical excitability was assessed at a single time point even though it is known to fluctuate due to factors such as circadian rhythms and cognitive states. Further studies should consider longitudinal assessments to better understand how these fluctuations influence the relationship between tACS-induced sensations and cortical excitability over time. Moreover, expanding the range of tested stimulation frequencies beyond 21 Hz and 40 Hz in future studies—such as by investigating 6 Hz, 10 Hz, and 20 Hz—could help clarify how different neural circuits contribute to the perception of tACS-induced sensations. Such studies may provide further insight into the underlying mechanisms and improve the precision of stimulation-based interventions.
While subjective sensations provide valuable insights into individual experiences of tACS, incorporating objective neurophysiological markers could enhance our understanding of the relationship between tACS-induced sensations and cortical excitability. Cortical excitability varies across different brain regions, and measures such as the TMS motor threshold (MT) primarily reflect M1 excitability rather than a global index of cortical activation. Techniques such as EEG and fMRI could be used alongside TMS to provide complementary data on neural activity changes. EEG, for instance, can measure the tACS-induced entrainment of oscillatory activity [15] while fMRI could reveal regional changes in blood flow and functional connectivity patterns associated with stimulation-induced sensations [16]. Future studies integrating EEG–TMS or fMRI–TMS approaches could help disentangle whether tACS-induced sensations are a direct result of local excitability changes or whether they reflect broader network-level interactions. This multimodal approach would provide a more comprehensive characterization of how tACS interacts with cortical activity and perception, ultimately refining stimulation protocols for both research and clinical applications.

5. Conclusions

We propose that tACS stimulation intensity should first be tailored to individual tolerability and then to individual neuronal excitability thresholds. Initially, both the target and control frequencies should be tested to determine the highest stimulation amplitude that participants can tolerate. Subsequently, individual excitability should be assessed—potentially using a combination of subjective measures (such as phosphenes and tingling, aiming to calibrate the perceived intensity across participants) and objective measures (such as TMS-determined motor thresholds). The ultimate goal is to apply an inter-individually comparable dose of TACS, ensuring a standardized effective dose across participants.

Author Contributions

Conceptualization, A.S. and F.F.; methodology, A.S., J.P. and F.F.; data curation, A.S. and J.P.; formal analysis, A.S. and F.F.; writing—original draft preparation, A.S.; writing—review and editing, J.P. and F.F.; supervision, F.F. All authors have read and agreed to the published version of the manuscript.

Funding

This research (A.S.) was funded by Kernen-Fonds, Switzerland.

Institutional Review Board Statement

This study protocol was reviewed and approved by the UNC Chapel Hill Institutional Review Board (IRB Number: 23-0597, approved on 28 June 2023).

Informed Consent Statement

The participants gave written informed consent prior to data collection.

Data Availability Statement

The datasets generated and analyzed during the current study are available from the corresponding author upon reasonable request. Data sharing will be facilitated after the completion of all planned publications related to this work by the research group. Requests will be evaluated in accordance with institutional and ethical guidelines to ensure the proper use and confidentiality of the data.

Acknowledgments

We thank the following undergraduate research assistants for their assistance in data collection: Christian Sodano, Dylan (Wu) Li, and Kirina Shah.

Conflicts of Interest

The authors declare that they have no conflicts of interest or financial disclosures related to the research, authorship, and publication of this article. F.F. is the lead inventor of patents of closed-loop tACS and receives royalty payments from UNC—Chapel Hill. He owns shares of Electromedical Products International and serves as a paid consultant and chair of the scientific advisory board. The work presented here is unrelated.

Appendix A

Motor Thresholding Procedure:
The motor threshold was defined according to Rossini et al. [17] as the lowest stimulus intensity at which the TMS of the motor cortex produces an electromyographic (EMG) response (a motor-evoked potential (MEP)) with an amplitude ≥ 50 uV in the target muscle (the first dorsal interosseous muscle of the right hand) in at least 50% of the trials. We identified the location for the TMS coil on the scalp with the largest single-trial MEP as follows (as suggested in Groppa et al. [18]): the coil was positioned 0–1 cm anterior and 4–5 cm lateral from the vertex. The maximal stimulator output (MSO) was set to 70% and then lowered stepwise to elicit MEPs with an average peak-to-peak amplitude of 0.5–1 mV. Then the coil was shifted 1 cm in the anterior, posterior, medial, and lateral directions while evoking three MEPs at each site. If the MEP amplitude was higher in one of the new positions compared to the starting position, the shifting of the coil was re-started from there. The motor threshold was then determined as follows. We started at the location we had just found with 30% of the maximal stimulator output (MSO). We then increased the MSO gradually in steps of 5% until TMS evoked MEPs with a peak-to-peak-amplitude of ≥50 uV in each trial. Thereafter, stimulus intensity was gradually lowered in steps of 1% MSO until there were fewer than five positive responses out of ten trials. This stimulus intensity (plus 1%) was then defined as the motor threshold.

References

  1. Frohlich, F.; Riddle, J. Conducting double-blind placebo-controlled clinical trials of transcranial alternating current stimulation (tACS). Transl. Psychiatry 2021, 11, 284. [Google Scholar] [CrossRef] [PubMed] [PubMed Central]
  2. Matsumoto, H.; Ugawa, Y. Adverse events of tDCS and tACS: A review. Clin. Neurophysiol. Pract. 2017, 2, 19–25. [Google Scholar] [CrossRef] [PubMed] [PubMed Central]
  3. Raco, V.; Bauer, R.; Olenik, M.; Brkic, D.; Gharabaghi, A. Neurosensory effects of transcranial alternating current stimulation. Brain Stimul. 2014, 7, 823–831. [Google Scholar] [CrossRef] [PubMed]
  4. Schutter, D.J.; Hortensius, R. Retinal origin of phosphenes to transcranial alternating current stimulation. Clin. Neurophysiol. 2010, 121, 1080–1084. [Google Scholar] [CrossRef] [PubMed]
  5. Turi, Z.; Ambrus, G.G.; Janacsek, K.; Emmert, K.; Hahn, L.; Paulus, W.; Antal, A. Both the cutaneous sensation and phosphene perception are modulated in a frequency-specific manner during transcranial alternating current stimulation. Restor. Neurol. Neurosci. 2013, 31, 275–285. [Google Scholar] [CrossRef] [PubMed]
  6. Evans, I.D.; Palmisano, S.; Loughran, S.P.; Legros, A.; Croft, R.J. Frequency-dependent and montage-based differences in phosphene perception thresholds via transcranial alternating current stimulation. Bioelectromagnetics 2019, 40, 365–374. [Google Scholar] [CrossRef] [PubMed]
  7. Thiele, C.; Zaehle, T.; Haghikia, A.; Ruhnau, P. Amplitude modulated transcranial alternating current stimulation (AM-TACS) efficacy evaluation via phosphene induction. Sci. Rep. 2021, 11, 22245. [Google Scholar] [CrossRef] [PubMed] [PubMed Central]
  8. Kar, K.; Krekelberg, B. Transcranial electrical stimulation over visual cortex evokes phosphenes with a retinal origin. J. Neurophysiol. 2012, 108, 2173–2178. [Google Scholar] [CrossRef] [PubMed] [PubMed Central]
  9. Laakso, I.; Hirata, A. Computational analysis shows why transcranial alternating current stimulation induces retinal phosphenes. J. Neural Eng. 2013, 10, 046009. [Google Scholar] [CrossRef] [PubMed]
  10. Acharya, J.N.; Hani, A.; Cheek, J.; Thirumala, P.; Tsuchida, T.N. American Clinical Neurophysiology Society Guideline 2: Guidelines for Standard Electrode Position Nomenclature. J. Clin. Neurophysiol. 2016, 33, 308–311. [Google Scholar] [CrossRef] [PubMed]
  11. Giustiniani, A.; Vallesi, A.; Oliveri, M.; Tarantino, V.; Ambrosini, E.; Bortoletto, M.; Masina, F.; Busan, P.; Siebner, H.R.; Fadiga, L.; et al. A questionnaire to collect unintended effects of transcranial magnetic stimulation: A consensus based approach. Clin. Neurophysiol. 2022, 141, 101–108. [Google Scholar] [CrossRef] [PubMed]
  12. Corp, D.T.; Bereznicki, H.G.K.; Clark, G.M.; Youssef, G.J.; Fried, P.J.; Jannati, A.; Davies, C.B.; Gomes-Osman, J.; Stamm, J.; Chung, S.W.; et al. Large-scale analysis of interindividual variability in theta-burst stimulation data: Results from the ‘Big TMS Data Collaboration’. Brain Stimul. 2020, 13, 1476–1488. [Google Scholar] [CrossRef] [PubMed] [PubMed Central]
  13. Kvašňák, E.; Orendáčová, M.; Vránová, J. Phosphene attributes depend on frequency and intensity of retinal tACS. Physiol. Res. 2022, 71, 561–571. [Google Scholar] [CrossRef] [PubMed] [PubMed Central]
  14. Sadrzadeh-Afsharazar, F.; Douplik, A. Non-invasive transcranial alternating current stimulation of spatially resolved phosphenes. Front. Neurosci. 2023, 17, 1228326. [Google Scholar] [CrossRef] [PubMed] [PubMed Central]
  15. Boyle, M.R.; Fröhlich, F. EEG feedback-controlled transcranial alternating current stimulation. In Proceedings of the 6th International IEEE/EMBS Conference on Neural Engineering (NER), San Diego, CA, USA, 6–8 November 2013; pp. 140–143. [Google Scholar] [CrossRef]
  16. Ghobadi-Azbari, P.; Jamil, A.; Yavari, F.; Esmaeilpour, Z.; Malmir, N.; Mahdavifar-Khayati, R.; Soleimani, G.; Cha, Y.H.; Shereen, A.D.; Nitsche, M.A.; et al. fMRI and transcranial electrical stimulation (tES): A systematic review of parameter space and outcomes. Prog. Neuropsychopharmacol. Biol. Psychiatry 2021, 107, 110149. [Google Scholar] [CrossRef] [PubMed]
  17. Rossini, P.M.; Burke, D.; Chen, R.; Cohen, L.G.; Daskalakis, Z.; Di Iorio, R.; Di Lazzaro, V.; Ferreri, F.; Fitzgerald, P.B.; George, M.S.; et al. Non-invasive electrical and magnetic stimulation of the brain, spinal cord, roots and peripheral nerves: Basic principles and procedures for routine clinical and research application. An updated report from an I.F.C.N. Committee. Clin. Neurophysiol. 2015, 126, 1071–1107. [Google Scholar] [CrossRef] [PubMed] [PubMed Central]
  18. Groppa, S.; Oliviero, A.; Eisen, A.; Quartarone, A.; Cohen, L.G.; Mall, V.; Kaelin-Lang, A.; Mima, T.; Rossi, S.; Thickbroom, G.W.; et al. A practical guide to diagnostic transcranial magnetic stimulation: Report of an IFCN committee. Clin. Neurophysiol. 2012, 123, 858–882. [Google Scholar] [CrossRef] [PubMed] [PubMed Central]
Figure 1. Individual data points (participant numbers 1–9) for motor threshold and combined scores (tingling + flickering) for 21 Hz and 40 Hz stimulation with trend lines.
Ctn 09 00020 g001
Table 1. Number of participants (%) reporting a sensation during stimulation.
21 Hz40 Hz
Flickering lights8 (88.9%)7 (77.8%)
Tingling5 (55.6%)6 (66.7%)
Itching4 (44.4%)4 (44.4%)
Sleepiness3 (33.3%)5 (55.6%)
Trouble concentrating2 (22.2%)4 (44.4%)
Pressure on head from electrodes2 (22.2%)4 (44.4%)
Headache3 (33.3%)3 (33.3%)
Improved mood2 (22.2%)3 (33.3%)
Burning sensation1 (11.1%) 2 (22.2%)
Other1 (11.1%)1 (11.1%)
Scalp pain1 (11.1%)1 (11.1%)
Neck pain2 (22.2%)0
Tooth pain1 (11.1%)0
Local redness01 (11.1%)
Worsening of mood00
Dizziness00
Ringing/buzzing noise00
Disclaimer/Publisher’s Note: The statements, opinions and data contained in all publications are solely those of the individual author(s) and contributor(s) and not of MDPI and/or the editor(s). MDPI and/or the editor(s) disclaim responsibility for any injury to people or property resulting from any ideas, methods, instructions or products referred to in the content.

