Article

Transport of Titanium Dioxide Nanoparticles in Porous Media: Characterization and Quantification of Retention Informed by Atomic Force Microscopy

Environmental Science Department, The University of Arizona, 429 Shantz Bldg, Tucson, AZ 85721, USA
*
Author to whom correspondence should be addressed.
Colloids Interfaces 2025, 9(5), 72; https://doi.org/10.3390/colloids9050072
Submission received: 22 August 2025 / Revised: 10 October 2025 / Accepted: 14 October 2025 / Published: 17 October 2025

Abstract

Manufactured nanoparticles are used in many consumer products and industries, and are known to enter our waste streams. Transport of nanoparticles in porous media has been studied extensively; however, the forces governing the interactions between nanoparticles and naturally porous media surfaces are still not fully understood. To examine the retention mechanisms and forces involved in nanoparticle transport, miscible–miscible transport experiments were performed and followed by force profile measurements by Atomic Force Microscopy (AFM). TiO2 nanoparticles were used as the model nanoparticle, with silica sand as the model natural porous medium. Solution chemistries were varied from pH 4.5 (favorable attachment) to 8 (unfavorable attachment), and at 0.0015–30 mM ionic strength. Detachment transport experiments were performed for the unfavorable attachment conditions to determine if secondary minima attachment was present. DLVO calculations were performed to evaluate their predictive ability for force profiles under the experimental conditions. Mass recoveries for the transport experiments ranged from 28% to 80%, indicating significant attachment. Detachment was observed, indicating the presence of secondary minima. The magnitudes of attachment measured for the transport experiments were generally consistent with the results of the AFM measurements. In addition, the detachment observed at the highest pH was also consistent with the predictions, indicating the presence of secondary minima. DLVO theory underestimated the magnitudes of the attractive and repulsive forces measured by AFM but was able to qualitatively represent behavior observed at the lower two pHs. In contrast, it provided a poor representation of behavior at the highest pH. The integrated AFM measurements and miscible–displacement experiments employed in this study have provided insight into the retention of TiO2, with implications for other nanoparticles during transport in porous media.

1. Introduction

The use of nanoparticles in manufacturing, consumer products, and other applications continues to increase. Concomitantly, there remains significant concern over the transport and fate of nanoparticles in the environment and their potentially deleterious impacts to human health and the environment, as discussed in a recent review [1]. The transport of nanoparticles in porous media is one topic that has been extensively studied, with numerous works investigating the impact of properties of the nanoparticles, solutions, and soil on retention and transport [2,3,4,5]. One of the most produced and widely used nanoparticles is titanium dioxide (TiO2), due to its combination of several desirable properties. TiO2 has a very high refractive index, high UV absorption capacity, and photocatalytic and antimicrobial properties. As a result, it is widely used for many industrial and commercial applications including pigments, sunscreens, cosmetics, and self-cleaning surfaces. A study of worldwide production of 10 nanoparticles reported that TiO2 was the most produced out of the ten [6]. Annual production of TiO2 pigment alone in the United States is estimated at approximately 1 million metric tons (USGS Mineral Commodity Summaries: Titanium and Titanium Dioxide website). Estimates of total production are much higher [7].
A large number of studies have investigated the retention and transport of TiO2 in soil and other porous media [8,9,10,11,12,13,14,15,16,17,18,19]. The results of these studies have provided insight into the influence of soil and water chemistry properties on TiO2 retention and transport behavior. However, uncertainties remain regarding the mechanisms of interaction between TiO2 particles and porous-medium solid surfaces, especially for unfavorable attachment conditions. While classic filtration theory and current understanding of DLVO interactions generally describe favorable attachment well [20,21,22], discrepancies between theory and measurements abound in the literature for unfavorable conditions [12,22,23,24,25,26,27]. Several phenomena have been suggested to account for these discrepancies, including straining, surface charge heterogeneity, and secondary minima attachment.
It is anticipated that measurements of the forces between nanoparticles and porous-medium surfaces will contribute to clarifying the type and importance of interactions influencing retention, which would advance our understanding of nanoparticle transport. One approach that has been used to accomplish this is the application of Atomic Force Microscopy (AFM) to measure forces between particles and solid surfaces, wherein the particles are attached to the AFM probe [28,29,30]. To our knowledge, the use of AFM to measure force profiles has not been applied to TiO2 in concert with transport experiments.
The objective of this study is to investigate and determine the mechanisms influencing the retention of TiO2 nanoparticles during transport in a water-saturated porous medium. This will be accomplished by applying AFM to measure force profiles in concert with controlled miscible–displacement transport experiments. The application of AFM is anticipated to be particularly useful for investigating the presence of secondary minima. The integration of AFM measurements and miscible–displacement experiments as employed in this study will provide insight into the retention of TiO2 and other nanoparticles during transport in porous media.

2. Materials and Methods

2.1. Materials

A well-sorted commercially available silica sand was used as the model naturally porous medium (20/30 Accusand, UNIMIN Corp, Ottawa Plant, Ottawa, MN, USA, median grain diameter of 0.677 mm). This sand has very low organic carbon and metal oxide contents, and no clay minerals. The zeta potential of the sand under experimental conditions was determined by Laser Doppler Micro-electrophoresis (LDME) (Malvern Zetasizer Nano ZS, Malvern Panalytical Ltd., Malvern, UK). Commercial TiO2 nanoparticles (MKnano, Mississauga, ON, Canada, 99%) with rutile crystalline structures and a nominal particle size of 50 nm were used as the representative nanoparticle. The particles were in solid powder form with no surface coating or treatment. Reagent grade pentafluorobenzoic acid (PFBA, Oakwood Products Inc., Estill, SC, USA) was used as a non-reactive tracer. Solutions were prepared with double-distilled water containing a phosphate buffer prepared from KH2PO4 and K2HPO4 (Baker Analyzed Reagents, Avantor Performance Materials, LLC., Radnor, PA, USA). Miscible–displacement experiments were conducted using acrylic columns (Soil Measurement Systems (SMSs)) of 2.58 cm internal diameter and 5.08 cm length, fitted with polyethylene frits (thickness: 32 mm, porosity: 15–45 μm, POR-4898, Interstate Specialty Products, Sutton, MA, USA) to retain the porous media.

2.2. Experiment Approach

The transport experiments and AFM measurements were conducted at three pH values of 4.5, 6, and 8, to characterize and quantify retention under both favorable and unfavorable attachment conditions. The zero point of charge (pHpzc) of TiO2 is reported to be 5.9 [31]. Therefore, favorable attachment conditions are expected for pH 4.6, unfavorable attachment conditions for pH 8, and mixed conditions for pH 6. The impact of solution chemistry was tested by conducting experiments at multiple ionic strengths. The transport experiments were conducted at a lower flow rate and equivalent pore water velocity, closer to natural groundwater flow rates, compared to many prior studies. To evaluate potential retention mechanisms at pH 8, water with essentially zero ionic strength (approximately 0.0015 mM, due to addition of a minute amount of buffer to maintain pH) was injected during the elution phase for selected TiO2 transport experiments.

2.3. Atomic Force Microscope Measurements

Magnetic stainless steel AFM specimen disks (10 mm diameter, approximately 0.7 mm thickness) were used, and approximately 5 mm wide, 0.4 mm deep wells were drilled in one side. Between 10 and 30 grains of the silica sand were affixed in the wells with small drops of adhesive, by the same methods as used in Attinti et al. [29] (see Figure S1). MikroMasch silicon-etched AFM probes with pre-measured spring constant (19-F series, backside Al-coated) were used for all force curve measurements.
The TiO2 nanoparticles were attached to the probes following the methods of Ong and Sokolov [28], where a Dimension AFM (Digital Instruments Dimension 3100, Bruker Nano, Inc., Santa Barbara, CA, USA) was used to manipulate the probes. Using the built-in video system of the Dimension, the AFM tips were first dipped in small drops of 10-min epoxy glue, and then in small piles of nanoparticles. This method resulted in a small (nm sized) “clump” being attached to the AFM tip, representing a nanoparticle aggregate. The epoxy was allowed to cure for at least 48 h before use. The probes were then sonicated for approximately 20 s to dislodge particles that may have been associated with the “clumps” but not fully attached. Scanning Electron Microscopy (SEM) (Hitachi S-4800 Type II, Hitachi High-Technologies Corporation, Tokyo, Japan) images of used nano-modified tips were obtained to confirm the presence of terminal nanoparticles on the tips. The mean diameter of the aggregates formed on the tips is 398 nm.
Force curve measurements were obtained for the nanoparticle-modified probes against the porous medium in aqueous conditions using a Multimode AFM (Digital Instruments Multimode with a NanoScope III controller). The ionic strength of the aqueous solutions ranged from 0.015 to 30 mM, and the pH values ranged from 4.5 to 8. Care was taken to ensure equilibrium of the tips in the solutions before measurements were obtained. Multiple force curve measurements (with each force curve measurement comprising an extension and a retraction of the cantilever) were acquired at several points on the porous media surface for each of the aqueous conditions to account for variability from surface heterogeneity. For aqueous conditions where the forces measured were highly variable, as many as 50 force curve measurements were obtained and averaged. Force curves were also obtained for adhesive-only modified probes and for unmodified probes to characterize the effects from the adhesive agent and the tips themselves. These measurements occurred under the same aqueous conditions as used for the nanoparticle-modified probes.

2.4. Transport Experiments

The experiments were conducted following methods used successfully in prior work [32,33]. The columns were packed with the sand to obtain bulk densities of approximately 1.7 g/cm3, saturated using de-aired, double-distilled water, and then flushed with approximately 60 pore volumes of phosphate-buffered solution. TiO2 suspensions were prepared at concentrations of 100 mg/L using the same buffered solution at different ionic strengths (0.3–30 mM) and pH values (4.5, 6 and 8). For this study, a “stable” TiO2 nanoparticle suspension was defined as a suspension that did not decrease by more than 15% in absorbance (measured by UV–visible spectrophotometry) over a time period equivalent to the duration of a tracer test. There was minimal change in absorbance over the first several hours, and a 14% reduction after 14 h, for all solutions.
A piston pump (Fluid Metering Company, Syosset, NY, USA, pump model Q1 CSC-W QG6), connected to the column with plastic tubing (Fluid Metering Company, Small Bore Tubing Kit Q661A: OD 1/16”), was used to inject the solutions containing the PFBA tracer or the nanoparticles into the bottom of the vertically positioned column. A pore water velocity of 0.3 cm/min was used to simulate groundwater flow rate. Once steady effluent concentrations were attained, buffer solution containing no tracer or nanoparticles was injected using the same ionic strength and pH as employed for the nanoparticle and tracer-solution injection. Effluent samples (3 mL) were collected using a fraction collector (Pharmacia, LKB-RediFrac, Marlborough, MA, USA).
Prior to each TiO2 experiment, a tracer test was conducted using a non-reactive tracer to characterize the hydrodynamic properties of the packed columns. PFBA solutions of concentrations between 150 and 200 mg/L were injected into the column at the same flow rate and using the same pump as the subsequent TiO2 experiments. The samples were analyzed by UV–visible spectrophotometry at a wavelength of 262 nm. TiO2 concentrations in the effluent samples were measured with UV–visible spectrophotometry at a wavelength of 290 nm. The zeta potentials of TiO2 nanoparticle suspensions from the influent (reservoir) and the effluent were determined using LDME (Malvern Zetasizer Nano ZS), to examine potential changes in surface charge after transport through the porous medium.
The morphology of the TiO2 nanoparticles in the influent and effluent solutions was investigated by Scanning Electron Microscopy (SEM) (Hitachi S-4800 Type II). Drops of influent and effluent samples (~50 μL each) were spotted onto doped silicon wafers freshly prepared by glow discharge. The samples were then dried under a low vacuum, blown with pure nitrogen gas to remove loose particles, and sputtered with approximately 5 nm of platinum to conduct charge. Representative images of the TiO2 nanoparticle aggregates within the samples were captured with optic settings of −5 kV, condenser lens 8, current 10, and probe set to high mode.
The morphology of the particles in the influent and effluent solutions was also examined using Nanoparticle Tracking Analysis (NTA) (Nanosight, Malvern Panalytical Ltd., Malvern, UK, L10). For this method, a sample of nanoparticle suspension was placed on a glass plate, through which a flattened laser beam was directed. A digital video camera was used to capture real-time images of individual nanoparticles within the sample. The image data were processed to characterize the Brownian movement of the particles, from which the particle sizes were determined through application of the Stokes–Einstein equation. The data for a large number of particles was then tabulated to develop a particle size distribution for the sample. An advantage of this method is the ability to characterize morphology under natural, aqueous-environment conditions.

2.5. Data Processing and Analysis

Raw force curve data for AFM were obtained in voltage (y) and sample position distance (x). The y-baseline (0 line) was subtracted from all the voltage measurements. The slope of the region of constant compliance was determined, and all voltage data was divided by this value to convert volts into nm (distance of tip deflection). All sample position distance data were converted into sample separation distance by subtracting the corresponding tip deflection value (xi = x − yi). Finally, the y-values were multiplied by the spring constant of the tip used, to obtain force with the units to nN (e.g., Owen, 2009 [11]). All replicate measurements were then averaged.
The Derjaguin–Landau–Verwey–Overbeek (DLVO) [34,35] interaction energies between the particles and the soil surface were calculated by the Equation (1) [12]:
ϕ t o t a l =   π ε 0 ε r a p ξ p 2 + ξ c 2 2 ξ p ξ c ( ξ p 2 + ξ c 2 l n 1 + exp κ D 1 exp κ D                                                                                               + l n 1 exp 2 κ D + A N S a p 6 D 1 + 14 D λ 1
where ε0 is the permittivity of a vacuum, εr is the relative dielectric constant of the medium, ap is the radius of the nanoparticle aggregate, ξp and ξc are the electrical potentials of the nanoparticles and the sand, respectively (estimated by the zeta potentials), D is the separation distance, ANS is the Hamaker constant of the TiO2 nanoparticle–water–sand system (4.5 × 10⁻²⁰ J), λ is the characteristic wavelength of interaction (taken to be 100 nm [12]), and κ is the inverse Debye length, which was calculated using Equation (2):
κ = ρ i e 2 z i 2 ε 0 ε r k B T
where ρi is the ion density in the bulk solution, e is the electron charge, z is valence of ions in the bulk solution, kB is the Boltzmann constant, and T is the absolute temperature of the system (e.g., [12]). The multiple valence of the electrolyte was accounted for in the Debye length. Resulting data were converted into units of force by division of estimated tip radius (taken to be the radius of average nano-TiO2 aggregate size).
These DLVO calculations are taken as first approximations of the interactions occurring; it is well understood that DLVO theory is limited in its ability to represent real-world systems. For example, the DLVO calculations herein have inherent inaccuracies as they assume perfect sphere–plate interactions and use the Derjaguin approximation. In addition, the mean aggregate diameter of 398 nm was used to convert DLVO to units of force, whereas a wide particle distribution existed in the transport experiments. These factors may account for some of the discrepancies between predicted and observed behavior.

3. Results

3.1. Nanoparticle Characterization

Inspection of the SEM images indicates that the individual (singular) TiO2 particles are primarily tubular, with average diameters of approximately 50 nm (Figure S2). The images indicate that aggregates may form, comprising several individual particles. The effective diameters of the TiO2 particles in the influent sample ranged from approximately 30 to 550 nm, with a mean of 180 nm, as measured by NTA (Figure S3). This range of diameters indicates that most of the particles in the solution exist as aggregates, which is consistent with the SEM results.
The mean effective particle diameter for the effluent sample (174 nm) was slightly smaller than the mean for the influent sample. In addition, the >400 nm size fraction present for the influent sample is absent for the effluent sample (Figure S3). This change in particle size distribution was most likely caused by the capture of larger aggregates (400 nm size range) within the column. However, this fraction comprises a very small portion of the particle population, and thus straining is considered to have a minimal impact on the overall transport of the nanoparticles for this system. The results of mathematical modeling and transport experiments suggest that straining may occur when the ratio of the colloid particle diameter to mean grain diameter (dp/d50) is greater than 0.002 [21,36,37]. For these experiments, dp/d50 ranged from 0.00004 to 0.0006, suggesting that straining was minimal. This is consistent with the results of the NTA characterization discussed above.

3.2. AFM Experiments

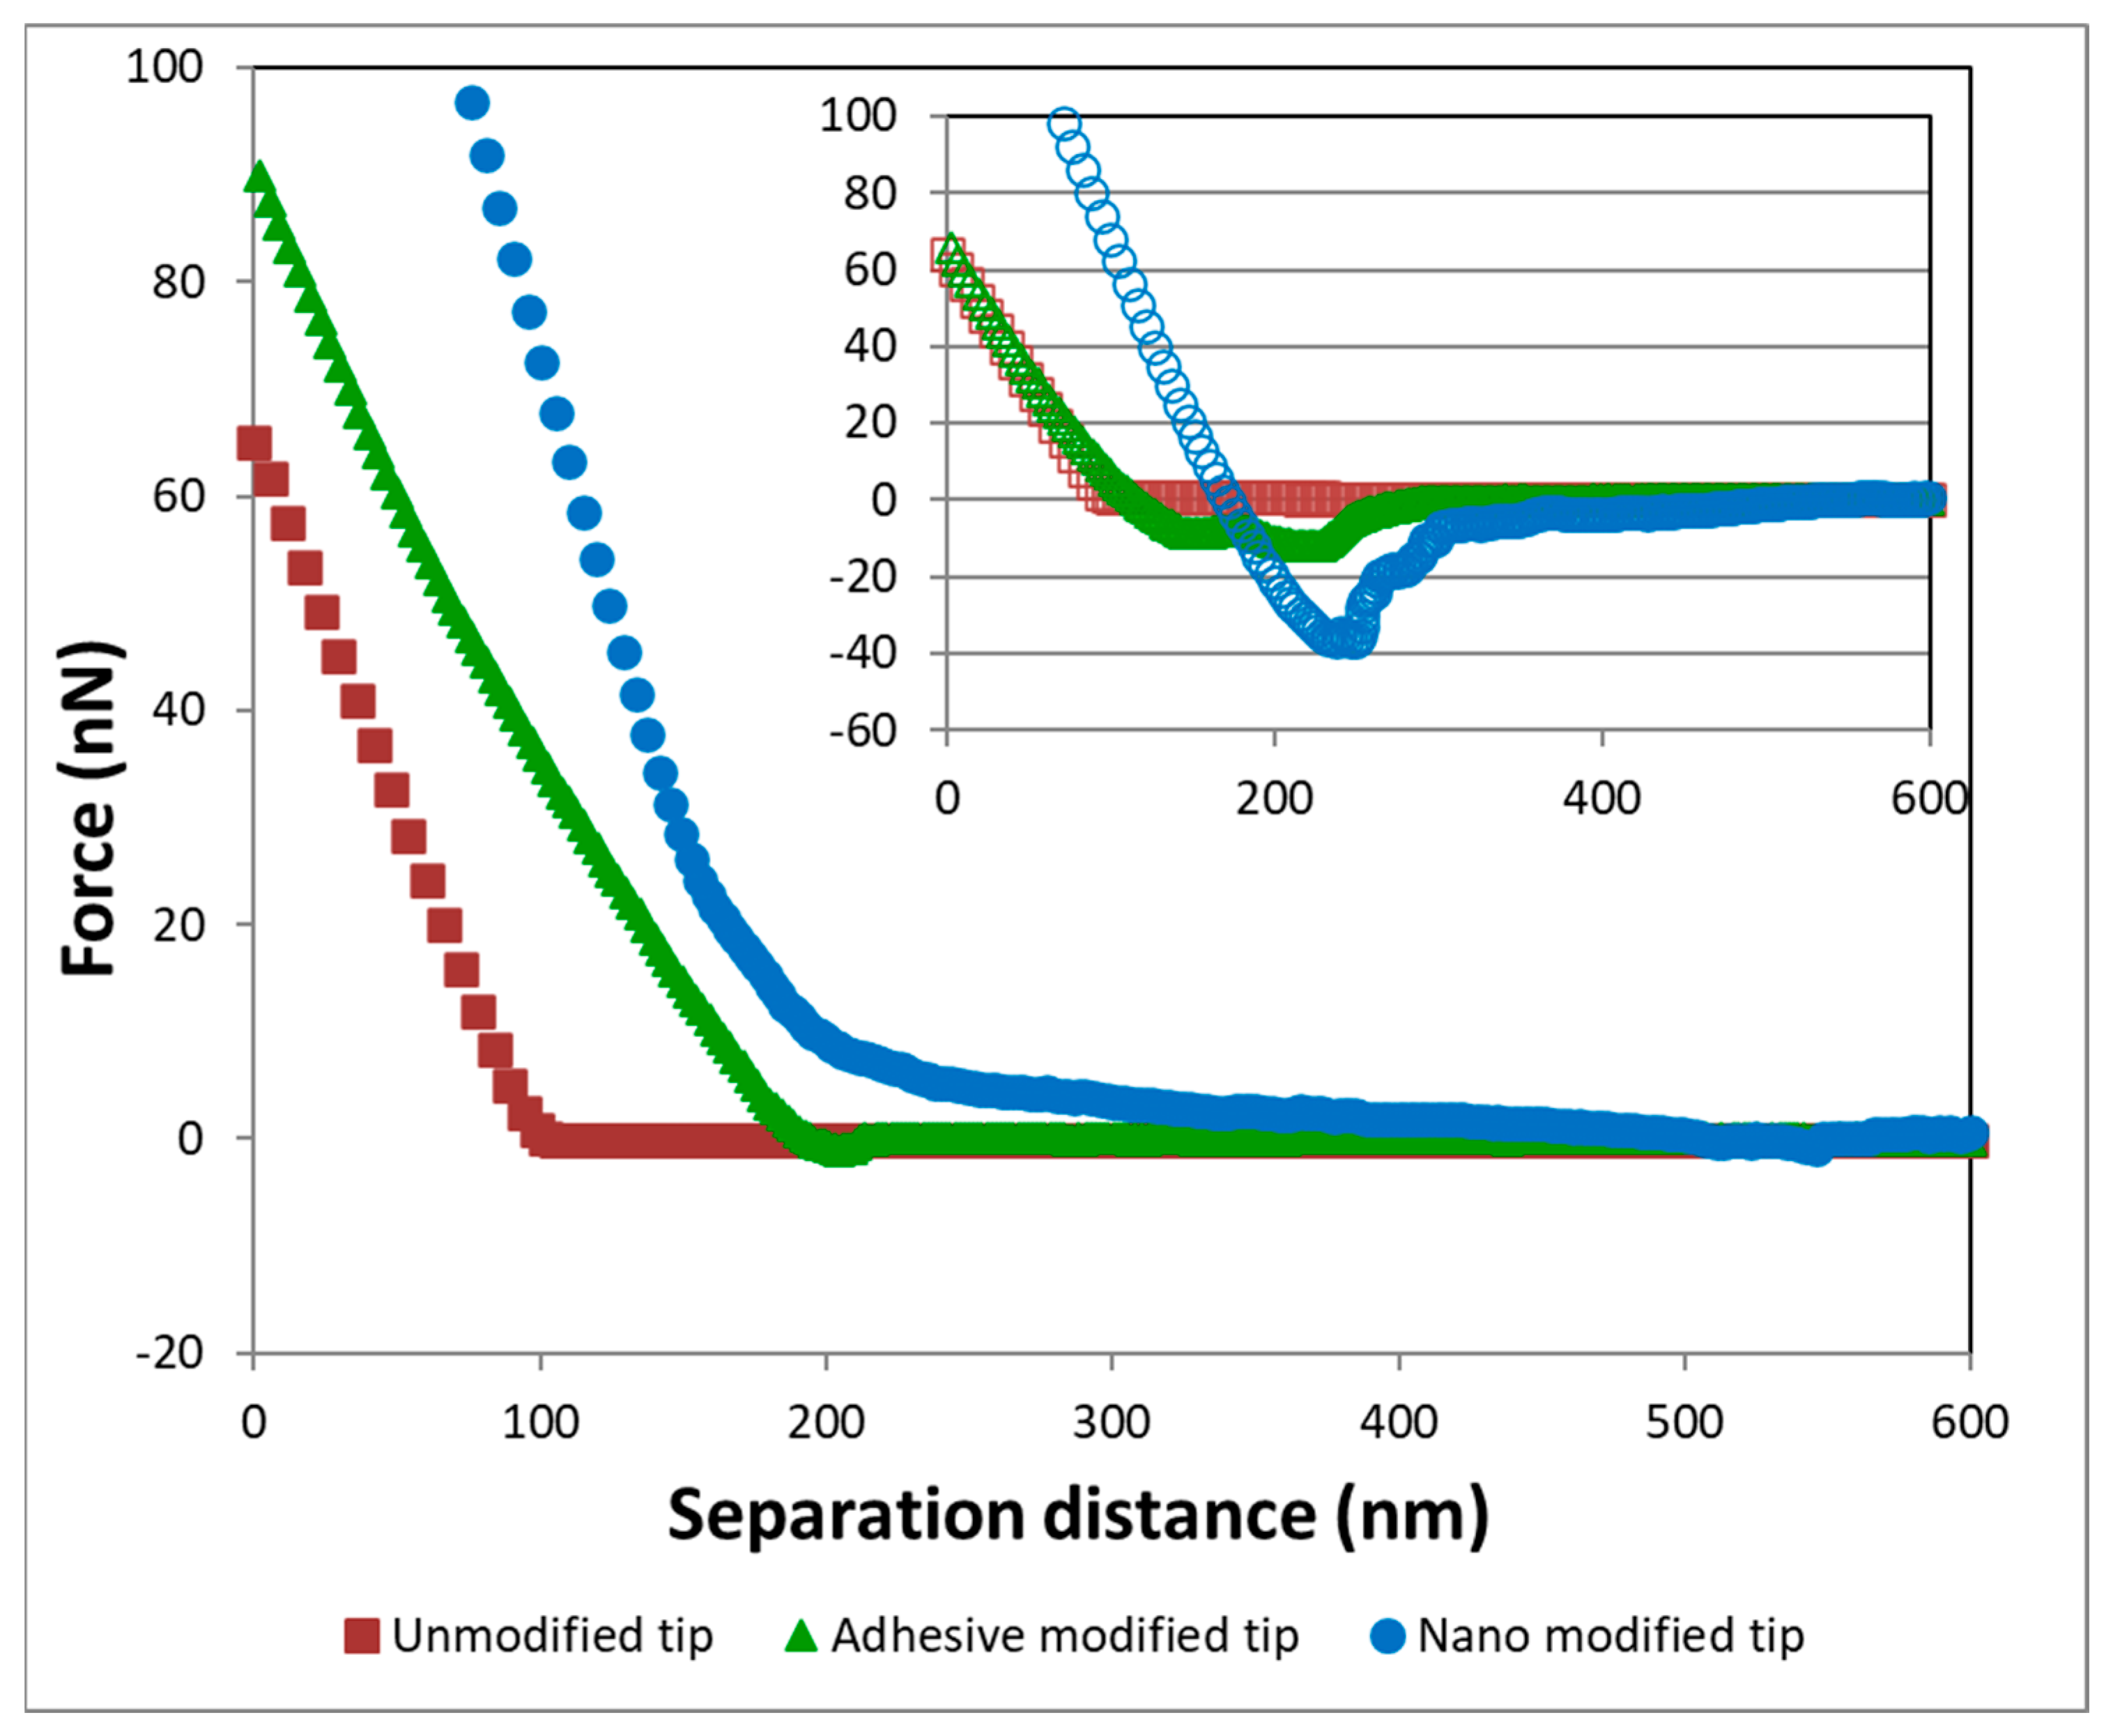
The unmodified tips had similar force curves regardless of solution chemistry, with little to no vdW or EDL effects observed (Figure 1). Only two pH and two ionic strength conditions are shown as representative data, as all data for the unmodified tips were similar. There was some change observed in the force profile, with changes in solution chemistry for the adhesive-only tips. However, the changes in behavior were significantly different from those observed for the nanoparticle-modified tips (Figure 2). SEM imaging confirmed the presence of terminal nanoparticles on the used AFM tips (Figure S4).
For the nanoparticle-modified tips, absolute adhesion was obtained from the absolute values of the largest deviation below the 0-force line upon retraction of the probe. These values comprise the adhesive forces occurring between the particle and the surface and are indicative of the potential attachment/detachment to/from the surface. Repulsive barrier height was determined by the highest force measured above the 0-force line on approach of the probe. These forces are the repulsive forces experienced by the particle when approaching a surface, and illustrate the likelihood that a particle can approach and attach to the surface. Negative forces measured further from the surface than the repulsive barrier were taken as secondary minima forces.
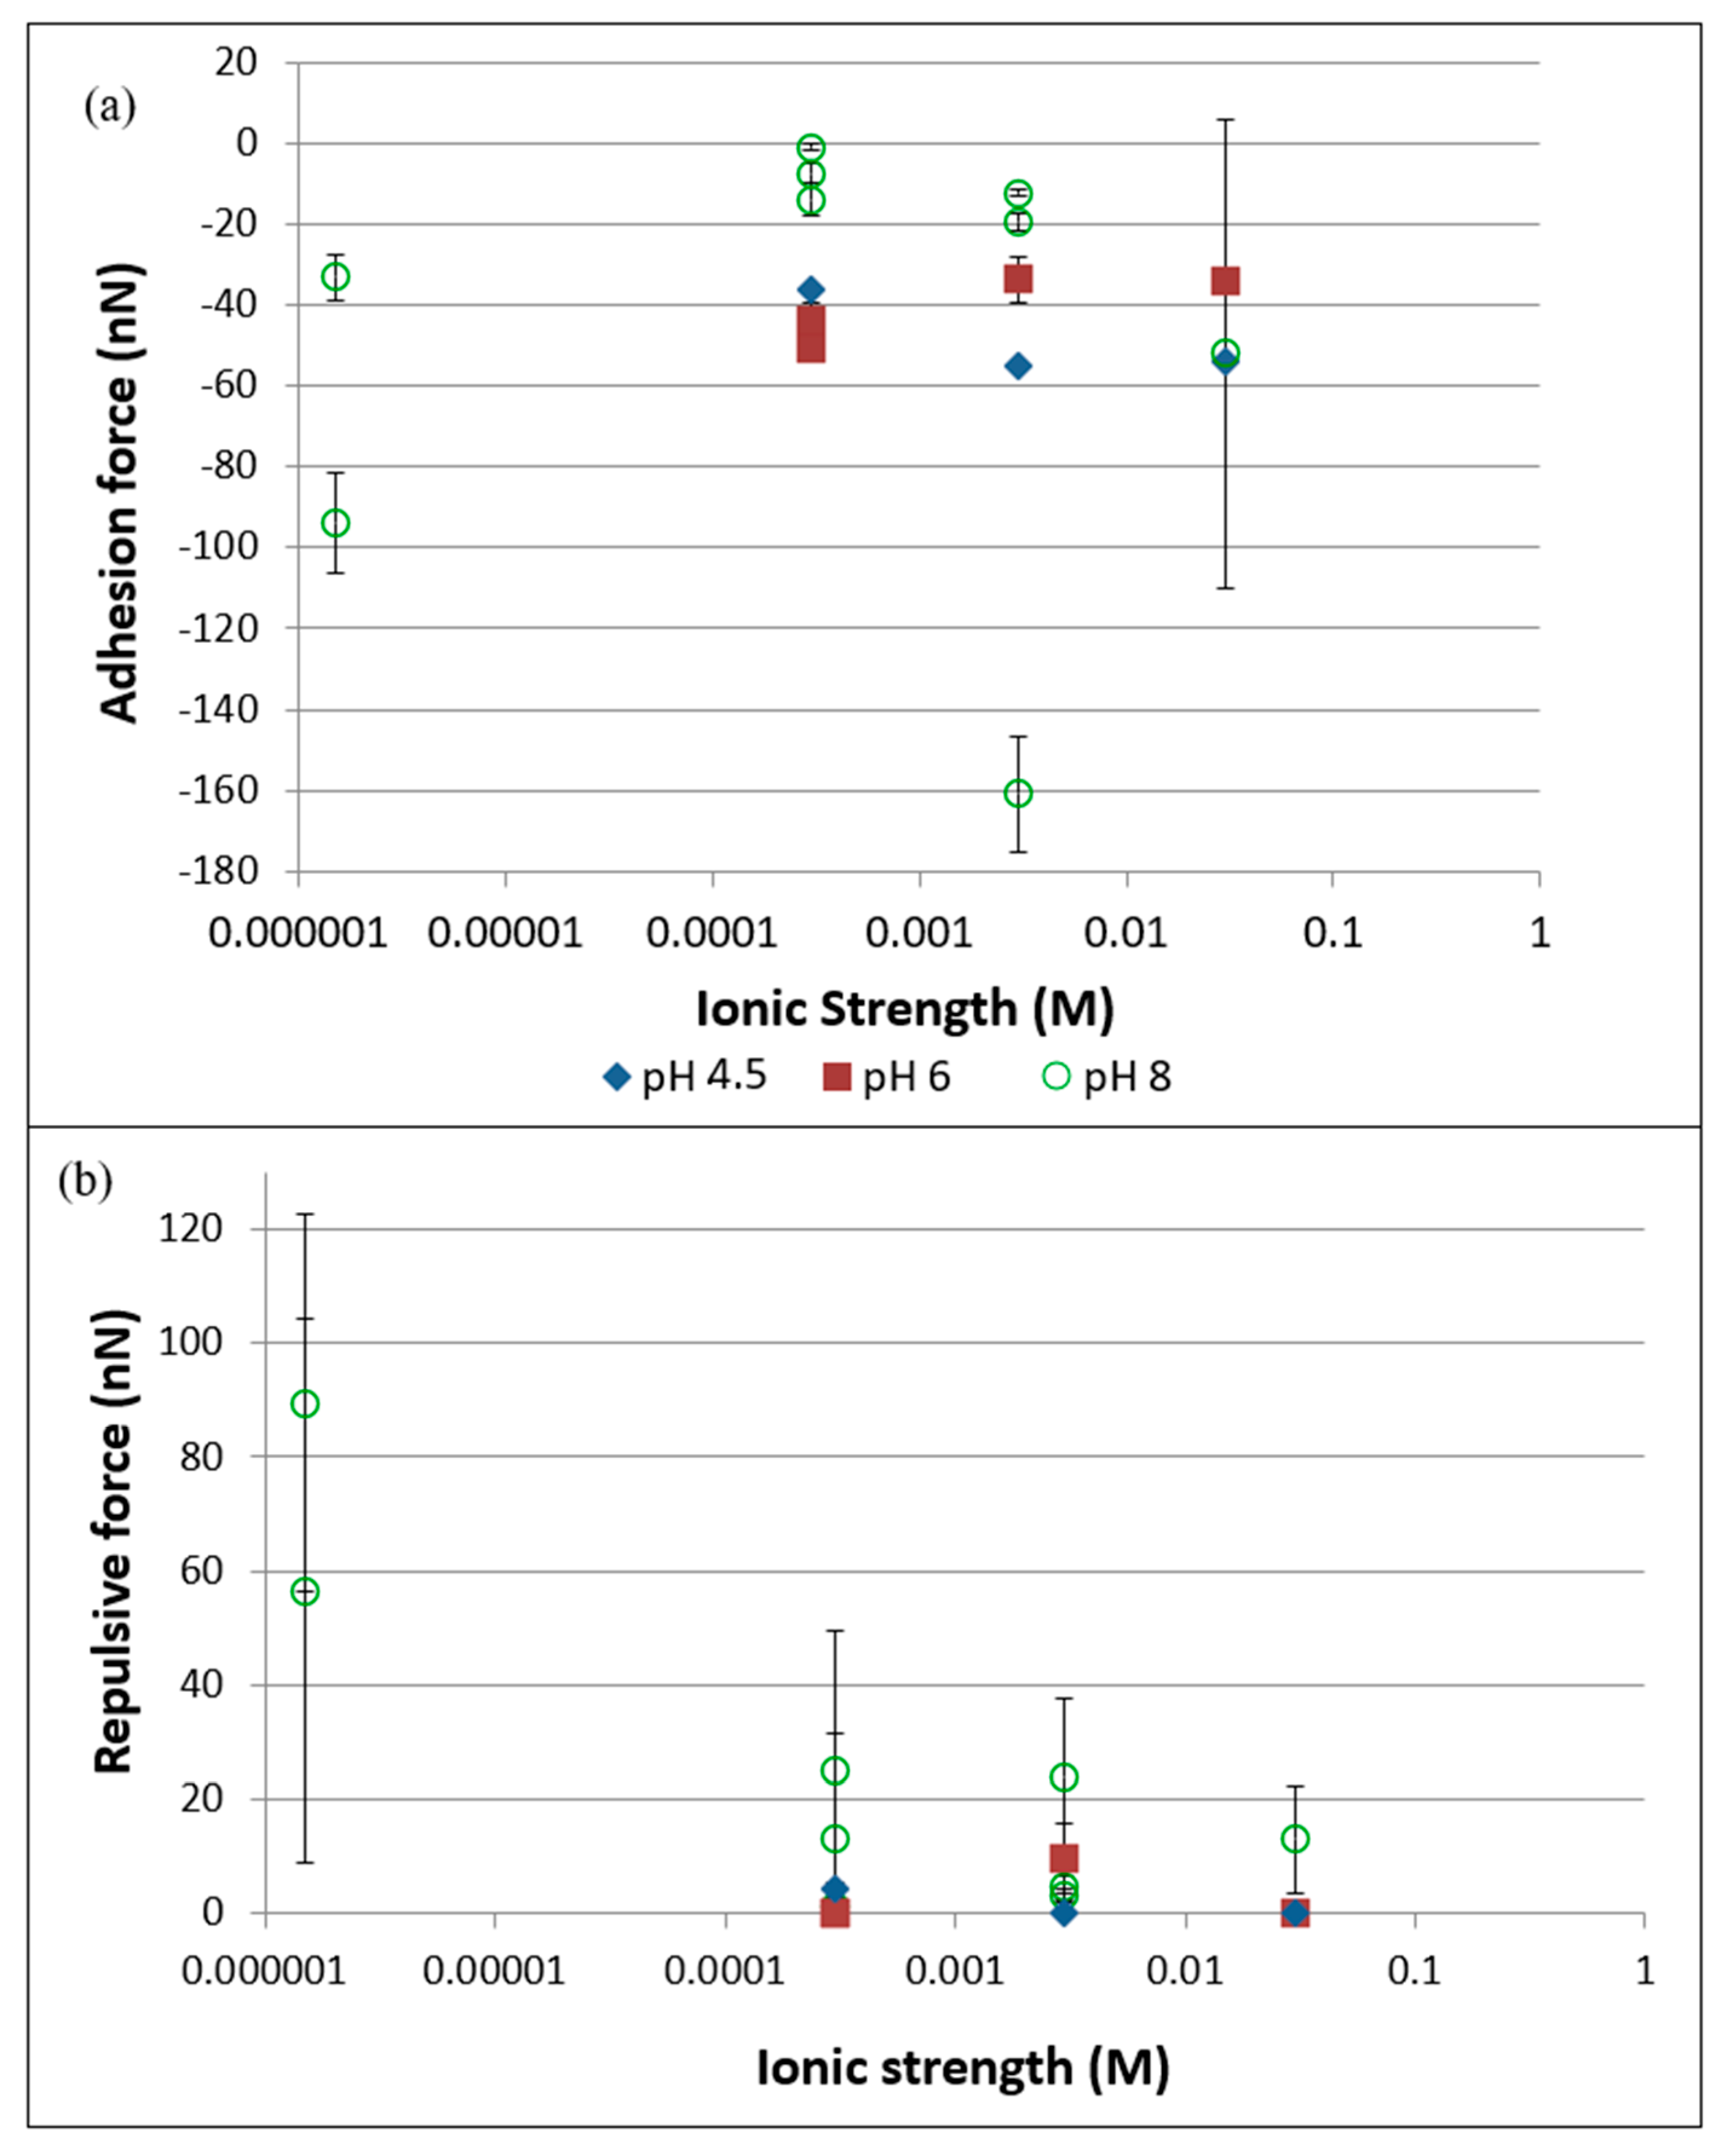
The force measurements are presented in Figure 3. It should be noted that multiple force measurements were collected for each point. The many force profiles were averaged, and the means of these are shown on the figures. The error bars on the figures represent the variability of the measured forces over time. All points in Figure 3 contain error bars; however, some of the variability was too small to be observed on the figure scale.
The forces measured at pH values of 4.5 and 6 were highly stable and largely non-hysteretic (Figure 3). They were also largely in at least qualitative agreement with the theory. Conversely, at pH 8, measurements were observed to be highly variable, exhibit hysteresis, and differed most widely from the theory. Given the low variability observed for the two lower pHs as well as the better comparison to theory, the variability observed at pH 8 is hypothesized to result from interactions associated with unfavorable attachment conditions.
For the nanoparticle-modified tips at pH 4.5 and 6, absolute adhesion for the nanoparticle-modified tips is observed to be comparatively minimally impacted by ionic strength (Figure 3 Top). Conversely, the adhesion force changes significantly with ionic strength at pH 8. The absolute adhesion force for the nanoparticle-modified tips is high for very low ionic strengths at pH 8. There was one anomalous measurement of very large absolute adhesion force (approximately 160 nN) observed for one of the 3 mM ionic strength replicates. The likely cause of this was a larger-than-typical nanoparticle aggregate on the modified tip, as larger particles are expected to have larger adhesion forces due to an increase in vdW forces. None of the other nano-modified tips exhibited such large adhesion forces under any solution chemistry. The apparent effects of ionic strength on adhesion at pH 8 was surprising; the TiO2 and the porous media surface are expected to be both highly negatively charged at this pH, creating unfavorable attachment conditions. If the only forces occurring under these conditions were vdW forces, it would be expected that ionic strength would not affect the adhesion force.
Small repulsive barrier forces (≤4 nN) were observed for the nanoparticle-modified tips at pH 4.5 (Table 1 and Figure 3 Bottom). This is consistent with favorable conditions as electrostatic forces would all be expected to be attractive under these conditions. At pH 6, repulsive barriers (~9 nN) were observed for the nanoparticle-modified tips only at the IS of 3 mM (Table 1 and Figure 3 Bottom). Under these conditions, EDL repulsion associated with the negatively charged areas of the nanoparticles may be present. Typically, these EDL repulsive forces are inversely related to ionic strength; however, no repulsive barrier was observed at the lower ionic strength for pH 6. Repulsive barriers are present under all conditions at pH 8 for the nanoparticle-modified tips and are somewhat inversely related to ionic strength (Table 1 and Figure 3 Bottom).
Overall, pH had a moderate effect on adhesion and repulsion forces for the nanoparticle-modified tips, particularly at the lower ionic strengths and for pH 8.
Secondary minima were assumed to comprise any negative force measured further from the surface than a repulsive barrier. When no repulsive barrier was present, or the attractive forces were closer to the surface than the repulsive barrier, then attractive forces were counted as primary minima, or adhesion forces. Apparent secondary minima were observed for the nanoparticle-modified tips for all conditions at pH 8, including at the IS of 0.015 mM, and for the IS of 0.3 mM at pH 6 (Table 1). There was no observable trend as to the depth of these minima. Adhesive-modified and unmodified tips did not exhibit secondary minima behavior under any solution chemistries. This indicates that the suspected secondary minima occurrence is associated with the presence of the nanoparticles.

3.3. Transport Experiments

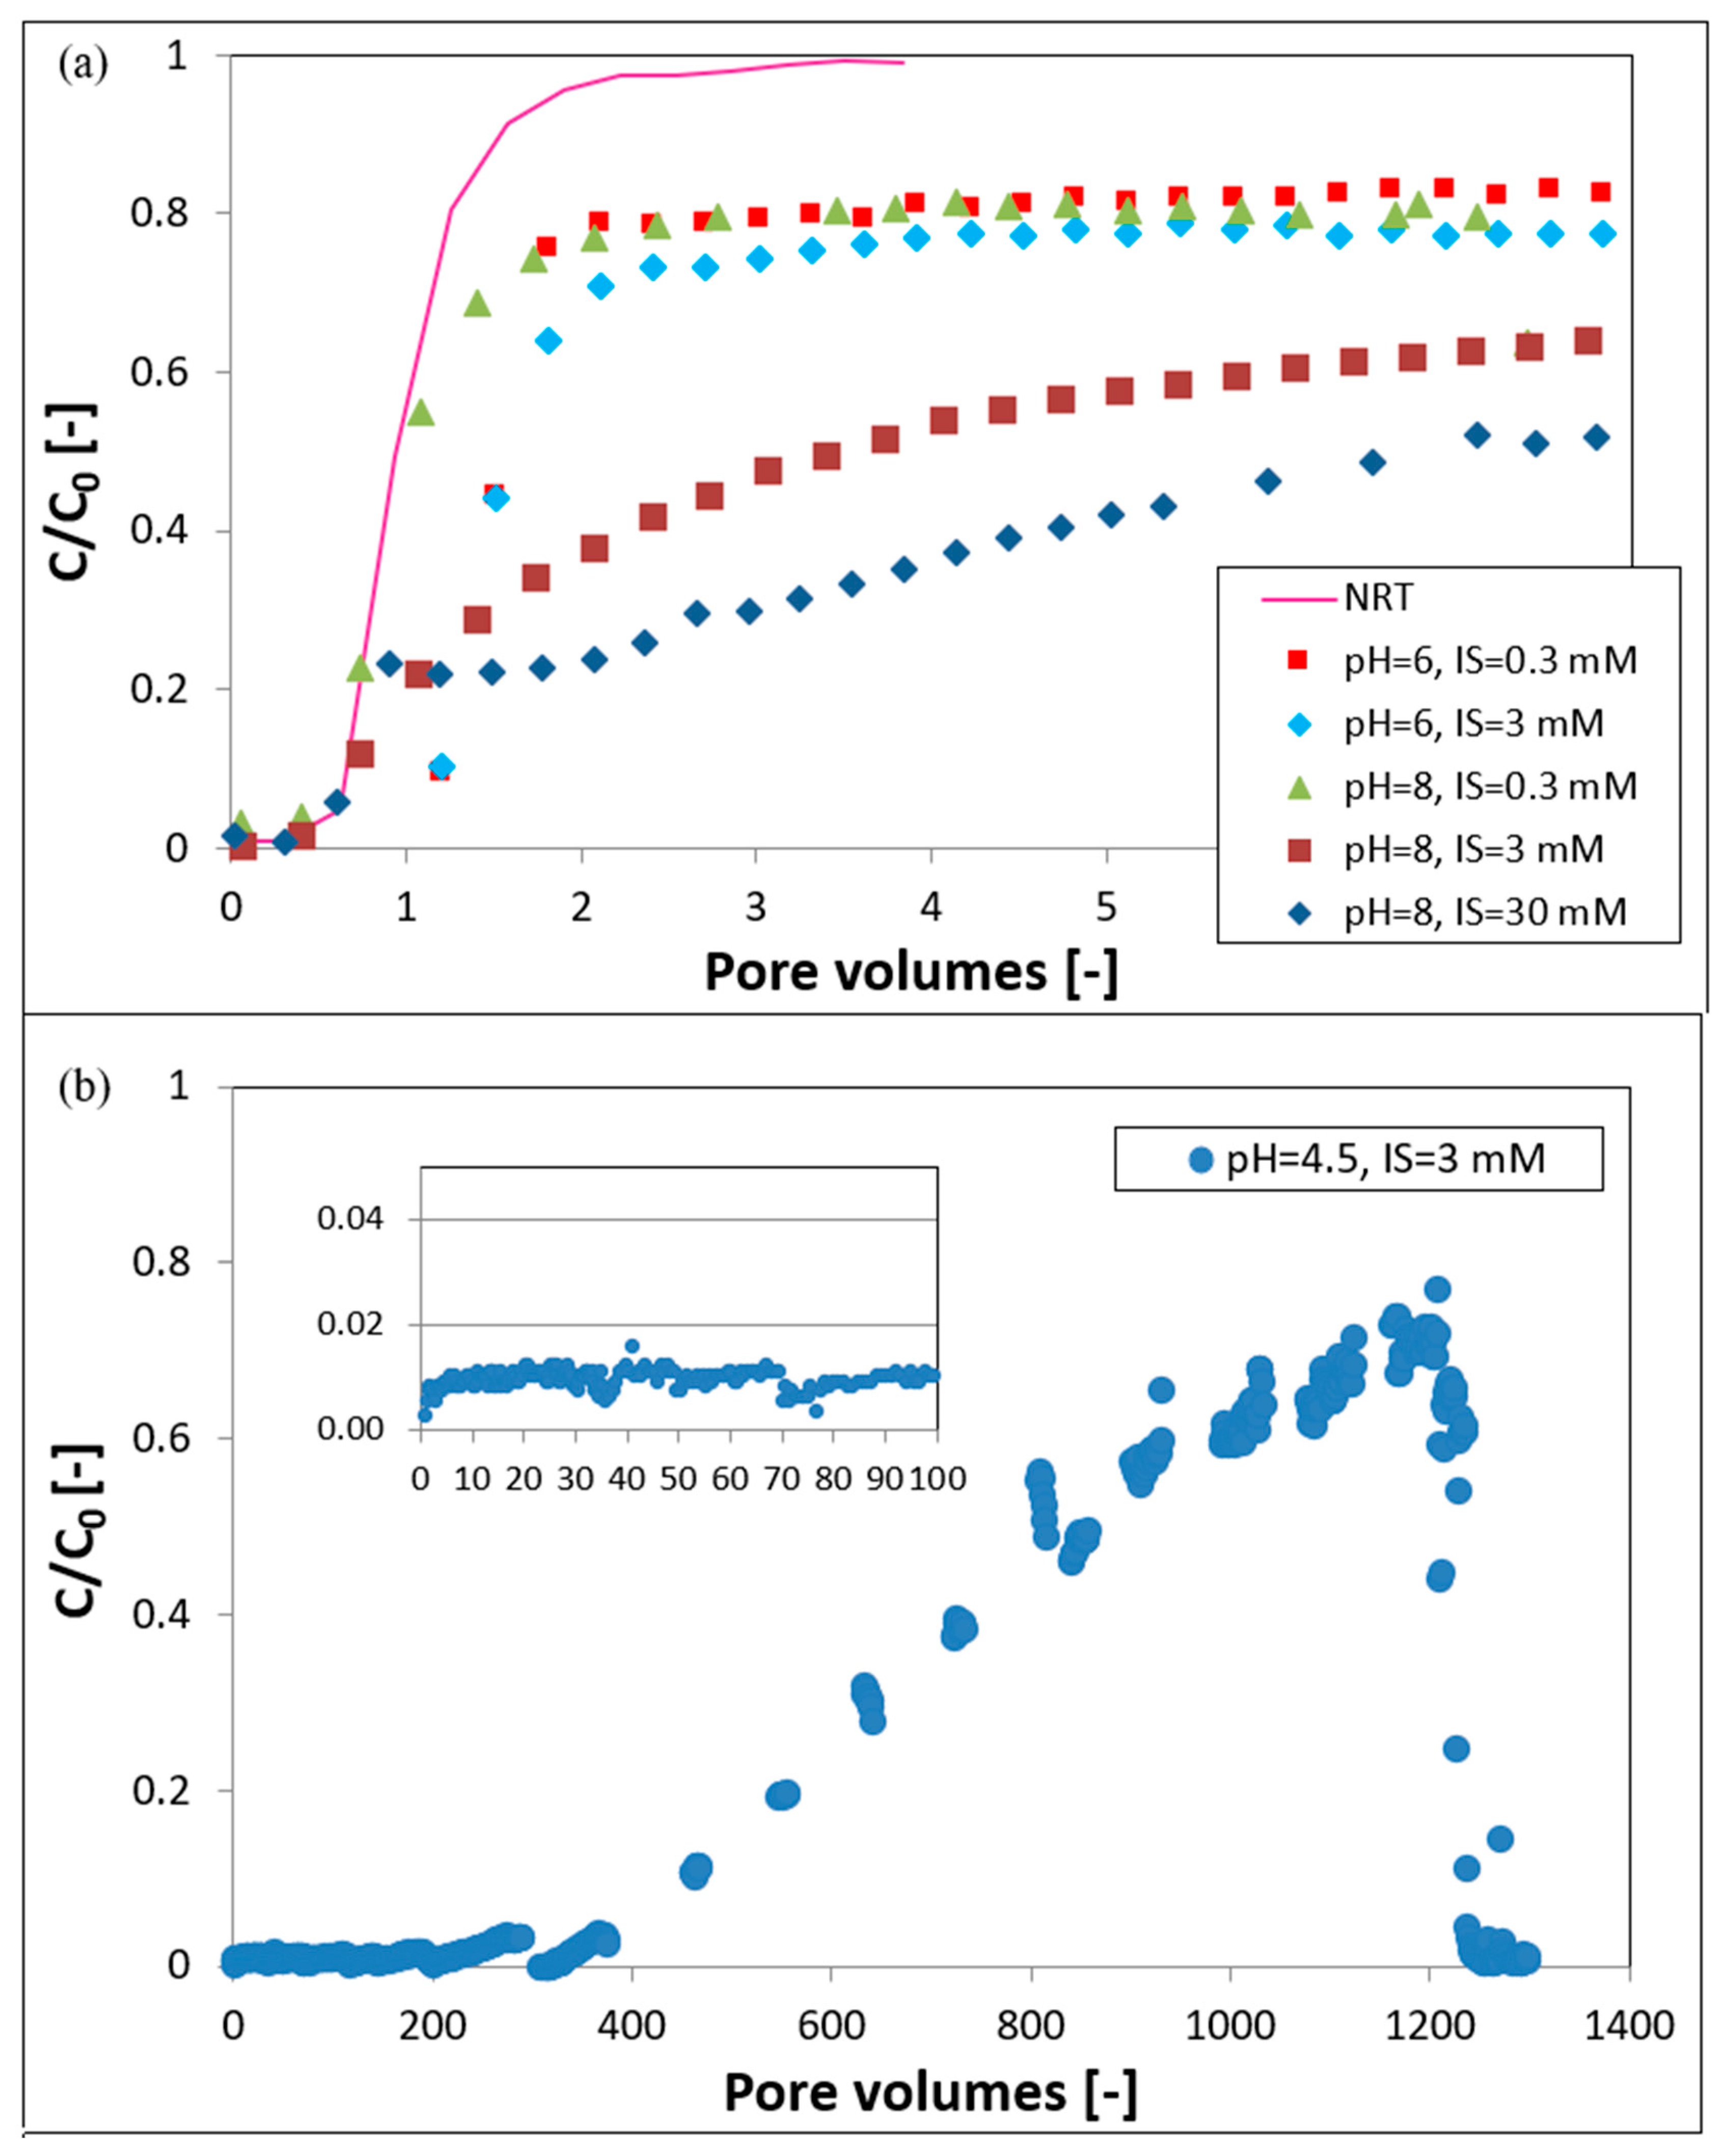
Representative breakthrough curves for the non-reactive tracer PFBA and for TiO2 are presented in Figure 4. The PFBA breakthrough curves are sharp and symmetrical, indicating ideal hydrodynamic transport conditions. The recoveries for the non-reactive tracer ranged from 98.5% to 106%, indicating essentially complete recovery. In contrast, retention of TiO2 was observed for all solution chemistries, with mass recoveries ranging from 28 to 80%.
In general, the transport behavior of the TiO2 nanoparticles comprised an initial breakthrough at approximately one pore volume, followed by a steady-state stage wherein effluent concentrations remained below the influent concentration for an extended time (Figure 4). This behavior is similar to that which has been previously reported for TiO2 nanoparticles and other colloids (e.g., [9,26,32,33,36,38,39]. Transport for pH 4.5 differed from the other pH experiments, wherein initial breakthrough reached a plateau at a very low relative concentration of 0.01 until approximately 300 pore volumes. This is much lower than observed for the other pH values, reflecting the favorable attachment conditions at pH 4.5. Thereafter, relative concentration increased gradually to approximately 0.75 at 1200 pore volumes (Figure 4 Bottom). This latter behavior is attributed to the blocking effect wherein attachment sites become filled and nanoparticles in later stages experience increasing amounts of nanoparticle-covered surfaces.
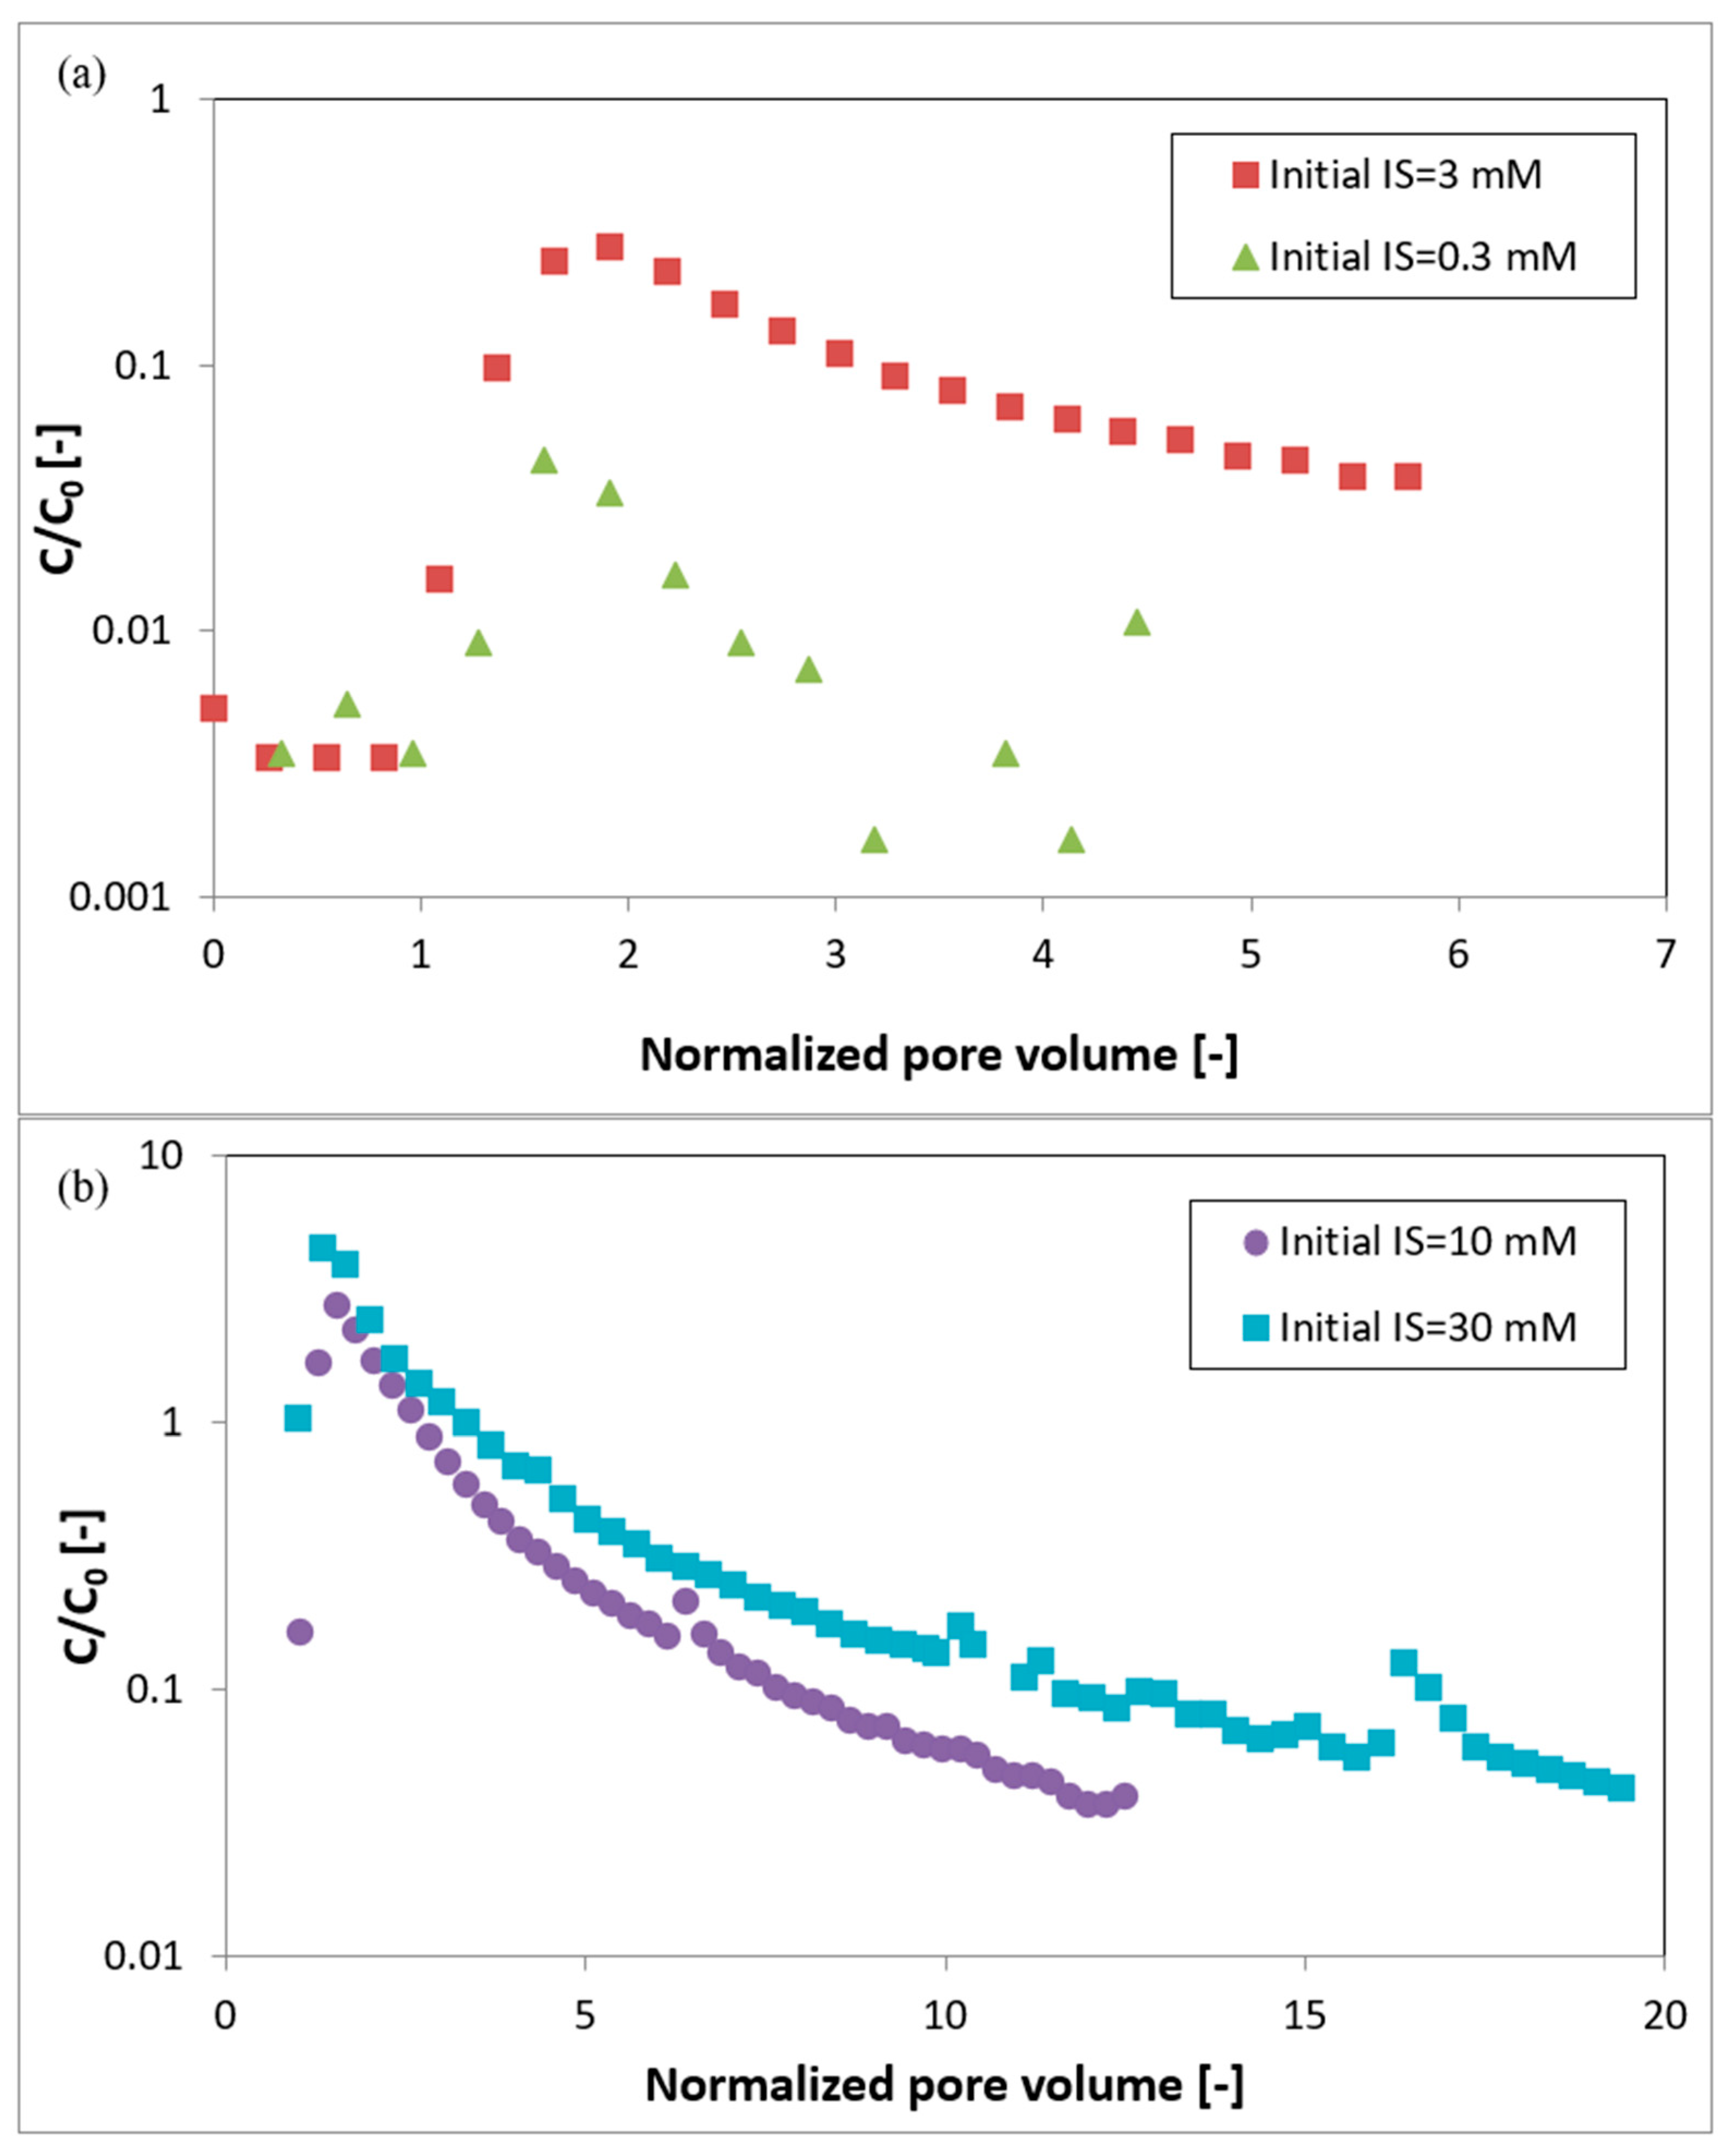
Detachment behavior under unfavorable attachment conditions (pH 8) was investigated by lowering the ionic strength of the solution to essentially zero during elution. Detachment was observed for all initial attachment conditions (Figure 5 Top and Bottom). Detachment mass was proportional to the ionic strength of attachment conditions, that is, the larger the difference between attachment and detachment ionic strength, the higher the mass of particles that detached. For the 10 and 30 mM conditions, detachment mass recovery was calculated to be in excess of the total mass injected into the column, at 135% and 176%, respectively (Figure 5 Bottom). Of course, actual mass recovery cannot exceed 100%; this apparently additional TiO2 in solution in excess of the total input amount is most likely from dispersal of nanoparticle aggregates under the very low ionic strength.

4. Discussion

4.1. DLVO Predictions vs. Measured Data

For all solution chemistries, the largest predicted repulsive barrier was approximately 1.6 nN, with the largest secondary minima of approximately −0.014 nN (Figure 6). Exclusively attractive forces were predicted for pH 4.5 experimental conditions, with longer range attraction at the lower ionic strength (Figure 6 Top). Small repulsive barriers were also predicted at pH 6, due to negative zeta potentials (Table 2) measured for the nanoparticles at this pH value (Figure 6 Top). There were no secondary minima predicted for this pH value. For pH 8 conditions, repulsive barriers were predicted for all ionic strengths (Figure 6 Bottom). Small secondary minima were predicted at IS values of 3 and 30 mM at both pH 6 and 8.
Qualitatively, DLVO theory predicted the behavior at pH 4.5 well (Figure 3 and Figure 6). Adhesive forces were prominent, and the range of influence of those forces increased with decreased IS. The DLVO theory also predicted the EDL repulsive barriers observed at pH 6 for the ionic strengths of 3 and 0.3 mM; qualitatively for 3 mM, and quantitatively for 0.3 mM (predicted value = 0.65 nN, measured value 0.5 ± 0.1 nN (Table 1)). These barriers were potentially caused by the somewhat negative zeta potential measured for these conditions (Table 2). However, in opposition to the theory, the repulsive barrier was larger at the 3 mM IS condition (Table 1). This is most likely due to slight variances in pH; uncertainty due to slight variations in chemistry is inherent to the variability at PZC. If the buffer solution at 0.3 mM was even slightly below pH 6, this would have resulted in lower measured EDL forces.
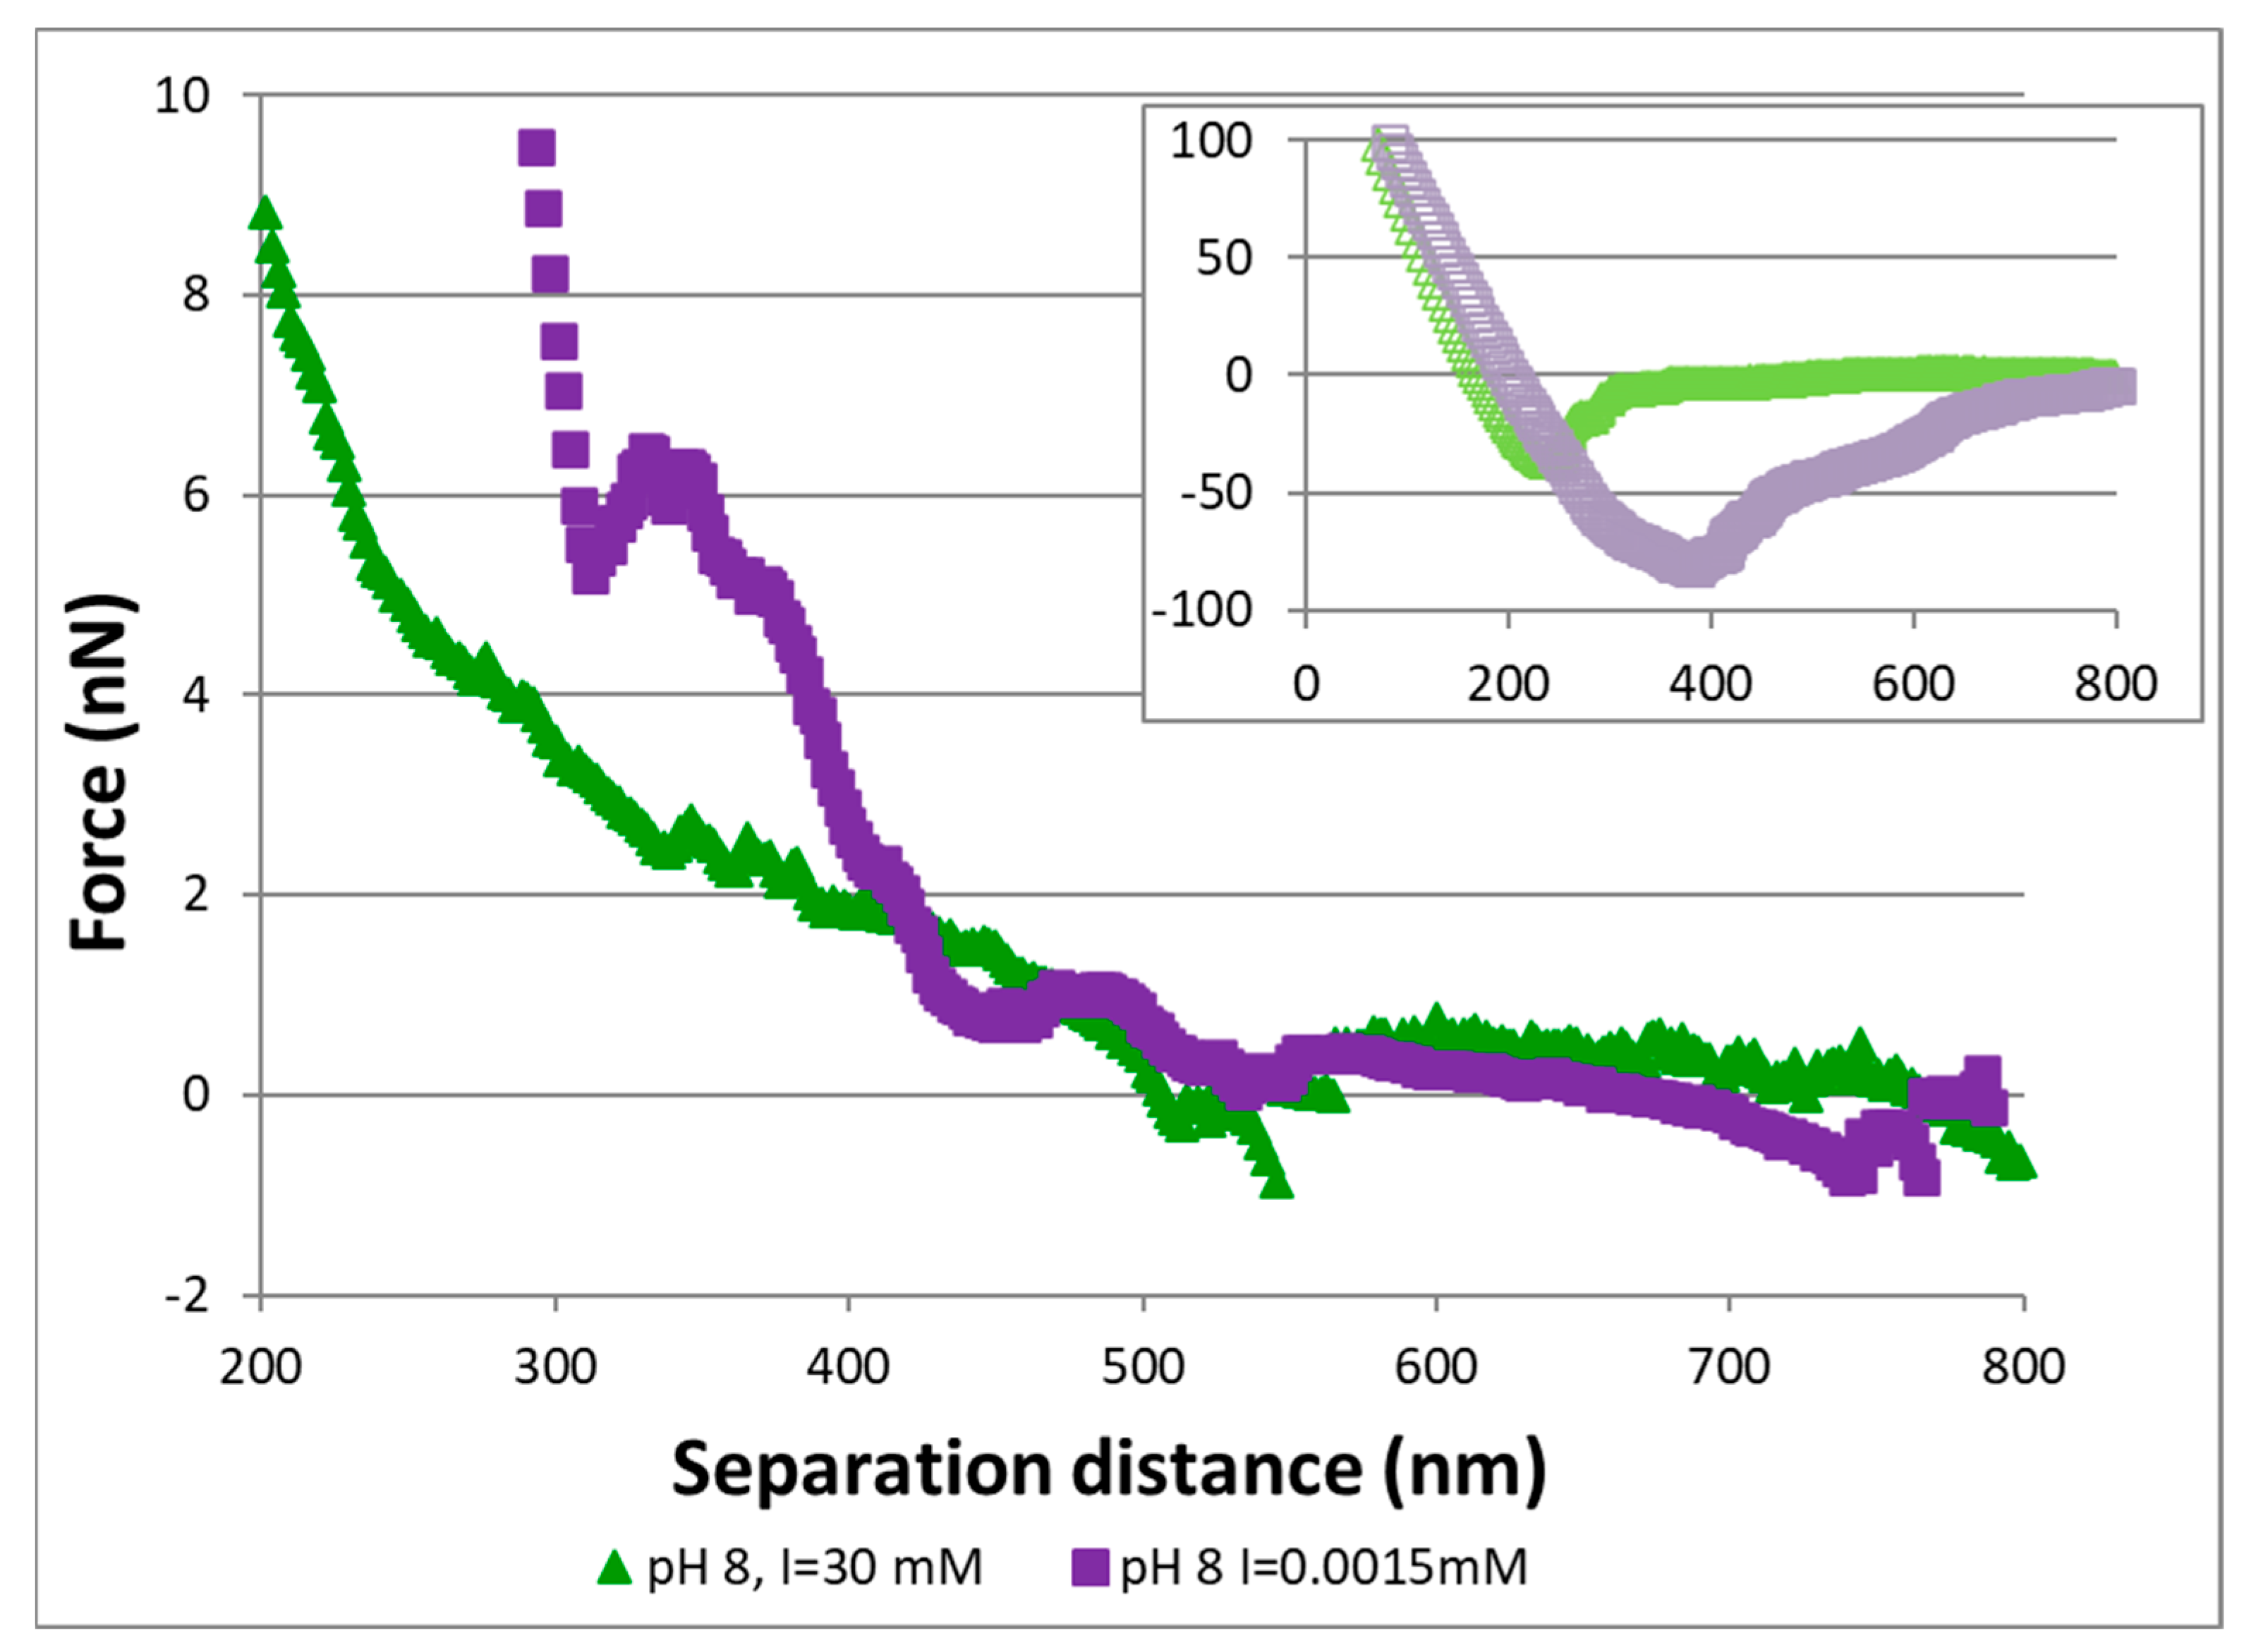
The predictions from DLVO theory were the least representative for pH 8. At pH 8, as with the other pH values, DLVO theory underestimated the magnitudes of both attractive and repulsive forces (Table 1, Figure 3 and Figure 6). However, unlike for the other pHs, DLVO theory predictions did not even qualitatively match the measured data. One issue may stem from the use of vdW forces as the only attractive force in DLVO predictions; if the only attractive forces occurring under the conditions herein were vdW forces, ionic strength would not affect the adhesion force. However, adhesion is clearly influenced by ionic strength, indicating non-DLVO attractive forces are present (Figure 7). Possible explanations could include Coulombic attraction, some change in surface chemistry by the electrolyte, possible complexation with the electrolyte, or conformational change in the nanoparticle aggregates, affecting attachment as the electrolyte concentrations are changed.
Other studies have used extended DLVO (xDLVO) to account for deviances from traditional DLVO theory due to acid–base, steric, or hydrophobic interactions (e.g., Thio et al., 2010 [30]). None of these interactions seem likely for the conditions herein; TiO2 nanoparticles are not known for acid–base chemistry or being hydrophobic, and being without surface protrusions or coatings should not have large steric hindrances. An alternate theory such as Coulombic Attraction Theory (CAT) could potentially account for these non-DLVO interactions observed. CAT allows for long-range attractive forces to be influenced by electrostatic attraction via counter ions due to a lack of shielding of Coulombic attraction (e.g., [40,41]. CAT also could explain the observed secondary minima at low ionic strength, as it accounts for secondary minima through Coulombic attraction rather than vdWs forces.
In addition to CAT interactions, it has also been suggested based on the results of column studies that TiO2 nanoparticle aggregates can undergo conformational changes during transport, both from collisions with porous media grains and other nanoparticles and changes in ionic strength, rendering them “sticky” (e.g., [9]. This type of behavior could explain the ionic strength-influenced adhesive forces measured herein; however, it is unknown if the nanoparticle aggregates attached to the AFM tips are able to undergo conformational changes. Regardless of whether the affixed nanoparticle aggregates are mobile enough to undergo small conformational changes, changes in nanoparticle–nanoparticle interactions would still occur and could account for at least part of the changes in adhesion with ionic strength.

4.2. Implications of AFM Measurements for Transport Behavior

Under favorable attachment conditions (pH 4.5), there are mostly only attractive forces and little to no repulsive forces measured (Table 1, Figure 3). This corresponds well with the large magnitude of retention observed in the transport experiment (Figure 4 Bottom). Only minimal nanoparticle breakthrough occurred under the conditions measured by AFM for an extended time, wherein concentrations remained very low for approximately 300 pore volumes. This is attributed to the favorable attachment sites being plentiful and favorable attachment rates being high. The significant increase in breakthrough observed would only occur once the attachment sites became filled, essentially coating the porous media with nanoparticles, causing nanoparticle–nanoparticle interactions to become more important to retention than nanoparticle–surface interactions.
Breakthrough curves for pH 6 at IS 0.3 and 3 mM, and pH 8 at IS = 0.3 mM appear similar (Figure 4 Top). Therefore, it would be expected that the forces measured would be similar. However, the force profile measurements were different for all three conditions. For pH 8 at IS = 0.3 mM, there was a moderately high repulsive barrier, high adhesion forces, and a secondary minimum, which might account for the observed transport behavior. For pH 6 at IS = 3 mM, there was a lower energy barrier and no secondary minimum. For pH 6 at 0.3 mM, there was only a small repulsive barrier and high attractive forces (Table 1, Figure 3). It would therefore be expected that there would be high attachment observed for this transport experiment, however, this is not the case. One possible explanation is that the solution at 0.3 mM used for the AFM measurements was just under pH 6 and closer to the PZC, and the solutions used for the transport experiments were just over 6, resulting in unfavorable attachment conditions for the transport experiments. This exemplifies the importance of solution chemistry on nanoparticle transport; even minor differences can have large effects.
Detachment of nano- and micro-sized particles from a porous-medium surface due to lowering the solution’s ionic strength from initial attachment conditions has been previously reported (e.g., [14,22,24,27,32,42,43,44] and was observed herein (Figure 7). This type of detachment is often attributed to the loss of a secondary attractive minimum at some midrange ionic strengths. The AFM measurements did show the suspected presence of secondary minima (Table 1) and the influence of ionic strength on their magnitude (Table 2, Figure 3), which is consistent with the transport observations.

5. Conclusions

This study combined AFM measurements of nanoparticle–surface interactions with miscible–displacement transport experiments to investigate retention mechanisms. Surface forces between nanoparticles and porous media surfaces were successfully measured. Forces under favorable attachment conditions (lower pH) were observed to be highly attractive, leading to the high retention observed in the transport experiment. Close to the PZC of TiO2, both attractive and repulsive forces were measured, depending on the ionic strength. For unfavorable attachment conditions, repulsive barriers and secondary minima were observed for all ionic strength conditions. High adhesion forces influenced by ionic strength were also observed.
The magnitudes of attachment measured for the transport experiments were generally consistent with the results of the AFM measurements. In addition, the detachment observed for the highest pH was also consistent with the predictions, indicating the presence of secondary minima. DLVO theory underestimated the magnitudes of the attractive and repulsive forces measured by AFM, but was able to qualitatively represent behavior observed for the lower two pH values. In contrast, it provided poor representation for the highest pH value. The results of this study provide insight into the retention of TiO2 and other nanoparticles during transport in porous media.

Supplementary Materials

The following supporting information can be downloaded at https://www.mdpi.com/article/10.3390/colloids9050072/s1, Figure S1: Optical microscope image of porous media on AFM specimen disk; Figure S2: Scanning Electron Microscope (SEM) images of TiO2 aggregates; Figure S3: Particle size distribution of TiO2 nanoparticle aggregates before entering the column and after exiting the column; Figure S4: SEM of used, nano-modified AFM tip.

Author Contributions

Conceptualization, M.L.B.; methodology, HC and M.L.B.; investigation, H.C.; analysis, H.C. and M.L.B.; writing—original draft, H.C.; writing—review and editing, M.L.B.; funding acquisition, M.L.B.; supervision, M.L.B. All authors have read and agreed to the published version of the manuscript.

Funding

This research was conducted with support provided in part by the National Institute of Environmental Health Sciences Superfund program (P42 ES04940).

Data Availability Statement

The original contributions presented in this study are included in the article/Supplementary Materials. Further inquiries can be directed to the corresponding author.

Acknowledgments

The authors thank the reviewers for their constructive comments.

Conflicts of Interest

The authors declare no conflicts of interest.

References

  1. Tran, T.-K.; Nguyen, M.-K.; Lin, C.; Hoang, T.-D.; Nguyen, T.-C.; Lone, A.M.; Khedulkar, A.P.; Gaballah, M.S.; Singh, J.; Chung, W.J.; et al. Review on fate, transport, toxicity and health risk of nanoparticles in natural ecosystems: Emerging challenges in the modern age and solutions toward a sustainable environment. Sci. Total Environ. 2023, 912, 169331. [Google Scholar] [CrossRef] [PubMed]
  2. Wang, M.; Gao, B.; Tang, D. Review of key factors controlling engineered nanoparticle transport in porous media. J. Hazard. Mater. 2016, 318, 233–246. [Google Scholar] [CrossRef] [PubMed]
  3. Meng, X.; Yang, D. Critical Review of Stabilized Nanoparticle Transport in Porous Media. J. Energy Resour. Technol. 2019, 141, 070801. [Google Scholar] [CrossRef]
  4. Sangani, M.F.; Owens, G.; Fotovat, A. Transport of engineered nanoparticles in soils and aquifers. Environ. Rev. 2019, 27, 43–70. [Google Scholar] [CrossRef]
  5. Yusuf, E.O.; Amber, I.; Officer, S.; Oluyemi, G.F. Transport of nanoparticles in porous media and associated environmental impact: A review. J. Eng. Res. 2024, 12, 275–284. [Google Scholar] [CrossRef]
  6. Piccinno, F.; Gottschalk, F.; Seeger, S.; Nowack, B. Industrial production quantities and uses of ten engi-neered nanomaterials in Europe and the world. J. Nanopart. Res. 2012, 14, 1109. [Google Scholar] [CrossRef]
  7. Robichaud, C.O.; Uyar, A.E.; Darby, M.R.; Zucker, L.G.; Wiesner, M.R. Estimates of upper bounds and trends in nano-TiO2 production as a basis for exposure assessment. Environ. Sci. Technol. 2009, 43, 4227–4233. [Google Scholar] [CrossRef]
  8. Saiers, J.E.; Hornberger, G.M.; Liang, L. First- and second-order kinetics approaches for modeling the transport of colloidal particles in porous media. Water Resour. Res. 1994, 30, 2499–2506. [Google Scholar] [CrossRef]
  9. Dunphy Guzman, K.A.; Finnegan, M.P.; Banfield, J.F. Influence of Surface Potential on Aggregation and Transport of Titania Nanoparticles. Environ. Sci. Technol. 2006, 40, 7688–7693. [Google Scholar] [CrossRef]
  10. Choy, C.C.; Wazne, M.; Meng, X. Application of an empirical transport model to simulate retention of nanocrystalline titanium dioxide in sand columns. Chemosphere 2008, 71, 1794–1801. [Google Scholar] [CrossRef]
  11. Fang, J.; Shan, X.-Q.; Wen, B.; Lin, J.-M.; Owens, G. Stability of titania nanoparticles in soil suspensions and transport in saturated homogeneous soil columns. Environ. Pollut. 2009, 157, 1101–1109. [Google Scholar] [CrossRef]
  12. Chen, G.; Liu, X.; Su, C. Transport and Retention of TiO2 Rutile Nanoparticles in Saturated Porous Media under Low-Ionic-Strength Conditions: Measurements and Mechanisms. Langmuir 2011, 27, 5393–5402. [Google Scholar] [CrossRef] [PubMed]
  13. Chowdhury, I.; Hong, Y.; Honda, R.J.; Walker, S.L. Mechanisms of TiO2 nanoparticle transport in porous media: Role of solution chemistry, nanoparticle concentration, and flowrate. J. Colloid Interface Sci. 2011, 360, 548–555. [Google Scholar] [CrossRef] [PubMed]
  14. Godinez, I.G.; Darnault, C.J. Aggregation and transport of nano-TiO2 in saturated porous media: Effects of pH, surfactants and flow velocity. Water Res. 2011, 45, 839–851. [Google Scholar] [CrossRef] [PubMed]
  15. Cai, L.; Tong, M.; Wang, X.; Kim, H. Influence of Clay Particles on the Transport and Retention of Titanium Dioxide Nanoparticles in Quartz Sand. Environ. Sci. Technol. 2014, 48, 7323–7332. [Google Scholar] [CrossRef]
  16. Cai, L.; Peng, S.; Wu, D.; Tong, M. Effect of different-sized colloids on the transport and deposition of titanium dioxide nanoparticles in quartz sand. Environ. Pollut. 2016, 208, 637–644. [Google Scholar] [CrossRef]
  17. Fisher-Power, L.M.; Cheng, T. Nanoscale Titanium Dioxide (nTiO2) Transport in Natural Sediments: Importance of Soil Organic Matter and Fe/Al Oxyhydroxides. Environ. Sci. Technol. 2018, 52, 2668–2676. [Google Scholar] [CrossRef]
  18. Chrysikopoulos, C.V.; Fountouli, T.V. Cotransport of titanium dioxide nanoparticles and formaldehyde in saturated and unsaturated columns packed with quartz sand. Vadose Zone J. 2022, 22, e20175. [Google Scholar] [CrossRef]
  19. Zhang, R.; Tu, C.; Zhang, H.; Luo, Y. Enhancing effects of dissolved and media surface-bound organic matter on titanium dioxide nanoparticles transport in iron oxide-coated porous media under acidic conditions. J. Hazard. Mater. 2022, 438, 129421. [Google Scholar] [CrossRef]
  20. Elimelech, M. Effect of Particle Size on the Kinetics of Particle Deposition under Attractive Double Layer Interactions. J. Colloid Interface Sci. 1994, 164, 190–199. [Google Scholar] [CrossRef]
  21. Li, X.; Scheibe, T.D.; Johnson, W.P. Apparent Decreases in Colloid Deposition Rate Coefficients with Distance of Transport under Unfavorable Deposition Conditions: A General Phenomenon. Environ. Sci. Technol. 2004, 38, 5616–5625. [Google Scholar] [CrossRef] [PubMed]
  22. Tufenkji, N.; Elimelech, M. Deviation from the classical colloid filtration theory in the pres-ence of repulsive DLVO interactions. Langmuir 2004, 20, 10818–10828. [Google Scholar] [CrossRef] [PubMed]
  23. Bowen, B.D.; Epstein, N. Fine particle deposition in smooth parallel-plate channels. J. Colloid Interface Sci. 1979, 72, 81–97. [Google Scholar] [CrossRef]
  24. Litton, G.M.; Olson, T.M. Particle size effects on colloid deposition kinetics: Evidence of secondary minimum deposition. Colloids Surf. A Physicochem. Eng. Asp. 1996, 107, 273–283. [Google Scholar] [CrossRef]
  25. Grolimund, D.; Elimelech, M.; Borkovec, M. Aggregation and deposition kinetics of mobile colloidal particles in natural porous media. Colloids Surf. A Physicochem. Eng. Asp. 2001, 191, 179–188. [Google Scholar] [CrossRef]
  26. Bradford, S.A.; Torkzaban, S.; Walker, S.L. Coupling of physical and chemical mechanisms of colloid straining in saturated porous media. Water Res. 2007, 41, 3012–3024. [Google Scholar] [CrossRef]
  27. Pelley, A.J.; Tufenkji, N. Effect of particle size and natural organic matter on the migration of nano- and microscale latex particles in saturated porous media. J. Colloid Interface Sci. 2008, 321, 74–83. [Google Scholar] [CrossRef]
  28. Ong, Q.K.; Sokolov, I. Attachment of nanoparticles to the AFM tips for direct measurements of interaction between a single nanoparticle and surfaces. J. Colloid Interface Sci. 2007, 310, 385–390. [Google Scholar] [CrossRef]
  29. Attinti, R.; Wei, J.; Kniel, K.; Sims, J.T.; Jin, Y. Virus’ (MS2, ϕX174, and Aichi) Attachment on Sand Measured by Atomic Force Microscopy and Their Transport through Sand Columns. Environ. Sci. Technol. 2010, 44, 2426–2432. [Google Scholar] [CrossRef]
  30. Thio, B.J.R.; Lee, J.-H.; Meredith, J.C.; Keller, A.A. Measuring the Influence of Solution Chemistry on the Adhesion of Au Nanoparticles to Mica Using Colloid Probe Atomic Force Microscopy. Langmuir 2010, 26, 13995–14003. [Google Scholar] [CrossRef]
  31. Kosmulski, M. The significance of the difference in the point of zero charge between rutile and anatase. Adv. Colloid Interface Sci. 2002, 99, 255–264. [Google Scholar] [CrossRef]
  32. Brusseau, M.; Oleen, J.; Santamaria, J.; Cheng, L.; Orosz-Coghlan, P.; Chetochine, A.; Blanford, W.; Rykwalder, P.; Gerba, C. Transport of microsporidium Encephalitozoon intestinales spores in sandy porous media. Water Res. 2005, 39, 3636–3642. [Google Scholar] [CrossRef] [PubMed]
  33. Santamaría, J.; Brusseau, M.L.; Araujo, J.; Blanford, W.J.; Gerba, C.P.; Orosz-Coghlan, P. Transport and Retention of Cryptosporidium Parvum Oocysts in Sandy Soils. J. Environ. Qual. 2012, 41, 1246–1252. [Google Scholar] [CrossRef] [PubMed]
  34. Derjaguin, B.; Landau, L.D. Theory of the Stability of Strongly Charged Lyophobic Sols and of the Adhesion of Strongly Charged Particles in Solutions of Electrolytes. Acta Phys. Chim. URSS 1941, 14, 633–662. [Google Scholar] [CrossRef]
  35. Verwey, E.J.W.; Overbeek, J.T.G. Theory of the Stability of Lyophobic Colloids: The Inter-Action of Sol Particles Having an Electric Double Layer; Elsevier Publishing Company: Amsterdam, The Netherlands, 1948. [Google Scholar]
  36. Bradford, S.A.; Yates, S.R.; Bettahar, M.; Simunek, J. Physical factors affecting the transport and fate of colloids in saturated porous media. Water Resour. Res. 2002, 38, 63-1–63-12. [Google Scholar] [CrossRef]
  37. Johnson, W.P.; Pazmino, E.; Ma, H. Direct observations of colloid retention in granular media in the presence of energy barriers, and implications for inferred mechanisms from indirect observations. Water Res. 2010, 44, 1158–1169. [Google Scholar] [CrossRef]
  38. Lacoanet, H.F.; Weisner, M.R. Velocity effects on fullerene and oxide nanoparticle deposition in porous media. Environ. Sci. Technol. 2004, 38, 4377–4382. [Google Scholar] [CrossRef]
  39. Lacoanet, H.F.; Bottero, J.Y.; Wiesner, M.R. Laboratory assessment of the mobility of nano-materials in porous media. Environ. Sci. Technol. 2004, 38, 5164–5169. [Google Scholar] [CrossRef]
  40. Sogami, I.; Ise, N. On the electrostatic interaction in macroionic solutions. J. Chem. Phys. 1984, 81, 6320–6332. [Google Scholar] [CrossRef]
  41. McBride, M.B.; Baveye, P. Diffuse Double-Layer Models, Long-Range Forces, and Ordering in Clay Colloids. Soil Sci. Soc. Am. J. 2002, 66, 1207–1217. [Google Scholar] [CrossRef]
  42. McDowell-Boyer, L.M. Chemical mobilization of micron-sized particles in saturated porous media under steady flow conditions. Environ. Sci. Technol. 1992, 26, 586–593. [Google Scholar] [CrossRef]
  43. Hahn, M.W.; O’Melia, C.R. Deposition and Reentrainment of Brownian Particles in Porous Media under Unfavorable Chemical Conditions: Some Concepts and Applications. Environ. Sci. Technol. 2003, 38, 210–220. [Google Scholar] [CrossRef]
  44. Shen, C.; Li, B.; Huang, Y.; Jin, Y. Kinetics of Coupled Primary and Secondary-Minimum Deposition of Colloids under Unfavorable Chemical Conditions. Environ. Sci. Technol. 2007, 41, 6976–6982. [Google Scholar] [CrossRef]
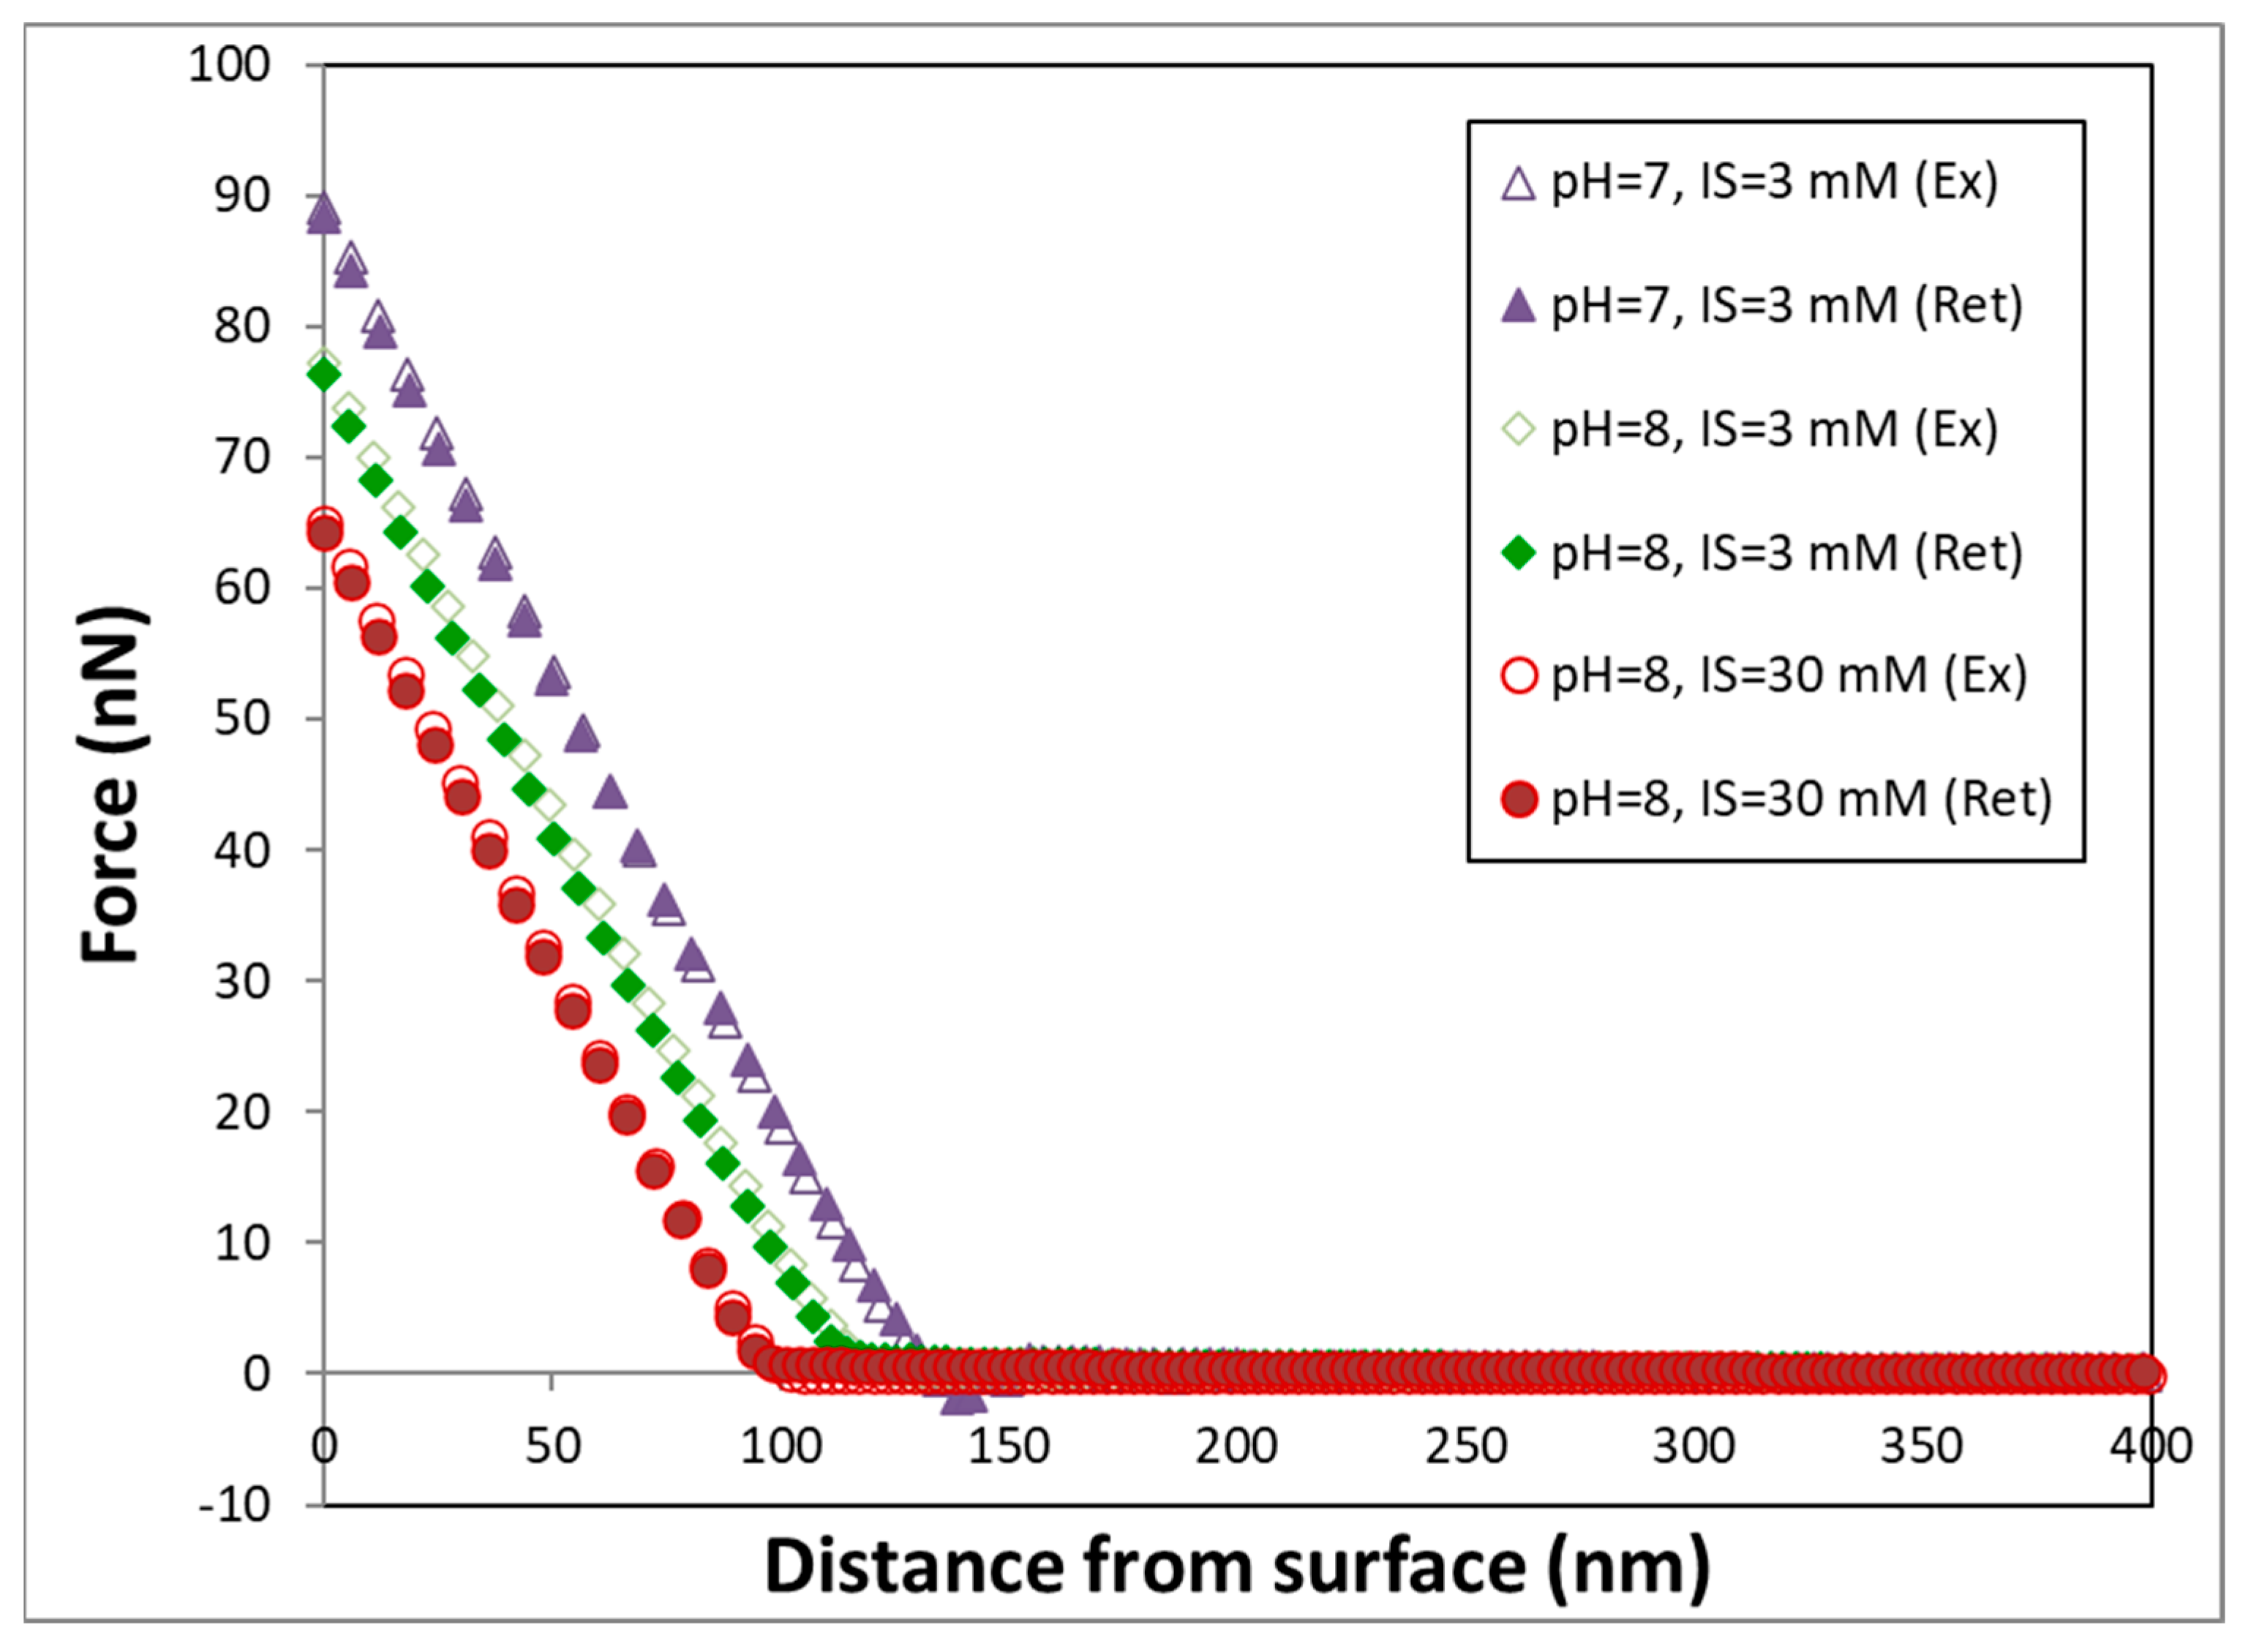
Figure 1. Representative force curves of unmodified tips against porous media surface. “Ex” = extension and “Ret” = retraction.
Colloids 09 00072 g001
Figure 2. Comparison of force curves of unmodified, glue-modified, and nanoparticle-modified tips against porous media surface under identical solution chemistry conditions (pH = 8, IS = 30 mM). Main chart: extension data, and inset: retraction data.
Colloids 09 00072 g002
Figure 3. (a): The measured adhesive force between nanoparticle-modified tips and porous media surface. (b): The “height” (force) of repulsive barriers associated with the surface under the indicated conditions. All points have error bars, although some are too small to be observed at the chart scale. The error bars denote one standard deviation of the variability among the force measurements.
Colloids 09 00072 g003
Figure 4. Breakthrough curves of TiO2 nanoparticles under different solution chemistries. (a): pH 6 and 8, and (b): pH 4.5.
Colloids 09 00072 g004
Figure 5. Detachment of TiO2 nanoparticles by lowering ionic strength to 0.0015 mM after attachment at ionic strength indicated (pH = 8 for all data). (a): low initial ionic strength, and (b): high initial ionic strength. The x-axis represents the elution portion of the breakthrough curve.
Colloids 09 00072 g005
Figure 6. DLVO predictions. (a): Predictions for pH 6 and 4.5. (b): Predictions for pH 8. Inset: Close up of secondary minima predictions.
Colloids 09 00072 g006
Figure 7. Forces measured between TiO2 nanoparticles and porous media surface under conditions of detachment experiments. Main chart: extension. Inset: retraction.
Colloids 09 00072 g007
Table 1. Measured and predicted forces associated with secondary minima depth and repulsive barriers.
MeasuredPredicted
pH
[−]
IS
[mM]
2 Minima
[nN]
Repulsive Barrier
[nN]
2 Minima
[nN]
Repulsive Barrier
[nN]
830−0.912.9−0.0141.2
3−1.2510.5−0.00081.6
0.3−0.121901.0
0.0015−0.8273n/an/a
63000−0.0150.17
309.7−0.00080.64
0.3−0.180.5400.65
4.53004.100
30000
0.30000
Table 2. Zeta potential of nano-TiO2 suspensions (zeta potential of sand estimated from the literature values for all conditions except pH 8, where 0.3, 3, and 30 mM resulted in zeta potentials of −54, −62, and −63 mV, respectively). * Values estimated from literature values for DLVO calculations.
pH
[−]
I
[mM]
Zeta Potential
[mV]
4.50.313*
313
3013*
60.3−40
3−48
30−52*
815−42
15−49
30−54
Disclaimer/Publisher’s Note: The statements, opinions and data contained in all publications are solely those of the individual author(s) and contributor(s) and not of MDPI and/or the editor(s). MDPI and/or the editor(s) disclaim responsibility for any injury to people or property resulting from any ideas, methods, instructions or products referred to in the content.