1. Introduction
Evaporation of complex fluids on solid surfaces is a ubiquitous phenomenon in nature. This phenomenon has been extensively studied by researchers [
1,
2,
3,
4]. Among these, nanofluid evaporation plays a particularly important role. Especially in biomedical and industrial applications, the evaporation-induced self-assembly of nanoparticles is crucial for advancing nanoscience and technology. These self-organized patterns have broad practical significance in fields such as DNA and protein sequencing, as well as nanodevice fabrication. For example, in biomedical engineering, nanoparticle deposition plays a key role in DNA and protein sequencing, as well as in the construction of cellular scaffolds, directly contributing to advances in diagnostics and therapeutic development [
5,
6,
7,
8]. In industrial production, the ability to control and utilize these deposition patterns can significantly improve lithographic precision and enhance the efficiency of nanodevice manufacturing, enabling the more cost-effective production of advanced technologies [
9]. With the continuous progress of nanotechnology, extensive research has been devoted to understanding the behavior of nanoparticles and the resulting deposition morphologies during droplet evaporation. During nanofluid evaporation, dispersed nanoparticles can self-assemble into a variety of complex structures [
10,
11,
12]. By controlling the evaporation conditions of nanofluids, nanoparticles can form different patterns, such as networks [
13,
14], fractal-like structures [
15], branched patterns [
12,
16,
17], and coffee-ring effects [
18].
The kinetic Monte Carlo (KMC) method has undergone continuous development and refinement for simulating the evaporation and deposition processes of nanofluids. This method serves as an effective tool for revealing the complex dynamic behaviors and deposition mechanisms during nanofluid evaporation [
19,
20,
21,
22]. Rabani first proposed a two-dimensional lattice-gas KMC model based on the Ising framework [
23], pioneering the use of KMC simulations to investigate the drying and deposition patterns of nanofluids. The model successfully captured the key features of nanoparticle migration and deposition, establishing a theoretical foundation for subsequent studies. Building on this framework, Rabani and Reichman et al. [
10] combined experiments and numerical simulations to elucidate variations in nanoparticle deposition under different conditions, including the formation of stripe-like, fragmented, and network-like structures. They further refined the two-dimensional KMC model by incorporating system energy fluctuations, enabling a more intuitive description of film evaporation and deposition. Stannard and Martin et al. [
13] investigated self-assembly phenomena in evaporating passivated gold nanoparticle films and analyzed the spatial organization of network patterns. Subsequently, Martin et al. [
24] developed a quasi-three-dimensional KMC model that revealed the formation of multiscale structures—such as networked, ring-like, and dendritic patterns—during film dewetting, showing excellent agreement with experimental observations. To better understand the instabilities arising from contact-line retraction and dendritic pattern formation during film evaporation in open regions, numerous researchers have conducted analytical and numerical studies. Lyushnin et al. [
25] analyzed film thickness variation and dendritic instability using nonlinear equations. Vancea and Thiele et al. [
12] explored the effects of particle concentration, interaction energy, and effective chemical potential through combined experimental and simulation approaches. Frastia et al. [
26] established a kinetic model based on the long-wave approximation to predict irregular deposition and periodic contact-line motion, with experimental validation confirming its reliability. Crivoi and Duan et al. [
15] investigated nanofluid film evaporation in square open domains, predicting dendritic deposit formation and analyzing the roles of particle concentration and diffusivity. Zhang et al. [
27] further refined the two-dimensional kinetic Monte Carlo (KMC) model by introducing a time- and space-dependent linear function to describe the effective chemical potential of the liquid. This modification enabled a more realistic representation of nanoparticle dynamics during droplet evaporation, allowing for the systematic prediction of diverse deposition patterns. Gao et al. [
28] incorporated a dynamic chemical potential coupled with the solvent evaporation rate into a three-dimensional KMC framework, successfully reproducing dual-scale cellular and ring-like nanoparticle structures. Junheng Ren et al. [
29] extended the KMC method from two to three dimensions and successfully simulated the self-assembly of dendritic patterns formed after nanofluid droplet evaporation. Collectively, these studies have deepened the understanding of the complex physical and chemical behaviors involved in nanofluid evaporation and provided theoretical guidance for the design and optimization of nanofluid-based applications.
However, previous studies have primarily focused on thin-film drying and did not consider the spatial variation in liquid thickness within an open square domain. Under open boundary conditions, the edges of the liquid film are directly exposed to the surrounding environment, which better represents the physical boundary conditions encountered in practical nanofluid evaporation. The drying process of a liquid film within a square domain is representative of many real-world applications, such as the fabrication of patterned nanocoatings on microelectronic chips [
30], the controlled deposition of functional nanoparticles on sensor substrates [
31], and thin-film preparation for optical [
32] and biomedical devices [
33]. Investigating this process helps deepen the understanding of evaporation-induced particle transport and deposition mechanisms, providing theoretical support for optimizing nanomaterial fabrication processes. Therefore, in this work, we develop a KMC model in a two-dimensional open square domain to simulate nanofluid evaporation with a spatially varying thickness of the liquid film. By incorporating the effects of nanofluid thickness and curvature, we improved the expression of the chemical potential in the KMC model to better describe the evaporation and self-assembly of nanoparticles. A linear function is assumed to represent the chemical potential with the highest value at the domain center and the lowest at the boundary. The model was used to predict the drying patterns of nanofluids within an open square domain. The shrinking speed of the dewetting front, the effects of the nanoparticle diffusion rate, and the decrease rate of the chemical potential were analyzed.
2. Mathematical Model
In this section, we develop a mathematical model based on the two-dimensional KMC framework, originally introduced by Rabani et al. [
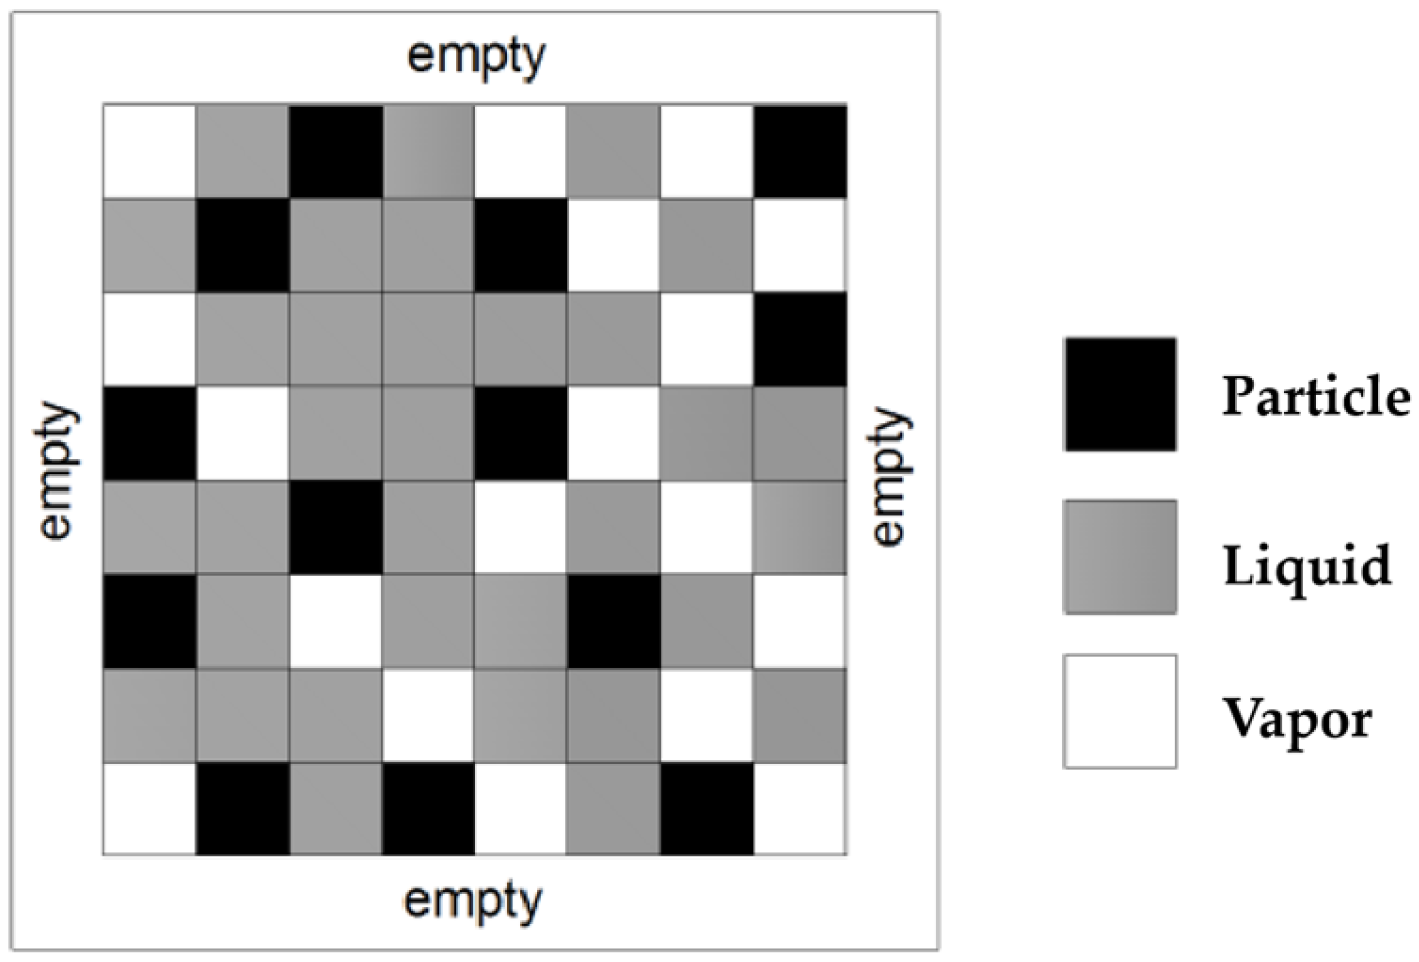
10]. This model describes the self-assembly process of nanoparticles during nanofluid evaporation. A schematic of the model is shown in
Figure 1. First, an empty square domain is initialized based on the lattice size. The domain is then filled with the liquid phase. In the model, the liquid domain is surrounded by vapor cells. In the next step, certain sites are randomly occupied by nanoparticles. The total number of particles depends on the global particle coverage,
, which is defined within the simulation.
In this model, we introduce two corresponding variables
and
, to show the status of each cell: particle cells
, liquid cells
and vapor cells
. In the implementation, the solvent and particle occupy single cells of the lattice. The size of the nanoparticle is not a crucial parameter, which was discussed in the previous studies [
10,
11]. The initial configuration of the simulation consists of a predefined concentration of particles randomly positioned on the lattice, with all other sites occupied by liquid, mimicking a nanoparticle solution. The competing processes of solvent evaporation and nanoparticle diffusion are then considered sequentially. After the initial configuration, the simulation proceeds through a loop of repeated Monte Carlo steps. The total number of Monte Carlo Steps (MCS) is predefined at the beginning of the simulation. First, each solvent cell is examined in the checkerboard pattern, and an attempt is made to convert the solvent phase from liquid to vapor (
) or from vapor to liquid (
), with a Metropolis acceptance probability,
, given by [
10]:
where
is the system temperature;
is the Boltzmann constant; and
is the change in energy associated with such a process.
After each solvent cell has been examined,
attempts are made to move each nanoparticle by one lattice spacing in a random direction, again using the probability,
. Particles may only move into the wet region of the lattice, specifically into a direction currently occupied by an adjacent liquid cell. This imitates the low mobility of nanoparticles on a substrate in the absence of solvent [
34]. If a nanoparticle moves, the displaced liquid cell is placed in the nanoparticle’s wake to preserve solvent density. The value of
controls the rate of nanoparticle diffusion relative to the solvent evaporation rate. Therefore, one Monte Carlo Step (MCS) is defined as a complete sweep to update all solvent cells, followed by
attempts to move each nanoparticle.
The Hamiltonian used in our simulations [
12] to calculate the
, and the Hamiltonian is as follows:
where
, a function of time
and position
, is the effective chemical potential of the solvent;
,
, and
are the interaction energies for adjacent sites (
i,
j) filled by (nanoparticle, nanoparticle), (nanoparticle, liquid) and (liquid, liquid), respectively, and
j is the index of the lattice cells adjacent to the
ith cell; and
t is the MCS number. In this model, we must note that the values of the interaction energies [
10,
14,
35] and the chemical potential are nondimensionalized by the
factor. The sums,
are taken for all pairs of the nearest and next-nearest cells. For the next-nearest cells, the interaction coefficients are weighted by a distance factor [
13],
.
For the KMC model, the effective chemical potential
controls the evaporation and condensation of the liquid [
12]. We know that
is the driving force for the motion of a dewetting or wetting front. The effective chemical potential was assumed to be a constant in the previous models [
10,
12,
13] to explore the drying of thin films. Taking into account the changing thickness profile of the drying nanofluid film, the effective chemical potential value is assumed to depend on the cell position and time in our model. The domain is a square, so we employ a dimensionless relative distance,
(
), to express the locations of cells. We assume that the effective chemical potential has the same value at the same distance (
r) at the same time:
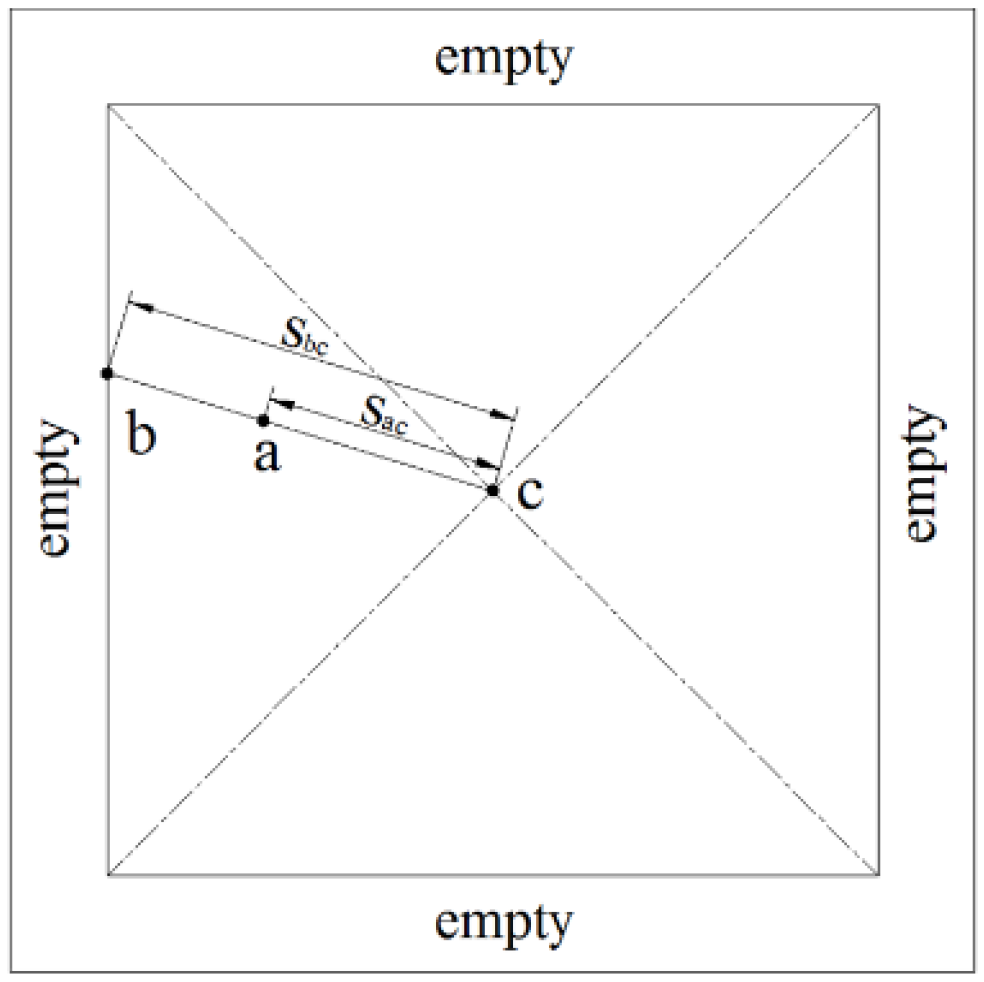
In
Figure 2, the relative distance
is defined as the ratio of the distance from the center to the cell (
) to the distance from the center to the boundary passing through the same cell (
). Therefore, the relative distance can be expressed as follows:
where
r is the relative distance;
is the distance between the center of the simulation domain and the cell of the liquid; and
is the distance between the center and the boundary of the domain.
In the 2D lattice-gas model, when the nanofluid contains no particles, the equilibrium chemical potential is –2.0, and less than –2.0 in the presence of the suspended particles [
12]. In our simulations, it is convenient to initialize the value of the chemical potential function on the three-phase line at zero time moment,
, and hence
is the initial boundary value. The effective chemical potential in the center of the simulation domain (
) is initially higher than that in the boundary, i.e.,
, because the thickness in the center is greater than that in the boundary.
Note that the effective chemical potential term is influenced by both the curvature-dependent Laplace pressure [
26] and the thickness-dependent disjoining pressure [
14]. The Laplace pressure term depends on the curvature of the liquid layer, while the disjoining pressure term depends on the layer thickness itself [
26]. Therefore, based on the layer thickness and the curvature of the simulation domain, we assume that the chemical potential varies with the relative radius of the domain. As mentioned previously, the chemical potential is highest at the domain center and lowest at the boundary. For simplicity, we approximate the chemical potential as a linear function in this study, with the highest value at the domain center and the lowest at the boundary:
where
. The initial boundary chemical potential,
, and the initial value at the simulation domain center,
. So, we can know that
.
During the drying of the nanofluid film, the contact line of
shrinks with the evaporation of the fluid. In the study of slow evaporation to mimic the natural drying process of the nanofluids, the effective chemical potential will decrease with the evaporation of the fluid. So, we assumed a decrease rate,
, to control the decrease in the effective chemical potential of the liquid. Finally, we can obtain the function of the effective chemical potential as follows.
where
is a nondimensional parameter. It can be controlled to change the evaporation rate in the simulation, which will be discussed in the following content.
3. Results
In this section, we present the results of the simulations. In the simulation, the size of the square domain is
cells [
36]. The purpose of this Monte Carlo simulation is to demonstrate the main trends in branched structure formation and to investigate the influence of various parameters.
First, we investigate the drying process of the nanofluid within the square domain. The first simulation is conducted with the following parameter settings:
,
,
,
,
,
,
. The result of the simulations is obtained, as shown in
Figure 3. The sequence of images illustrates the progression of nanofluid drying within a square domain. The simulation begins with a uniform distribution of particles within the square domain. In this diagram, we observe that the drying process proceeds with the receding contact line. The particles attract one another and deposit into finger-like structures toward the center of the domain.
In the result, we can see that there are no vapor holes and separate dot-like islands as predicted by Ref. [
10]. This is because, in these simulations, the value of
was reduced to
compared with that used by Vancea et al. [
12], in order to mitigate particle aggregation and promote the movement of nanoparticles driven by the receding three-phase contact line. On the other hand, it is because this model takes into account the changing thickness profile of the drying nanofluid film.
In
Figure 3, we observe that the shrinking speeds of the dewetting front vary at different time intervals. We calculated the average shrinking speed over the first 1000 MCS time interval.
Figure 4 shows the average speed of the dewetting front at different time points. From this figure, we observe that the average speed generally declines continuously as the nanofluid dries. However, a slight increase in speed is observed between 4000 and 5000 MCS. This can be explained by observing the concentration of nanoparticles near the dewetting front. At the early stages of evaporation, boundary particles move with the front and accumulate near the contact line. The concentration of particles near the dewetting front increases, reducing the probability of a phase change from liquid to vapor. As a result, the speed of the shrinking dewetting front decreases as the nanofluid dries, and the particles aggregate into branched structures. When evaporation reaches a certain point (between 4000 and 5000 MCS) and the dewetting front passes over the branched structures, the concentration of particles near the dewetting front decreases. As a result, the speed of the dewetting front increases during this period.
In previous studies, we found that the diffusion rate (
) of nanoparticles is a critical parameter for the Kinetic Monte Carlo (KMC) model [
1]. Therefore, in this section, a further analysis of the effect of the diffusion rate is presented.
Figure 5 illustrates a comparison of simulation results for different nanoparticle diffusion rates. The parameter values are also shown in
Figure 5.
In the comparison of different nanoparticle diffusion rates, we observe that the number of finger-like structures decreases as the diffusion rate (
) increases. We also note that a higher diffusion rate leads to the formation of burlier branch structures, as shown in
Figure 5f. In contrast, lower diffusion rates result in the formation of slender, multi-branched structures, as indicated in
Figure 5a. This can be explained by the fact that when the diffusion rate is high, particle mobility is sufficient to keep up with the moving dewetting front. As a result, more evenly distributed nanoparticles tend to move along the front rather than aggregate into branched structures and remain behind. Conversely, when the diffusion rate is low, the opposite occurs.
Additionally,
Figure 6 shows the dependence of the number of fingers on the particle diffusion rate, with the relative distance (
r) set to 0.6. From this figure, we clearly observe the quantitative relationship between the number of fingers and the particle diffusion rate. In conjunction with
Figure 5 and
Figure 6, we observe that when the diffusion rate is sufficiently high, the number of fingers tends to approach 4.
The effective chemical potential is a very critical parameter for the 2-D KMC model. In this model, we used the decrease rate,
, to control the decrease in the chemical potential during the drying of the fluid. Here, we investigate the effect of the decrease in the rate of the chemical potential on the formation of drying patterns.
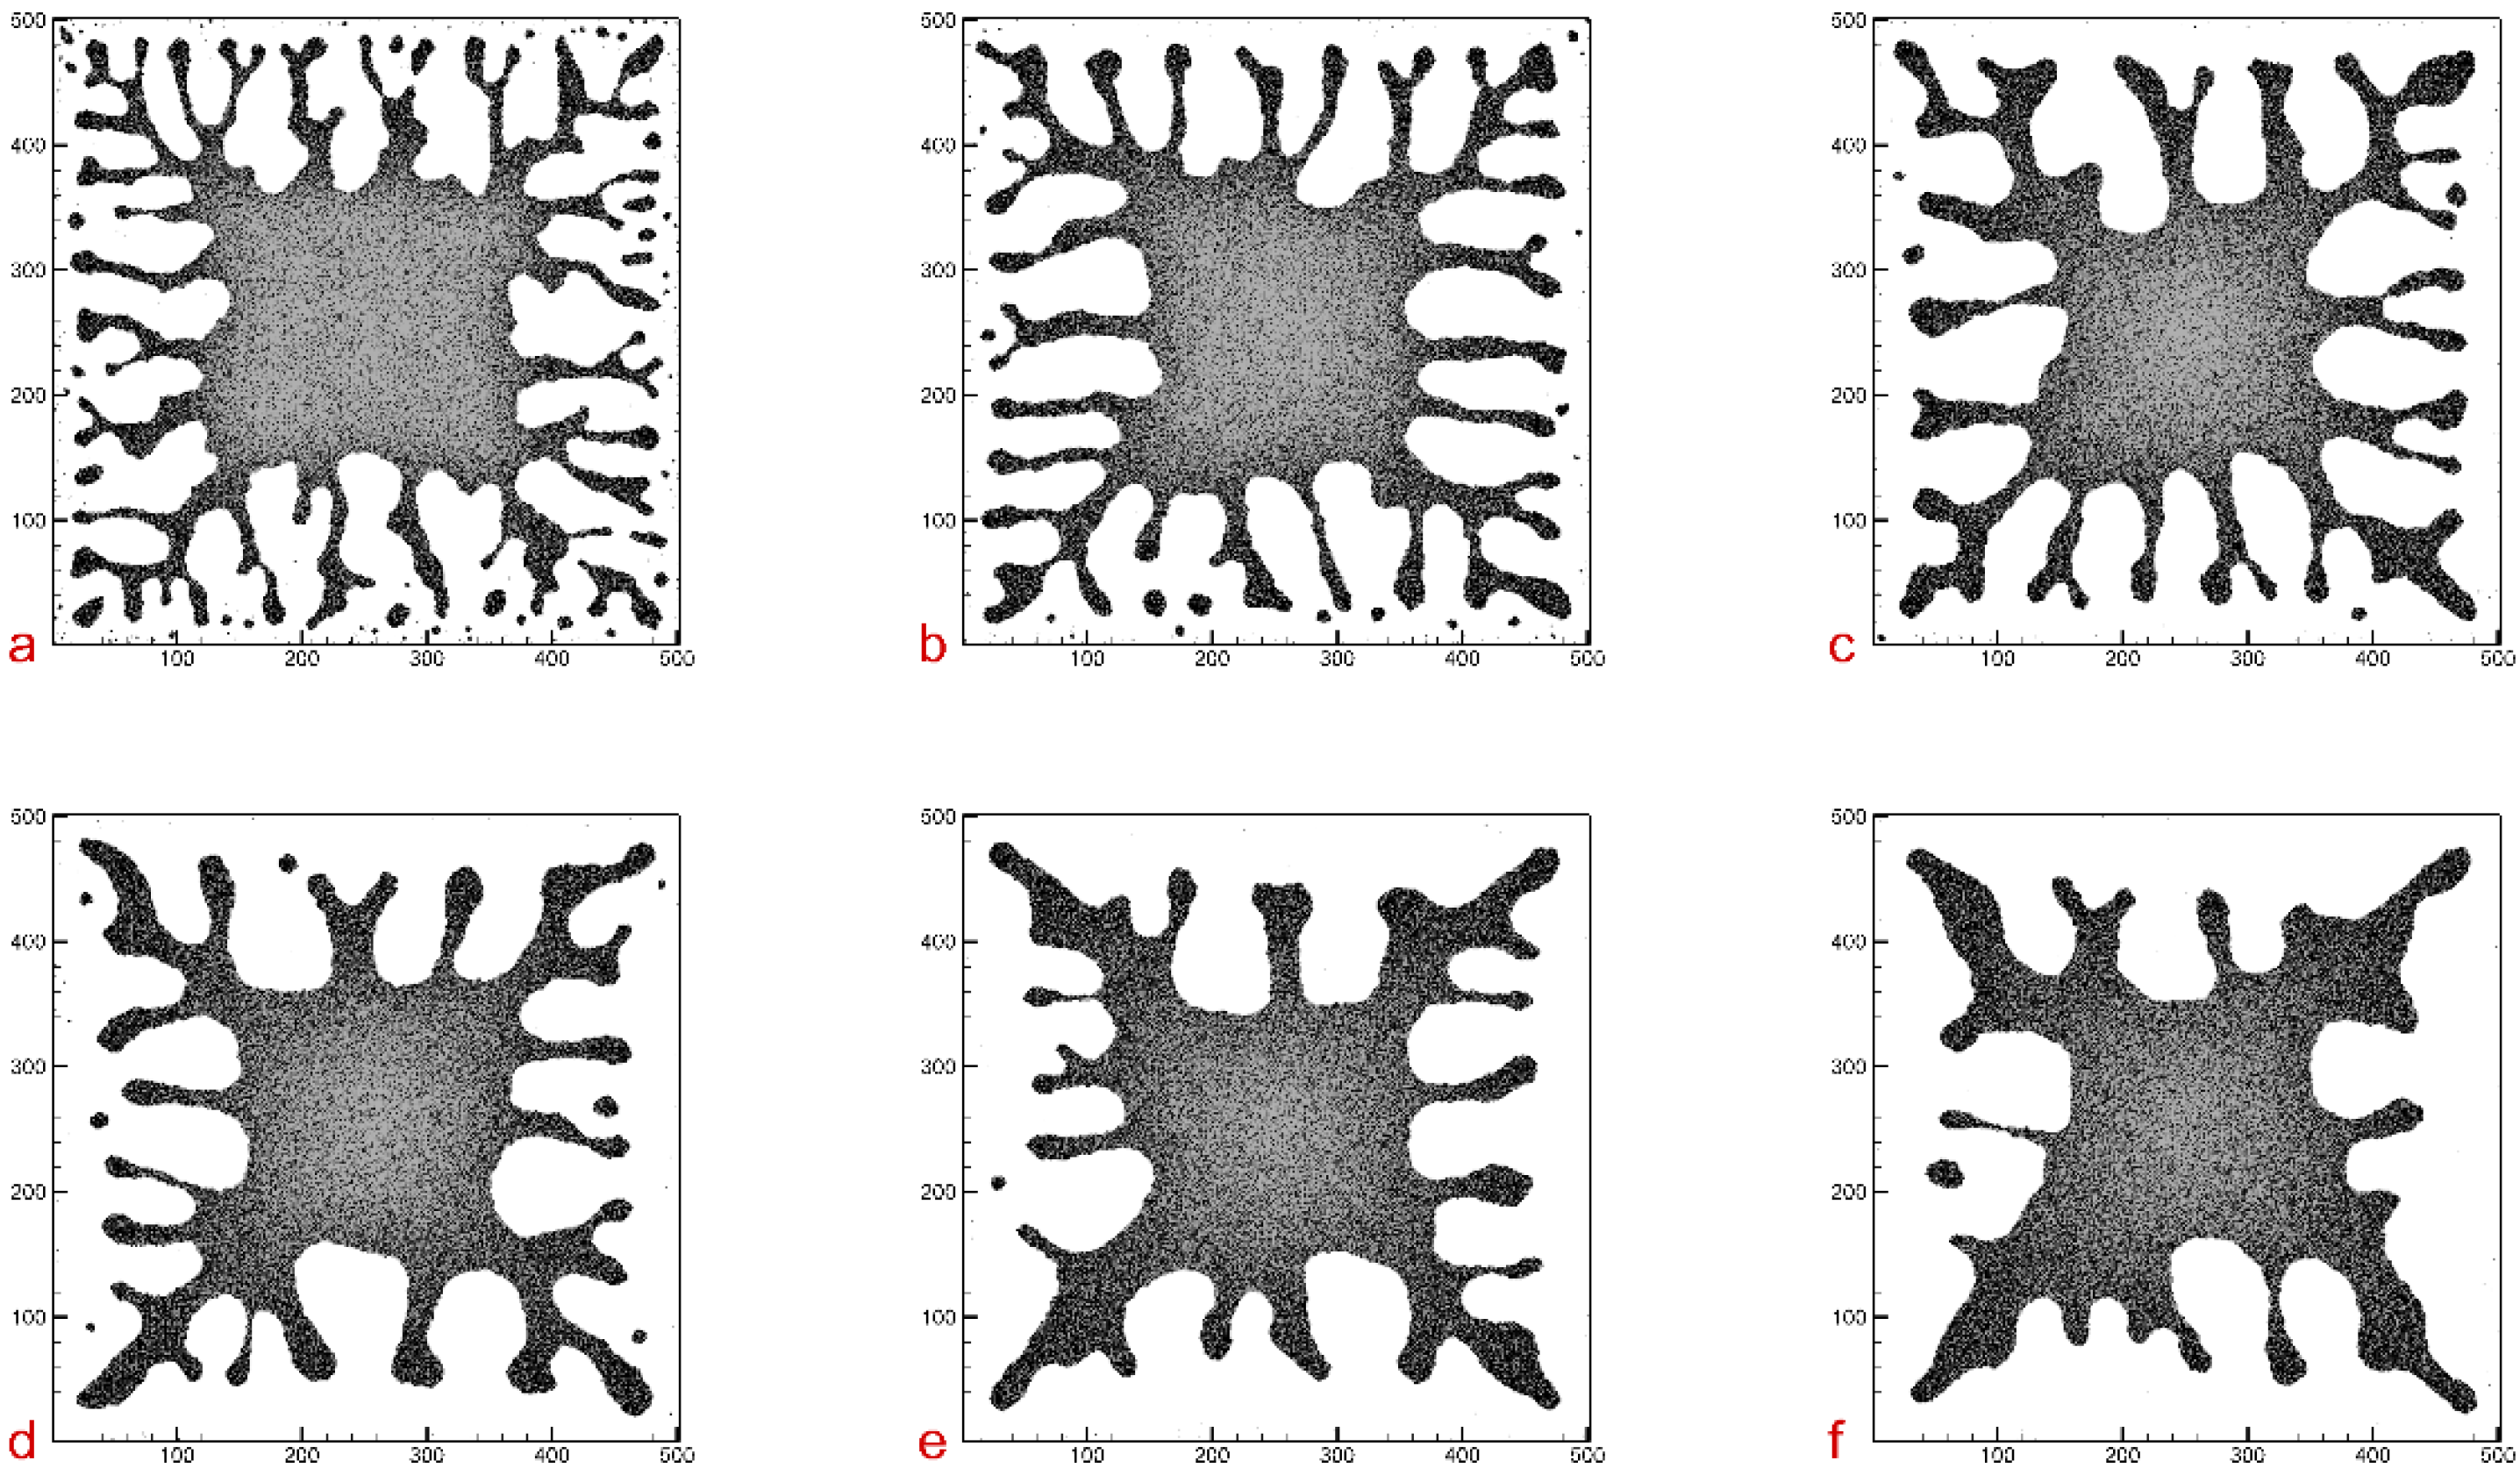
Figure 7 demonstrates the particle self-assembly patterns with different decrease rates of the chemical potential,
(
,
,
,
,
,
) at the time moment (after 2000 MCS). In the comparison among
Figure 7a–f, we can see that the drying rate of the nanofluid is not the same.
Figure 7a shows a low decrease rate of the chemical potential (
) corresponds to the position of the drying front far away from the domain center, whereas a high decrease rate (
) results in a fast contact line motion during the evaporation (see
Figure 7f). This is because the chemical potential is the driving force for the motion of a dewetting or wetting front. From Equation (6) we can see that with the increase in the decrease rate of chemical potential, the chemical potential decreases, thus the speed of the dewetting front will be increased.
In
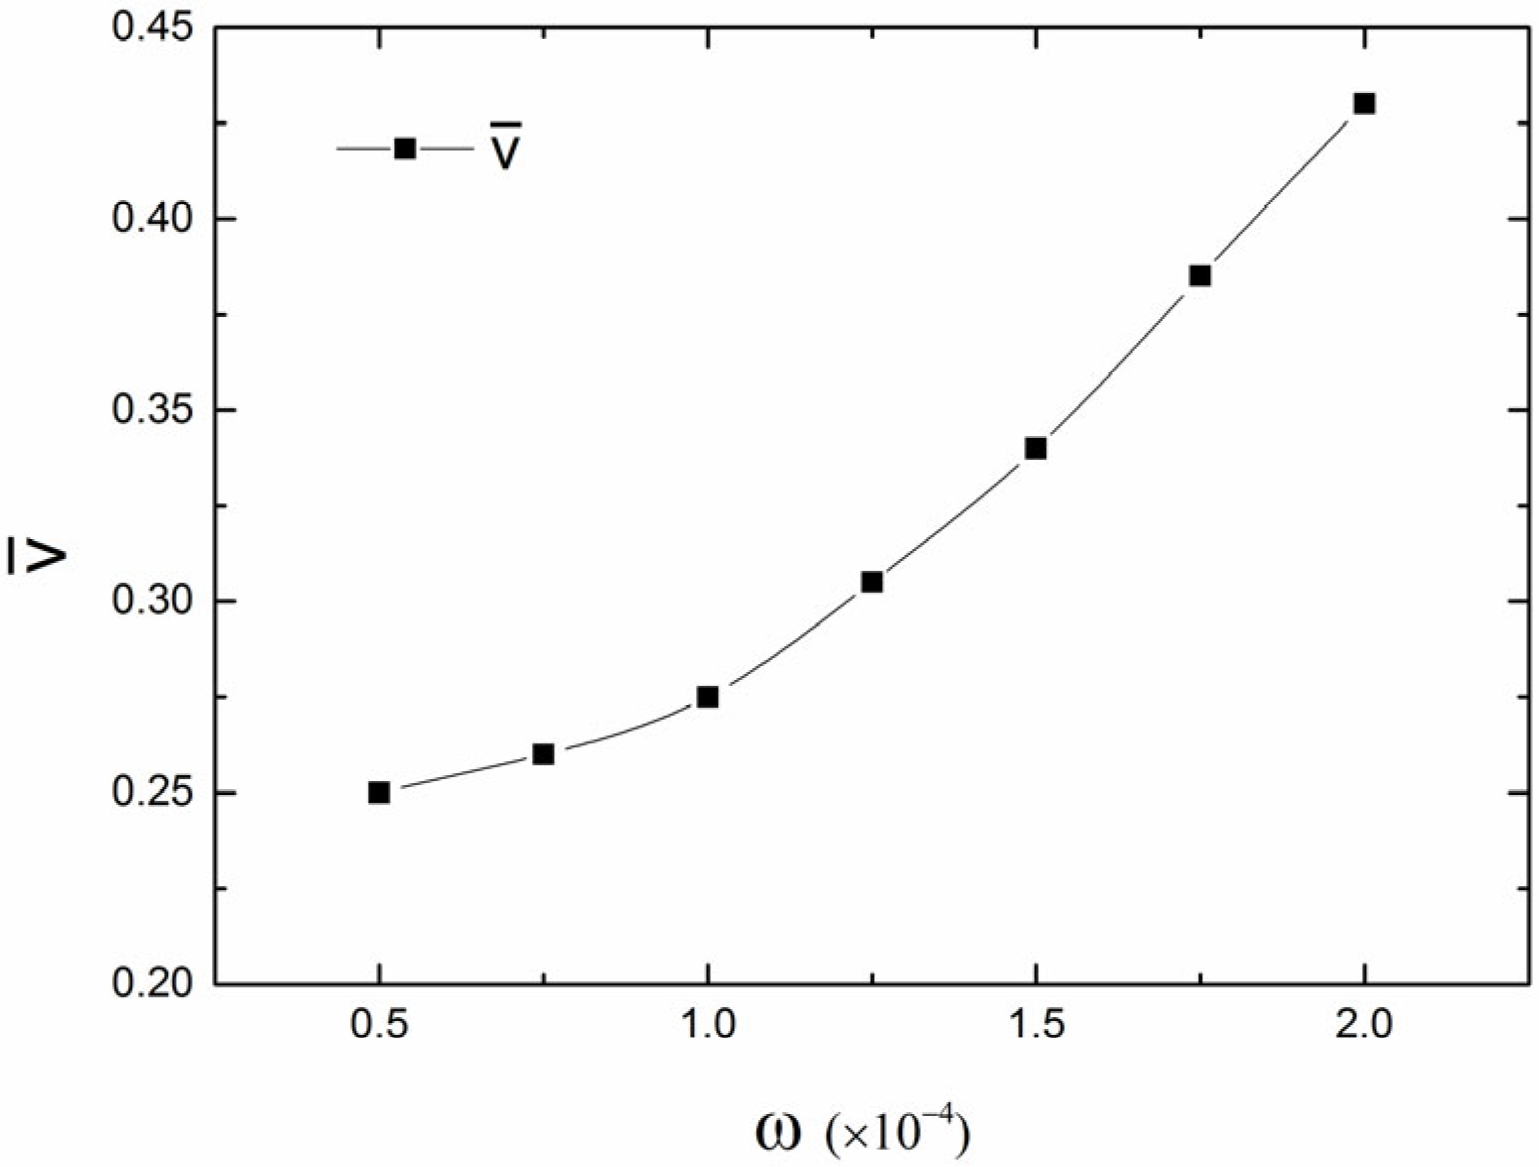
Figure 8, we present a quantitative analysis of the effect of the chemical potential decrease rate (
) on the shrinking speed of the dewetting front during nanofluid drying. As shown in
Figure 8, it clearly shows that the average front speed increases approximately exponentially with increasing values of
. Additionally,
Figure 7 demonstrates that the number of finger-like structures increases with the increase in the decrease rate (
) of the chemical potential. This is because the number of fingers formed at the drying front is influenced by the motion velocity of the contact line. When the decrease rate (
) of the chemical potential increases, the speed of the dewetting front also increases. As a result, more nanoparticles tend to aggregate into branched structures and remain behind rather than move on with the dewetting front line, which results in more finger-like structures.


