Article

Synthesis and Application of Albumin Nanoparticles Loaded with Prussian Blue Nanozymes

1
Faculty of Biology, Perm State University, 614068 Perm, Russia
2
Institute of Ecology and Genetics of Microorganisms, 614081 Perm, Russia
3
Institute of Technical Chemistry, 614013 Perm, Russia
*
Author to whom correspondence should be addressed.
Colloids Interfaces 2022, 6(2), 29; https://doi.org/10.3390/colloids6020029
Submission received: 9 April 2022 / Revised: 27 April 2022 / Accepted: 5 May 2022 / Published: 8 May 2022

Abstract

:
Prussian blue nanozymes exhibit peroxidase-like catalytic activity and are therefore considered a stable and inexpensive alternative to natural peroxidases in the enzyme-linked immunosorbent assay (ELISA). In this work, we propose a robust method of Prussian blue nanozyme functionalization, which relies on the entrapment of nanozymes into albumin nanoparticles. The principle of the method is the addition of ethanol to a solution that contains albumin and nanozymes. At a high ethanol concentration solubility of albumin decreases, resulting in the formation of albumin nanoparticles loaded with nanozymes. The hydrodynamic diameter of nanoparticles was between 120 and 230 nm and depended on the nanozyme-to-BSA ratio. Encapsulation efficiency of nanozymes reached 96–99% and up to 190 μg of nanozymes were loaded per 1 mg of nanoparticles. Nanoparticles were stable at pH 5.5–7.5 and upon long-term storage in deionized water. Excellent reproducibility of the synthesis procedure was confirmed by the preparation of three individual batches of Prussian-blue-loaded BSA nanoparticles with almost identical properties. Nanoparticles were functionalized with monoclonal antibodies using glutaraldehyde cross-linking. The resulting conjugates were applied as labels in an ELISA-like assay of tumor marker prostate-specific antigen (PSA). The lower limit of detection was below 1 ng/mL, which enables measurement of PSA in the range of clinically relevant concentrations.

1. Introduction

Nanozymes are nanomaterials exhibiting enzyme-like catalytic activity. The most attractive features of nanozymes are better physical-chemical stability, recyclability, and almost unlimited tunability of catalytic properties [1]. Nowadays, nanozymes are studied as alternatives to natural counterparts in various fields of biomedicine, including therapy [2] and diagnostics [3]. The development of immunoassays is a promising area of nanozyme application. In modern immunoassays, enzymes such as horseradish peroxidase generate a color signal by converting a colorless substrate to a colored product. This principle underlies the enzyme-linked immunosorbent assay (ELISA), one of the most popular types of clinical immunoassays. Nanozymes exhibiting peroxidase-like activity, such as Prussian blue nanoparticles, are considered more stable and cheap substitutes for the natural peroxidase in ELISA [4].
Prussian blue is a blue pigment with a chemical formula varying from AFeIII[FeII(CN)6]·xH2O (where A is K, Na, or NH4) to FeIII4[FeII(CN)6]3·xH2O [5]. Prussian blue nanoparticles exhibit peroxidase-like activity and have been utilized as catalytic labels in ELISA-like immunoassays [6] and rapid lateral-flow tests [7,8]. The application of nanozymes as diagnostic reagents requires them to be functionalized with molecules (e.g., monoclonal antibodies), which provide biospecific recognition of the analyte. Moreover, nanozyme preparations should have good colloidal stability in physiological conditions (neutral pH, relatively high concentration of salts) and stability under long-term storage conditions. To date, multiple approaches to the functionalization of Prussian blue nanozymes have been developed, including coating with low-molecular-weight stabilizers [9], artificial polymers, proteins, and so on [10]. Attachment of recognition molecules is mediated via both covalent and non-covalent interactions.
In the present work, we propose a straightforward method of Prussian blue nanozyme functionalization, which is based on albumin desolvation. The desolvation method relies on the addition of poor solvent (e.g., alcohol) to the albumin solution [11]. A decrease in protein solubility initiates the formation of monodisperse and stable albumin nanoparticles. In pharmaceutics, this method is extensively applied for the encapsulation of drugs and polymers into albumin nanoparticles. Recently, several research groups have reported successful desolvation-assisted preparation of protein-coated nanozymes including gold [12], iron [13,14], and cerium nanoparticles [15]. The desolvation method has not been reported for encapsulation of Prussian blue nanozymes. Prussian blue is prone to hydrolysis at alkaline pH [16], which is commonly used for albumin desolvation [17], therefore synthesis conditions need to be optimized.
From the real-world perspective, the functionalization process should be simple, reproducible, and include as few stages as possible [18]. Advantages of the desolvation technique are relatively cheap and widely available raw materials, a tunable procedure, multiple cross-linking options, straightforward purification, and potential scalability [19,20,21]. The resulting nanoparticles are supposed to contain multiple nanozymes coated with cross-linked albumin molecules providing colloidal stability at physiological pH and functional groups for the attachment of recognition molecules. The size of nanoparticles synthesized by desolvation methods can be controlled by varying synthesis conditions [22].
Herein, we synthesized albumin nanoparticles loaded with various amounts of Prussian blue nanozymes. Properties of the nanoparticles including size, zeta potential, and colloidal stability were characterized. Nanoparticles were functionalized with monoclonal antibodies against tumor marker prostate-specific antigen (PSA) and used as labels in an ELISA-like assay of PSA.

2. Materials and Methods

2.1. Reagents and Instrumentation

Bovine serum albumin (BSA) was from VWR (USA). Iron (III) chloride hexahydrate, imidazole, TRIS and 3,3′,5,5′-tetramethylbenzidine dihydrochloride (TMB) were from AppliChem (Illinois, IL, USA); potassium hexacyanoferrate (II) trihydrate, propionic acid, butyric acid, formic acid, and casein, were from Sigma-Aldrich (Saint Louis, MO, USA). Tween-20, glutaraldehyde, citric acid, oxalic acid, glycine, sodium phosphate, sodium bicarbonate, HEPES, and glycerol were from ITW (Glenview, IL, USA). Potassium hydroxide, isopropyl alcohol, sodium hydroxide, sulfuric acid, acetic acid, and hydrochloric acid were from Reakhim, (Moscow, Russia). Streptavidin was from ProspecBio, (Rehovot, Israel). Prostate-specific antigen (PSA) and anti-PSA monoclonal antibodies (MAbs, clones 3A6 and 1A6) were obtained from HyTest, (Turku, Finland). The 96-well polystyrene plates (maxi binding) were from SPL Life Sciences, (Pocheon, Korea). Dialysis tubing (cellulose membrane; 10,000 MWCO) was from Thermo Scientific (Waltham, MA, USA).
Instrumentation. The Stat Fax 2600 microplate washer was from Awareness Technology (Palm City, FL, USA). The Multiskan Sky UV-Vis Reader was from Thermo Scientific (Waltham, MA, USA). The ZetaSizer NanoZS particle analyzer was from Malvern, Malvern, UK. The Peristaltic pump P-1 was from Pharmacia, (Uppsala, Sweden). The VCX-130 ultrasonic processor was from Sonics & Materials (Newtown, CT, USA).

2.2. Synthesis of Prussian Blue Nanozymes

We prepared 100 mL solutions of 50 mM FeCl3 and 50 mM K4[Fe(CN)6]. Each solution was heated to +55 °C. The solutions were mixed by pouring K4[Fe(CN)6] into FeCl3 under stirring at 700 rpm on a magnetic stirrer. After mixing, the temperature was maintained at +55 °C for 10 min. Then, the solution was left to cool to room temperature. Isopropyl alcohol was added to the final concentrations of 30% (v/v). Centrifugation at 4000× g for 10 min was performed. The supernatant was removed and nanozymes were resuspended in water. The suspension (approximately 40 mL) was extensively dialyzed against water and sonicated for 20 min on ice (probe diameter—6 mm, amplification—60%, output power—18–25 W).

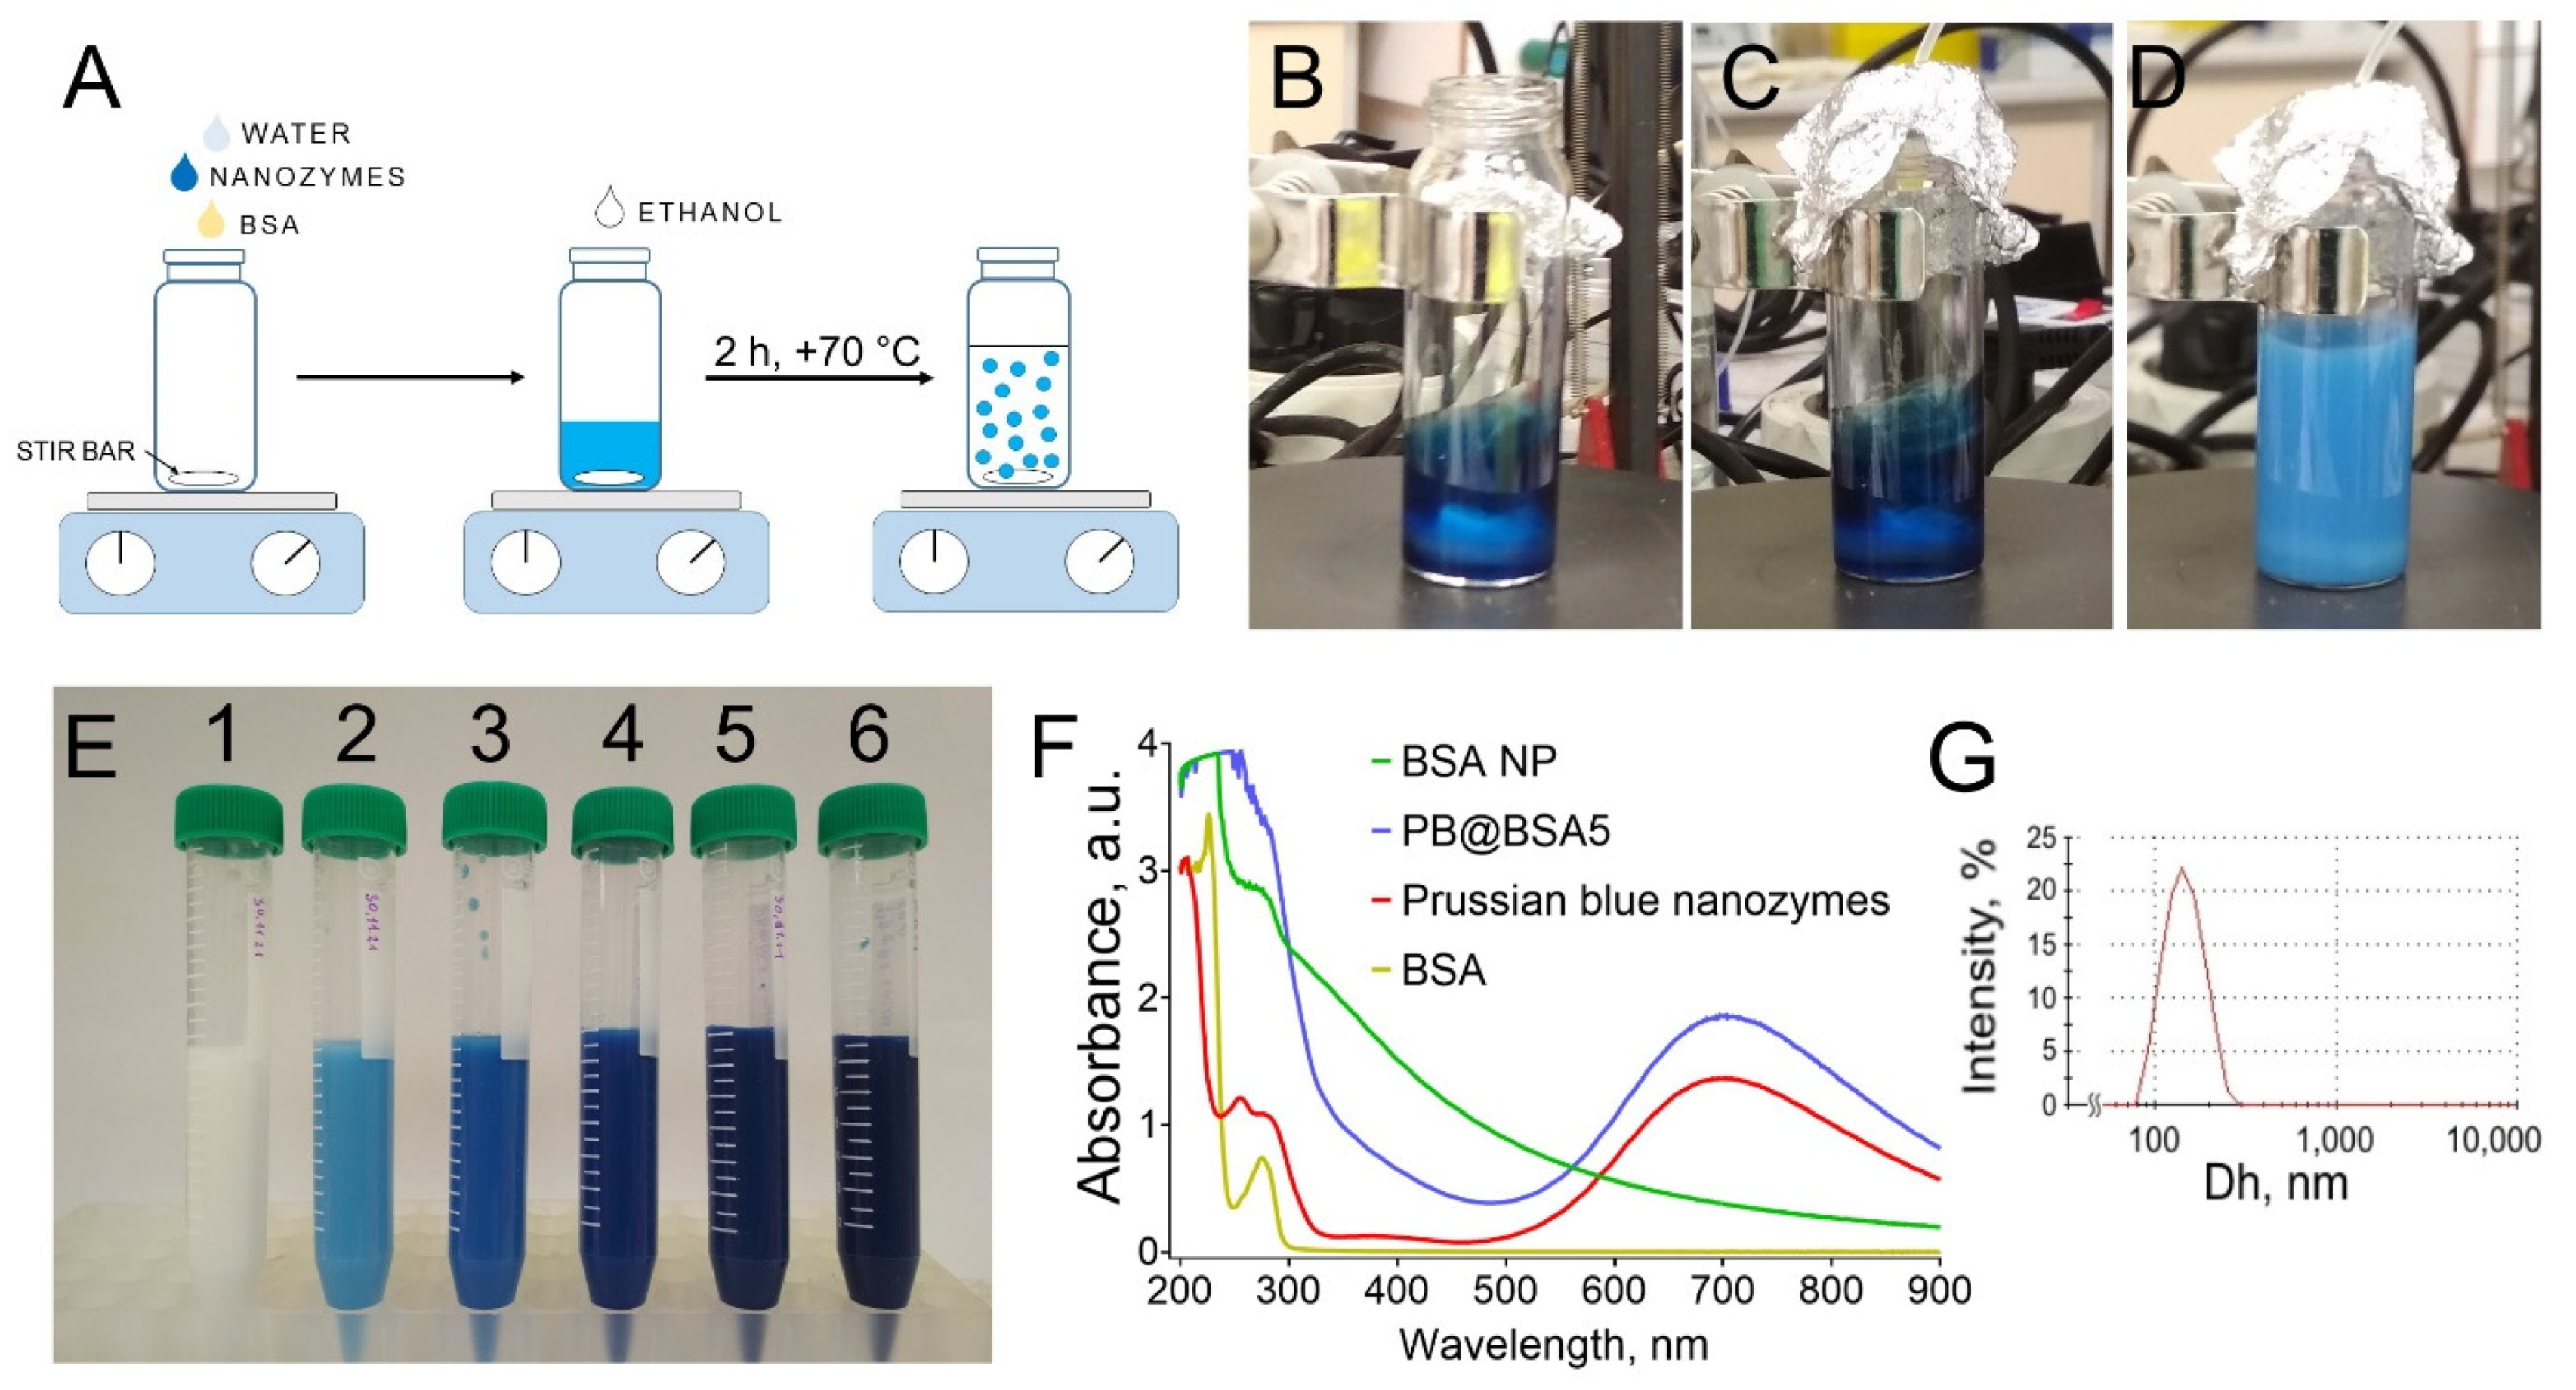
2.3. Preparation of Prussian Blue Nanozyme-Loaded BSA Nanoparticles (PB@BSA)

An amount of 4 mL of an aqueous solution containing 30 mg/mL BSA and a certain amount of Prussian blue nanozymes were added into glass vials. Concentrations of nanozymes were 0.375, 0.75, 1.5, 3, and 6 mg/mL. Solutions were kept under stirring (1000 RPM) across all the synthesis stages. Ethanol (95%; 16 mL) was added dropwise (4 mL/min) using a peristaltic pump. The addition of ethanol was carried out at room temperature. Next, the addition temperature of the solution was raised to +70 °C (temperature was controlled through a thermal sensor). After two hours of heating, stirring was stopped, and the nanoparticle suspension was cooled to room temperature. Nanoparticles were transferred into 2 mL centrifuge tubes and washed with deionized water three times by centrifugation at 20,000× g for 20–30 min (duration depended on the rate of nanoparticle sedimentation). Next, each centrifugation pellet was redispersed by sonication (3 mm probe; duration—15 s; power—approx. 8–9 W). The resulting nanoparticles were combined, sonicated on ice for 10 min (3 mm probe; power—approx. 8–9 W), and stored at +4 °C.
Control nanoparticles (BSA NPs) were prepared without the addition of nanozymes in the same way.

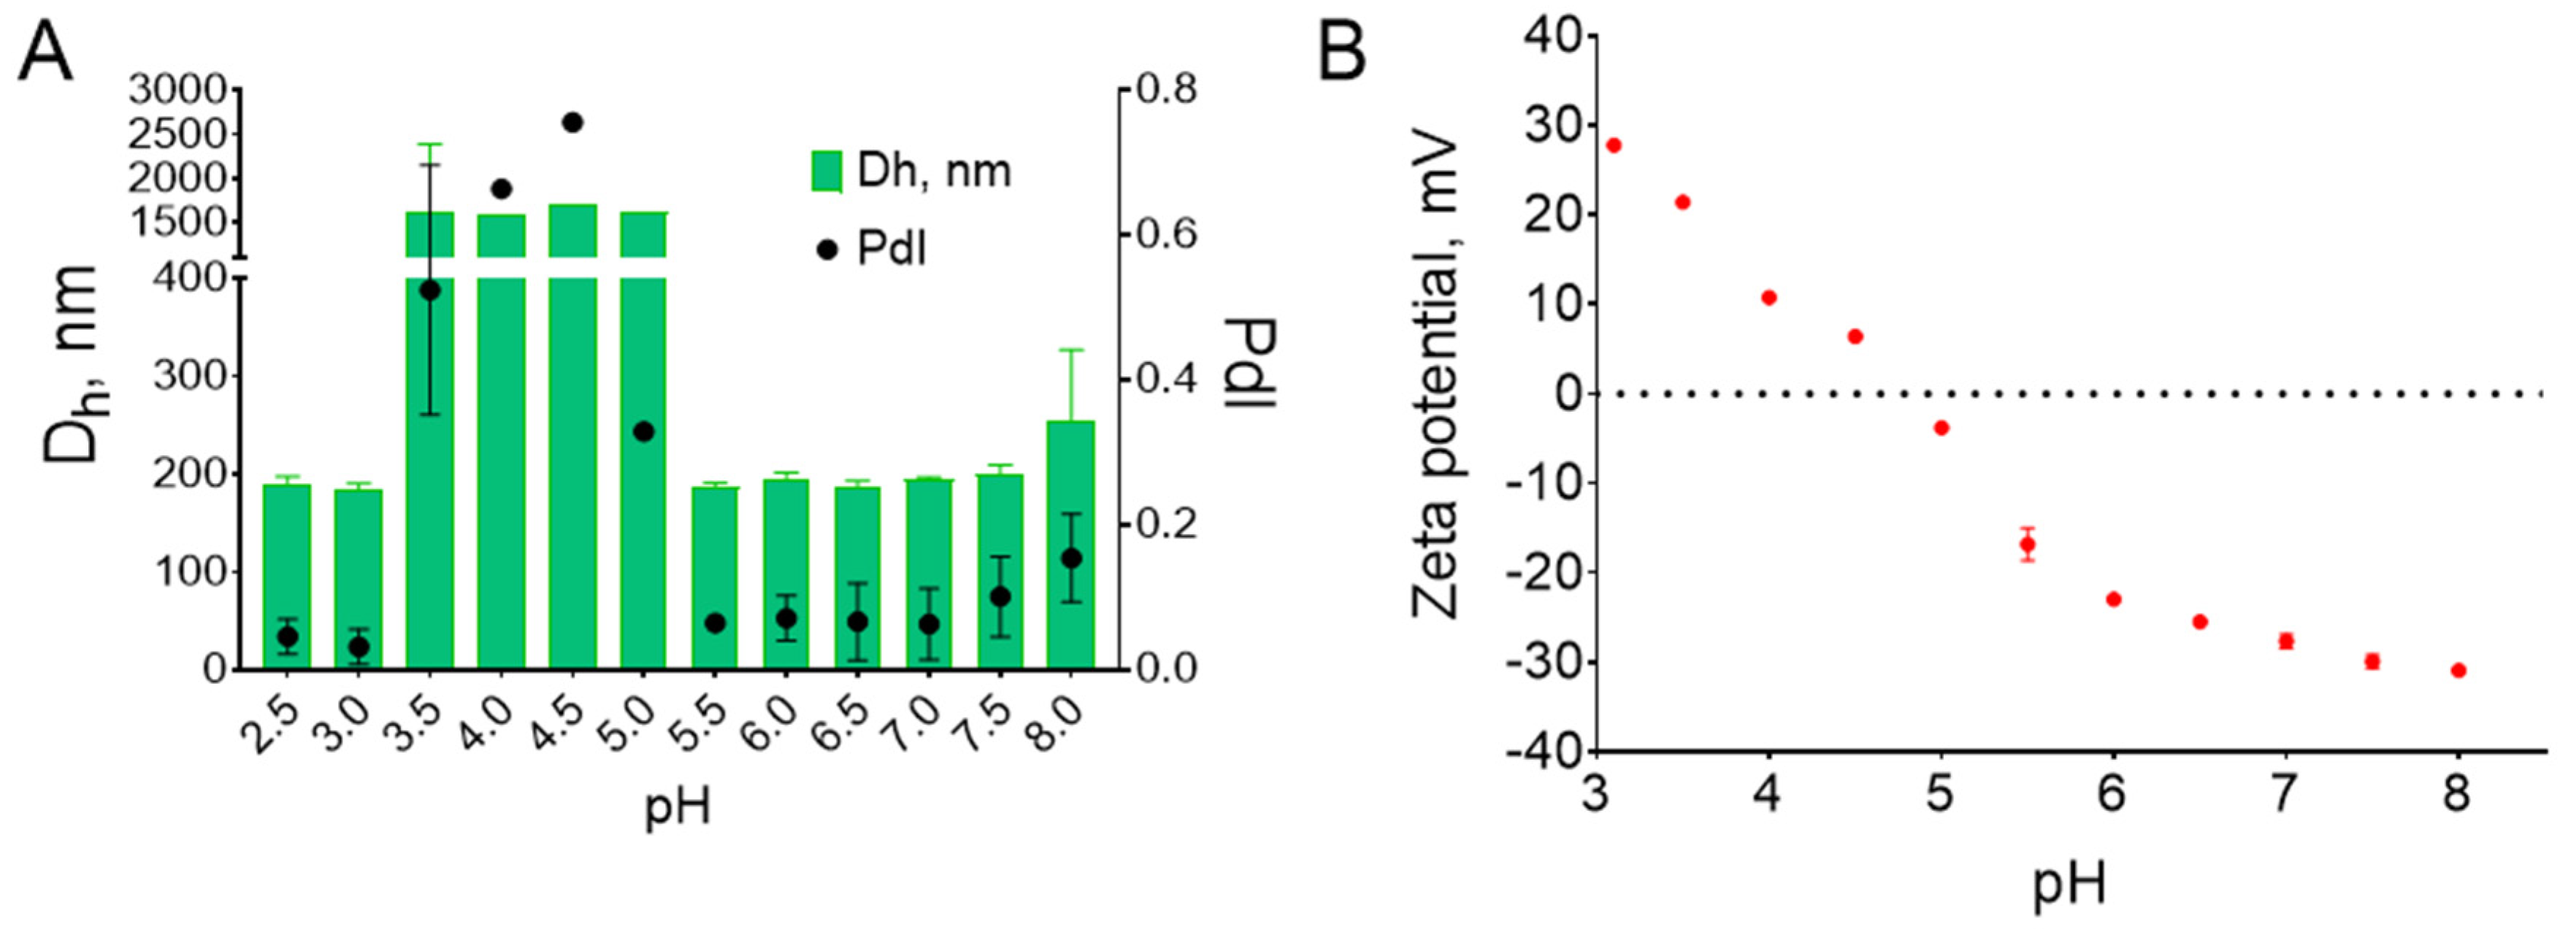
2.4. Characterization of PB@BSA Nanoparticles

Concentration. The concentration of nanoparticles was determined by gravimetric analysis. One milliliter of nanoparticle suspension was added to porcelain crucibles and dried to constant weight at +140 °C (water was evaporated by heating at +95 °C). Three technical replicates were measured for each sample.
Size. Hydrodynamic diameter (Dh) and polydispersity index (PdI) were measured by dynamic light scattering (DLS). Nanoparticles were diluted to 10 μg/mL in deionized water. Three technical replicates were measured for each sample.
Zeta potential. Zeta potential was measured by the M3-PALS (mixed mode measurement-phase analysis light scattering) technique. Samples were diluted to 50 μg/mL in 10 mM phosphate buffer, pH 7, and analyzed in auto mode. Three technical replicates were measured for each sample.
UV-Vis spectra. Nanoparticles were diluted to 400 μg/mL in deionized water and transferred to a quartz cuvette (1 cm path length). Absorbance at 200–1000 nm was measured.
Scanning electron microscopy (SEM) and elemental analysis. The nanoparticle aqueous solution (1–10 μg/mL) was dropped on a silicon wafer and dried at room temperature. Samples were analyzed by a field emission scanning electron microscope FEI Quanta 650FEG equipped with an energy-dispersive X-ray detector.

2.5. Loading Efficiency of Prussian Blue Nanozymes

Calibrators were prepared by the addition of 100 μL of nanozyme aqueous solution to 900 μL of 5 mg/mL BSA in H2O. Resulting solutions contained 5, 10, 20, 40, and 80 μg/mL of nanoparticles. PB@BSA nanoparticles were diluted 1:10 (BSA NP; PB@BSA1; and PB@BSA2), 1:20 (PB@BSA3 and PB@BSA4), or 1:40 (PB@BSA5) in 5 mg/mL BSA. Trypsin solution (10 mg/mL in 1 mM HCl) was added to each sample (10 μL per 1 mL). Samples were incubated at +37 °C on a rotator for 36 h, then absorbance at 700 nm was measured. Three technical replicates were prepared for each sample.
Linear regression was used to calculate the concentration of nanoparticles in digested samples from a calibration curve (Figure S1).
The synthesis yield, encapsulation efficiency and loading capacity of nanozymes were calculated as follows:
Yield = W e i g h t   o f   P B @ B S A   n a n o p a r t i c l e s I n i t i a l   w e i g h t   o f   n a n o z y m e s + i n i t i a l   w e i g h t   o f   B S A × 100 %
Encapsulation   efficiency = W e i g h t   o f   l o a d e d   n a n o z y m e s I n i t i a l   w e i g h t   o f   n a n o z y m e s × 100 %
Loading   capacity = W e i g h t   o f   l o a d e d   n a n o z y m e s W e i g h t   o f   P B @ B S A   n a n o p a r t i c l e s

2.6. Functionalization of PB@BSA Nanoparticles with Antibodies, BSA, and Streptavidin

PB@BSA nanoparticles were diluted in a 10 mM sodium phosphate buffer, pH 7 to 5 mg/mL. The resulting suspension was dropwise added to an equal volume of 1% glutaraldehyde solution in phosphate buffer (pH 7, adjusted with 1 M NaOH) under vigorous stirring. The mixture was incubated for 30 min at +37 °C on a rotator (10 rpm), then nanoparticles were washed by centrifugation at 20,000× g twice with water and once with phosphate buffer. Before and after washing, absorbance at 450 nm (A450) of glutaraldehyde-treated nanoparticles was measured to determine their concentration. To the washed nanoparticles MAbs, streptavidin, or BSA were added. The resulting suspensions were briefly vortexed and then incubated for 60 min at +37 °C on a rotator (10 rpm). Unreacted aldehyde groups were quenched by the addition of 1 M glycine-NaOH (pH 7) to 0.1 M followed by 60 min of incubation at +37 °C. Nanoparticles were washed with water three times as described above. The concentration of nanoparticles was determined by measuring A450.
Nanoparticles with attached MAbs, streptavidin, or BSA will be further referred to as BSA NP/MAb, PB@BSA1/MAb, BSA NP/Str, PB@BSA1/BSA, etc. “PB@BSA/MAb”, “PB@BSA/Str”, and “PB@BSA/BSA” will be used as generic terms for any type of PB@BSA conjugated with MAbs, streptavidin, or BSA, respectively.

2.7. PSA Immunoassay

The 96-well plates were filled with 100 μL of 10 μg/mL anti-PSA capture monoclonal antibodies (clone 3A6) diluted with 0.1 M carbonate buffer, pH 9.5. Plates were kept at +37 °C for 2 h, then washed three times with 300 μL of PBT (10 mM phosphate buffer, pH 7, containing 0.1% Tween-20). Blocking buffer (200 μL; PBT with 1% casein and 1% BSA) was added to the wells. After that, plates were incubated on a shaker (300 rpm) at +37 °C for 1 h and washed three times. PSA (100 μL) diluted in a blocking buffer was added and plates were incubated on a shaker (300 rpm) at +37 °C for 3 h. After washing, PB@BSA/MAb or PB@BSA/BSA (100 μL) diluted in the blocking buffer were added. Plates were incubated on a shaker (300 rpm) at +37 °C for 1 h, then washed and filled with 100 μL of substrate solution (9 mL of 5 mM phosphate-citrate buffer, pH 4 + 1 mL of 1 mg/mL TMB in DMSO + 100 μL of 30% H2O2). After the 30-min-long incubation on a shaker (300 rpm) at +37 °C, 100 μL of 2 M H2SO4 was added, and A450 was measured immediately.

3. Results and Discussion

3.1. Synthesis of Nanozyme-Loaded Albumin Nanoparticles: Properties and Reproducibility

Prussian blue nanozymes were synthesized by a traditional method relying on a quick mixing of FeCl3 and K4[Fe(CN)6] solutions. In our experiment, we used relatively concentrated solutions of iron salts and did not add any stabilizers such as citric acid. Almost 2 g of Prussian blue nanozymes with a mean hydrodynamic diameter of 44 nm and polydispersity index of 0.167 were prepared (Figure S2). Nanozymes form stable aqueous suspensions and keep their size after storage for several months.
Desolvation of albumin is usually performed in an alkaline medium [17]; however, hydrolysis of Prussian blue occurs at neutral and alkaline pH [16]. Desolvation in acidic pH facilitates the formation of large nanoparticles or even macroscopic aggregates [17]. Possible solutions include desolvation at pH lower than the isoelectric point of BSA (e.g., 2–3) or complete omission of the pH adjustment. We chose the second approach due to its simplicity. An aqueous solution of albumin has a pH between 7 and 7.5, which is appropriate for the formation of nanoparticles with a desirable size of 100–200 nm. Despite the neutral pH value, we did not observe hydrolysis of Prussian blue, probably due to extremely low ionic strength.
The first step of our study was the determination of optimal starting BSA concentration. We aimed to choose synthesis conditions favoring the preparation of nanozyme-loaded BSA nanoparticles (PB@BSA) with a size large enough to be sedimented with a reasonably low centrifugation force. Farka et al. have recently applied Prussian blue nanoparticles in immunoassay and reported difficulties with the purification of nanoparticles in the course of functionalization by centrifugation due to their small size (20–30 nm) [6]. Such small nanoparticles can be separated from molecules by gel chromatography or ultrafiltration; however, these methods are rather expensive and time-consuming. For these reasons, we prepared PB@BSA nanoparticles of 100, 160, and 230 nm by changing the starting concentration of BSA [17] (20, 30, and 40 mg/mL, respectively). The smallest nanoparticles were completely sedimented in 60 min at 20,000× g, whereas larger ones were sedimented in 10–20 min. A starting BSA concentration of 30 mg/mL was chosen for the further experiments.
The following step included the synthesis of BSA nanoparticles loaded with various amounts of Prussian blue nanozymes (Figure 1A–D). Ethanol was added to the solution containing BSA and nanozymes, which led to the formation of PB@BSA. The resulting nanoparticles were stabilized by heating. An initial mass ratio of BSA and nanozymes was from 5:1 (PB@BSA5) to 80:1 (PB@BSA1) (Table 1). Plain BSA nanoparticles (BSA NPs) were synthesized in the same conditions and used as a control. In the course of nanoparticle synthesis, aggregates were formed in the reaction vessel (Figure S3). After the washing accompanied by ultrasonication, these aggregates were destroyed. The resulting PB@BSA nanoparticles had a polydispersity index lower than 0.2, indicating their narrow size distribution (representative size distribution plots are presented in Figure 1E and Figure S4). Electron microscopy analysis found that nanoparticles have a spherical shape (Figure 2).
Successful nanozyme loading can be seen by eye: all nanoparticles prepared in the presence of Prussian blue nanozymes had a blue color, whose intensity was inversely proportional to the initial BSA to Prussian blue ratio (Figure 1E). Moreover, their absorbance spectra showed a broad peak at 700 nm, which is typical for Prussian blue (Figure 1F). These results are supported by the elemental analysis of BSA NP and PB@BSA5 samples (Figures S5 and S6). Encapsulation efficiency reached 96% at the highest starting concentration of Prussian blue, therefore almost all nanozymes were entrapped by albumin nanoparticles. Loading capacity also depended on the initial BSA to Prussian blue ratio. PB@BSA5 nanoparticles contained 186 μg of nanozymes per 1 mg of nanoparticles. A further increase of the starting concentration of Prussian blue had deleterious effects: nanoparticles became smaller whereas synthesis yield decreased. Therefore, nanozyme concentrations that are too high interfere with the desolvation process.
Reproducibility of nanoparticle synthesis is essential for its practical application. We synthesized 3 additional batches of PB@BSA5 nanoparticles, which were denoted as PB@BSA5-1, PB@BSA5-2, and PB@BSA5-3. Their properties are summarized in Table 2. Size distributions are presented in Figure S7. Batch-to-batch reproducibility was good in terms of size, yield, and nanozyme content; however, PB@BSA5 nanoparticles synthesized previously under the same conditions were almost 20 nm smaller. These differences indicate that day-to-day reproducibility needs to be further improved.

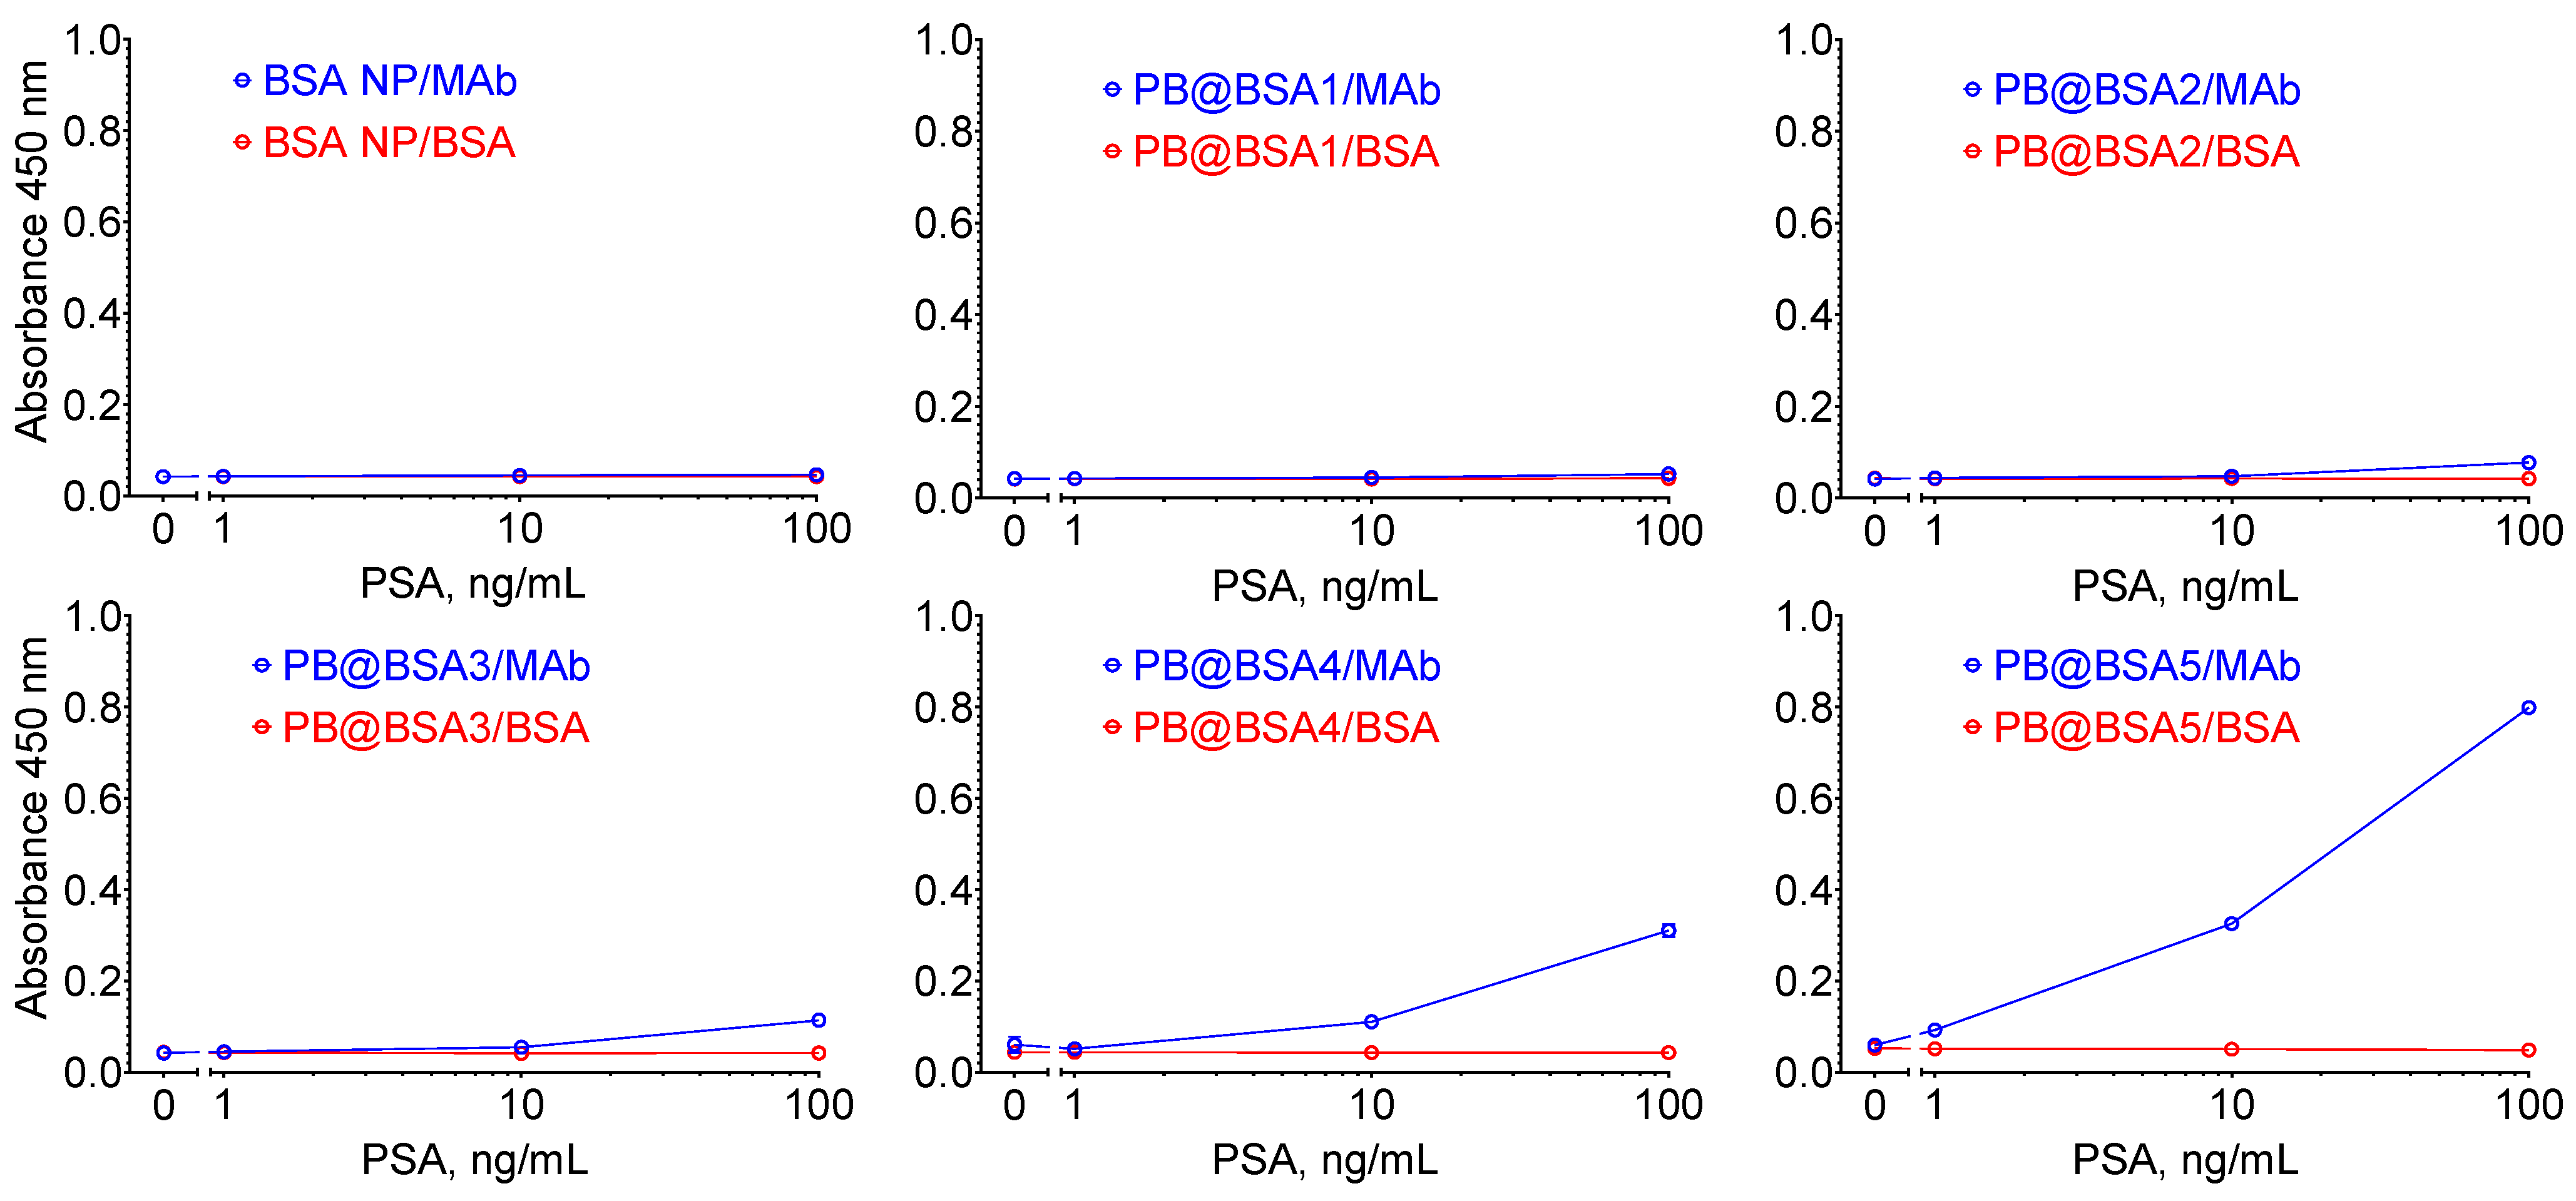
3.2. Functionalization of PB@BSA Nanoparticles

Nanozyme-loaded BSA nanoparticles were functionalized with streptavidin or monoclonal antibodies (MAbs) against prostate-specific antigen (PSA) using glutaraldehyde. Glutaraldehyde contains two aldehyde groups that cross-link primary amines of PB@BSA and recognition molecules. Nanoparticles were first treated with glutaraldehyde excess, then MAbs or streptavidin were incubated with glutaraldehyde-activated PB@BSA, resulting in the formation of PB@BSA/MAb or PB@BSA/Str. PB@BSA conjugated with BSA (PB@BSA/BSA) was used as a control. The decrease in nanoparticle zeta potential after glutaraldehyde cross-linking confirms its reaction with primary amines of BSA (Figure S8).
PB@BSA/MAb and PB@BSA/Str nanoparticles possess good colloidal stability at neutral pH (Figure 3), which is essential because immunoassays are carried out in physiological conditions. Aggregation of nanoparticles was observed at pH values close to the isoelectric point of BSA (3.5–5.0), which is typical for albumin nanoparticles [23]. The zeta potential of nanoparticles approaches zero in the mentioned pH range, indicating that electrostatic forces take part in the stabilization of PB@BSA suspensions. We need to emphasize, however, that the size of nanoparticles was measured in buffers with much higher ionic strength, therefore other forces, such as steric repulsion, also contribute to the stabilization of nanoparticle suspensions. The long-term stability of nanoparticles was assessed by measuring their size and polydispersity after several weeks of storage. Nanoparticles were kept in deionized water without any stabilizers, such as surfactants. We did not observe any change in size and polydispersity upon storage.
Conjugates of PB@BSA with MAbs and BSA were synthesized to compare their efficiency in immunoassay. The performance of conjugates was compared using a PSA sandwich immunoassay. The highest sensitivity of PSA detection and most intense color was produced by nanoparticles with the largest nanozyme content, PB/BSA5/Mab (Figure 4). The absence of a signal in wells in which control conjugate (PB@BSA5/BSA) was added confirmed that the signal was due to interaction between antibody and antigen. Oxidation of the substrate was promoted by the peroxidase-like activity of nanozymes, because nanoparticles without nanozymes (BSA NP/MAb) did not generate any signal.
Nanozyme-containing nanoparticles produced a rather weak color signal in terms of absorbance value in comparison with conventional ELISA. Higher signal intensity can both improve the reliability of absorbance measurement at lower absorbance values and increase the sensitivity of the immunoassay. Therefore, the next step of our work was to optimize the composition of the substrate solution.

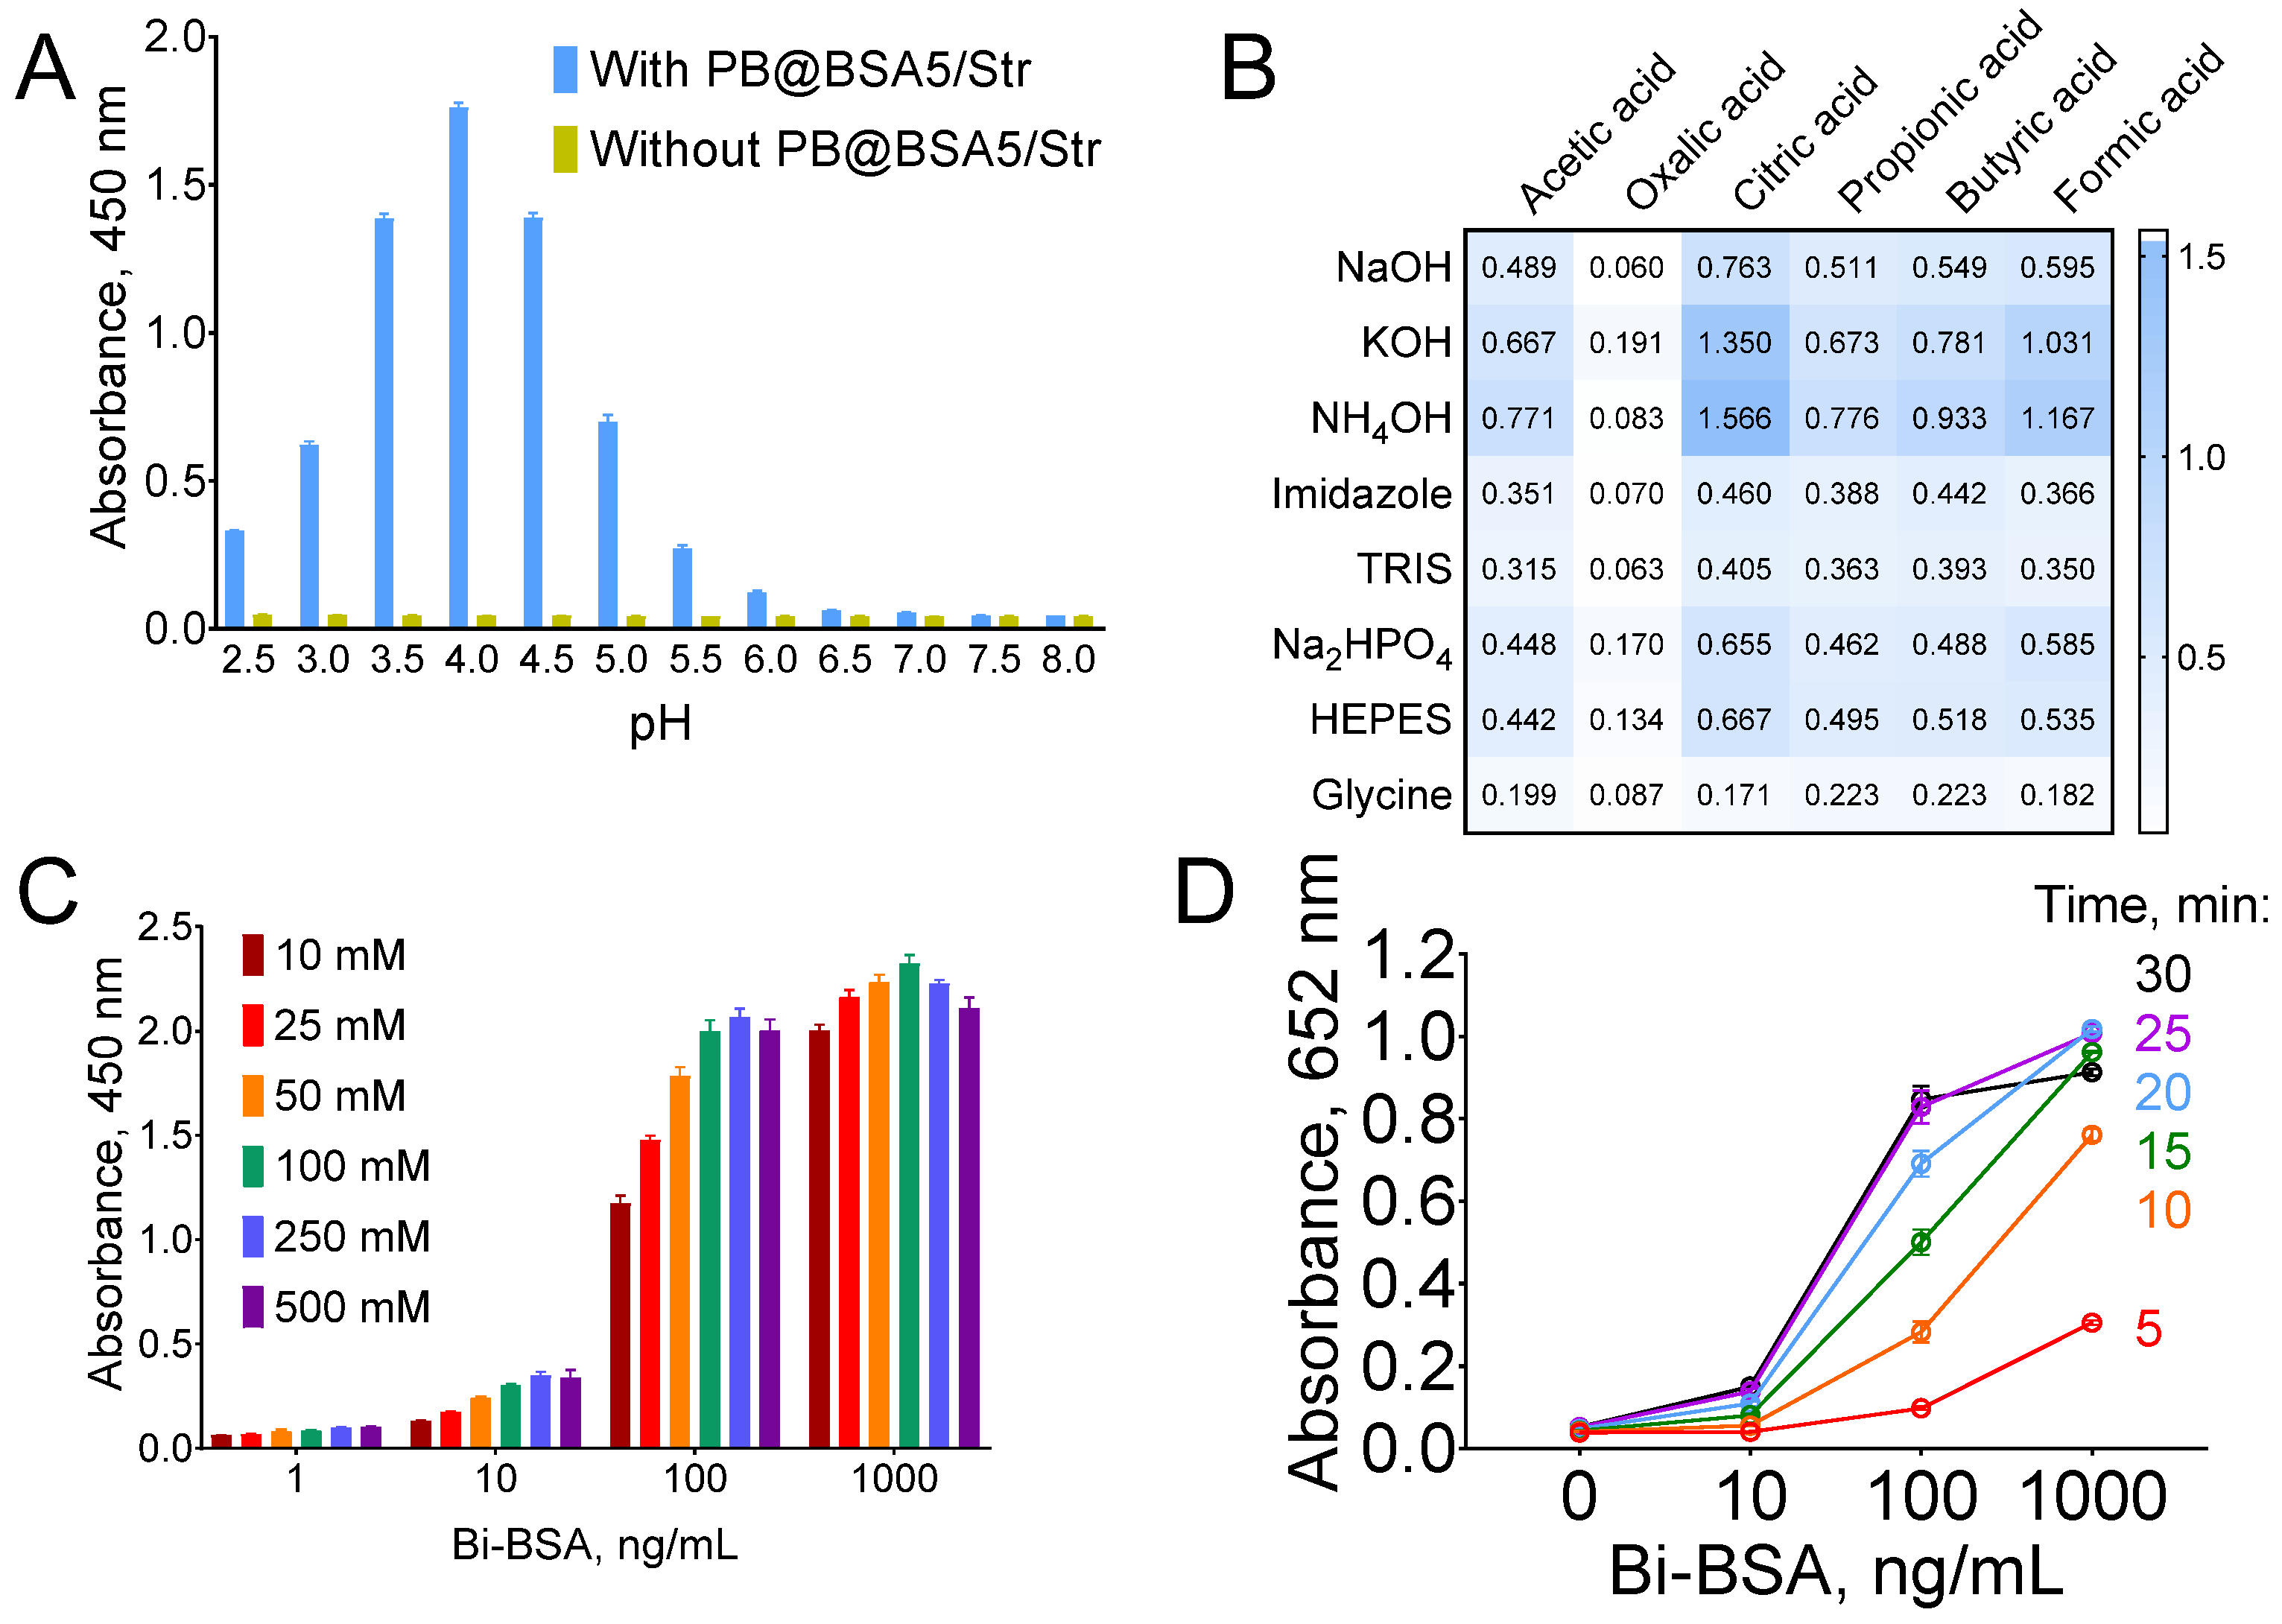
3.3. Optimization of Substrate Buffer

The catalytic activity of nanozymes depends on environmental conditions including composition [24,25] and pH of the buffer solution as well as the concentration of specific electrolytes [26] and substrates (TMB and H2O2) [27].
First, we assessed the pH dependence of PB@BSA peroxidase-like activity. As we have shown before, aggregation of PB@BSA occurs at acidic pH, hampering direct measurement of their catalytic activity in solution. For this reason, we utilized a quick and simple direct assay of biotinylated BSA (Bi-BSA) to optimize the TMB substrate. Streptavidin-conjugated PB@BSA5 nanoparticles (PB@BSA5/Str) were used in this experiment. Plates were coated with Bi-BSA, blocked, treated with PB@BSA5/Str, and filled with substrate solutions.
Optimal pH was determined using TMB diluted in 0.1 M citrate/0.2 M phosphate (McIlvaine) buffer, which allows covering a wide range of pH values. The highest signal was attained at pH 4, whereas at pH 3 and 5 absorbance value was almost three times lower (Figure 5A). This result does not completely coincide with previously published data on the effect of pH on Prussian blue activity. Specifically, Prussian blue nanoparticles are active in a wider range of pH including physiological values [28,29]. Differences in synthesis conditions probably explain these discrepancies. Moreover, the method of catalytic activity measurement can also affect the results: in both mentioned papers peroxidatic activity was measured by direct addition of nanozymes into the substrate solution.
In further experiments, optimization of substrate buffer composition was performed. Buffers were prepared from six acids (acetic, oxalic, citric, butyric, propionic, and formic) and eight bases (KOH, NaOH, NH4OH, imidazole, TRIS, HEPES, Na2HPO4, and glycine). Spontaneous color development, which can be caused by traces of transition metals (e.g., iron), was prevented by the addition of sodium citrate solution (pH 4) to 1 mM in all tested buffers [30]. The highest signal was obtained with 0.1 M ammonium-citrate buffer (Figure 5B). There was no color development in samples without nanoparticles, confirming that the observed signal was caused by nanoparticles and not due to the spontaneous decomposition of substrates. Notably, color intensity significantly depends on buffer composition; for example, more than a two-fold difference was found between commonly used citrate-phosphate buffer and ammonium-citrate buffer. Retesting of buffers that produced the highest absorbance values yielded the same result: ammonium-citrate and potassium-citrate buffers performed best (Figure S9).
Next, the molarity of the ammonium-citrate buffer was optimized. An increase in buffer molarity from 10 to 100 mM provided significant growth of absorbance; larger ion concentrations had a negligible effect (Figure 5C). Importantly, enhancement of the color signal did not lead to higher signal variation, therefore buffer optimization can theoretically improve the limit of detection of the immunoassay.
Finally, we investigated the dependence between the concentration of H2O2 and the dynamics of color development. Nanozymes possess a lower affinity towards H2O2 [24] than horseradish peroxidase, therefore higher concentrations of H2O2 are usually utilized in nanozyme-based assays. Throughout previous experiments, concentration of hydrogen peroxide in the substrate solution was 0.3%. Herein, we tested substrates containing from 0.018% to 2.4% of H2O2. Absorbance at 652 nm (absorbance maximum of semi-oxidized TMB) was measured for 60 min at 5 min intervals. In general, higher peroxide concentrations resulted in more rapid absorbance growth (Figure S10). H2O2 concentrations of 0.15–0.3% provide both high and stable signals. Notably, even in optimized conditions, nanozymes react more slowly than horseradish peroxidase. The maximum signal is reached after 25–30 min of incubation (Figure 5D).
Optimization of substrate composition resulted in a significant increase in the intensity of the color signal generated by PB@BSA. Nevertheless, this improvement also had undesirable consequences: the background signal in the PSA assay dramatically increased. We identified that PB@BSA can non-specifically interact with both human and murine immunoglobulin G (IgG). As a rule, such issues can be solved by the application of a blocking solution, which contains substances (usually proteins, polymers, or animal sera) capable of suppressing the non-specific interactions. In previous experiments we used a blocking solution containing casein and albumin; however, they became ineffective after the application of an optimized substrate. An additional study was carried out to develop an appropriate blocking solution. A desirable effect was achieved by the adjustment of ionic strength to 0.5–1 M using NaCl and the addition of 0.5–1% glutaraldehyde-treated albumin resembling the structure of the PB@BSA/MAb surface.

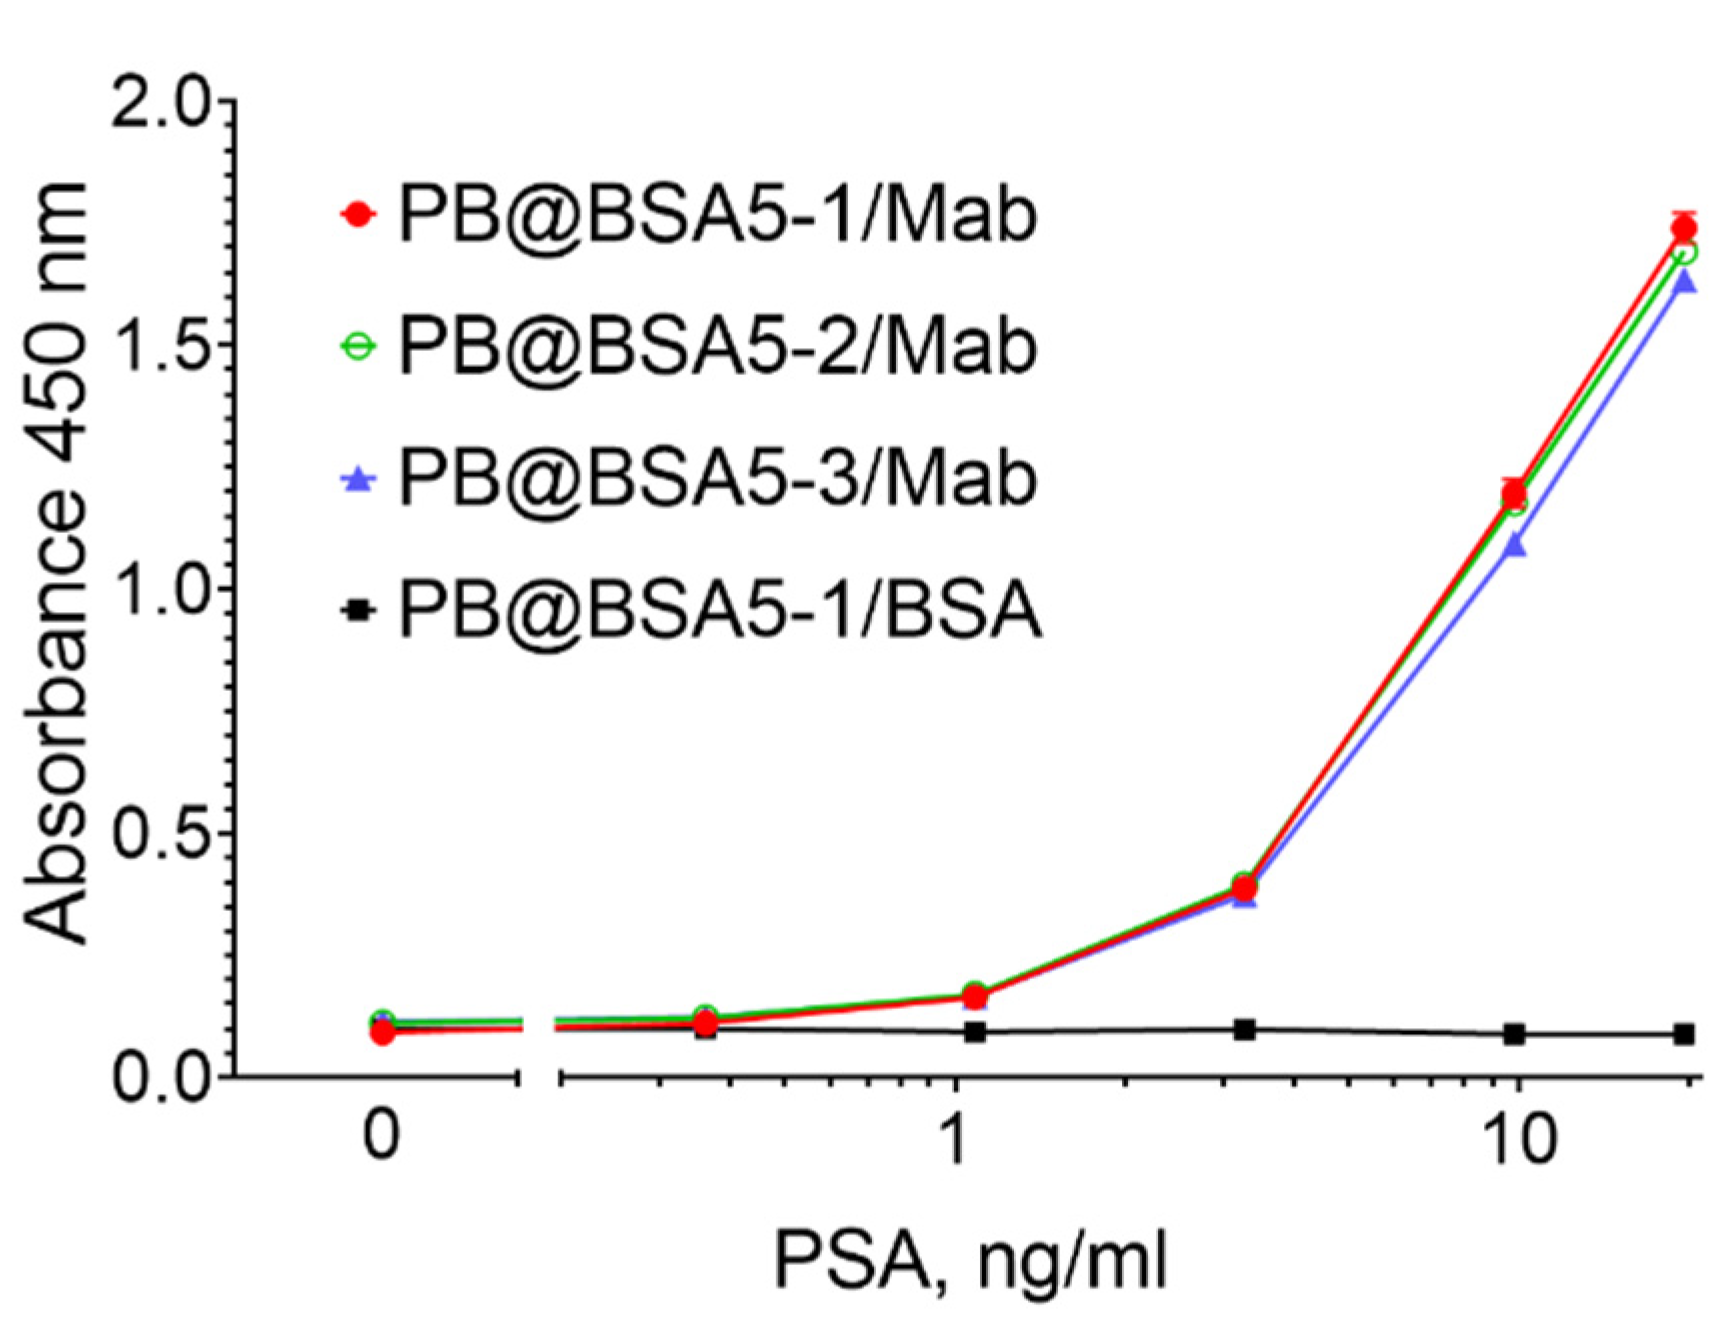
3.4. PSA Assay: Optimization and Reproducibility

The final goal of our study was to achieve the performance of nanozyme-containing albumin nanoparticles as labels in the colorimetric assay of PSA. In all the previous experiments we used a fixed concentration of PB@BSA/MAb (0.1 mg/mL); the MAb:nanoparticle ratio was also the same: 50 μg per 1 mg. Herein, various concentrations of nanoparticles and antibody-to-nanoparticle ratios were tested (Figure S11). In general, a higher concentration of nanoparticles and antibodies did not provide significant improvement in the assay sensitivity. Based on the analysis of calibration curves, we chose the optimal assay conditions: concentration of PB@BSA/MAb—0.1 mg/mL; MAb to PB@BSA ratio—100 μg per 1 mg.
Nanoparticles PB@BSA5-1, PB@BSA5-2, and PB@BSA5-3 were conjugated with MAb and used as diagnostic reagents in the PSA immunoassay. Nanoparticles conjugated with BSA (PB@BSA5-1/BSA) were used as a negative control. Almost identical calibration curves were obtained for all tested conjugates (Figure 6). Lower limits of PSA detection were 0.064, 0.390, and 0.659 ng/mL (Figure S12). As one can see, LODs differed by an order of magnitude. The extremely low LOD value (0.064 ng/mL) obtained for PB@BSA5-1/MAb can be explained by the very low variation of a zero calibrator. Taking into account the very gentle slope of the calibration curve at PSA concentrations lower than 1 ng/mL, we conclude that 0.390 and 0.659 ng/mL are more realistic estimations of LOD. Therefore, the analytical sensitivity of the developed assay enables the determination of PSA in a clinically relevant range of concentrations (concentration of 4 ng/mL indicates increased risk of prostate cancer) [31], indicating the applicability of nanozyme-loaded BSA nanoparticles as labels in colorimetric immunoassays.

4. Conclusions

The desolvation technique was successfully applied to encapsulate Prussian blue nanozymes into BSA nanoparticles. The advantages of this approach are its simplicity and reproducibility. At a laboratory scale, more than one hundred milligrams of nanoparticles can be synthesized in 3–4 h. Nanozyme-loaded nanoparticles have good colloidal stability and can be stored for several months. The practical applicability of nanoparticles as reagents for colorimetric immunoassays was confirmed by the quantitative detection of a prostate-specific antigen.

Supplementary Materials

The following supporting information can be downloaded at https://www.mdpi.com/article/10.3390/colloids6020029/s1, Reagents and instrumentation. Figure S1. Calibration curve of Prussian blue nanozymes; Figure S2. Intensity-weighted size distribution plot of Prussian blue nanozymes; Figure S3. PB@BSA5 nanoparticles after thermal cross-linking; Figure S4. Intensity-weighted size distribution plots; Figure S5. Elemental analysis (EDS) of PB@BSA5; Figure S6. Elemental analysis (EDS) of BSA NPs; Figure S7. Intensity-weighted size distribution plots; Figure S8. Decrease in zeta potential of PB@BSA5 after the glutaraldehyde treatment; Figure S9. Re-testing of substrates provided the highest signal; Figure S10. Dynamics of color intensity change at different H2O2 concentration in substrate solution; Figure S11. Optimization of PSA assay conditions; Figure S12. PSA assay: results of curve fitting.

Author Contributions

Conceptualization, P.K., M.R. and S.Z.; methodology, P.K. and M.K.; investigation, P.K., M.K., M.B., D.K. and V.T., resources, M.R.; writing—original draft preparation, P.K. and M.K.; supervision, M.R. and S.Z.; project administration, M.R.; funding acquisition, P.K. All authors have read and agreed to the published version of the manuscript.

Funding

This study was supported by the Russian Science Foundation, grant 20-75-00029.

Institutional Review Board Statement

Not applicable.

Informed Consent Statement

Not applicable.

Data Availability Statement

The datasets used and/or analyzed during the current study are available from the corresponding author on reasonable request.

Conflicts of Interest

The authors declare no conflict of interest. The funders had no role in the design of the study; in the collection, analyses, or interpretation of data; in the writing of the manuscript, or in the decision to publish the results.

References

  1. Das, B.; Franco, J.L.; Logan, N.; Balasubramanian, P.; Kim, M.I.; Cao, C. Nanozymes in Point-of-Care Diagnosis: An Emerging Futuristic Approach for Biosensing. Nano-Micro Lett. 2021, 13, 193. [Google Scholar] [CrossRef] [PubMed]
  2. Ren, X.; Chen, D.; Wang, Y.; Li, H.; Zhang, Y.; Chen, H.; Li, X.; Huo, M. Nanozymes-recent development and biomedical applications. J. Nanobiotechnol. 2022, 20, 92. [Google Scholar] [CrossRef]
  3. Li, S.; Zhang, Y.; Wang, Q.; Lin, A.; Wei, H. Nanozyme-Enabled Analytical Chemistry. Anal. Chem. 2022, 94, 312–323. [Google Scholar] [CrossRef] [PubMed]
  4. Gao, Y.; Zhou, Y.; Chandrawati, R. Metal and Metal Oxide Nanoparticles to Enhance the Performance of Enzyme-Linked Immunosorbent Assay (ELISA). ACS Appl. Nano Mater. 2020, 3, 1–21. [Google Scholar] [CrossRef]
  5. Kraft, A. Some considerations on the structure, composition, and properties of Prussian blue: A contribution to the current discussion. Ionics 2021, 27, 2289–2305. [Google Scholar] [CrossRef]
  6. Farka, Z.; Čunderlová, V.; Horáčková, V.; Pastucha, M.; Mikušová, Z.; Hlaváček, A.; Skládal, P. Prussian Blue Nanoparticles as a Catalytic Label in a Sandwich Nanozyme-Linked Immunosorbent Assay. Anal. Chem. 2018, 90, 2348–2354. [Google Scholar] [CrossRef]
  7. He, Q.; Yang, H.; Chen, Y.; Shen, D.; Cui, X.; Zhang, C.; Xiao, H.; Eremin, S.A.; Fang, Y.; Zhao, S. Prussian blue nanoparticles with peroxidase-mimicking properties in a dual immunoassays for glycocholic acid. J. Pharm. Biomed. 2020, 187, 113317. [Google Scholar] [CrossRef]
  8. Tian, M.; Xie, W.; Zhang, T.; Liu, Y.; Lu, Z.; Li, C.M.; Liu, Y. A sensitive lateral flow immunochromatographic strip with prussian blue nanoparticles mediated signal generation and cascade amplification. Sens. Actuators B Chem. 2020, 309, 127728. [Google Scholar] [CrossRef]
  9. Shokouhimehr, M.; Soehnlen, E.S.; Hao, J.; Griswold, M.; Flask, C.; Fan, X.; Basilion, J.P.; Basu, S.; Huang, S.D. Dual purpose Prussian blue nanoparticles for cellular imaging and drug delivery: A new generation of T1-weighted MRI contrast and small molecule delivery agents. J. Mater. Chem. 2010, 20, 5251–5259. [Google Scholar] [CrossRef]
  10. Qin, Z.; Li, Y.; Gu, N. Progress in Applications of Prussian Blue Nanoparticles in Biomedicine. Adv. Healthc. Mater. 2018, 7, 1800347. [Google Scholar] [CrossRef]
  11. Weber, C.; Coester, C.; Kreuter, J.; Langer, K. Desolvation process and surface characterisation of protein nanoparticles. Int. J. Pharm. 2000, 194, 91–102. [Google Scholar] [CrossRef]
  12. Peralta, D.V.; He, J.; Wheeler, D.A.; Zhang, J.Z.; Tarr, M.A. Encapsulating gold nanomaterials into size-controlled human serum albumin nanoparticles for cancer therapy platforms. J. Microencapsul. 2014, 31, 824–831. [Google Scholar] [CrossRef] [PubMed]
  13. Chen, D.; Tang, Q.; Xue, W.; Xiang, J.; Zhang, L.; Wang, X. The preparation and characterization of folate-conjugated human serum albumin magnetic cisplatin nanoparticles. J. Biomed. Res. 2010, 24, 26–32. [Google Scholar] [CrossRef] [Green Version]
  14. Angelova, N.; Yordanov, G. Entrapment of β-FeO(OH) nanoparticles in human serum albumin: Preparation, characterization and hemocompatibility. Colloids Surf. A Physicochem. Eng. Asp. 2017, 516, 317–324. [Google Scholar] [CrossRef]
  15. Bhushan, B.; Gopinath, P. Antioxidant nanozyme: A facile synthesis and evaluation of the reactive oxygen species scavenging potential of nanoceria encapsulated albumin nanoparticles. J. Mater. Chem. B 2015, 3, 4843–4852. [Google Scholar] [CrossRef]
  16. Karyakin, A.A. Advances of Prussian blue and its analogues in (bio)sensors. Curr. Opin. Electrochem. 2017, 5, 92–98. [Google Scholar] [CrossRef]
  17. Galisteo-González, F.; Molina-Bolívar, J.A. Systematic study on the preparation of BSA nanoparticles. Colloids Surf. B 2014, 123, 286–292. [Google Scholar] [CrossRef]
  18. Liu, X.; Meng, H. Consideration for the scale-up manufacture of nanotherapeutics—A critical step for technology transfer. VIEW 2021, 2, 20200190. [Google Scholar] [CrossRef]
  19. Spada, A.; Emami, J.; Tuszynski, J.A.; Lavasanifar, A. The Uniqueness of Albumin as a Carrier in Nanodrug Delivery. Mol. Pharm. 2021, 18, 1862–1894. [Google Scholar] [CrossRef]
  20. Wacker, M.; Zensi, A.; Kufleitner, J.; Ruff, A.; Schütz, J.; Stockburger, T.; Marstaller, T.; Vogel, V. A toolbox for the upscaling of ethanolic human serum albumin (HSA) desolvation. Int. J. Pharm. 2011, 414, 225–232. [Google Scholar] [CrossRef]
  21. Yedomon, B.; Fessi, H.; Charcosset, C. Preparation of Bovine Serum Albumin (BSA) nanoparticles by desolvation using a membrane contactor: A new tool for large scale production. Eur. J. Pharm. Biopharm. 2013, 85, 398–405. [Google Scholar] [CrossRef] [PubMed]
  22. Jahanban-Esfahlan, A.; Dastmalchi, S.; Davaran, S. A simple improved desolvation method for the rapid preparation of albumin nanoparticles. Int. J. Biol. Macromol. 2016, 91, 703–709. [Google Scholar] [CrossRef] [PubMed]
  23. Wang, W.; Huang, Y.; Zhao, S.; Shao, T.; Cheng, Y. Human serum albumin (HSA) nanoparticles stabilized with intermolecular disulfide bonds. Chem. Commun. 2013, 49, 2234. [Google Scholar] [CrossRef]
  24. Drozd, M.; Pietrzak, M.; Parzuchowski, P.G.; Malinowska, E. Pitfalls and capabilities of various hydrogen donors in evaluation of peroxidase-like activity of gold nanoparticles. Anal. Bioanal. Chem. 2016, 408, 8505–8513. [Google Scholar] [CrossRef] [PubMed] [Green Version]
  25. Huang, P.-J.J.; Yang, J.; Chong, K.; Ma, Q.; Li, M.; Zhang, F.; Moon, W.J.; Zhang, G.; Liu, J. Good’s buffers have various affinities to gold nanoparticles regulating fluorescent and colorimetric DNA sensing. Chem. Sci. 2020, 11, 6795–6804. [Google Scholar] [CrossRef]
  26. Shan, Z.; Lu, M.; Wang, L.; MacDonald, B.; MacInnis, J.; Mkandawire, M.; Zhang, X.; Oakes, K.D. Chloride accelerated Fenton chemistry for the ultrasensitive and selective colorimetric detection of copper. Chem. Commun. 2016, 52, 2087–2090. [Google Scholar] [CrossRef]
  27. Pham, X.-H.; Hahm, E.; Huynh, K.-H.; Son, B.S.; Kim, H.-M.; Jun, B.-H. Sensitive Colorimetric Detection of Prostate Specific Antigen Using a Peroxidase-Mimicking Anti-PSA Antibody Coated Au Nanoparticle. Biochip J. 2020, 14, 158–168. [Google Scholar] [CrossRef]
  28. Komkova, M.A.; Karyakina, E.E.; Karyakin, A.A. Catalytically synthesized Prussian Blue nanoparticles defeating natural enzyme peroxidase. J. Am. Chem. Soc. 2018, 140, 11302–11307. [Google Scholar] [CrossRef]
  29. Wang, S.; Yan, H.; Wang, Y.; Wang, N.; Lin, Y.; Li, M. Hollow Prussian Blue nanocubes as peroxidase mimetic and enzyme carriers for colorimetric determination of ethanol. Microchim. Acta 2019, 186, 738. [Google Scholar] [CrossRef]
  30. Stable Indicator Solutions for Detection of Peroxidatic Activity. Available online: https://patents.google.com/patent/WO1990002339A1/en (accessed on 7 April 2022).
  31. Duffy, M.J. Biomarkers for prostate cancer: Prostate-specific antigen and beyond. Clin. Chem. Lab. Med. 2020, 58, 326–339. [Google Scholar] [CrossRef] [Green Version]
Figure 1. (A) Scheme of nanoparticle synthesis; (BD) different stages of PB@BSA1 synthesis: a mixture of BSA and nanozymes before (B) and after the addition of 1 (C) or 4 (D) mL of ethanol; (E) nanoparticle suspensions: 1—BSA NPs, 2—PB@BSA1, 3—PB@BSA2, 4—PB@BSA3, 5—PB@BSA4, 6—PB@BSA5. (F) UV-Vis spectra of BSA NPs, PB@BSA5, nanozymes, and BSA. (G) Intensity-weighted size distribution of PB@BSA5, Dh—hydrodynamic diameter.
Colloids 06 00029 g001
Figure 2. SEM images of PB@BSA5 (A) and BSA NP (B) nanoparticles. Scale bars—1 μm.
Colloids 06 00029 g002
Figure 3. Colloidal stability of PB@BSA5/Str. (A) Mean hydrodynamic diameter (Dh) and polydispersity index (PdI) of nanoparticles (10 μg/mL) in McIlvaine buffers with various pH values. (B) Zeta potential of nanoparticles (50 μg/mL) in 5 mM citrate-phosphate buffer. Means ± SDs of 3 technical replicates are presented.
Colloids 06 00029 g003
Figure 4. Calibration curves in PSA assay obtained for various PB@BSA nanoparticles conjugated with anti-PSA MAbs or BSA. Concentration of nanoparticles—0.1 mg/mL. Means ± SDs of 3 technical replicates are presented. Error bars are very small and hidden by the data points.
Colloids 06 00029 g004
Figure 5. (A) Absorbance value produced by substrates with various pH values. Samples ‘Without PB@BSA5/Str’ represent signal intensity in wells that were filled with the blocking buffer instead of conjugate (control of spontaneous color development). Substrate: 0.1 M citrate/0.2 M phosphate buffers, TMB—1 mg/mL, H2O2—0.3%. n = 4, mean ± SD. (B) Absorbance value produced by various substrate buffers (pH 4), mean of 2 samples is given; (C) effect of buffer molarity on color signal, n = 3, mean ± SD; (D) calibration curves obtained in different time periods after the addition of substrate (H2O2-0.3%), n = 3, mean ± SD.
Colloids 06 00029 g005
Figure 6. PSA calibration curve assay obtained for three batches of PB@BSA5 nanoparticles conjugated with anti-PSA MAbs or BSA. n = 3, mean ± SD. Error bars are very small and hidden by the data points.
Colloids 06 00029 g006
Table 1. Properties of PB@BSA nanoparticles.
Nanoparticle TypeDh, nmPdIZP, mVLoading Capacity, μg/mgEncapsulation Efficiency, %Yield, %
BSA NP234 ± 30.078 ± 0.006−19.1 ± 0.90.00.079.8
PB@BSA1237 ± 530.166 ± 0.073−17.8 ± 1.47.640.666.4
PB@BSA2169 ± 50.175 ± 0.007−16.8 ± 0.824.774.573.6
PB@BSA3123 ± 10.176 ± 0.008−19.2 ± 1.751.184.378.6
PB@BSA4131 ± 180.131 ± 0.090−17.9 ± 0.8101.791.481.8
PB@BSA5140 ± 10.040 ± 0.026−17.8 ± 0.4186.596.386.1
n = 3, mean ± SD.
Table 2. Properties of three batches of PB@BSA5 nanoparticles.
BatchDh, nmPdIZP, mVLoading Capacity, μg/mgEncapsulation Efficiency, %Yield, %
PB@BSA5-1168 ± 10.104 ± 0.007−18.2 ± 1.619299.786.7
PB@BSA5-2167 ± 10.106 ± 0.011−21.0 ± 1.019199.890.6
PB@BSA5-3161 ± 10.178 ± 0.017−17.5 ± 0.918799.691.1
n = 3, mean ± SD.
Publisher’s Note: MDPI stays neutral with regard to jurisdictional claims in published maps and institutional affiliations.

