Review

Two-Liquid Flotation for Separating Mixtures of Ultra-Fine Rare Earth Fluorescent Powders for Material Recycling—A Review

1
Ecole Nationale Supérieure de Géologie, GeoRessources UMR 7359 CNRS, University of Lorraine, 2 Rue du Doyen Marcel Roubault, BP 10162, 54505 Vandoeuvre-lès-Nancy, France
2
Department of Systems Innovation, Graduate School of Engineering, The University of Tokyo, 7-3-1 Hongo, Bunkyo-ku, Tokyo 113-8656, Japan
*
Author to whom correspondence should be addressed.
Colloids Interfaces 2018, 2(1), 7; https://doi.org/10.3390/colloids2010007
Submission received: 10 January 2018 / Revised: 2 February 2018 / Accepted: 7 February 2018 / Published: 13 February 2018

Abstract

:
This paper reviews two separation methods applying two-step two-liquid flotation for recovering ultra-fine rare earth fluorescent powders (i.e., red, green, and blue). The paper aims to extract the science behind separation by two-liquid flotation, and to provide resulting engineering tips for material recycling. Two-liquid flotation, also called liquid-liquid extraction, involves two solvents (i.e., non-polar and polar solvents) to capture hydrophobic/hydrophobized particles at their interface, and a surfactant to selectively modify the surface property of the target powder(s). For separating a three powder mixture, two different developed flowsheets, composed of two-step separation are discussed. The major difference found was the polar solvents used. The first flowsheet (called the aqueous-organic system) employed water as a polar solvent while the second flowsheet (called the organic-organic system) utilized N,N-dimethylformamide, DMF as a polar solvent. The organic-organic system at the optimized conditions achieved both the grade and recovery of all the separated fluorescent powders at greater than 90% while the aqueous-organic system did not satisfy these criteria. This paper also reviews the mechanism behind the separation, as well as performing a cost comparison between the two methods. The cost comparison indicates that the organic-organic system is a more cost effective method for recovering rare earth fluorescent powders than the aqueous-organic system. Since the size of powders (i.e., several µm) is too small for the application of conventional separation technologies (e.g., froth flotation), two-liquid flotation is a unique pathway for the material recycling of ultra-fine rare earth fluorescent powders.

1. Introduction

Fluorescent powders are widely used in the manufacturing of luminescent materials, such as, three-band fluorescent lamps [1]. These powders contain rare earth elements. Rare earth elements (REEs) are considered risk elements, since most of them are imported from only a few countries. In addition, the price of these elements can be strongly affected by the oil price for transportation. The number of fluorescent lamps consumed in 2011 was approximately 0.38 billion [2]. However, the recycling rate of REEs was only less than 1% in 2011 [3]. The REEs are thus required to be recycled and an efficient recycling methodology is needed. Generally, the spent fluorescent lamps are first crushed in water to reject mercury vapor and avoid air pollution [4]. Separation of glass and metallic parts is then carried out by magnetic separation. Fluorescent powders, on the other hand, are often discarded without being recovered. Therefore, recycling of fluorescent powders is encouraged in order to minimize the amount of waste and solve environmental problems in addition to the economic benefit.
In the case of Japan, for example, the Waste Recycling Governance Guidelines for Waste Generating Companies was formulated by the Waste and Recycling Subcommittee Environmental Committee Industrial Structure Council, The Ministry of Economy, Trade and Industry in 2004. Thirty five products were listed as targets of the guidelines, their producers were required to deal with their 3R (reduce, reuse, recycling). Fluorescent lamps, which contain glass, mercury, fluorescent powders, and other materials, are one of the products whose end-life management is affected by the implementation of the guidelines. Within this frame, the glass and mercury from the lamps are required to be recovered and recycled. However, other materials, such as fluorescent powders, are normally discarded without recycling.
In relation to recycling of rare earth fluorescent powders, several authors reported their separation for material recycling. In general, fluorescent powders can be recovered using different kinds of conventional extraction/separation methods, including (a) leaching [5] followed by regeneration [6], (b) dense-medium centrifugation [7], and (c) froth flotation [8]. Although the application of these methods can achieve good results, further increases in the grade and recovery could be of additional benefit. A review of previously reported recycling methods for rare earth fluorescent powders can be found, for example, in the articles of Wu et al., 2014 [9] and Tan et al., 2015 [10].
Two-liquid flotation has a proven ability to selectively separate a mixture of ultrafine particles (e.g., [11]). Due to the ultra-fine size of the fluorescent powders (e.g., several μm in this study), two-liquid flotation utilizing fine oil droplet with higher attraction to the hydrophobic particles can be a more suitable option than conventional froth flotation which significantly depresses the collision probability between air bubbles and particles whose sizes are finer than 20 μm (e.g., [12]). Within this frame, the authors suggested a two-liquid flotation method in order to achieve a better separation performance (i.e., higher grade and recovery).
In this article, previously reported flowsheets [13,14] developed for separating an artificial mixture of rare earth fluorescent powders (i.e., red, green, and blue) are reviewed and compared. Also, the mechanism study on the interaction between oil droplet and ultra-fine rare earth fluorescent particles is reviewed. This article aims to extract the science behind the separation of ultra-fine fluorescent powders by two-liquid flotation, and to provide some practical tips for engineering their recycling. The flowsheets were designed to recover each powder at a high grade because (1) the degree of deterioration of rare earth fluorescent powders from waste fluorescent lamps may differ among the powders, and (2) the mixing ratio of fluorescent powders used in the fluorescent lamps differs depending on lamp types. The potential uses of recovered powders include (1) rare earth fluorescent powders in the manufacturing process of new fluorescent lamps, and (2) as a secondary material in the manufacturing other products (e.g., light-emitting diodes (LEDs), polishing agents).
In this article, two proposed flowsheets of two-liquid flotation for rare earth fluorescent powders are reviewed and compared in terms of separation performance and mechanism. The two flowsheets used different solvents, i.e., (1) aqueous and non-polar organic (n-heptane) solvents, and (2) polar organic (N,N-dimethylformamide, DMF) and non-polar organic (n-heptane) solvents. In order to select the best separation method, the two flowsheets are also compared by evaluating the costs in connection with the separation of a three-component mixture of rare earth fluorescent powders (i.e., red, green, and blue).

2. Two-Liquid Flotation

Two-liquid flotation, also referred to as liquid-liquid extraction, is a mineral processing method for separating a mixture of ultra-fine particles (less than 10 μm) [11,15,16] by using two solvents with different polarities, i.e., polar and non-polar solvents in order to create two different phases and utilize their interface for separation. In addition, a surfactant is used for manipulating the wettability of the target component within the mixture [17]. As a result, the target particles can be attached to small droplets of non-polar solvent and move towards the interface of the two solvents, whereas the others stay in the polar solvent. At the end, they can be recovered separately.
During the separation process, after the mixture of particles is added into solvents with surfactant, they are shaken and allowed to settle. As a result, the hydrophobized target component of the mixture, agglomerated with non-polar oil droplets, migrates towards the non-polar phase, and remains at the interface of the two phases [18] where the collected component can then easily be recovered separately from the other components remaining in the polar phase.
The driving forces of this separation are: (1) the interaction forces between non-polar oil droplets and particles due to long-range intermolecular forces in the polar phase [19]. Their interactions can be described by DLVO (Derjaguin-Landau-Verwey-Overbeek) theory [18,20]: (2) the capillary forces that support the component captured at the interface due to the surface free energy created at the boundary of two phases [17,21]. The efficiency of two-liquid flotation is primarily affected by the following parameters: (a) particle characteristics, i.e., wettability [15], surface charge/zeta potential [13,14,20], and size of particle/aggregates [18,21]; (b) type of solvent [14]; (c) type of surfactant, i.e., ionic (cationic or anionic surfactant) or non-ionic surfactant; (d) surfactant concentration; and (e) solid concentration [13,14]. This method has been applied to recover a wide range of ultra-fine particles, including metal oxide (e.g., [22,23,24,25,26]), coal particles (e.g., [27]).
In the following sections, the application of two-liquid flotation to separate a fluorescent powder mixture will be revisited, and essential information will be summarized for extracting its science and engineering applications.

2.1. Experimental Procedure for Fluorescent Powder Separation

First, red, green, and blue fluorescent powders were mixed (mixing mass ratio = red:green:blue = 1:1:1, and solid concentration = 15 to 60 g/L). The powders were placed in a 30 mL squibb separatory funnel and then mixed with two solvents with different polarities, i.e., 10 mL of polar solvent (e.g., DMF) and 10 mL of non-polar solvent (e.g., n-heptane) in the presence of surfactant (e.g., dodecyl amine acetate (DAA)), and shaken for a certain period (e.g., 2–5 min). The whole system was then settled and, powders at the two phase interface and remained in the polar phase were separately collected. At each stage of separation, the volumetric ratio of non-polar and polar solvents was maintained at a certain ratio (e.g., 1:1 to 1:5) [13,14]. Further details will be given in the Section 3 and Section 4 specific to two different flowsheet designs.

2.2. Analysis and Evaluation of Results

The collected products were dissolved using aqua regia. The solution was then analyzed by using inductively coupled plasma-atomic emission spectrometry (ICP-AES; Seiko Instruments SPS-3000, Chiba, Japan). With the chemical components of fluorescent powders identified by X-ray diffraction (XRD), the contents of each component were reconciled to determine the mass of each powder recovered. The recovery, grade and separation efficiency were calculated to evaluate and discuss the separation performance [13,14]. In order to calculate the efficiency of a process for separating a three-component mixture, the Equation (1) given by Dodbiba et al. (2005) [28] was extended and used [13]; see Equation (2):
Efficiency = [ ( M a ( 1 ) M a ( i ) ) × ( M a ( 1 ) M 1 ) ] × 100 %
Efficiency = [ ( M a ( 1 ) M a ( i ) ) × ( M a ( 1 ) M 1 ) ] × [ ( M b ( 2 ) M b ( i ) ) × ( M b ( 2 ) M 2 ) ] × [ ( M c ( 3 ) M c ( i ) ) × ( M c ( 3 ) M 3 ) ] × 100 %
in Equations (1) and (2), Ma(1) is the mass of material a in the output stream 1; Ma(i) is the mass of materials a in the feed; and M1 is the mass of the output stream 1.
In the following Section 3 and Section 4, two different flowsheets developed for applying two-liquid flotation to separate a mixture of fluorescent powders for material recycling is reviewed and summarized. The primary difference between the two developed flowsheets is the solvents used. Flowsheet 1 used water that has been commonly used in two-liquid flotation (e.g., [29]) as a polar solvent while flowsheet 2 used N,N-dimethylformamide (DMF) as a polar solvent based on the solvent selection [14].

3. Flowsheet 1: Two-Liquid Flotation Using Aqueous and Organic Solvents (Aqueous-Organic System)

3.1. Materials

Table 1 shows the chemical compositions of pure fluorescent powder samples used in the flowsheet 1 and analyzed by ICP-AES (Seiko Instruments Inc., Tokyo, Japan, SPS 3000) after acid digestion. The samples were commercial fluorescent powder products widely applied to fluorescent lamps and low voltage displays. The powders contained a variety of rare earth metals, such as yttrium (Y), europium (Eu), and cerium (Ce). The fluorescent in water showed negative zeta potential at pH values from 2 to 12 (Figure 1). Particle size of the powders was in the range from 1 to 10 μm, and their average particle sizes were under 5 μm. The measured specific gravities of the powders using a pycnometer were 4.30 (red), 4.06 (green), and 3.51 (blue), respectively [13].

3.2. Flowsheet Design

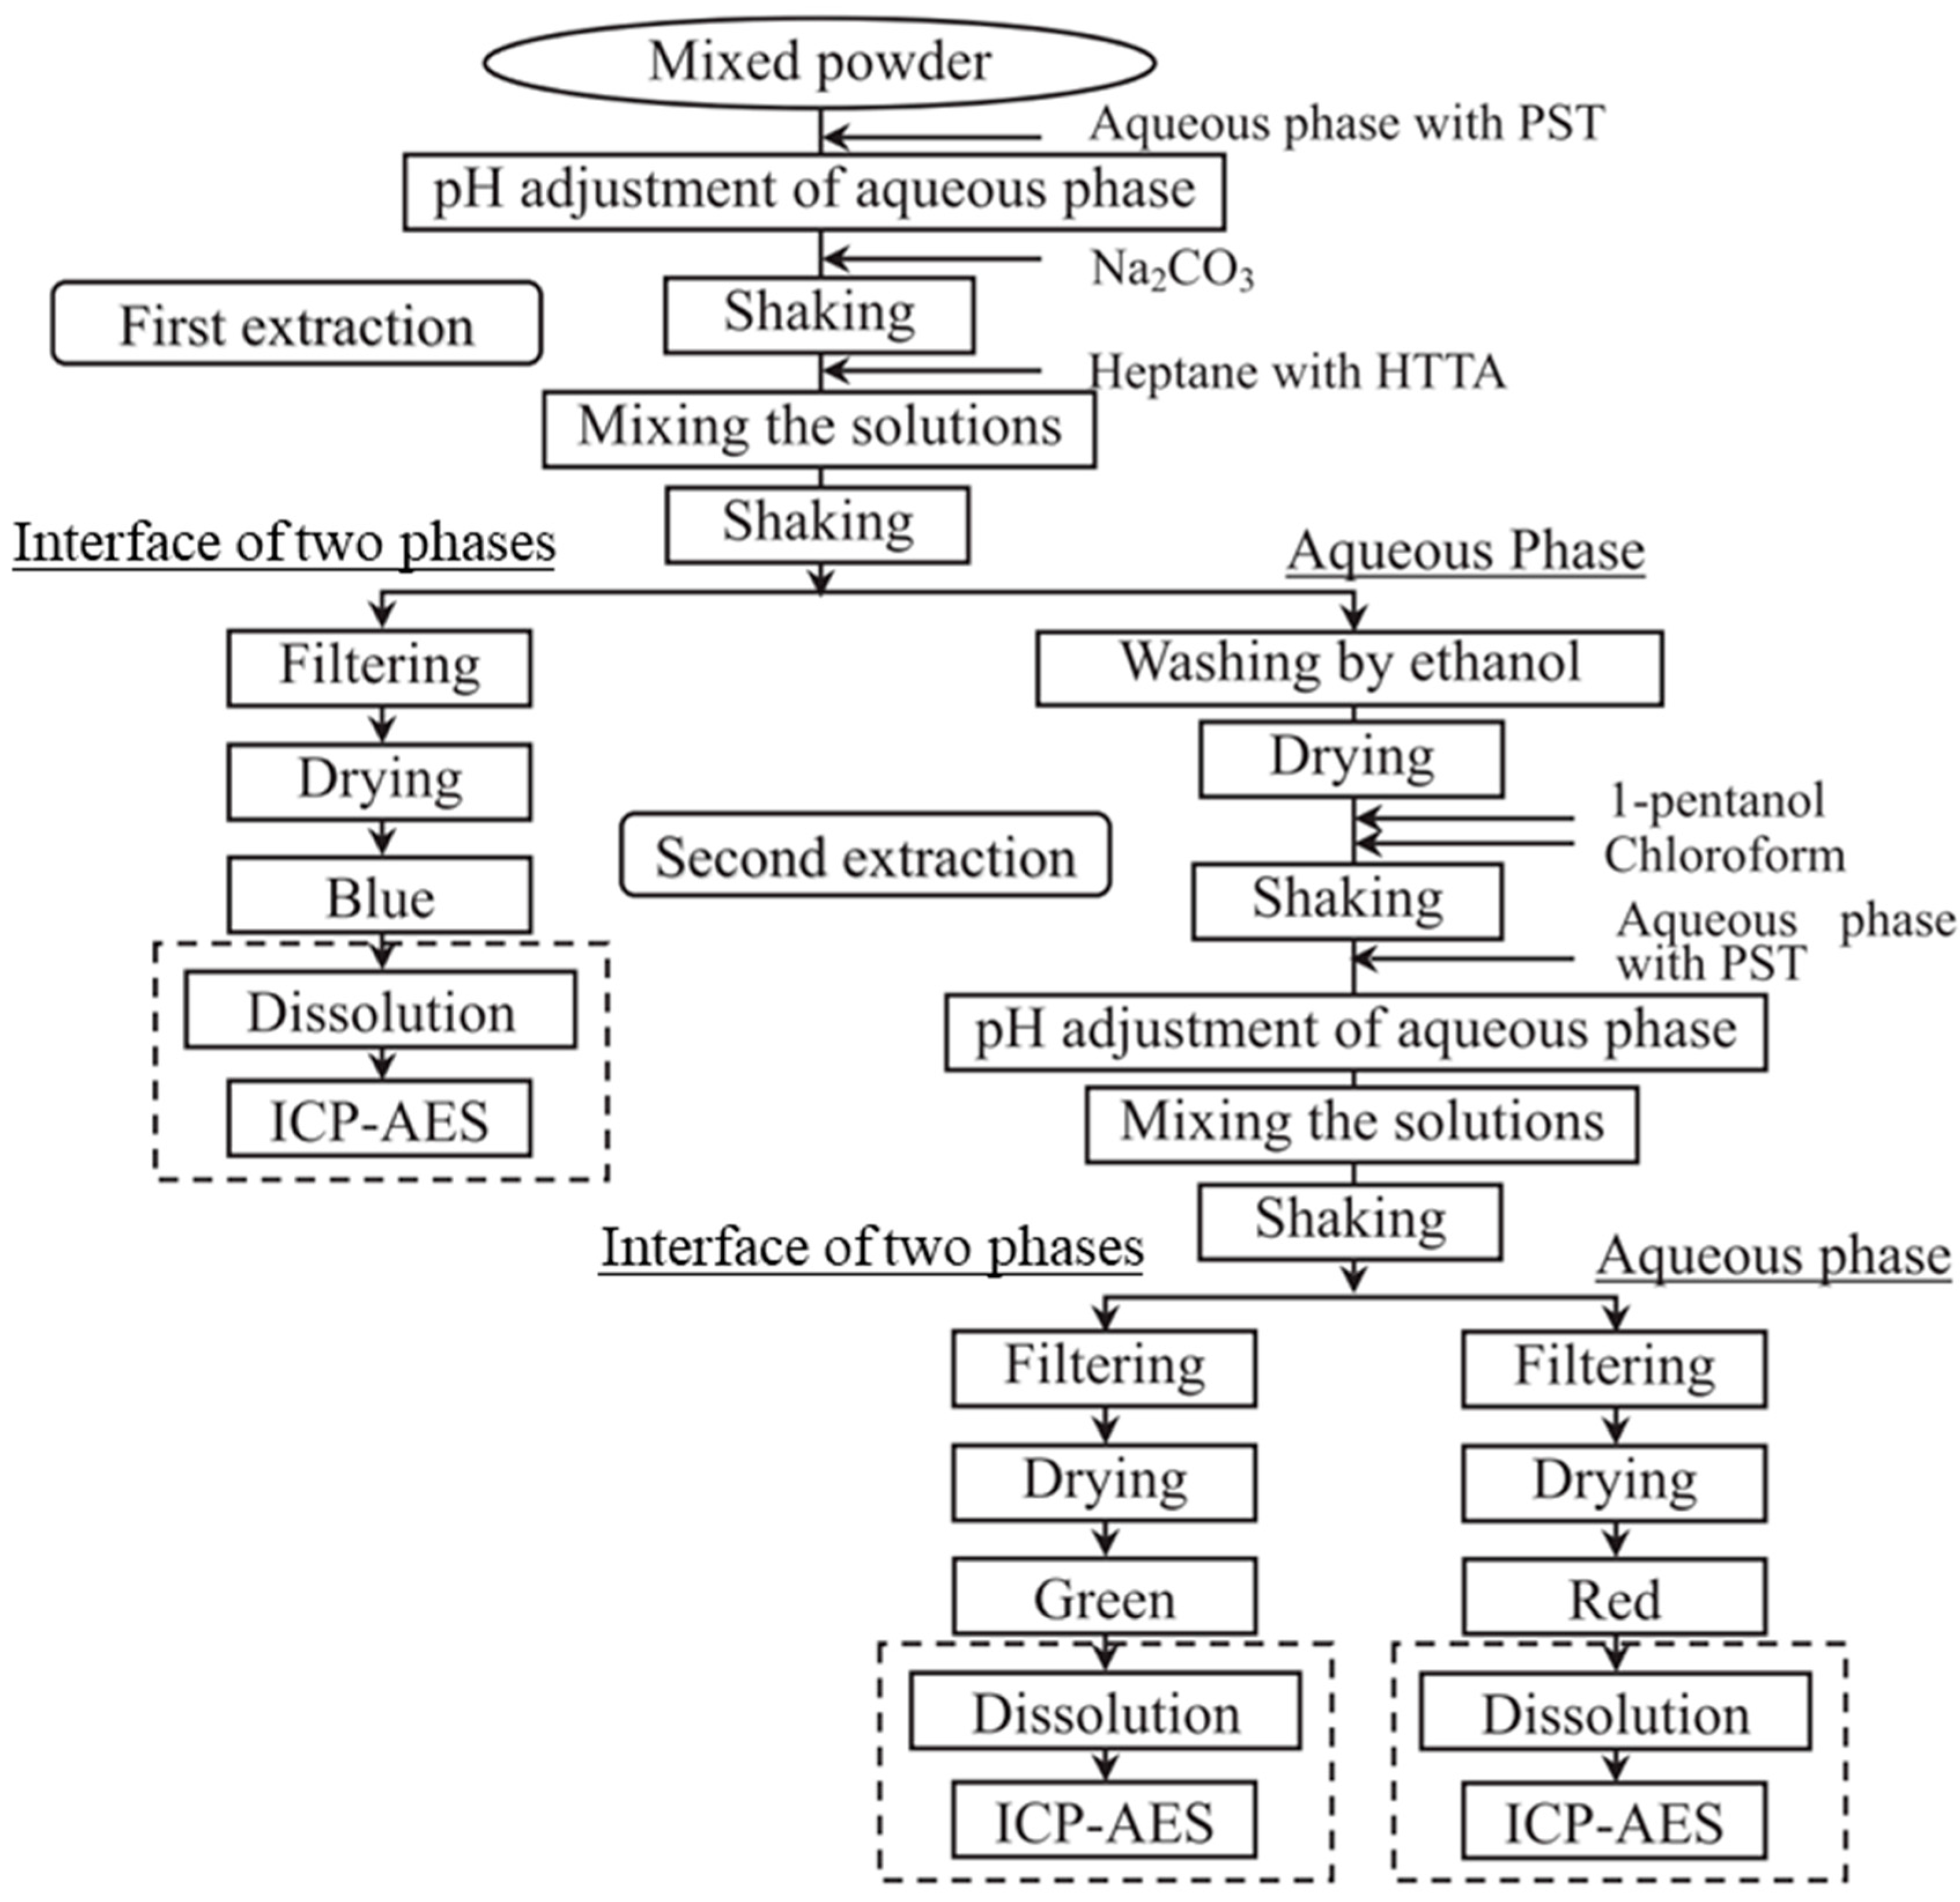
Flowsheet 1 for separating three types of fluorescent powders with the aqueous-organic system is shown in Figure 2. Prior to the separation, the three fluorescent powders, i.e., red, green, and blue were mixed. Surfactants, potassium sodium tartrate tetrahydrate (PST, KNaC4H4O6·4H2O) of analytical grade and 2-thenoyltrifluoroacetone (HTTA, CF3COCH2COC4H3S) of purity over 98% were dissolved in the aqueous phase and the n-heptane (C7H16) phase, respectively, with the application of sonication. The aqueous phase pH was adjusted by using HCl, Na2CO3 or NaOH. After the fluorescent powders were mixed with the aqueous phase and shaken for 1–2 min, the n-heptane phase was introduced. The volumetric ratio of the n-heptane and aqueous phase was maintained at 2:3. The solution consisting of two phases was shaken at the room temperature for 5 min. After settling the two phase mixture, the blue powder was reported at the interface of the two phases. The green and red powders remained in the lower phase (aqueous). The green-red mixture was washed by 99.5% ethanol to remove HTTA attached to the powders. The second separation stage for the remaining powders was conducted using two phases, the chloroform phase containing 1-pentanol as an oil droplet stabilizer and the aqueous phase containing dissolved PST as a depressant. After the green-red mixture was mixed with the chloroform phase and shaken for 1 to 2 min, the aqueous phase was added. The volumetric ratio of chloroform and aqueous phase was tested in between 1:1 and 1:5. The two phase mixture was shaken at room temperature for 5 min. The green powder was then reported at the chloroform-aqueous interface and separated from the red powder remaining in the aqueous phase. The powders collected at each step were analyzed using ICP-AES after the acid digestion of the powders.

3.3. Results from the Flowsheet 1 (Aqueous-Organic System)

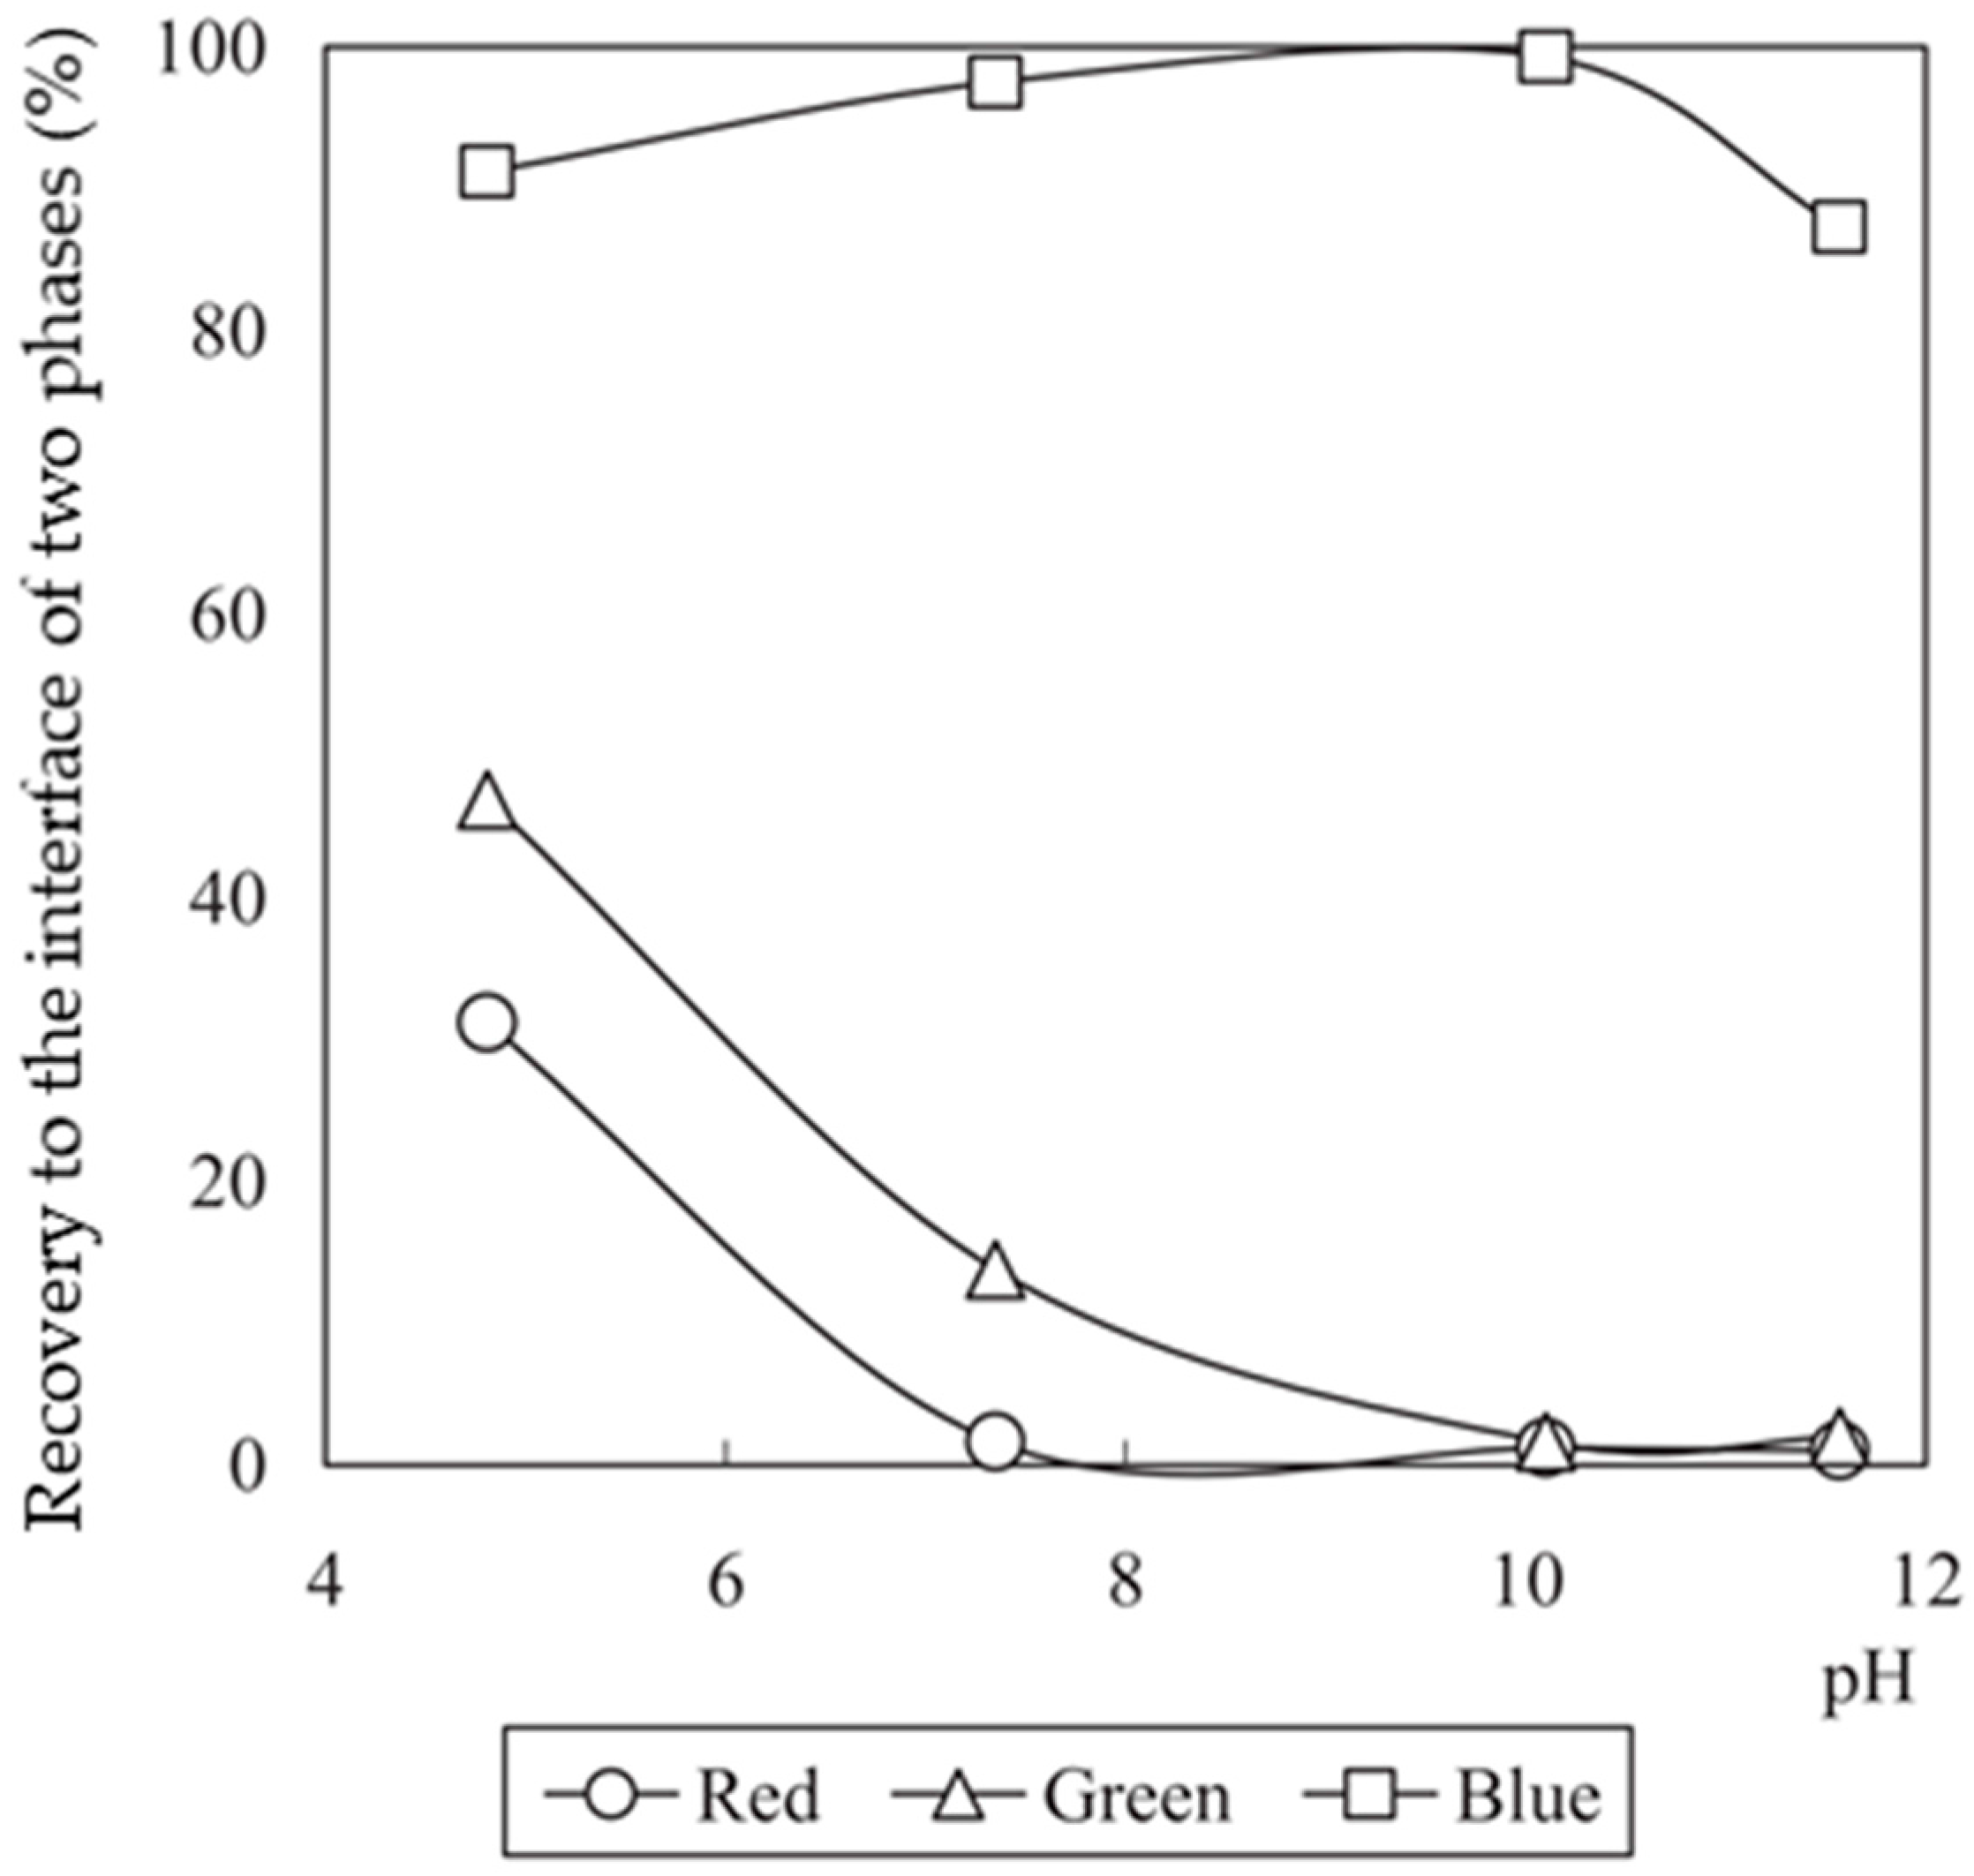
In flowsheet 1, firstly, the effect of the aqueous phase pH (Figure 3) on the fluorescent powder separation performance was investigated. The blue fluorescent powder was most selectively reported at the heptane-aqueous interface at pH 10. Its maximum recovery was almost 100%. The red and green powders had, on the other hand, almost no recovery at the heptane-aqueous interface at this pH.
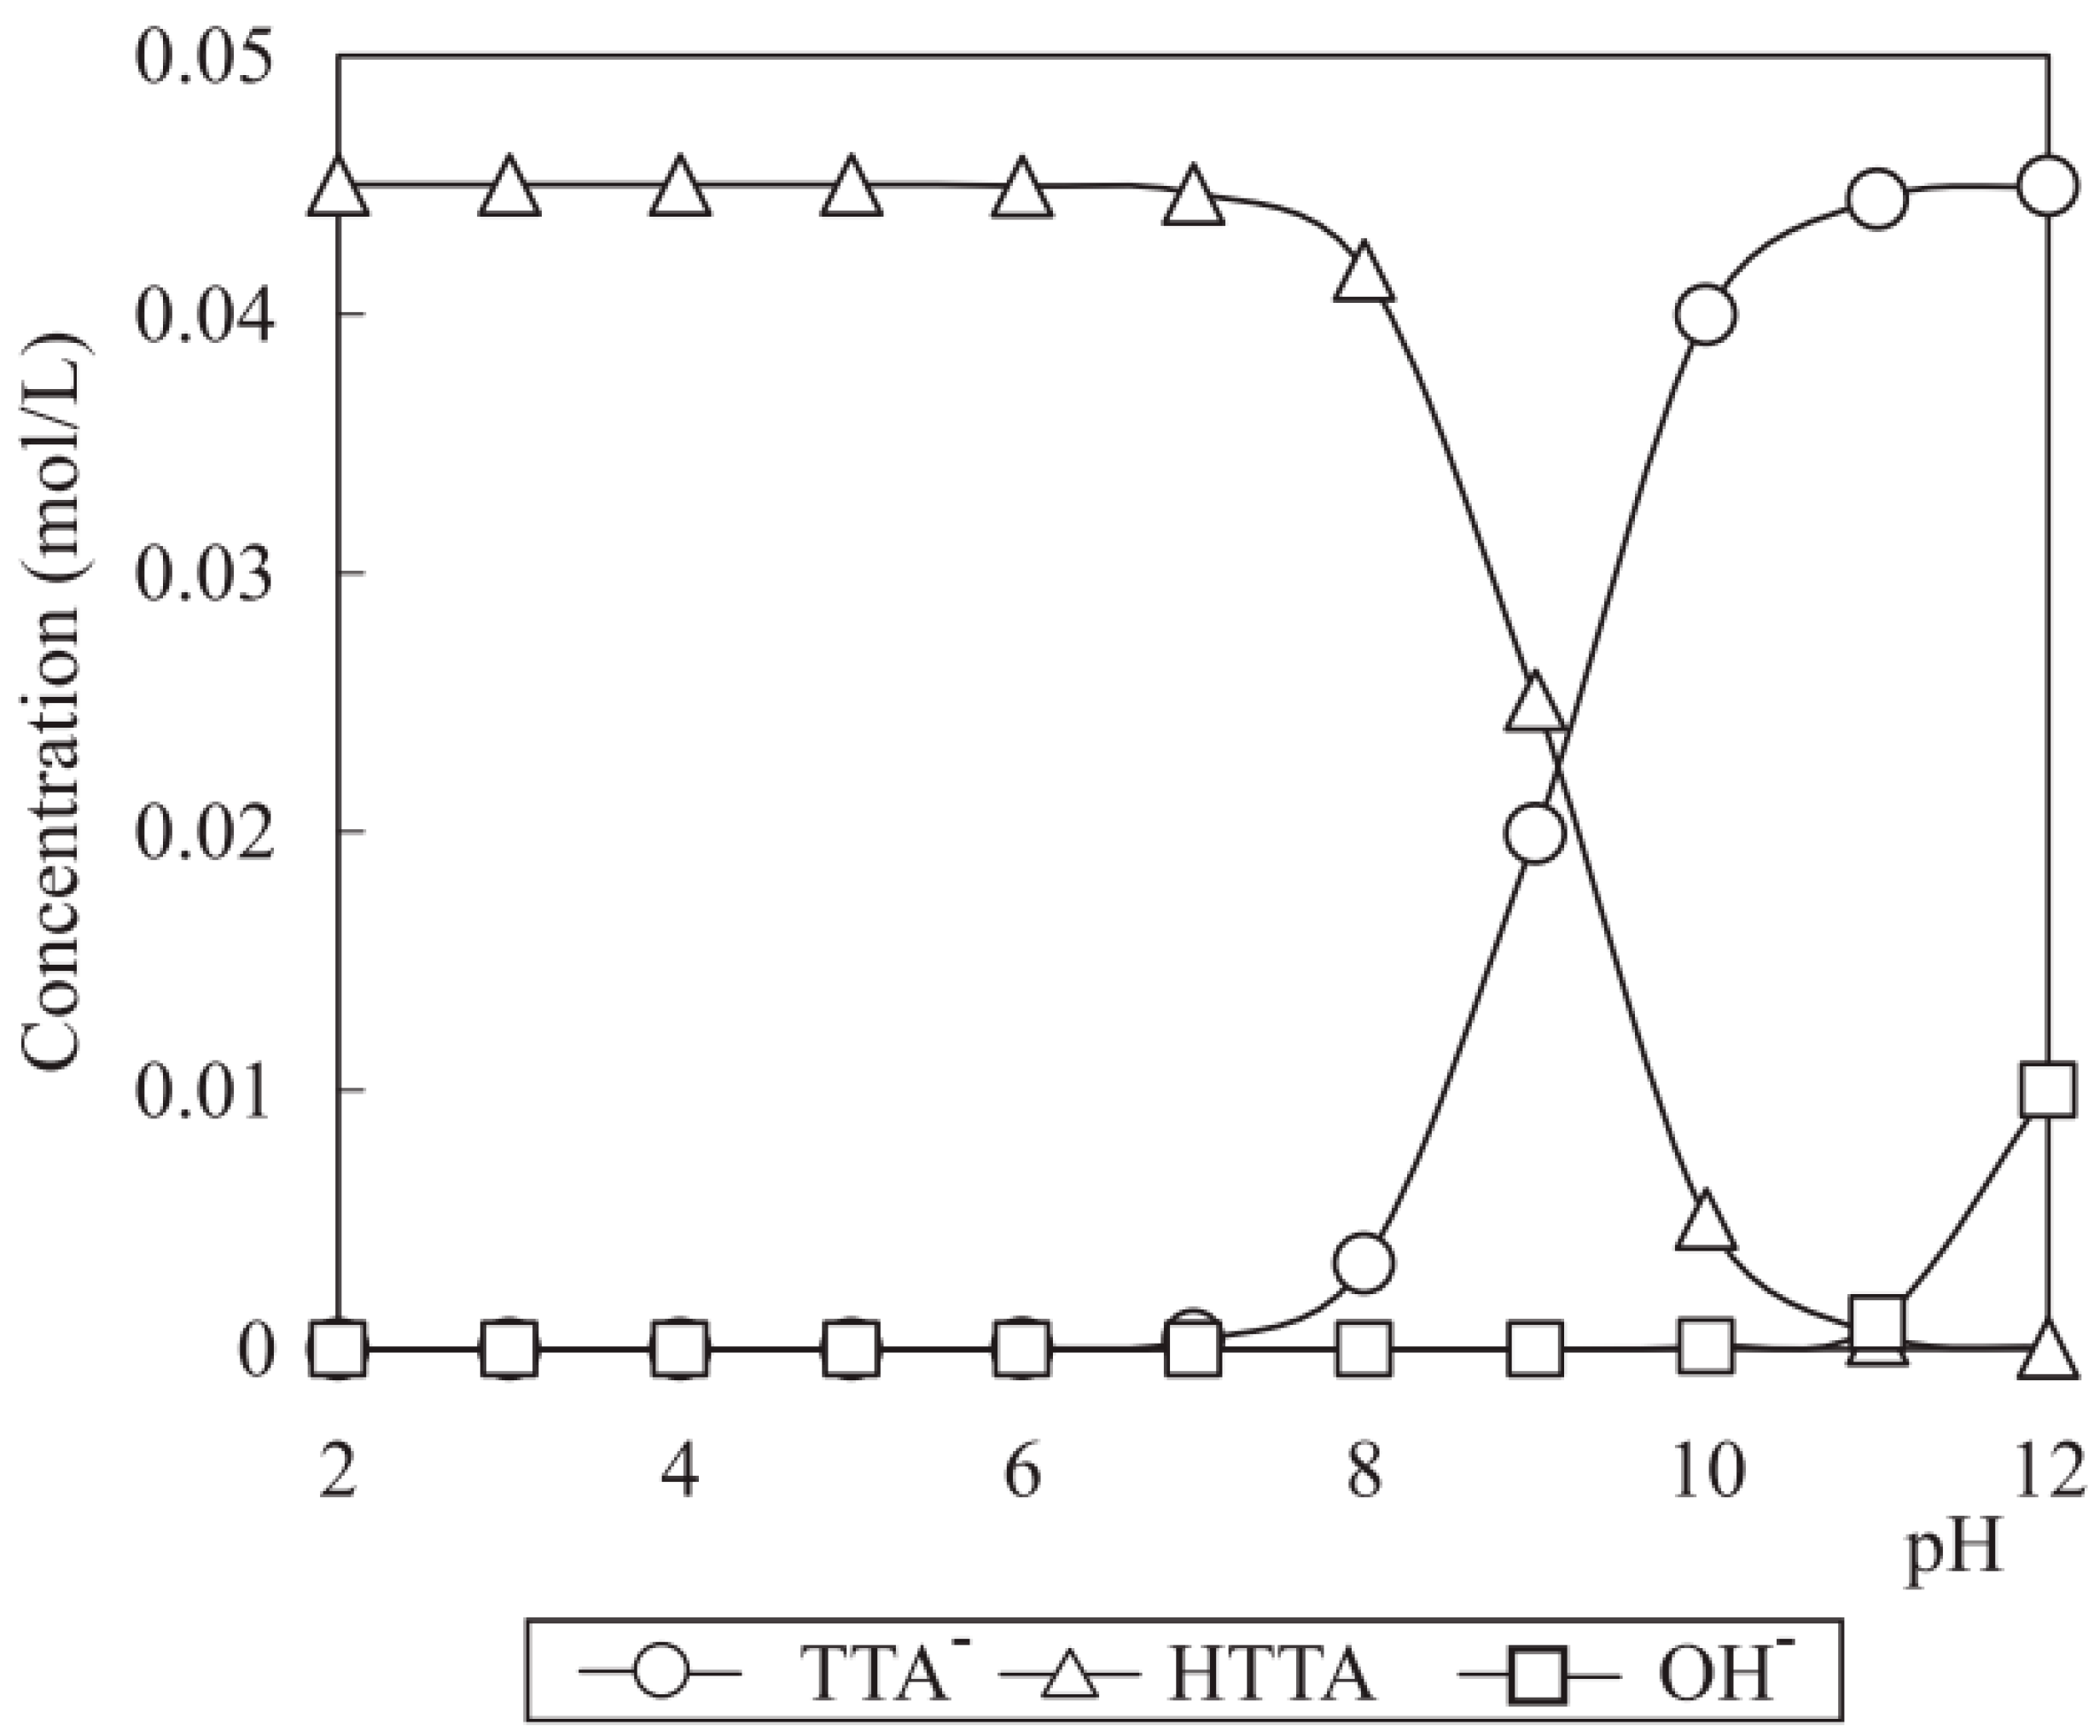
In order to explain this separation result that the blue powder was selectively recovered with HTTA as a surfactant, Otsuki et al. (2006-a) [13] calculated the concentration of HTTA species, [HTTA] and [TTA], as well as [OH] which is abundant in the aqueous solution and competitive to TTA, as a function of the aqueous solution pH. The following reaction was considered to occur in the solution containing the total concentration Cα of HTTA [30]:
HTTA H + + TTA
K a = [ H + ] [ TTA ] [ HTTA ] = 7.94 × 10 10
Figure 4 shows the calculated concentration of HTTA species and hydroxyl ion as a function of pH. At pH below 8, the concentration of reactive HTTA species, TTA is considerably smaller than the concentration of the non-reactive form HTTA. Even the blue powder possesses Al3+ ion and Ba2+ ion on its surface; it did not strongly attract TTA due to its low concentration and thus the powder did not obtain enough floatability with small/no surface hydrophobicity enhancement. At pH above 8, TTA becomes abundant in the solution and is attractive to the Al3+ ion and Ba2+ ion of the blue powder due to electrostatic interaction. This resulted in high floatability of the blue powder due to increase in the surface hydrophobicity given by the adsorption of TTA. Especially, Ba2+ ion would be one of the most abundant ions dissociated from the blue powder, and was reactive to the TTA at higher than pH 8 and thus made the blue powder surface hydrophobic based on its adsorption.
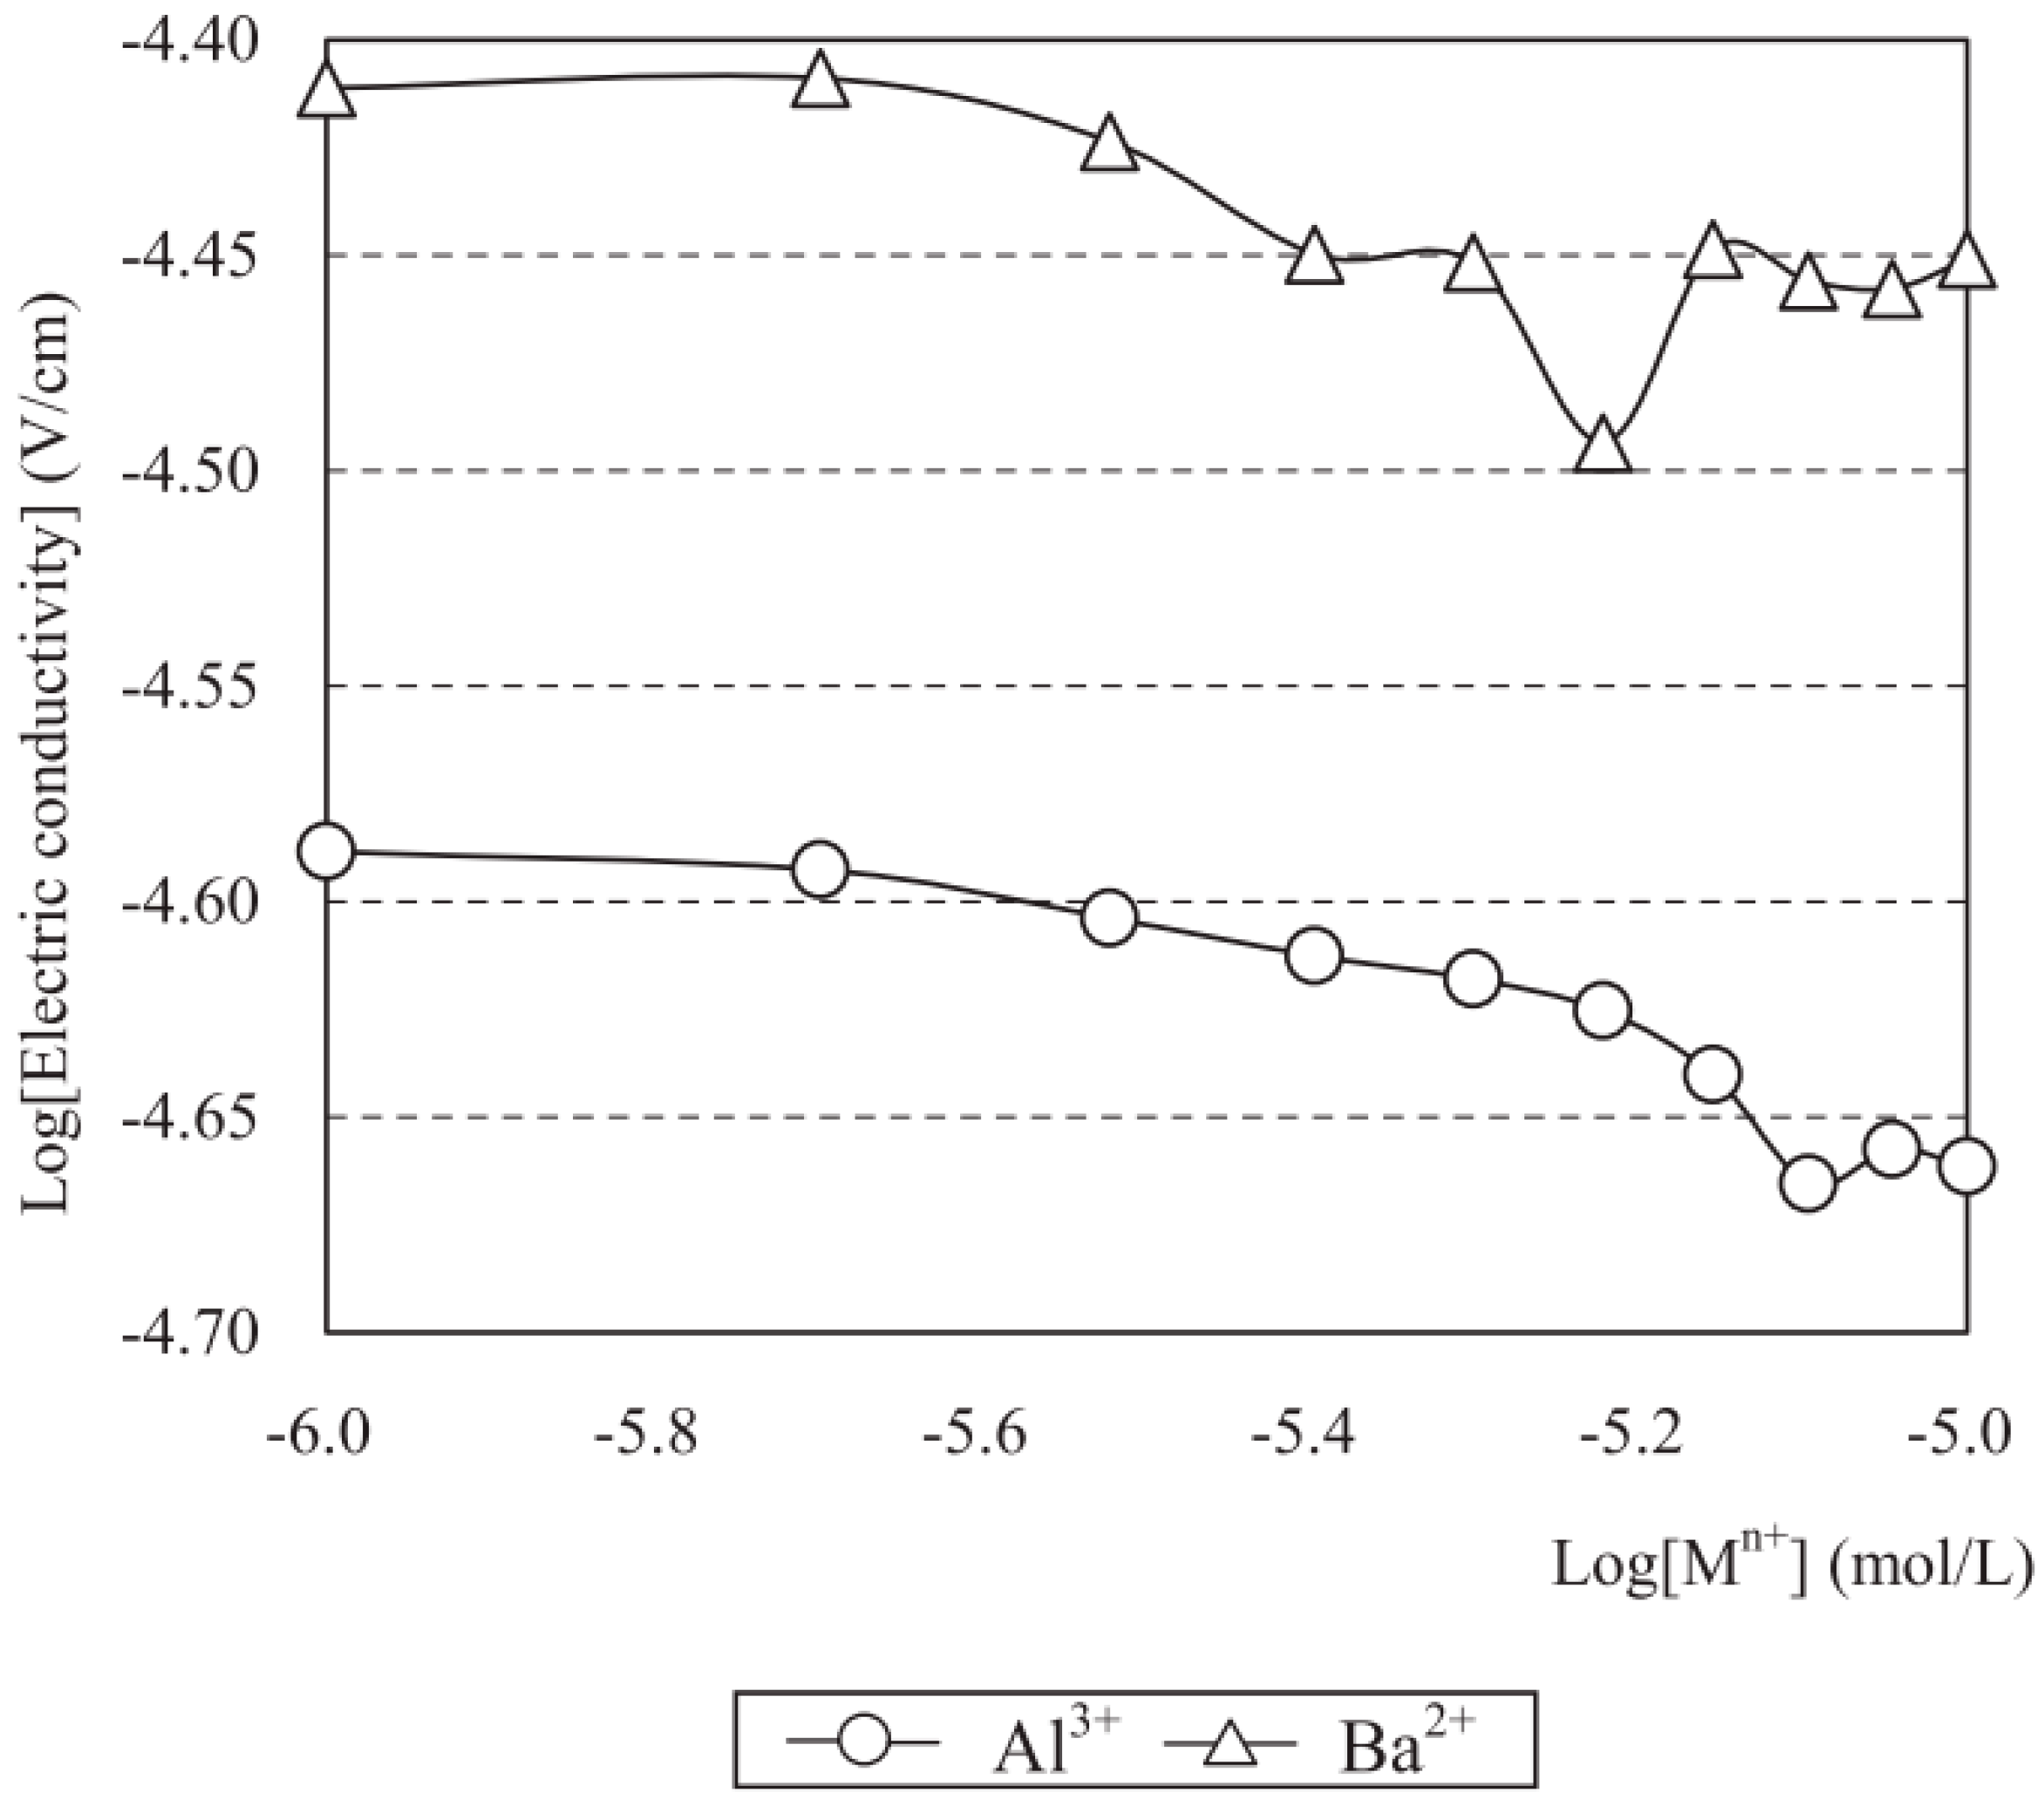
The electric conductivity of the aqueous solution containing HTTA at pH10, the optimum pH for the recovery of blue powder (Figure 3), was measured as a function of Al3+ ion and Ba2+ ion concentration, to investigate the HTTA adsorption onto the powder by evaluating the formation of the insoluble salt of TTA with Al3+ ion and Ba2+ ion. Figure 5 shows that both Al3+ ion and Ba2+ ion formed an insoluble salt with TTA. It is explained by the decrease in the electrical conductivity up to a certain metal ion concentration (Al3+ concentration: 8.0 × 10⁻⁶ mol/L; Ba2+ concentration: 6.0 × 10⁻⁶ mol/L) and then increased. When HTTA concentration is smaller than that threshold concentration, about 1 × 10⁻⁵ mol/L, TTA formed an insoluble salt with Al3+ ion or Ba2+ ion, and the formation of the insoluble salt decreased the electrical conductivity due to the decrease in ion concentration. At that threshold concentration, although a certain amount of Al3+ ion or Ba2+ ion can be changed to Al(OH)3 (Ksp = 4.6 × 10⁻³³) [31] or Ba(OH)2 (Ksp = 9.7 × 10⁻⁴) [32], the electron numbers of TTA and the proton numbers of Al3+ ion or Ba2+ ion were almost balanced. Therefore, the decrease in the electric conductivity was stopped. Higher than that threshold concentration, TTA could not form an insoluble salt with Al3+ ion or Ba2+ ion due to the existence of very limited TTA other than the insoluble salt in the aqueous solution, and the excess Al3+ ion or Ba2+ ion increased the electrical conductivity. At pH above 11, the hydroxyl ions, which compete with TTA to react with Ba2+ ion, are abundant in the aqueous solution. The competitive adsorption limits the adsorption of TTA- onto the blue powder and thus depresses the floatability of the blue powder to the heptane-water interface. Thus, the separation performance of the blue powder is depressed higher than pH 11.
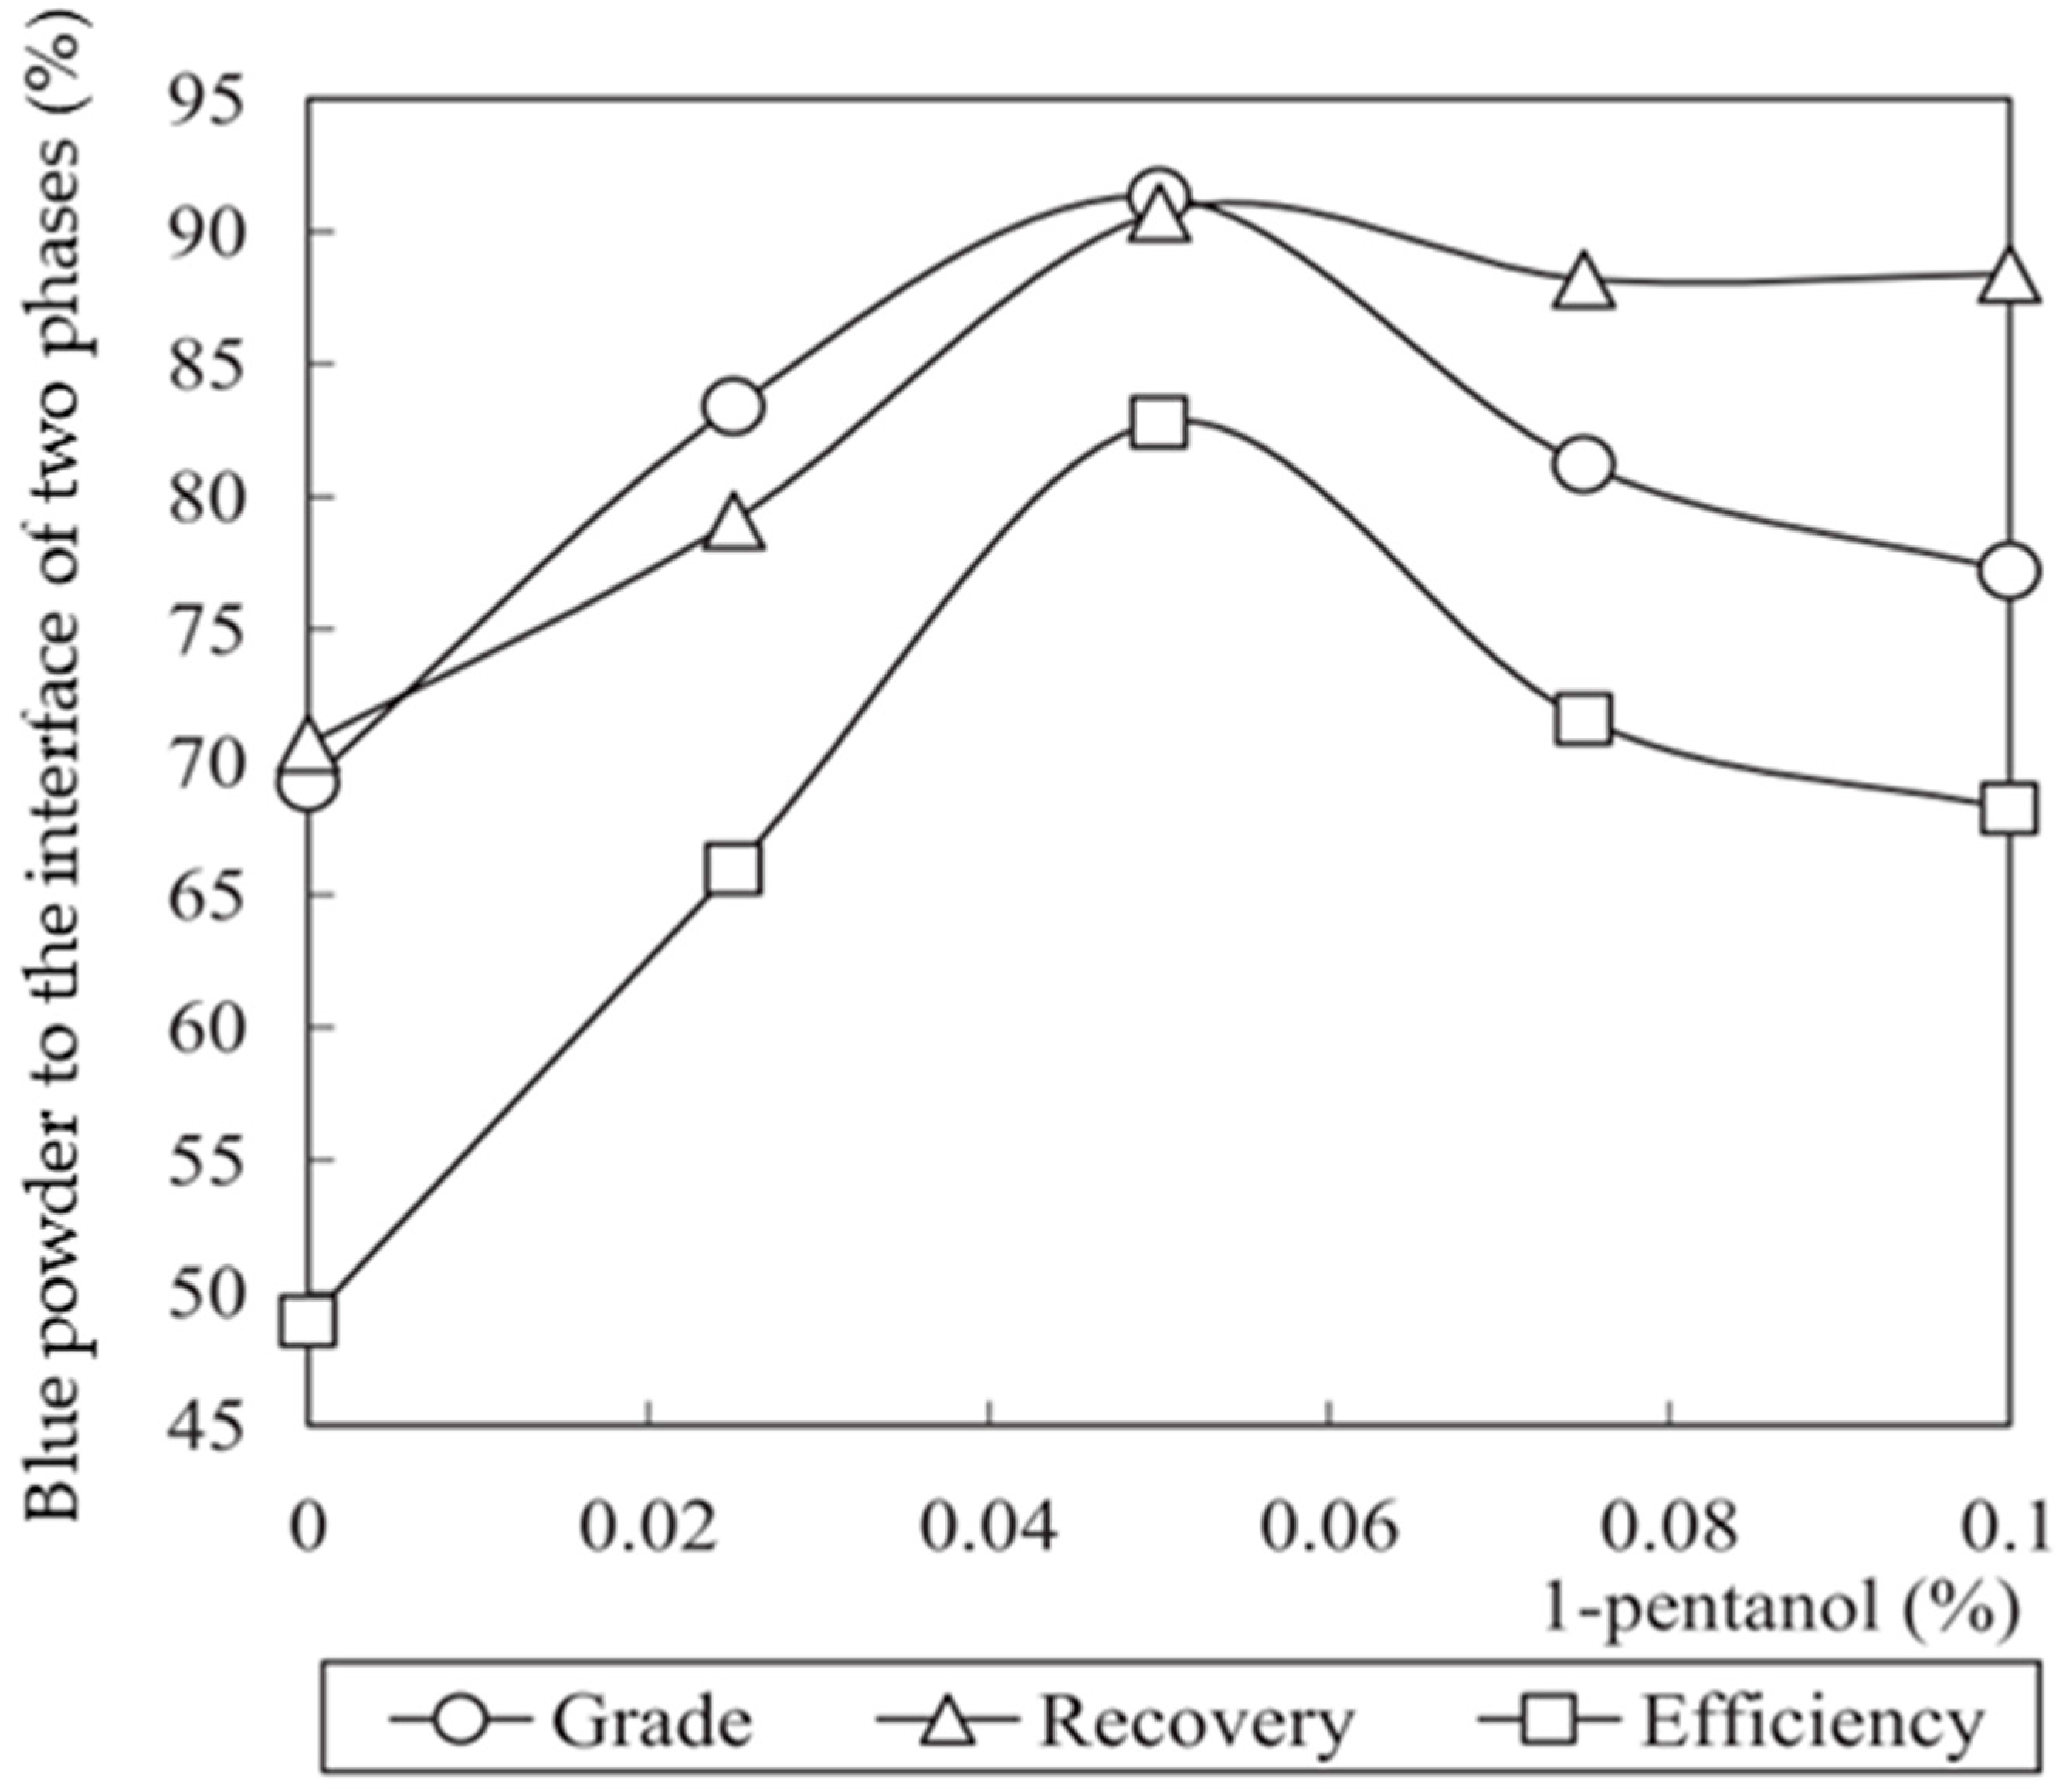
Second, the effect of emulsifier 1-pentanol concentration on the blue fluorescent powder recovery was studied (Figure 6). 1-Pentanol (C5H12O) affects the recovery of the fluorescent powders and the best result was achieved at 0.05% of 1-pentanol with the separation efficiency of 82.8%. 1-Pentanol acted as a stabilizer, which emulsified and stabilized the heptane droplet dispersed in the aqueous phase because hydroxyl ion of 1-pentanol was attracted to the water molecule while the hydrocarbon group of 1-pentanol had an attraction to the heptane molecule. On further increasing the 1-pentanol concentration to 0.1 wt%, the grade and recovery of the blue powder decreased to 77% (from 90% at 0.05 wt%) and 88% (from 89% at 0.05 wt%), respectively. The stability of heptane droplets increased with increasing the 1-pentanol dosage. Increasing the stability of heptane droplets contributed to the excess heptane droplets in the aqueous phase effectively colliding heptane droplets with the red and green powders as well as blue powder, which was aimed to be attracted with heptane droplets and moved towards the heptane-aqueous interface. However, increasing the 1-pentanol concentration higher than its optimum concentration (i.e., 0.05 wt%) increased the amounts of red and green powders entrapped to the heptane-aqueous interface, and decreased the grade and recovery of the blue powder reported at the heptane-aqueous interface.
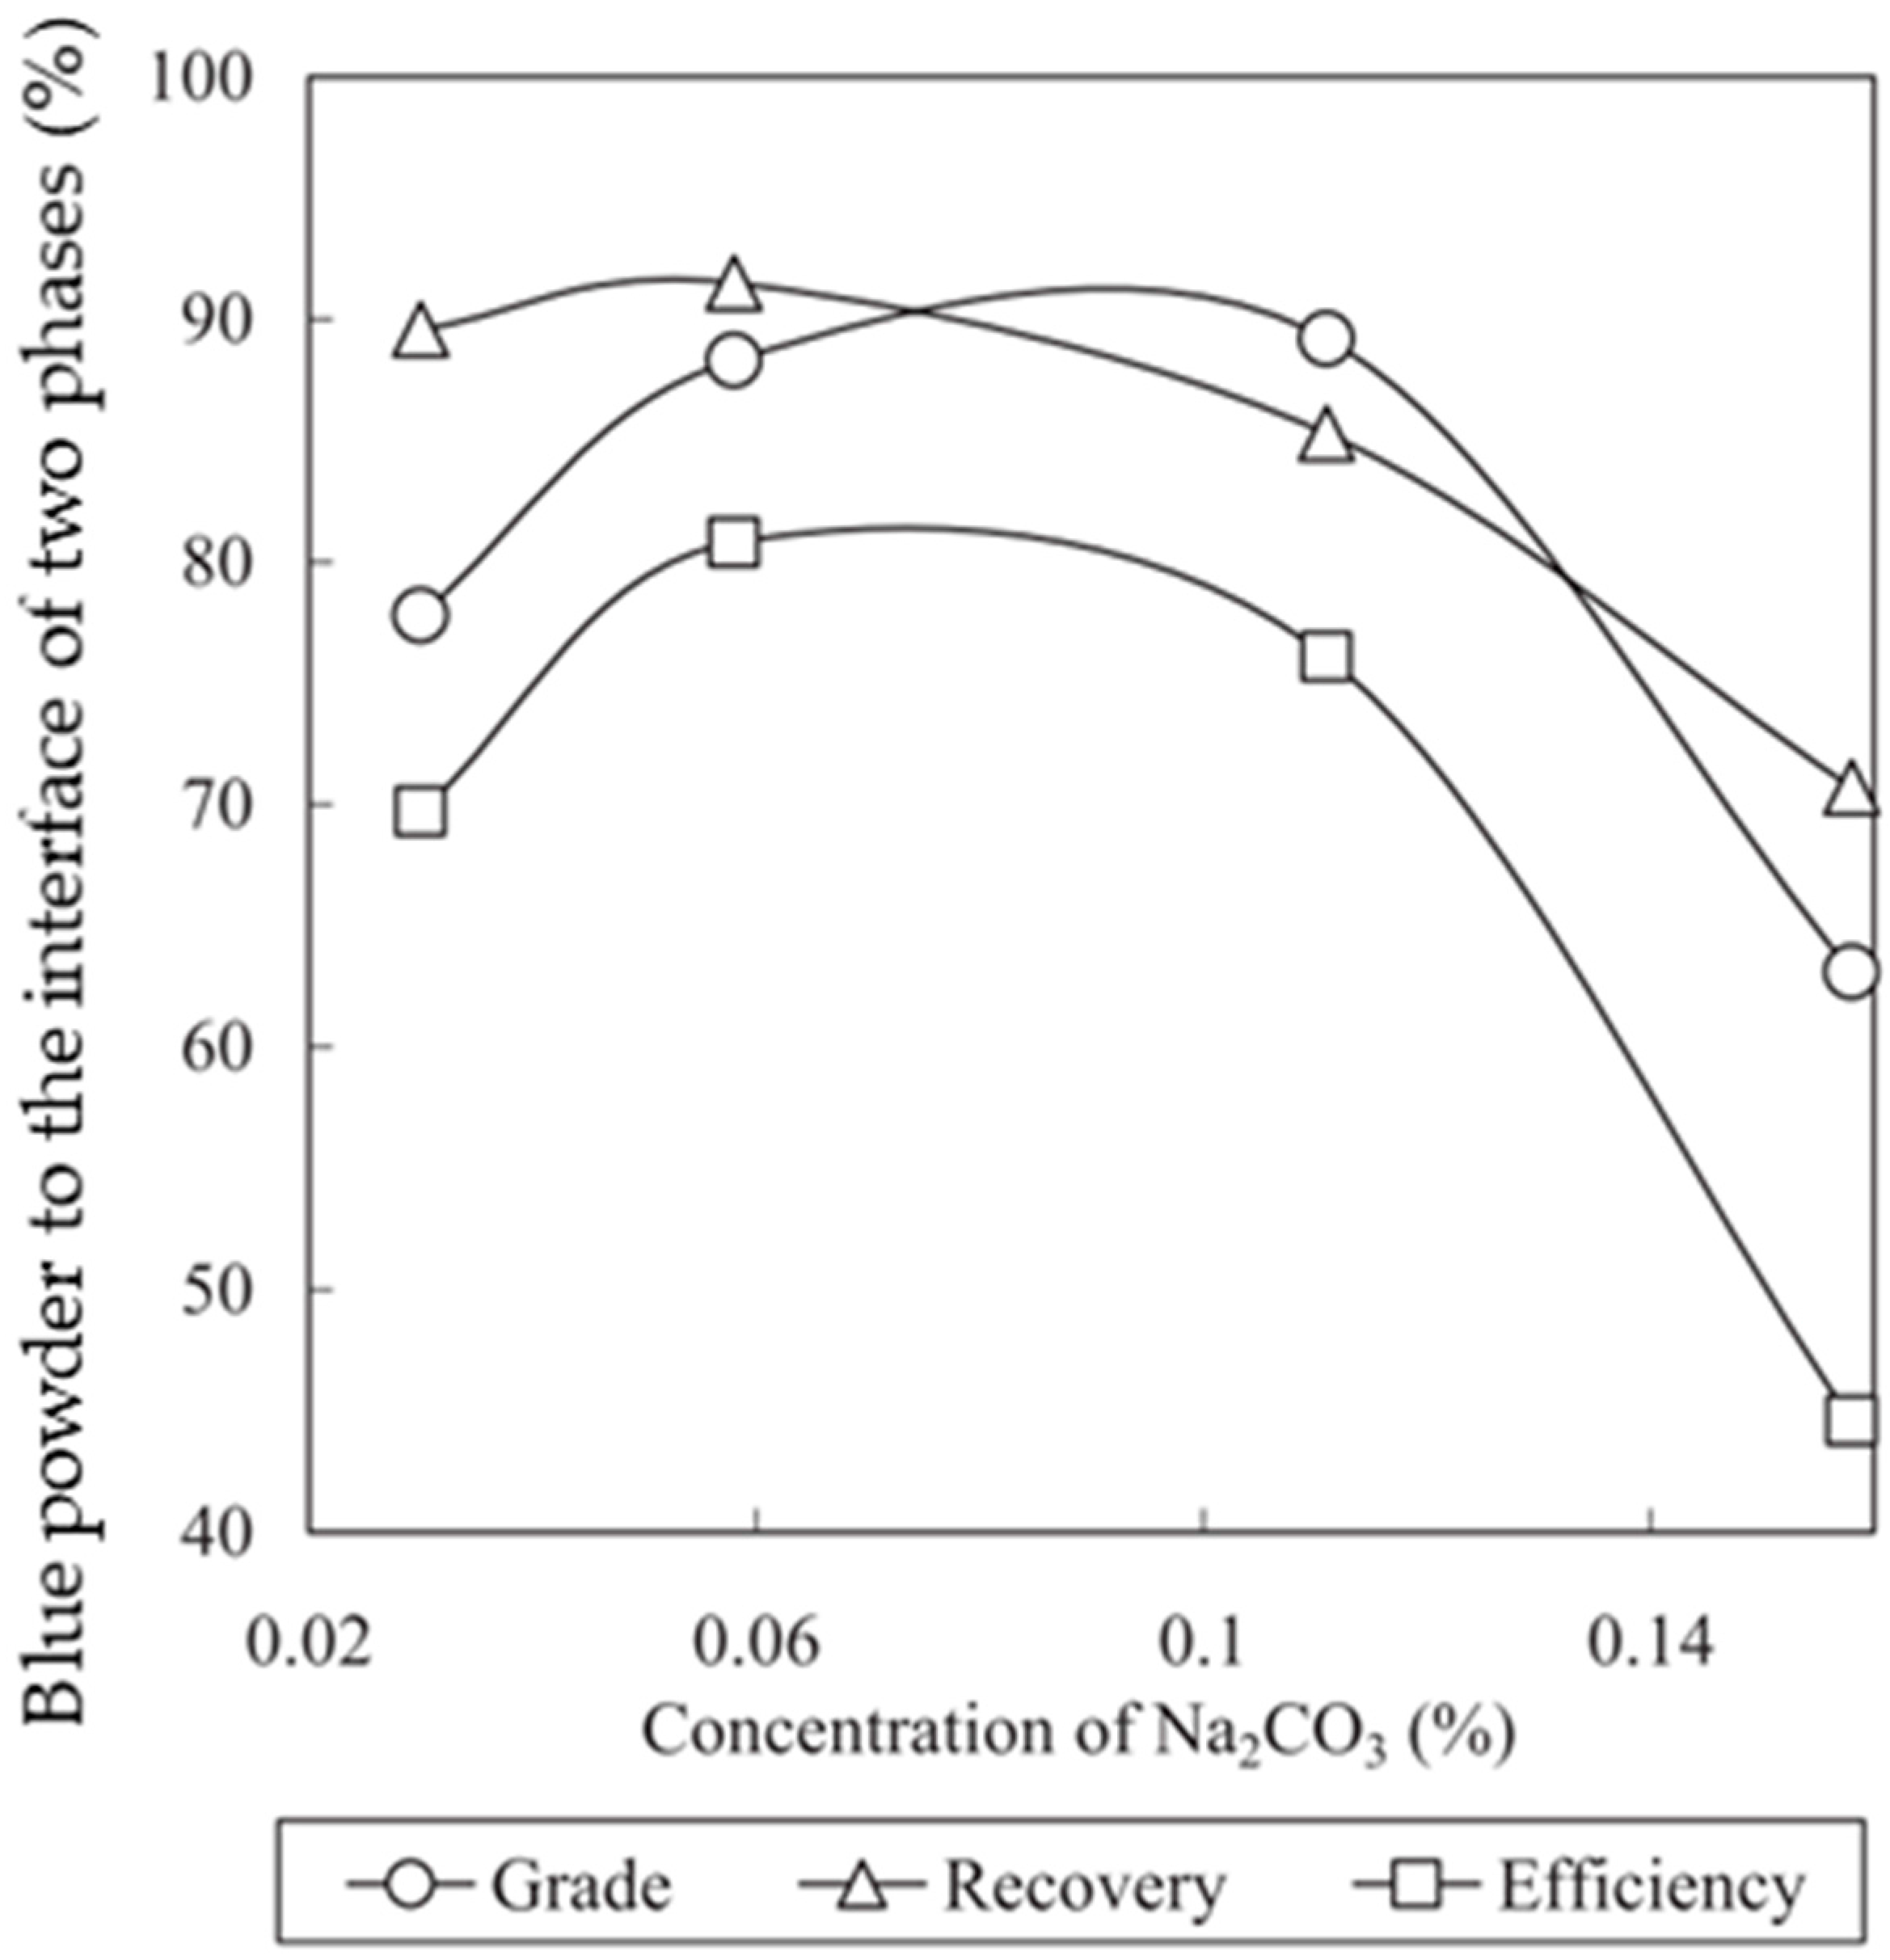
Third, the effect of Na2CO3 concentration on the blue fluorescent powder recovery was studied (Figure 7). As a buffer solution, the Na2CO3 concentration is very important to maintain the aqueous solution pH constant. The carbonate ion, CO32−, is a much stronger base (Kb = 1.8 × 10⁻⁴) than the HCO3 ion (Kb = 2.3 × 10⁻⁸) [33] and can firmly stabilize the solution pH that is critical for the particle recovery by two-liquid flotation to ensure the collector adsorption. When the Na2CO3 concentration was between 0.03% and 0.16%, the aqueous solution pH remained stable around 10.3. However, the separation performance of the blue fluorescent powder changed significantly within that Na2CO3 concentration range. The reasonable Na2CO3 concentration identified was 0.06%. The Na2CO3 concentration varied the concentration of HTTA species that affect the separation performance as discussed above. Calculation of the aqueous solution pH at various Na2CO3 concentrations was conducted using the following steps [34] in order to estimate/calculate the concentration of HTTA species at different Na2CO3 concentrations, and thus to explain its effect on the separation results:
[ H + ] [ A 2 ] [ HA ] = K a 2 = 6 × 10 11
where A is acid concentration, Ka2 is the second acid dissociation constant of Na2CO3. Assuming that the total concentration of Na2CO3 is C and the generation rate of HA is α, the following relationships are given:
[ A 2 ] = C ( 1 α ) ,   [ HA ] = C α ,   [ OH ] C α
The formation reaction can be described below:
A 2 + H 2 O HA + OH
Then, the first base dissociation constant (Kb1) is now given as follows:
[ HA ] [ OH ] [ A 2 ] = C 2 α 2 C ( 1 α ) = C α 2 1 α = K b 1 = K w K a 2
α = K w + K w 2 + 4 C K a 2 K w 2 C K a 2
[OH] = Cα
pOH = −log[OH]
pH = Kw − pOH
where Kw is the dissociation constant of water. By solving Equations (5), (9)–(12), the aqueous solution pHs at 0.03%, 0.06%, 0.11%, and 0.16% of Na2CO3 were determined as 10.8, 11.0, 11.1, and 11.2, respectively. The aqueous solution pH affects the concentration of HTTA species (i.e., HTTA, TTA) and hydroxyl ion (OH) (Figure 4). At pH below 11, the recovery of the blue powder containing Ba2+ ion using a chelating agent HTTA was successfully achieved due to the considerably low concentration of hydroxyl ion. At pH above 11, the concentration of hydroxyl ion gradually increases up to about 20 wt% of TTA, and competes with TTA to attract Ba2+ ion. Under such conditions, the competitive adsorption limited the floatability of the blue powder towards the water-heptane interface, and thus the recovery and grade of the blue powder was depressed.
The overall separation results are given in Table 2, showing the grade of red and green products was higher than 90% while the one of blue product was lower than 90% (i.e., 74%).

4. Flowsheet 2: Two-Liquid Flotation Using Organic Solvents (Organic-Organic System)

4.1. Materials

The sample used in this part was a mixture of three fluorescent powders (i.e., red, green, and blue powders), which are widely used in the manufacturing of fluorescent lamps [1]. Table 3 shows the chemical composition and content of red, green, and blue powders determined by ICP-AES combined with the assistance from the XRD component identification. The powders contained a variety of rare earth elements, such as yttrium, lanthanum, and strontium.
The number particle size distribution of the fluorescent powders was determined by analyzing a series of images taken with scanning electron microscopy (SEM). The average particle sizes of fluorescent powders varied from 1.1 to 2.6 μm [14].
In this flowsheet, (a) n-heptane (C7H16) as a non-polar solvent and (b) N,N-dimethylformamide [DMF, (CH3)2NCHO] as a polar solvent were used to create their interface (Table 4). Selection of the solvents was discussed and reported in a previous publication [14] and its summary is given in the following sections.
During the two-liquid flotation of the fluorescent powders, two different surfactants were tested: (1) dodecyl amine acetate (DAA), CH3(CH2)11NH2.CH3COOH, a cationic surfactant; and (2) sodium 1-octanesulfonate, CH3(CH2)7SO3Na, an anionic surfactant. DAA was selected because the fluorescent powders exhibited negative zeta potentials in both n-heptane and DMF (Table 5). Sodium 1-octanesulfonate, on the other hand, was selected because the blue powder is composed of Ba2+ (Table 3), which can interact with the SO24− ion of sodium 1-octansulfonate and improve the wettability of the blue powder [14].

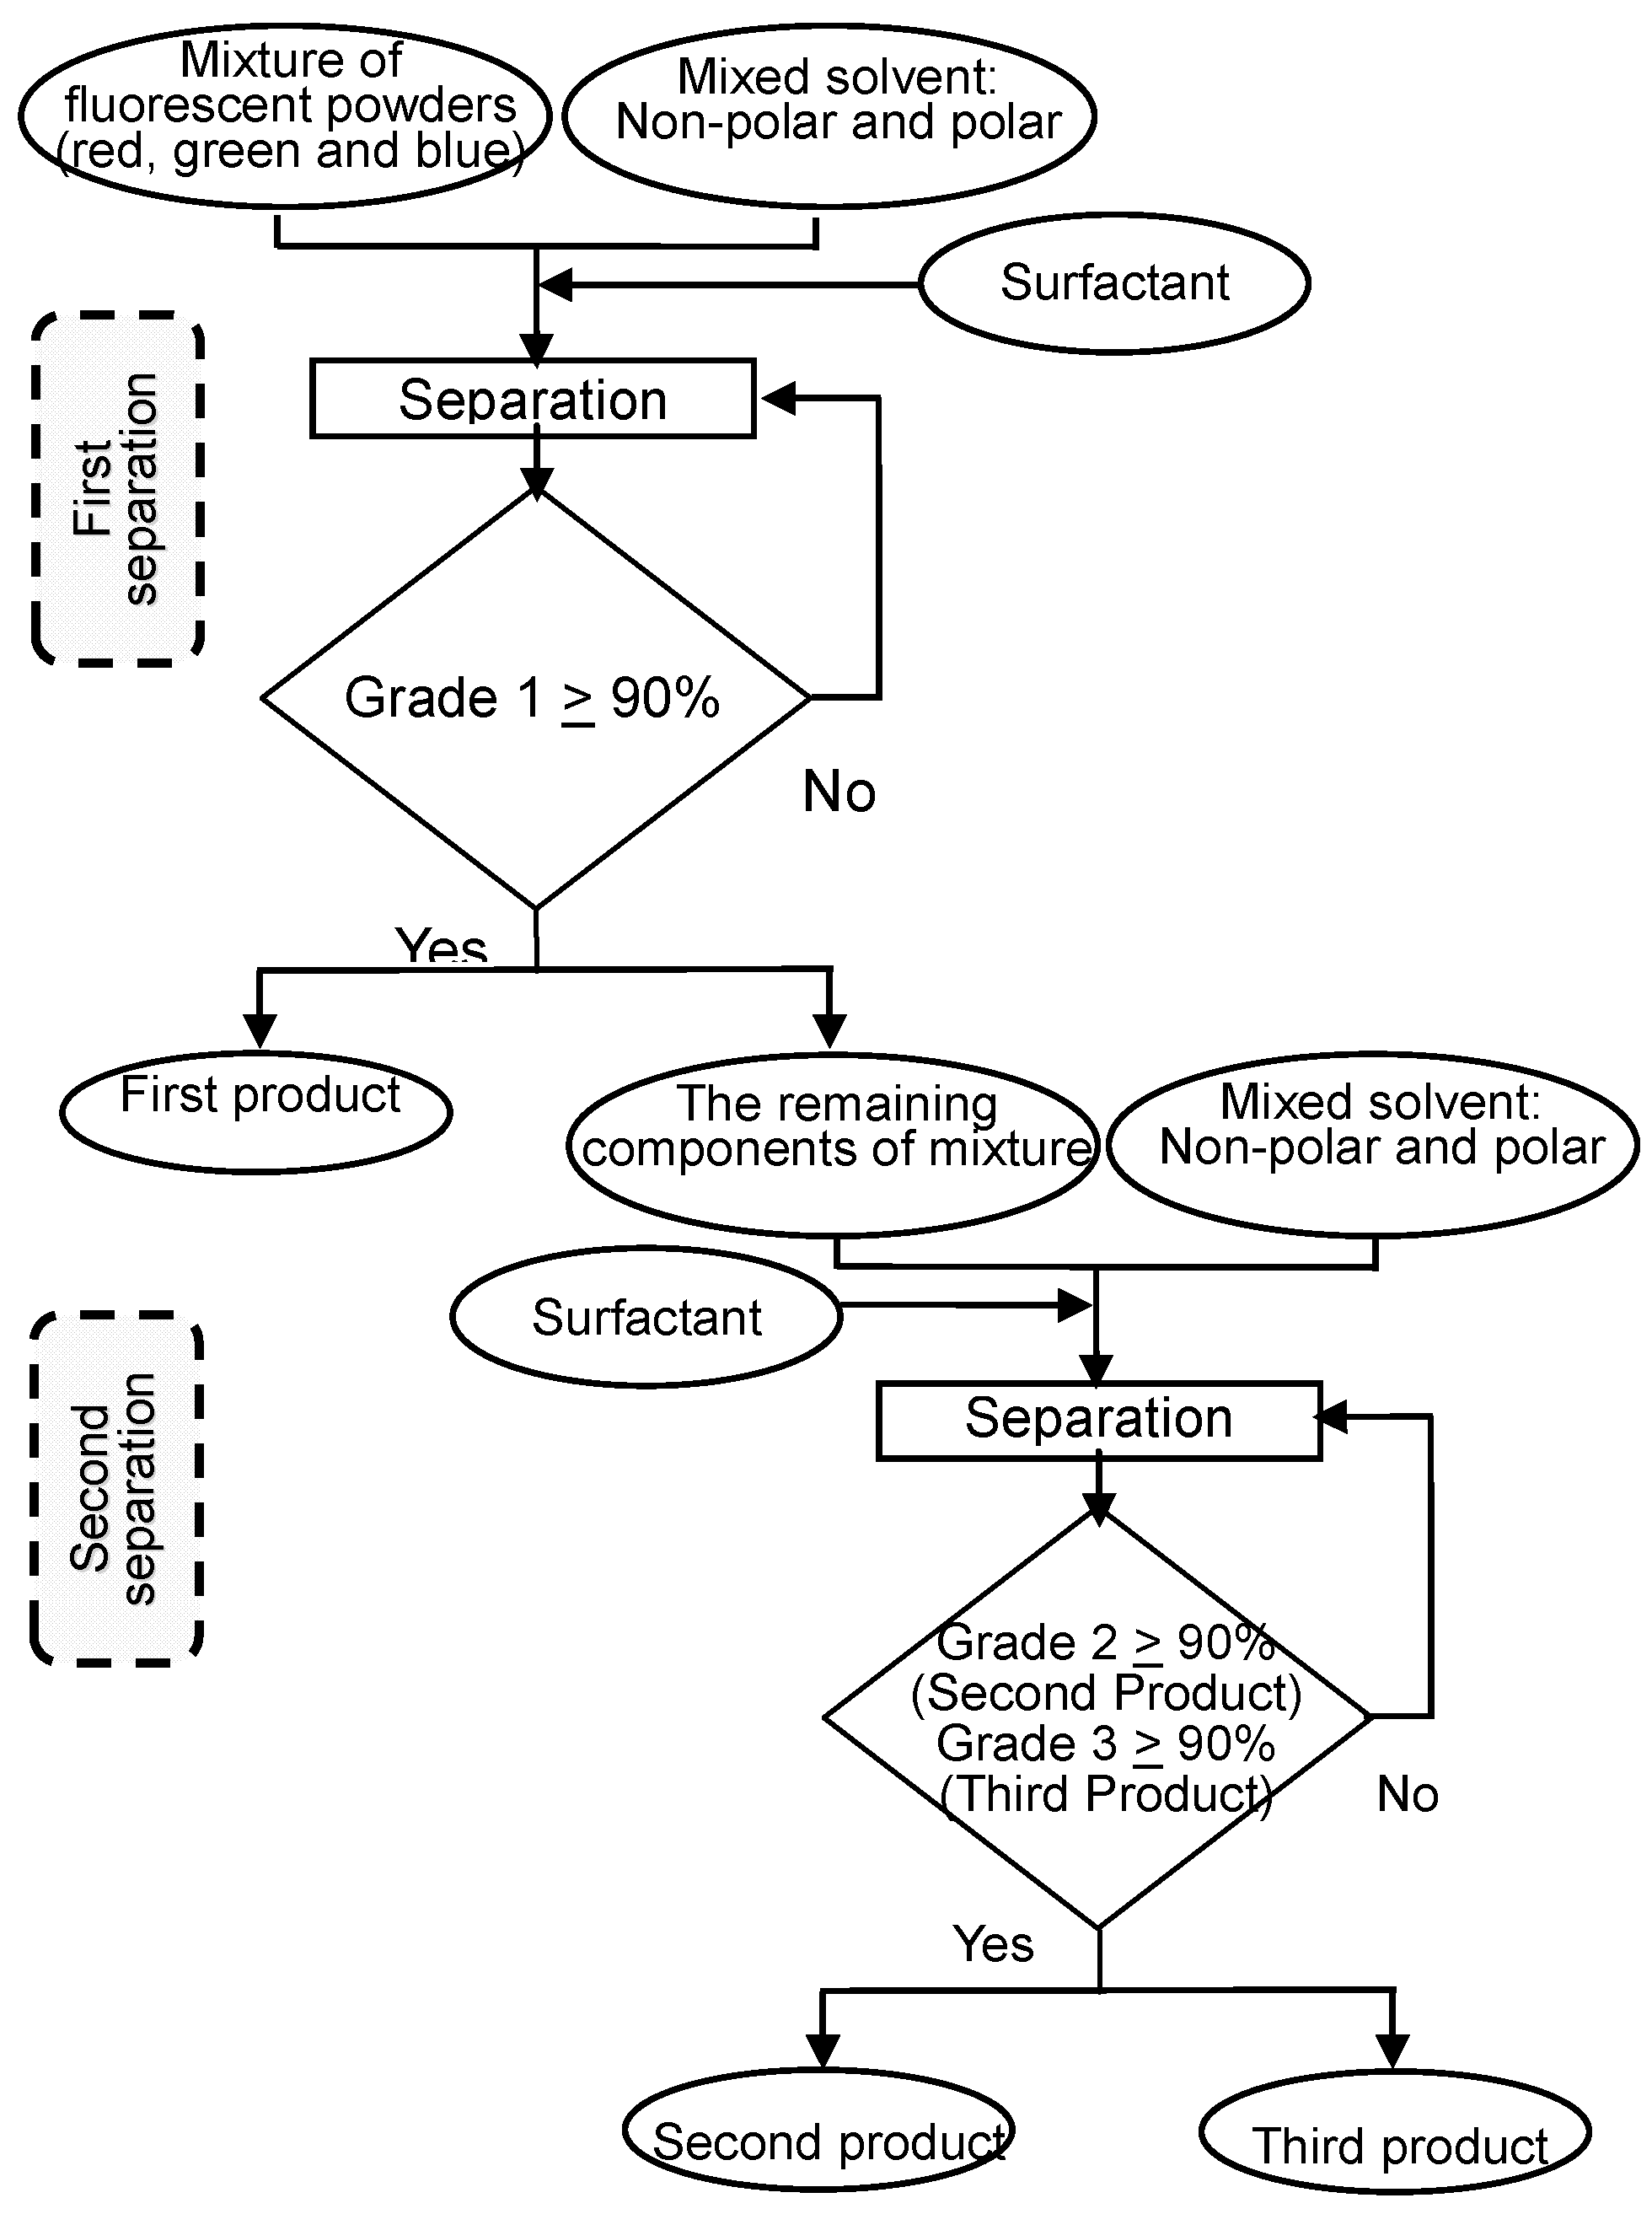
4.2. Flowsheet Design

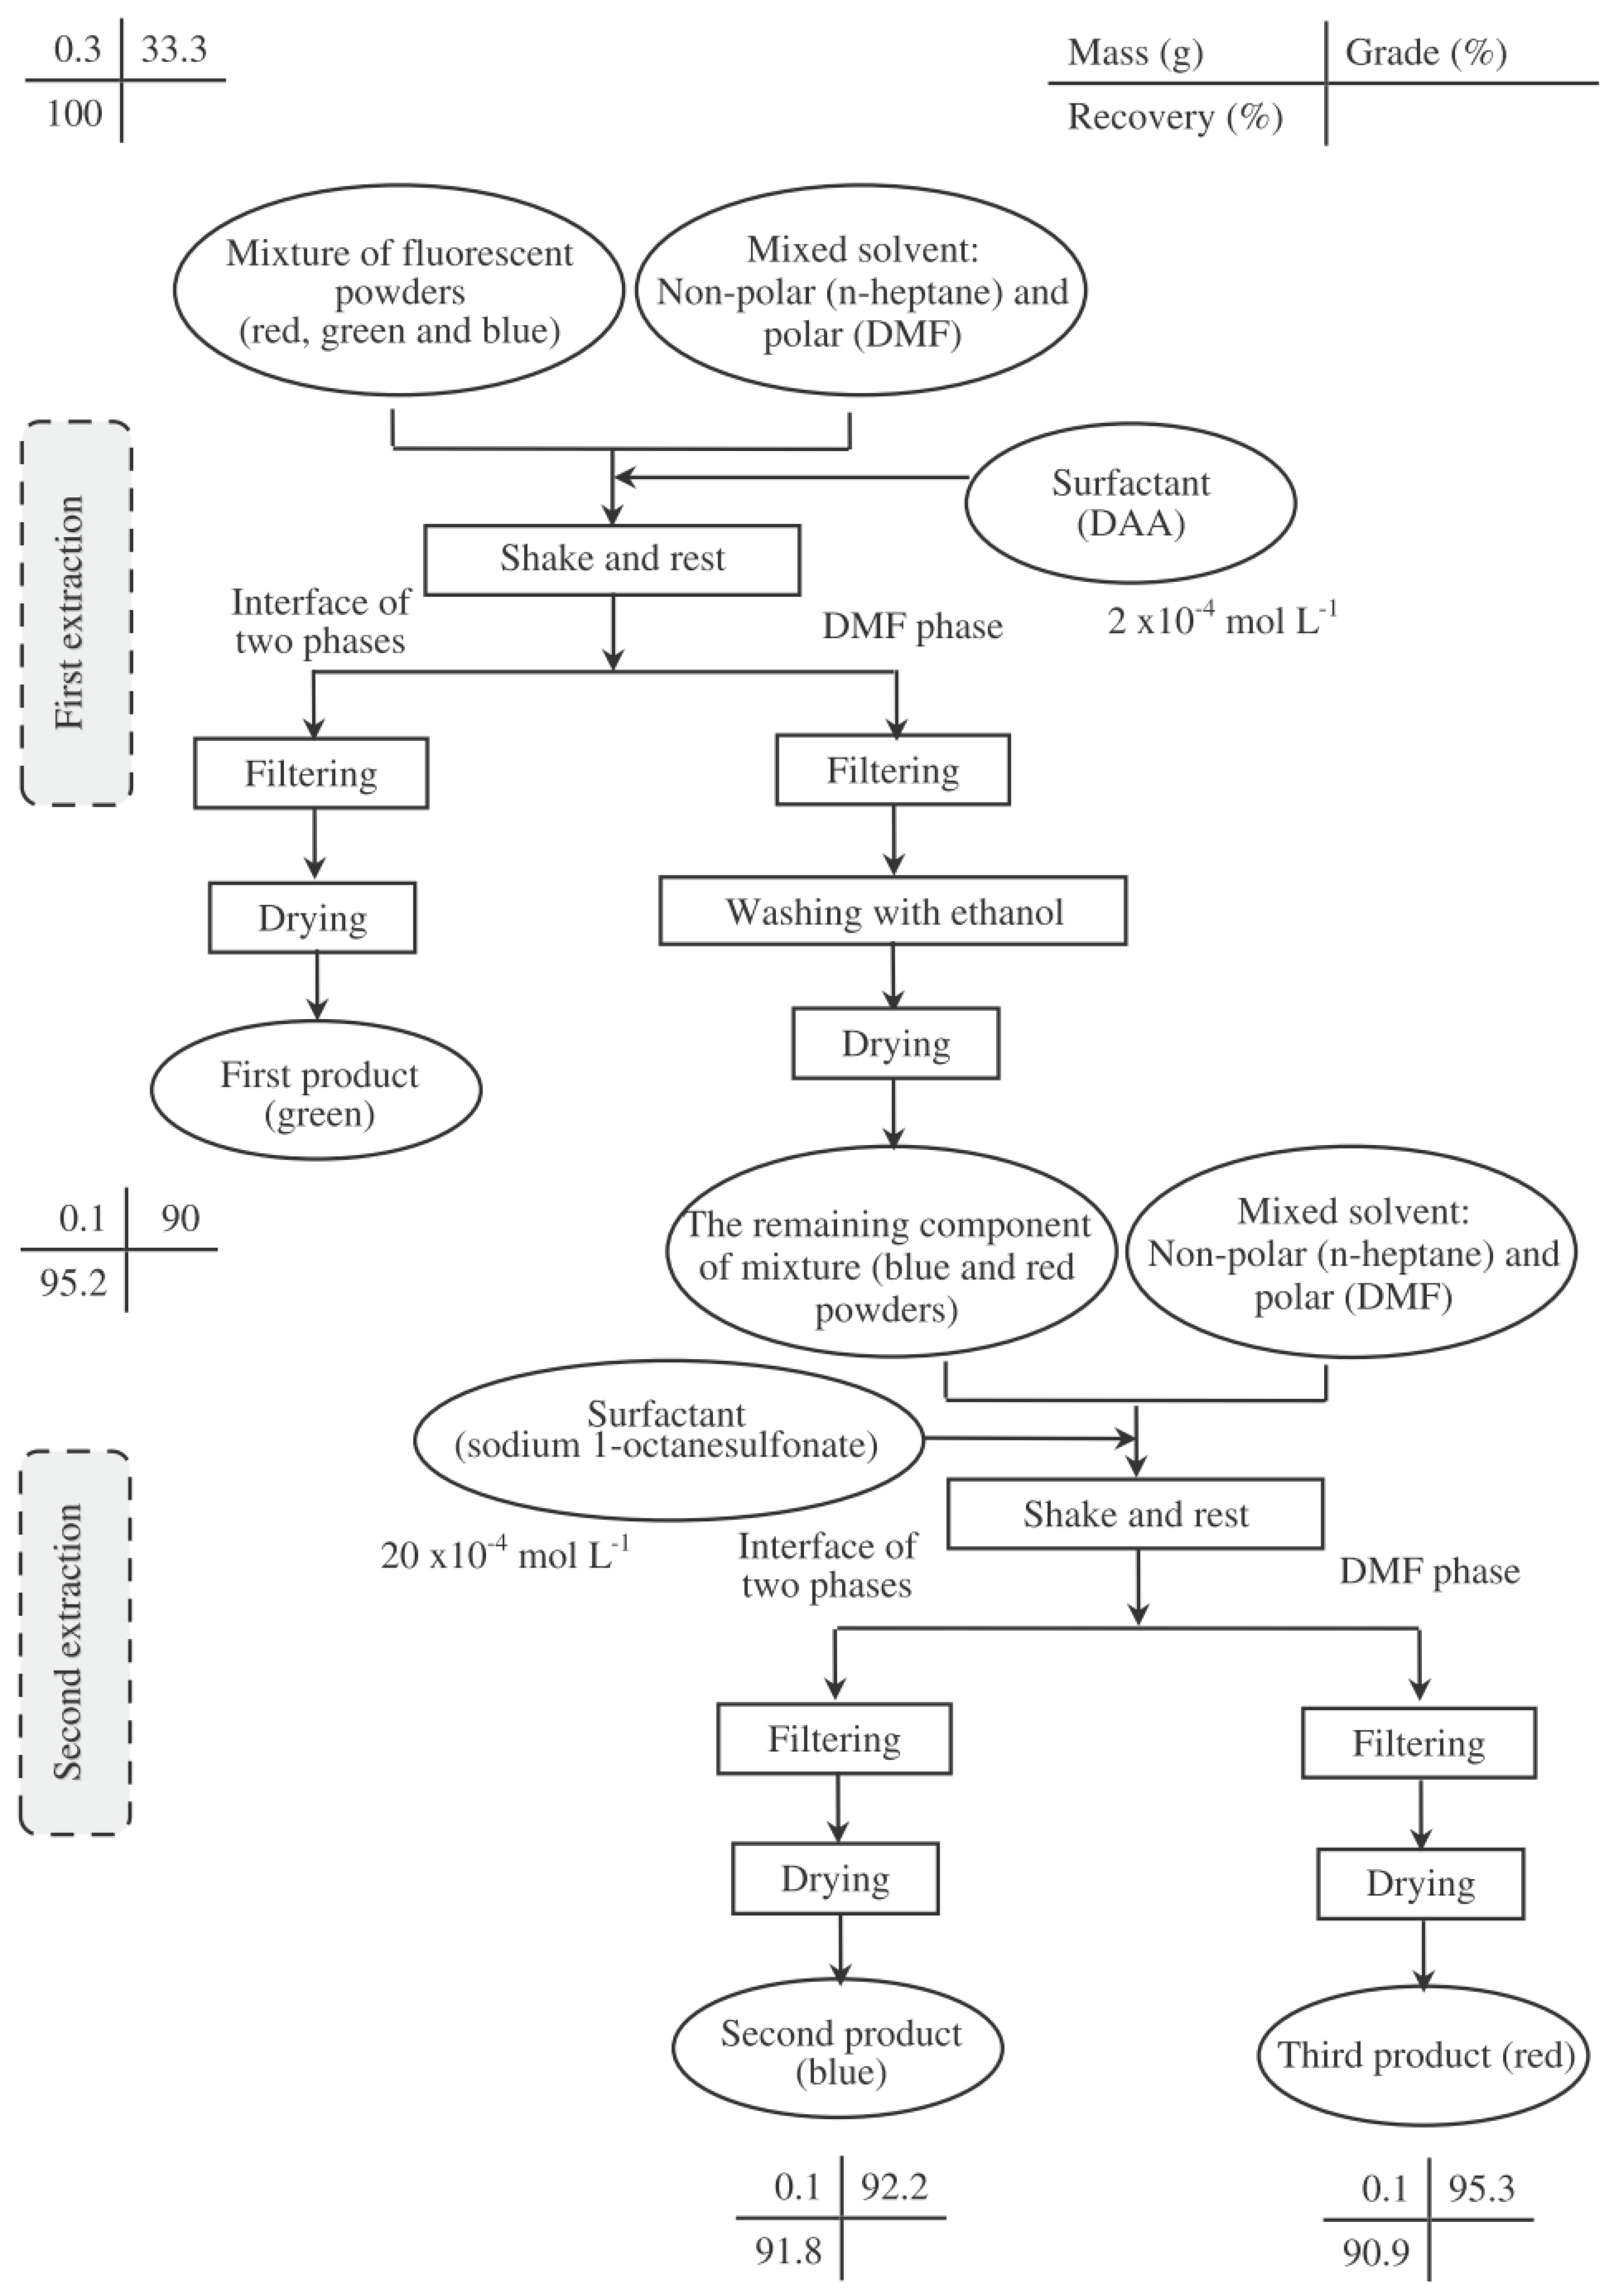
In order to separate the mixture of three fluorescent powders (i.e., red, green, and blue powders, Table 3), a two-step process shown in Figure 8 was developed. n-Heptane was selected as a non-polar solvent, whereas DMF was selected as a polar solvent [14]. DAA (2 × 10⁻⁴ mol L−1) was used in the first stage of the process (also called the first separation stage) to recover the green powder while sodium 1-octantesulfonate (20 × 10−4 mol L−1) was used in the second stage (called the second separation stage) to recover the blue powder.
In the first stage, the green fluorescent powder migrates towards the non-polar phase (n-heptane) and is captured at the interface of the two solvents. The red and blue fluorescent powders, on the other hand, remain in the polar phase (DMF). After the green powder is collected, the red-blue mixture is washed with ethanol to remove DAA attached to the powder surface. The powders remaining in the DMF phase are then mixed again with two organic solvents, i.e., 10 mL of DMF and 10 mL of n-heptane, in the presence of surfactant (sodium 1-octanesulfonate, 20 × 10−4 mol L−1) and shaken for 2 min. The blue fluorescent powder is captured at the interface of the two solvents, and is separated from the red fluorescent powder, which remains in the DMF phase. Finally, each product is filtered and dried. The numbers given in Figure 8 indicate the separation results.

4.3. Results from the Flowsheet 2

4.3.1. Effect of Surfactant

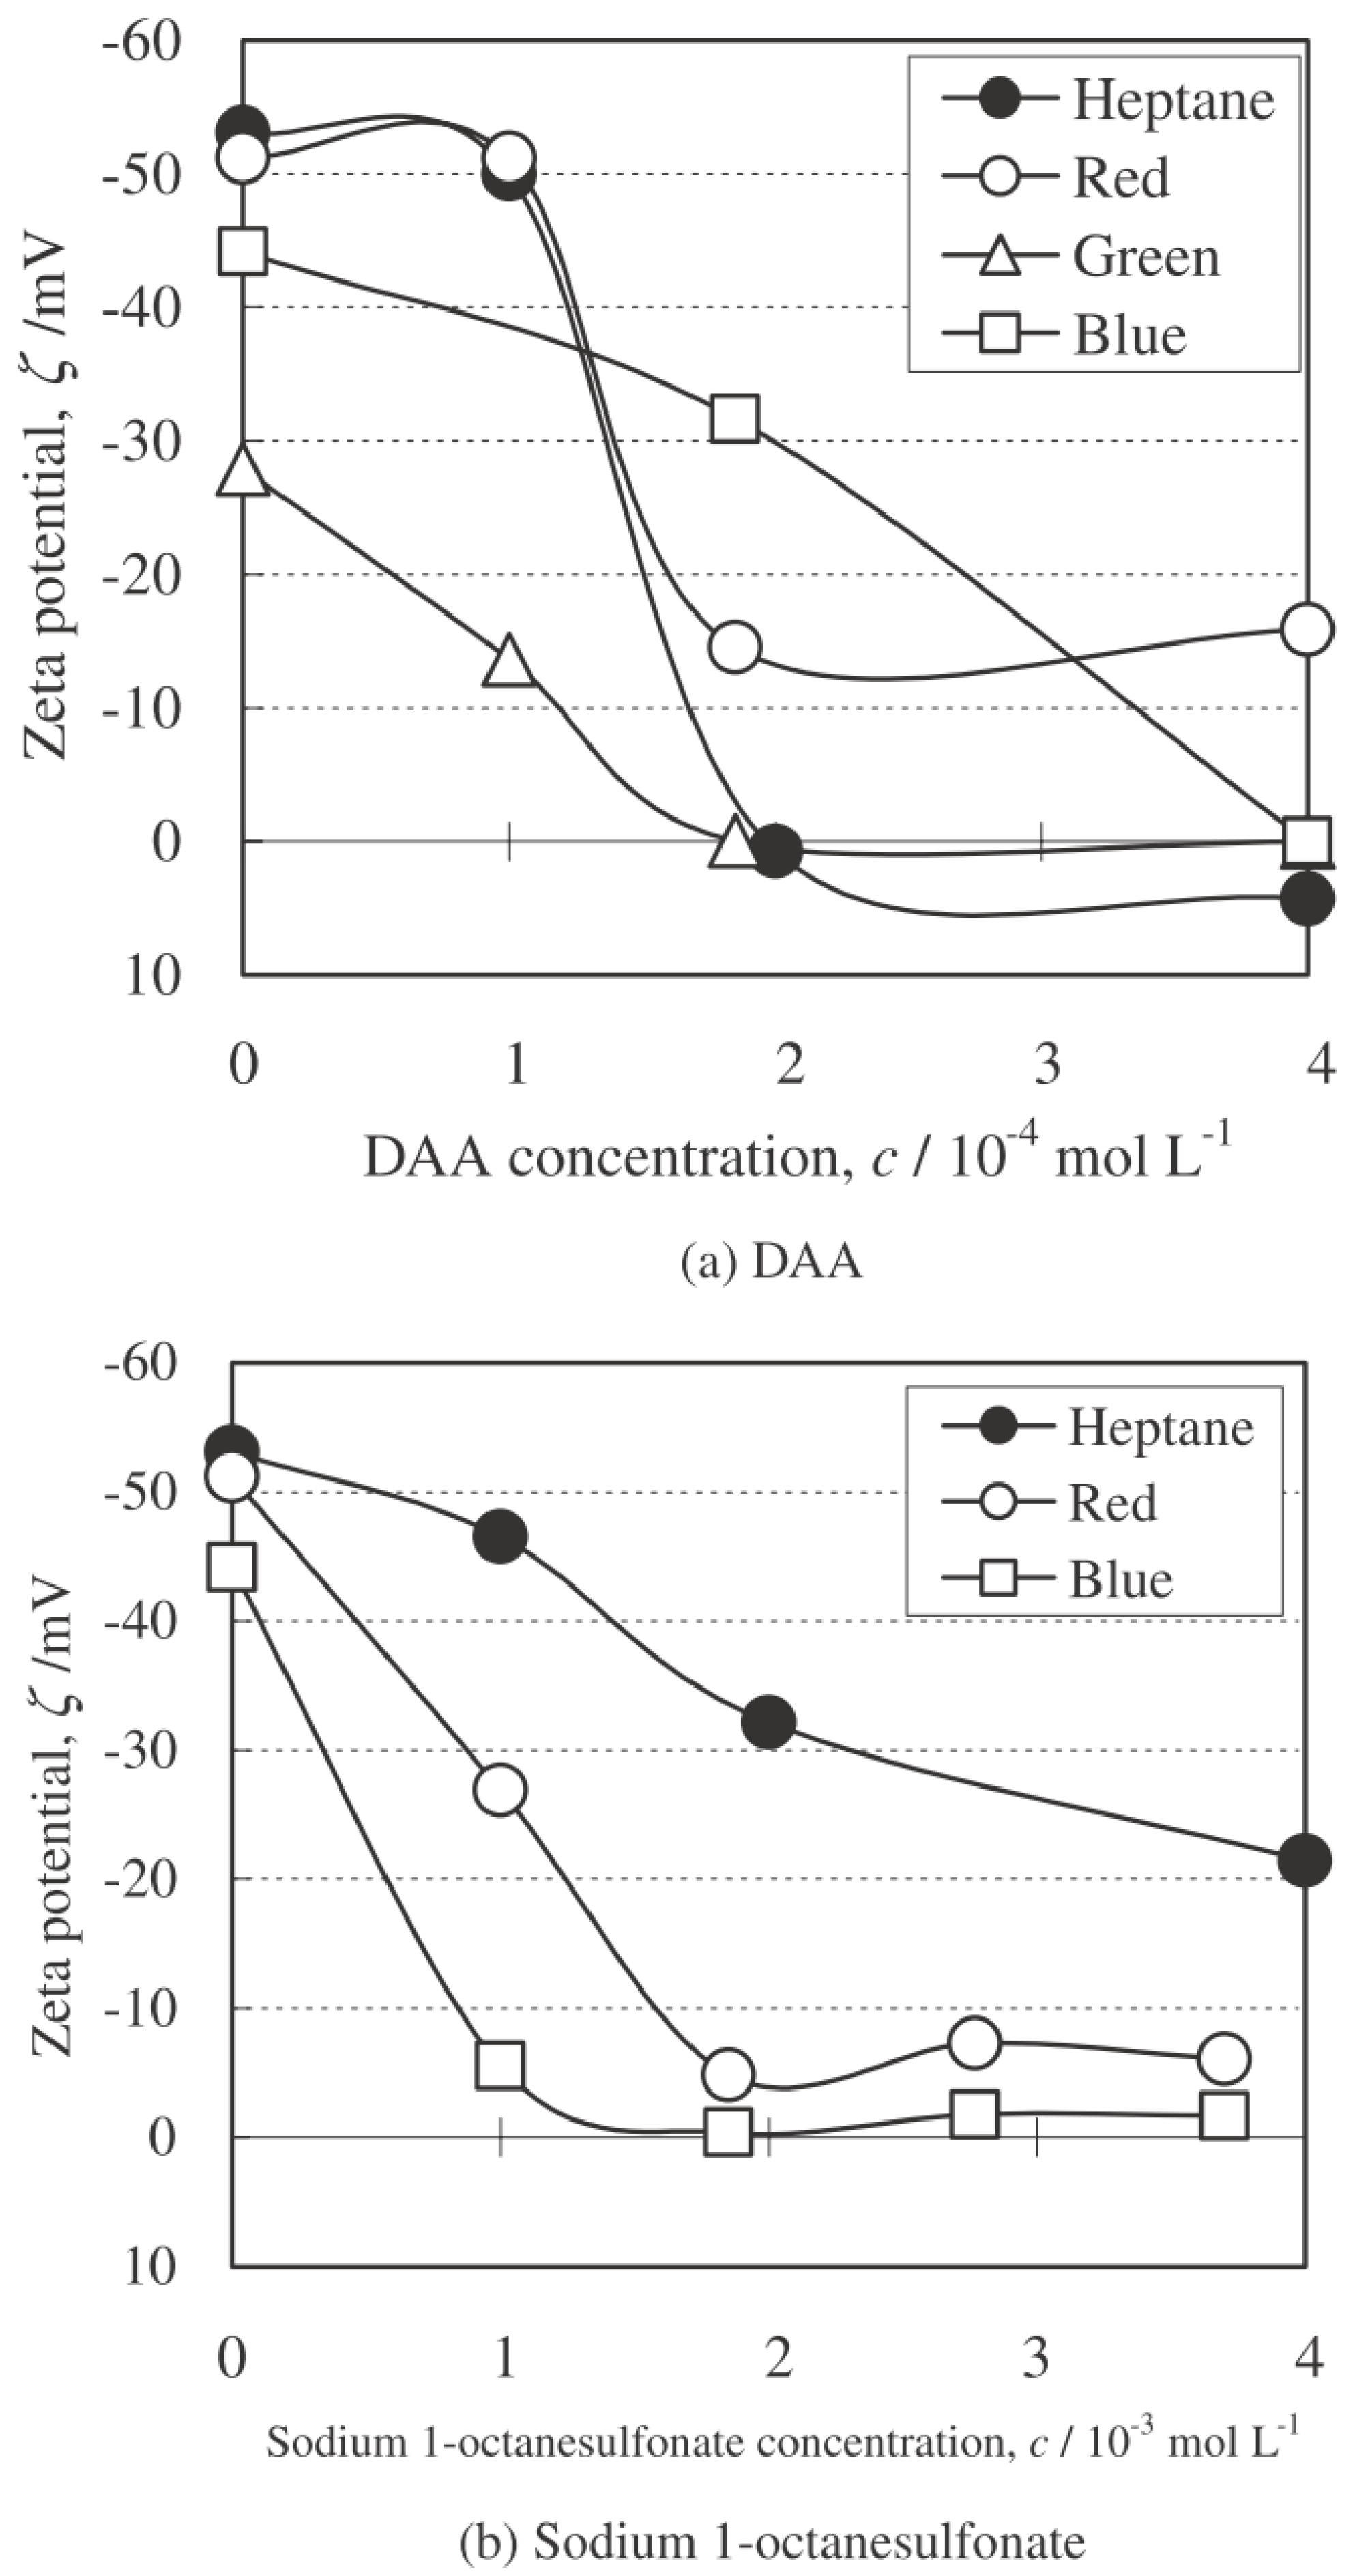
In order to investigate the effect of the surfactant concentration on the electric double-layer interaction between the fluorescent powder and non-polar oil droplet (n-heptane), their zeta potential was measured by using an electrophoretic light scattering spectrophotometer. Figure 9 shows the zeta potential of fluorescent powders (i.e., red, green, or blue powder) immersed in DMF solvent as a function of surfactant concentration of DAA (Figure 9a) and sodium 1-octanesulfonate (Figure 9b).
The green powder exhibits a zeta potential close to zero with the addition of more than 2 × 10⁻⁴ mol L−1 DAA (Figure 9a). The blue powder, on the other hand, has the minimum zeta potential value with the addition of 2 × 10⁻³ mol L−1 sodium 1-octanesulfonate (Figure 9b). Blue powder is composed of Ba2+ ion (Table 3), which can interact with organosulfonate (RSO3) [36] of sodium 1-octanesulfonate.
The results indicate that the zeta potential of fluorescent powders immersed in DMF are all negative but strongly affected by the type of surfactant and its concentration (Figure 9). The optimum surfactant concentration for the best separation was DAA 2 × 10⁻⁴ mol L−1 and sodium 1-octanesulfonate 2 × 10⁻³ mol L−1 [14] that matches with the above mentioned zeta potential trend. It should be noted that lowering the zeta potential of fluorescent powders enhances the hetero-coagulation of fluorescent powder and n-heptane droplet due to the weaker electric double layer repulsion between them and higher hydrophobicity assigned by the surfactant adsorption. A higher difference in zeta potential of different fluorescent powders is also required to selectively separate a mixture of the powders.

4.3.2. Effect of Solid Concentration

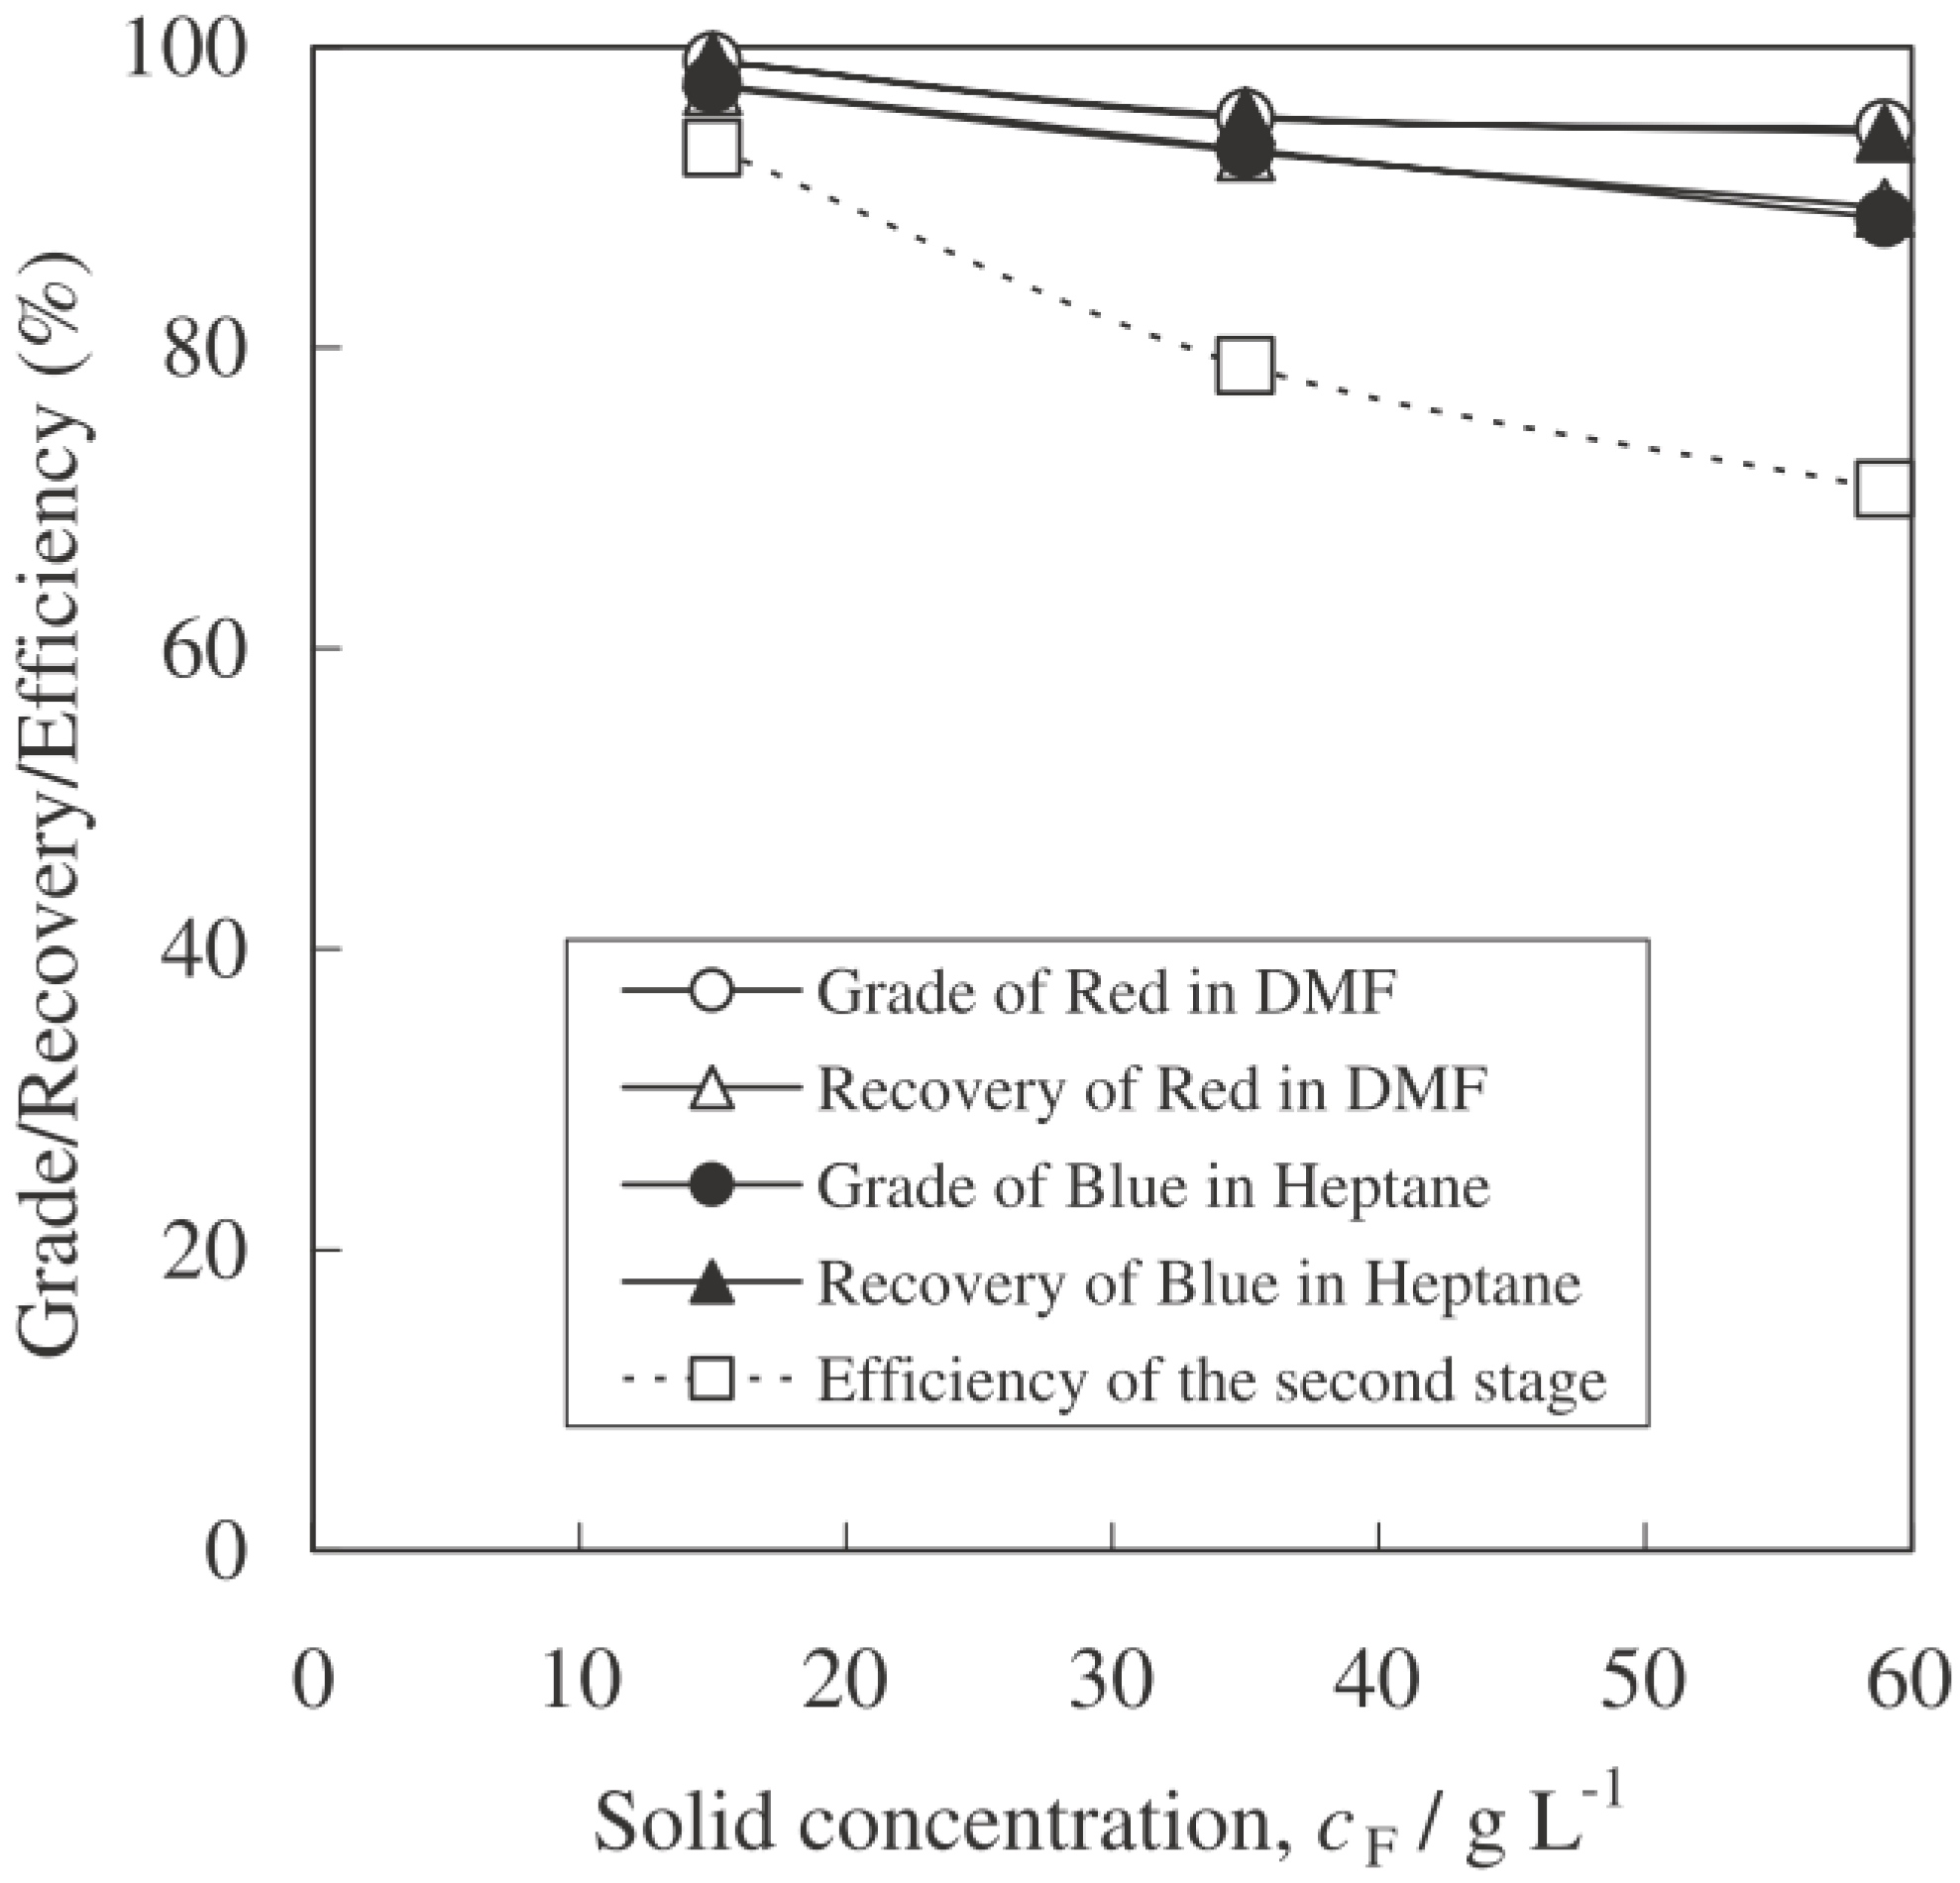
The effect of solid concentration was investigated to determine the optimum solid concentration for recovering the green powder at the two-liquid interface with DAA as a surfactant in the first stage of separation. Figure 10 shows that the highest efficiency was achieved when the solid concentration was 30 g L−1. The grade of the green powder decreased on increasing the solid concentration above the optimum concentration due to the lower probability of collision between green particles and droplets of n-heptane while the higher collision probabilities with other powders, led to their entrapment.
In addition, the effect of solid concentration on the blue powder recovery with sodium 1-octanesulfonate as a surfactant in the second separation stage was investigated. As shown in Figure 11, the highest efficiency was achieved at a solid concentration of 15 g L−1. A similar trend was observed as in the lst stage. In other words, the blue powder recovery decreased on increasing the solid concentration above its optimum.
To evaluate the flowsheet, the efficiency of two-liquid flotation was calculated using Equation (2). Table 6 shows the grade and recovery of each product and the overall separation efficiency. The grade and recovery of each product ranged from 90% to 95%, while the overall efficiency was 62.8% higher than its aqueous-organic system (47.9%, Table 2). These results indicate a successful separation.

4.4. Heterocoagulation of Particle and Non-Polar Oil Droplet

Heterocoagulation of fine particles is important for many industrial applications, such as separation/deposition/removal of fine particles [37,38,39,40,41,42,43,44,45,46]. The separation of a mixture of fine and ultra-fine particles can be performed by mineral processing methods, i.e., flotation [37,38], emulsion flotation [39,40,41], and two-liquid flotation [20,42]. All these methods utilize the advantage of the heterocoagulation of particle and bubble/non-polar oil in polar solvent, such as water.
Although the heterocoagulation of fine particles and non-polar oil droplet in aqueous solution has been reported [20,47], little information has been reported regarding the heterocoagulation of ultra-fine particles and non-polar oil droplet in organic solvent that is eventually the heart of the proposed two-liquid flotation. Thus, it is important to understand and investigate such heterocoagulation to extract its science and give a better feedback to the engineering of ultra-fine particle separation by two-liquid flotation.
The objective of this part is to better understand and to investigate the heterocoagulation of ultra-fine particles and non-polar oil droplets in a polar organic solvent in order to verify the mechanism of two-liquid flotation when separating ultra-fine particles. Within that frame, Otsuki et al., (2007) [18] (1) measured the physical properties of particles and non-polar oil droplets, i.e., the zeta potential and the aggregate size of particles, (2) calculated the potential energy by using DLVO theory, and then (3) evaluated the interaction between fluorescent powders and non-polar oil in a polar organic solvent. These results were well correlated with the separation results of a mixture of the fluorescent powders by two-liquid flotation.

4.4.1. DLVO Theory

Hetero-coagulation of colloidal particles in aqueous solution is often described by using DLVO theory [48,49], in which the total potential energy is expressed as the sum of the van der Waals potential, VA, and the electrical double layer potential, VR. In the study of Otsuki et al. (2007) [18], DLVO theory was applied to study the interaction between a micron meter size particle and a non-polar oil droplet dispersed in a polar organic solvent. The total potential energy was calculated by using the following Equations (13)–(15):
VT = VA + VR
Assuming that the average radius of the particles (or aggregate) (a) is much smaller than that of the non-polar oil droplets (ano) (a << ano), VA and VR can be expressed for the interaction between a sphere and an infinite plate [20]:
V A = A 132 6 [ 2 a ( H + a ) H ( H + 2 a ) ln ( H + 2 a H ) ]
V R = π a ε 0 ε r [ 2 ψ 1 ψ 2 l n 1 + e ( κ H ) 1 e ( κ H ) + ( ψ 1 2 + ψ 2 2 ) ln ( 1 e ( 2 κ H ) ) ]
where ɛ0 is the dielectric constant of free space, ɛr is dielectric coefficient of polar solvent, κ is the Debye-Huckel reciprocal length, a is the particle radius, ψ1 and ψ2 are the surface potentials of the particle and the non-polar oil droplet (which are considered to be equivalent to the zeta potential of the particle ζ1 and the non-polar solvent ζ2, respectively).
The Hamaker constant A132 in Equation (14) is calculated using the following equation [50]:
A 132 = ( A 11 A 22 ) ( A 22 A 33 )
where A11, A22, and A33 refer to the Hamaker constant of the particle, the non-polar oil droplet, and the polar solvent, respectively.
The Debye-Huckel reciprocal length in Equation (15) is expressed for a solution of 1:1 electrolyte by the Equation (17) [20]:
κ = 2 e 2 N A c z 2 ε r ε 0 k T
where e is the elementary electrical charge, NA is the Avogadro’s number, c is the concentration of surfactant below the critical micelle concentration, z is the valence of the surfactant, and k is the Boltzmann’s constant, T is the absolute temperature in Kelvin.
Generally, the DLVO theory can describe the heterocoagulation of colloidal particles in aqueous solution. On the other hand, Otsuki et al. (2007) [18] applied the DLVO theory for evaluating the heterocoagulation of colloidal particles in a polar organic solvent because the polar organic solvent they used had a similar dielectric coefficient (ɛr) to aqueous solution, and the electrolyte concentration was substituted by the surfactant concentration (c) for calculating the total potential energy, adapting the method described by Kusaka et al. (1994) [20].

4.4.2. Measuring the Physical Properties of Particle and Non-Polar Oil Droplet for Calculating the Potential Energy

Zeta Potential

In order to determine the zeta potential of each fluorescent powder in a three-component mixture, (1) surfactant concentration adsorbed on the surface of each powder and (2) zeta potential of n-heptane and each powder dispersed in DMF solvent were measured separately. The determined zeta potential was used as an input parameter for calculating the total potential energy (Equations (13)–(17)).
First, the colorimetric determination was performed in order to quantify the surfactant concentration adsorbed on the fluorescent powders. The colorimetric measurement determines the absorbance of sample solvent containing a surfactant. The difference between the initial concentration and the concentration after the powder addition and shaking is the surfactant concentration adsorbed on the fluorescent powder. The details of the experimental procedure are given in the previous publication by Otsuki et al., 2007 [18]. Second, the zeta potentials of fluorescent powders and n-heptane dispersed in DMF solvent were measured as a function of concentration of (a) DAA or (b) sodium 1-octanesulfonate in DMF solvent (polar phase).

Aggregate Size

The interactive force apparatus (IFA) was used in order to determine the size of aggregated fluorescent powders in experimental conditions applied to two-liquid flotation. In a typical test, 0.2 g of sample powder was added into a 50 mL vial with 20 mL DMF solvent and a surfactant (i.e., (a) DAA; or (b) sodium 1-octanesulfonate) and then was shaken for 2 min which is equivalent to the shaking time used for two-liquid flotation. Next, 10 mL of sample solvent was transferred to the sample cell of IFA. The cell was set on the top of the piezo-stage of the apparatus, and the hemisphere was immersed in the sample solvent inside the cell (see [18,51] for the details of IFA measurement). The piezo-stage moves to regulate the distance between the hemisphere and flat plate, and measures the forces between two surfaces as a function of their distance. From the force curve, particle/aggregate size was determined and used for the potential energy calculation.

4.4.3. Calculating the Total Potential Energy

Results of Measurements

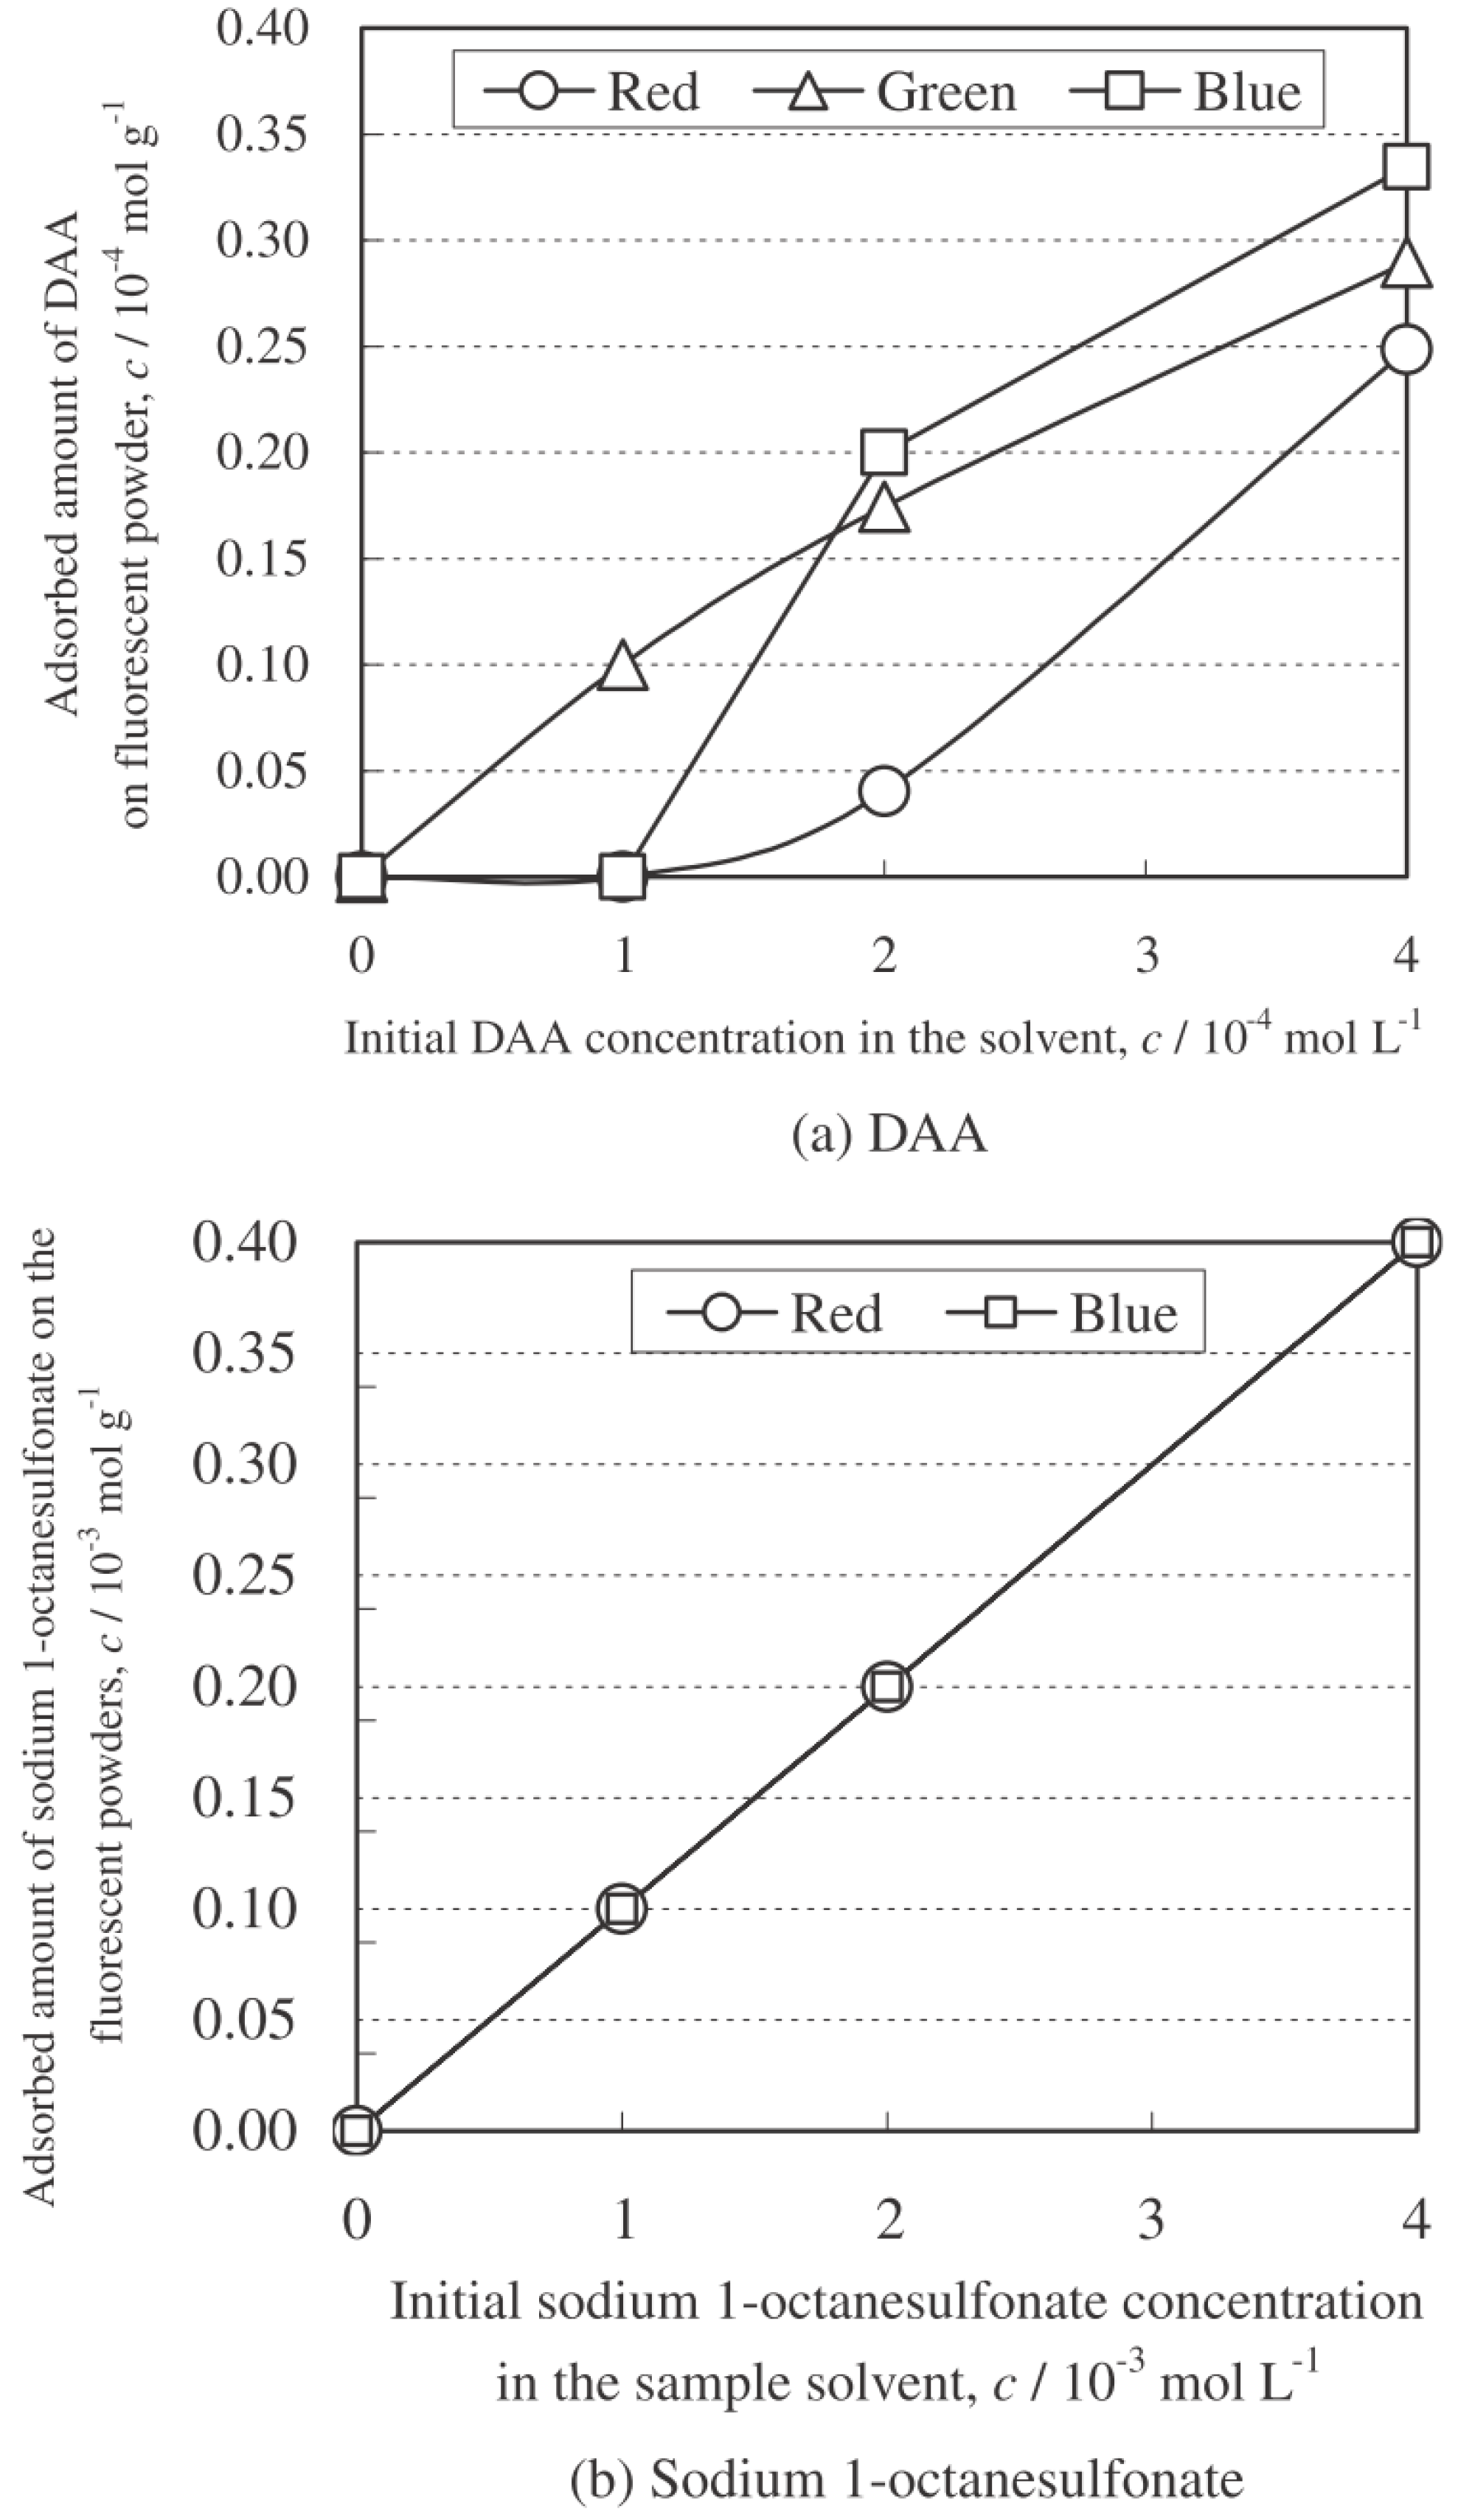
Figure 12 shows the surfactant concentration adsorbed on different fluorescent powders in different surfactant systems ((a) DAA, (b) sodium 1-octanesulfonate). In general, the amount of surfactant adsorbed increases with the surfactant concentration. The adsorbed amount of DAA on each fluorescent powder is different, whereas the adsorbed amount of sodium 1-octanesulfonate on each fluorescent powder is similar. In other words, each fluorescent powder has a different affinity to DAA, while the blue and red powders have similar affinity to sodium 1-octanesulfonate. The measured adsorbed surfactant concentration was used for estimating the surfactant concentration adsorbed on each component of the powder mixture (i.e., red, green, blue) in the separation system at the optimum initial surfactant concentration determined by separation results.
By using the zeta potential value of the individual fluorescent powder (Figure 9), the zeta potential of each powder in the powder mixture was estimated by considering both the results of adsorbed surfactant concentration and zeta potential, assuming that the powder mixture stays in the sample solvent. In other words, Otsuki et al. (2007) [18] assumed the competitive adsorption of surfactant onto different powders occurring in their mixture. First, they estimated the surfactant concentration adsorbed on each fluorescent powder proportional to the initial surfactant concentration allocated to each powder based on the adsorbed amount of surfactant from the measurement of single powders, ((a) DAA = 2.0 × 10⁻⁴ mol L−1 = 0.2 × 10⁻⁴ mol L−1 (red) + 0.8 × 10⁻⁴ mol L−1 (green) + 1.0 × 10⁻⁴ mol L−1 (blue) (b) sodium 1-octanesulfonate = 2.0 × 10⁻³ mol L−1 = 1.0 × 10⁻³ mol L−1 (red) + 1.0 × 10⁻³ mol L−1 (blue)). Then, the value of the zeta potential of each powder dispersed in DMF solvent at that surfactant concentration was used for calculating the potential energy.

Potential Calculation

Otsuki et al. (2007) [18] applied DLVO theory with the sphere-plate model, and the total potential energies of interaction between a fluorescent particle and an n-heptane droplet in DMF as a function of their separation distance were calculated by using Equations (13)–(17). They evaluated the heterocoagulation of an ultra-fine particle (fluorescent powder of spherical shape) and a non-polar oil droplet (n-heptane as an infinite plate) in a polar solvent (DMF) in the presence of surfactant (DAA or sodium 1-octanesulfonate).
The parameters used in this calculation were the Hamaker constant (A) given in Table 7, the zeta potential of the fluorescent powders (ζ1), and particle radius (a) determined from the IFA measurement given in Table 8 in Equation (14), zeta potential of n-heptane (ζ2) given in Table 9, relative permittivity of solvent i.e., DMF (er) given in Table 6, as well as the concentration (c) and the valence (z) of surfactant given in Table 10. The absolute temperature (T) was 298 K.
The total potential energies (VT) of interaction between the fluorescent particle and the n-heptane droplet ((1) red—n-heptane, (2) green—n-heptane and (3) blue—n-heptane) at 2 × 10⁻⁴ mol L−1 of DAA are given in Figure 13a as a function of separation distance (H). The attractive interaction between the green powder and n-heptane droplet is indicated while the other two powders have repulsive interaction with n-heptane explained by the positive potential energy. Therefore, the heterocoagulation of green particle and n-heptane is more feasible, than blue and red particles.
The total potential energy (VT) of the interaction between a fluorescent particle and an n-heptane droplet ((1) red—n-heptane, (2) blue—n-heptane) at 20 × 10−4 mol L−1 of sodium 1-octanesulfonate is also presented in Figure 13b). There is a clear difference between the blue and red powders. The attractive interaction between the blue fluorescent powder and n-heptane droplet is pronounced. Thus, the heterocoagulation between blue particle and n-heptane is more feasible than red particle and n-heptane indicating the repulsive force.
The calculation results explain the heterocoagulation mechanism of hydrophobized fluorescent powders ((1) green powder in the presence of DAA, and (2) blue powder in the presence of sodium 1-octanesulfonate) and n-heptane droplet in DMF solvent. The green particles exhibit a high degree of heterocoagulation in the presence of DAA while the blue particles show the same trend in the presence of sodium 1-octanesulfonate (Figure 13).

4.4.4. Separation Mechanism of Fluorescent Powders

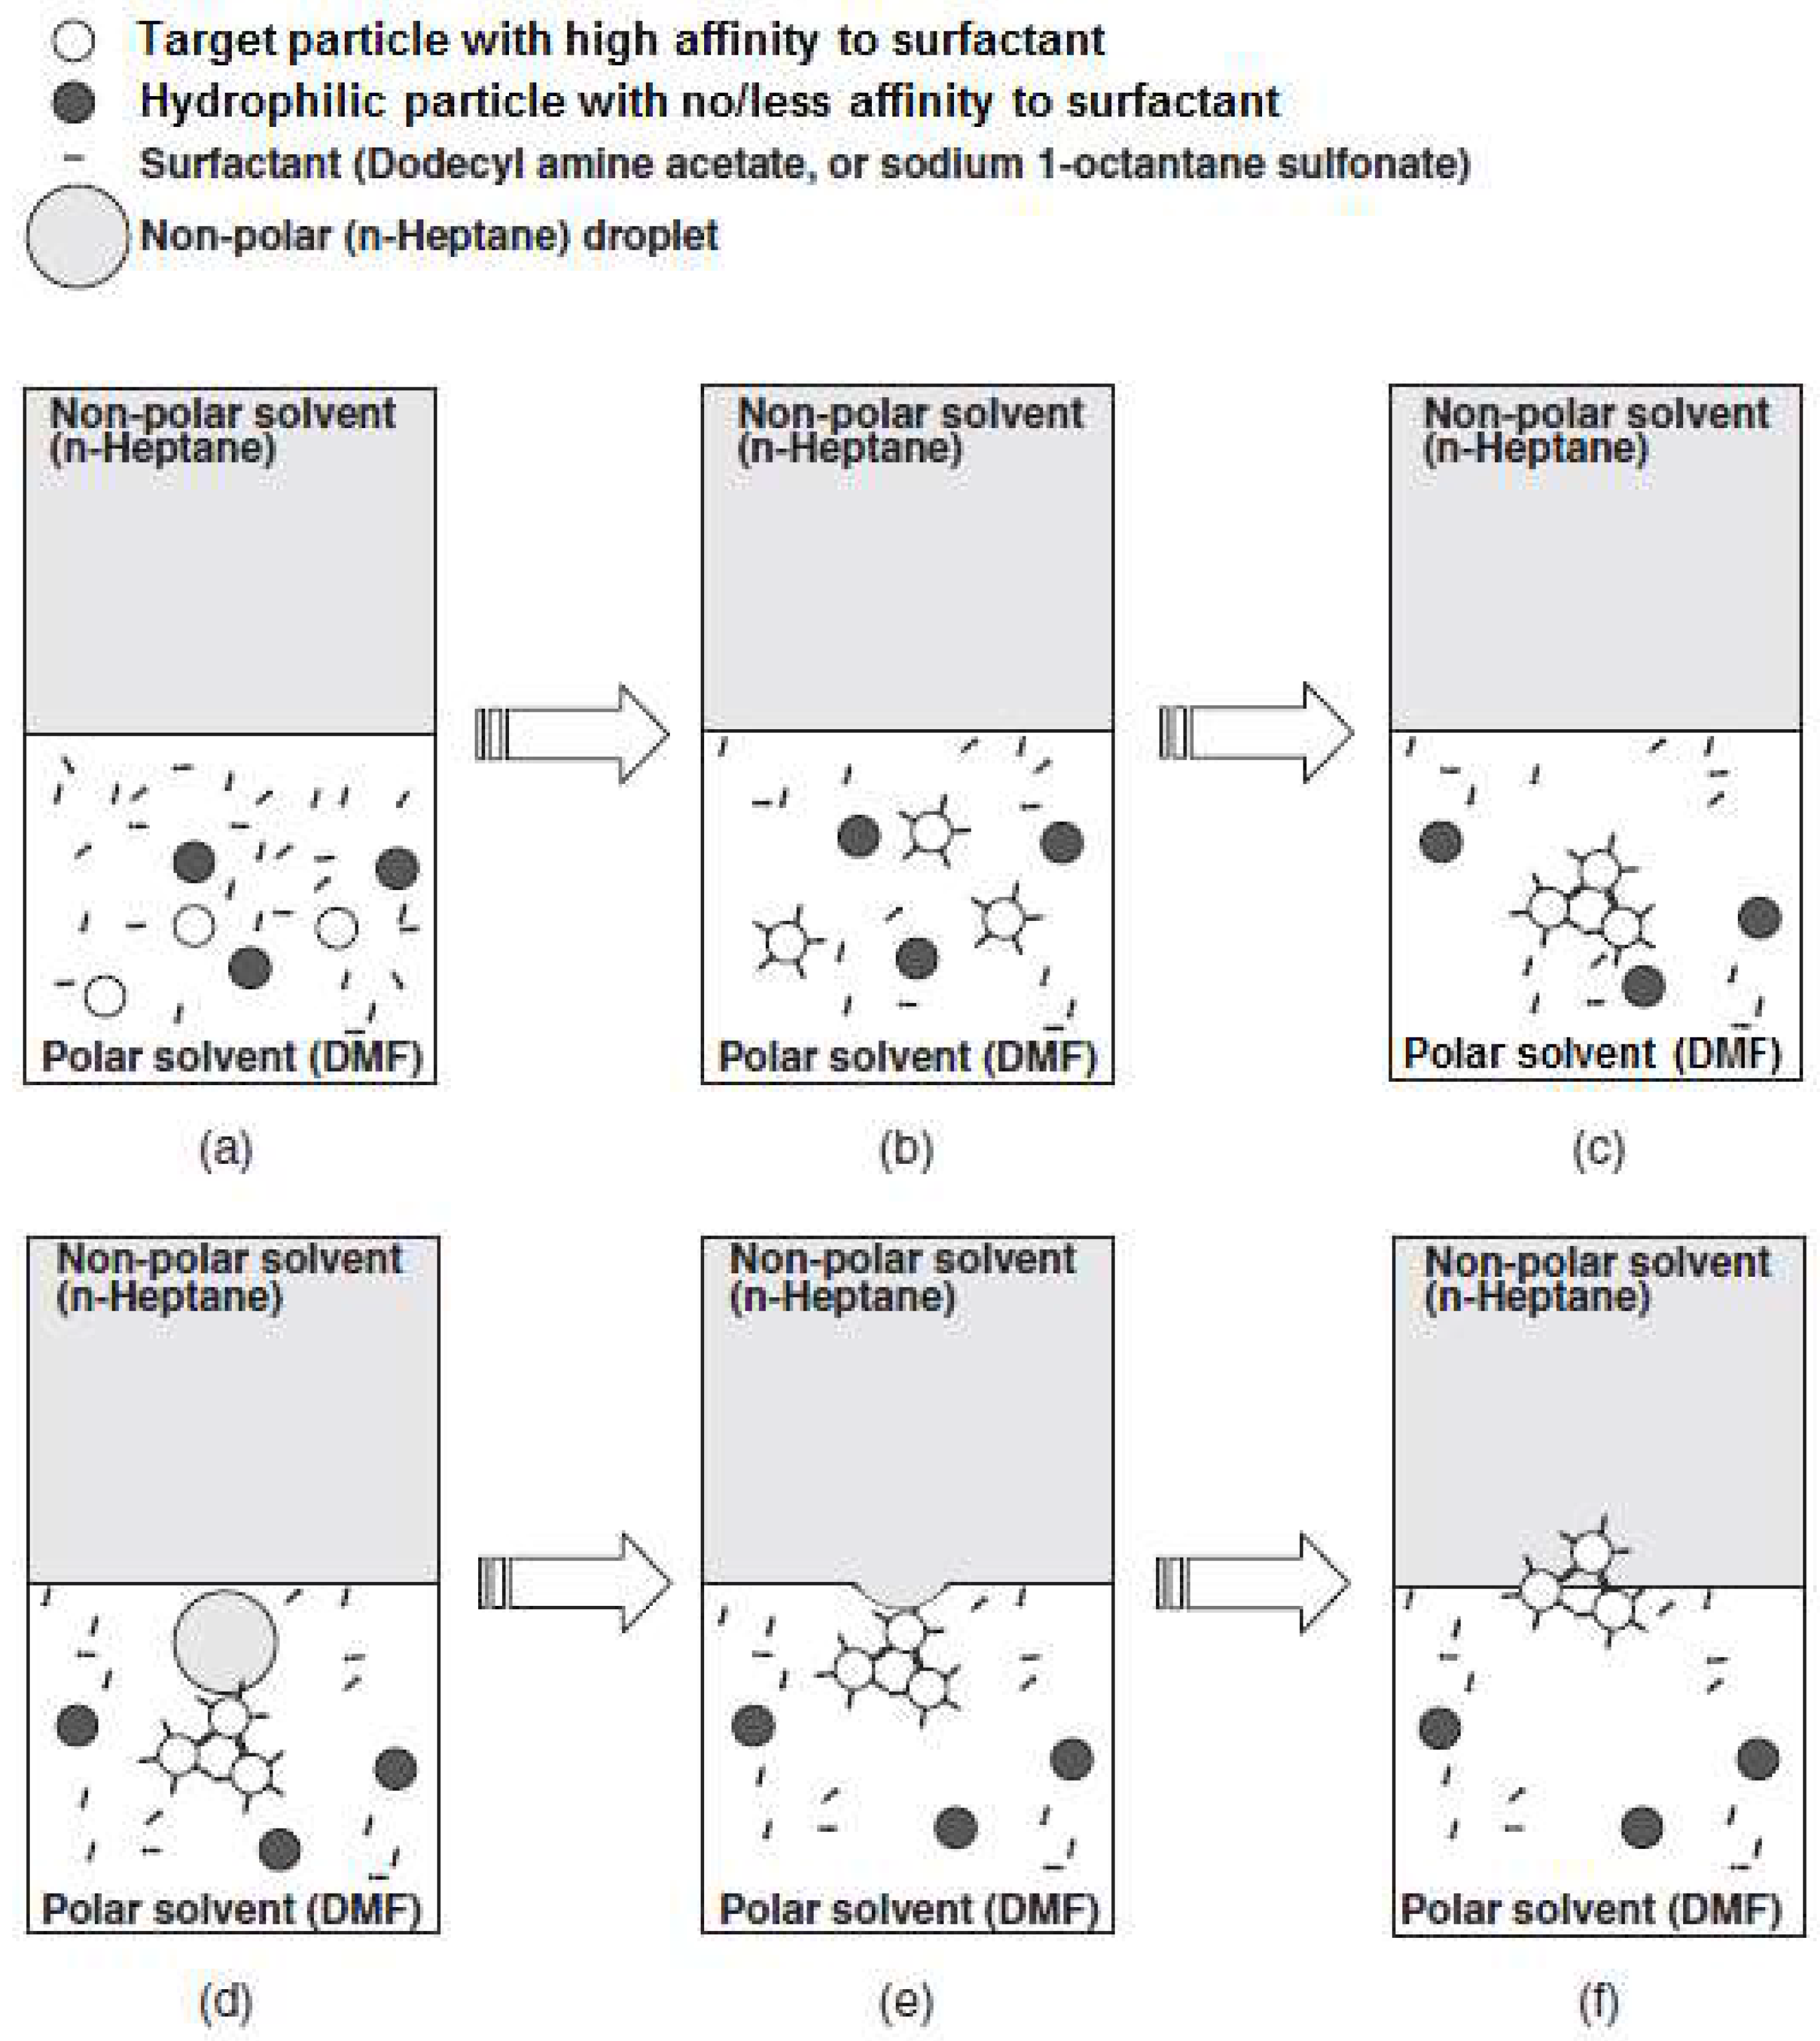
The potential energy calculation using the DLVO theory suggested the following mechanism of two-liquid flotation. Upon the commencement of two-liquid flotation (Figure 14a, surfactant molecules are attached onto the surface of target particles (DAA onto green particles, or sodium 1-octanesulfonate onto blue particles) (Figure 14b) and make the particle surfaces hydrophobic. The hydrophobized particles are then aggregated with other hydrophobized particles (Figure 14c). The aggregated hydrophobized particles are then attached to the surface of non-polar (n-heptane) droplet explained by the negative potential energy between particle and non-polar droplet (Figure 14d), and migrate towards the interface of the two phases (Figure 14e), and are collected from the interface. On the other hand, the hydrophilic particles without enough surfactant adsorption remain in DMF (Figure 14f). By considering the measured aggregate size of the powders by the interactive force apparatus, the aggregate size (green: 14 μm, blue: 3.4 μm) was much smaller than the maximum size (1600 μm) which can be supported by the surface free energy of the heptane-DMF interface [21]. Therefore, the powder aggregate can be trapped by the surface free energy of the heptane-DMF interface.
The mechanism was verified by a set of experimental results regarding the separation of a mixture of fluorescent powders (i.e., red, green, blue). The grade and recovery of each product were between 90% and 95% (Table 6 [14]).

5. Comparison between Two Different Two-Liquid Flotations

5.1. Selection of Solvents for Two-Liquid Flotation

Selection of proper solvents is a key for successful separation of ultra-fine particles by two-liquid flotation (e.g., [29]). In this section, one logical way of selecting solvents is introduced and the reason why the organic-organic system exhibited the better performance over the aqueous-organic system is explained. Here the focus is given to the selection of the polar solvent due to the main difference between the aqueous-organic and organic-organic systems. However, the selection of non-polar solvent was also discussed in a previous publication by Otsuki et al., 2008 [14].
In order to select an appropriate polar solvent for separating fluorescent powders, the diffusion coefficient of fluorescent powders in different polar solvents (i.e., DMF and water) was calculated using Equation (18) with the following parameters: T = 298 K, a is the half of the mean diameter shown in Table 3, and μ is given in Table 4. The contact angle of the polar solvents on a pyrex glass immersed in n-heptane was also measured by capturing an image using a digital camera and ImageJ software was used to process the digital images [14].
D dif = k T 6 π a μ
Figure 15 shows the results of these measurements and calculations. It can be seen that DMF shows a higher diffusion coefficient for the particles and a lower contact angle compared with water. It should be noted that (1) the higher diffusion coefficient leads to a higher collision probability of particles with heptane droplets, and (2) a polar solvent of lower contact angle within n-heptane has a higher affinity for heptane, which coagulates with the hydrophobic particles. These two requirements should be fulfilled in order to coagulate particles with a non-polar oil droplet. Figure 15 shows that DMF is more suitable than water for separation since it has both a relatively high diffusion coefficient and a low contact angle.

5.2. Cost Comparison

5.2.1. Methodology

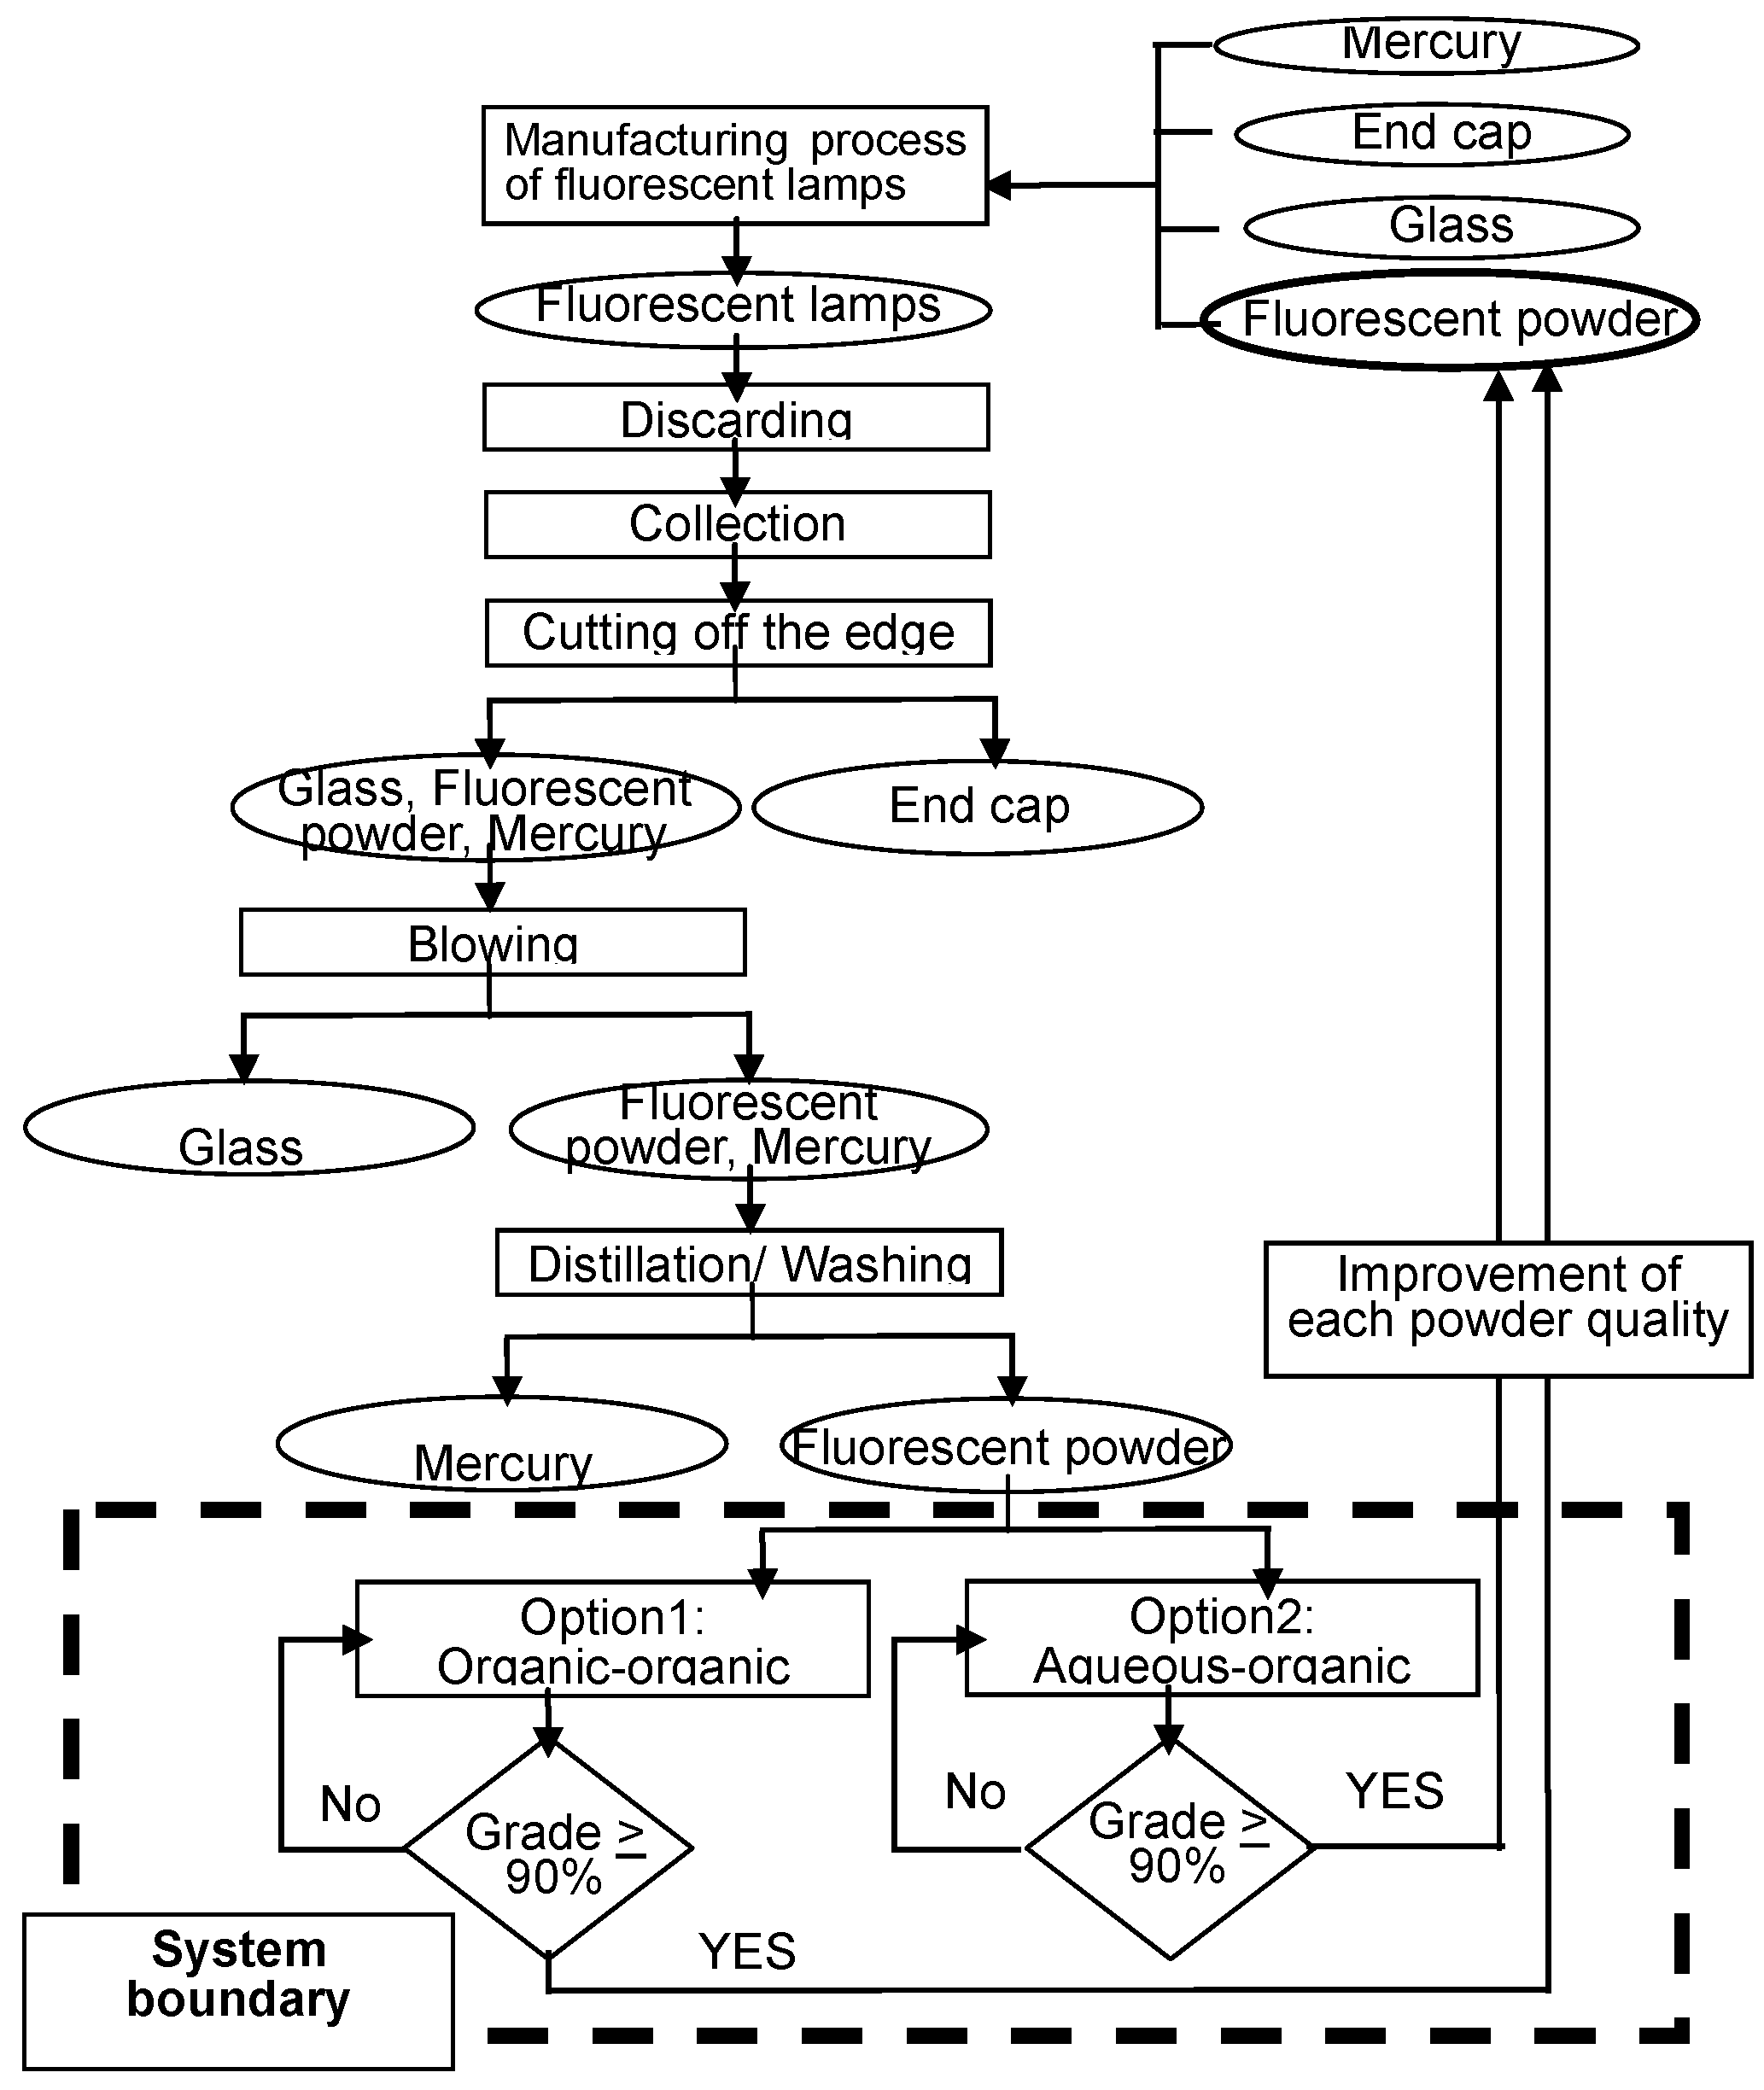
In order to select the most cost effective method, a cost comparison was performed in the following manner. It is important to note that the manufacturing processes of fluorescent lamps was not included in the analysis (Figure 16) since the influence of the process on the separation system of rare earth fluorescent powders is the same, regardless of the separation option. The process can be selected from two separation options, Option 1 for the organic-organic system (Section 4) and Option 2 for the aqueous-organic system (Section 3). In the present study, the mass of fluorescent powders to be separated is named as “processed mass Mg (kg)” (Figure 17). It is assumed that the processed mass is the mass for recovering 1kg of processed fluorescent powder concentrate after the separation process. With regard to the separation of fluorescent powders for recycling (i.e., Options 1 and 2, in Figure 16), the efficiency of the separation process was expressed as what is called “base grade” gb (gb1 for Option 1; gb2 for Option 2). The “base grade” is a technological parameter defined as the ratio between the total mass of a fraction 1 and the mass of material “a” in the fraction 1 after the separation process.
Grade ,   g b ( % ) = ( Mass   of   material   a   in   fraction   1   Total   mass   of   fraction   1 ) × 100   ( % )
The experimental works [13,14] showed that the “base grade” when separating the mixture of rare earth fluorescent powders (i.e., red, green, and blue) was (1) gb1 ≥ 90% (e.g., 90% grade of green) by Option 1 [14], and (2) gb2 <90% (e.g., 74% grade of blue) by Option 2 [13]. The end-user’s requirement i.e., the required grade of the separation process was expressed as what is called “rate of grade” gr. When gr > gb, a multi-stage separation process should be carried out.
The algorithm shown in Figure 17 was employed to evaluate: (1) the mass of rare earth fluorescent powder that should be processed to achieve the required “rate of grade” gr (denoted as Mg); (2) the mass of rare earth fluorescent powders collected after the separation process (denoted as Mc); (3) the “base grade” gb (gb1 for Option 1; gb2 for Option 2); (4) the required “rate of grade” gr; (5) the “base recovery” rb (rb1 for Option 1; rb2 for Option 2); and (6) the required “rate of recovery” rr. The algorithm (Figure 17) was also employed to calculate the number of separation Ns. The separation product(s) should be reprocessed in one or more cleaning stage(s) to achieve the required “rate of grade” gr, since the grade needs improvement to be greater than 90% when an aqueous-organic system is employed.
The total cost was calculated as follows. The total cost for recovering 1 kg of processed fluorescent powders was the multiplication of (a) the total cost for 1kg of processed fluorescent powders and (b) the processed mass for recovering 1 kg fluorescent powders. Here, the costs of solvent, surfactant, and electricity were regarded as the main process associated costs as defined by Equation (20).
Total   cost   ( USD   ( kg - recovery ) 1 ) = Total   cost   ( USD   ( kg - process ) 1 ) ×   Processed   mass   ( kg ) = ( ( Cost   of   solvent ) + ( cost   of   surfactant ) ) + ( cost   of   electricity ) ) × Processed   mass = ( ( So 1 + So 2 + + So n ) + ( Su 1 + Su 2 + + Su n ) ) + ( E ) ) × M g
where Son is the cost of solvent n, Sun is the cost of surfactant n, and E is the cost of electricity, and the processed mass was defined as follows:
Processed   mass   ( kg ) =   Collected   mass   ( 1 kg ) Recovery   M g = M c R

5.2.2. Goal Definition

Two separation methods for rare earth fluorescent powders, generated from discarded fluorescent lamps, were compared by calculating the costs in order to select the best method from the following two options:
  • Option 1: two-liquid flotation using the organic-organic system; and
  • Option 2: two-liquid flotation using the aqueous-organic system.
A simplified decision making chart of rare earth fluorescent powder recycling from fluorescent lamps, indicating the system boundary and describing the relationship between the processes involved, is shown in Figure 16. Rare earth fluorescent powders (i.e., red, green, and blue powders) together with other materials (glass, end cap, electrode, mercury, etc.) are used as raw materials in the manufacturing process of fluorescent lamps. After being used, the “old” fluorescent lamps are collected. Prior to recycling, the materials used in the fluorescent lamps are sorted and recovered. Finally, the rare earth fluorescent powders are separated by Option 1 or Option 2.
It should be noted that material recycling of each fluorescent powder is a more effective alternative if a high-purity product (i.e., the grade of product be higher than 90%) is achieved via a separation process [14]. For this purpose, two kinds of two-liquid flotation methods were compared for the separation of the rare earth fluorescent powders prior to their re-use in the production of fluorescent lamps [13,14] in terms of processing cost. A simplified flowsheet of the process for the separation of fluorescent powders according to their type is shown in Figure 18.

5.2.3. Results and Discussion on the Cost Comparison

The total cost for separating a mixture of the rare earth fluorescent powders was calculated. The total cost consists of the cost of reagents (i.e., solvent and surfactant) and electricity. The associated cost in each separation process (i.e., Option 1 and Option 2) is listed in Table 11. The cost increases with the number of separation process. Therefore, the number of the separation processes required to achieve higher than the rate of grade (90%) was determined as the first step of calculation.
The number of separation processes was evaluated based on the separation results of a three-powder mixture by Option 1 (Table 12) and Option 2 (Table 13). It should be noted that Option 1 provided over 90% grade of all three components (Table 12) whereas Option 2 obtained less than 90% grade of the blue powder (74.8%) (Table 13). Therefore, the blue powder product collected as the blue powder should be reprocessed in order to increase the grade of the powder for satisfying the end user’s requirement i.e., gr > 90%. The grade of the blue powder after multi-separation processes was estimated based on Equation (19).
The calculation results are shown in Table 14. The grade of the blue powder becomes higher than 90% (94.2%) after the 2nd cycle. Therefore, the re-processing step can stop after the second processing. The experimental and calculation results of separation of the powder mixture were summarized as the input parameters for further calculation (Table 15). Option 1 obtained over 90% grade and recovery of all three components after first processing (Ns = 1) whereas Option 2 obtained over 90% grade of all three components after an additional processing step (Ns = 2). Table 16 shows the overall calculation results according to the algorithm (Figure 17). Option 1 is a cost effective method, compared with Option 2. The difference between the two options was 85 USD (kg-recovery)−1.
Interpretation of the results was the last phase of the evaluation. The objective was to analyze results, reach conclusions based on the findings of the evaluation, and make recommendations for lowering the cost of the recycling system of rare earth fluorescent powder from discarded fluorescent lamps.
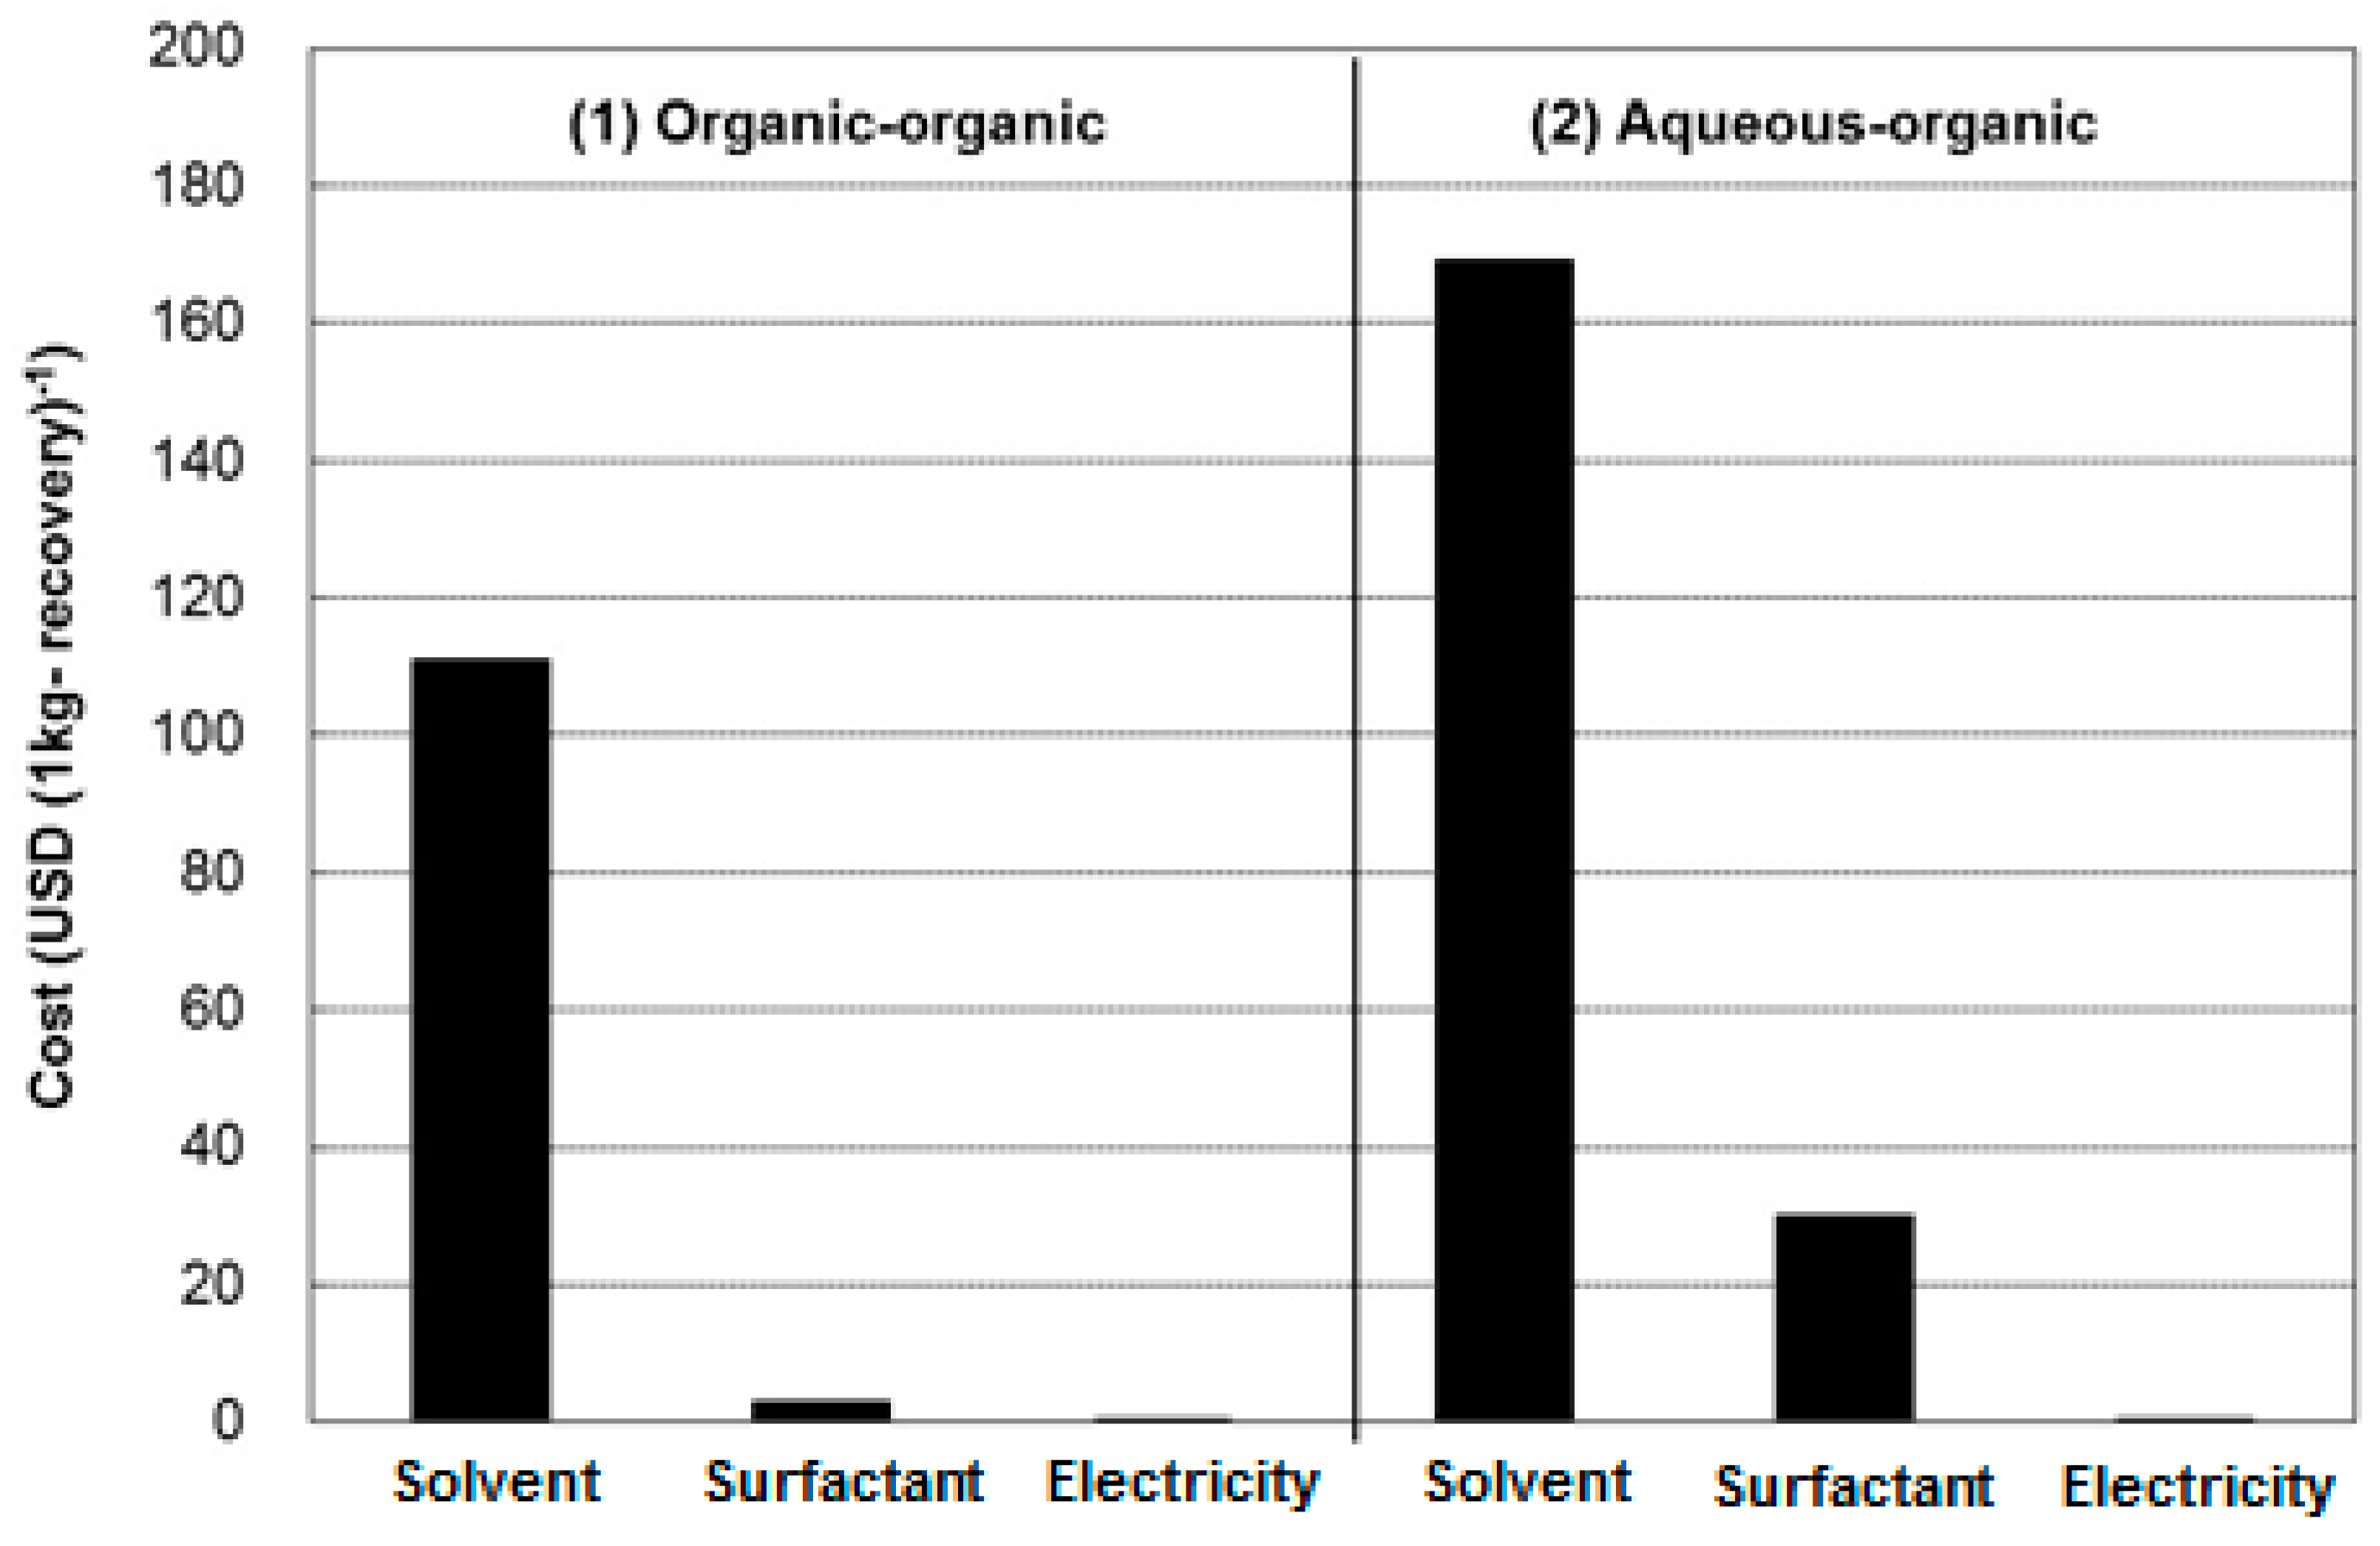
Figure 19 indicates the cost of each expense for the separation of a mixture of rare earth fluorescent powders (1 kg-recovery). It is worth mentioning that this cost calculation is based on the utilization of the reagent cost for a small quantity. Thus, the actual operational cost can be much more cost effective by applying the actual quantity of reagents used in the plant. On the other hand, in view of comparing two different two-liquid flotation options, this calculation still gives some insight on selecting the better options and understanding the contribution of each cost component. Since Option 2 requires cleaning (2nd processing of the 1st stage product recovered at the interface of two solvents), its cost for the separation process becomes higher than Option 1. This higher cost with Option 2 is explained by the fact that the costs of all the three components (i.e., solvent, surfactant, electricity) are higher in Option 2 than Option 1. Their differences are 58 USD with solvent, 27 USD with surfactant, and 0.09 USD with electricity. The differences contributed to the total cost of the separation process (Table 16). As a summary, Option 1 was a more cost effective method than the other Option 2.

6. Conclusions

This paper reviewed the studies on two-step two-liquid flotation for separating mixtures of three different powders (i.e., red, green, and blue). The aims were to extract the science behind the separation of ultra-fine fluorescent powders by two-liquid flotation, and to provide some useful feedback for their material recycling. For separating the three powder mixture, two different flowsheets composed of two-step separation were compared. Their major difference was the solvents used. The first flowsheet (called aqueous-organic system) employed water as a polar solvent and n-heptane as a non-polar solvent. The second flowsheet (called organic-organic system) utilized N,N-dimethylformamide, DMF as a polar solvent and n-heptane as a non-polar solvent. Based on the comparison, the organic-organic system showed a better separation performance (i.e., grade and recovery of all the separated fluorescent powders greater than 90%) and better cost effectiveness than the aqueous-organic system. This paper also reviewed the mechanism behind the separation, discussed the logical selection of polar solvent, a key factor determining the success of separation, and compared the costs associated with the two separation processes. Since the size of powders is several µm, i.e., too small for conventional mechanical froth flotation, two-liquid flotation poses a great potential to achieve successful separation of ultra-fine rare earth fluorescent powders prior to their material recycling.

Conflicts of Interest

The authors declare no conflict of interest.

Nomenclature

Roman Symbols
AHamaker constant (J)
aradius of particle (m)
anoradius of non-polar oil droplet (m)
cconcentration of surfactant (mol L−1)
Daverage particle size (m)
eelementary electrical charge (e = 1.60 × 10⁻¹⁹ C) (C)
Hdistance of separation (m)
kBoltzmann’s constant (k = 1.38 × 10⁻²³ J K−1) (J K−1)
NAAvogadro’s number (NA = 6.02 × 10²³ mol−1) (mol−1)
Tabsolute temperature (K)
VTtotal potential energy (J)
VApotential energy of interaction due to van der Waals forces (J)
VRpotential energy of interaction due to the overlap of the two electrical double layer (J)
zvalence of surfactant (−)
Greek Symbols
ɛrdielectric coefficient of the medium (F m−1)
ɛ0dielectric constant of the free space (ɛ0 = 8.55 × 10⁻¹² F m−1) (F m−1)
ψ1surface potential of particle (V)
ψ2surface potential of non-polar solvent (V)
κDebye-Huckel reciprocal length (m−1)
μviscosity of solvent (Pa s)
ρFdensity of fluorescent powder (kg m−3)
ρSdensity of solvent (kg m−3)
σelectric conductivity of DMF solvent (μS cm−1)
ζ1zeta potential of particle (V)
ζ2zeta potential of non-polar oil droplet (V)

References

  1. Shionoya, S.; Yen, M.W. Phosphor Handbook; CRC Press: Boca Raton, FL, USA, 1998; pp. 391–394. [Google Scholar]
  2. Japan Lighting Manufactures Association. Fluorescent Lamp Guidebook; Japan Lighting Manufactures Association: Tokyo, Japan, 2011; p. 14. [Google Scholar]
  3. Binnemans, K.; Jones, P.T.; Blanpain, B.; Gerven, T.V.; Yang, Y.; Walton, A.; Buchert, M. Recycling of rare earths: A critical review. J. Clean. Prod. 2013, 51, 1–22. [Google Scholar] [CrossRef]
  4. Rabah, M.A. Recovery of aluminium, nickel-copper alloys and salts from spent fluorescent lamps. Waste Manag. 2004, 24, 119–126. [Google Scholar] [CrossRef] [PubMed]
  5. Takahashi, T.; Takano, A.; Saito, T.; Nagano, N.; Hirai, S.; Shimakage, K. Separation and recovery of rare earth elements from phosphor sludge in processing plant of waste fluorescent lamp by pneumatic classification and sulphuric acidic leaching. J. MMIJ 2001, 117, 579–585. (In Japanese) [Google Scholar] [CrossRef]
  6. Takahashi, T.; Takano, A.; Saito, T.; Nagano, N.; Hirai, S.; Shimakage, K. Synthesis of red phosphor (Y2O3:Eu3+) from waste phosphor sludge by coprecipitation process. J. MMIJ 2002, 118, 413–418. (In Japanese) [Google Scholar] [CrossRef]
  7. Hirajima, T.; Sasaki, K.; Bissombolo, A.; Hirai, H.; Hamada, M.; Tsunekawa, M. Feasibility of an efficient recovery of rare earth-activated phosphors from waste fluorescent lamps through dense-medium centrifugation. Sep. Purif. Technol. 2005, 44, 197–204. [Google Scholar] [CrossRef]
  8. Hirajima, T.; Bissombolo, A.; Sasaki, K.; Nakayama, K.; Hirai, H.; Tsunekawa, M. Floatability of rare earth phosphors from waste fluorescent lamps. Int. J. Miner. Process. 2005, 77, 187–198. [Google Scholar] [CrossRef]
  9. Wu, Y.; Yin, X.; Zhang, Q.; Wang, W.; Mu, X. The recycling of rare earths from waste tricolor phosphors in fluorescent lamps: A review of processes and technologies. Resour. Conserv. 2014, 88, 21–31. [Google Scholar] [CrossRef]
  10. Tan, Q.; Li, J.; Zeng, X. Rare earth elements recovery from waste fluorescent lamps: A review. Crit. Rev. Environ. Sci. Technol. 2014, 45, 749–776. [Google Scholar] [CrossRef]
  11. Shergold, H.L.; Mellgren, O. Concentration of minerals at the oil/water interface. Trans. AIME 1970, 247, 149–159. [Google Scholar]
  12. Miettinen, T.; Ralston, J.; Fornasiero, D. The limits of fine particle flotation. Miner. Eng. 2010, 23, 420–437. [Google Scholar] [CrossRef]
  13. Otsuki, A.; Mei, G.; Jiang, Y.; Matsuda, M.; Shibayama, A.; Sadaki, J.; Fujita, T. Solid-Solid Separation of Fluorescent Powders By Liquid-Liquid Extraction Using Aqueous and Organic Phases. Resour. Process. 2006, 53, 121–133. [Google Scholar] [CrossRef]
  14. Otsuki, A.; Dodbiba, G.; Shibayama, A.; Sadaki, J.; Mei, G.; Fujita, T. Separation of rare earth fluorescent powders by two-liquid flotation using organic solvents. Jpn. J. Appl. Phys. 2008, 47, 5093–5099. [Google Scholar] [CrossRef]
  15. Zambrana, G.Z.; Medina, R.T.; Gutierrez, G.B.; Vargas, R.R. Recovery of minus ten micron cassiterite by liquid-liquid extraction. Int. J. Miner. Process. 1974, 1, 335–345. [Google Scholar] [CrossRef]
  16. Marinakis, K.I.; Kelsall, G.H. Effect of lattice cations, silicate ions and fluorosilicate ions on 2-liquid flotation of tungsten minerals. Trans. IMM Sect. C 1987, 96, 63–68. [Google Scholar]
  17. Laskowski, J.S.; Ralston, J. Colloid Chemistry in Mineral Processing; Elsevier: Amsterdam, The Netherlands, 1992; pp. 361–394. [Google Scholar]
  18. Otsuki, A.; Dodbiba, G.; Fujita, T. Two-liquid flotation: Heterocoagulation of fine particles in polar organic solvent. Mater. Trans. 2007, 48, 1095–1104. [Google Scholar] [CrossRef]
  19. Fuerstenau, D.W. Fine particle processing. In Proceedings of the International Symposium on Fine Particles Processing, Las Vegas, NV, USA, 24–28 February 1980; pp. 669–705. [Google Scholar]
  20. Kusaka, E.; Nakahiro, Y.; Wakamatsu, T. The role of zeta potentials of oil droplets and quartz particles during collectorless liquid-liquid extraction. Int. J. Miner. Process. 1994, 41, 257–269. [Google Scholar] [CrossRef]
  21. Otsuki, A.; Sadaki, J.; Yamaguchi, K.; Shibayama, A.; Fujita, T. Observation of Aggregate Structure of Green and Blue Fluorescent Powders Suspended in Heptane by Interactive Force Measurement. Int. J. Soc. Mater. Eng. Resour. 2006, 13, 86–91. [Google Scholar] [CrossRef]
  22. Kusaka, E.; Arimoto, Y.; Nakahiro, Y.; Wakamatsu, T. Collectorless liquid-liquid extraction of fine mineral particles using various organic liquids as the oil phase. Miner. Eng. 1994, 7, 39–48. [Google Scholar] [CrossRef]
  23. Kusaka, E.; Nakahiro, Y.; Wakamatsu, T. Collectorless liquid-liquid extraction of silica fines in trivalent metal salts solutions. Miner. Eng. 1995, 8, 817–828. [Google Scholar] [CrossRef]
  24. Hu, B.; Nakahiro, Y.; Wakamatsu, T. The effect of organic solvents on the recovery of fine mineral particles by liquid-liquid extraction. Miner. Eng. 1993, 6, 731–742. [Google Scholar] [CrossRef]
  25. Wang, L.P.; Kanemitsu, Y.; Dodbiba, G.; Fujita, T.; Oya, Y.; Yokoyama, H. Separation of ultrafine particles of alumina and zircon by liquid–liquid extraction using kerosene as the organic phase and sodium dodecylsulfate (SDS) as the surfactant collector for abrasive manufacturing waste recycling. Sep. Purif. Technol. 2013, 108, 133–138. [Google Scholar] [CrossRef]
  26. Kanemitsu, Y.; Wang, L.P.; Dodbiba, G.; Fujita, T. Liquid-Liquid Separation of Fine Zircon-Alumina Mixtures for Abrasives Recycling. Resour. Process. 2012, 59, 81–84. [Google Scholar] [CrossRef]
  27. Yoon, R.H.; Gupta, N.; Li, B.; Luttrell, G.H.; Bratton, R.C.; Reyher, J.; Suboleski, S. HHS process: A new approach for recovering fine Illinois basin coals. In Proceedings of the International Coal Preparation Conference, Louisville, KY, USA, 25–27 April 2016; pp. 99–106. [Google Scholar]
  28. Dodbiba, G.; Sadaki, J.; Okaya, K.; Shibayama, A.; Fujita, T. The use of air tabling and triboelectric separation for separating a mixture of three plastics. Miner. Eng. 2005, 18, 1350–1360. [Google Scholar] [CrossRef]
  29. Kusaka, E.; Tamai, H.; Nakahiro, Y.; Wakamatsu, T. Role of surface free energy in a solid surface during collectorless liquid-liquid extraction. Miner. Eng. 1993, 6, 455–464. [Google Scholar] [CrossRef]
  30. Van Uitert, L.G.; Conard, W.C.; Douglas, B.E. Studies on coordination compounds. III. The chelating tendencies of β–diketones with the chlorides of copper (II), nickel and barium in water-dioxane solutions. J. Am. Chem. Soc. 1953, 75, 457–460. [Google Scholar] [CrossRef]
  31. Ringbom, A. Complexation in Analytical Chemistry; Sangyo-Tosho: Tokyo, Japan, 1965; pp. 317–324. (In Japanese) [Google Scholar]
  32. The Chemistry Society of Japan (Ed.) Handbook of Chemistry, 5th ed.; Basic Edition Vol. II; Maruzen: Tokyo, Japan, 2004; pp. 149–152. [Google Scholar]
  33. Brown, T.; LeMay, H.; Bursten, B. Chemistry, 8th ed.; Prentice Hall: New York, NY, USA, 1997; pp. 616–620. [Google Scholar]
  34. Sawatani, T. Basic Analytical Chemistry; Nanko-do: Tokyo, Japan, 1972; pp. 210–211. (In Japanese) [Google Scholar]
  35. Asahara, S. Yozai Handbook (Solvent Handbook); Kodansha: Tokyo, Japan, 1976; pp. 156–158, 734–738. (In Japanese) [Google Scholar]
  36. Cote, A.P.; Shimizu, G.K.H. The supramolecular chemistry of the sulfonate group in extended solids. Coord. Chem. Rev. 2003, 245, 49–64. [Google Scholar] [CrossRef]
  37. Laskowski, J.; Iskra, J. Role of capillary effects in bubble-particle collision in flotation. Trans. Inst. Min. Metall. 1970, 79, C6–C10. [Google Scholar]
  38. Stratton-Crawley, R. Beneficiation of Mineral Fines-Problems and Research Needs; AIME: New York, NY, USA, 1979; pp. 317–330. [Google Scholar]
  39. Ralston, J.; Kent, W.; Newcombe, G. Polymer-stabilized emulsions and fine-particle recovery, i. The calcite-quartz system. Int. J. Miner. Process. 1984, 13, 167–186. [Google Scholar] [CrossRef]
  40. Kent, W.; Ralston, J. Polymer-stabilized emulsions and fine-particle recovery, ii. The chalcopyrite-quartz system. Int. J. Miner. Process. 1985, 14, 217–232. [Google Scholar] [CrossRef]
  41. Mackenzie, J.M.W. Interactions between oil drops and mineral surfaces. Trans. AIME 1970, 247, 202–208. [Google Scholar]
  42. Lai, R.W.M.; Fuerstenau, D.W. Liquid-liquid extraction of ultrafine particles. Trans. AIME 1968, 241, 549–556. [Google Scholar]
  43. Tamai, H.; Hakozaki, T.; Suzawa, T. Deposition of polymethyl methacrylate latex on fibers. Colloid Polym. Sci. 1980, 258, 870–876. [Google Scholar] [CrossRef]
  44. Gotoh, K.; Inoue, T.; Tagawa, M. Adhesion of nylon particles to a quartz plate in an aqueous solution and their removal by electro-osmosis. Colloid Polym. Sci. 1984, 262, 982–989. [Google Scholar] [CrossRef]
  45. Kallay, N.; Barouch, E.; Matijević, E. Diffusional detachment of colloidal particles from solid/solution interfaces. Adv. Colloid Interface Sci. 1987, 27, 1–42. [Google Scholar] [CrossRef]
  46. Furusawa, K.; Anzai, C. Heterocoagulation behaviour of polymer latices with spherical silica. Colloids Surf. 1992, 63, 103–111. [Google Scholar] [CrossRef]
  47. Mulvaney, P.; Perera, J.M.; Biggs, S.; Grieser, F.; Stevens, G.W. The direct measurement of the forces of interaction between a colloid particle and an oil droplet. J. Colloid Interface Sci. 1996, 183, 614–616. [Google Scholar] [CrossRef] [PubMed]
  48. Derjaguin, B.; Landau, L. Theory of the stability of strongly charged lyophobic sols and of the adhesion of strongly charged particles in solutions of electrolytes. Prog. Surf. Sci. 1993, 43, 30–59. [Google Scholar] [CrossRef]
  49. Verwey, E.J.W.; Overbeek, J.T.C. Theory of the Stability of Lyophobic Colloids; Elsevier Publishing Company Inc.: New York, NY, USA, 1948. [Google Scholar]
  50. Israelachvili, J. Intermolecular and Surface Forces, 2nd ed.; Academic Press: London, UK, 1992; pp. 176–212. [Google Scholar]
  51. Otsuki, A.; Dodbiba, G.; Fujita, T. Measurements of size distribution of titanium dioxide fine particles in a highly concentrated non-aqueous suspension by using particle self-assembly under an electric field. Adv. Powder Technol. 2012, 23, 517–522. [Google Scholar] [CrossRef]
  52. Crowl, V.T. Floculation, flotation and flooding in phthalocyanine/titanium dioxide pigmented paints. J. Oil Colour Chem. Assoc. 1967, 50, 1023–1059. [Google Scholar]
  53. Nacalai Tesque Co. Ltd., Japan, Chemical Catalog. Available online: http://www.nacalai.co.jp/online/online.html (accessed on 30 November 2017).
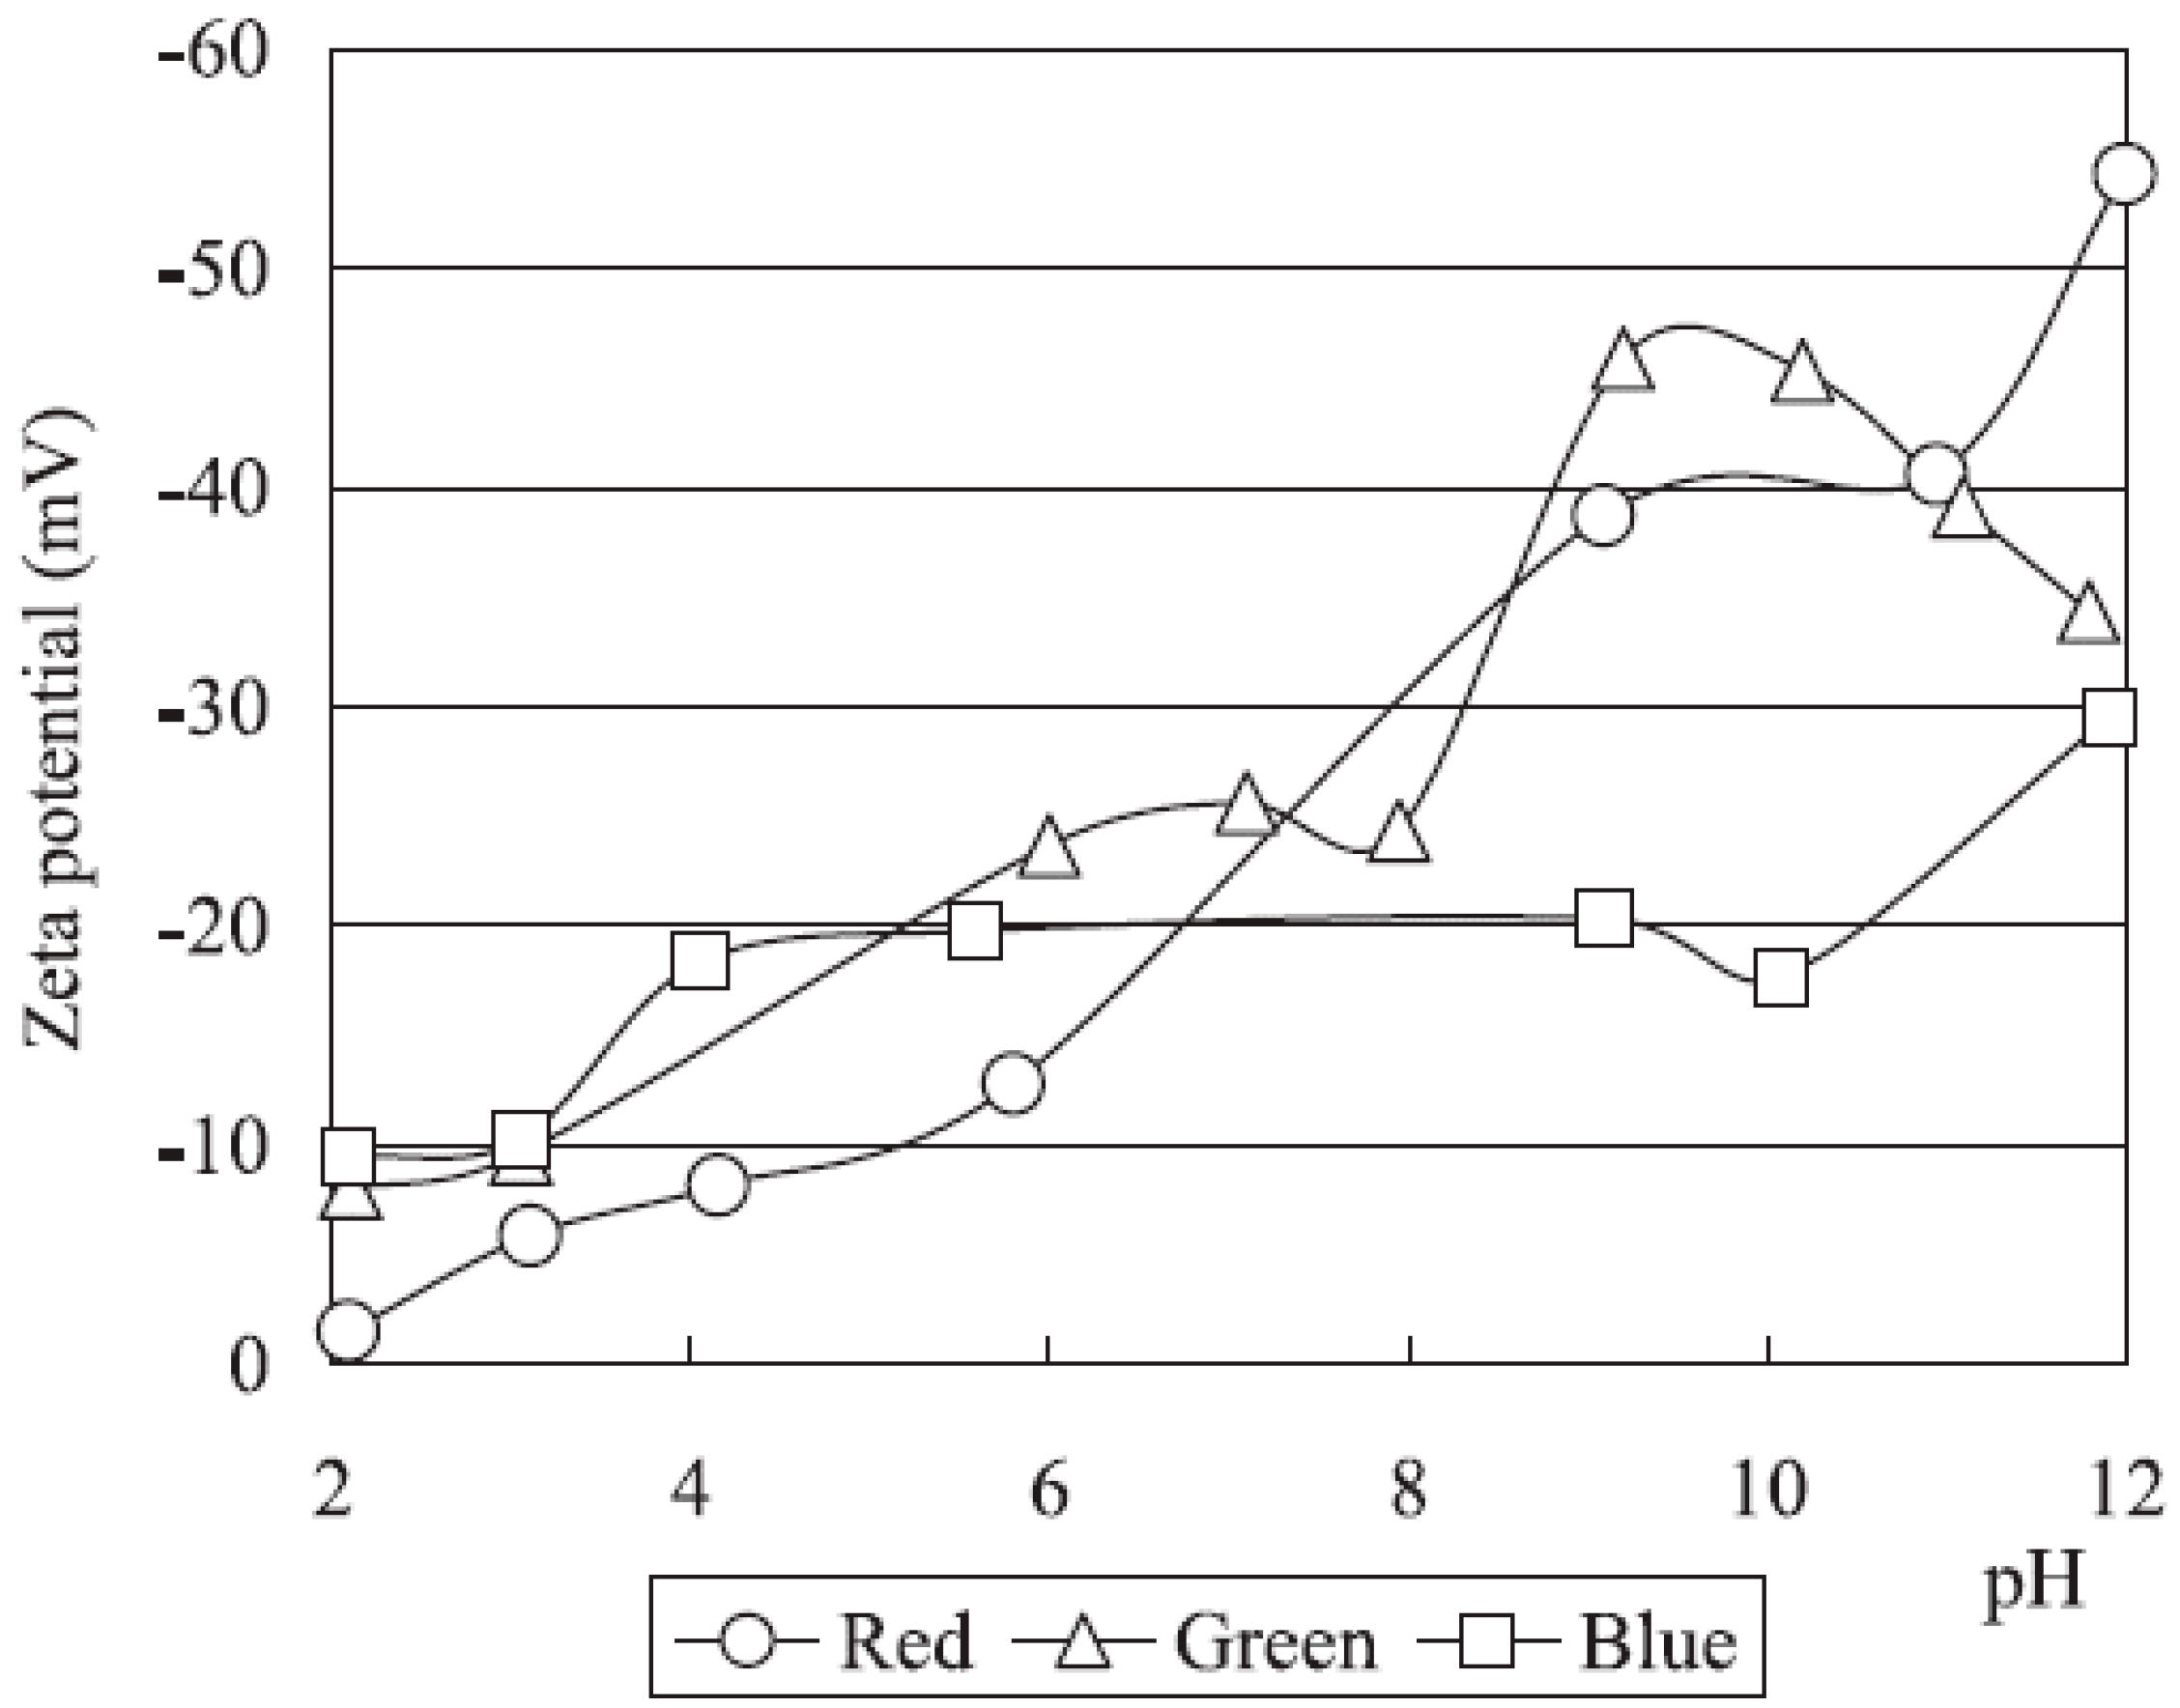
Figure 1. Zeta potential of the fluorescent powders studied in the aqueous-organic system [13] (permission obtained for reproduction).
Colloids 02 00007 g001
Figure 2. Flowsheet 1 for separating the artificial mixture of fluorescent powders in the aqueous-organic system (Modified from [13], permission obtained).
Colloids 02 00007 g002
Figure 3. Effect of the aqueous phase pH on the recovery of the fluorescent powders at the heptane-aqueous interface at the first separation stage of the aqueous-organic system (experimental conditions: 1% HTTA (2-thenoyltrifluoroacetone) in heptane; 1% PST (potassium sodium tartrate tetrahydrate) in aqueous phase; organic/aqueous ratio = 1/3) (Modified from [13], permission obtained).
Colloids 02 00007 g003
Figure 4. Concentration of HTTA species and hydroxyl ion as a function of the aqueous solution pH [13] (permission obtained for reproduction).
Colloids 02 00007 g004
Figure 5. Electric conductivity of the aqueous solution containing 1 × 10⁻⁵ mol/L HTTA as a function of Al3+ ion or Ba2+ ion concentration (Experimental conditions: pH 10 of the aqueous solution) [13] (permission obtained for reproduction).
Colloids 02 00007 g005
Figure 6. Effect of 1-pentanol concentration on the recovery of blue powder to the heptane-aqueous interface at the first separation stage of the aqueous-organic system (Experimental conditions: 1% PST in the aqueous phase; pH 10.3 of the aqueous phase; 0.25% HTTA in the heptane phase) (Modified from [13], permission obtained).
Colloids 02 00007 g006
Figure 7. Effect of Na2CO3 concentration on the recovery of blue powder to the heptane-aqueous interface at the first separation stage of the aqueous-organic system (Experimental conditions: 0.25% HTTA in the heptane phase; 1% PST in the aqueous phase; organic/aqueous ratio = 2/3 (v/v), pH 10.3 of the aqueous phase) (Modified from [13], permission obtained).
Colloids 02 00007 g007
Figure 8. Flowsheet 2 for separating the mixture of fluorescent powders in the organic-organic system [14] (Copyright (2008) The Japan Society of Applied Physics, permission obtained for reproduction).
Colloids 02 00007 g008
Figure 9. Zeta potential of fluorescent powders and n-heptane droplets as a function of surfactant concentration ((a) dodecyl amine acetate (DAA) and (b) sodium 1-octansulfonate) in DMF solvent. (Experimental conditions: volume of each sample = 20 mL; concentration of each fluorescent powders = 10 g L−1-DMF; concentration of n-heptane = 0.5 mL/mL) [18] (permission obtained for reproduction).
Colloids 02 00007 g009
Figure 10. Separation results of green powder as a function of solid concentration at the first separation stage in the organic-organic system. (Experimental conditions: mixing ratio of powders, red:green:blue = 1:1:1; mixing ratio of solvents, heptane:DMF = 1:1; 2 × 10⁻⁴ mol L−1 of DAA) [14] (Copyright (2008) The Japan Society of Applied Physics, permission obtained for reproduction).
Colloids 02 00007 g010
Figure 11. Separation results of a mixture of red and blue powders as a function of solid concentration at the second separation stage in the organic-organic system. (Experimental conditions: mixing ratio of powders, red:blue = 1:1; mixing ratio of solvents, heptane:DMF = 1:1; 20 × 10−4 mol L−1 sodium 1-octanesulfonate) [14] (Copyright (2008) The Japan Society of Applied Physics, permission obtained for reproduction).
Colloids 02 00007 g011
Figure 12. Adsorbed amount of surfactant on the fluorescent powders as a function of its initial concentration ((a) DAA, or (b) sodium 1-octanesulfonate) in the DMF solvent measured by colorimetric determination using bromophenol blue solution at pH 3 [18] (permission obtained for reproduction).
Colloids 02 00007 g012
Figure 13. Total potential energy, VT between a fluorescent particle and an n-heptane droplet in DMF solvent at a certain surfactant concentration as a function of their distance. (Concentration of surfactant: (a) DAA = 2 × 10⁻⁴ mol L−1, and (b) sodium 1-octanesulfonate = 20 × 10−4 mol L−1) [18], (permission obtained for reproduction).
Colloids 02 00007 g013
Figure 14. Behavior of hydrophobized and hydrophilic particles during the two-liquid flotation process of a fluorescent powder mixture from step (a) to (f). (a) The commencement of two-liquid flotation; (b) the attachment of surfactant onto the surface of target particles; (c) aggregate formation of hydrophobized target particles; (d) attachment of aggregate on the surface of a non-polar droplet; (e) movement of aggregate and non-polar droplet toward the non-polar solvent; (f) recovery of the aggregate at the interface of non-polar and polar solvents (Modified from [18], permission obtained).
Colloids 02 00007 g014
Figure 15. (a) Contact angle at glass-polar solvent-n-heptane interface, and (b) diffusion coefficient of fluorescent powders dispersed in two different polar solvents. Polar solvents used in this experiment were DMF and water. No surfactant was added. The inset in the graphic window of (a) is a schematic of the contact angle measurement [14] (Copyright (2008) The Japan Society of Applied Physics, permission obtained for reproduction).
Colloids 02 00007 g015
Figure 16. A simplified decision making chart of fluorescent powder recycling from fluorescent lamps, with the indication of the system boundary.
Colloids 02 00007 g016
Figure 17. Algorithm for calculating (1) the mass Mg of rare earth fluorescent powders passing through the separating devices in order to achieve the required “rate of grade” gr, and (2) the mass Mc i.e., the mass of rare earth fluorescent powders exiting the separation process.
Colloids 02 00007 g017
Figure 18. A simplified flowsheet of the process for the separation of the rare earth fluorescent powders according to their types.
Colloids 02 00007 g018
Figure 19. Summary of the process cost for the separation of a mixture of rare earth fluorescent powders (1 kg-recovery).
Colloids 02 00007 g019
Table 1. Elemental compositions of the fluorescent powders studied in the aqueous-organic system (Modified from [13]).
PowderFormulaElemental Content (%)
OYEuAlMgBaCeTb
RedY2O3: Eu3+17.567.26.5
GreenCeMgAl10O17: Tb3+42.6 31.35.7 9.55.3
BlueBaMgAl10O17: Eu2+42.3 1.932.42.712.4
Table 2. Summary of the separation results of the fluorescent powder mixture in the aqueous-organic system (adapted from [13]).
RedGreenBlueOverall Efficiency (%) *
Grade (%)Recovery (%)Grade (%)Recovery (%)Grade (%)Recovery (%)
96.994.194.676.074.198.747.9
* Calculated by using Equation (2).
Table 3. Chemical compositions and content of the three different fluorescent powders studied in the organic-organic system (adapted from [14]; Copyright (2008) The Japan Society of Applied Physics, permission obtained).
PowderFormulaComponentsContent (wt%)Average Particle Size D (μm)Density ρs (kg m−3)
RedY2O3: Eu3+Y2O391.62.65120
Eu2O37.8
GreenLaPO4: Tb3+,Ce3+P2O529.81.15060
La2O339.7
Ce2O317.9
Tb2O310.1
Blue(Sr,Ca,Ba)10(PO4)6Cl2: Eu2+P2O5252.14270
Al2O31.3
Cl1.1
CaO1.8
Fe2O30.014
SrO41.2
BaO27
EuO1.0
Table 4. Physical properties of solvents studied in the organic-organic system (Modified from [35]).
SolventFormulaViscosity μ (10−4 Pa s)Density ρs (kg m−3)Melting Point T (K)Boiling Point T (K)
n-HeptaneC7H164.09683183372
DMF(CH3)2NCHO8.02906213426
Table 5. Zeta potential of the red, green, and blue fluorescent powders studied in the organic-organic system and dispersed in n-heptane or N,N-dimethylformamide (DMF) without surfactant. (Experimental conditions: solid concentration of each powder in heptane was 10 g L−1) [14] (Copyright (2008) The Japan Society of Applied Physics, permission obtained).
SolventPowderZeta Potential (mV)
n-HeptaneRed−53.2
Green−12.6
Blue−28.3
DMFRed−51.2
Green−27.9
Blue−44.2
Table 6. Summary of the experimental results of a two-liquid flotation for separating the red, green, and blue fluorescent powders in the organic-organic system. (Experimental conditions: mixture ratio of red, green, and blue was 1:1:1; DAA concentration at first stage: 2 × 10⁻⁴ mol L−1; sodium 1-octanesulfonate concentration at second stage: 20 × 10−4 mol L−1; mixing ratio of solvent DMF: n-heptane: 1:1; solid concentration at first stage 30 g L−1, solid concentration at second stage 15 g L−1) [14] (Copyright (2008) The Japan Society of Applied Physics, permission obtained for reproduction).
First ProductSecond ProductThird ProductOverall Efficiency (%) *
(Green)(Blue)(Red)
Grade (%)Recovery (%)Grade (%)Recovery (%)Grade (%)Recovery (%)
90.095.292.291.895.390.962.8
* Calculated by using Equation (2).
Table 7. The Hamaker constants used in the calculation of the total potential energy.
MaterialHamaker Constant, A/J
Fluorescent powder; A11 *12.0 × 10−19 [50]
n-heptane; A223.6 × 10−20 [52]
DMF; A33 *26.1 × 10−20 [50]
*1 Hamaker constant of fluorescent powder is considered to be similar to the Hamaker constant of oxide. *2 Hamaker constant of DMF is considered to be similar to the Hamaker constant of formamide.
Table 8. Zeta potential and radius of the fluorescent powders (determined by interactive force apparatus (IFA)) dispersed in DMF used in the calculation of the total potential energy. The initial surfactant concentration in DMF solvent was 2 × 10⁻⁴ mol L−1 DAA at the 1st step, and 20 × 10−4 mol L−1 sodium 1-octanesulfonate at the 2nd step (Modified from [18]).
Separation StepPowderZeta Potential, ζ1/VRadius of Fluorescent Powder, a/m
1stRed−50 × 10-31.3 × 10−6
Green−14 × 10-37.0 × 10−6
Blue−40 × 10-31.1 × 10−6
2ndRed−27 × 10-31.3 × 10−6
Blue−6 × 10-31.7 × 10−6
Table 9. Zeta potential of n-heptane used in the calculation of the total potential energy. The initial surfactant concentration in DMF solvent was 2 × 10⁻⁴ mol L−1 DAA at the 1st step, and 20 × 10−4 mol L−1 sodium 1-octanesulfonate at the 2nd step (Modified from [18]).
Separation StepZeta Potential, ζ2/V
1st−53 × 10−3
2nd−53 × 10−3
Table 10. Concentration and valence of surfactant concentration used in the calculation of the total potential energy (Modified from [18]).
Separation StepSurfactantConcentration, c/mol L−1Valency, z/-
1stDAA2 × 10−41
2ndSodium 1-octanesulfonate20 × 10−4−1
Table 11. Reagents used in the separation process of rare earth fluorescent powders.
MethodType of ReagentSymbolsNamePrice (USD L−1, or USD kg−1) *
Organic-organicSolventSo1 (1st/2nd)N,N-Dimethylformamide (DMF)23.0
So2 (1st/2nd)n-Heptane81.0
SurfactantSu1Dodecylamine acetate (DAA)4240.0
Su2Sodium 1-octanesulfonate5800.0
Aqueous-organicSolventSo3 (1st/2nd)Water0.0013
So4 (1st)n-Heptane22.0
So5 (2nd)Chloroform81.0
SurfactantSu32-Thenoyltrifluoroacetone (HTTA)4240.0
Su41-Pentanol44.0
Su5Potassium sodium tartrate tetrahydrate (PST)440.0
Su6Sodium bicarbonate14.8
* [53].
Table 12. Mass deportment, grade, and recovery of the rare earth fluorescent powders before and after two-liquid flotation using the organic-organic phases (option 1). The results in Table 6 were used for the calculation assuming the feed powder mixture is composed of 1 kg of the 3 different powders (green:blue:red = 1:1:1).
1st stage Mass (kg)Grade, gb1 (%)Recovery, rb1 (%)
GreenOthersGreenOthersGreenOthers
Feed1.002.0033.366.6100.0100.0
Interface0.950.1190.010.095.25.3
In DMF phase0.051.892.597.54.894.7
2nd stage Mass (kg)Grade, gb1 (%)Recovery, rb1 (%)
BlueRedBlueRedBlueRed
Feed0.950.9548.948.794.994.5
Interface0.950.0892.27.895.39.1
In DMF phase0.070.848.291.84.790.9
Table 13. Mass deportment, grade, and recovery of the rare earth fluorescent powders before and after two-liquid flotation using the aqueous-organic phases (Option 2). The results in Table 2 were used for the calculation assuming the feed powder mixture is composed of 1 kg of the 3 different powders (green:blue:red = 1:1:1).
1st stage Mass (kg)Grade, gb2 (%)Recovery, rb2 (%)
BlueOthersBlueOthersBlueOthers
Feed1.002.0033.366.6100.0100.0
Interface0.990.3474.125.998.717.2
In aqueous phase0.011.660.899.21.382.8
2nd stage Mass (kg)Grade, gb2 (%)Recovery, rb2 (%)
GreenRedGreenRedGreenRed
Feed0.820.8449.050.281.883.7
Interface0.760.0694.65.476.05.9
In aqueous phase0.030.823.196.924.094.1
Table 14. Calculated separation results of the mixture of rare earth fluorescent powders for purifying the grade of the blue powder by two-liquid flotation using the aqueous-organic phases (Option 2).
2nd Processing at 1st StageMass (kg)Grade, gb2 (%)Recovery, rb2 (%)
BlueOthersBlueOthersBlueOthers
Feed0.990.3474.125.998.717.2
Interface0.960.0694.25.897.43.0
In aqueous phase0.030.298.291.82.697.0
Table 15. Summary of separation results of the rare earth fluorescent powders for the cost comparison.
Organic-organic phasesFirst Product (Green)Second Product (Blue)Third Product (Red)Total Efficiency (%)
Grade, gb1 (%)Recovery, rb1 (%)Grade, gb1 (%)Recovery, rb1 (%)Grade, gb1 (%)Recovery, rb1 (%)
90.0 95.292.295.391.8 90.962.8
Aqueous-organic phases *First Product (Blue)Second Product (Green)Third Product (Red)Total Efficiency (%)
Grade, gb2 (%)Recovery, rb2 (%)Grade, gb2 (%)Recovery, rb2 (%)Grade, gb2 (%)Recovery, rb2 (%)
94.2 97.494.676.096.994.160.1
* after 2nd processing of the blue product.
Table 16. Process cost calculated based on the algorithm shown in Figure 17.
Organic-Organic (Option 1)Aqueous-Organic (Option 2)
ReagentCost (USD (kg-Process)−1)Cost (USD (kg-Recovery)−1)ReagentCost (USD (kg-Process)−1)Cost (USD (kg-Recovery)−1)
So123.0024.54So30.00180.0020
So281.0086.44So4129.60148.75
So517.6020.20
Subtotal104.00110.99Subtotal147.20168.95
Su10.210.22Su321.2024.33
Su22.512.68Su40.000220.00025
Su55.055.80
Su60.090.11
Subtotal2.722.90Subtotal26.3430.24
Electricity0.130.14Electricity0.200.23
Number of separation cycle required1Number of separation cycle required2 (for 1st stage)
Collected mass (kg)1Collected mass (kg)1
Processed mass (kg)1.07Processed mass (kg)1.15
Recovery(total)0.94Recovery(total)0.89
Total Cost (USD (kg; process)−1)106.9Total Cost (USD (kg; process)−1)173.7
Total Cost (USD (kg; recovery)−1)114.0Total Cost (USD (kg; recovery)−1)199.4