


Abstract
Large language models (LLMs) show promise for grading open-ended assessments but still exhibit inconsistent accuracy, systematic biases, and limited reliability across assignments. To address these concerns, we introduce SURE (Selective Uncertainty-based Re-Evaluation), a human-in-the-loop pipeline that combines repeated LLM prompting, uncertainty-based flagging, and selective human regrading. Three LLMs—gpt-4.1-nano, gpt-5-nano, and the open-source gpt-oss-20b—graded answers of 46 students to 130 open questions and coding exercises across five assignments. Each student answer was scored 20 times to derive majority-voted predictions and self-consistency-based certainty estimates. We simulated human regrading by flagging low-certainty cases and replacing them with scores from four human graders. We used the first assignment as a training set for tuning certainty thresholds and to explore LLM output diversification via sampling parameters, rubric shuffling, varied personas, multilingual prompts, and post hoc ensembles. We then evaluated the effectiveness and efficiency of SURE on the other four assignments using a fixed certainty threshold. Across assignments, fully automated grading with a single prompt resulted in substantial underscoring, and majority-voting based on 20 prompts improved but did not eliminate this bias. Low certainty (i.e., high output diversity) was diagnostic of incorrect LLM scores, enabling targeted human regrading that improved grading accuracy while reducing manual grading time by 40–90%. Aggregating responses from all three LLMs in an ensemble improved certainty-based flagging and most consistently approached human-level accuracy, with 70–90% of the grades students would receive falling inside human-grader ranges. A reanalysis based on outputs from a more diversified LLM ensemble comprised of gpt-5, codestral-25.01, and llama-3.3-70b-instruct replicated these findings but also suggested that large reasoning models such as gpt-5 might eliminate the need for human oversight of LLM grading entirely. These findings demonstrate that self-consistency-based uncertainty estimation and selective human oversight can substantially improve the reliability and efficiency of AI-assisted grading.
1. Introduction
Studies have found that large language models (LLMs) can grade coding tasks [1], short answers to open questions [2,3], and student essays [4,5] with good performance. Grading open forms of assessment manually can be time-consuming and boring, but they are often better measures of student ability than multiple-choice questions [2,6]. Using LLMs for grading would allow teachers to rely on open forms of assessment while saving considerable time [1,2]. Teachers could use this time to improve educational materials or tutoring students, making LLM grading a win-win for students and teachers alike. However, despite promising early findings, it remains unclear whether LLMs can grade accurately and fairly across assignments, courses, and programs, or if they are only accurate for specific cases. Consequently, multiple authors advise against fully automating the grading process at this point [2,7,8]. This sentiment is mirrored by the European Union’s artificial intelligence (AI) act, which classifies AI grading as “high risk” and mandates human oversight [9]. To address this, we introduce SURE (Selective Uncertainty-based Re-Evaluation), a human-in-the-loop pipeline that combines automated LLM grading with uncertainty-based flagging and human review.
Specifically, we propose repeatedly prompting LLMs to score the same student answer to obtain a distribution of candidate scores, from which to derive a predicted score (e.g., mean, median, mode, etc.) and certainty estimate (e.g., standard deviation, entropy, etc.). Then, any low-certainty scores (e.g., falling below a threshold) can be flagged and later manually graded by a teacher. Repeatedly sampling from LLMs and aggregating their outputs serves two purposes. First, aggregating results across prompts may improve grading accuracy: instead of relying on a single score, multiple samples might allow the model’s judgments to converge toward a more reliable estimate. In line with this assumption, previous studies have reported that repeated prompting can sometimes improve LLM-grading [10,11]. Second, by examining the variability across samples, we aim to quantify uncertainty and flag questionable grades. We assume that when a grading task falls well within the LLM’s training distribution, it will consistently assign the correct score or at least do so on average across repeated samples. In contrast, when a task is underrepresented, ambiguous, or absent from the training data, we expect greater variation in the scores, as the model may hallucinate or explore multiple plausible solutions rather than settling on a single, well-defined answer. This idea parallels the “self-consistency” approach introduced by ref. [12], who showed that aggregating answers from multiple reasoning paths not only improved overall accuracy but that the level of agreement among samples could serve as a measure for uncertainty. In line with their findings, recent papers have successfully utilized self-consistency-based uncertainty metrics to improve LLM performance in the context of question answering [13,14,15].
Combining automated assessment with human review of uncertain cases [16] has been suggested for other high-risk applications, such as medical diagnosis [17] and financial fraud detection [18]. Similarly, [8] evaluated a related procedure for grading: they obtained ten independent LLM-generated scores per student response, averaged these scores, and compared the mean to predictions from item response theory (IRT) to estimate grading uncertainty and identify responses requiring human review. They found that uncertainty-based thresholding improved the LLM grading accuracy for physics exams [8].
The effectiveness of the SURE pipeline we propose depends critically on the diversity of LLM outputs that arises from repeated prompting. If repeated scores are always identical, uncertainty estimates become meaningless, and we cannot reliably distinguish between easy-to-grade cases and those that require human review. We explored several strategies for increasing output diversity by influencing the stochasticity and variability of LLM responses.
First, we varied temperature and top-p parameters to control token-level randomness: lower values make outputs more deterministic, while higher values encourage more varied responses [19,20,21]. For reasoning models that do not expose these parameters, we instead varied text verbosity, which affects the length of responses [22].
Second, we introduced several prompt perturbations designed to elicit different reasoning paths without changing the prompt content. Specifically, we explored shuffling the order of rubric criteria, instructing LLMs to adopt different grader personas (e.g., strict vs lenient), and prompting them in different languages. Critically, our goal here was not to investigate how LLM-grading fared under different prompting conditions or in multilingual educational contexts; instead, our aim was only to increase output variability. Prior work shows that LLMs are sensitive not only to a prompt’s semantic content but also to its phrasing and presentation [23,24,25], and that leveraging such diversification can improve uncertainty estimation [26]. These effects may be especially pronounced in cases where the model has not converged on a stable reasoning path and may help reveal those instances in which its grading is unreliable.
Third, we investigated LLM ensembles—aggregating the outputs of multiple models rather than relying on a single one—to increase output diversity and reduce model-specific biases. This approach builds on the idea of ensemble learning, where combining several imperfect predictors often yields more robust performance, as seen in methods such as bagging and random forests [27]. Similar ideas are now being explored for LLMs [28,29,30] and they might be particularly useful for estimating (un)certainty: because different LLMs are trained on distinct data and optimization objectives, their outputs might vary in informative ways when evaluating the same student response [14,15]. Aggregating these diverse perspectives might stabilize majority-voted scores, especially when certain models are better suited to specific response types. For example, in a methods course, a model fine-tuned for mathematical or formal reasoning (e.g., Minerva [31]) may be better suited for evaluating answers to quantitative questions, whereas a general instruction-tuned model may perform better when assessing conceptual responses about experimental design. While either model alone may be imperfect outside its area of specialization, aggregating their independent judgments could yield more stable majority-voted scores. Moreover, high agreement between multiple heterogeneous LLMs (i.e., high certainty) may serve as a strong indicator that the assigned score is reliable and does not require human review.
We investigated SURE using data from an introductory programming course for psychology students [1]. Students learned basic programming concepts and how to construct data-processing pipelines and visualizations in R [32] and, optionally, Python [33]. The course comprised four take-home assignments and an in-class exam. Tasks frequently combined coding exercises with open-ended conceptual questions, and students were given substantial freedom in how to structure their solutions. As a result, solutions were highly heterogeneous (e.g., when asked to compute a mean, one student might simply call mean(), another might print the result, and a third might assign it to a variable).
Because assignments mixed executable code, conceptual explanations, and flexible solution paths—and because students were not instructed to produce standardized, testable outputs—the rubrics were designed for manual evaluation rather than automated unit-test-based assessment. This design choice reflects a broader observation in the automated grading literature: traditional systems for programming assignments are highly effective for functional correctness but struggle to assess documentation, conceptual explanations, or the alignment between code and prose. Additionally, writing unit tests can be incredibly time-consuming, especially when students are allowed to solve problems in different ways, and when partial credit is awarded for incomplete or incorrect solutions [34].
Under these circumstances, LLM-assisted grading becomes a promising candidate for reducing grading workload. LLMs can be prompted directly with the same natural-language rubrics used for manual grading, enabling flexible assessment of both code correctness (e.g., correctly implementing a loop), open-ended components (e.g., explaining that division by FALSE is like division by zero), and conceptual tasks (e.g., describing and making improvements to a plot) within a unified framework and without time-consuming test generation.
In earlier work, we graded student responses from this course using gpt-4o [35] and compared the results to instructor scores students received during the course. We found that gpt-4o consistently awarded substantially lower grades than human graders [1], which resonates with prior research into LLM-based grading of programming assignments where LLMs were systematically stricter than teachers [36,37]. A qualitative inspection revealed distinct error patterns for both LLMs and humans. The LLM sometimes deviated from rubric instructions, penalized unconventional but correct solutions, failed at tasks like counting lines of code or interpreting plots, or applied criteria too literally. Human graders, in turn, occasionally overlooked rubric elements or made minor oversight errors [1], indicating that some of the lower LLM scores were justified and highlighting that human grading is not infallible [38]. Based on these findings, we revised several rubrics to make them more explicit and easier to follow for both humans and LLMs. Additionally, instead of relying on the assessment of a single human grader, four of the authors used the revised rubrics to independently grade all student responses. This enabled us to use the majority-voted human score (or tied scores) for each student answer as a more robust reference for evaluating LLM-based grading with and without SURE. All revised rubrics, prompts, and code are available at https://github.com/lukekorthals/sure (accessed on 21 January 2026).
2. Related Work
Automated grading has been researched for more than half a century, initially focusing on closed-form assessment formats such as multiple-choice and fill-in-the-blank items, where correctness can be determined through exact matching, predefined answer sets, or rule-based heuristics [39,40,41].
In parallel, researchers also investigated automated scoring of open-ended responses, exploring how aspects of writing quality and content understanding could be captured computationally. Early work relied on surface-level textual features [42], followed by approaches incorporating deeper semantic information such as semantic similarity [43], and more recently by deep neural networks that learn task-relevant representations directly from data [44,45,46]. Notably, already more than two decades ago, several automated grading systems had been developed and deployed in educational settings [47,48].
The automated assessment of programming assignments has a long history and represents a distinct strand within automated grading research. Many aspects of coding education can be assessed automatically using dynamic analysis (e.g., unit tests executed against instructor-defined test suites) and static analysis (e.g., linters and style checkers that inspect code without execution) [34,49,50]. Classical autograders primarily target functional correctness through input–output matching or comparison with reference implementations [34]. Static analyses further support evaluation of code quality and readability, for example by detecting unused variables, formatting violations, or overly complex control flow. Some systems additionally assess runtime performance, memory usage, plagiarism, or the quality of student-written tests (e.g., via coverage metrics) [34,49,50]. In well-specified tasks with clearly defined outputs, such systems are highly reliable, scalable, and time-efficient, and have become standard practice in many computer science courses and large-scale online platforms [49,50,51].
However, this reliability depends on careful task design: expected outputs must be precisely specified, solution formats sufficiently constrained, and edge cases enumerated in advance [34,51]. When assignments allow heterogeneous solution paths, award partial credit for incomplete reasoning, or require conceptual explanations alongside code, purely test- or rule-based automation becomes substantially more difficult. This distinction is central to our setting: the assignments and rubrics evaluated here intentionally include such open-ended components, making it infeasible to retroactively assess them using such traditional approaches.
The ability of modern large language models (LLMs) to handle a wide range of tasks suggests a potential unification of automated grading across domains: unlike earlier approaches, LLMs can be prompted with natural language instructions and rubrics to assess essays [4], short answers [2,3,52], and programming assignments [1,37]. To improve alignment with human judgments, prior studies have explored a range of techniques including prompt engineering with rubric conditioning, few-shot prompting, and chain-of-thought reasoning [53,54,55], as well as retrieval-augmented generation [52,56] and task-specific fine-tuning [57]. Despite these advances, results consistently show sensitivity to prompt design, systematic biases, and non-trivial disagreement with human graders, leading to a broad consensus that LLM-based grading should be deployed with caution rather than as a fully automated replacement for human assessment [1,2,7,8,37].
Within programming education specifically, recent work has begun to systematically evaluate LLMs as graders of coding assignments. Large-scale comparisons across multiple contemporary models reveal substantial variation in grading strictness, score distributions, and agreement with instructors, with only moderate alignment achieved in many cases [37]. Classroom-based studies likewise report that LLMs tend to correlate with human judgments while systematically underscoring relative to instructors, highlighting both their promise and limitations for summative assessment [1,36]. Detailed rubric criteria can improve alignment but do not fully eliminate disagreement with human raters [1,58]. Taken together, these findings suggest that while LLMs offer a flexible and scalable alternative to traditional test-based autograders for programming assignments, their outputs remain variable and model-dependent, motivating human-in-the-loop frameworks like SURE.
Importantly, human grading itself is imperfect, with multiple raters frequently disagreeing [38,59] and human graders sometimes making errors that LLMs avoid [1]. Nevertheless, human scores remain the benchmark against which automated systems are evaluated because they reflect established educational practice and accountability structures [9].
3. Materials and Methods
3.1. Data
We used data from 46 graduate students enrolled in an introductory programming course described in ref. [1]. The five graded assignments consisted of 130 coding exercises in R and Python, and open questions about programming, science, and psychology. Each question was scored between 0 and 1 in 0.25 increments based on subtractive rubric criteria (e.g., “subtract 0.5 points if the student did not set their working directory correctly”). Based on our earlier findings [1], we revised the rubrics to prevent avoidable LLM mistakes. For example, gpt-4o would frequently penalize students who wrote variations of “you cannot divide by 0” because the rubric specified to “subtract 1 point if student doesn’t explictly mention division by zero” [1]. We revised that rubric to say: “Subtract 1 point if the student did not somehow explain or mention that you cannot divide by zero”. While the earlier rubric resulted in 45% of student answers to this question being scored incorrectly, the revised version resulted in only 14% incorrectly scored student answers across all fully automated grading conditions evaluated on the training set that are described later in this article. This finding underscores how important rubric formulation is for LLM-grading. All assignment questions and rubrics are available on GitHub https://github.com/lukekorthals/sure (accessed on 21 January 2026) and can be compared with the resources used for ref. [1] at https://github.com/lukekorthals/canvas-llm-integration (accessed on 19 August 2025). To compare findings here with those from our earlier study, we prompted gpt-4o [35] to score all student responses based on the new rubrics.
Four of the authors independently graded the student answers to obtain reliable ground-truth scores. Graders 1, 2, and 4 graded all assignments, while grader 3 only graded the first and last assignments. For this, we built a Dash app [60] that let graders score answers question-by-question in random student order while recording the time between opening and submitting each score, enabling estimates of potential time savings. Missing answers were automatically assigned zero points and zero seconds. Because graders occasionally left the app open during breaks, any recorded time above the 99th percentile was treated as unrealistic and replaced with the mean time recorded by the other graders for that same answer.
We defined the ground truth for each student answer as the score most frequently awarded by the four human graders. For ties, all tied scores were treated as valid ground-truth values. For each grader, we marked a score as correct if it matched any ground-truth value and incorrect otherwise. The relative frequency of correct scores across assignments, questions, or students provided a measure of grading accuracy. Because we previously found substantial underscoring by gpt-4o [1], we also examined grading bias by calculating the signed deviation from the closest ground-truth value of each score. Averaging these deviations across grouping variables yielded a measure of systematic over- or underscoring. We later computed the same accuracy and bias metrics for all LLM graders to compare their performance under fully automated and human-in-the-loop SURE grading with that of the human graders.
We had no strong a priori hypotheses and wanted to explore many different LLM configurations and certainty thresholds. To ensure conservative estimates of the effectiveness and efficiency of the proposed SURE pipeline, we used the first programming assignment (47 questions) as a training set for exploration and to select a fixed certainty threshold and single diversification strategy. Afterwards, we used the remaining four programming assignments (34, 27, 8, and 14 questions respectively) to compare the performance of SURE to manual and fully automated grading. Assignment 4 originally had 10 questions, but we removed two advanced questions because they required graders to run a program for counting lines or opening a link to evaluate a Dash app, for which our LLM grading setup was not suited.
Graders and LLMs were instructed to score individual student answers between 0 and 1, which formed the basis for all question-level analysis. However, for decision-makers evaluating the efficacy of LLM-grading, alignment at the level of assignment grades is also relevant. For this, we computed grades on the Dutch 10-point grading scale. In the first assignment, students had to answer 30 basic R questions (worth 8 grade points) and either 9 Python or 8 advanced R questions (worth 2 grade points). Assignments 2 and 3 used the same grading logic with different numbers of R, advanced R, and Python questions. For assignment 4 we only considered R questions because we excluded the advanced questions. For assignment 5 (the exam) students had to complete 14 out of 16 available questions (R or Python):
To assess the reliability of the human reference scores, we evaluated interrater reliability at both the level of individual question scores and aggregated assignment grades. Reliability was quantified using intraclass correlation coefficients under a two-way random-effects model with absolute agreement (ICC[2,1]) [61]. To complement the ICC estimates, we additionally fitted linear mixed-effects models to decompose score variance into components attributable to students, questions, assignments, graders, and residuals. To examine potential grader bias toward specific students, we additionally tested for grader–student interaction effects by including a grader × student random effect. All reliability analyses were conducted in R using the psych [62] and lme4 [63] packages.
3.2. SURE Pipeline
3.2.1. Repeated Prompting for Score Prediction and Uncertainty Estimation
We graded each student answer with 20 repeated prompts, selected the most frequent score as the predicted score and its relative frequency as the model’s certainty. With 20 prompts, certainty could vary between 0 and 1 in increments of 0.05. In rare cases (≤0.01% of processed prompts), LLM runs produced fewer valid responses due to API or parsing errors, resulting in coarser certainty estimates (the smallest number of valid iterations for a student answer was 16). We landed on 20 iterations because it struck a balance between costs and precision—more prompts might improve certainty estimation, but would also increase API costs and the time to process them. Estimating certainty this way focuses only on the peak (the most frequent score) of the distribution of plausible scores and disregards potentially informative aspects of its shape, such as skewness, spread, or multimodality. While this simplification ignores some potential uncertainty cues, we used it here to get a first estimate of the effectiveness of the proposed pipeline and to maintain an uncertainty metric that is intuitively interpretable (i.e., “What percentage of runs produced this grade?”). In response to reviewer feedback on a previous version of this article, we fit frequentist logistic mixed-effects models including two additional uncertainty metrics: the Simpson index [64], which captures the concentration of probability mass, and the mean absolute deviation from the modal score, which quantifies the extremity of disagreement. Both metrics predicted correctness, and all three uncertainty measures remained significant in a combined model (). However, model comparisons using AIC [65] and BIC [66] indicated that none of the models outperformed the model including only the simple certainty metric based on the relative frequency of the most frequent score. This suggests that, although additional uncertainty signals were present, they did not provide sufficient incremental predictive value to justify increased model complexity in the present study. Importantly, these and other candidate uncertainty metrics were highly correlated here. While correlations between different variability metrics were expected, restricting scoring to discrete values between 0 and 1 in increments of 0.25 might have exaggerated these correlations, and in other contexts alternative uncertainty metrics might prove more useful.
3.2.2. Flagging Low-Certainty Scores and Simulating Human Regrading
Predicted scores with certainties below a selected threshold were flagged for simulated human review. Thus, the threshold determined the trade-off between human effort and grading accuracy: a lower threshold reduced effort but risked overlooking incorrect scores, while a higher threshold increased human workload but (thereby) improved accuracy. Flagged cases can be understood as true positives (TP), false positives (FP), true negatives (TN), and false negatives (FN):
- TP: LLM is uncertain (flagged) and incorrect—a useful flag;
- FP: LLM is uncertain (flagged) but correct—unnecessary teacher effort;
- TN: LLM is confident (unflagged) and correct—ideal automatic grading;
- FN: LLM is confident (unflagged) but incorrect—undetected error.
In the training set, we selected the threshold () that maximized the score. Similar to ref. [8], we chose the metric because it balances accuracy with human workload. In other words, it tries to catch as many incorrect scores (TP), while avoiding unnecessary flags (FP) that would inflate teacher effort.
To assess the effectiveness of the SURE pipeline, we simulated manual regrading by replacing predicted scores of flagged cases with randomly sampled scores from one of the human graders and recalculating correctness (matching ground truth) and bias (signed deviation from closest ground truth). Sampling randomly from the human graders accounts for the fact that they also sometimes make mistakes, and by doing so, we allowed regrading to introduce mistakes when uncertain yet correct scores were replaced with human scores which deviated from the ground truth.
3.3. LLM Configurations and Diversification Strategies
We prompted three LLMs to respond with structured JSON outputs (see Listings A1 and A2): gpt-4.1-nano, a closed-source non-reasoning model [67]; gpt-5-nano, a closed-source reasoning model [68]; and gpt-oss-20b, an open-source reasoning model [69]. LLMs were queried through the OpenAI batch API [70] (gpt-4.1-nano and gpt-5-nano) or on a private AzureML [71] compute cluster owned by the university (gpt-oss-20b).
We initially developed the grading prompts used in ref. [1] through iterative testing on mock assignment submissions prior to the course. These prompts included detailed system-level instructions specifying the task context, scoring criteria, chain-of-thought reasoning, and output formatting, while user prompts contained the student response, question text, question-specific rubric, and an example solution receiving full credit [1]. These prompts aimed to combine potential benefits from chain-of-thought and one-shot prompting. However, through further exploration, we found that example solutions could sometimes be detrimental as they may lead the LLM to deviate from the rubric, and that similar performance could be achieved with much lighter prompts and without relying on a system prompt at all. Accordingly, in the present study, we used only user prompts without exemplars, instructing the LLMs to utilize chain of thought by first generating an explanation and then calculating a score and responding in structured JSON format.
To explore how parameter settings and prompt perturbations affected grading behavior, we created 48 distinct prompting conditions: 24 for gpt-4.1-nano, 16 for gpt-5-nano, and 8 for gpt-oss-20b (see prompting conditions in Table 1). Each condition was used to grade every student answer in the first programming assignment (training set) 20 times, resulting in a total of 2,075,520 prompts (48 conditions × 20 iterations × 47 questions × 46 students).
Table 1.
Model configurations and diversification settings.
3.3.1. Parameter Variations
For gpt-4.1.-nano, we varied and (the latter only when ). For gpt-5-nano, we varied . For gpt-oss-20bs we fixed to reduce runtime on the compute cluster.
3.3.2. Prompt Perturbations
For all three LLMs we applied three prompt perturbation techniques:
- 1.
- Shuffled rubrics: each rubric consisted of a list of subtractive grading criteria [1]. When this intervention was active, we randomly sampled 20 criteria orderings from all possible permutations. For rubrics with fewer than four criteria (), permutations were repeated equally until reaching 20. Otherwise, criteria followed the original order.
- 2.
- Grader personas: we created persona prompts for strict, lenient, meticulous, and sloppy grading (see Listing A3). When enabled, we sampled each persona 5 times to add a persona to each of the 20 prompts. Otherwise, prompts contained no persona.
- 3.
- Multilingual prompting: we used gpt-5-nano to translate all prompt components (base prompt, questions, rubrics, and persona snippets) into German, Spanish, French, Japanese, and Chinese, and verified the translations by back-translating to English via DeepL [72]. When this intervention was active, we sampled equally across the six languages (including English). Otherwise, all 20 prompts were in English.
3.3.3. Post Hoc Ensembles
We created LLM ensembles post hoc by resampling the outputs of eight matched triplets taken from 24 prompting conditions. Specifically, we constructed eight ensembles that varied the three prompt-perturbation techniques: for gpt-oss-20b we used all eight conditions, for gpt-4.1-nano we used the eight conditions with and , and for gpt-5-nano we used the eight conditions with . These ensembles were not fully independent from their reference conditions, and we used bootstrap resampling with 3000 iterations to break ties: For each student answer, within each ensemble condition mapping onto three prompting conditions, we first pooled all 60 available responses (20 from each LLM) and then drew bootstrap resamples (with replacement) of size 20. For each resample, we computed the majority-voted predicted score and its certainty. We then aggregated over all B resamples by taking the most frequent score as the ensemble’s final predicted score and the mean certainty as its certainty estimate.
3.4. Grading Procedures
We examined three LLM-based grading procedures:
- Majority voting (MV): Fully automated grading based on the most frequent scores assigned to each student answer across 20 repeated grading iterations. We computed these for all 56 conditions (prompting + post hoc ensembles).
- Single prompt (SP): Fully automated grading based on a single score we sampled from the 20 iterations for each student answer. We applied this only to the 48 prompting conditions; ensembles per definition aggregated the outputs from multiple prompts.
- SURE: Human-in-the-loop grading based on majority voting with simulated human regrading of flagged scores. We assessed SURE for all 56 conditions (prompting + post hoc ensembles). In the training set we tuned separate uncertainty thresholds by maximizing the score for each of the 56 conditions. In the test set we used the median of these 56 thresholds as a fixed certainty threshold.
Like for the four human graders, we classified the resulting scores as correct or incorrect and computed their deviation from the closest ground-truth scores. We used these metrics to evaluate and compare the performance of the three LLM-based grading procedures against one another and against fully manual grading.
3.5. Research Questions
We investigated the following research questions:
- 1.
- RQ1: Can majority voting improve the accuracy of fully automated LLM grading?
- 2.
- RQ2: Can SURE improve the accuracy over fully automated LLM grading?
- 3.
- RQ3: Can diversification strategies (token sampling, prompt perturbations, LLM ensembles) improve the SURE protocol?
- 4.
- RQ4: How effective (accuracy) and efficient (time spent grading) is SURE compared to fully manual grading?
RQ3 was only investigated on the training set. All other research questions were investigated both on the training and the test sets.
3.6. Exploratory Analyses on the Training Set
3.6.1. Grading Procedures and Diversification Strategies
Table 2 illustrates the data structure for grading procedures and outcome variables. Each row represents the outcome of a grading procedure applied to a specific student answer. The variable Correct is binary (1 = correct, 0 = incorrect), Error is the signed deviation from the nearest ground-truth value (negative = under-grading, positive = over-grading). Each unique Student–Question–Condition combination contains two rows for ensemble conditions or three for prompting conditions—one per Procedure.
Table 2.
Illustrative grading procedure dataset: each row represents the outcome of a specific grading procedure applied to a student’s answer. Condition 1 illustrates all three grading procedures for prompting conditions. Condition 2000 illustrates ensemble conditions, for which single-prompt grading is missing as it does not make practical sense.
Table 3 illustrates the condition-level manipulations. The variable llm has four levels (gpt-4.1-nano, gpt-5-nano, gpt-oss-20b, ensemble). All other predictors are binary indicators: temperature (0 = 0.0 or absent, 1 = 1.0), topp (0 = 0.1 or absent, 1 = 1.0), verbosity (0 = low or absent, 1 = medium), shuffling (0 = no shuffle, 1 = shuffle), persona (0 = none, 1 = varied), and languages (0 = English, 1 = varied).
Table 3.
Illustrative rows from the condition-level dataset. The first three rows show variations in temperature and rubric shuffling for gpt-4.1-nano; the last row shows an ensemble condition without prompt perturbations.
We fit a Bayesian hierarchical logistic regression model to predict the log-odds of scoring student answers correctly based on grading procedure, LLM, model parameters, prompt perturbations and all meaningful two-way interactions: For Procedure the reference category was set to majority-voting. For llm the reference category was set to gpt-4.1-nano. Consequently, the model intercept represents the condition majority voting with gpt-4.1-nano at , , , and without any prompt perturbations (). Terms for temp and topp were only included for gpt-4.1-nano (with top_p nested within temperature), and terms for verb were only included for gpt-5-nano. We added all two-way interactions while preserving the conditional nesting of temperature, top_p and text_verbosity. We also added random intercepts for questions and students to account for repeated measures and clustering.
We used the Bambi package [73] to fit models in Python. We used four MCMC chains with 1000 tuning and 1000 sampling iterations, yielding 4000 posterior draws in total. We used Bambi’s default weakly informative priors [74]. We interpreted all coefficients whose 95% highest density intervals (HDIs) excluded zero.
This analysis addressed the first three research questions at the level of individual student answers:
- A negative coefficient for single-prompt grading would indicate that majority grading improved fully automated grading (RQ1).
- A positive coefficient for SURE that was larger than those for SP and MV would indicate that the proposed pipeline improved accuracy over automated grading (RQ2).
- Positive coefficients for any of the diversification strategies—particularly in combination with SURE—would indicate that diversification strategies were beneficial (RQ3).
3.6.2. Comparing Single-Prompt, Majority-Voting, SURE and Manual Grading
Based on the results of the regression model outlined in the previous section, we selected the following model configurations without any prompt perturbations and compared their performance under different grading procedures (SP, MV, SURE) with manual grading:
- gpt-4.1-nano with temperature and top_p set to 1.0.
- gpt-5-nano with text_verbosity set to medium.
- gpt-oss-20b with text_verbosity set to medium.
- ensemble based on the three selected LLM configurations.
Accuracy and bias at the level of student answers. To compare SURE and manual grading at the level of student answers (RQ4), we selected data after simulating human regrading. Table 4 illustrates the data structure. Each row shows the score awarded by a specific grader (human or LLM with SURE) to a specific student answer.
Table 4.
Illustrative grader dataset: each row shows the score a student answer received from a human grader (grader-1, grader-2, grader-3, grader-4) or the human-in-the-loop SURE protocol with a given LLM (gpt-4.1-nano, gpt-5-nano, gpt-oss-20b, ensemble). Values are for illustration purposes and do not show real data.
We used these data to run two Bayesian hierarchical regression models: a logistic model for Correct and a Gaussian model for Error. For both, we set intercepts to zero and tested the effect of the Grader predictor with random intercepts for students and questions. We estimated the models using four MCMC chains, each with 1000 tuning and sampling iterations. Then, we compared the posterior estimates for each pairwise comparisons (e.g., grader-1 vs. grader-2, grader-1 vs. gpt-5-nano, etc.) to assess whether one grader was better (more accurate, less biased) than another. Specifically, for each pairwise comparison we computed the percentage of samples for grader A that were greater (accuracy) or closer to zero (bias) than grader B. If this analysis revealed that SURE grading achieved or exceeded the performance of some or all human graders, this would indicate that manual grading may be replaced by it.
Alignment at the level of assignment grades. The previously described analysis was done on the student answer level; however, even small differences (e.g., some grader slightly underscoring student answers) may accumulate at the level of overall grades, which is a phenomenon we observed for single-prompt LLM grading in ref. [1]. Therefore, we also compared the grading performance of fully automated LLM grading (SP, MV), human-in-the-loop SURE grading, and manual grading (RQ1, RQ2, RQ4) based on grades calculated for the first assignment.
We calculated grades based on the scores of each individual human grader and based on the ground-truth scores. The minimum and maximum grade across graders defined each student’s human grade range, and the minimum and maximum grade across ground-truth scores defined the ground-truth grade range; together, we considered these the target ranges in which grades from fully automated grading (SP, MV) or human-in-the-loop SURE grading should fall to be considered equivalent to manual grading. We calculated the grades students would have received from the three LLMs and the ensemble under each of the three grading procedures (SP, MV, SURE). For each, we computed the proportion of LLM grades that fell inside the target ranges and the maximum and median deviation from the closest target range boundary as metrics for alignment. If the majority of LLM awarded grades fell inside the target ranges and if the maximum and median deviation were small, this indicated that a given grading procedure may be accurate enough to replace fully manual grading. We considered these metrics descriptively and inspected plots to address RQ1, RQ2, and RQ4:
- If majority-voted grades were more aligned with target ranges than grades based on single-prompts this would provide support that majority voting improves fully automated grading (RQ1).
- If grades from SURE were more aligned than fully automated grades (SP and MV) this would indicate the benefit of SURE (RQ2).
- By assessing the proportion of SURE grades that fell inside the target ranges and the maximum and median deviations from target range boundaries, we assessed whether SURE could be suitable to replace manual grading (RQ4).
Time savings from SURE. Even if the previous analyses indicated that SURE grading achieved human performance, it might not make sense to replace fully manual grading with it. This is because the performance of SURE grading could be entirely driven by manual regrading. Consider a scenario in which almost all cases are flagged and regraded; if this was the case, SURE grading would essentially be manual grading and provide not meaningful time savings and not be more efficient (RQ4). To address this we calculated the time it took human graders to manually score all student answers and compared it with the time it would have taken them if they only had to score flagged cases. We present the absolute grading times under manual and SURE grading and time savings as a percentage and discuss whether they support replacing manual grading or not.
3.7. Planned Analyses on the Test Set
We used the test set to repeat the analyses for the four LLM configurations without prompt perturbations that we selected based on the first analysis in the training set:
- gpt-4.1-nano with temperature and top_p set to 1.0.
- gpt-5-nano with text_verbosity set to medium.
- gpt-oss-20b with text_verbosity set to medium.
- ensemble based on the three selected LLM configurations.
We prompted them to score each student answer in assignments 2–5 20 times and created the post hoc LLM ensemble by resampling the three prompting conditions. For flagging we used a fixed threshold, which we determined by taking the median () of the 56 tuned thresholds from the training set. We then repeated the analyses described in Section 3.6.2. For the question-level analyses, we considered data from all four assignments (2–5) and used Bayesian regression to predict correctness, and for grading bias, from grader (humans and LLMs with SURE) with random intercepts for questions and students. In contrast, we computed the alignment with assignment grades and time savings for each assignment separately.
3.8. Additional Exploratory Analyses
After receiving reviewer comments to an earlier version of this article, we conducted some additional exploratory analyses. Specifically, we investigated the performance of larger LLMs and more diverse ensembles in the test set. For this, we prompted gpt-5, OpenAI’s current flagship model [75], Llama-3.3-70B-Instruct, a large open source model by Meta [76], and Codestral 25.01, a 22 billion parameter open-source model fine-tuned for code generation by Mistral [77], to score each student answer in the test set 7 times by setting n = 7. We also used the 21 combined responses to create a “true” ensemble instead of utilizing bootstrapping like before. Additionally, to simulate a more realistic grading scenario, we used the UvA AI chat API—an endpoint for prompting LLMs for internal use at the University of Amsterdam [78]—to prompt these models synchronously by running code in a Jupyter notebook. We allowed for 20 retries in case of occasional parsing errors of LLM outputs to ensure we obtained the intended number of valid responses. Prompting this way took between two and seven hours, with gpt-5 taking the majority of the time because of its reasoning capability, and codestral-25.01 being very fast.
Like for the other models, we assessed the single-prompt, majority-voting, and SURE performance of each LLM separately, as well as for their ensemble. We used the same fixed threshold of for flagging in SURE. Notably, with only seven repeated prompts per student answer, the certainty estimates for the individual models were much coarser (increments of approximately 14.3%) than before (increments of 5%), which means that any case where three or more responses deviated from the majority vote would be flagged. With 21 aggregated prompts, the ensemble more closely matched the earlier setup based on 20 iterations. By prompting completely different models, and utilizing a coarser certainty estimate, this analysis also provided some more insight into the generalizability of the fixed threshold of 0.7.
We repeated the same analyses as for the other models with one exception: instead of looking at the alignment between manual grading and LLM grading at the level of assignment grades, we zoomed out further and computed overall course grades based on the five assignments in the test set. This added another perspective on alignment, which is particularly relevant for decision-makers considering the adoption of LLM-based grading solutions. During the actual course, final grades were calculated as the weighted average of assignment and exam grades, with assignments 1–4 each contributing 15% and the exam (assignment 5) contributing 40% to the final grade. As we only considered grades in the test set (assignments 2–5), we adjusted the weights accordingly: assignments 2–4 each contributed 20%, and assignment 5 contributed 40%.
4. Results
4.1. Interrater Reliability of Human Graders
We computed ICC(2,1) and fitted linear mixed-effects models to assess interrater reliability at both the level of individual question scores and aggregated assignment grades.
At the question level, reliability was excellent, (2,1) = 0.92, 95% CI [ 0.92, 0.93], , . Variance decomposition from a cross-classified mixed-effects model showed that grader identity accounted for a negligible proportion of total variance (≈0.1%). Assignment and student also accounted for small proportions of variance (≈2.7% and ≈1.6% respectively), with most variability attributable to differences between questions and residual error (≈53% and ≈42.5% respectively).
At the grade level, reliability remained excellent, , 95% CI [0.83, 0.94]. Grader and student identity only accounted for a small proportion of variance (≈2.7% and ≈8.5% respectively), with assignment and residual error accounting for most variability (≈65.7% and ≈23.1% respectively).
To examine potential student-specific grading bias, we extended the grade-level mixed-effects model with a grader × student random effect. This model resulted in a singular fit, with the corresponding variance component estimated at zero, indicating no evidence that graders systematically evaluated specific students differently.
Overall, these results indicate that human grading was fair and highly reliable at both the question and grade levels, supporting the use of aggregated ground-truth scores derived from multiple graders as a baseline for evaluating LLM-based grading in this study.
4.2. Exploratory Findings on the Training Set
4.2.1. Descriptive Findings in the Training Set
Figure 1 shows how certainty thresholds were tuned by maximizing scores for each of the 56 conditions. Most optimal thresholds (Δ) lie between 0.6 and 0.85. Optimal thresholds and the average F1 trajectory for the ensemble condition (black triangles and line) are markedly shifted to the left and more peaked than those of the other models. For the test set we fixed the threshold at 0.7, which was the median optimal threshold across all conditions (dashed vertical line). Figure 2 shows the certainty of correct and incorrect scores and their relationship to tuned certainty thresholds for all conditions of a given LLM. It suggests that certainty is diagnostic of correctness: most correct scores cluster at 100% certainty (all iterations agree), while incorrect scores are more widely distributed at lower levels of certainty. The ensemble stands out with a distinctly bimodal distribution and concentrated thresholds, suggesting that mixing multiple LLMs can help separate cases suited for automated grading from those that are not.
Figure 1.
Threshold tuning based on scores. Each ⋄ indicates the threshold that maximized for one of the 56 conditions. The dashed vertical line indicates the median threshold across all conditions which we used as a fixed threshold for flagging in the test set.
Figure 2.
Certainty distributions for correctand incorrect scores across models. Proportions are normalized within each category, such that the bars for correct and incorrect scores each sum to one. Histograms use bins of 5% certainty. Dashed lines show tuned thresholds for the 56 conditions.
Figure 3 displays the observed grading accuracy of different models, grading procedures, and prompting configurations, aggregated across students and questions for the first assignment. Different LLMs are displayed on the x-axis, and visual inspection suggests that the reasoning models (gpt-5-nano, and gpt-oss-20b) and the ensemble clearly outperformed gpt-4.1-nano even when using only a single prompt (circles). Both majority-voting (squares) and SURE (triangles) appear to improve the accuracy of all LLMs, with gpt-oss-20b and the ensemble even reaching human-level accuracy (gray band) and gpt-4.1-nano achieving the greatest relative gains, potentially because more cases were flagged for that LLM. Effects of prompt perturbations (colors) are difficult to assess visually, but it seems like multilingual prompting may have hurt the accuracy of the three LLMs, particularly gpt-4.1-nano and especially for single-prompt grading. We also see that gpt-5-nano with a single prompt is on par with gpt-4o (dotted line) used in ref. [1], while majority voting improves the accuracy beyond it. Based on visual inspection alone, Figure 1, Figure 2 and Figure 3 suggest that self-consistency-based [12] certainty estimation can work for weaker as well as stronger LLMs and that the performance of the proposed SURE procedure may be comparable to fully manual grading.
Figure 3.
Assignment-level grading accuracy across models and conditions in the training set. SURE (Δ) consistently achieves the highest accuracies, with gpt-oss-20b and the ensemble reaching human performance (gray band). The dotted line shows the single-prompt performance of gpt-4o in our previous paper [1].
4.2.2. Effects of Grading Procedures and Diversification Strategies
We used Bayesian logistic regression to predict the log-odds of scoring student answers correctly based on the grading procedure, LLM, sampling parameters, and prompt perturbation techniques and all meaningful two-way interactions (predictors that were varied together). The four MCMC chains each with 1000 warmup and sampling iterations mixed well (all ). Table 5 shows the coefficients and 95% HDI of all coefficients. In the following we only interpret those whose 95% HDI excludes zero.
Table 5.
Regression coefficients.
At the intercept (majority-voting, gpt-4.1-nano, temp = 0, topp = 1, verb = 0, shuf = 0, pers = 0, lang = 0; , 95% HDI ) the probability of scoring a student answer correctly was estimated to be about 83%. Relying only on a single prompt (, 95% HDI ) reduced that probability, while human-in-the-loop SURE (, 95% HDI ) increased it. Utilizing gpt-5-nano (, 95% HDI ), gpt-oss-20b (, 95% HDI ), or the LLM ensemble (, 95% HDI ) instead of gpt-4.1-nano also increased the probability of scoring student answers correctly. These results at the level of individual student answers are consistent with the earlier visual inspection of the grading accuracy at the assignment level (Figure 3): majority voting and SURE are better than single-prompt grading, and the reasoning models (gpt-5-nano, gpt-oss-20b) and the ensemble outperform gpt-4.1-nano.
We obtained negative coefficients for interactions between SURE:gpt-5-nano (, 95% HDI ), SURE:gpt-oss-20b (, 95% HDI [−0.831, −0.542]), and SURE:ensemble (, 95% HDI ). This reflects that the relative performance gain for gpt-4.1-nano from SURE was greater than that for the other LLMs, whose baseline accuracy (single prompt/majority voting) was already greater and closer to the ceiling.
We found a positive coefficient for the main effect of topp(llm = gpt-4.1-nano; temp = 1) (, 95% HDI ) and a negative interaction for topp(llm = gpt-4.1-nano; temp = 1):single-prompt (, 95% HDI ). This indicates that prompting gpt-4.1-nano with temperature and top_p set to one was beneficial but only for majority voting and SURE. Figure 3 clearly shows how majority voting (squares) for gpt-4.1-nano with a lower temperature and top_p was only slightly beneficial, while a large jump in accuracy for gpt-4.1-nano with a higher temperature and top_p. Together with the regression results, this indicates that increased token-level variability may help stabilize majority-voted scores. This could be because more plausible scores are explored, while deterministic sampling results in getting stuck in a local minimum similar to relying on a single prompt.
None of the prompt perturbation techniques improved the probability to score student answers correctly. On the contrary, we obtained negative coefficients for lang (, 95% HDI ), and the interactions between lang:single-prompt (, 95% HDI ), lang:topp(llm = gpt-4.1-nano; temp = 1) (, 95% HDI ), and lang:shuf (, 95% HDI ). These indicate that multilingual prompting was detrimental, particularly when relying only on a single prompt, simultaneously shuffling rubrics, and using gpt-4.1-nano with increased token-level sampling variability.
We also found positive coefficients for the interactions between lang:gpt-5-nano (, 95% HDI ), and lang:gpt-oss-20b (, 95% HDI ), suggesting that multilingual prompting was less detrimental for more recent reasoning models. This is in line with Figure 3, which clearly shows how multilingual prompting was very detrimental to single-prompt grading with gpt-4.1-nano but less so to the other LLMs and grading procedures.
Finally, for random intercepts, we found moderate variability for students (, 95% HDI ), and considerable variability for questions (, 95% HDI ). This indicates that some students are easier to score than others, which raises concerns for potentially biased grading and suggests that LLMs are worse at scoring certain questions, which is in line with our earlier findings [1] and exactly what we wanted to address with SURE grading.
With respect to the research questions, this regression model and Figure 2 and Figure 3 suggest that majority voting improves fully automated grading (RQ1), SURE improves accuracy over automated grading (RQ2), and only higher temperature and top_p, and ensembling are effective diversification strategies (improving grading accuracy) in our context (RQ3). Based on these results, we decided to focus only on four LLM configurations for all other analyses:
- gpt-4.1-nano with temperature and top_p set to 1.0.
- gpt-5-nano with default “medium” text_verbosity.
- gpt-oss-20b with default “medium” text_verbosity.
- Ensemble based on the three selected LLM configurations.
4.2.3. Single-Prompt, Majority-Voting, SURE and Manual Grading in the Training Set
Accuracy and bias at the level of student answers. We fit a Bayesian logistic regression with random intercepts for students and questions to estimate the log-odds that each of the four human graders and human-in-the-loop SURE grading with four LLM graders (gpt-4.1-nano at temp = topp = 1, gpt-5-nano with verb = 1, gpt-oss-20b, and the ensemble; without prompt perturbations) would score student answers correctly. At first we obtained values around 1.05, so we increased the sampling to 2000 tuning and 2000 sampling iterations. After this change, convergence between the four MCMC chains improved (). The model was fit without an intercept, which means that once the coefficients were transformed from log-odds to probabilities, each one directly represented that grader’s estimated probability of assigning a correct score. Below we report estimated coefficients as log-odds but interpret the results at the probability level.
Figure 4 displays the posterior means and 95% HDIs (left panel) and the pairwise probability that a grader was more accurate than another (right panel). With about 92% estimated probability to score student answers correctly, grader 2 (, 95% HDI ) was the most accurate human grader. They were followed by grader 3 (, 95% HDI ; ≈87%), grader 1 (, 95% HDI ; ≈85%) and grader 4 (, 95% HDI ; ≈82%). Under human-in-the-loop SURE grading with tuned certainty thresholds, both gpt-oss-20b (, 95% HDI ; ≈84%) and the LLM ensemble (, 95% HDI ; ≈83%) reached accuracies comparable to the mid-range of human graders. In contrast gpt-5-nano (, 95% HDI ; ≈79%) and particularly gpt-4.1-nano (, 95% HDI ; ≈68%) performed worse, with all human graders likely outperforming them. Random intercepts revealed moderate variability for students (, 95% HDI ) and considerable variability for questions (, 95% HDI ), indicating that even the human graders and LLMs under SURE were challenged by certain questions and student answers.
Figure 4.
Posterior estimates of grading accuracy for human graders and LLMs under SURE with tuned certainty thresholds in the training set. The left panel shows posterior means and 95% HDIs for the probability (transformed log-odds) of scoring a student answer correctly. The right panel displays pairwise dominance probabilities, indicating for each row–column pair the posterior probability that the grader in the row is more accurate than the grader in the column.
We fit a similar Bayesian linear regression to predict grading bias with four MCM chains making 1000 tuning and sampling draws (all ). This regression revealed a more pronounced difference between human graders and human-in-the-loop SURE grading (see Figure 5): human grader 4 (, 95% HDI ) and grader 2 (, 95% HDI ) were unbiased (HDI include zero), while grader 3 (, 95% HDI ) was underscoring and grader 1 (, 95% HDI ) was overscoring. In contrast, despite SURE, all LLM graders underscored students (negative bias) and were likely more biased than most human graders: gpt-oss-20b (, 95% HDI ); ensemble (, 95% HDI ); gpt-4.1-nano (, 95% HDI ); gpt-5-nano (, 95% HDI ). Random intercepts for students showed low variability (, 95% HDI ), while those for questions indicated moderate variability (, 95% HDI ).
Figure 5.
Posterior estimates of grading bias for human graders and LLMs under SURE with tuned certainty thresholds in the training set. The left panel shows posterior means and 95% HDIs for grading bias (deviation from closest ground truth). The right panel displays pairwise dominance probabilities, indicating for each row–column pair the posterior probability that the grader in the row is less biased (closer to zero) than the grader in the column.
Alignment at the level of assignment grades. The previous analysis was conducted at the level of individual student answers, for which differences between manual grading and SURE were relatively small. However, even small differences may accumulate at the level of assignment grades. To evaluate this, we computed target grade ranges (human and ground-truth grades) and the grade each student would have received under a given LLM and grading procedure.
Figure 6 reveals considerable disagreement between human graders (wide gray areas) in some cases but also perfect agreement in one case (black horizontal line instead of gray area). It also shows a pronounced negative grading bias for single-prompt grading (circles are often far below the gray target ranges), which is consistent with earlier findings using gpt-4o [1]. The plot also shows that majority voting and SURE pull student grades closer to or even inside the target ranges for most students. Interestingly, there are also individual cases where majority voting or SURE decreases the alignment with human grade ranges. This reflects that sometimes, single prompts can “accidentally” be right and that human (re)graders sometimes make mistakes and are less correct than LLMs, which is something we also observed in ref. [1]. The starkest difference emerged for gpt-4.1-nano: Table 6 shows that for single-prompt grading, only ≈7% of grades fell inside the target range, and the maximum grade deviation reached 1.9 grade points. In contrast, with SURE, ≈61% of grades fell inside the target ranges, and the maximum deviation was only 0.4 grade points. We saw a similar pattern for all other LLMs, with SURE resulting in maximum and median grade point deviations of ≤0.5 and ≤0.1 grade points for all LLMs respectively. This finding suggests that SURE can result in grades matching human accuracy, particularly for stronger LLMs and the LLM ensemble.
Figure 6.
Alignment of assignment grades awarded by human graders (black vertical bars), the target ranges defined by the minimal and maximal human and ground-truth grades (gray areas), fully automated LLM grades based on single-prompt (○), majority-voting (□), and human-in-the-loop LLM grading with SURE (Δ) in the training set. Alignment is markedly improved by SURE.
Table 6.
Alignment of LLM grades with human-grade target ranges under different procedures for assignment 1.
Time savings from SURE. While the previous analysis indicated that SURE could achieve good alignment with human grades, this could be driven by a large flagging rate which would mean that SURE was largely manual grading anyway and offered no substantial time savings. We assessed this by comparing the time spent for manual grading with the time graders would spend under SURE.
Table 7 shows that manually grading the first assignment took between 3 and 6.5 h. In contrast, the SURE procedure would reduce manual grading time by up to 90%, making it highly efficient.
Table 7.
Manual grading time and manual regrading time after SURE (minutes) with time savings for assignment 1 1.
This table also shows that time savings would be less for gpt-4.1-nano than for the other LLMs and the ensemble, reflecting the lower baseline accuracy and greater flagging rate for this LLM. Together with the big performance increases for gpt-4.1-nano, this provides further evidence that self-consistency-based uncertainty estimation is effective for both weaker non-reasoning models (gpt-4.1-nano) and reasoning models (gpt-5-nano, gpt-oss-20b).
4.2.4. Summary of Training Set Results
To summarize, in the training set, we found evidence that self-consistency-based [12] (un)certainty could distinguish between cases that could be graded automatically and those that should be reviewed by a human grader. Notably, aggregating the outputs from several LLMs in an ensemble visibly improved the separability of incorrect and correct scores.
We also found that SURE based on optimal thresholds could result in greatly improved alignment with human graders both at the level of individual student answers and assignment grades, while saving teachers more than 80% of the manual grading time spent on that assignment.
However, these results were based on optimally set flagging thresholds tuned on an efficiency ( score) objective. Therefore, they might be overly optimistic estimates of the effectiveness and efficiency of the proposed SURE pipeline. In practice, thresholds would have to be set in advance, which might be problematic if the obtained certainties are highly assignment specific. Therefore, we simulated SURE with a fixed certainty threshold (0.7) in the test set (assignments 2–5). These assignments include more complex programming tasks (e.g., manipulating data, creating plots) which we previously found to be graded less accurately with gpt-4o [1] and therefore likely would include exactly such cases that we wanted to identify and flag for human reviews.
4.3. Test Set Validation
4.3.1. Descriptive Findings in the Test Set
Figure 7 shows how correct and incorrect scores were distributed across certainty levels in the test set (assignments 2–5). As in the training set, most correct scores cluster at 100% certainty, indicating full agreement across repeated prompts. However, there are also more correct scores at lower certainty values, which increases the overlap between the distributions of correct and incorrect scores. This overlap implies more unwanted flags (false positives; blue bars to the left of the threshold) and more unflagged incorrect scores (false negatives; red bars to the right of the threshold). Once again, the ensemble stands out with a distinctly bimodal certainty distribution that is neatly separated by the fixed threshold at 0.7. In contrast, the same fixed threshold appears to be too low for the individual LLMs, resulting in many incorrect scores that remain unflagged.
Figure 7.
Certainty distributions for correct and incorrect scores in the test set. Proportions are normalized within each category, such that the bars for correct and incorrect scores each sum to one. Histograms use bins of 5% certainty. The vertical dashed line marks the fixed certainty threshold () used for flagging in the test set.
Figure 8 shows assignment-level grading accuracy in the test set for all LLMs and grading procedures. As in the training set, SURE (triangles) and, to a lesser extent, majority voting (squares) improved accuracy over single-prompt grading (circles) for all models. For all four assignments, SURE with the ensemble reached human-level grading accuracy (gray band). In contrast, gpt-4.1.-nano clearly reached lower grading accuracy for all assignments even with SURE, and gpt-oss-20b, and gpt-5-nano approached human performance only for assignments 4 and 5. This likely reflects the inadequate thresholds, which resulted in too many unflagged incorrect cases.
Figure 8.
Assignment-level grading accuracy in the test set. SURE (Δ) consistently achieves the highest accuracies, with the ensemble reaching human performance (gray band). The dotted lines show the single-prompt performance of gpt-4o in our previous paper [1].
4.3.2. Single-Prompt, Majority-Voting, SURE and Manual Grading in the Test Set
Accuracy and bias at the level of student answers. Similar to the training set, we ran a Bayesian logistic regression to assess the accuracy of the four human graders and the four human-in-the-loop SURE grading procedures (gpt-4.1-nano, gpt-5-nano, gpt-oss-20b, ensemble) at the level of individual student answers in the test set (assignments 2–5). The model included random intercepts for students and questions and was fit without a global intercept, so that each coefficient directly represents the log-odds of assigning a correct score for a specific grader. We estimated the model with four MCMC chains, 1000 tuning 1000 and sampling iterations per chain, and all obtained , indicating good convergence.
With an estimated probability of correctly scoring student answers of about 95%, human grader 3 (, 95% HDI ) was the most accurate grader. However, this estimate was based only on assignment 5 (the only test-set assignment graded by grader 3), which makes it less generalizable than the estimates for the other human graders and the LLMs under SURE. Grader 3 was followed by grader 1 (, 95% HDI ; ≈94%), the ensemble (, 95% HDI ; ≈93%), grader 4 (, 95% HDI ; ≈93%), grader 2 (, 95% HDI ; ≈91%), gpt-oss-20b (, 95% HDI ; ≈89%), gpt-5-nano (, 95% HDI ; ≈87%), and gpt-4.1-nano (, 95% HDI ; ≈78%). Random intercepts for students showed little variability (, 95% HDI ), while those for questions indicated moderate variability (, 95% HDI ).
Figure 9 visualizes these results and highlights the relative ranking of graders in terms of pairwise dominance. The heatmap shows that grader 3 and grader 1 clearly outperform the two other human graders and all LLMs under SURE with very high posterior probability, and that grader 3 is likely more accurate than grader 1 as well. The ensemble occupies a distinct middle position: it is almost certainly more accurate than gpt-4.1-nano, gpt-5-nano, gpt-oss-20b, and grader 2 and is roughly comparable to grader 4 (pairwise probability close to 0.5). Together, the posterior means and pairwise dominance structure indicate that in the test set, SURE with the ensemble achieved accuracy similar to mid-range human graders while SURE was less effective for the individual LLMs and did not achieve accuracies comparable to manual grading.
Figure 9.
Posterior estimates of grading accuracy for human graders and LLMs under SURE with tuned certainty thresholds in the test set. The left panel shows posterior means and 95% HDIs for the probability (transformed log-odds) of scoring a student answer correctly. The right panel displays pairwise dominance probabilities, indicating for each row–column pair the posterior probability that the grader in the row is more accurate than the grader in the column.
For grading bias, we found very similar results and even more evidence that SURE with the LLM ensemble rivaled human performance: with zero being included in the 95% HDI, human grader 4 (, 95% HDI ) and the ensemble (, 95% HDI ) may be considered unbiased. Like on the training set, human grader 1 was the only grader with a positive bias (overscoring; , 95% HDI ). All other graders were negatively biased (underscoring): human grader 3 (, 95% HDI ); gpt-oss-20b (, 95% HDI ); gpt-5-nano (, 95% HDI ); human grader 2 (, 95% HDI ); gpt-4.1-nano (, 95% HDI ). Random intercepts for students showed moderate variability (, 95% HDI ), while those for questions indicated considerable variability (, 95% HDI ).
In the accuracy analysis, human graders 1 and 3 were clearly the strongest performers, with the ensemble under SURE grading occupying a solid mid-range position. In terms of bias, however, the picture shifts: Figure 10 shows that the ensemble is much closer to zero than most human graders, with an HDI that includes zero and a posterior mean comparable to the nearly unbiased grader 4. In contrast, graders 1 and 3—despite being the most accurate—exhibit clear positive and negative bias respectively. The pairwise-dominance heatmap shows that the ensemble with SURE is very likely less biased than human graders 1, 2, and 3.
Figure 10.
Posterior estimates of grading bias for human graders and LLMs under SURE with tuned certainty thresholds in the test set. The left panel shows posterior means and 95% HDIs for grading bias (deviation from closest ground truth). The right panel displays pairwise dominance probabilities, indicating for each row–column pair the posterior probability that the grader in the row is less biased (closer to zero) than the grader in the column.
Alignment at the level of assignment grades. Like for assignment 1, we also assessed the accuracy of grades by computing human and ground-truth target ranges, and the grades students would receive under different LLM grading procedures. In contrast to the previous analysis at the level of student answers where we used data across assignments, we did this separately for each of the four test-set assignments. The previous analyses suggested that SURE achieved human like performance for the ensemble, and for brevity, we only show its results in Figure 11, while Table 8 shows performance metrics (percentage of grades inside target ranges, median and maximum grade point deviation from target range boundaries) for all LLMs.
Figure 11.
Alignment of assignment grades awarded by human graders (black vertical bars), the target ranges defined by the minimal and maximal human and ground truth grades (gray areas), fully automated LLM grades based on single-prompt (○), majority-voting (□), and human-in-the-loop LLM grading with SURE (Δ) in the test set. Alignment is markedly improved by SURE.
Table 8.
Alignment of LLM grades with human-grade target ranges under different procedures for assignments 2–5.
Figure 11 shows that the ensemble even under fully automated grading with majority voting frequently produced grades that fell inside the target ranges; however, for some students, this procedure resulted in severe underscoring with maximum and median grade point deviations up to ≤3.2 and ≤0.3 respectively. While the median deviation of less than half a grade point might be acceptable in practice, underscoring a student by more than three full grades is not. This highlights the importance of evaluating LLM grading not only at the level of averages but also at the level of individual students.
In contrast, SURE grading with the ensemble resulted in between 84% and 91% of grades falling inside target ranges, with ≤0.4 maximum and ≤0.1 median grade point deviation for all assignments. Notably, for assignment 4, we observed 15/46 students for which all three human graders and the ensemble with SURE agreed perfectly.
For the individual LLMs, Table 8 shows a similar pattern: SURE reduced the severity of grading errors, yielding maximum and median grade point deviations of ≤1.6 and ≤0.6 for gpt-4.1-nano, ≤1.9 and ≤0.3 for gpt-5-nano, and ≤1.4 and ≤0.1 for gpt-oss-20b. This indicates that even with suboptimal certainty thresholds, SURE can meaningfully improve alignment with human grading. However, the remaining deviations and relatively low proportions of grades falling inside the human target ranges suggest that these models still produce errors that are too large to justify replacing manual grading in practice. These results highlight the benefit of using LLM ensembles for uncertainty-based flagging but also put into question whether it is possible to set proper flagging threshold in advance.
Time savings from SURE. Table 9 shows that the time savings achieved by SURE in the test set varied substantially across LLMs and assignments. Notably, the ensemble yielded comparatively modest time savings—between 26% and 58%—while the individual LLMs often saved considerably more time, in some cases exceeding 80%. This pattern is consistent with earlier results showing that the fixed certainty threshold () was well calibrated for the ensemble but too lenient for the individual LLMs: the weaker models produced many incorrect but high-certainty predictions that went unflagged, reducing the amount of manual regrading and thereby inflating time savings at the cost of lower accuracy. Conversely, the ensemble flagged a larger proportion of cases for review, which reduced automation but produced human-level accuracy.
Table 9.
Manual grading time and manual regrading time after SURE (minutes) with time savings for assignments 2–5 1.
Importantly, this outcome is not necessarily a limitation of the proposed SURE approach. For assignments that contain questions the LLMs struggle to grade reliably—such as those in assignments 2–5—we explicitly want them to be flagged, which necessarily results in more manual effort. At the same time, the table also shows that when the proportion of flagged responses becomes very large, the resulting time savings may be too small to justify deploying such a pipeline in practice. Thus, while the ensemble achieved the highest grading accuracy, it did so by relying more heavily on human review in the test set, illustrating the trade-off between efficiency and reliability inherent to certainty-based flagging.
4.4. Additional Exploratory Findings
To assess whether SURE grading worked for larger state-of-the art models, we used gpt-5 to score all student answers in the test set. Additionally, we created a more diversified ensemble based on gpt-5, codestral-25.01, and llama-3.3-70b-instruct. Figure 12 shows that certainty is not as clearly separated between correct and incorrect scores for individual models but ensembling them yields a bimodal distribution similar to that of the previous results. This suggests that ensembling continues to be beneficial for separating correct and incorrect scores.
Figure 12.
Certainty distributions for correct and incorrect scores in the test set using three additional models and their ensemble. Proportions are normalized within each category, such that the bars for correct and incorrect scores each sum to one. Histograms use bins of 5% certainty. The vertical dashed line marks the fixed certainty threshold () used for flagging in the test set.
Figure 13 shows assignment-level grading accuracies for the three additional models and their ensemble in the test set. As before, human-in-the-loop grading with SURE (triangles) improved accuracy over fully automated single-prompt grading (circles) and majority voting (squares) for all models. However, gpt-5 only slightly benefited from flagging, suggesting that the scores from repeated prompting were very consistent regardless of their agreement with the human-derived ground truth. Notably, the majority-voting accuracy of the ensemble was worse than that of gpt-5 alone, likely because the other two much less accurate models dragged it down. However, with SURE, the ensemble outperformed gpt-5 for all assignments, driven by a much larger flagging rate and consequently more human grading. These results suggest that pairing stronger and weaker models in more diverse ensembles might be beneficial for uncovering cases in which the stronger model is confidently incorrect, albeit at the cost of more human grading effort.
Figure 13.
Assignment-level grading accuracy of three additional models and their ensemble in the test set. SURE (Δ) consistently achieves the highest accuracies, with the ensemble reaching human performance (gray band and black lines). The dotted lines show the single-prompt performance of gpt-4o in our previous paper [1].
Like the descriptive findings, the results from the Bayesian analyses corroborate that SURE with the ensemble achieves accuracy (see Figure 14) and bias (see Figure 15) on par with mid-range human graders.
Figure 14.
Posterior estimates of grading accuracy for human graders, and three additional LLMs and their ensemble under SURE with certainty thresholds fixed at 0.7 in the test set. The left panel shows posterior means and 95% HDIs for the probability (transformed log-odds) of scoring a student answer correctly. The right panel displays pairwise dominance probabilities, indicating for each row–column pair the posterior probability that the grader in the row is more accurate than the grader in the column.
Figure 15.
Posterior estimates of grading bias for human graders, and three additional LLMs and their ensemble under SURE with certainty thresholds fixed at 0.7 in the test set. The left panel shows posterior means and 95% HDIs for grading bias (deviation from closest ground-truth). The right panel displays pairwise dominance probabilities, indicating for each row–column pair the posterior probability that the grader in the row is less biased (closer to zero) than the grader in the column.
In contrast to the test set analysis with the original LLMs (gpt-4.1-nano, gpt-5-nano, gpt-oss-20b)—where we evaluated assignment-level grade alignment—we zoomed out further and assesssed the course-level grade alignment. Specifically, we computed course grades based on weighed assignment grades for the new LLMs and their ensemble under all three grading procedures and compared them to course grades calculated for human graders and the target range spanned by the minimal and maximal ground-truth or human course grades for each student. Table 10 and Figure 16 show that SURE and ensembling improved alignment markedly with about 96% of course grades falling into the target ranges and low maximum () and median () deviations on the Dutch 10-point grading scale. Similarly, gpt-5 with SURE achieved 86% of course grades inside the target ranges with maximum and median grade point deviation. Notably, Table 11 shows that SURE with gpt-5 saved about 93% of manual grading time while the ensemble with SURE saved only about 40% compared to fully manual grading. This is driven by the good accuracy of gpt-5 under fully automated grading with a single prompt or majority voting and its comparatively low flagging rate due to being very consistent across regrades. This indicates that larger reasoning models may be able to achieve acceptable alignment even without human-in-the-loop review, which could completely eliminate the need for human grading, giving teachers more time to spend tutoring students. However, the ensemble with SURE still outperformed gpt-5 in this regard and emerged as the most accurate grading procedure evaluated here. This finding again highlights the trade-off between grading accuracy and time savings when using certainty-based flagging. Critically, decision-makers at universities might be much more inclined to utilize human-in-the-loop approaches before fully automated grading becomes widely accepted.
Table 10.
Alignment of LLM grades with human grade target ranges under different procedures for the weighted course grade.
Figure 16.
Alignment of overall course grades awarded by human graders (black vertical bars), the target range defined by the minimal and maximal human and ground-truth grades (gray areas), fully automated LLM grades based on a single prompt (○) or majority voting (□), and human-in-the-loop LLM grading with SURE (Δ) using the three new models and their ensemble in the test set. Alignment is markedly improved by SURE.
Table 11.
Manual grading time and manual regrading time after SURE (minutes) with time savings for assignments 2–5 with new models 1.
4.5. Summary of Results
Across both training and test sets, our results support the core idea of the proposed SURE pipeline. Repeated prompting produced a certainty measure that was strongly diagnostic of correctness, and combining models in an ensemble yielded a distinctly bimodal certainty distribution that separated clearly between high- and low-confidence predictions. On the training set, tuning certainty thresholds for each condition showed that self-consistency-based flagging could substantially improve grading accuracy for non-reasoning (gpt-4.1-nano) and reasoning models (gpt-5-nano, gpt-oss-20b). With optimally chosen thresholds, SURE brought assignment-level accuracy and grade alignment close to or within the range of human graders, while reducing manual grading time by more than 80%.
The test set analysis, which used a single fixed threshold of and omitted prompt perturbations, provides a more conservative but still encouraging picture. For the ensemble, the fixed threshold aligned well with its bimodal certainty distribution: SURE achieved human-level accuracy at the level of individual answers, near-unbiased grading, and high alignment with human assignment grades (84–91% of grades inside target ranges, with very small maximum and median deviations). However, these gains came with only moderate time savings (26–58%), reflecting that many responses would still have to be routed to human graders. For the individual LLMs, the same fixed threshold was too lenient, leading to more unflagged incorrect answers, lower accuracy, stronger negative bias, and larger grade deviations, even though SURE still improved performance relative to single-prompt and majority-voting baselines.
Together, these findings highlight a central trade-off of certainty-based flagging. When thresholds are well calibrated, most clearly for the ensemble, the pipeline can match mid-range human graders in accuracy and bias while still reducing manual effort. At the same time, the test set results show that thresholds are assignment- and model-sensitive: overly aggressive automation can save time but harms reliability, whereas conservative thresholds preserve human-level accuracy at the cost of smaller time savings.
The findings from the additional analyses based on a more diversified ensemble (gpt-5, codestral-25.01, llama-3.3-70b-instruct) corroborated the earlier results, with ensembling yielding a bimodal certainty distribution for which the fixed threshold was well calibrated. At the level of overall course grades, SURE resulted in 87% and 96% of grades falling into the target ranges for gpt-5 and the ensemble respectively, with very small maximum (0.3–0.5) and median grade point deviations (0.1) on the 10-point Dutch grading scale, and time savings of about 93% for gpt-5 and about 40% for the ensemble. Notably, even under fully automated grading, gpt-5 achieved very good alignment, which suggests human oversight might become less critical with larger reasoning models. In contrast, llama-3.3-70b-instruct performed considerably worse than gpt-oss-20b, indicating that the number of parameters alone does not drive performance. Instead, we suspect reasoning capabilities are much more relevant for the ability of these LLMs to follow rubrics and score student answers accurately. Additionally, the particularly poor performance of codestral-25.01, a model trained for fast code generation, may indicate that reasoning and instruction following (i.e., sticking to the rubrics) are more important for grading than domain specialization.
5. Discussion
Large language models can grade open-ended assignments, yet they typically fail to reach human performance and are prone to biases, which limits their suitability for fully automated assessment. Here, we introduced SURE, a lightweight human-in-the-loop framework leveraging self-consistency and ensembling to flag cases for selective human regrading. SURE substantially improved alignment with ground-truth scores from four human graders, while reducing overall grading effort. We found that uncertainty estimates based on prompt agreement were informative but unreliable for individual LLMs, whereas LLM ensembles yielded more separable uncertainty distributions, which supported fixed-threshold flagging. As such, combining self-consistency with selective human oversight may offer a path toward more reliable and scalable AI-assisted grading.
Previous studies investigating LLM-based grading of programming assignments report only moderate agreement with human graders, systematic underscoring, and substantial variability across models [1,36,37,58]. Notably, different models exhibit distinct grading styles, ranging from consistently strict to comparatively lenient, suggesting that model choice alone can materially influence assigned scores [37]. Furthermore, while rubric-conditioned prompting improves alignment and interpretability, it does not eliminate disagreement with expert graders or sensitivity to prompt design [58]. Similarly, we found that grading student answers with a single prompt resulted in underscoring across conditions. Majority voting based on repeatedly scoring the same student answer reduced but did not eliminate that bias, which is consistent with self-consistency stabilizing LLM performance [12,13]. However, incorrect scores frequently received (near-)unanimous agreement across iterations, reflecting that LLMs can be confidently wrong [10,26]. This means that while informative, self-consistency-based uncertainty is limited in its ability to flag erroneous scores for regrading when used with individual models. This pattern also mirrors observations in related research reporting that even high internal consistency across models does not guarantee alignment with human scores [37].
This problem was effectively mitigated by aggregating the outputs of multiple LLMs in ensembles, which resulted in markedly bimodal uncertainty distributions, more clearly separating correct from incorrect predictions. This result is consistent with recent work showing that cross-model disagreement more effectively exposes confidently incorrect LLM responses than within-model self-consistency alone [14,15]. While prior studies caution that ensembles of highly similar models may underestimate uncertainty [15] and research into LLM-based grading of programming assignments found considerable clustering by provider [37], we found that an ensemble composed exclusively of OpenAI models (gpt-4.1-nano, gpt-5-nano, gpt-oss-20b) was already effective under SURE. This suggests that meaningful diversity can arise even among models from the same provider, likely due to differences in size, architecture, and reasoning capabilities rather than training data alone. However, the second, more heterogeneous ensemble (gpt-5, codestral-25.01, llama-3.3-70b-instruct) achieved even better alignment with human grading. While this gain may partly reflect the strong individual performance of gpt-5, this finding does point towards utilizing diverse ensembles. Notably, reasoning models such as gpt-oss-20b consistently outperformed non-reasoning models even when they were larger (llama-3.3-70b-instruct) or domain-specialized (codestral-25.01), indicating that reasoning capability is more important for LLM-based grading than the number of parameters or domain specialization. The strong performance of gpt-oss-20b is especially encouraging in this regard. As an open-source reasoning model, it combines competitive grading accuracy with lower deployment costs and improved data privacy, making it a practical candidate for educational settings. Notably, gpt-5 achieved very good performance even when scoring student answers based on a single prompt. However, large reasoning models also incur higher latency and computational cost, especially when prompted synchronously at scale. These trade-offs highlight that ensemble design for SURE grading must balance accuracy gains against cost, latency, and privacy constraints. Based on our findings, we recommend constructing SURE ensembles by prioritizing diversity in reasoning behavior rather than model size alone. A practical strategy might be to start with a small set of diverse, preferably open-source reasoning models, evaluate their performance in context, and only add larger or closed-source models if necessary.
Beyond ensembling, only high temperature and top-p sampling with gpt-4.1-nano emerged as an effective diversification strategy for improving grade alignment under SURE. Randomizing rubric order and instructing models to adopt grading personas (e.g., lenient or strict) had little effect, and multilingual prompting even reduced grading accuracy for gpt-4.1-nano under single-prompt conditions. However, this adverse effect was attenuated under majority voting and largely absent for the gpt-5-nano and gpt-oss-20b, suggesting that earlier-generation models may be less consistent across languages than more recent reasoning models. Importantly, these findings are based on a single study and do not imply that multilingual prompting is generally ineffective as a diversification strategy. In fact, prior work has shown multilingual prompting to be more effective than temperature sampling or persona prompting for inducing useful diversity in question answering tasks [24]. Moreover, our results do not permit conclusions about LLM-based grading in multilingual educational settings as investigated by ref. [2]. Future work should examine multilingual prompting and other diversification strategies—such as dynamically sampling few-shot exemplars in broader grading contexts.
SURE aligns closely with regulatory expectations for AI-supported assessment: under the EU AI Act, systems used for evaluating student performance are classified as high-risk applications, requiring meaningful human oversight and safeguards against systematic error [9]. SURE operationalizes this principle by using uncertainty estimates to determine when human intervention is warranted, allowing instructors to retain control over ambiguous or error-prone cases while benefiting from automation when model confidence is high. Several other human-in-the-loop grading frameworks have been proposed for similar reasons. These include iterative prompt refinement through cycles of human and LLM grading (CoTAL; [79]), escalation based on discrepancies between LLM scores and student self-evaluations (AVALON; [80]), and approaches that rely on psychometric modeling to derive uncertainty estimates [8]. Compared to these methods, SURE is comparatively lightweight: it requires no iterative alignment, no student input, and no explicit psychometric modeling, relying instead on self-consistency and cross-model agreement to identify cases that merit human review. This design allows large portions of an assignment to be graded automatically when confidence is high, while preserving instructor oversight where it is most needed.
Nevertheless, several limitations of our study warrant clarification and point towards future research opportunities. A first limitation concerns the use of human grading as the reference standard. Although interrater reliability in our study was high, consistent with prior work on rubric-based assessment [38,59], human grading is not infallible. In earlier work using data from the same course, we observed cases in which human graders made mistakes that LLMs avoided, such as overlooking rubric criteria or syntax errors [1]. It is therefore possible that some student answers in the present study were consistently misgraded by all human raters despite high agreement, highlighting that aggregated human scores represent a pragmatic benchmark rather than an absolute ground truth. Future work could address this limitation by incorporating more objective reference measures where available. In programming education, aspects of student solutions can often be evaluated using unit tests or static analysis [34,49]. Because the rubrics evaluated here were designed for human assessment and student solutions were highly heterogeneous, retroactively implementing unit tests or pattern-matching rules would not have been feasible. Future work should therefore draw on data from programming courses that already rely on objective, test-based grading criteria to compare traditional autograding, LLM-based approaches, and manual assessment in a more controlled and systematic manner. Such comparisons would allow a clearer analysis of shared and complementary failure modes and could inform the design of principled hybrid solutions. At the same time, practical considerations remain important. Synchronous prompting of multiple LLMs—especially large reasoning models—can be computationally expensive and time-consuming, particularly in large classes. In contexts where batching with reasonable completion windows or other forms of parallelized prompting are not available, traditional automated grading methods, which are often highly time-efficient [34], may remain the more pragmatic choice.
A second limitation concerns the way human regrading was simulated. Regrading was performed by randomly sampling among available graders, which likely understates persistent rater-specific tendencies (e.g., strict vs. lenient grading) and may therefore make SURE appear less biased by partially averaging out grader effects. In practice, however, many courses rely on a single instructor or teaching assistant per submission, making such tendencies unavoidable. When multiple graders are involved, a common mitigation is to assign graders by question rather than by student, which improves consistency within items while preserving independent judgments across graders. In the context of SURE, such best practices should be maintained during regrading to avoid scoring some submissions more strictly or leniently than others.
Another limitation concerns how uncertainty was operationalized for flagging. We relied on prompt agreement; specifically, the relative frequency of the modal score as a simple and interpretable certainty measure. This performed well under the coarse 0–1 grading scheme used here but may ignore other uncertainty cues in settings with more continuous scoring. Although we evaluated alternative distributional metrics and did not observe meaningful improvements in the present study, future work should examine alternative uncertainty metrics, some of which can be found in recent studies operationalizing self-consistency-based uncertainty quantification in various contexts [14,15,26]. Additionally, future work should explore whether uncertainty-based flagging is unbiased with respect to students. While we did not observe any obvious patterns, the literature on this topic is mixed with [81] reporting no bias in short answer grading but [82] reporting gender and racial biases in resume screening. In the context of SURE, it is possible that certain answer styles, languages, or other factors systematically increase or decrease the likelihood of getting flagged, which could inadvertently introduce inequities in grading.
Relatedly, setting an appropriate flagging threshold poses another practical challenge. While the fixed threshold of tuned on the first assignment served as a well-calibrated flagging threshold for both ensembles in the remaining four assignments, optimal thresholds for individual models varied considerably. Further, while the test-set assignments differed from the training-set assignment in content, they were all still drawn from the same course and used similar scoring criteria. Thus, it remains unclear whether the same threshold would generalize to other courses, domains, or grading schemes. In fact, we think it is likely that optimal thresholds may vary substantially across contexts. Researchers exploring SURE in new settings should therefore calibrate thresholds carefully for example by tuning them based on the score [8] using historical course data. Critically, such tuning requires additional data and effort and may therefore be impractical in many instructional settings. Instead, instructors may prefer simple heuristics, such as regrading all cases with a single deviating score across repeated evaluations (i.e., using an aggressive threshold at certainty ), regrading the lowest p percent of certainty values, or regrading a fixed proportion of submissions (e.g., half of an assignment). Such heuristics avoid reliance on calibration data and allow instructors to directly control the amount of human effort invested but require careful consideration of how much uncertainty can be tolerated for a given assessment context.
Alternatively, we think that a particularly promising extension lies in combining SURE and student self-grading, similar in spirit to the AVALON framework [80]. Instead of flagging uncertain cases for instructors, students could receive transparent grading reports that include rubric-based predicted scores, results from repeated LLM ensemble evaluations, and visualizations of score consistency (e.g., histograms of scores across runs). Low-certainty cases would thus not be flagged for teachers but students, who could be asked to self-grade their work using the same criteria and indicate whether they agree with the model’s assessment. Submissions for which student self-grades and LLM-based grades diverge could then be deferred to instructors for review. Such a workflow could provide students with timely and detailed feedback, which is a powerful driver of learning and often neglected in higher education settings [83,84]. Prior research has shown that students appreciate LLM-generated feedback and perceive it as helpful when it is timely and transparent [1,85,86,87], suggesting an opportunity for integrating assessment and feedback to support learning rather than merely assigning grades. Requiring students to engage with grading criteria and evaluate their own work may further enhance learning, as self-assessment has been shown to improve performance, metacognition, and self-regulated learning [88]. From a practical perspective, such a framework could be integrated in a learning management system like Canvas [89], building on existing LLM-based grading and feedback integrations [1]. One potential drawback is that increased transparency may limit the reuse of identical assignment questions across years, but this may be an acceptable trade-off given the potential gains in feedback timeliness, transparency, and the opportunity for instructors to reinvest saved time in tutoring and individualized support.
A final and critical limitation concerns the generalizability of our findings. Our evaluation was conducted based of data from a single relatively small introductory programming course using a coarse grading scheme and a specific set of assignments, which limits the extent to which conclusions can be directly transferred to other domains, educational levels, or assessment formats. At the same time, this setting provides a demanding test case: assignments combine open-ended questions and coding exercises, partial credit, and heterogeneous student solutions and have been shown to expose both LLM and human grading errors in prior work [1]. Future research should therefore validate SURE across a broader range of contexts, including courses outside programming, finer-grained or analytic rubrics, different languages, and different task formats. We are currently collecting data from additional courses spanning multiple disciplines, languages, and assessment forms to this end, and encourage other researchers to replicate and extend our findings in diverse educational settings. Beyond validating performance, such studies should investigate alternative diversification and ensembling strategies, varied uncertainty metrics, escalation heuristics or data-driven flagging mechanisms, and assess which parts of SURE as presented here are most sensitive to contextual factors. Establishing how SURE can be adapted to diverse instructional settings will be essential for assessing its potential as a general, domain-agnostic framework for reliable and scalable AI-assisted grading that genuinely supports educators while maintaining the rigor and integrity of human judgment.
Author Contributions
Conceptualization, L.K. and E.A.; methodology, L.K.; software, L.K. and H.R.; validation, L.K.; formal analysis, L.K.; investigation, L.K.; data curation, L.K., H.R., G.G. and E.A.; writing—original draft preparation, L.K.; writing—review and editing, L.K., H.R., R.G., I.V., G.G. and E.A.; visualization, L.K.; supervision, L.K., H.R., R.G. and I.V.; project administration, L.K. All authors have read and agreed to the published version of the manuscript.
Funding
This research received no external funding.
Institutional Review Board Statement
The study was conducted in accordance with the Declaration of Helsinki, and approved by the Ethics Committee of the Faculty of Social and Behavioral Sciences at the University of Amsterdam (FMG-11904, 1 July 2025).
Informed Consent Statement
Informed consent was obtained from all subjects involved in the study.
Data Availability Statement
The data presented in this study are available on request from the corresponding author due to restrictions related to participant privacy and ethical considerations imposed by the Ethics Committee of the Faculty of Social and Behavioral Sciences at the University of Amsterdam.
Acknowledgments
During the preparation of this manuscript, the authors used ChatGPT 5.1 voice mode to discuss and summarize ideas and ChatGPT 5.1 to revise parts of the manuscript. The authors have reviewed and edited the output and take full responsibility for the content of this publication.
Conflicts of Interest
The authors declare no conflicts of interest.
Abbreviations
The following abbreviations are used in this manuscript:
| LLMs | Large language models |
| AI | Artificial intelligence |
| SURE | Selective Uncertainty-based Re-Evaluation |
| IRT | Item Response Theory |
| TP | True positive |
| FP | False positive |
| TN | True negative |
| FN | False negative |
| SP | Single prompt |
| MV | Majority voting |
Appendix A. LLM Prompts
We assembled the grading prompt based on the prompting condition (e.g., varying grading personas) and the respective student answer. For brevity, we only include the English prompt components, which we translated into different languages for conditions that used multilingual prompting. The base prompt included placeholders for format, personality, question, submission, and rubric (Listing A1):
| Listing A1. Base prompt for LLM grading. |
 |
The format placeholder was replaced with a structured json response format (Listing A2):
| Listing A2. JSON response format used in the format placeholder. |
 |
The personality placeholder was replaced with an empty string in conditions without personas and with one of the four grading personas otherwise (Listing A3):
| Listing A3. Grading personas used for the personality placeholder. |
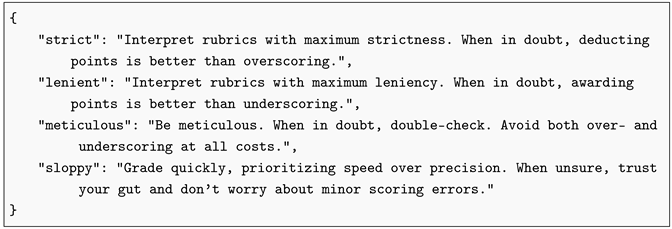 |
The question, submission, and rubric placeholders were replaced with the respective text for each student answer that was scored by the LLMs.
References
- Korthals, L.; Rosenbusch, H.; Grasman, R.; Visser, I. Grading University Students with LLMs: Performance and Acceptance of a Canvas-Based Automation. In Artificial Intelligence in Education. Posters and Late Breaking Results, Workshops and Tutorials, Industry and Innovation Tracks, Practitioners, Doctoral Consortium, Blue Sky, and WideAIED; Cristea, A.I., Walker, E., Lu, Y., Santos, O.C., Isotani, S., Eds.; Springer: Cham, Switzerland, 2025; pp. 36–43. [Google Scholar] [CrossRef] [Scilit]
- Grévisse, C. LLM-based automatic short answer grading in undergraduate medical education. BMC Med. Educ. 2024, 24, 1060. [Google Scholar] [CrossRef] [Scilit]
- Flodén, J. Grading exams using large language models: A comparison between human and AI grading of exams in higher education using ChatGPT. Br. Educ. Res. J. 2025, 51, 201–224. [Google Scholar] [CrossRef] [Scilit]
- Ishida, T.; Liu, T.; Wang, H.; Cheung, W.K. Large language models as partners in student essay evaluation. arXiv 2024, arXiv:2405.18632. [Google Scholar] [CrossRef] [Scilit]
- Yavuz, F.; Çelik, O.; Yavaş Çelik, G. Utilizing large language models for EFL essay grading: An examination of reliability and validity in rubric-based assessments. Br. J. Educ. Technol. 2025, 56, 150–166. [Google Scholar] [CrossRef] [Scilit]
- Polat, M. Analysis of Multiple-Choice versus Open-Ended Questions in Language Tests According to Different Cognitive Domain Levels. Novitas-ROYAL (Res. Youth Lang.) 2020, 14, 76–96. [Google Scholar]
- Schneider, J.; Schenk, B.; Niklaus, C. Towards LLM-based Autograding for Short Textual Answers. arXiv 2024, arXiv:2309.11508. [Google Scholar] [CrossRef] [Scilit]
- Kortemeyer, G.; Nöhl, J. Assessing confidence in AI-assisted grading of physics exams through psychometrics: An exploratory study. Phys. Rev. Phys. Educ. Res. 2025, 21, 010136. [Google Scholar] [CrossRef] [Scilit]
- European Parliament and Council of the European Union. Regulation (EU) 2024/1689 of the European Parliament and of the Council of 13 June 2024 laying down harmonised rules on artificial intelligence and amending Regulations (EC) No 300/2008, (EU) No 167/2013, (EU) No 168/2013, (EU) 2018/858, (EU) 2018/1139 and (EU) 2019/2144 and Directives 2014/90/EU, (EU) 2016/797 and (EU) 2020/1828 (Artificial Intelligence Act) (Text with EEA relevance). Off. J. Eur. Union 2024, 2024/1689, 1–144. [Google Scholar]
- Bhandari, S.; Pardos, Z. Can Language Models Grade Algebra Worked Solutions? Evaluating LLM-Based Autograders Against Human Grading. In Proceedings of the 18th International Conference on Educational Data Mining, Palermo, Italy, 20–23 July 2025; Mills, C., Alexandron, G., Taibi, D., Lo Bosco, G., Paquette, L., Eds.; International Educational Data Mining Society: Palermo, Italy, 2025; pp. 554–558. [Google Scholar] [CrossRef]
- Chen, Z.; Wan, T. Grading Explanations of Problem-Solving Process and Generating Feedback Using Large Language Models at Human-Level Accuracy. Phys. Rev. Phys. Educ. Res. 2025, 21, 010126. [Google Scholar] [CrossRef] [Scilit]
- Wang, X.; Wei, J.; Schuurmans, D.; Le, Q.; Chi, E.; Narang, S.; Chowdhery, A.; Zhou, D. Self-Consistency Improves Chain of Thought Reasoning in Language Models. arXiv 2023, arXiv:2203.11171. [Google Scholar] [CrossRef] [Scilit]
- Portillo Wightman, G.; Delucia, A.; Dredze, M. Strength in Numbers: Estimating Confidence of Large Language Models by Prompt Agreement. In Proceedings of the 3rd Workshop on Trustworthy Natural Language Processing (TrustNLP 2023), Toronto, Canada, 14 July 2023; Ovalle, A., Chang, K.-W., Mehrabi, N., Pruksachatkun, Y., Galystan, A., Dhamala, J., Verma, A., Cao, T., Kumar, A., Gupta, R., Eds.; Association for Computational Linguistics: Stroudsburg, PA, USA, 2023; pp. 326–362. [Google Scholar] [CrossRef] [Scilit]
- Simple Yet Effective: An Information-Theoretic Approach to Multi-LLM Uncertainty Quantification. In Proceedings of the 2025 Conference on Empirical Methods in Natural Language Processing, Suzhou, China, 4–9 November 2025; Christodoulopoulos, C., Chakraborty, T., Rose, C., Peng, V., Eds.; Association for Computational Linguistics: Stroudsburg, PA, USA, 2025; pp. 30493–30504. [Google Scholar] [CrossRef] [Scilit]
- Hamidieh, K.; Thost, V.; Gerych, W.; Yurochkin, M.; Ghassemi, M. Uncovering Confident Failures: The Complementary Roles of Aleatoric and Epistemic Uncertainty in LLMs. In Proceedings of the NeurIPS 2025 Workshop: Reliable ML from Unreliable Data, San Diego, CA, USA, 6 December 2025; Available online: https://openreview.net/forum?id=9Jq7wNrpUI (accessed on 3 November 2025).
- Horton, P.; Florea, A.; Stringfield, B. Conformal validation: A deferral policy using uncertainty quantification with a human-in-the-loop for model validation. Mach. Learn. Appl. 2025, 22, 100733. [Google Scholar] [CrossRef] [Scilit]
- Strong, J.; Men, Q.; Noble, A. Trustworthy and Practical AI for Healthcare: A Guided Deferral System with Large Language Models. arXiv 2025, arXiv:2406.07212. [Google Scholar] [CrossRef] [Scilit]
- Alves, J.V.; Leitão, D.; Jesus, S.; Sampaio, M.O.P.; Liébana, J.; Saleiro, P.; Figueiredo, M.A.T.; Bizarro, P. A benchmarking framework and dataset for learning to defer in human-AI decision-making. Sci. Data 2025, 12, 506. [Google Scholar] [CrossRef] [Scilit]
- OpenAI. How Should I Set the Temperature Parameter? Available online: https://platform.openai.com/docs/faq/how-should-i-set-the-temperature-parameter (accessed on 3 November 2025).
- Peeperkorn, M.; Kouwenhoven, T.; Brown, D.; Jordanous, A. Is Temperature the Creativity Parameter of Large Language Models? arXiv 2024, arXiv:2405.00492. [Google Scholar] [CrossRef] [Scilit]
- Holtzman, A.; Buys, J.; Du, L.; Forbes, M.; Choi, Y. The Curious Case of Neural Text Degeneration. In Proceedings of the International Conference on Learning Representations, Virtual Conference, 26 April–1 May 2020. [Google Scholar]
- OpenAI. Using GPT-5, 2025. Available online: https://platform.openai.com (accessed on 3 November 2025).
- Lu, Y.; Bartolo, M.; Moore, A.; Riedel, S.; Stenetorp, P. Fantastically Ordered Prompts and Where to Find Them: Overcoming Few-Shot Prompt Order Sensitivity. In Proceedings of the 60th Annual Meeting of the Association for Computational Linguistics (Volume 1: Long Papers), Dublin, Ireland, 22–27 May 2022; Muresan, S., Nakov, P., Villavicencio, A., Eds.; Association for Computational Linguistics: Stroudsburg, PA, USA, 2022; pp. 8086–8098. [Google Scholar] [CrossRef] [Scilit]
- Wang, Q.; Pan, S.; Linzen, T.; Black, E. Multilingual Prompting for Improving LLM Generation Diversity. In Proceedings of the 2025 Conference on Empirical Methods in Natural Language Processing, Suzhou, China, 4–9 November 2025; Christodoulopoulos, C., Chakraborty, T., Rose, C., Peng, V., Eds.; Association for Computational Linguistics: Stroudsburg, PA, USA, 2025; pp. 6367–6389. [Google Scholar] [CrossRef] [Scilit]
- Fröhling, L.; Demartini, G.; Assenmacher, D. Personas with Attitudes: Controlling LLMs for Diverse Data Annotation. In Proceedings of the 9th Workshop on Online Abuse and Harms (WOAH), Vienna, Austria, 1 August 2025; Calabrese, A., de Kock, C., Nozza, D., Plaza-del Arco, F.M., Talat, Z., Vargas, F., Eds.; Association for Computational Linguistics: Stroudsburg, PA, USA, 2025; pp. 468–481. Available online: https://aclanthology.org/2025.woah-1.43/ (accessed on 3 November 2025).
- Chen, J.; Mueller, J. Quantifying Uncertainty in Answers from any Language Model and Enhancing their Trustworthiness. In Proceedings of the 62nd Annual Meeting of the Association for Computational Linguistics (Volume 1: Long Papers), Bangkok, Thailand, 11–16 August 2024; Ku, L.W., Martins, A., Srikumar, V., Eds.; Association for Computational Linguistics: Stroudsburg, PA, USA, 2024; pp. 5186–5200. [Google Scholar] [CrossRef] [Scilit]
- Hastie, T.; Tibshirani, R.; Friedman, J. Ensemble Learning. In The Elements of Statistical Learning: Data Mining, Inference, and Prediction; Hastie, T., Tibshirani, R., Friedman, J., Eds.; Springer: New York, NY, USA, 2009; pp. 605–624. [Google Scholar] [CrossRef]
- Tekin, S.F.; Ilhan, F.; Huang, T.; Hu, S.; Liu, L. LLM-TOPLA: Efficient LLM Ensemble by Maximising Diversity. In Findings of the Association for Computational Linguistics: EMNLP 2024, Miami, FL, USA, 12–16 November 2024; Al-Onaizan, Y., Bansal, M., Chen, Y.N., Eds.; Association for Computational Linguistics: Stroudsburg, PA, USA, 2024; pp. 11951–11966. [Google Scholar] [CrossRef] [Scilit]
- Wang, J.; Wang, J.; Athiwaratkun, B.; Zhang, C.; Zou, J. Mixture-of-Agents Enhances Large Language Model Capabilities. arXiv 2024, arXiv:2406.04692. [Google Scholar] [CrossRef] [Scilit]
- Yang, H.; Li, M.; Zhou, H.; Xiao, Y.; Fang, Q.; Zhou, S.; Zhang, R. Large Language Model Synergy for Ensemble Learning in Medical Question Answering: Design and Evaluation Study. J. Med. Internet Res. 2025, 27, e70080. [Google Scholar] [CrossRef] [Scilit]
- Lewkowycz, A.; Andreassen, A.; Dohan, D.; Dyer, E.; Michalewski, H.; Ramasesh, V.; Slone, A.; Anil, C.; Schlag, I.; Gutman-Solo, T.; et al. Solving Quantitative Reasoning Problems with Language Models. In Advances in Neural Information Processing Systems; Koyejo, S., Mohamed, S., Agarwal, A., Belgrave, D., Cho, K., Oh, A., Eds.; Curran Associates, Inc.: Red Hook, NY, USA, 2022; Volume 35, pp. 3843–3857. [Google Scholar]
- R Core Team. R: A Language and Environment for Statistical Computing; R Foundation for Statistical Computing: Vienna, Austria, 2022. [Google Scholar]
- Van Rossum, G.; Drake, F.L., Jr. Python Reference Manual; Centrum voor Wiskunde en Informatica: Amsterdam, The Netherlands, 1995. [Google Scholar]
- Messer, M.; Brown, N.C.C.; Kölling, M.; Shi, M. Automated Grading and Feedback Tools for Programming Education: A Systematic Review. ACM Trans. Comput. Educ. 2024, 24, 1–43. [Google Scholar] [CrossRef] [Scilit]
- OpenAI; Hurst, A.; Lerer, A.; Goucher, A.P.; Perelman, A.; Ramesh, A.; Clark, A.; Ostrow, A.J.; Welihinda, A.; Hayes, A.; et al. GPT-4o System Card. arXiv 2024, arXiv:2410.21276. [Google Scholar] [CrossRef] [Scilit]
- Jukiewicz, M. The Future of Grading Programming Assignments in Education: The Role of ChatGPT in Automating the Assessment and Feedback Process. Think. Ski. Creat. 2024, 52, 101522. [Google Scholar] [CrossRef] [Scilit]
- Jukiewicz, M. A Systematic Comparison of Large Language Models for Automated Assignment Assessment in Programming Education: Exploring the Importance of Architecture and Vendor. arXiv 2025, arXiv:2509.26483. [Google Scholar] [CrossRef] [Scilit]
- Messer, M.; Brown, N.C.C.; Kölling, M.; Shi, M. How Consistent Are Humans When Grading Programming Assignments? ACM Trans. Comput. Educ. 2025, 25, 1–37. [Google Scholar] [CrossRef] [Scilit]
- Valenti, S.; Neri, F.; Cucchiarelli, A. An Overview of Current Research on Automated Essay Grading. J. Inf. Technol. Educ. Res. 2003, 2, 319–330. [Google Scholar] [CrossRef] [Scilit]
- Dikli, S. An Overview of Automated Scoring of Essays. J. Technol. Learn. Assess. 2006, 5, 1–36. Available online: https://ejournals.bc.edu/index.php/jtla/article/view/1640 (accessed on 3 November 2025).
- Ifenthaler, D. Automated Essay Scoring Systems. In Handbook of Open, Distance and Digital Education; Zawacki-Richter, O., Jung, I., Eds.; Springer Nature: Singapore, 2023; pp. 1057–1071. [Google Scholar] [CrossRef] [Scilit]
- Page, E.B. The Use of the Computer in Analyzing Student Essays. Int. Rev. Educ. 1968, 14, 210–225. [Google Scholar] [CrossRef] [Scilit]
- Mohler, M.; Mihalcea, R. Text-to-Text Semantic Similarity for Automatic Short Answer Grading. In Proceedings of the 12th Conference of the European Chapter of the Association for Computational Linguistics, Athens, Greece, 30 March–3 April 2009; Lascarides, A., Gardent, C., Nivre, J., Eds.; Association for Computational Linguistics: Stroudsburg, PA, USA, 2009; pp. 567–575. Available online: https://aclanthology.org/E09-1065/ (accessed on 3 November 2025).
- Dong, F.; Zhang, Y. Automatic Features for Essay Scoring—An Empirical Study. In Proceedings of the 2016 Conference on Empirical Methods in Natural Language Processing, Austin, TX, USA, 1–5 November 2016; Association for Computational Linguistics: Stroudsburg, PA, USA, 2016; pp. 1072–1077. [Google Scholar] [CrossRef] [Scilit]
- Taghipour, K.; Ng, H.T. A Neural Approach to Automated Essay Scoring. In Proceedings of the 2016 Conference on Empirical Methods in Natural Language Processing, Austin, TX, USA, 1–5 November 2016; Association for Computational Linguistics: Stroudsburg, PA, USA, 2016; pp. 1882–1891. [Google Scholar] [CrossRef] [Scilit]
- Uto, M. A Review of Deep-Neural Automated Essay Scoring Models. Behaviormetrika 2021, 48, 459–484. [Google Scholar] [CrossRef] [Scilit]
- Leacock, C.; Chodorow, M. C-Rater: Automated Scoring of Short-Answer Questions. Comput. Humanit. 2003, 37, 389–405. [Google Scholar] [CrossRef] [Scilit]
- Attali, Y.; Burstein, J. Automated Essay Scoring with e-rater® V.2. J. Technol. Learn. Assess. 2006, 4, 1–31. Available online: https://ejournals.bc.edu/index.php/jtla/article/view/1650 (accessed on 3 November 2025). [CrossRef] [Scilit]
- Ihantola, P.; Ahoniemi, T.; Karavirta, V.; Seppälä, O. Review of Recent Systems for Automatic Assessment of Programming Assignments. In Proceedings of the 10th Koli Calling International Conference on Computing Education Research, Koli, Finland, 28–31 October 2010; ACM: New York, NY, USA, 2010; pp. 86–93. [Google Scholar] [CrossRef] [Scilit]
- Staubitz, T.; Klement, H.; Renz, J.; Teusner, R.; Meinel, C. Towards Practical Programming Exercises and Automated Assessment in Massive Open Online Courses. In Proceedings of the 2015 IEEE International Conference on Teaching, Assessment, and Learning for Engineering (TALE), Zhuhai, China, 10–12 December 2015; IEEE: New York, NY, USA, 2015; pp. 23–30. [Google Scholar] [CrossRef] [Scilit]
- Novak, M.; Kermek, D. Assessment Automation of Complex Student Programming Assignments. Educ. Sci. 2024, 14, 54. [Google Scholar] [CrossRef] [Scilit]
- Rodríguez, J.F.; Fernández-García, A.J.; Verdú, E. Grading Open-Ended Questions Using LLMs and RAG. Expert Syst. 2026, 43, e70174. [Google Scholar] [CrossRef] [Scilit]
- Yewon, A.; Sang-Ki, L. The Impact of Prompt Engineering on GPT-4o’s Scoring Reliability in English Writing Assessment. SSRN 2025. [Google Scholar] [CrossRef] [Scilit]
- Golchin, S.; Garuda, N.; Impey, C.; Wenger, M. Large Language Models As MOOCs Graders. arXiv 2024, arXiv:2402.03776. [Google Scholar] [CrossRef] [Scilit]
- Ferreira Mello, R.; Pereira Junior, C.; Rodrigues, L.; Pereira, F.D.; Cabral, L.; Costa, N.; Ramalho, G.; Gasevic, D. Automatic Short Answer Grading in the LLM Era: Does GPT-4 with Prompt Engineering Beat Traditional Models? In Proceedings of the 15th International Learning Analytics and Knowledge Conference, Dublin, Ireland, 3–7 March 2025; ACM: New York, NY, USA, 2025; pp. 93–103. [Google Scholar] [CrossRef] [Scilit]
- Qiu, H.; White, B.; Ding, A.; Costa, R.; Hachem, A.; Ding, W.; Chen, P. SteLLA: A Structured Grading System Using LLMs with RAG. arXiv 2025, arXiv:2501.09092. [Google Scholar] [CrossRef] [Scilit]
- Latif, E.; Zhai, X. Fine-Tuning ChatGPT for Automatic Scoring. Comput. Educ. Artif. Intell. 2024, 6, 100210. [Google Scholar] [CrossRef] [Scilit]
- Pathak, A.; Gandhi, R.; Uttam, V.; Ramamoorthy, A.; Ghosh, P.; Jindal, A.R.; Verma, S.; Mittal, A.; Ased, A.; Khatri, C.; et al. Rubric Is All You Need: Improving LLM-Based Code Evaluation with Question-Specific Rubrics. In Proceedings of the 2025 ACM Conference on International Computing Education Research, Charlottesville, VA, USA, 3–6 August 2025; ACM: New York, NY, USA, 2025; pp. 181–195. [Google Scholar] [CrossRef] [Scilit]
- Jonsson, A.; Svingby, G. The Use of Scoring Rubrics: Reliability, Validity and Educational Consequences. Educ. Res. Rev. 2007, 2, 130–144. [Google Scholar] [CrossRef] [Scilit]
- Hossain, S. Visualization of Bioinformatics Data with Dash Bio. SciPy 2019. [Google Scholar] [CrossRef] [Scilit]
- Shrout, P.E.; Fleiss, J.L. Intraclass Correlations: Uses in Assessing Rater Reliability. Psychol. Bull. 1979, 86, 420–428. [Google Scholar] [CrossRef] [PubMed]
- Revelle, W. psych: Procedures for Psychological, Psychometric, and Personality Research; Northwestern University: Evanston, IL, USA, 2025; Available online: https://CRAN.R-project.org/package=psych (accessed on 3 November 2025).
- Bates, D.; Mächler, M.; Bolker, B.; Walker, S. Fitting Linear Mixed-Effects Models Using lme4. J. Stat. Softw. 2015, 67, 1–48. [Google Scholar] [CrossRef] [Scilit]
- Simpson, E.H. Measurement of Diversity. Nature 1949, 163, 688. [Google Scholar] [CrossRef] [Scilit]
- Akaike, H. A New Look at the Statistical Model Identification. IEEE Trans. Autom. Control 1974, 19, 716–723. [Google Scholar] [CrossRef] [Scilit]
- Schwarz, G. Estimating the Dimension of a Model. Ann. Stat. 1978, 6, 461–464. [Google Scholar] [CrossRef] [Scilit]
- OpenAI. GPT-4 0.1 Nano-OpenAI API. Available online: https://platform.openai.com/docs/models/gpt-4.1-nano (accessed on 3 November 2025).
- OpenAI. GPT-5 Nano-OpenAI API. Available online: https://platform.openai.com/docs/models/gpt-5-nano (accessed on 3 November 2025).
- OpenAI. Gpt-Oss-20b-OpenAI API. Available online: https://platform.openai.com/docs/models/gpt-oss-20b (accessed on 3 November 2025).
- OpenAI. Batch API - OpenAI API. Available online: https://platform.openai.com/docs/guides/batch (accessed on 3 November 2025).
- Microsoft. Azure Machine Learning—ML as a Service|Microsoft Azure. Available online: https://azure.microsoft.com/en-us/products/machine-learning (accessed on 3 November 2025).
- DeepL. DeepL Translate: The World’s Most Accurate Translator. Available online: https://www.deepl.com/translator (accessed on 3 November 2025).
- Capretto, T.; Piho, C.; Kumar, R.; Westfall, J.; Yarkoni, T.; Martin, O.A. Bambi: A simple interface for fitting Bayesian linear models in Python. arXiv 2022, arXiv:2012.10754. [Google Scholar] [CrossRef] [Scilit]
- Westfall, J. Statistical details of the default priors in the Bambi library. arXiv 2017, arXiv:1702.01201. [Google Scholar] [CrossRef] [Scilit]
- OpenAI. Introducing GPT-5. 2025. Available online: https://openai.com/index/introducing-gpt-5/ (accessed on 31 January 2026).
- Grattafiori, A.; Dubey, A.; Jauhri, A.; Pandey, A.; Kadian, A.; Al-Dahle, A.; Letman, A.; Mathur, A.; Schelten, A.; Vaughan, A.; et al. The Llama 3 Herd of Models. arXiv 2024, arXiv:2407.21783. [Google Scholar] [CrossRef] [Scilit]
- Mistral AI Team. Codestral 25.01|Mistral AI. 2025. Available online: https://mistral.ai/news/codestral-2501?utm_source=chatgpt.com (accessed on 31 January 2026).
- Universiteit van Amsterdam. UvA AI Chat. 2025. Available online: https://www.uva.nl/over-de-uva/over-de-universiteit/ai/ai-in-het-onderwijs/uva-ai-chat/uva-ai-chat.html (accessed on 31 January 2026).
- Cohn, C.; S, A.T.; Mohammed, N.; Biswas, G. CoTAL: Human-in-the-Loop Prompt Engineering for Generalizable Formative Assessment Scoring. arXiv 2025, arxiv.2504.02323. [Google Scholar] [CrossRef] [Scilit]
- Armfield, D.; Chen, E.; Omonkulov, A.; Tang, X.; Lin, J.; Thiessen, E.; Koedinger, K. Avalon: A Human-in-the-Loop LLM Grading System with Instructor Calibration and Student Self-assessment. In Artificial Intelligence in Education. Posters and Late Breaking Results, Workshops and Tutorials, Industry and Innovation Tracks, Practitioners, Doctoral Consortium, Blue Sky, and WideAIED; Cristea, A.I., Walker, E., Lu, Y., Santos, O.C., Isotani, S., Eds.; Springer: Cham, Switzerland, 2025; pp. 111–118. [Google Scholar] [CrossRef] [Scilit]
- Rodrigues, L.; Xavier, C.; Costa, N.; Gasevic, D.; Mello, R.F. Is GPT-4 Fair? An Empirical Analysis in Automatic Short Answer Grading. Comput. Educ. Artif. Intell. 2025, 8, 100428. [Google Scholar] [CrossRef] [Scilit]
- An, J.; Huang, D.; Lin, C.; Tai, M. Measuring Gender and Racial Biases in Large Language Models: Intersectional Evidence from Automated Resume Evaluation. PNAS Nexus 2025, 4, pgaf089. [Google Scholar] [CrossRef] [Scilit]
- Hattie, J.; Timperley, H. The Power of Feedback. Rev. Educ. Res. 2007, 77, 81–112. [Google Scholar] [CrossRef] [Scilit]
- Morris, R.; Perry, T.; Wardle, L. Formative Assessment and Feedback for Learning in Higher Education: A Systematic Review. Rev. Educ. 2021, 9, e3292. [Google Scholar] [CrossRef] [Scilit]
- Dai, W.; Lin, J.; Jin, H.; Li, T.; Tsai, Y.S.; Gašević, D.; Chen, G. Can Large Language Models Provide Feedback to Students? A Case Study on ChatGPT. In Proceedings of the 2023 IEEE International Conference on Advanced Learning Technologies (ICALT), Orem, UT, USA, 10–13 July 2023; IEEE: New York, NY, USA, 2023; pp. 323–325. [Google Scholar] [CrossRef] [Scilit]
- Jia, Q.; Cui, J.; Du, H.; Rashid, P.; Xi, R.; Li, R.; Gehringer, E. LLM-generated Feedback in Real Classes and Beyond: Perspectives from Students and Instructors. In Proceedings of the 17th International Conference on Educational Data Mining, Atlanta, GA, USA, 14–17 July 2024; Paaßen, B., Demmans Epp, C., Eds.; International Educational Data Mining Society: Atlanta, GA, USA, 2024; pp. 862–867. [Google Scholar] [CrossRef]
- Meyer, J.; Jansen, T.; Schiller, R.; Liebenow, L.W.; Steinbach, M.; Horbach, A.; Fleckenstein, J. Using LLMs to Bring Evidence-Based Feedback into the Classroom: AI-generated Feedback Increases Secondary Students’ Text Revision, Motivation, and Positive Emotions. Comput. Educ. Artif. Intell. 2024, 6, 100199. [Google Scholar] [CrossRef] [Scilit]
- Nieminen, J.H.; Boud, D. Student Self-Assessment: A Meta-Review of Five Decades of Research. Assess. Educ. Princ. Policy Pract. 2025, 32, 127–151. [Google Scholar] [CrossRef] [Scilit]
- Canvas. Available online: https://www.instructure.com/canvas (accessed on 19 February 2025).
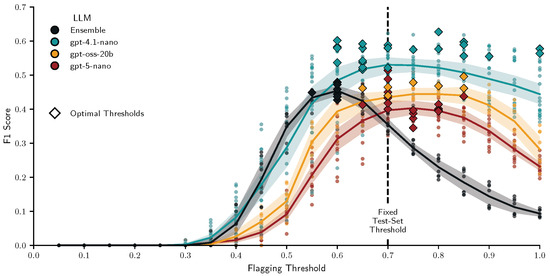
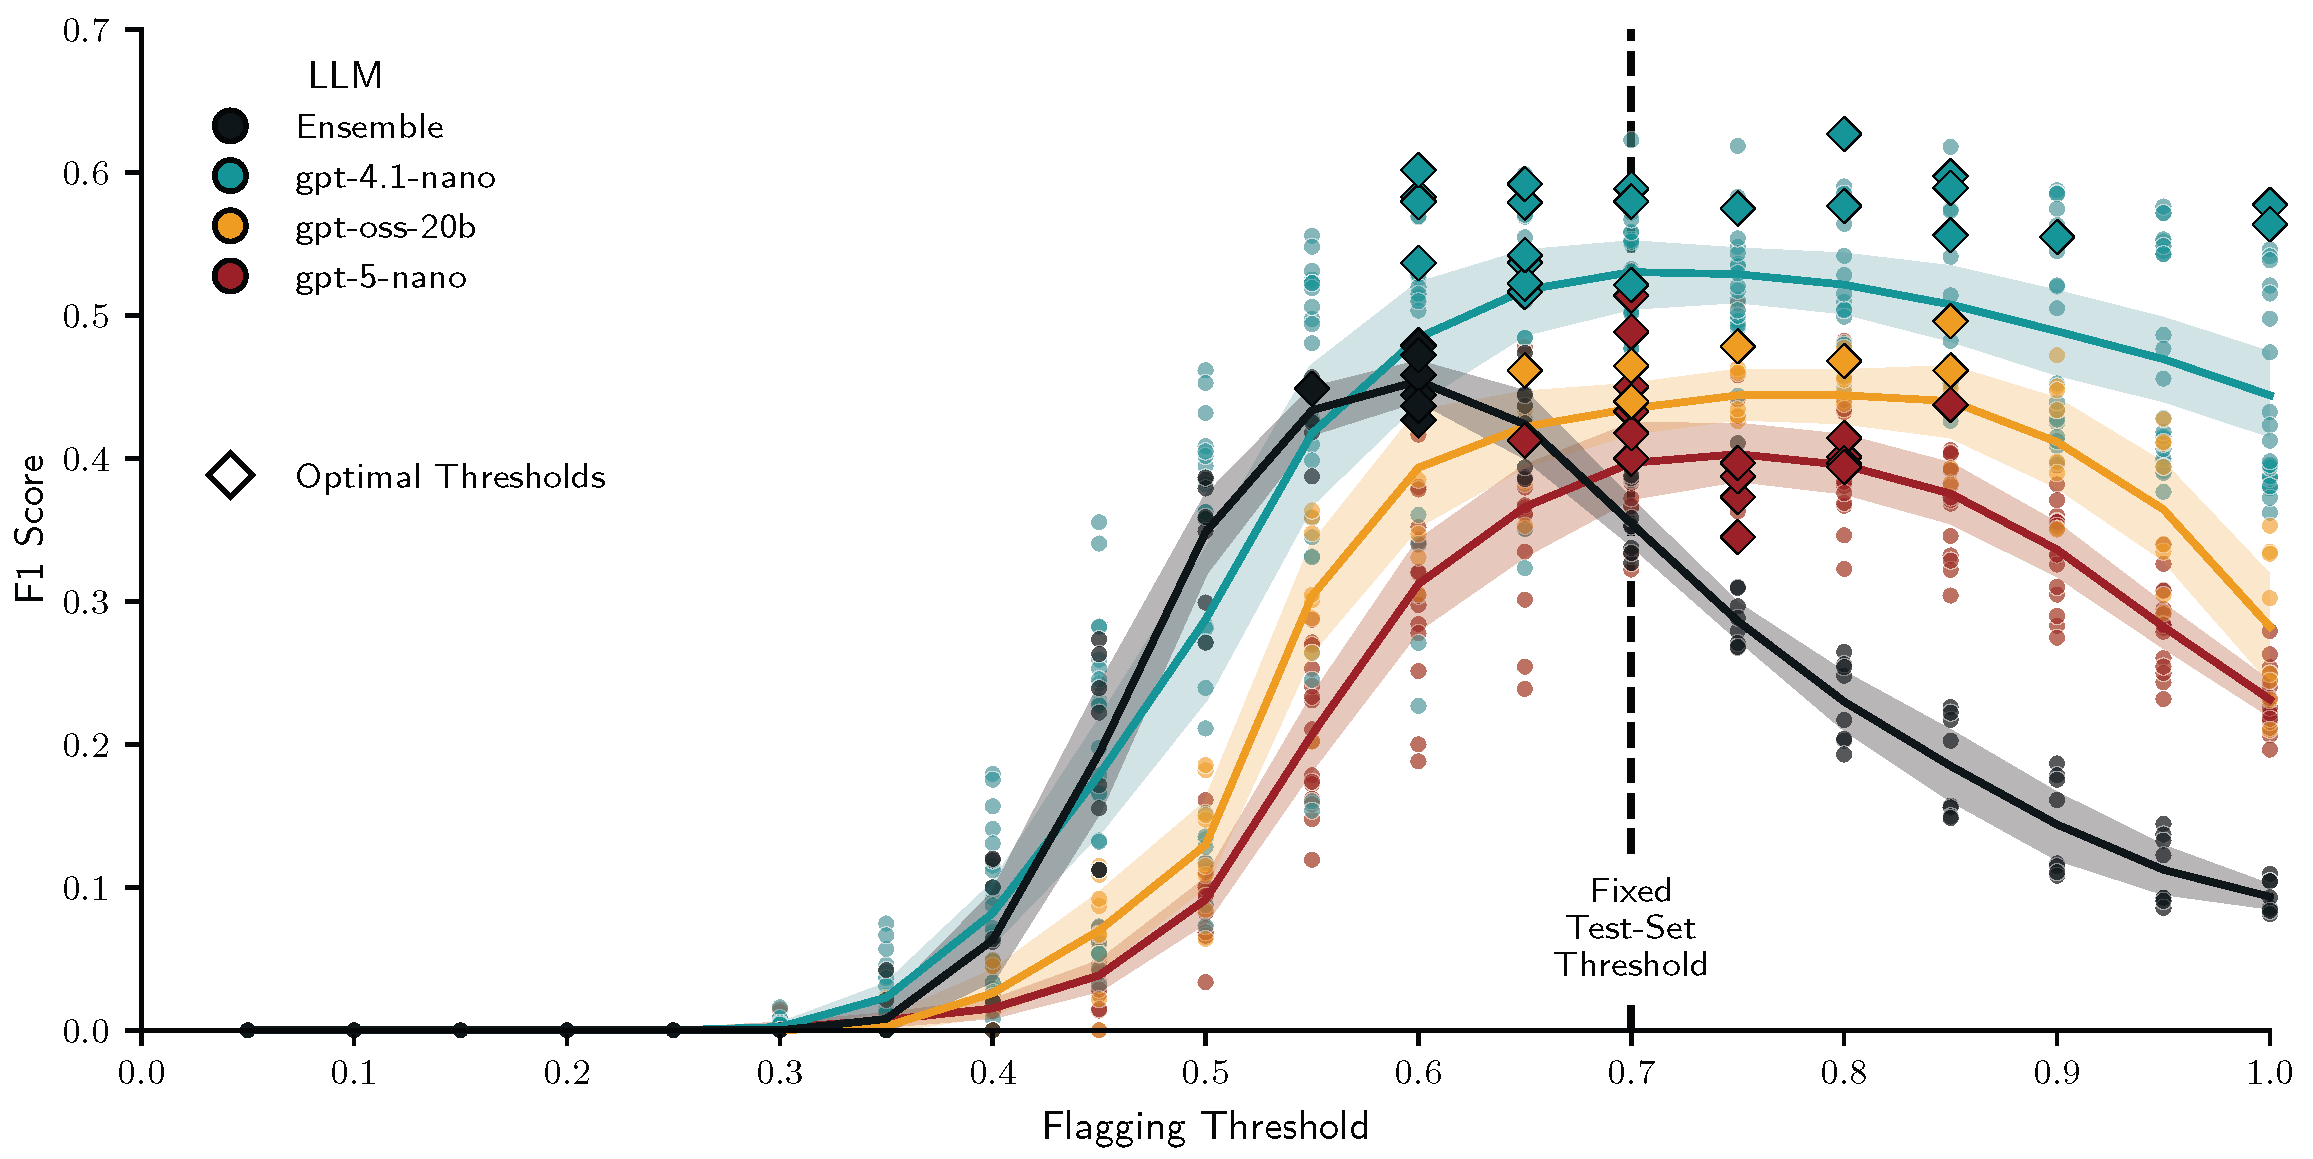
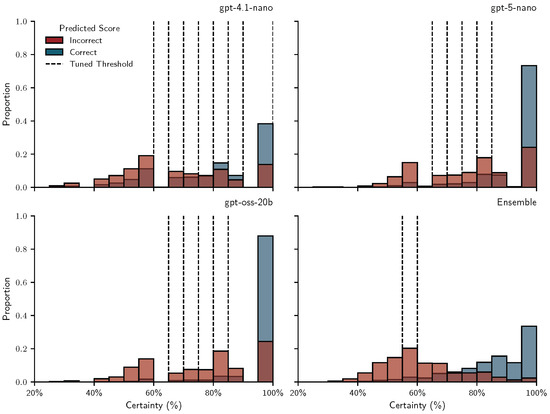
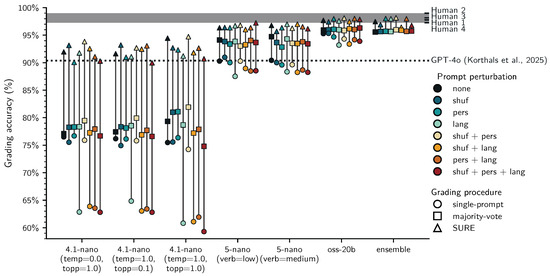
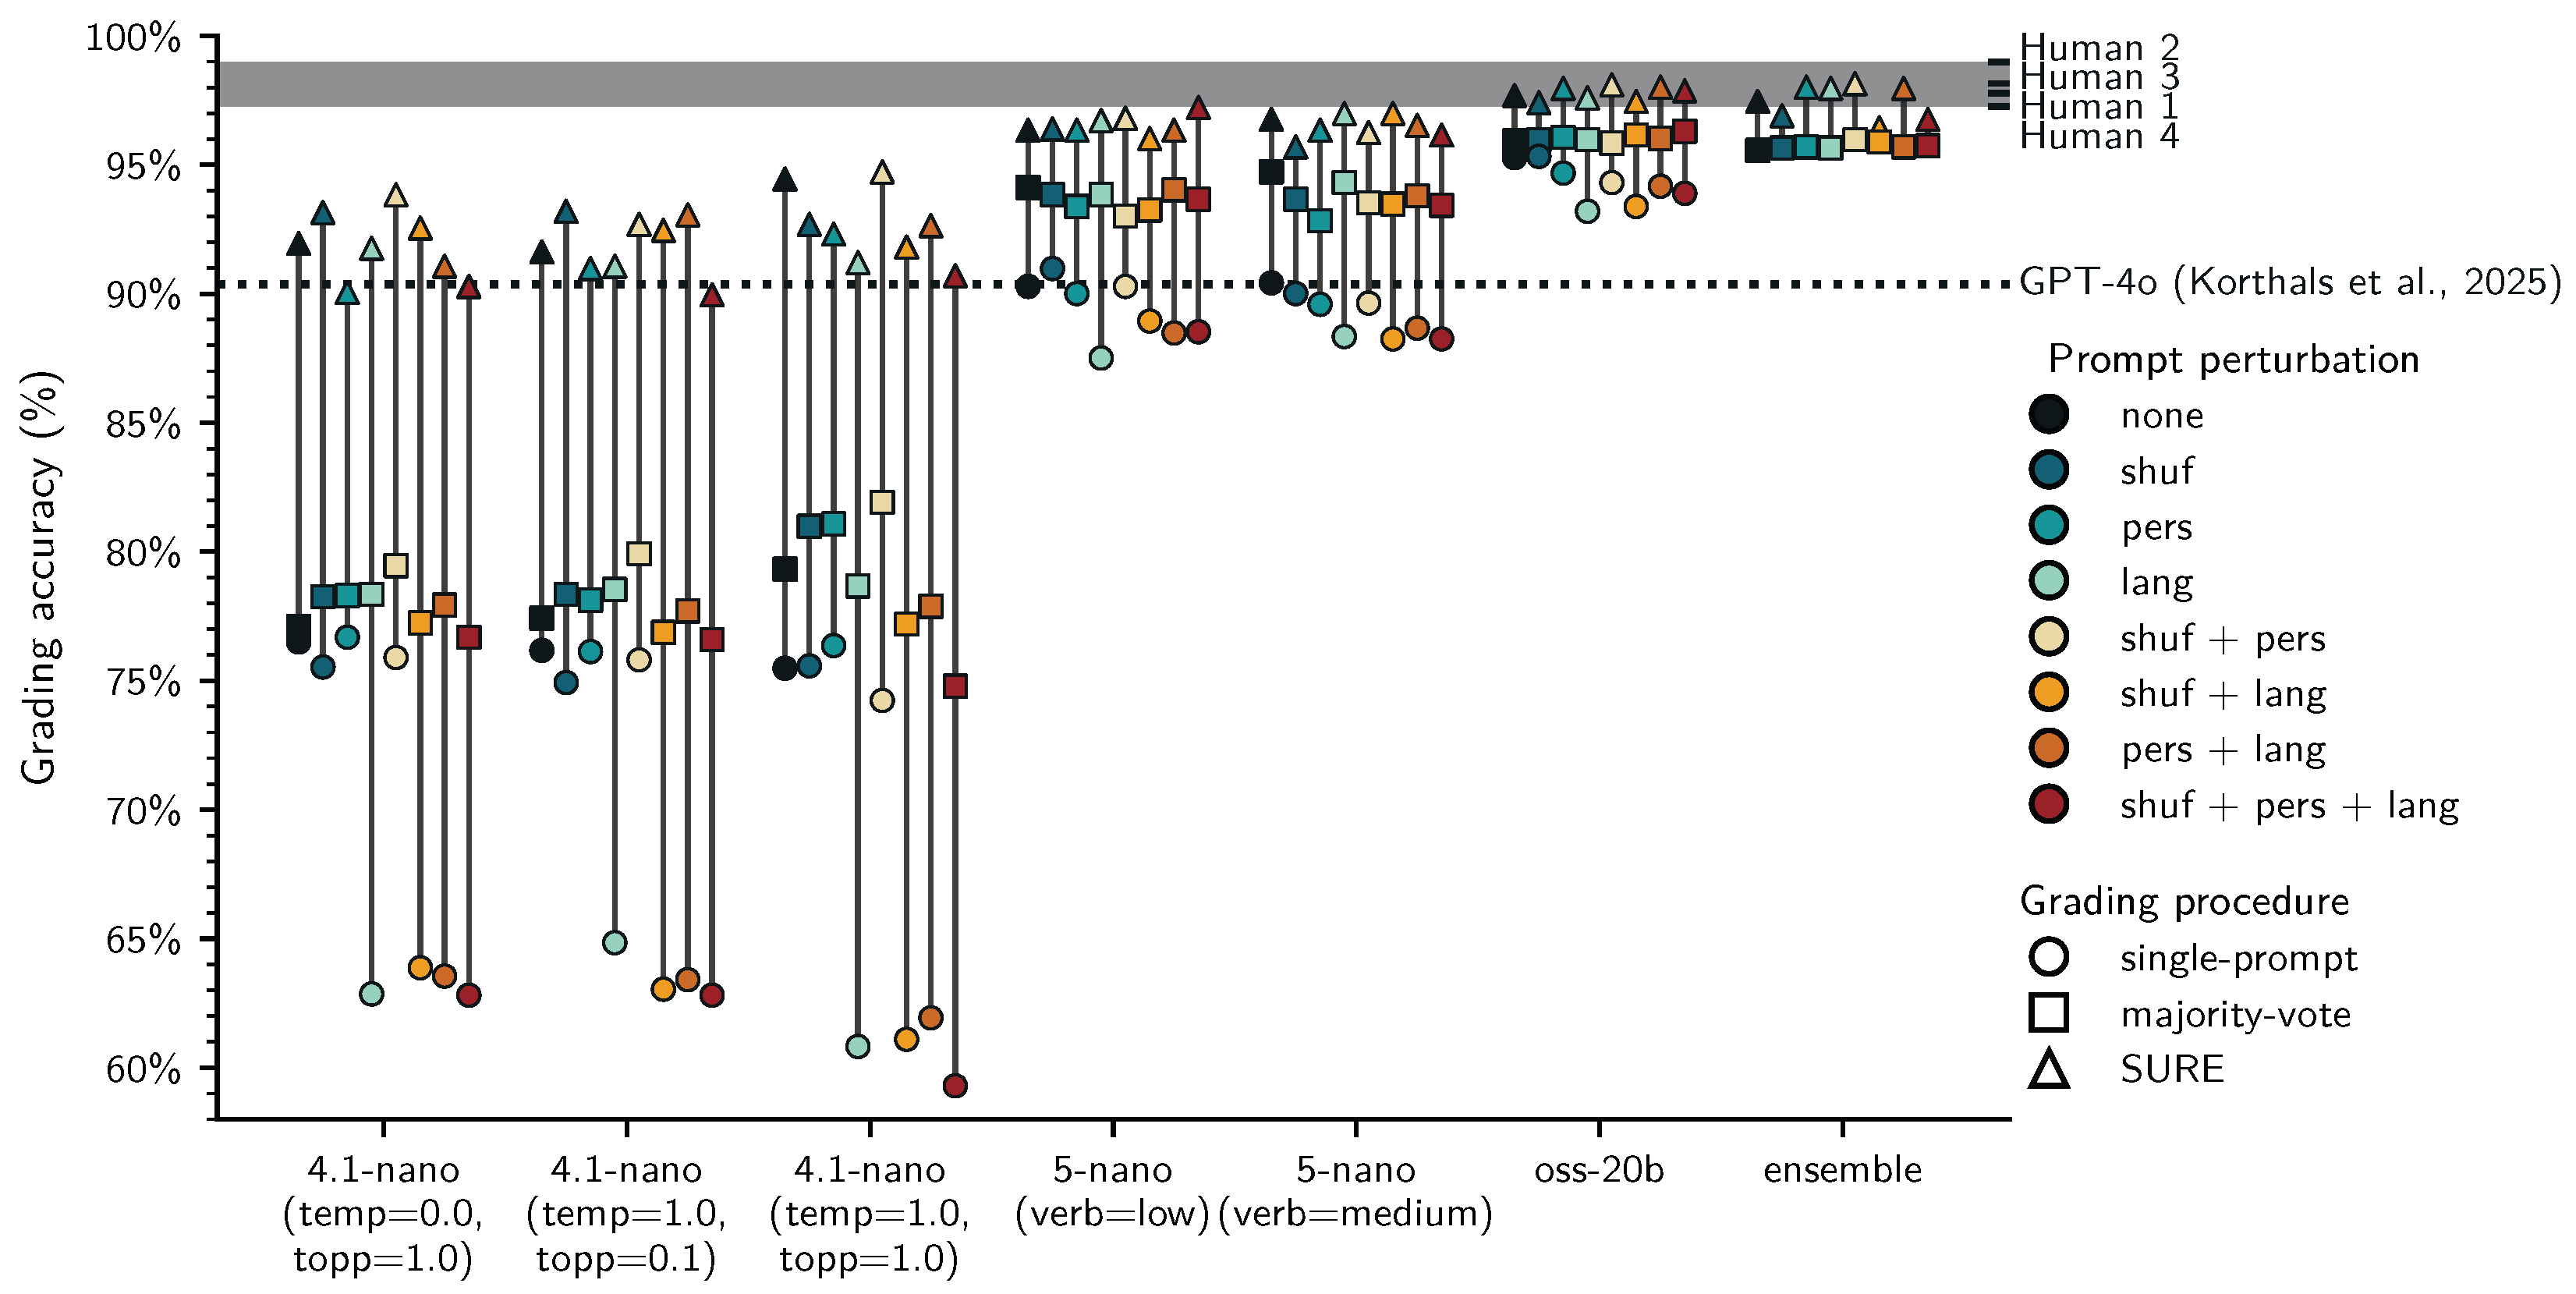
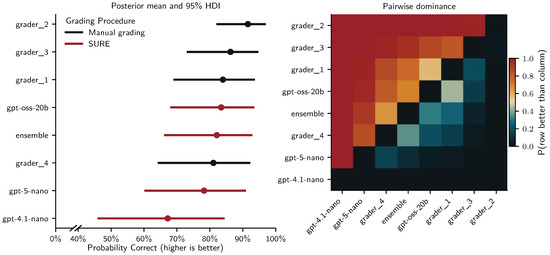
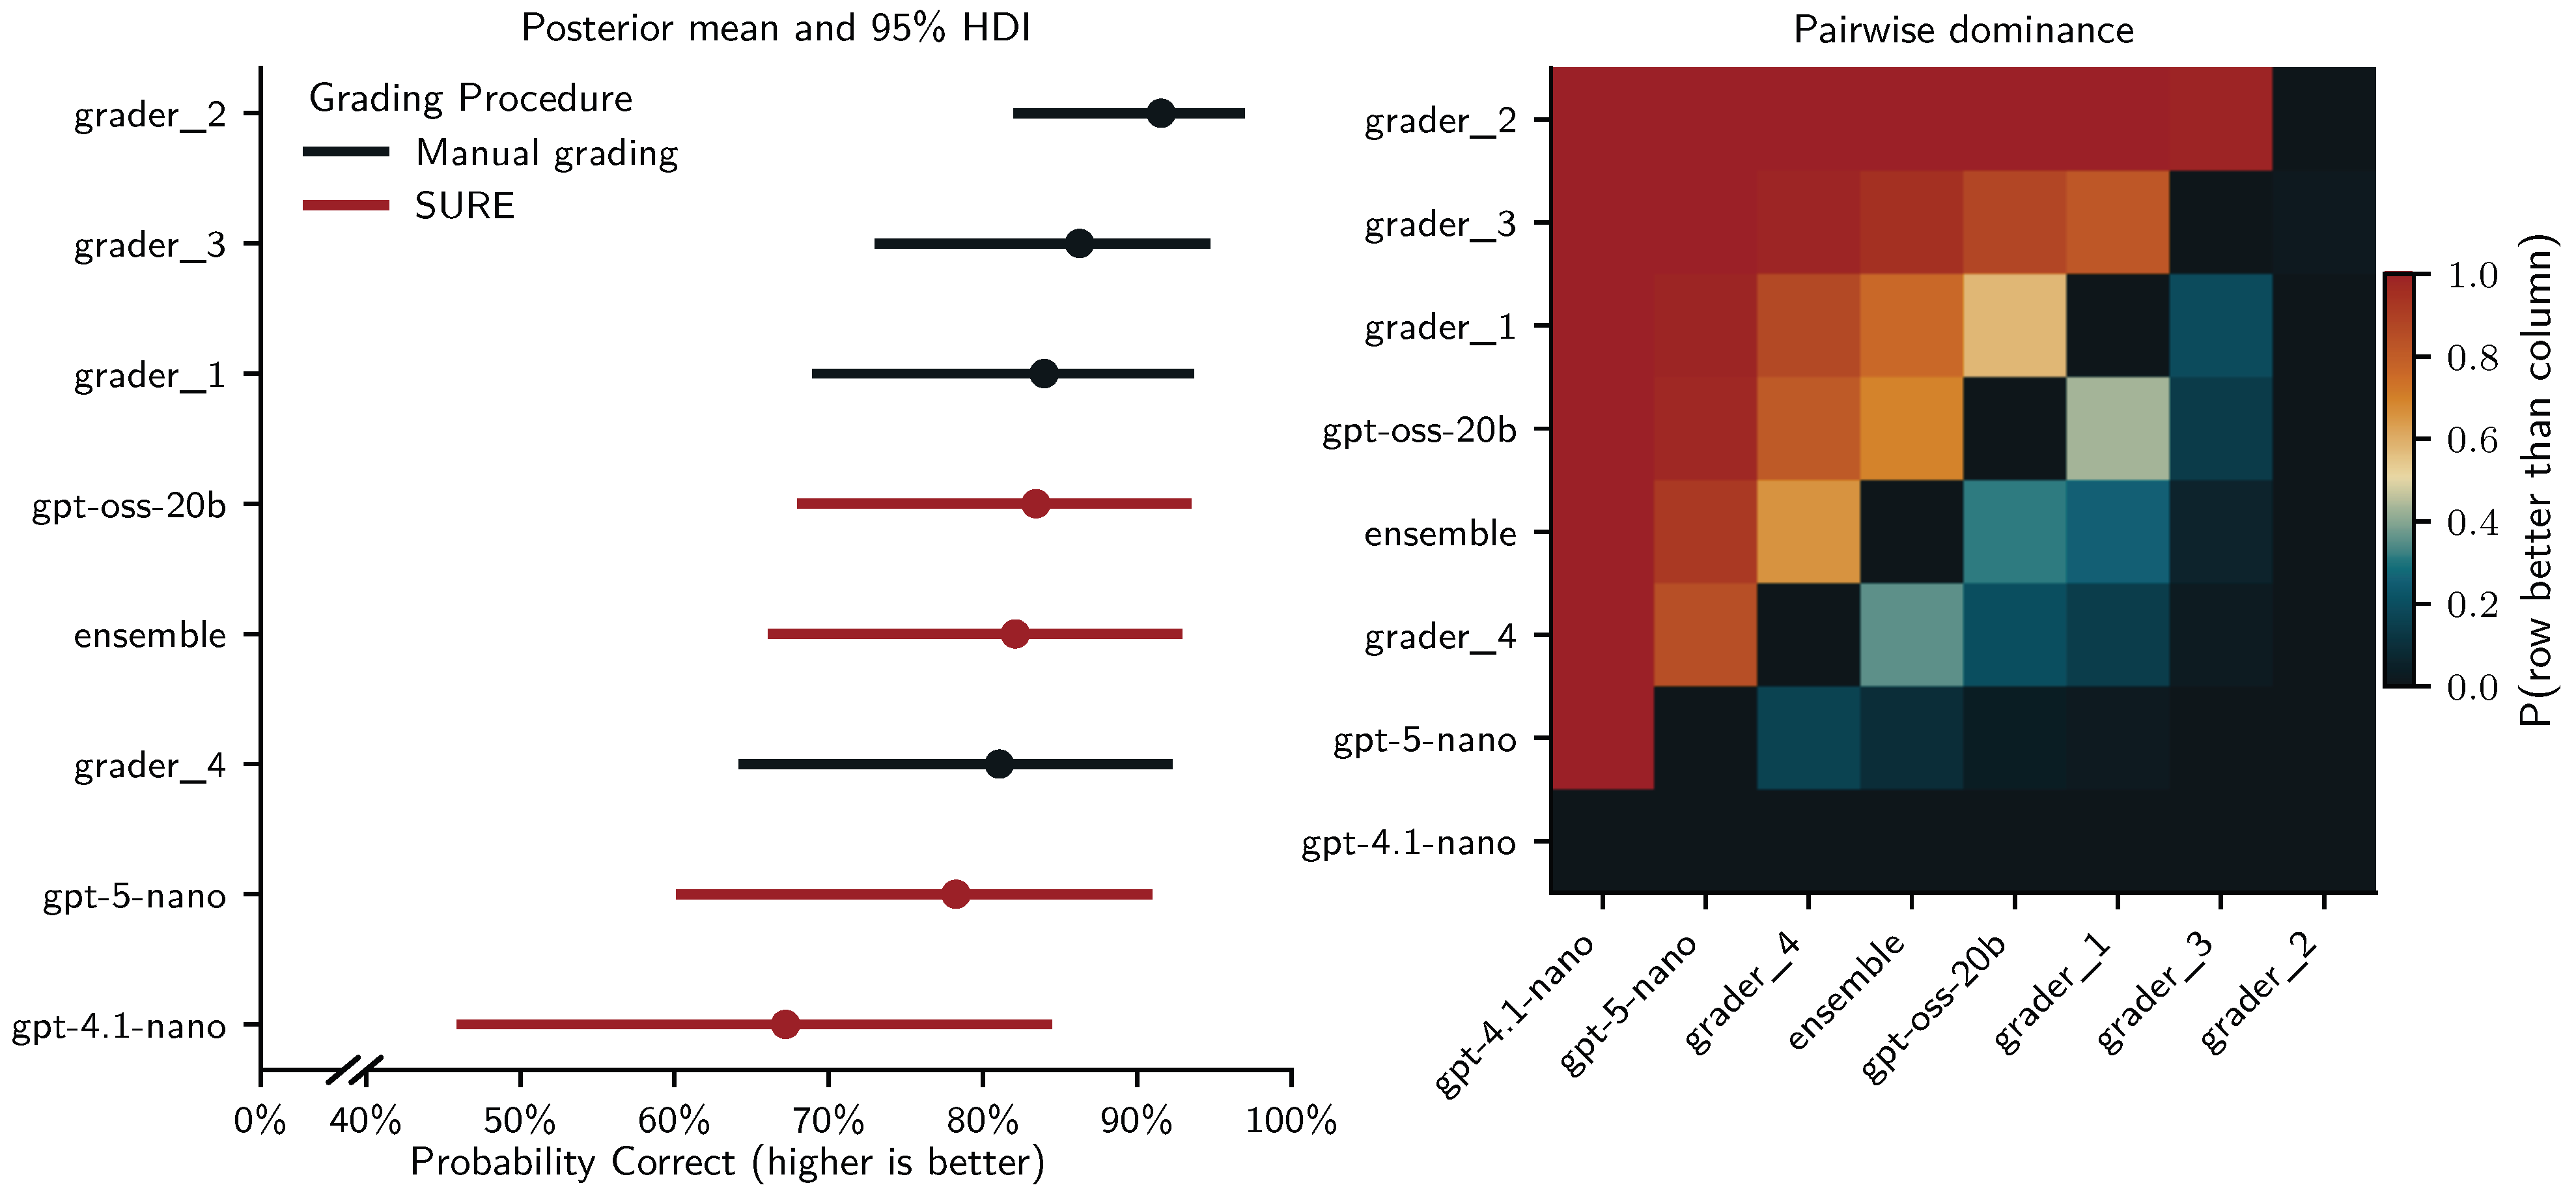
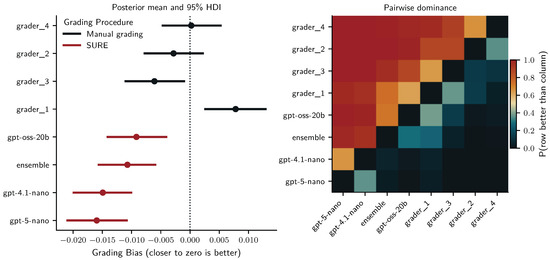
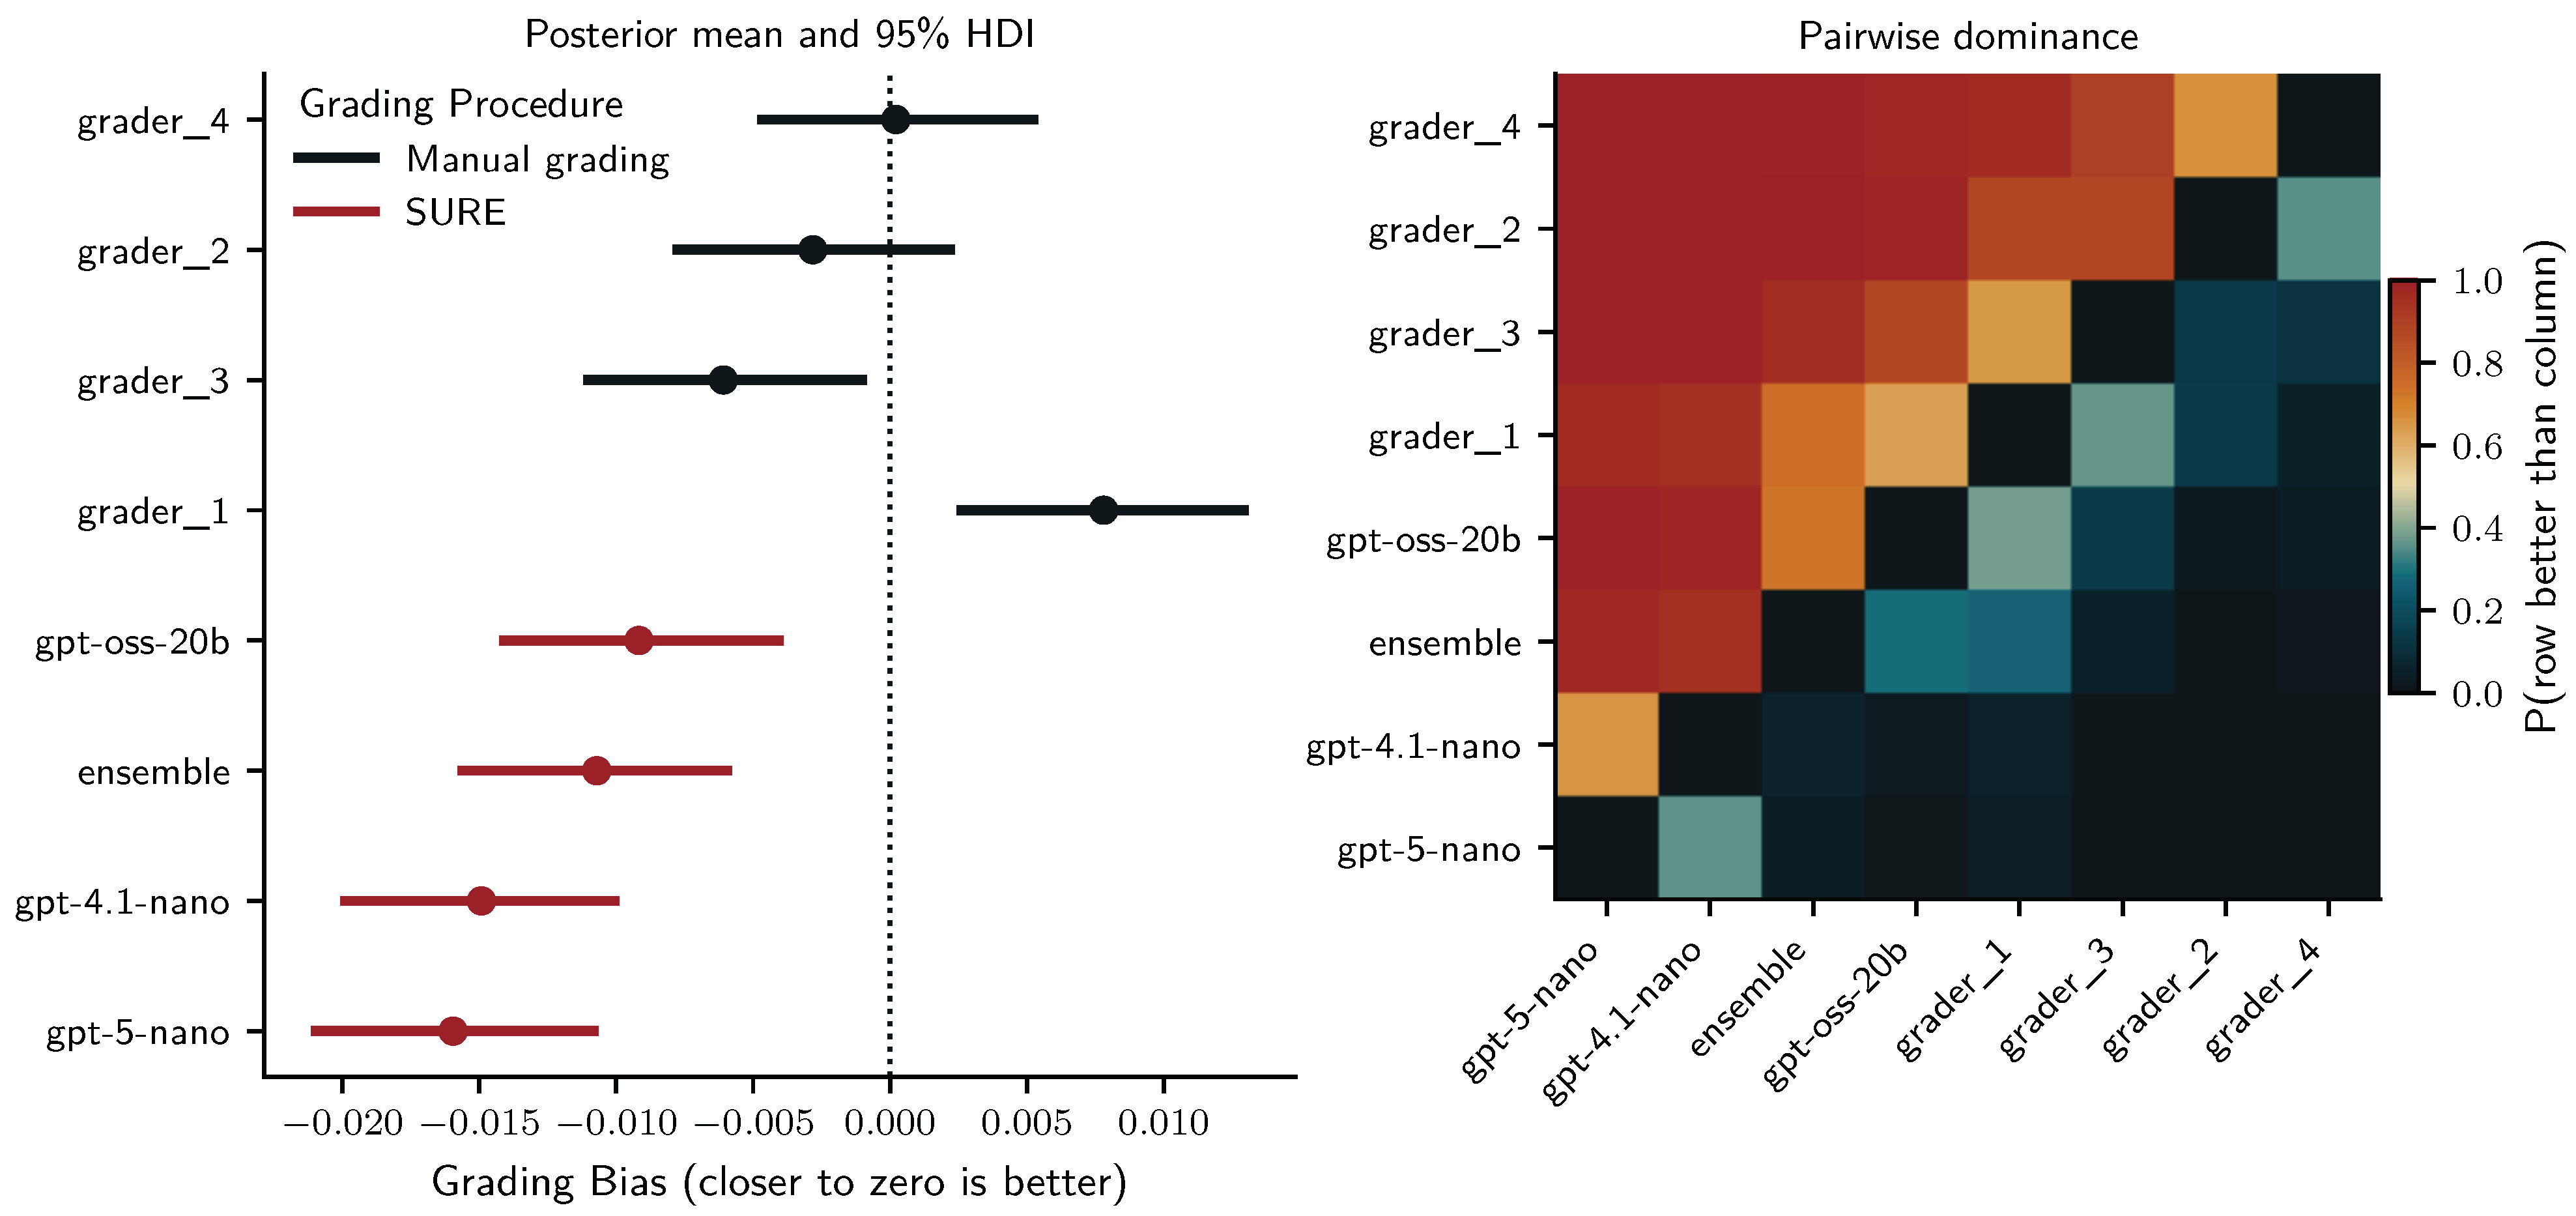
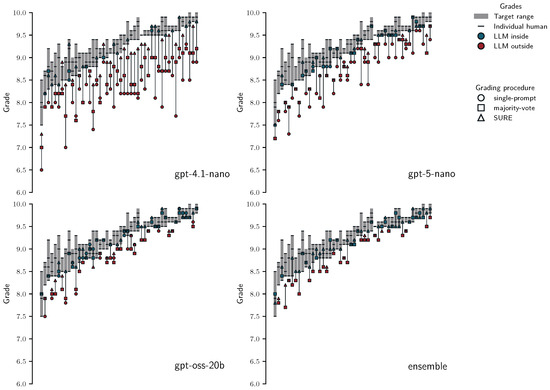
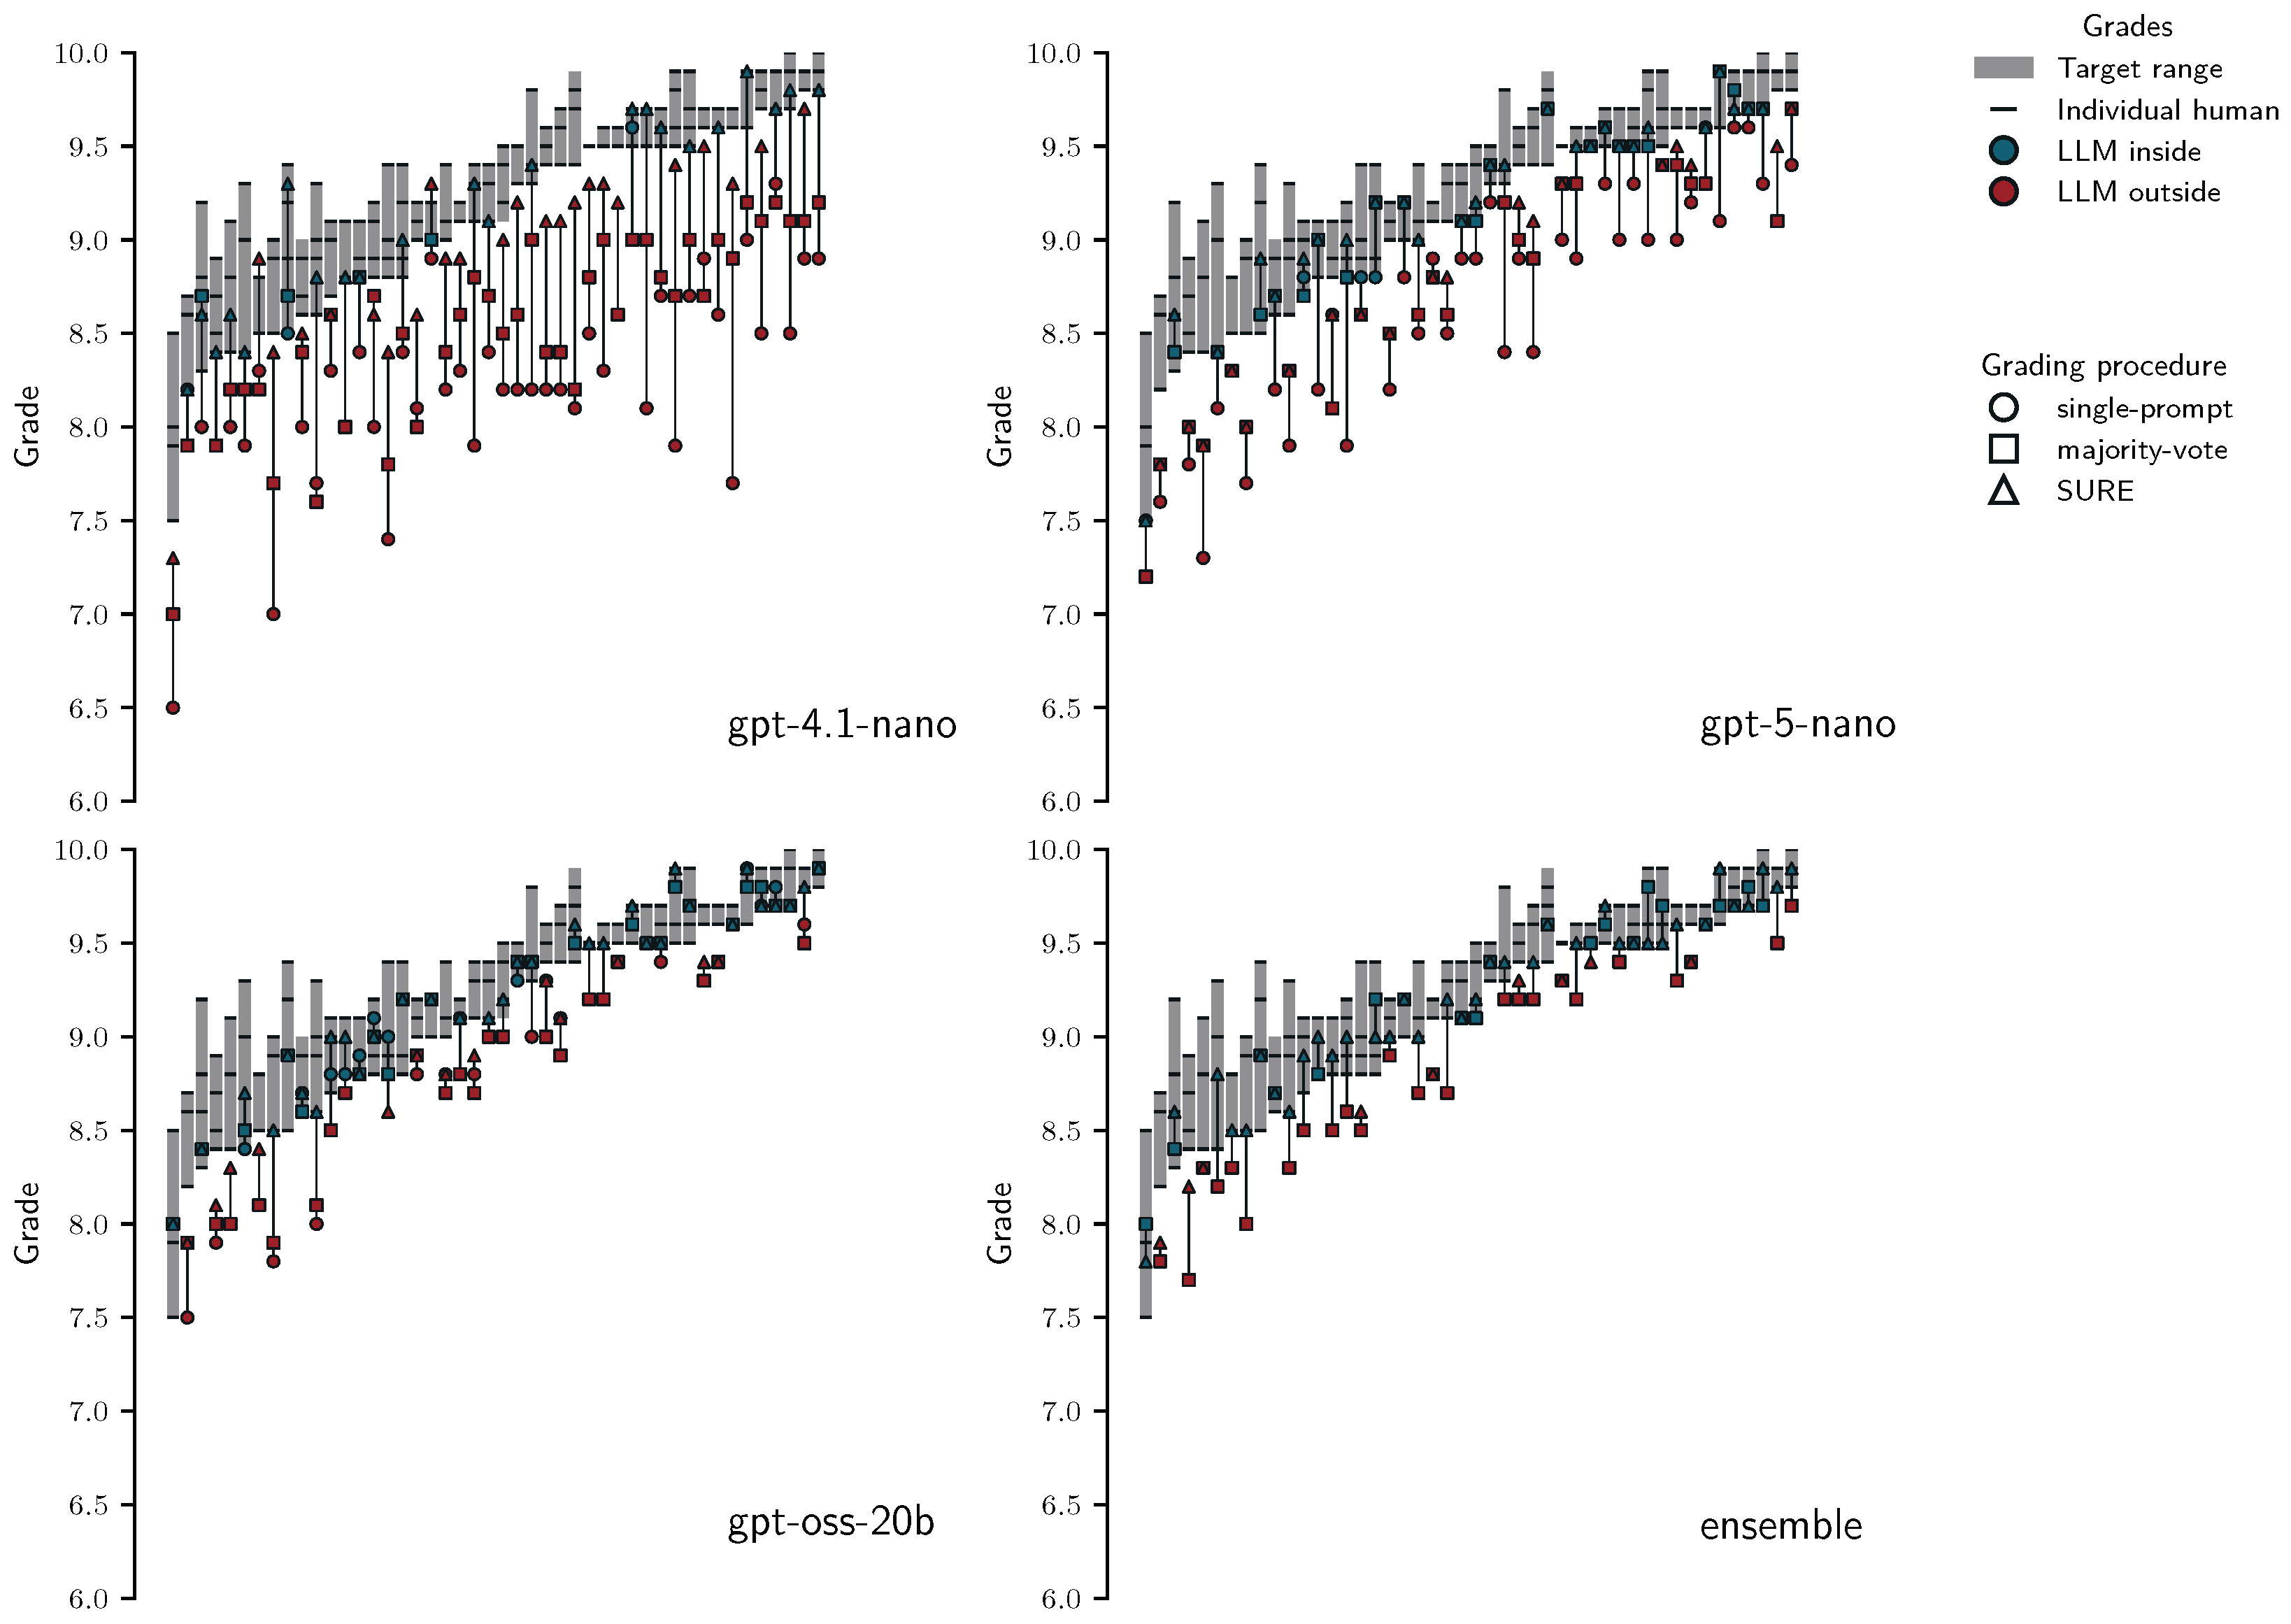
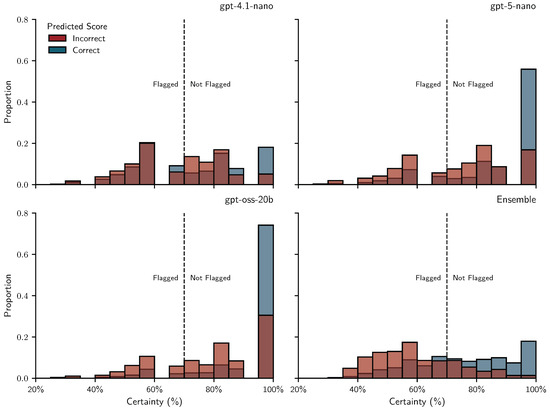
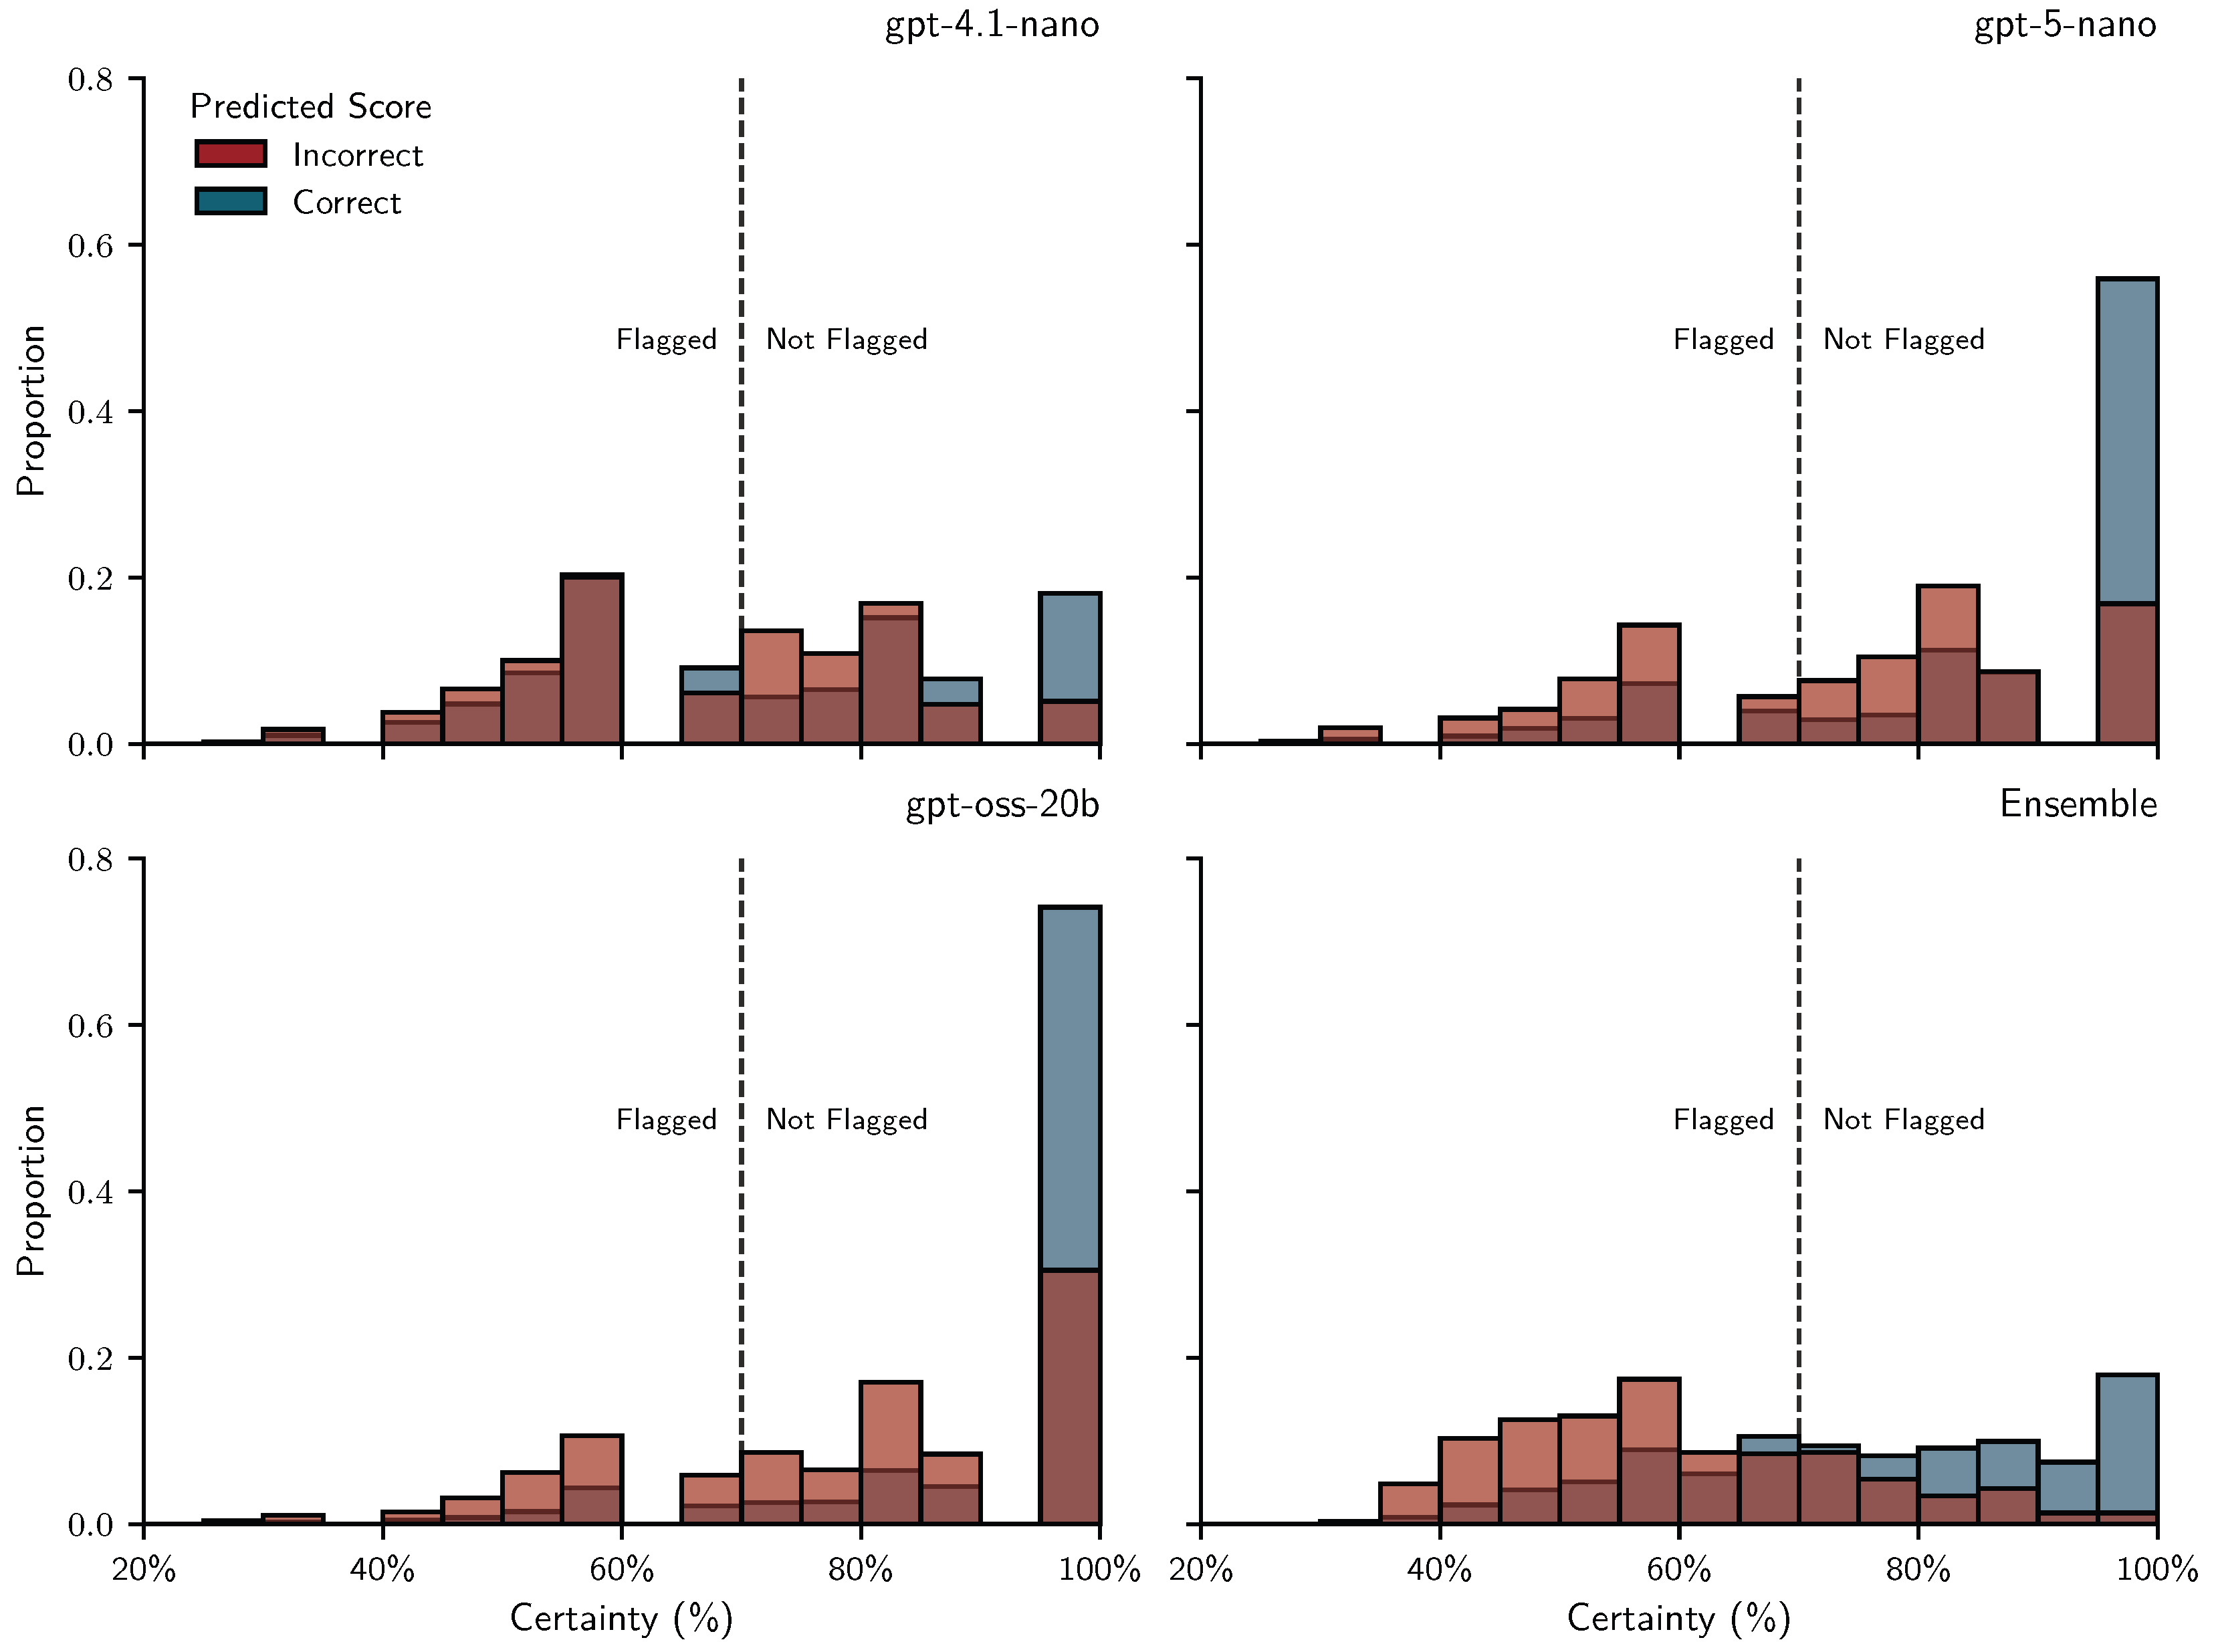
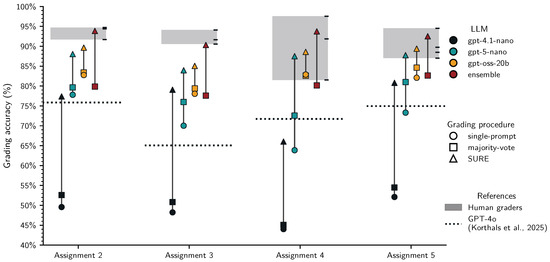
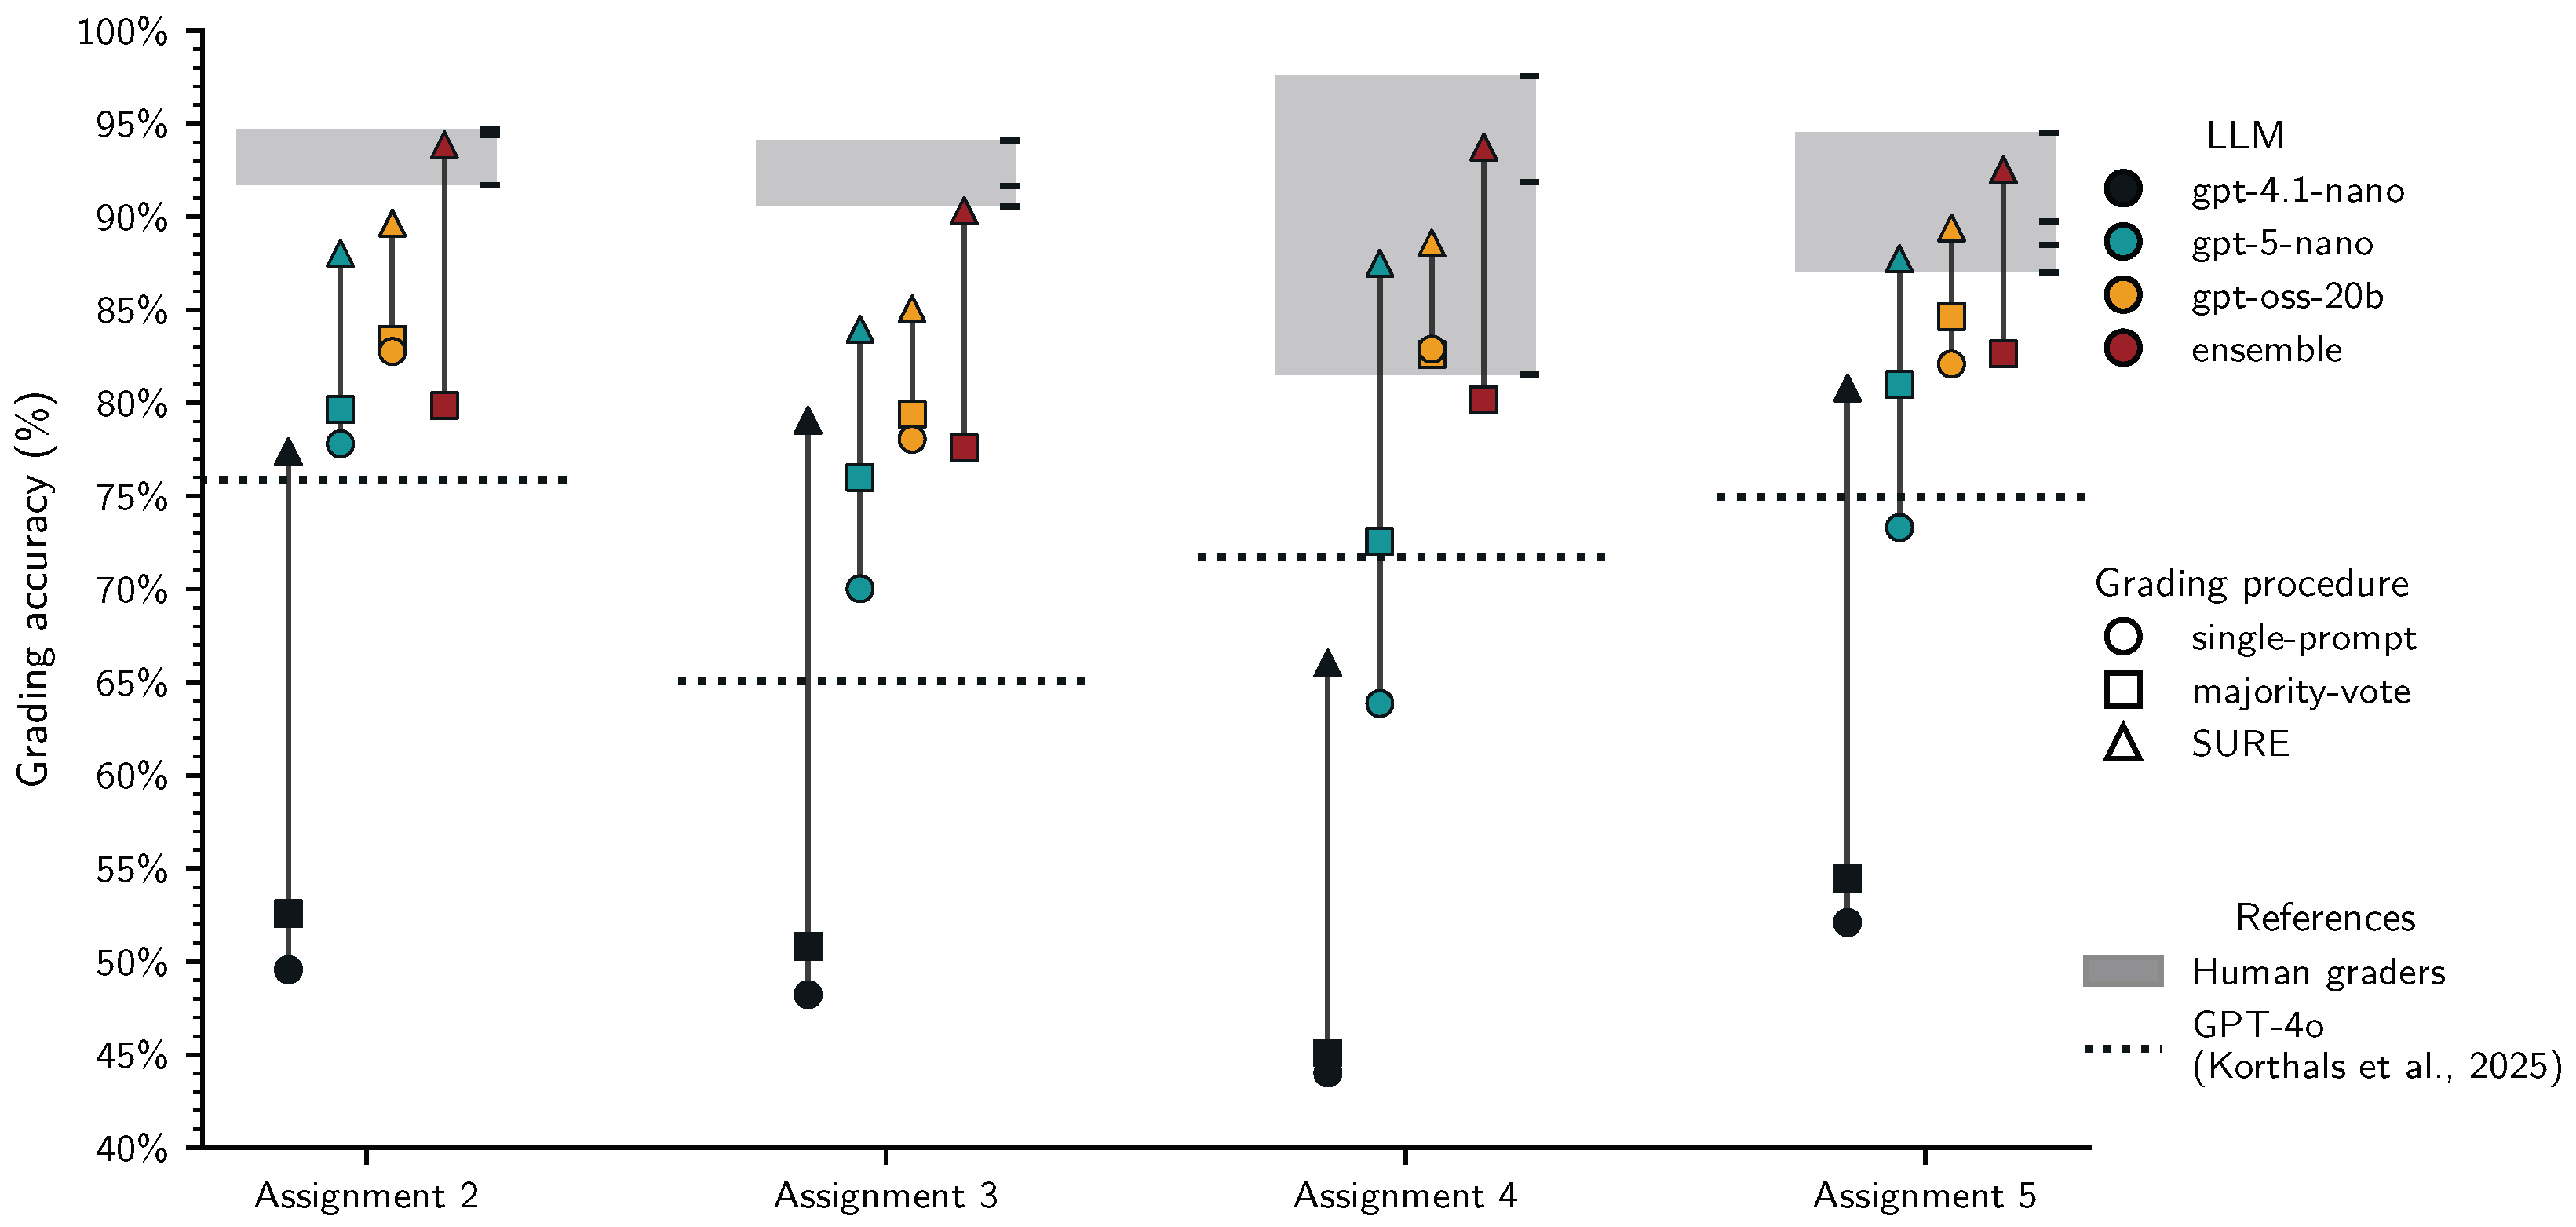
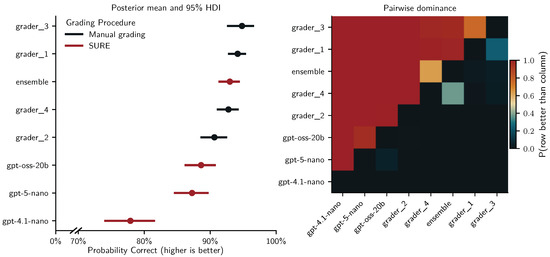
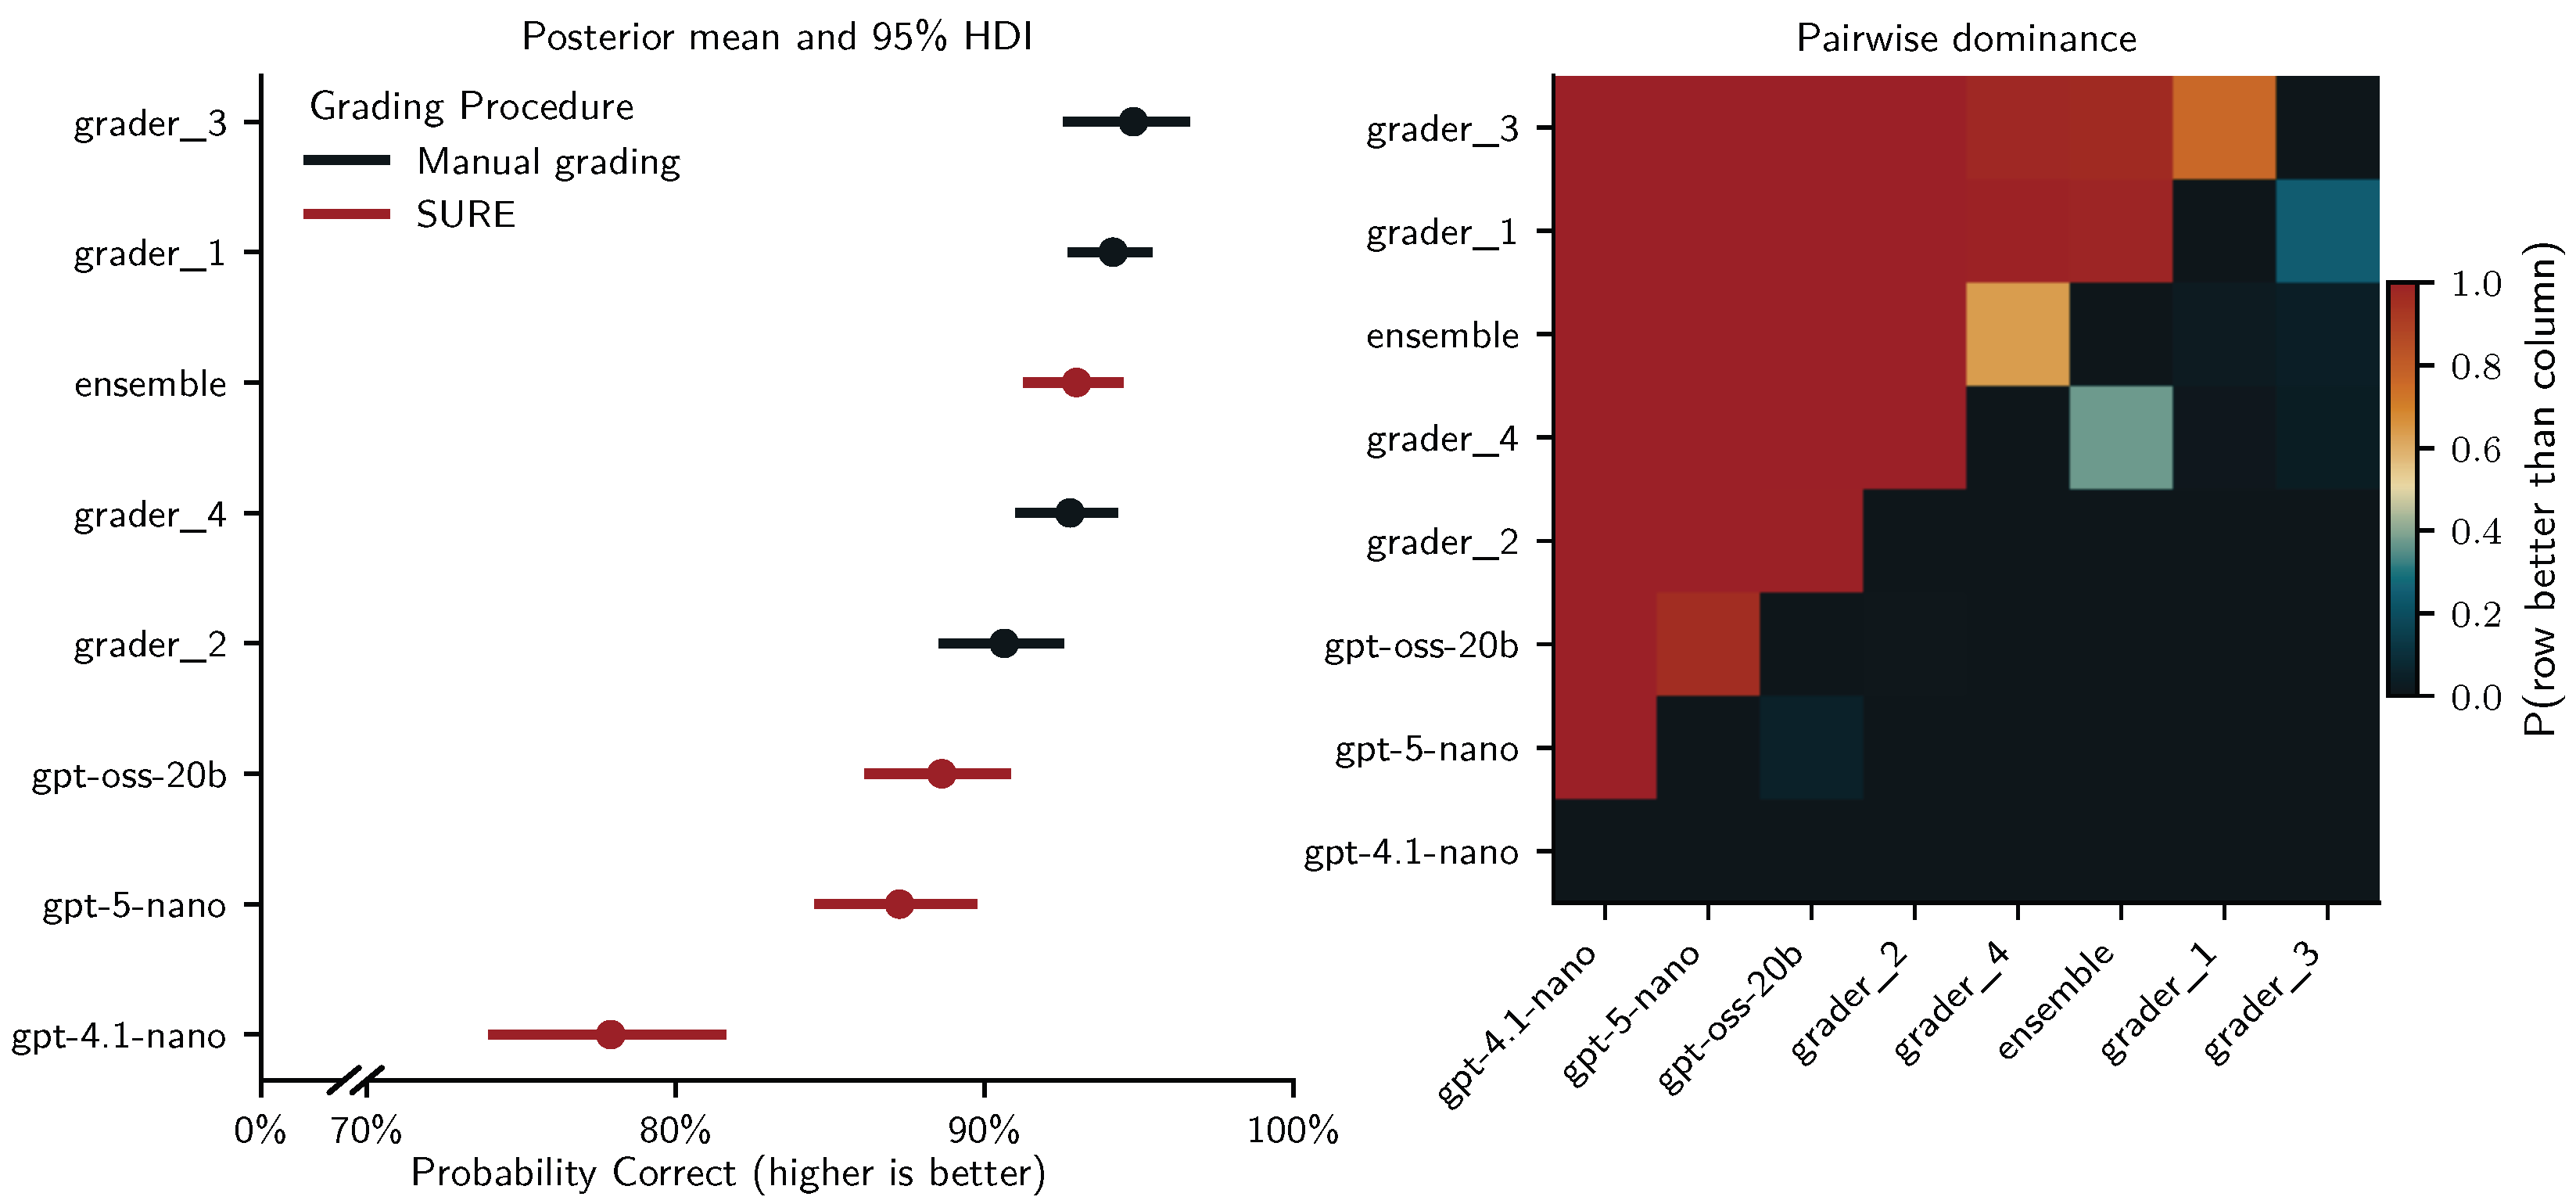
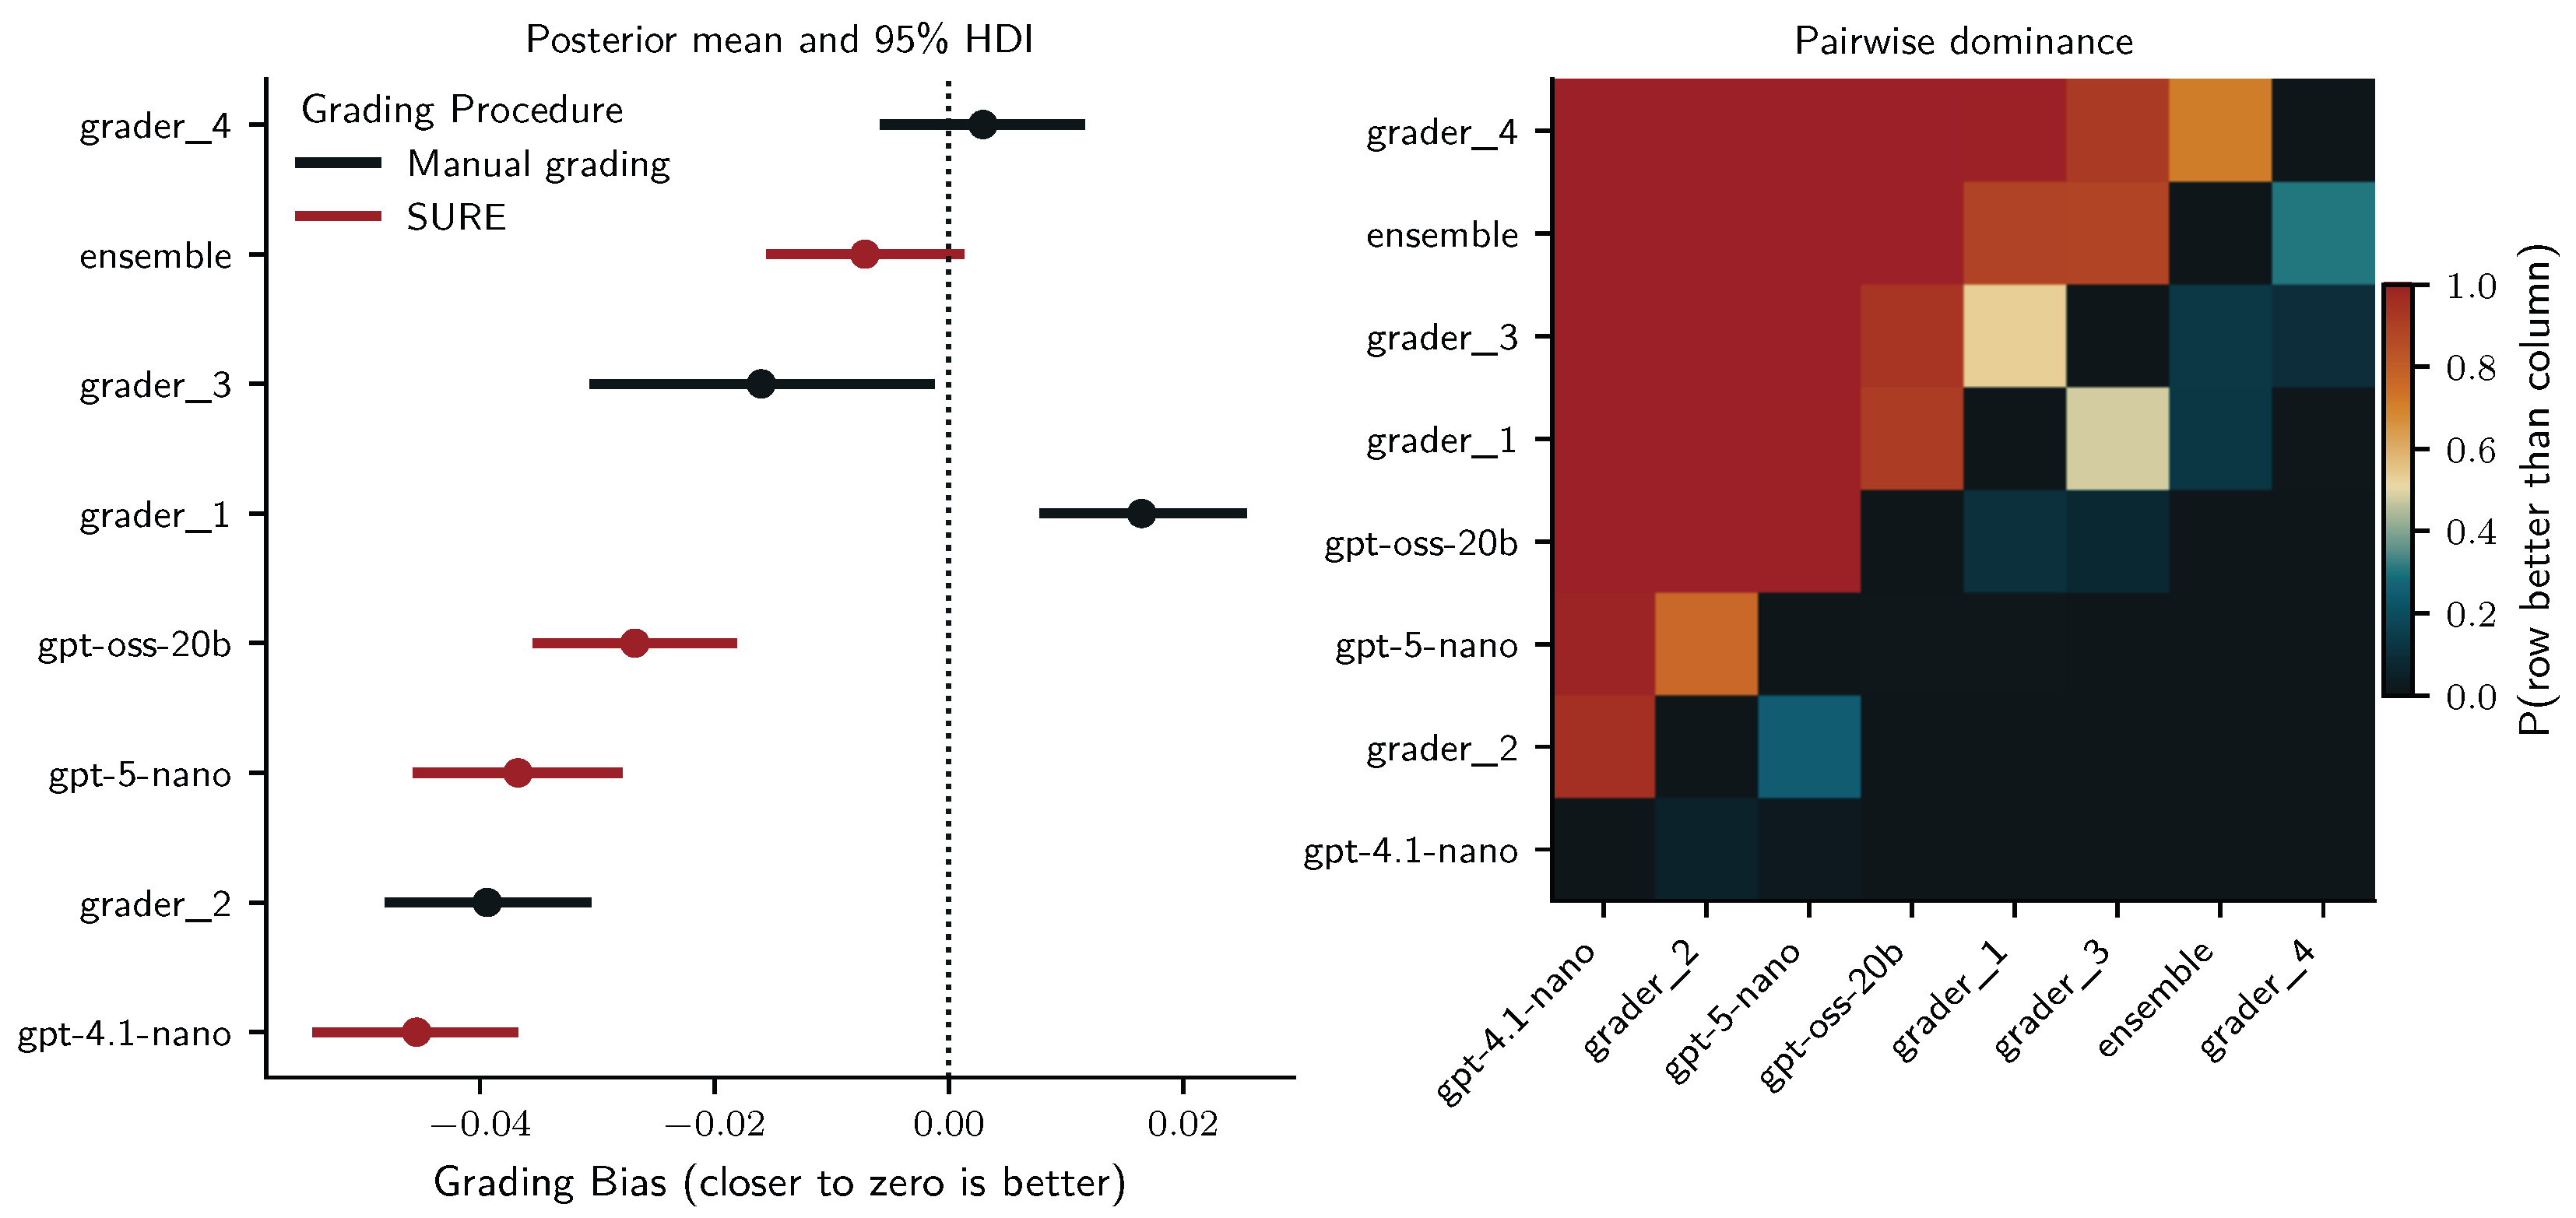
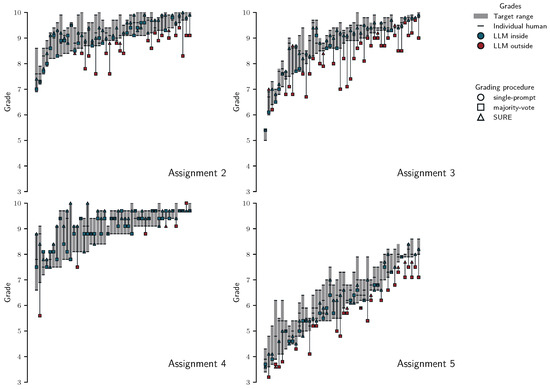
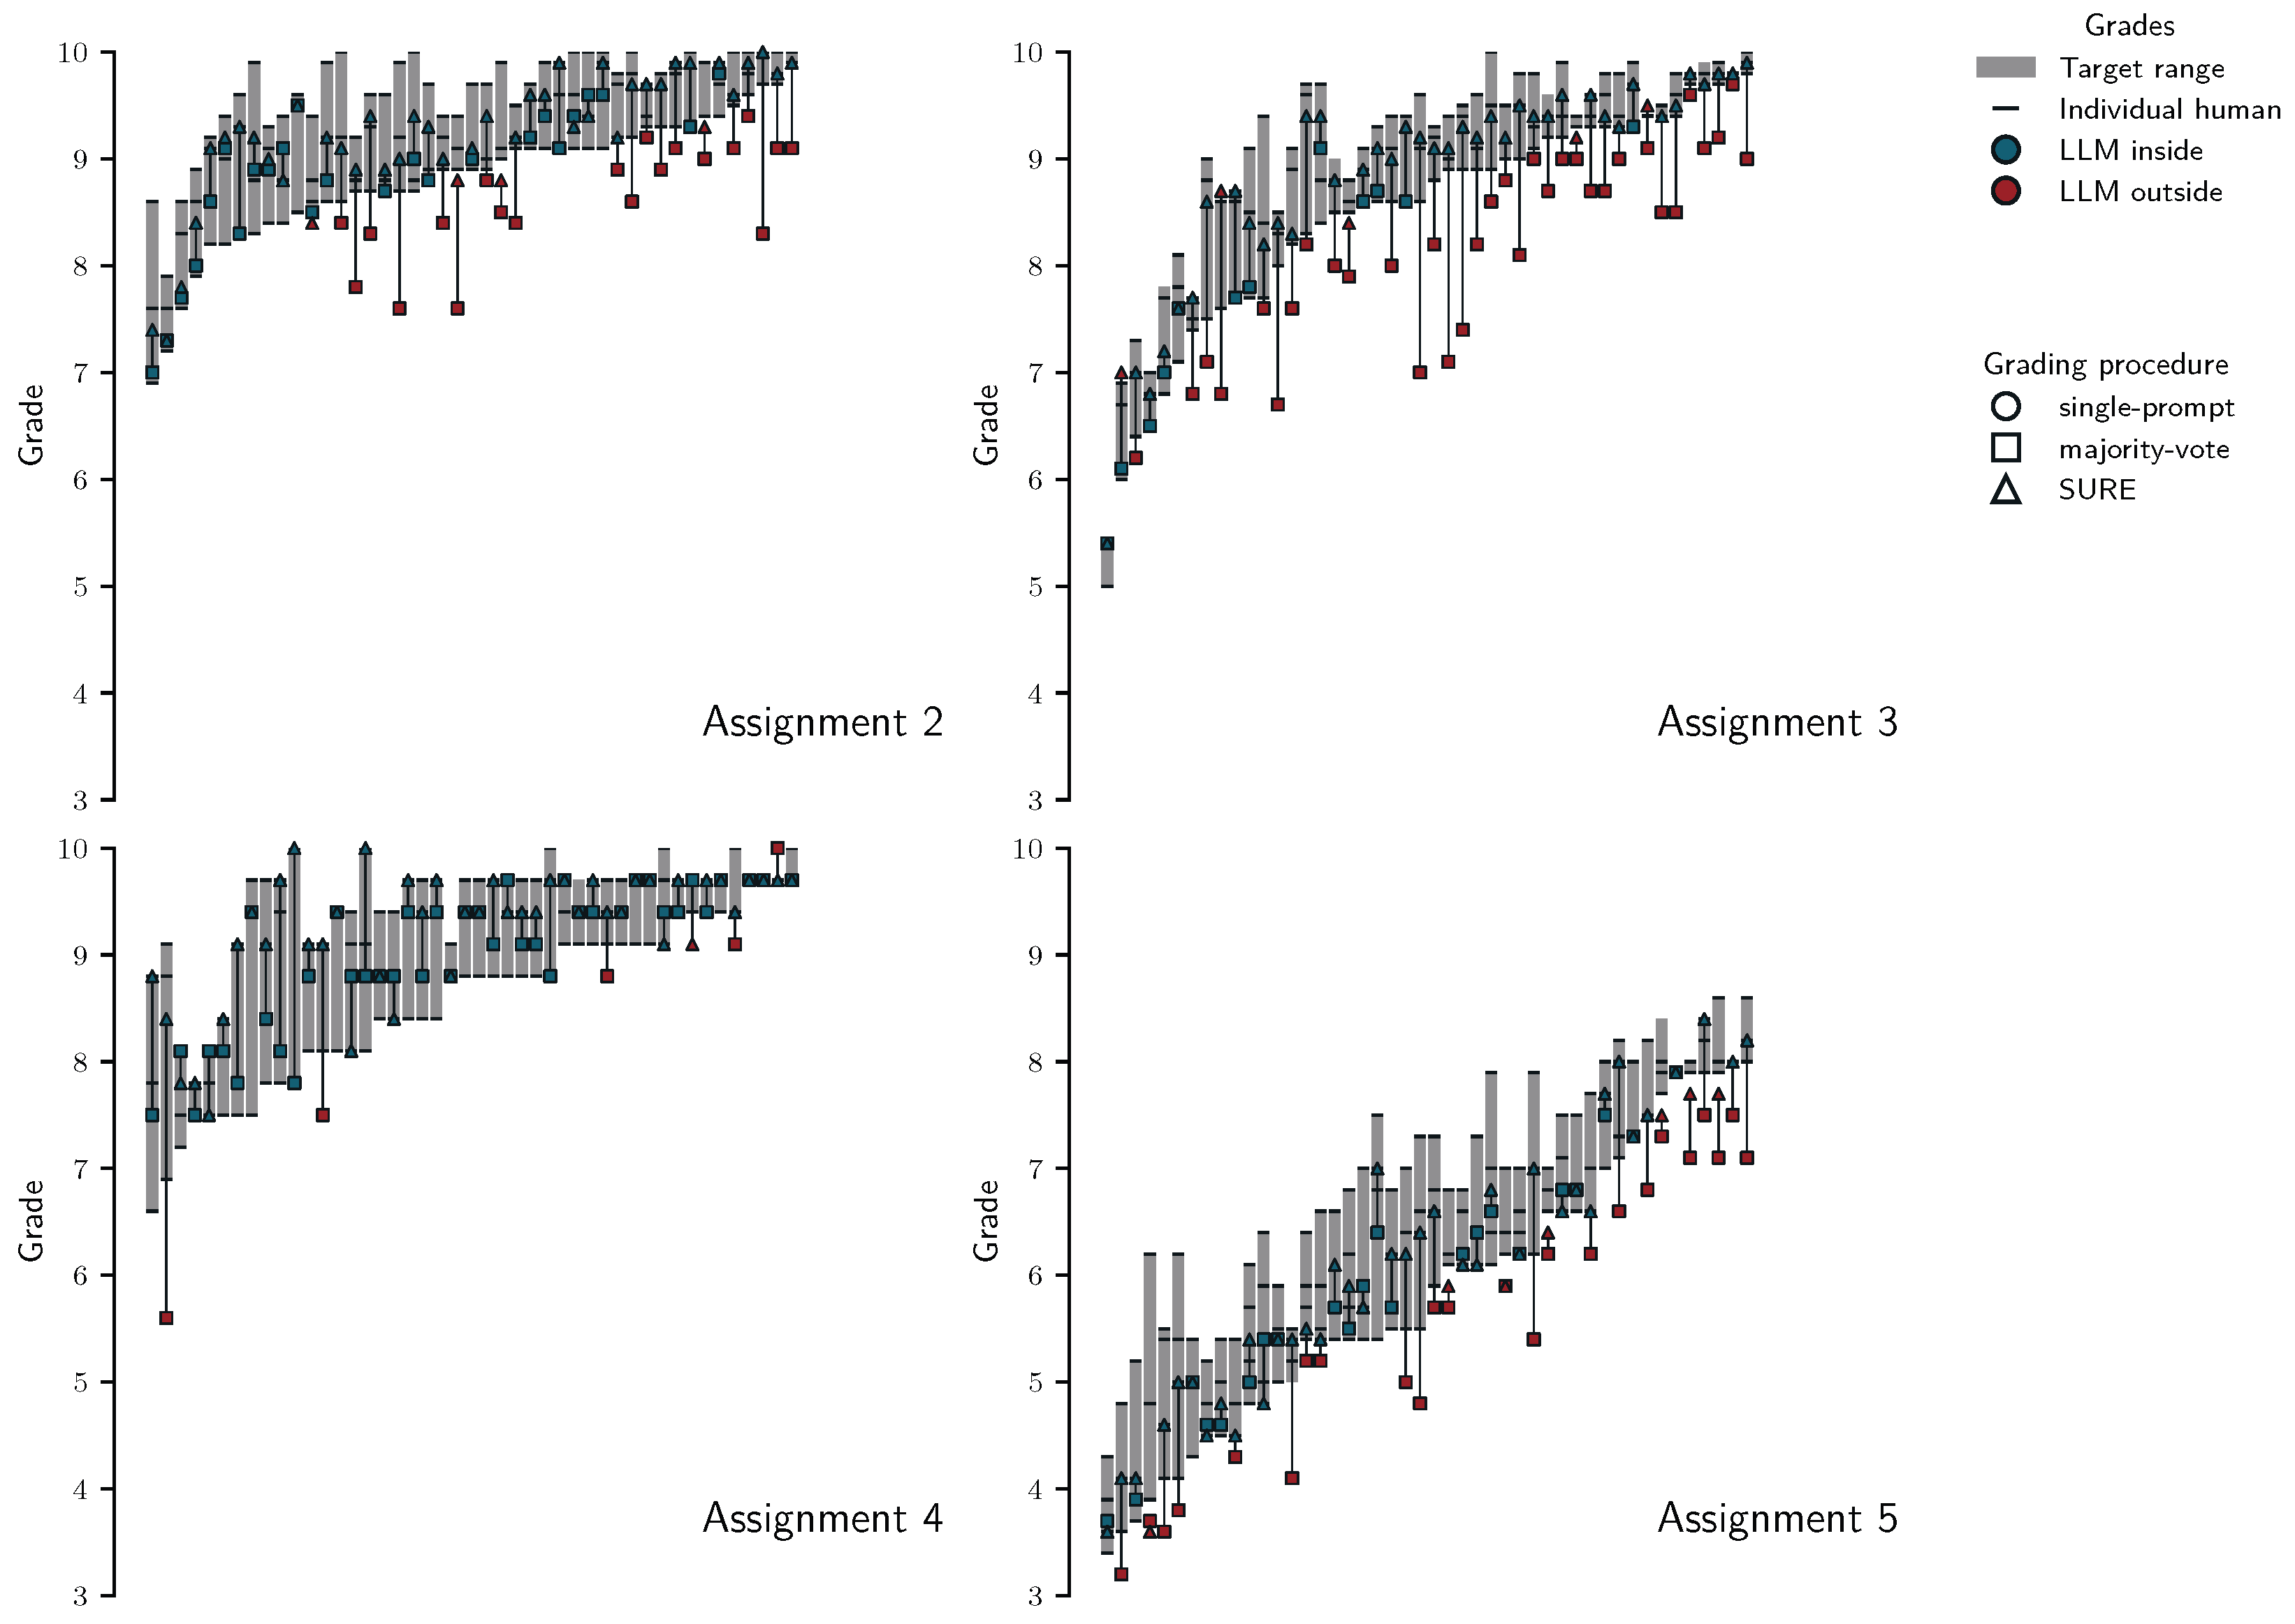
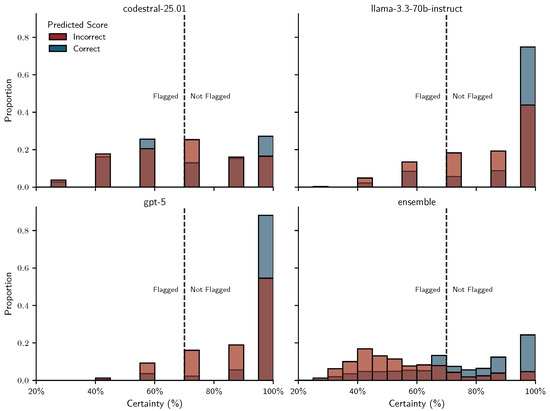
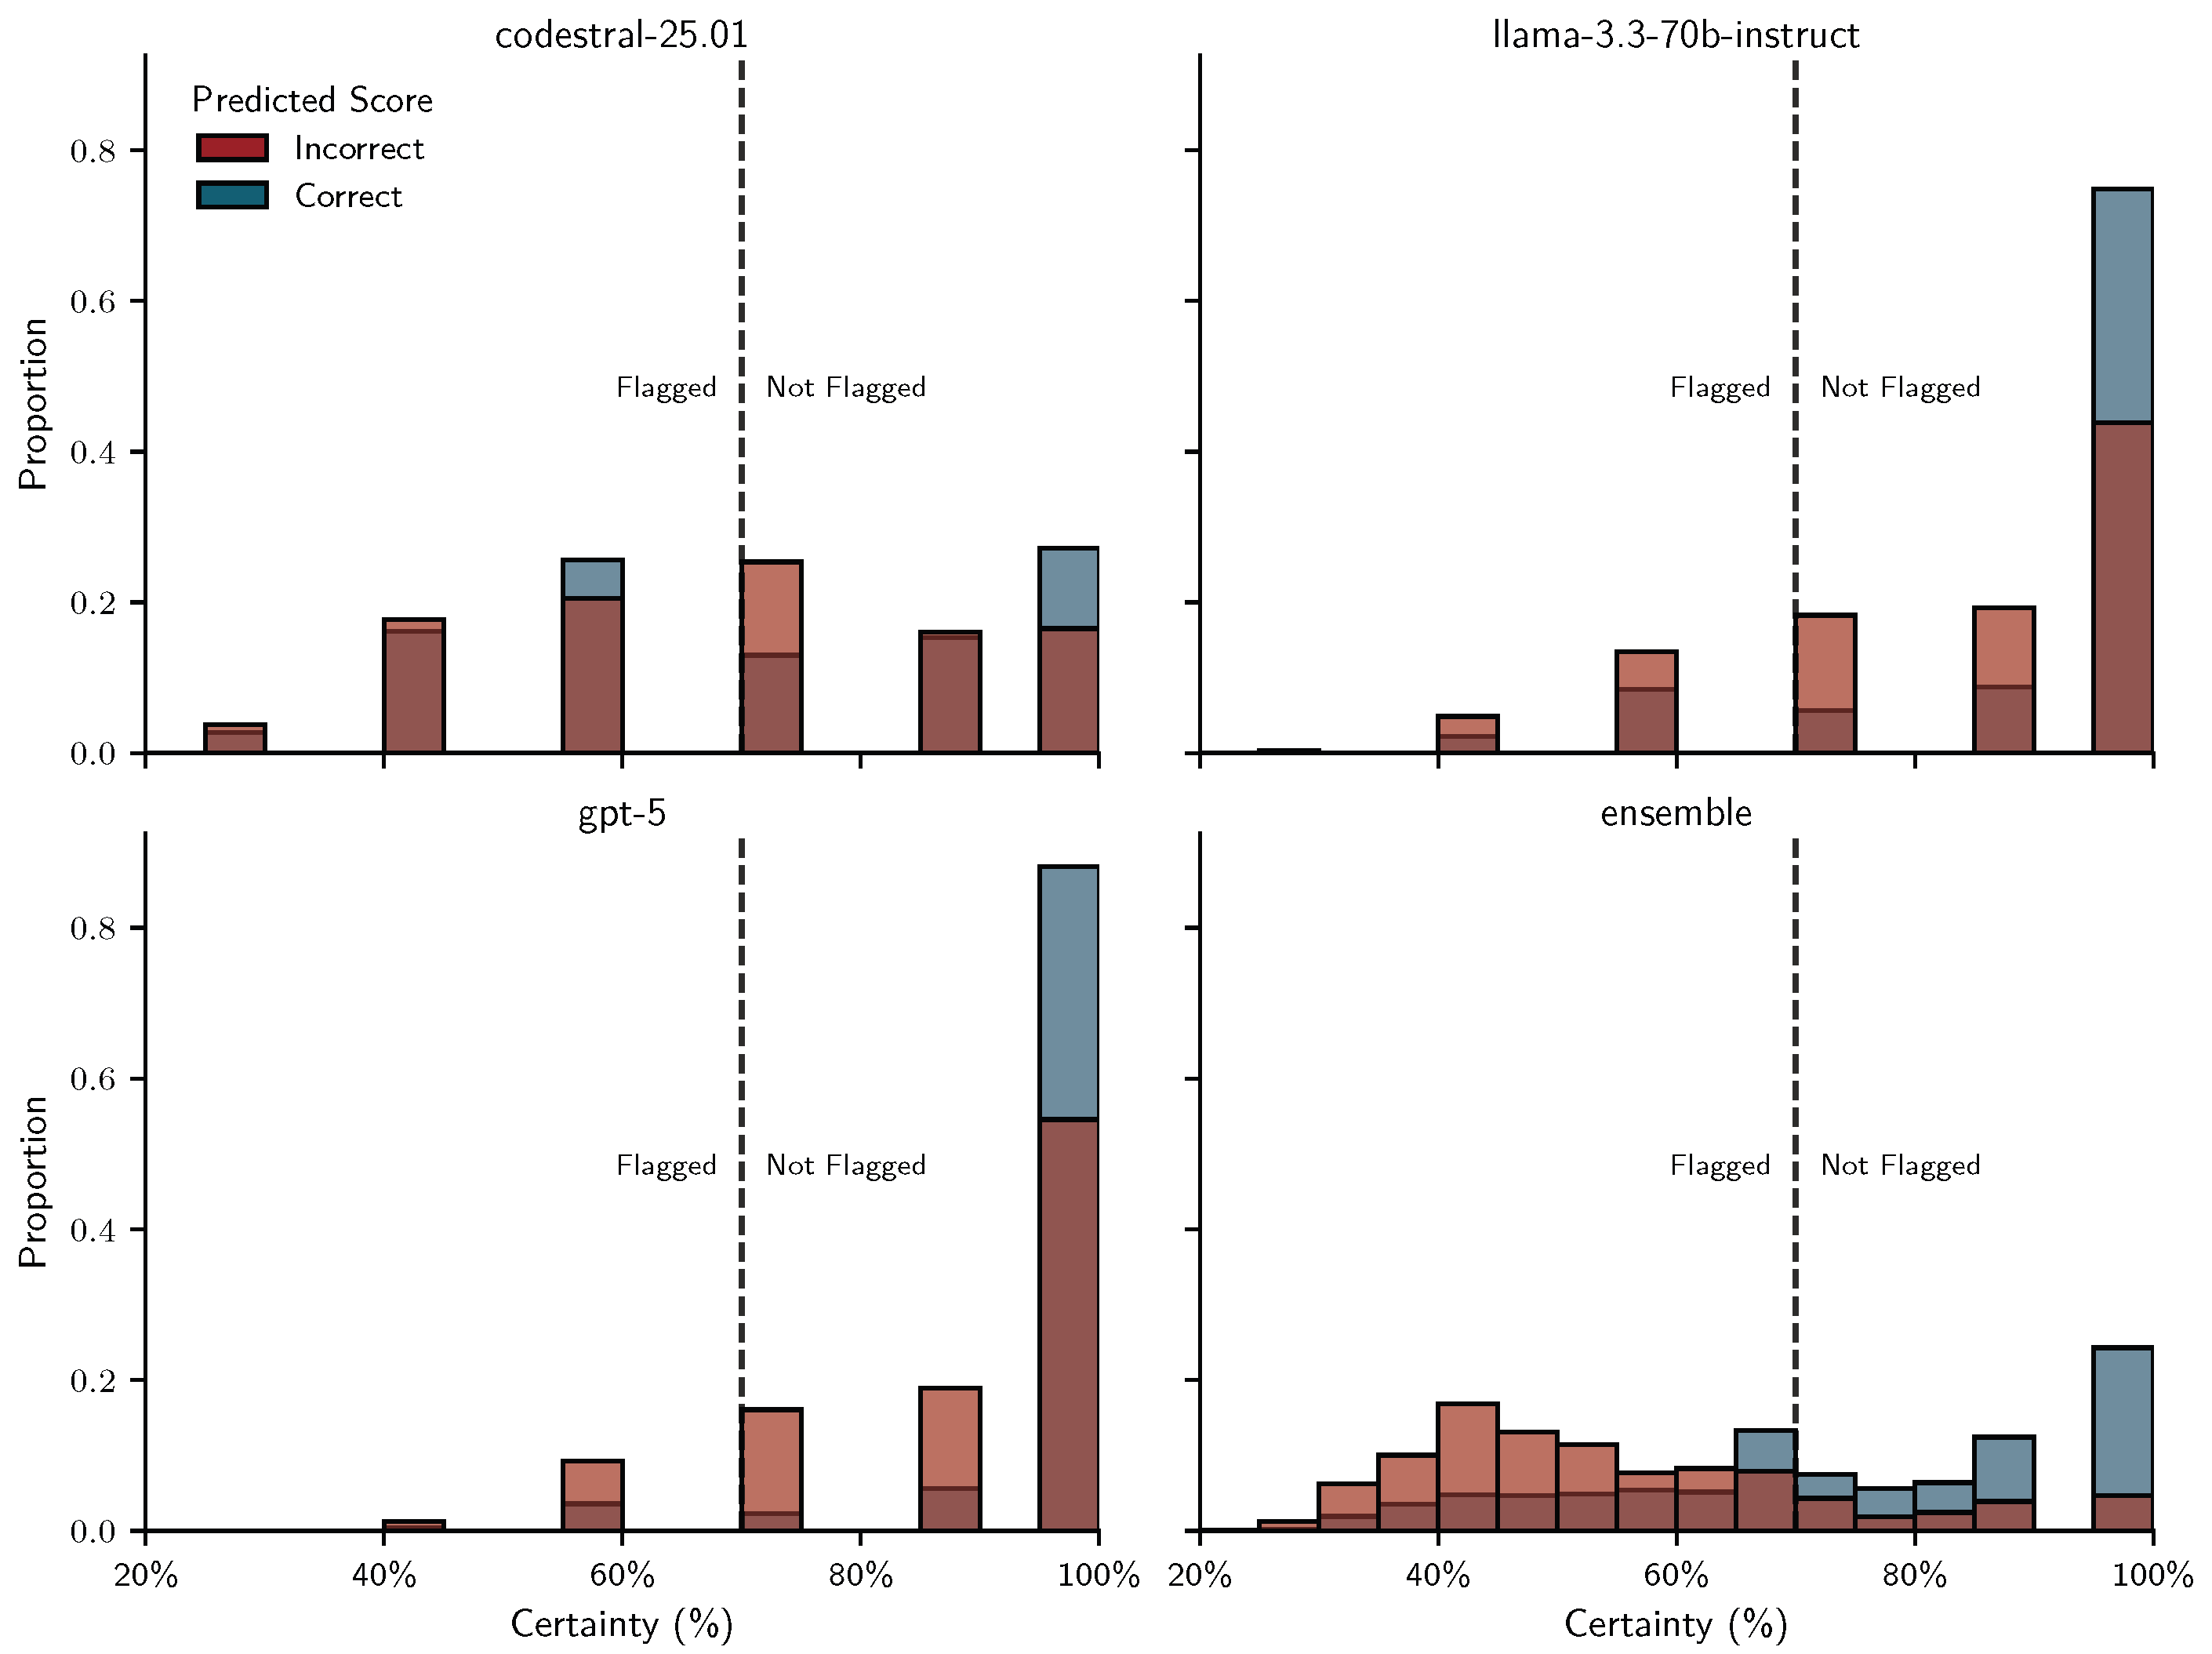
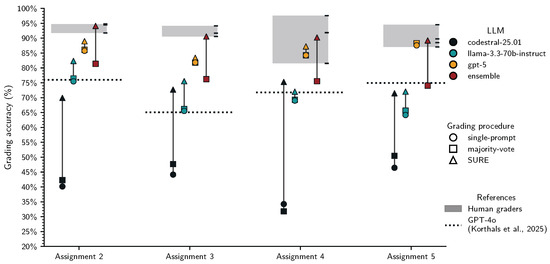
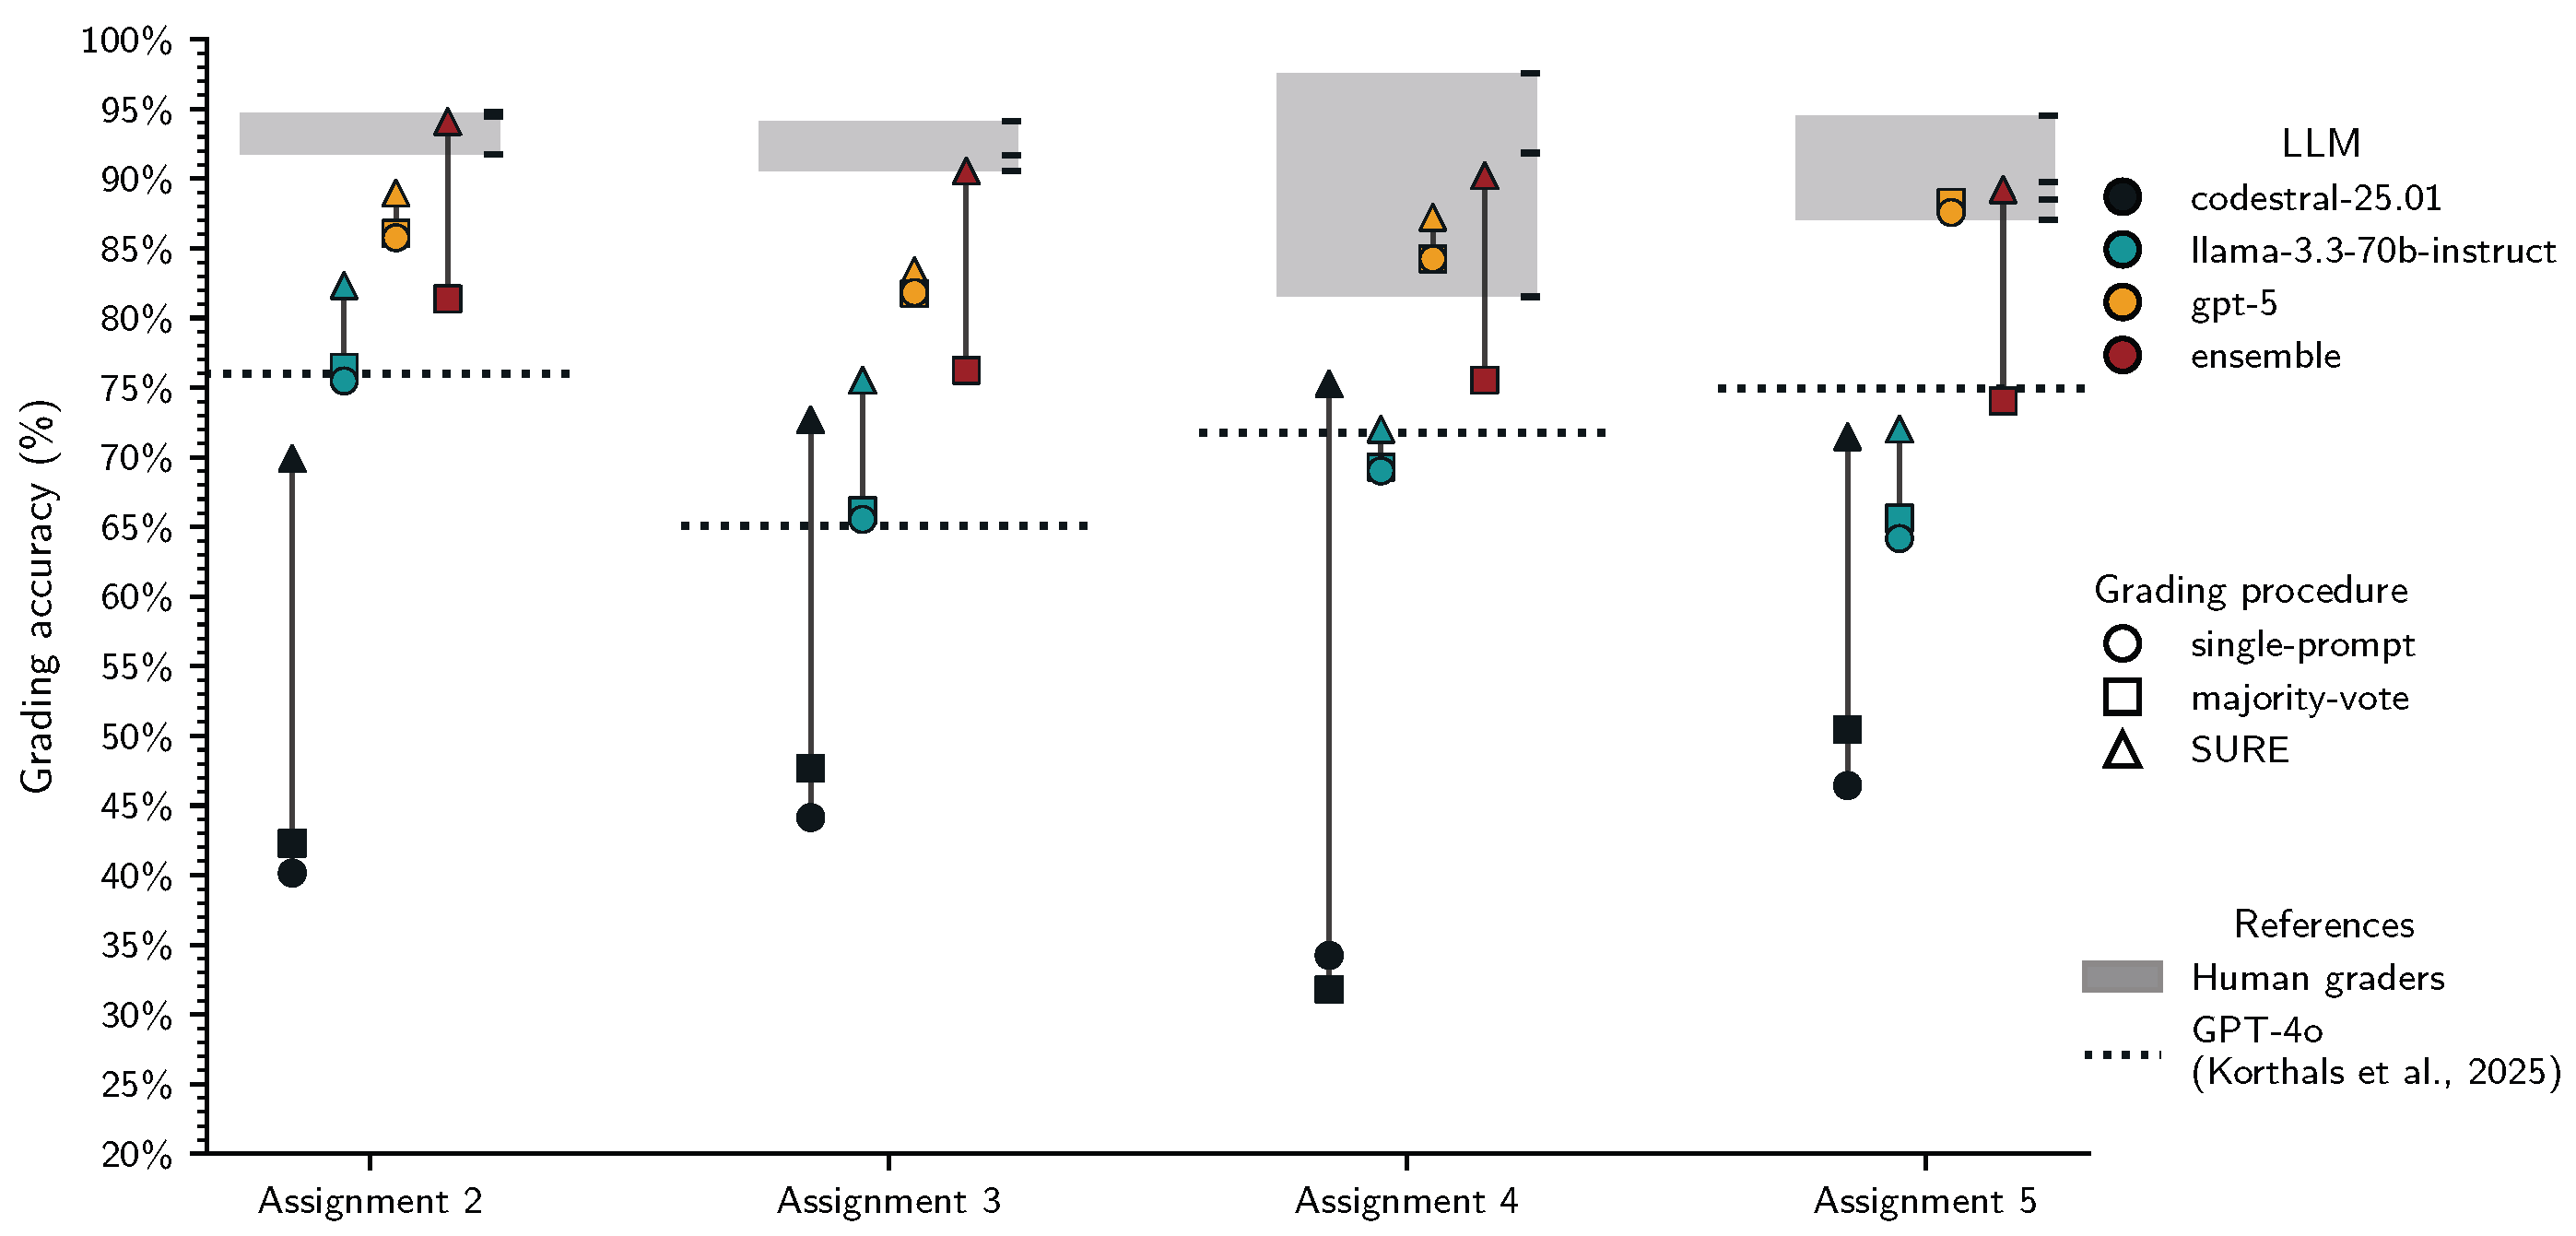
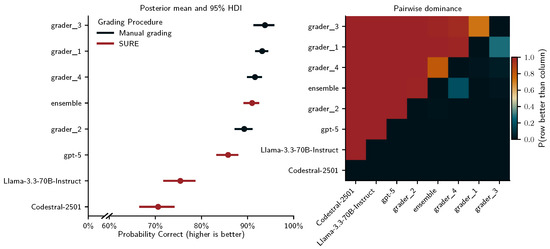
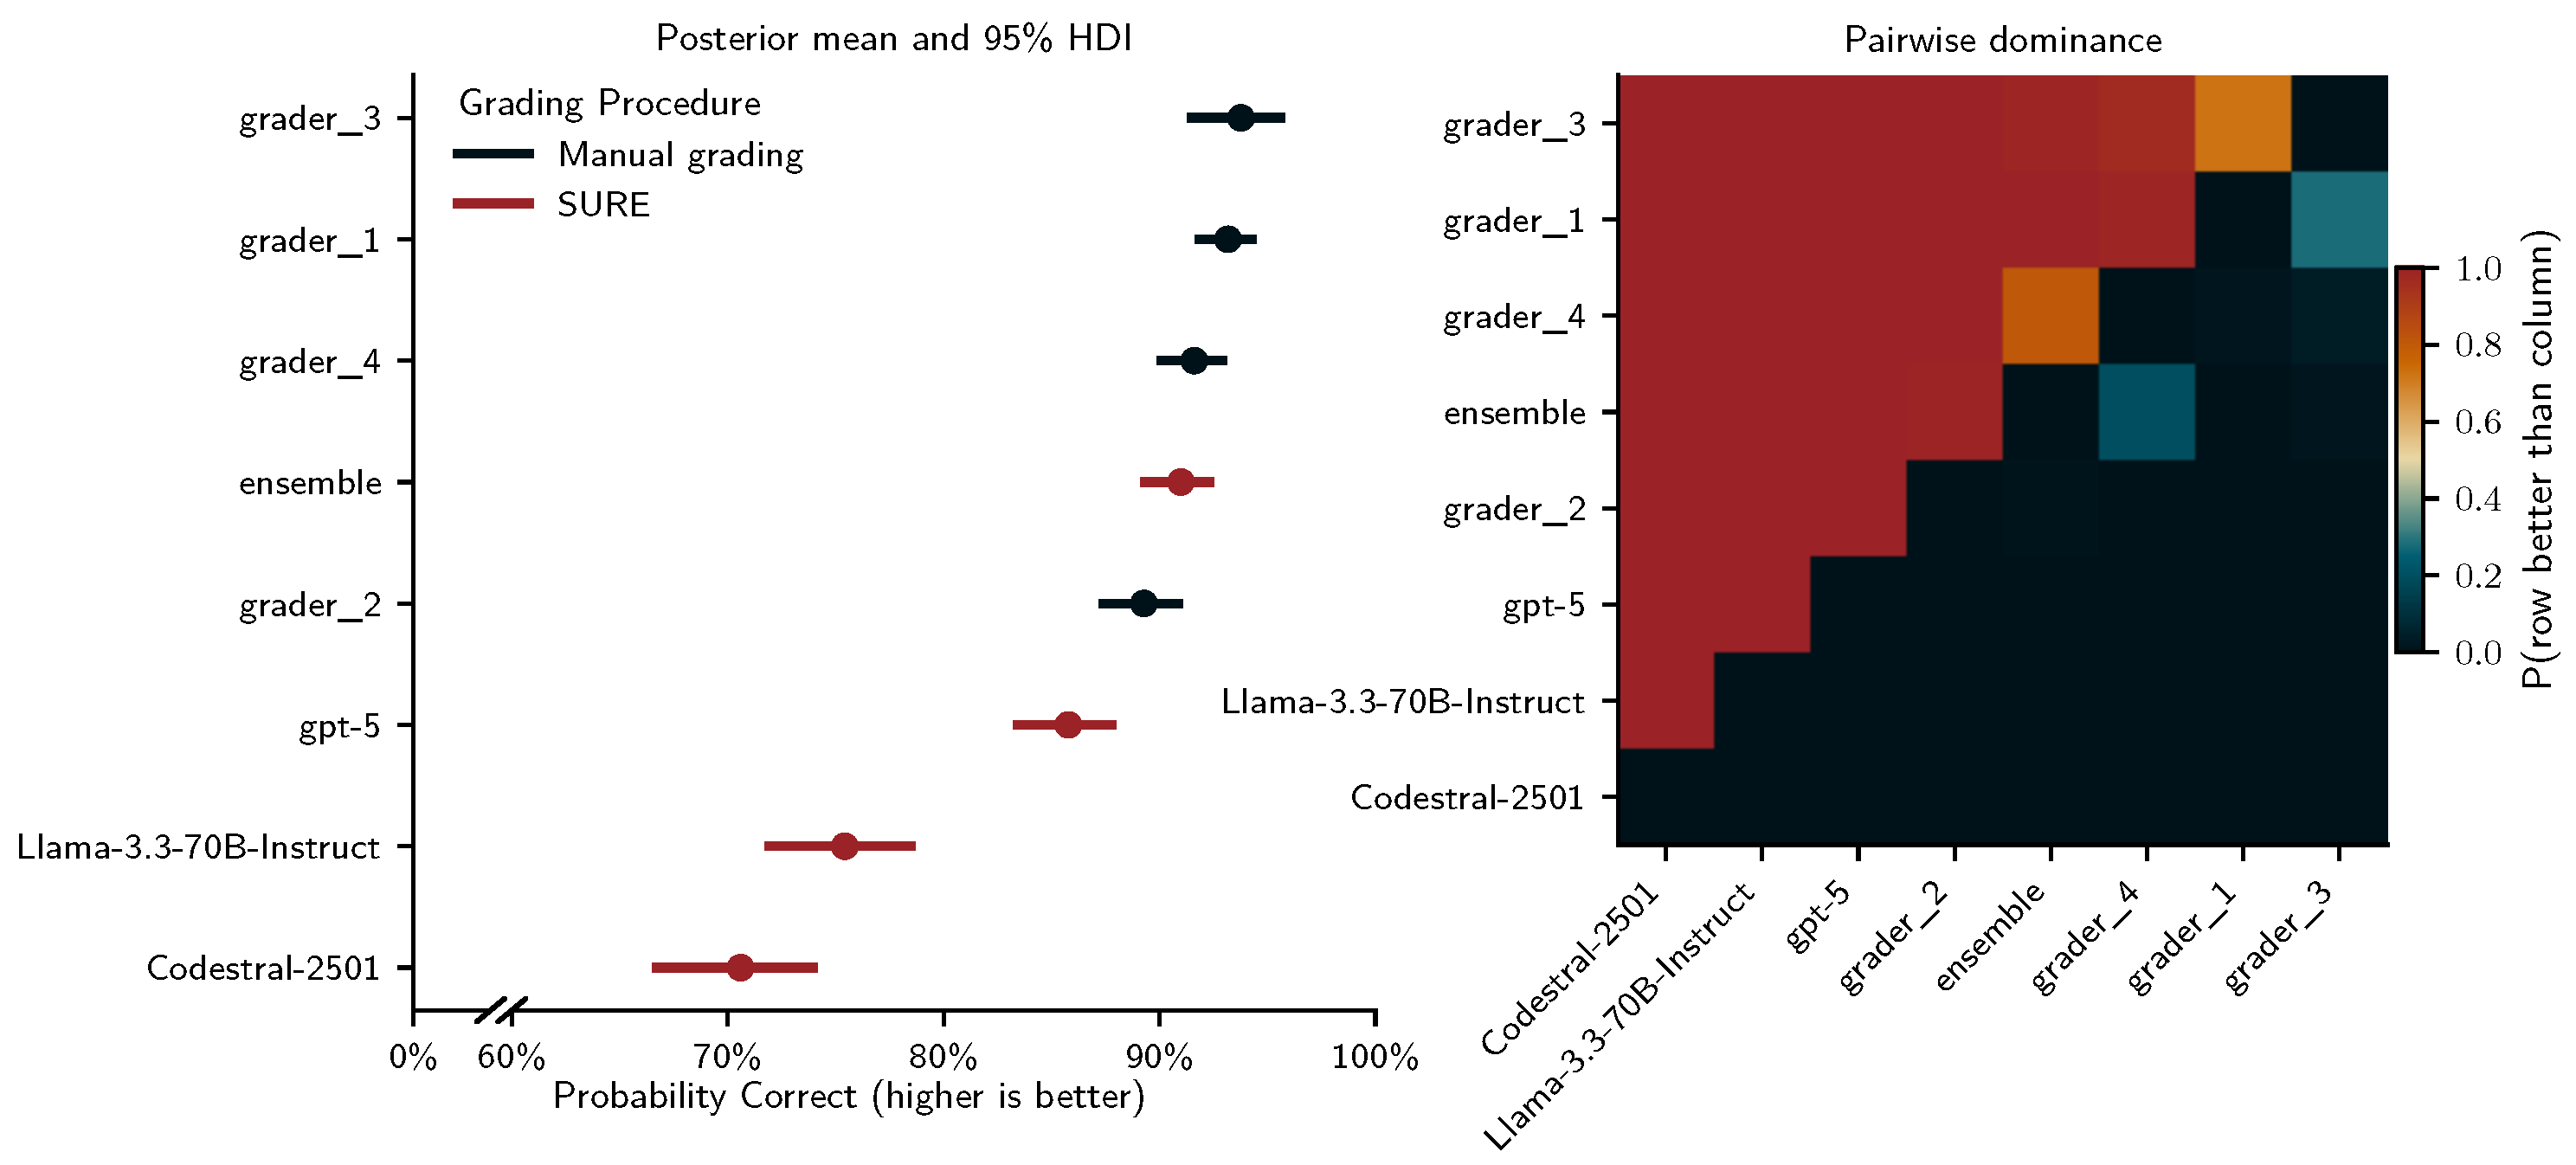
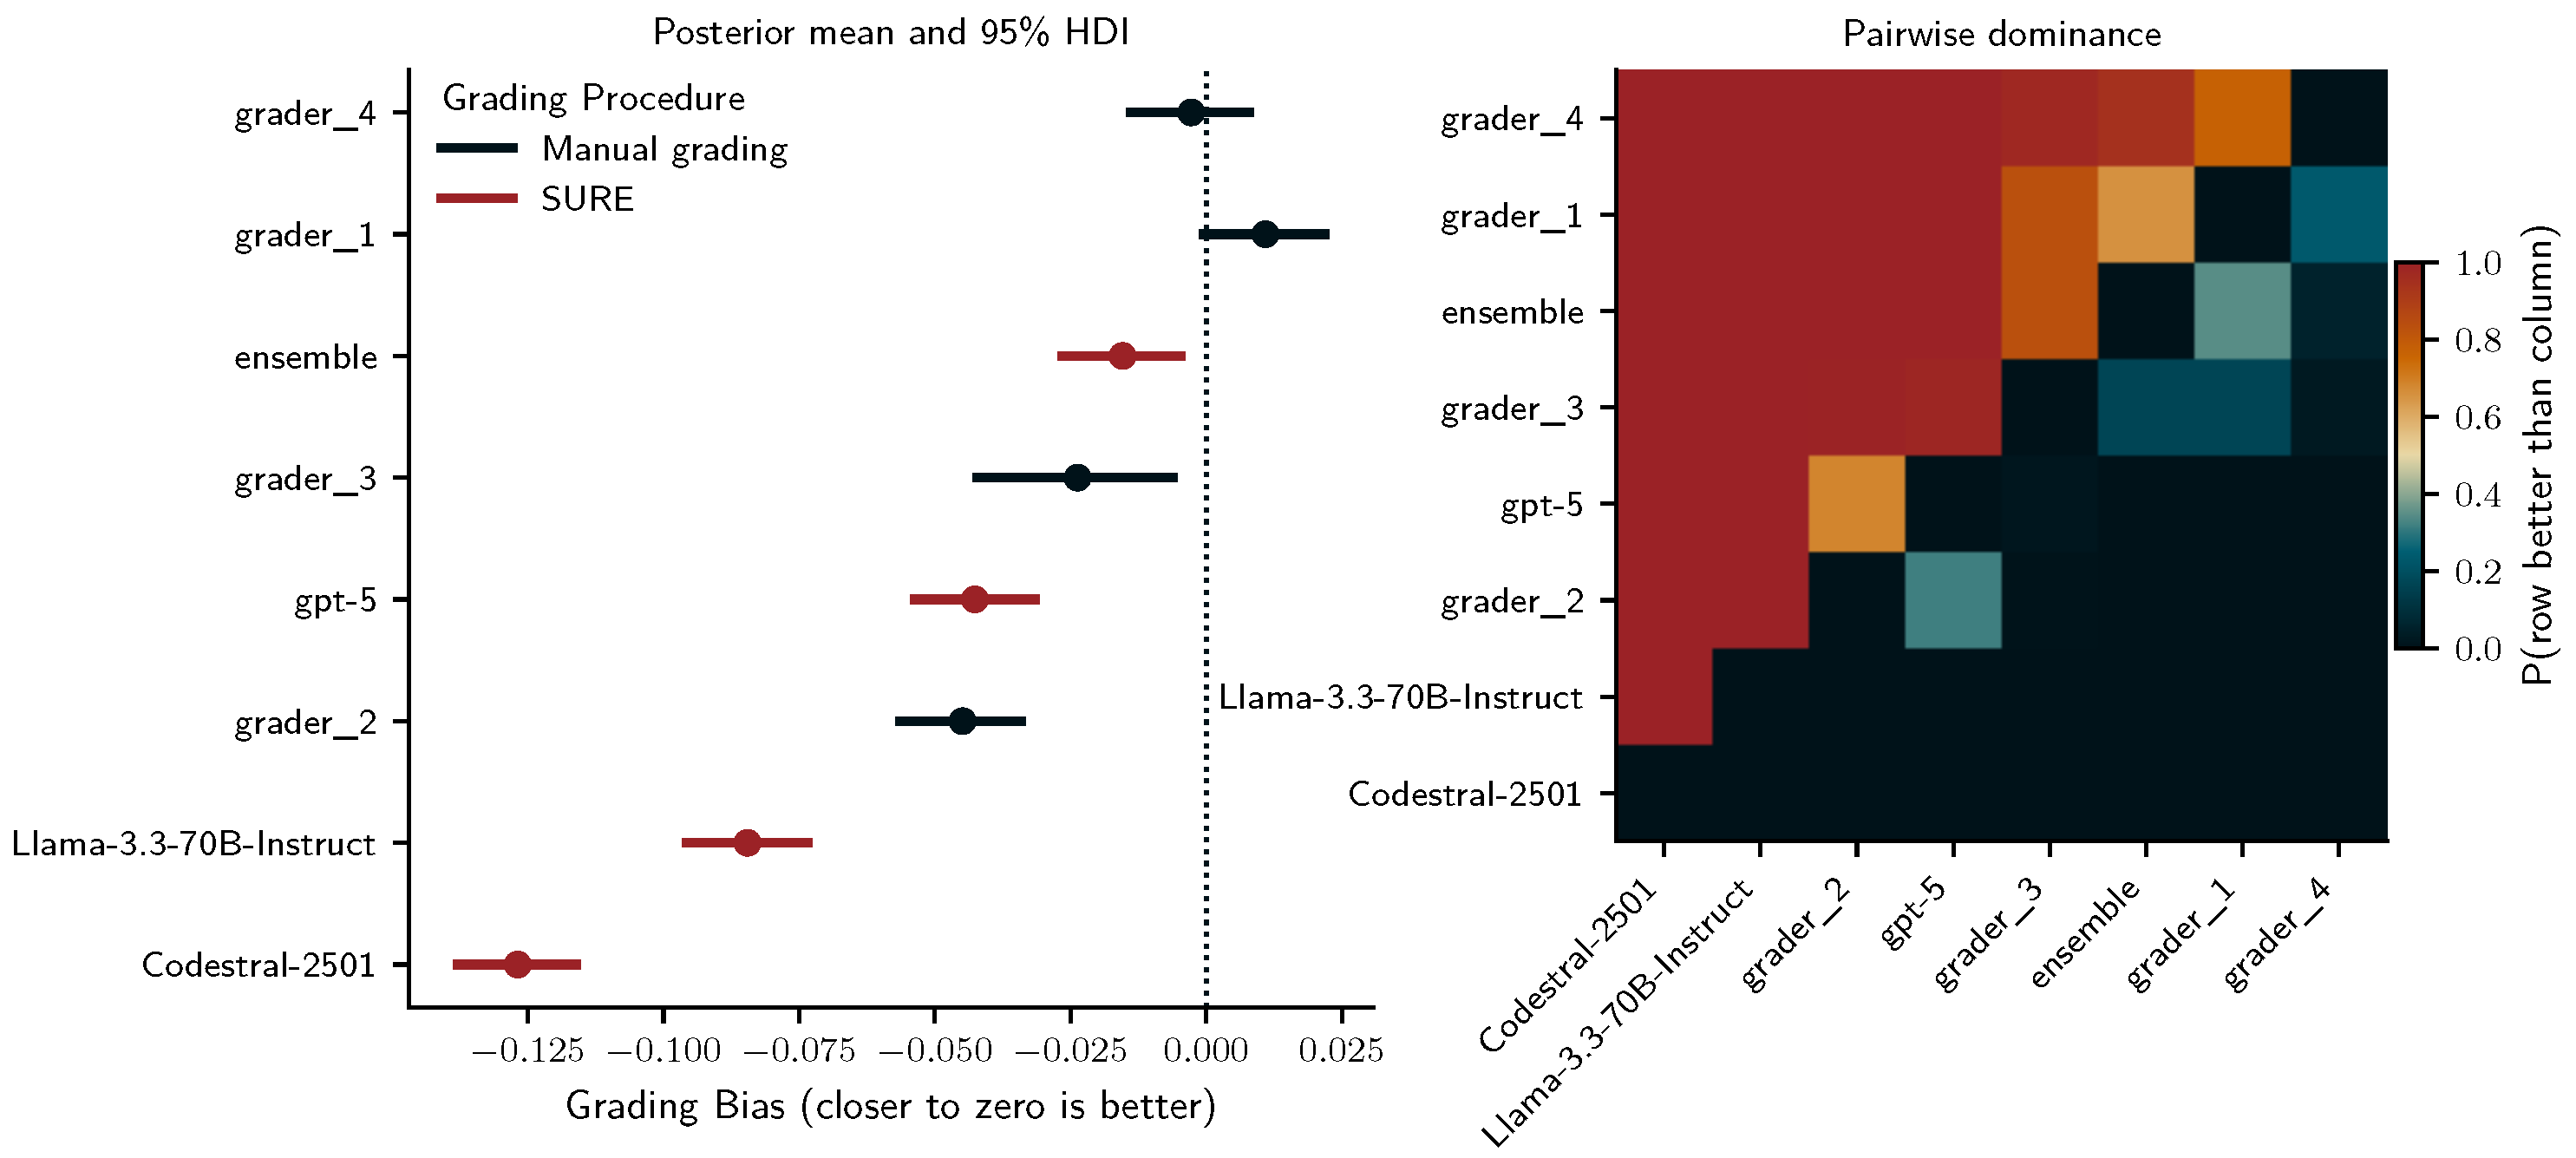
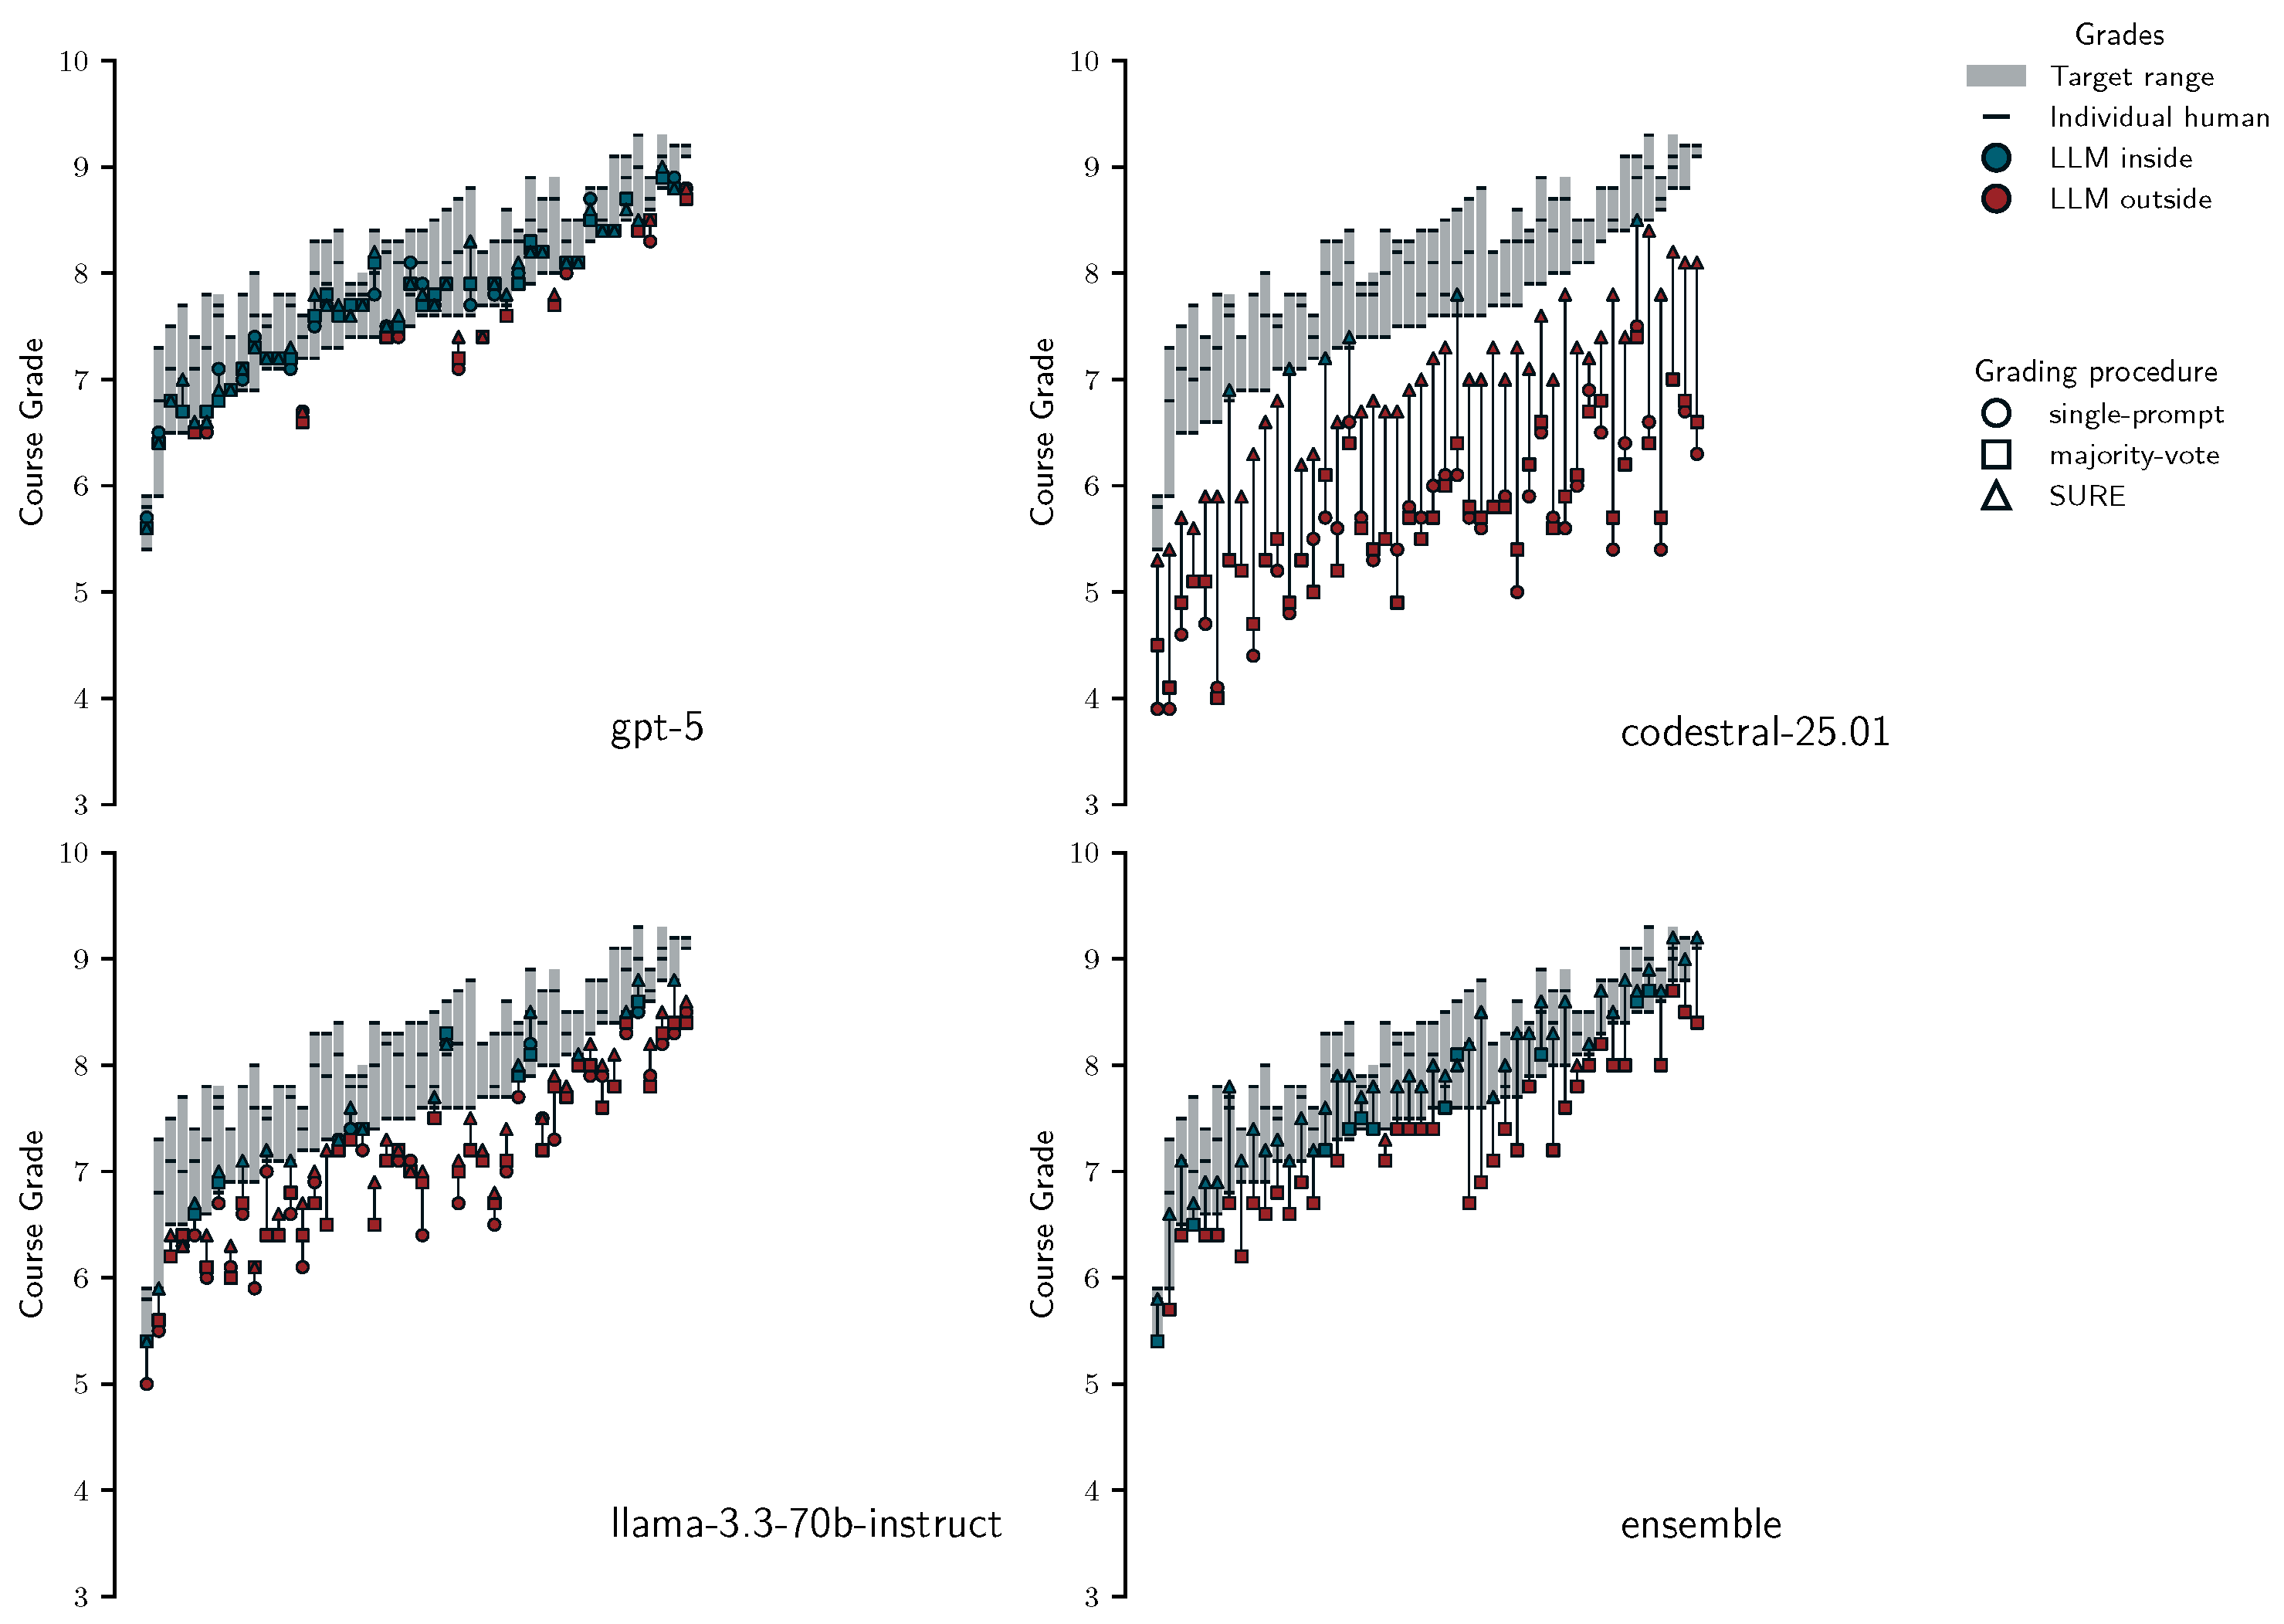

Disclaimer/Publisher’s Note: The statements, opinions and data contained in all publications are solely those of the individual author(s) and contributor(s) and not of MDPI and/or the editor(s). MDPI and/or the editor(s) disclaim responsibility for any injury to people or property resulting from any ideas, methods, instructions or products referred to in the content. |
© 2026 by the authors. Licensee MDPI, Basel, Switzerland. This article is an open access article distributed under the terms and conditions of the Creative Commons Attribution (CC BY) license.