1. Introduction
Single-cell RNA sequencing (scRNA-seq) is a technique that enables transcriptomic profiling at the level of individual cells, providing a high-resolution view of cellular heterogeneity in complex tissues. It captures the unique expression patterns of thousands to millions of cells, making it possible to identify rare cell types and novel cellular states that may be obscured in bulk data [
1]. The classification and understanding of diseases such as cancer, neurodegeneration, and immune disorders involve cell-type composition and state dynamics, which play key roles in pathogenesis.
Brain tumours, such as glioblastoma (GBM) and medulloblastoma, are highly aggressive and heterogeneous cancers. GBM is the most common malignant primary brain tumour in adults, marked by significant molecular and cellular diversity that complicates treatment and heightens prediction [
2,
3]. Contrarily, medulloblastoma is the most prevalent malignant pediatric brain tumour, classified into four distinct molecular subgroups, each with differing prognostic and therapeutic implications [
4]. Transcriptomic profiling using bulk RNA sequencing and single-cell RNA sequencing (scRNA-seq) is crucial for revealing gene expression signatures associated with tumour development, progression, and treatment response [
1]. Transforming omics data into image formats allows for the application of convolutional neural networks (CNNs) in effective classification [
5,
6]. Techniques such as DeepInsight and Fotomics convert gene expression data into 2D images using dimensionality reduction and Fourier transforms, respectively [
7,
8]. While these methods are effective, they often lack built-in interpretability. To address this issue, we propose a saliency-guided CNN pipeline that highlights the most influential gene regions through gradient-based saliency maps, providing biologically meaningful insights [
9,
10].
Motivation and Objectives
Classifying brain tumors from transcriptomic data is challenging due to high dimensionality and lack of interpretability. Image-based methods like DeepInsight and Fotomics enable CNNs to process gene expression as images but offer limited explanation of predictions. We propose a saliency-guided CNN to improve both accuracy and interpretability. The objectives of this study are as follows:
Transform brain tumor transcriptomic profiles into image representations using dimensionality reduction and spectral methods.
Benchmark DeepInsight, Fotomics, and our proposed saliency-guided CNN on GBM and medulloblastoma datasets.
Evaluate classification performance and extract biologically relevant gene features using saliency maps
2. Related Work
Recent research has emphasised transforming non-image omics data into image-like representations to harness the strengths of convolutional neural networks (CNNs) for classification tasks. Sharma et al. introduced DeepInsight, a method that converts non-image data into structured 2D images based on feature similarity, enabling the application of standard image-based CNNs to genomic and transcriptomic data [
7]. Extensions of DeepInsight have since evolved, such as GeneViT, which leverages vision transformers for improved performance [
11], and Fotomics, which maps features through Fourier transformations to capture global frequency-based patterns [
8]. Other models, such as OmicsMapNet and KEGG-based mapping strategies, incorporate biological knowledge into spatial arrangements to reflect functional ontologies [
12].
Building on previous foundations, this approach introduces a novel pipeline that combines GPU-accelerated image generation (using pyDeepInsight) with multiple dimensionality reduction techniques, t-SNE, UMAP, and PCA, to create RGB image representations of scRNA-seq data. Each colour channel captures distinct structural information: t-SNE emphasises local cell neighbourhoods [
13], UMAP preserves the global manifold topology [
14], and PCA accounts for data variance. This RGB encoding offers a richer visual representation than traditional grayscale methods, enabling enhanced pattern learning and interpretability.
Our method builds on prior work by applying CNN architectures such as ResNet and EfficientNet directly to these RGB images for tumour classification. In addition, we incorporate saliency maps to identify gene importance at the class level, adding an interpretable layer to deep learning predictions. Although recent reviews highlight the role of deep learning in single-cell and spatial transcriptomics [
15], few existing approaches provide a unified, scalable framework that combines image transformation, dimensionality reduction, CNN-based classification, and biological interpretability. This work addresses this gap by systematically benchmarking DeepInsight, Fotomics, and our saliency-guided CNN across two brain tumour datasets, glioblastoma (scRNA-seq) and medulloblastoma (bulk expression), to evaluate both performance and biological insight.
3. Datasets
This study utilised two publicly available transcriptomic datasets, GSM3828672 and GSE85217, retrieved from the Gene Expression Omnibus (GEO) repository. These datasets were selected to evaluate image-based deep learning methods across both single-cell and bulk transcriptomic modalities, thereby reflecting biological complexity and supporting the assessment of model generalisability.
GSM3828672 Smart-seq2 GBM offers high-resolution single-cell RNA-seq profiles from 28 glioblastoma tumors, allowing for the study of intra-tumoral heterogeneity and facilitating cell-level classification.
GSE85217 (medulloblastoma) consists of a large cohort n = 763 with established molecular subtype annotations, serving as a benchmark dataset for assessing model performance on bulk-level data.
These datasets enable us to evaluate the robustness and interpretability of image-based CNN models across varying resolutions, tissue types, and classification levels.
4. Methods
This study evaluates DeepInsight, Fotomics, and a saliency-guided CNN on brain tumour transcriptomic data by converting gene expression into images for classification and interpretability. The following subsections outline the theoretical foundations and implementation of each method in the analytical framework.
4.1. Preprocessing and Quality Control for Single-Cell RNA-Seq
Single-cell RNA sequencing data from GSM3828672 glioblastoma (Smart-seq2 platform) and GSE85217 medulloblastoma were processed consistently using the Scanpy pipeline. Quality control (QC) metrics were computed using scanpy.pp.calculate_qc_metrics, and cells exhibiting either unusually low or high gene counts, or an elevated proportion of mitochondrial gene expression—based on dataset-specific thresholds—were excluded. This filtering step was performed to eliminate low-quality cells, potential doublets, and apoptotic or stressed cells.
Following QC, gene expression counts were normalised on a per-cell basis to a total count of 10,000 using scanpy.pp.normalize_total, and log-transformed using the log1p function. Highly variable genes (HVGs) were identified scanpy.pp.highly_variable_genes, and the top 100 HVGs were selected for downstream analyses, including visualisation and clustermap generation.
Dimensionality reduction was performed using Principal Component Analysis (PCA), followed by construction of a neighbourhood graph and clustering using the Leiden algorithm. The resulting clusters were embedded in a two-dimensional space using Uniform Manifold Approximation and Projection (UMAP) for visual interpretation. Differential gene expression between clusters was assessed using a t-test approach, implemented via scanpy.tl.rank_genes_groups.
4.2. DeepInsight
DeepInsight converts high-dimensional RNA-seq data into image representations, enabling the use of convolutional neural networks (CNNs) for classification tasks. It utilises dimensionality reduction techniques such as t-SNE and kernel PCA to organise genes based on their similarities, resulting in pixel layouts that maintain biological relevance. Gene expression values are mapped onto these layouts, generating either RGB or greyscale images. These images are then input into a ResNet-based parallel CNN architecture, which features multiple convolutional layers to facilitate effective feature extraction and classification. The study applied a TCGA RNA-seq dataset consisting of 6216 samples and 60,483 genes across 10 cancer types, and DeepInsight achieved an impressive 99% classification accuracy, outperforming traditional methods [
7].
4.3. Fotomics
Fotomics applies Fast Fourier Transform (FFT) to single-cell RNA-seq data, converting gene expression profiles into 2D frequency-based images. By mapping real and imaginary FFT components onto a Cartesian plane and applying convex hull rotation, it generates spatially structured images that encode gene relationships. These images are fed into a CNN architecture for classification. As shown in the workflow in their paper Figure (1) [
8], the transformed omics images undergo convolution, pooling, and fully connected layers to predict cell types. Fotomics demonstrated strong classification performance and faster runtimes compared to DeepInsight across multiple scRNA-seq datasets.
4.4. Saliency Guided CNN
In our proposed Saliency Guided CNN framework, we introduce an interpretable deep learning pipeline for single-cell RNA-seq classification by mapping gene expression profiles into RGB images using manifold learning techniques. Each cell is represented as an image of size
, where pixel colour encodes gene coordinates from t-SNE (
R), PCA (
G), and UMAP (
B) embeddings. As detailed in Algorithm 1, the resulting images are used to train a convolutional neural network under a
k-fold cross-validation strategy. Classification performance is evaluated using standard metrics such as accuracy, precision, recall, F1-score, and AUC. To enhance interpretability, we compute saliency maps based on concept relevance, defined by the gradient of a concept score
with respect to each input pixel [
16]:
This highlights the contribution of each pixel and thus each gene coordinate to the representation of high-level biological concepts, offering insight into cell types specific features.
| Algorithm 1. Saliency-Guided scRNA-seq Classification via RGB Mapping |
- Require:
Gene expression matrix , labels , image size - Ensure:
Trained CNN model, evaluation metrics, concept-based saliency maps - 1:
Normalise X and select top variable genes - 2:
Compute PCA , t-SNE , and UMAP embeddings - 3:
for to n do - 4:
Normalise coordinates of PCA, t-SNE, and UMAP to - 5:
Map t-SNE coordinates to pixel location - 6:
Construct RGB vector: , , - 7:
Assign RGB value to pixel in blank image - 8:
Save image to directory associated with class label - 9:
end for - 10:
Initialise k-fold cross-validation - 11:
for each fold to k do - 12:
Train CNN model on training images - 13:
Evaluate model on validation images - 14:
Record performance metrics: accuracy, precision, recall, F1-score, AUC - 15:
end for - 16:
Save best-performing model as model_final.pth - 17:
for each class to C do - 18:
Select representative image - 19:
Forward pass through CNN to get concept score - 20:
Compute concept-based saliency: - 21:
Visualise and save saliency heatmap for - 22:
end for
|
5. Experimental Setup
Preprocessing and Image Generation
Raw gene expression matrices were processed using the Scanpy library. Preprocessing included log-normalisation, followed by dimensionality reduction using a combination of Principal Component Analysis (PCA), Uniform Manifold Approximation and Projection (UMAP), and t-distributed Stochastic Neighbour Embedding (t-SNE). PCA was first applied to reduce the feature space to 50 components. A k-nearest neighbour graph was then constructed in the PCA space and used to compute 2D UMAP embeddings. Additionally, t-SNE was computed using the top 50 principal components.
The resulting 2D embeddings (, , and ) were normalised to the range and mapped to RGB channels: t-SNE to red, PCA to green, and UMAP to blue. Each sample was plotted as a coloured blob on a pixel grid using the t-SNE coordinates for spatial positioning (with a radius of 3 pixels to simulate local density). The final images were saved in label-specific folders for downstream CNN-based classification.
6. Model Architecture and Training
To evaluate the classification performance of transcriptomic image representations, two convolutional neural network (CNN) architectures were employed: ResNet-18 and EfficientNet-B0. Both models were implemented using the PyTorch deep learning framework and trained on a system configured to utilise GPU acceleration via CUDA when available, with automatic fallback to CPU execution otherwise.
Both models were initialised with ImageNet-pretrained weights, and their final classification layers were replaced with task-specific linear layers to match the number of output classes:
ResNet-18: The original fully connected (fc) layer was replaced with a new linear layer whose output dimension matched the number of target classes.
EfficientNet-B0: The final layer in the classifier block was similarly substituted with a linear layer adapted to the classification task.
Models were deployed to the appropriate computational device (cuda or cpu) using PyTorch.
The study architectures, ResNet-18 and EfficientNet-B0, were applied exclusively to the custom RGB image representations derived from PCA, UMAP, and t-SNE embeddings of the transcriptomic data. In contrast, DeepInsight and Fotomics were each used as self-contained pipelines, which include their own built-in CNN classifiers. These models were used without modification, as provided in their respective frameworks.
To ensure a fair and consistent comparison across all evaluated methods, including DeepInsight and Fotomics, which employ relatively short training cycles, training was limited to five epochs. Both ResNet-18 and EfficientNet-B0 reached performance stability within this range, and extending the training duration primarily resulted in overfitting due to the dataset size and feature dimensionality. To further ensure robust performance estimation and minimise variance arising from data partitioning, a five-fold stratified cross-validation strategy was employed, maintaining balanced class distributions across folds. Each model was trained independently for each fold using the defined hyperparameters:
6.1. Evaluation Protocol
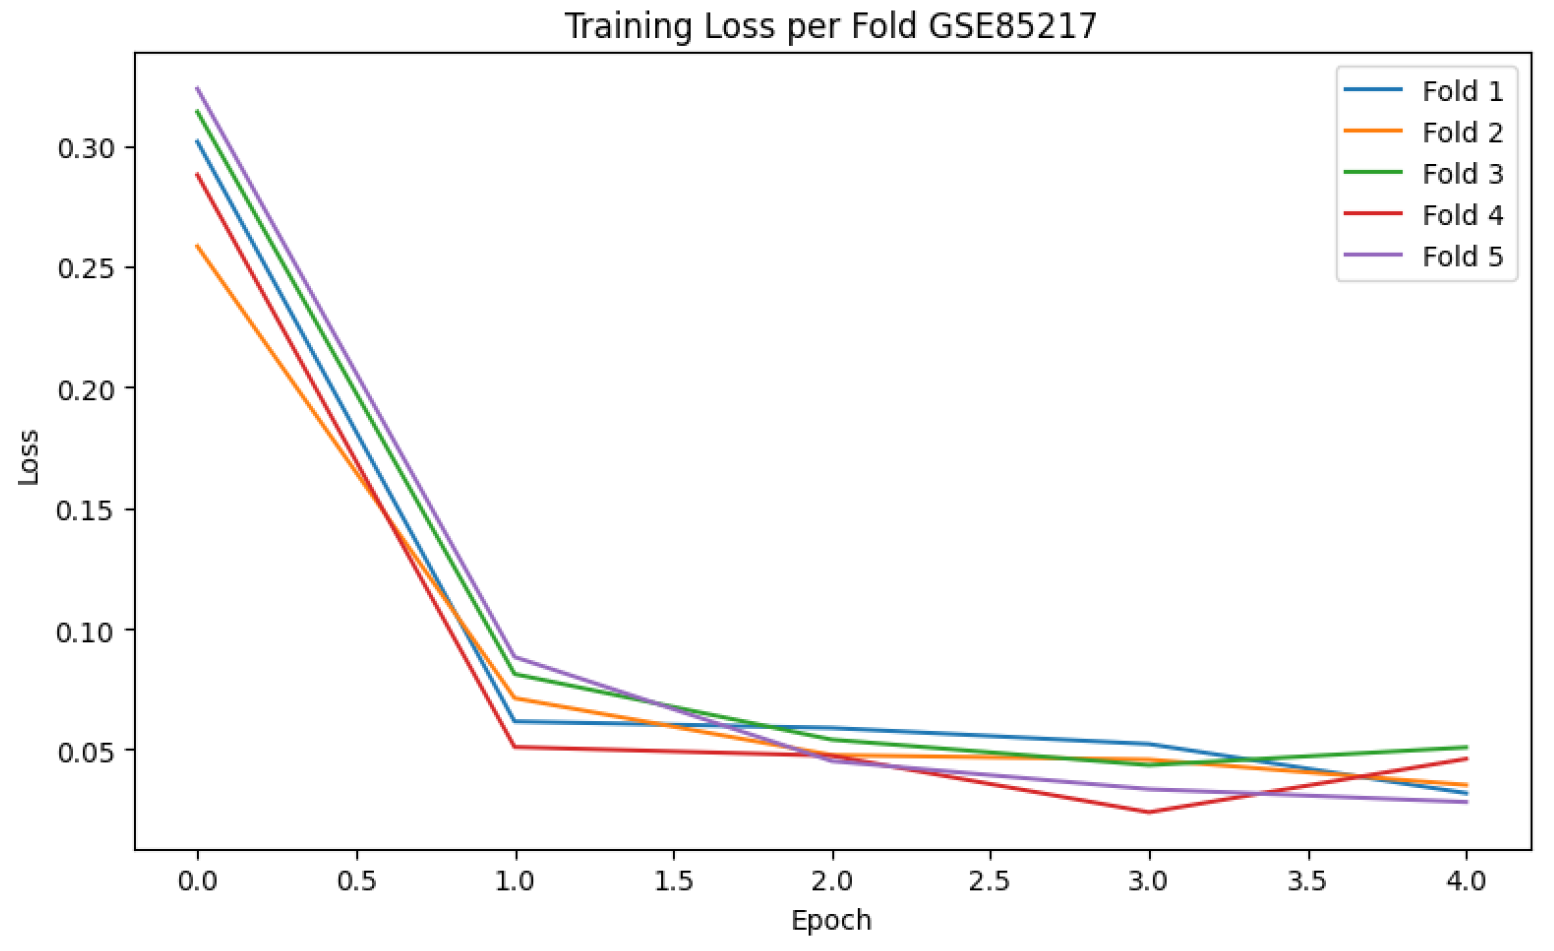
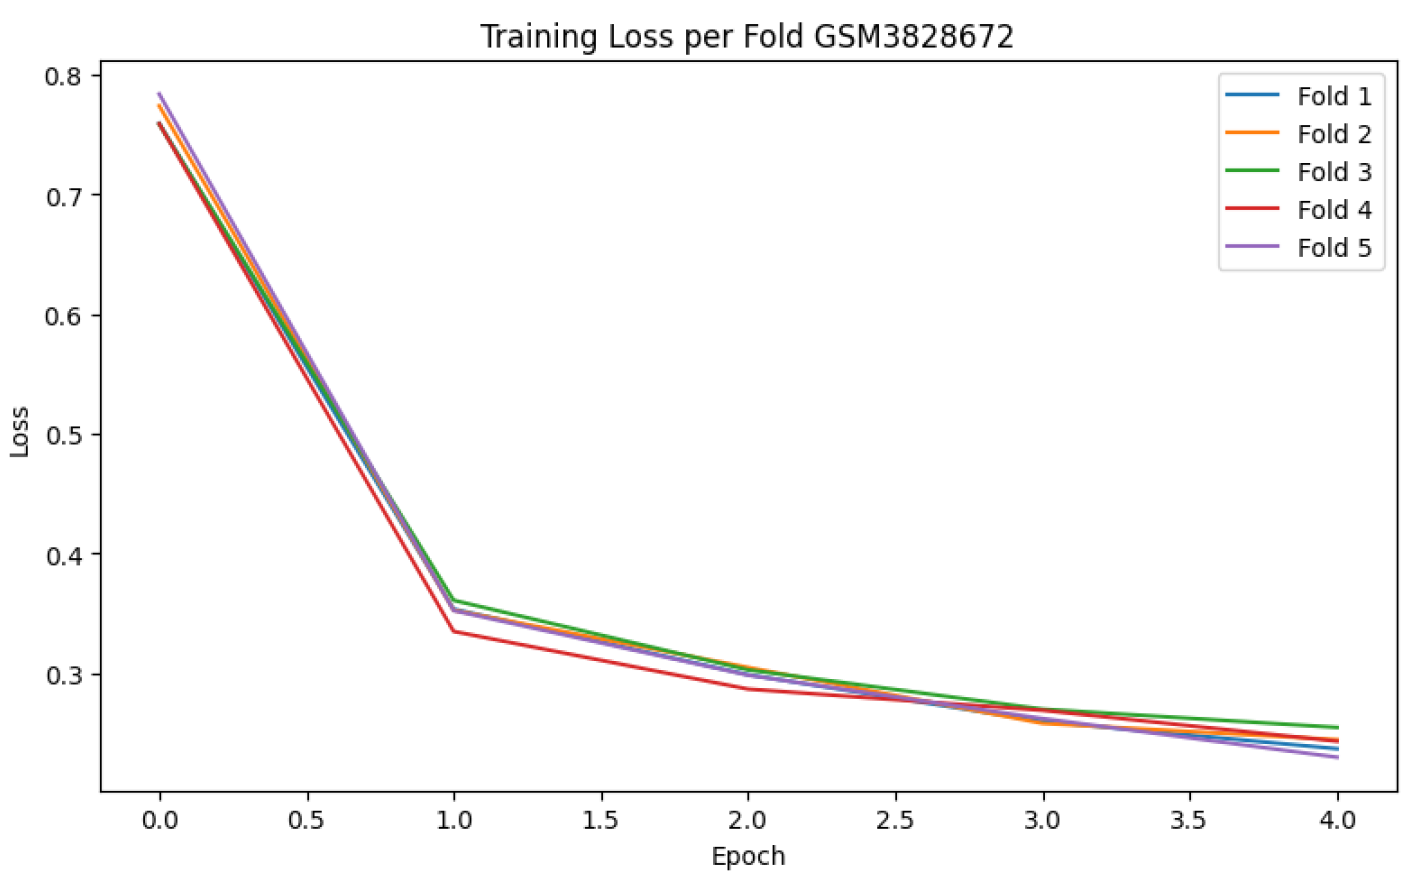
Model performance was evaluated using multiple metrics to ensure both global and class-specific assessment. These included classification accuracy, macro-averaged one-vs-one (OvO) ROC-AUC, and the confusion matrix to measure per-class prediction quality. Additionally, training loss curves were plotted for each fold to monitor convergence behaviour and detect potential overfitting.
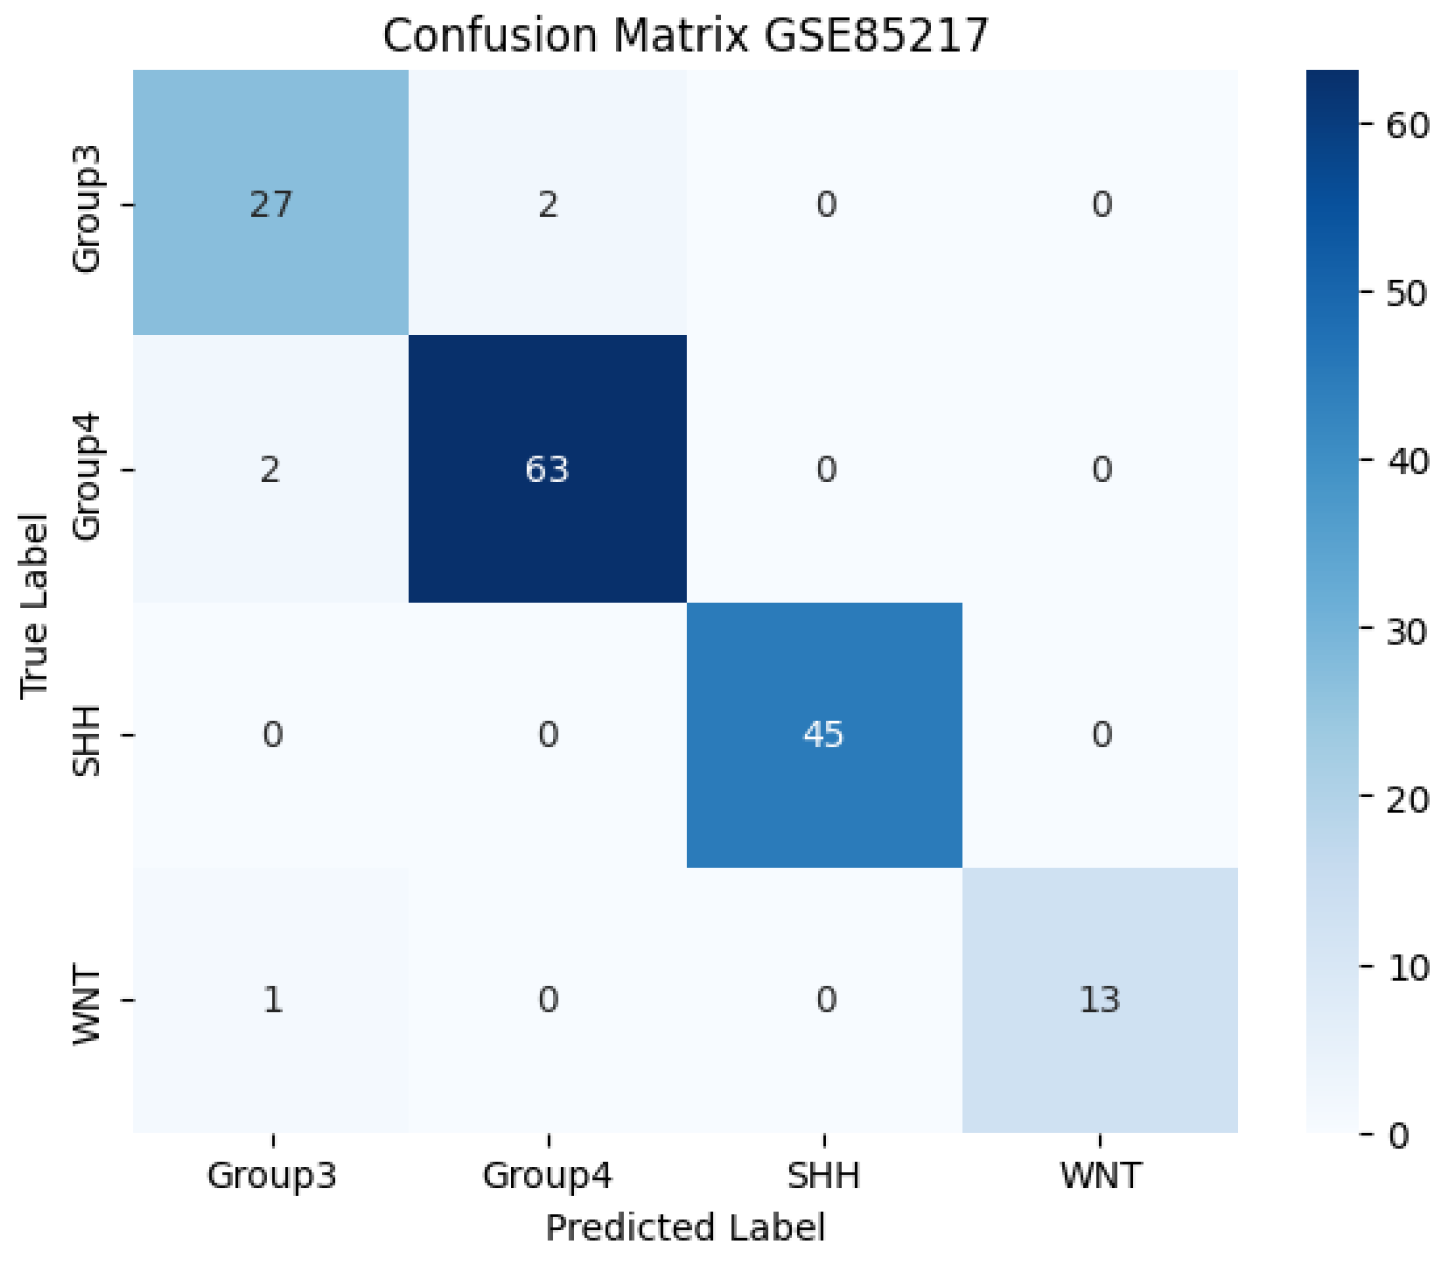
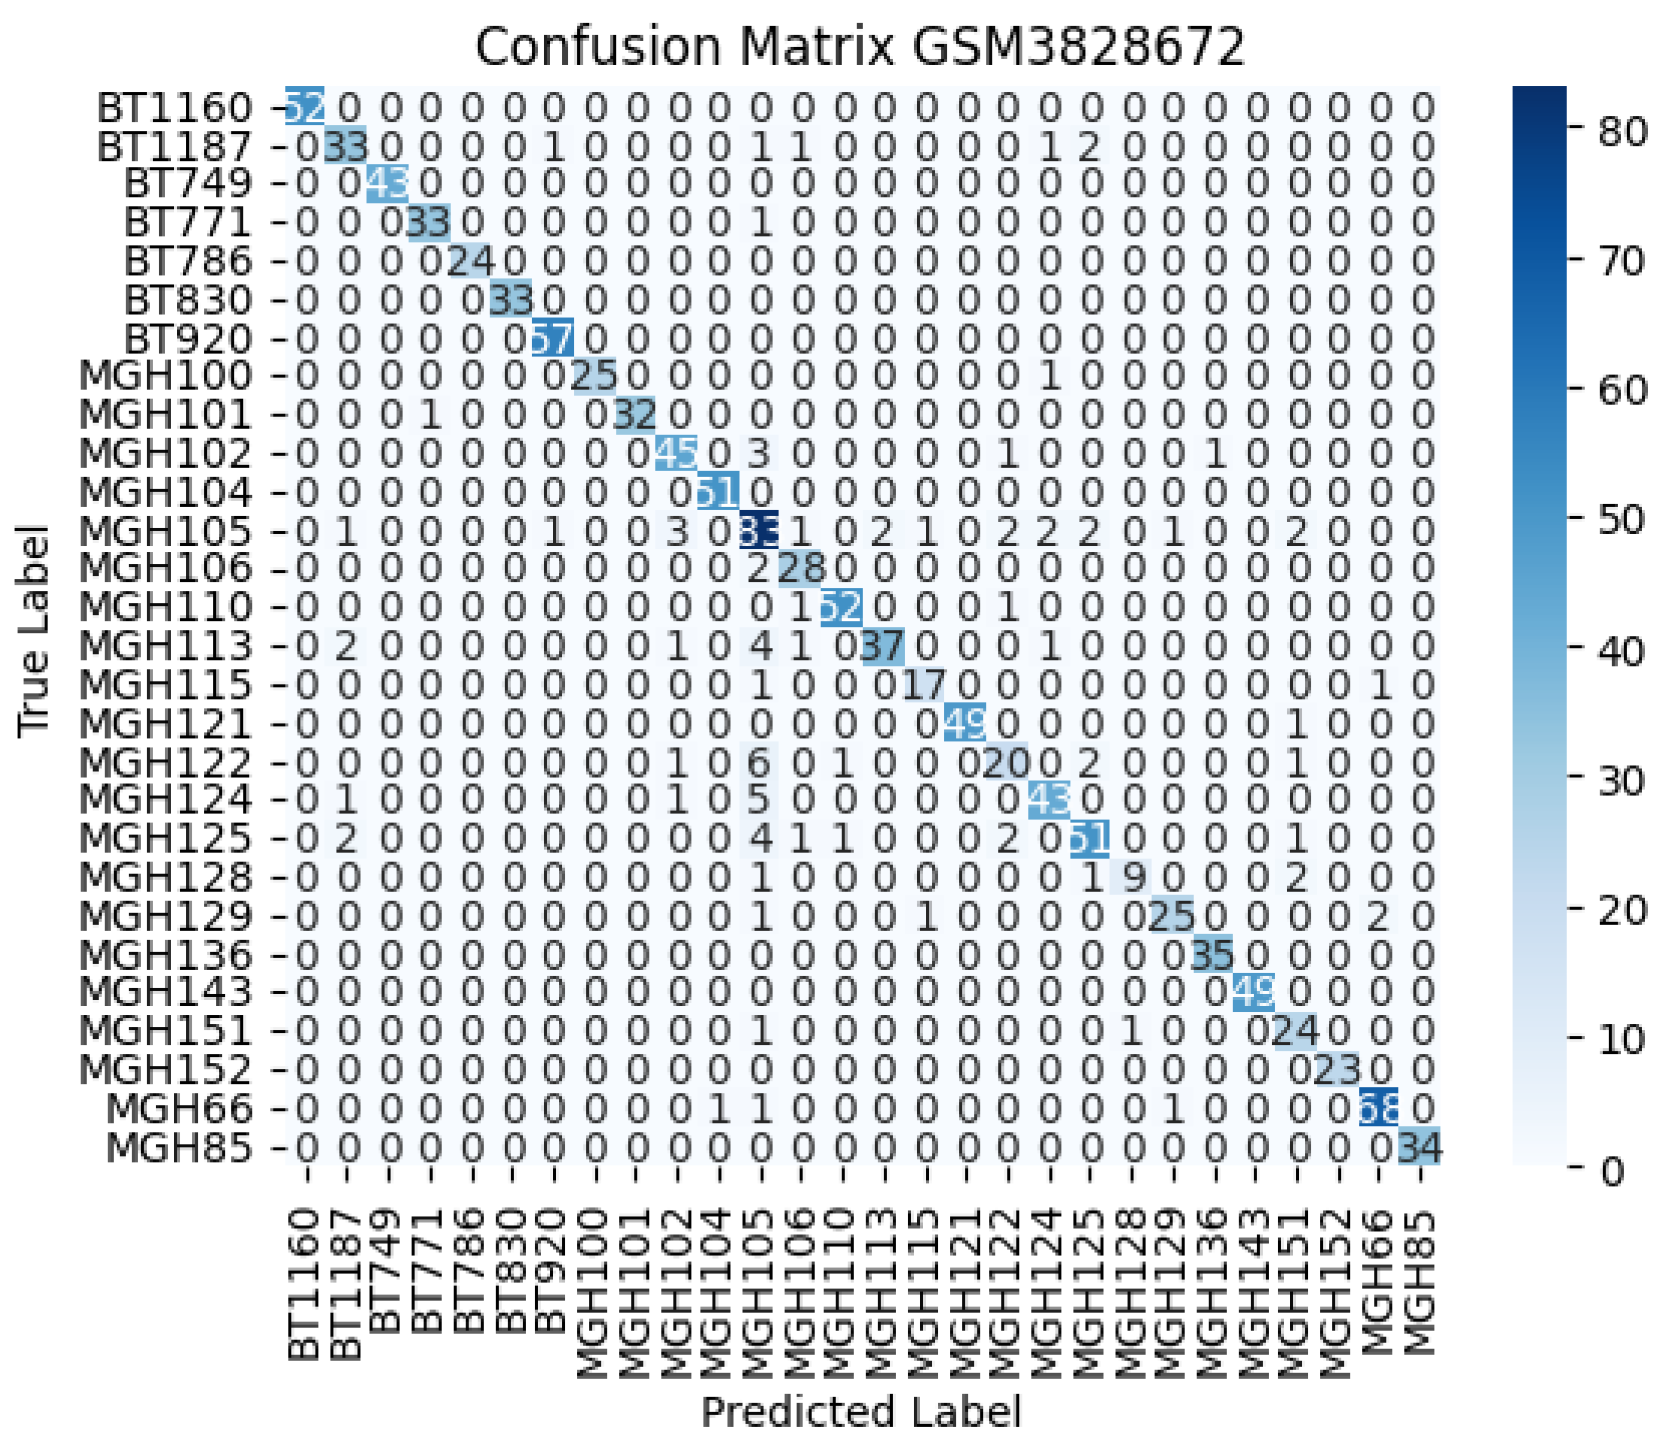
The confusion matrix was computed and visualised after each fold, providing insights into class-level misclassifications. An averaged confusion matrix across all folds was also generated to summarise the model’s generalisation capability. These visualisations are included in the
Figure 1,
Figure 2,
Figure 3 and
Figure 4.
6.2. Saliency-Based Gene Interpretation
To support interpretability, gradient-based saliency mapping was applied to the trained CNN models, following the method of Simonyan et al. [
9]. Each input image
was represented as an RGB tensor derived from independent embeddings of the omics data: PCA (green), UMAP (blue), and t-SNE (red). The classifier is defined as a function
, where
C denotes the number of tumour classes. For a given input image
I, the predicted class is
To compute saliency, we calculated the gradient of the logit corresponding to the predicted class with respect to the input:
The saliency map was obtained by taking the maximum absolute gradient across the RGB channels:
highlighting those pixels most influential for the classification decision. Saliency maps were computed in PyTorch using the
.backward() operation and visualised as heatmaps. One representative image per class was selected for illustration. Notably, the red channel (t-SNE) frequently dominated high-saliency regions, suggesting that local transcriptomic structure contributed substantially to classification.
As the RGB channels correspond to independent embeddings rather than coherent colour channels, pixel-level saliency was not interpreted in isolation. Instead, each pixel was mapped back to its associated gene identity using the coordinate transformations defined during image generation. This procedure ensured that interpretability remained anchored in the original transcriptomic feature space.
Genes were ranked by their aggregated saliency values and examined for biological relevance. Several top-ranked features corresponded to recognised tumour markers, including OLIG2 and SOX2 in glioblastoma, and MYC and MYCN in medulloblastoma. To evaluate functional coherence, enrichment analysis of the top 200 saliency-ranked genes was performed using Gene Ontology (GO) and pathway annotations.
6.3. Implementation and Hardware Details
All components were implemented in Python using PyTorch version 1.12.0 for deep learning and Scanpy for omics preprocessing. Image rendering and visualisation were done using PIL (version 8.0.0), Matplotlib (version 3.8.0), and Seaborn (version 0.11.0). Training and evaluation were carried out on a workstation equipped with an NVIDIA CUDA-enabled GPU, Intel CPU, and 32 GB of RAM.
6.4. Statistical Analysis
To assess whether the observed differences in classification performance between ResNet-18 and EfficientNet-B0 were statistically significant, the Wilcoxon Signed-Rank Test was employed [
17,
18]. This non-parametric test was chosen as a robust alternative to the paired
t-test, as it does not assume normality and is well-suited for small-sample comparisons across cross-validation folds.
The test was conducted separately on the fold-wise accuracy scores from two datasets.
From
Table 1, the results indicate no statistically significant difference in classification accuracy between the two architectures (
), although the GSM3828672 Smart-seq2 result approaches marginal significance. These findings suggest that both ResNet-18 and EfficientNet-B0 exhibit similar and reliable performance on the evaluated tasks.
Considering its lower computational complexity and faster training time, ResNet-18 was selected for subsequent saliency analysis and interpretation. Full classification results, including loss curves, confusion matrices, and ROC visualisations, are provided in
Section 7.
7. Results
This section presents a comprehensive evaluation of the proposed saliency-guided CNNs framework, implemented with both ResNet-18 and EfficientNet-B0 architectures, across two transcriptomic datasets: GSE85217 (bulk RNA-seq, 4-class molecular subtype classification) and GSM3828672 (single-cell RNA-seq, 30-class cell type-level classification). The performance of these deep learning models was benchmarked against two conventional image-based bioinformatics approaches: Fotomics and DeepInsight, providing a comparison across modern CNN architectures and traditional handcrafted feature-based methods.
7.1. Medulloblastoma Subtype Classification (GSE85217)
In the analysis of the GSE85217 dataset,
Table 2 summarises the 5-fold cross-validation performance of the ResNet-18-based saliency-guided CNN model, achieving a mean accuracy of 97.20%, F1-score of 97.00%, and macro-AUC of 99.18%, indicating high consistency across folds. The training loss curves across five folds shown in
Figure 1 indicate rapid and stable convergence within the first few epochs. Furthermore, the confusion matrix in
Figure 2 illustrates the model’s effectiveness in correctly classifying all four medulloblastoma subtypes (Group 3, Group 4, SHH, and WNT), with minimal confusion.
7.2. GSM3828672 Smart-Seq2 GBM Classification
For the GSM3828672 glioblastoma dataset, the saliency-guided CNN with ResNet-18 demonstrated the highest classification performance among all evaluated methods. The model’s 5-fold cross-validation results
Table 3 show consistent performance with low standard deviation, indicating stable generalisation across folds. The training loss curves
Figure 3 confirm effective convergence within a few epochs. Furthermore, the confusion matrix
Figure 4 illustrates the model’s capability to correctly classify a diverse set of 28 cell type–derived GBM samples with minimal misclassification, underscoring its robustness in handling highly heterogeneous single-cell transcriptomic data.
7.3. Comparative Summary and Model Insights
As illustrated in
Table 4, the saliency-guided CNN using ResNet-18, trained on RGB images generated from PCA, UMAP, and t-SNE embeddings, achieved the highest performance across both datasets, with maximum accuracies of 97.25% on GSE85217 and 91.02% on GSM3828672, and F1-scores of 96.96% and 91.26%, respectively. While EfficientNet-B0, also trained on the same RGB embeddings, performed well, it slightly lagged behind ResNet-18 in precision and interpretability. Fotomics and DeepInsight, evaluated as end-to-end pipelines using their default CNN classifiers, achieved competitive results. Fotomics, which leverages frequency-domain transformations, achieved 96.07% accuracy on the bulk dataset, showcasing its ability to capture global expression patterns. DeepInsight, which preserves local structure through spatial feature mapping, performed relatively better in recall and AUC (Macro), especially on GSM3828672, indicating its strength in modelling localised expression signals. However, both transformation-based methods lack inherent interpretability. In contrast, the proposed saliency-guided CNN integrates accurate classification with class-level feature attribution, making it particularly suited for biologically meaningful and explainable predictions in both bulk and single-cell transcriptomic contexts.
7.4. Interpretability via Saliency Maps
To improve the interpretability of the classification model, class-wise saliency maps were generated for the GSE85217 dataset using gradient-based visualisation techniques. As illustrated in
Figure 5, saliency maps were generated for representative tumours from the Group 3, Group 4, SHH, and WNT medulloblastoma subtypes. Genes with saliency scores
are annotated, representing those with the strongest influence on the model’s predictions. The saliency score quantifies the local sensitivity of the model’s output to perturbations in individual gene expression levels. Notable examples include
CXCR4 (0.41) in Group 3,
TOP2A (0.39) in Group 4,
CDK6 (0.25) in SHH, and
WNT5A (0.20) in WNT. These visualisations provide interpretable, model-derived evidence supporting subtype-specific gene relevance.
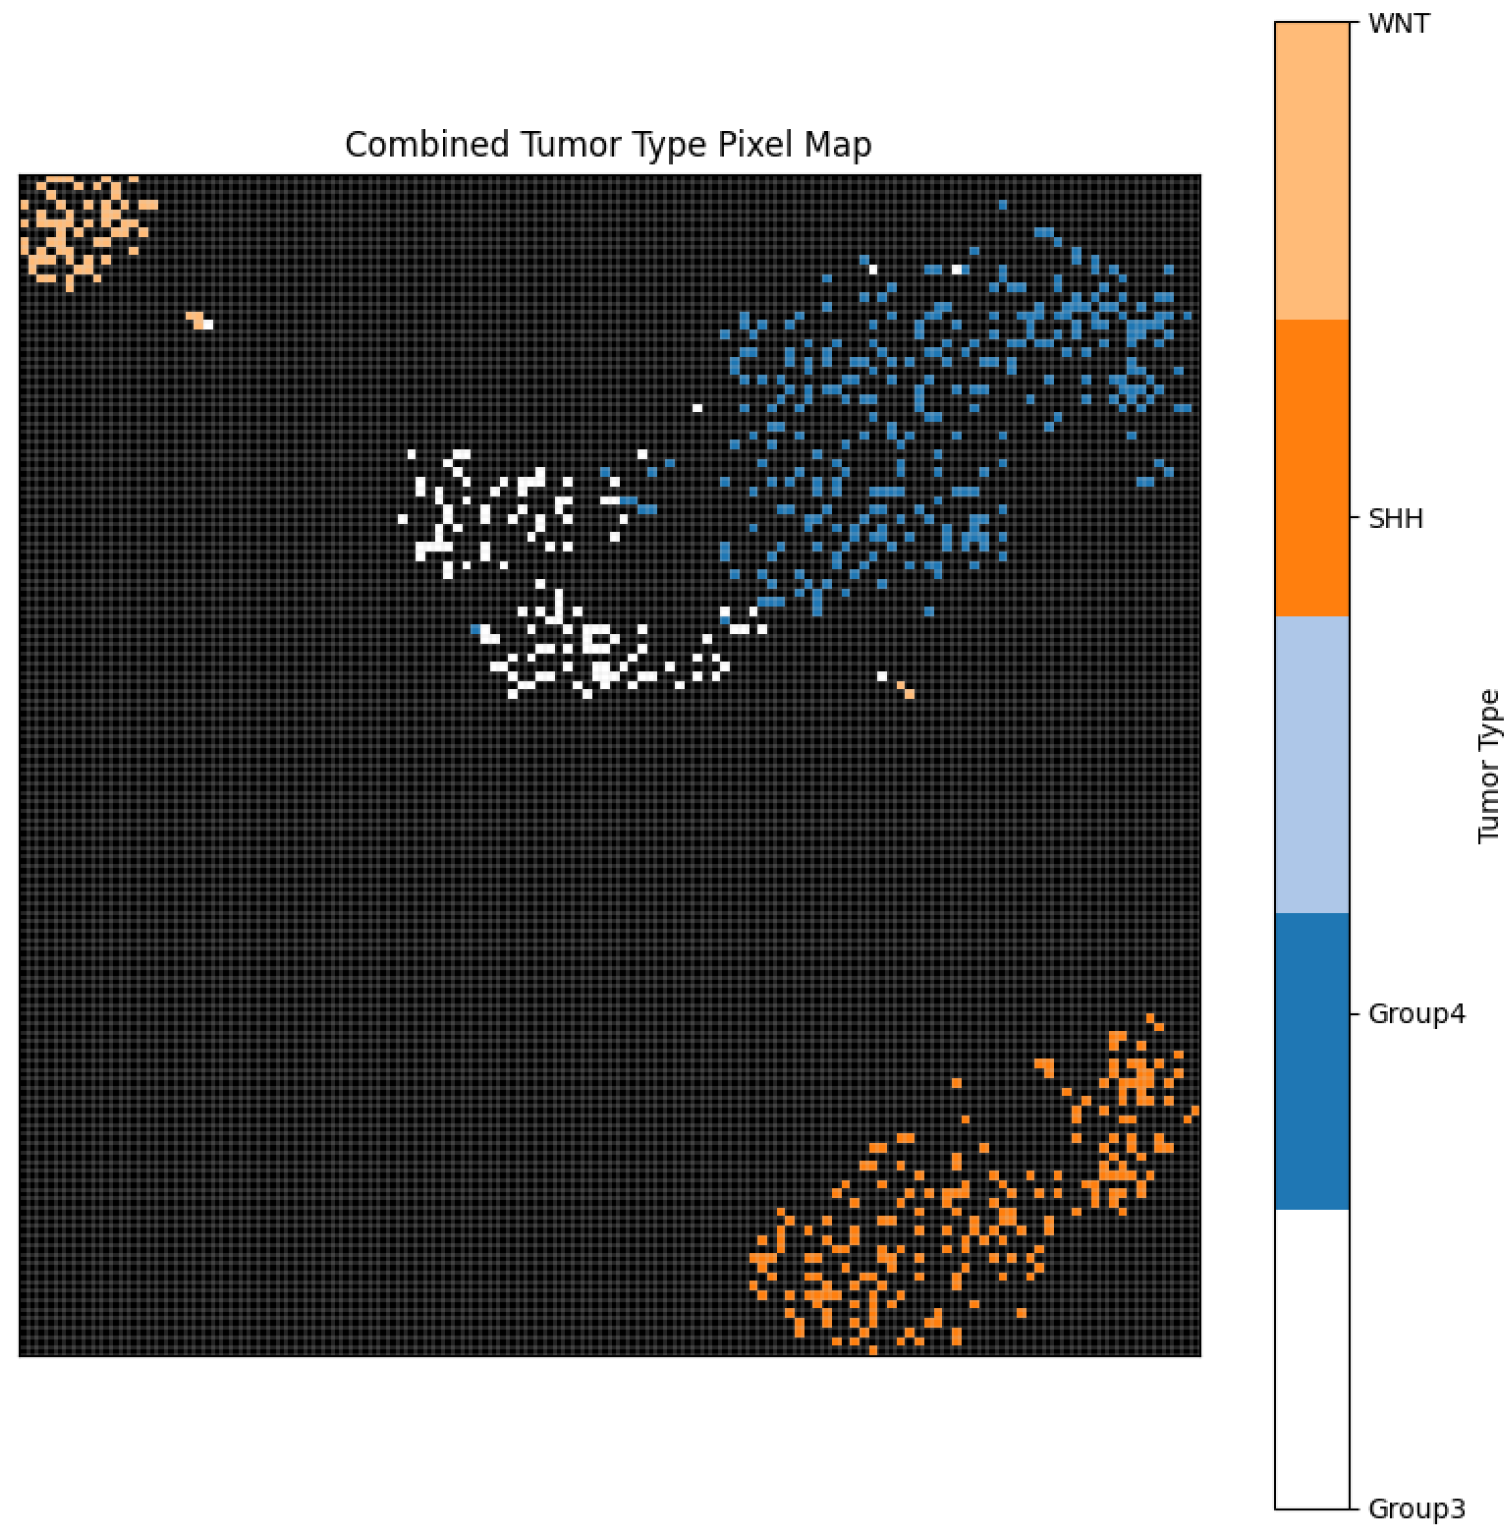
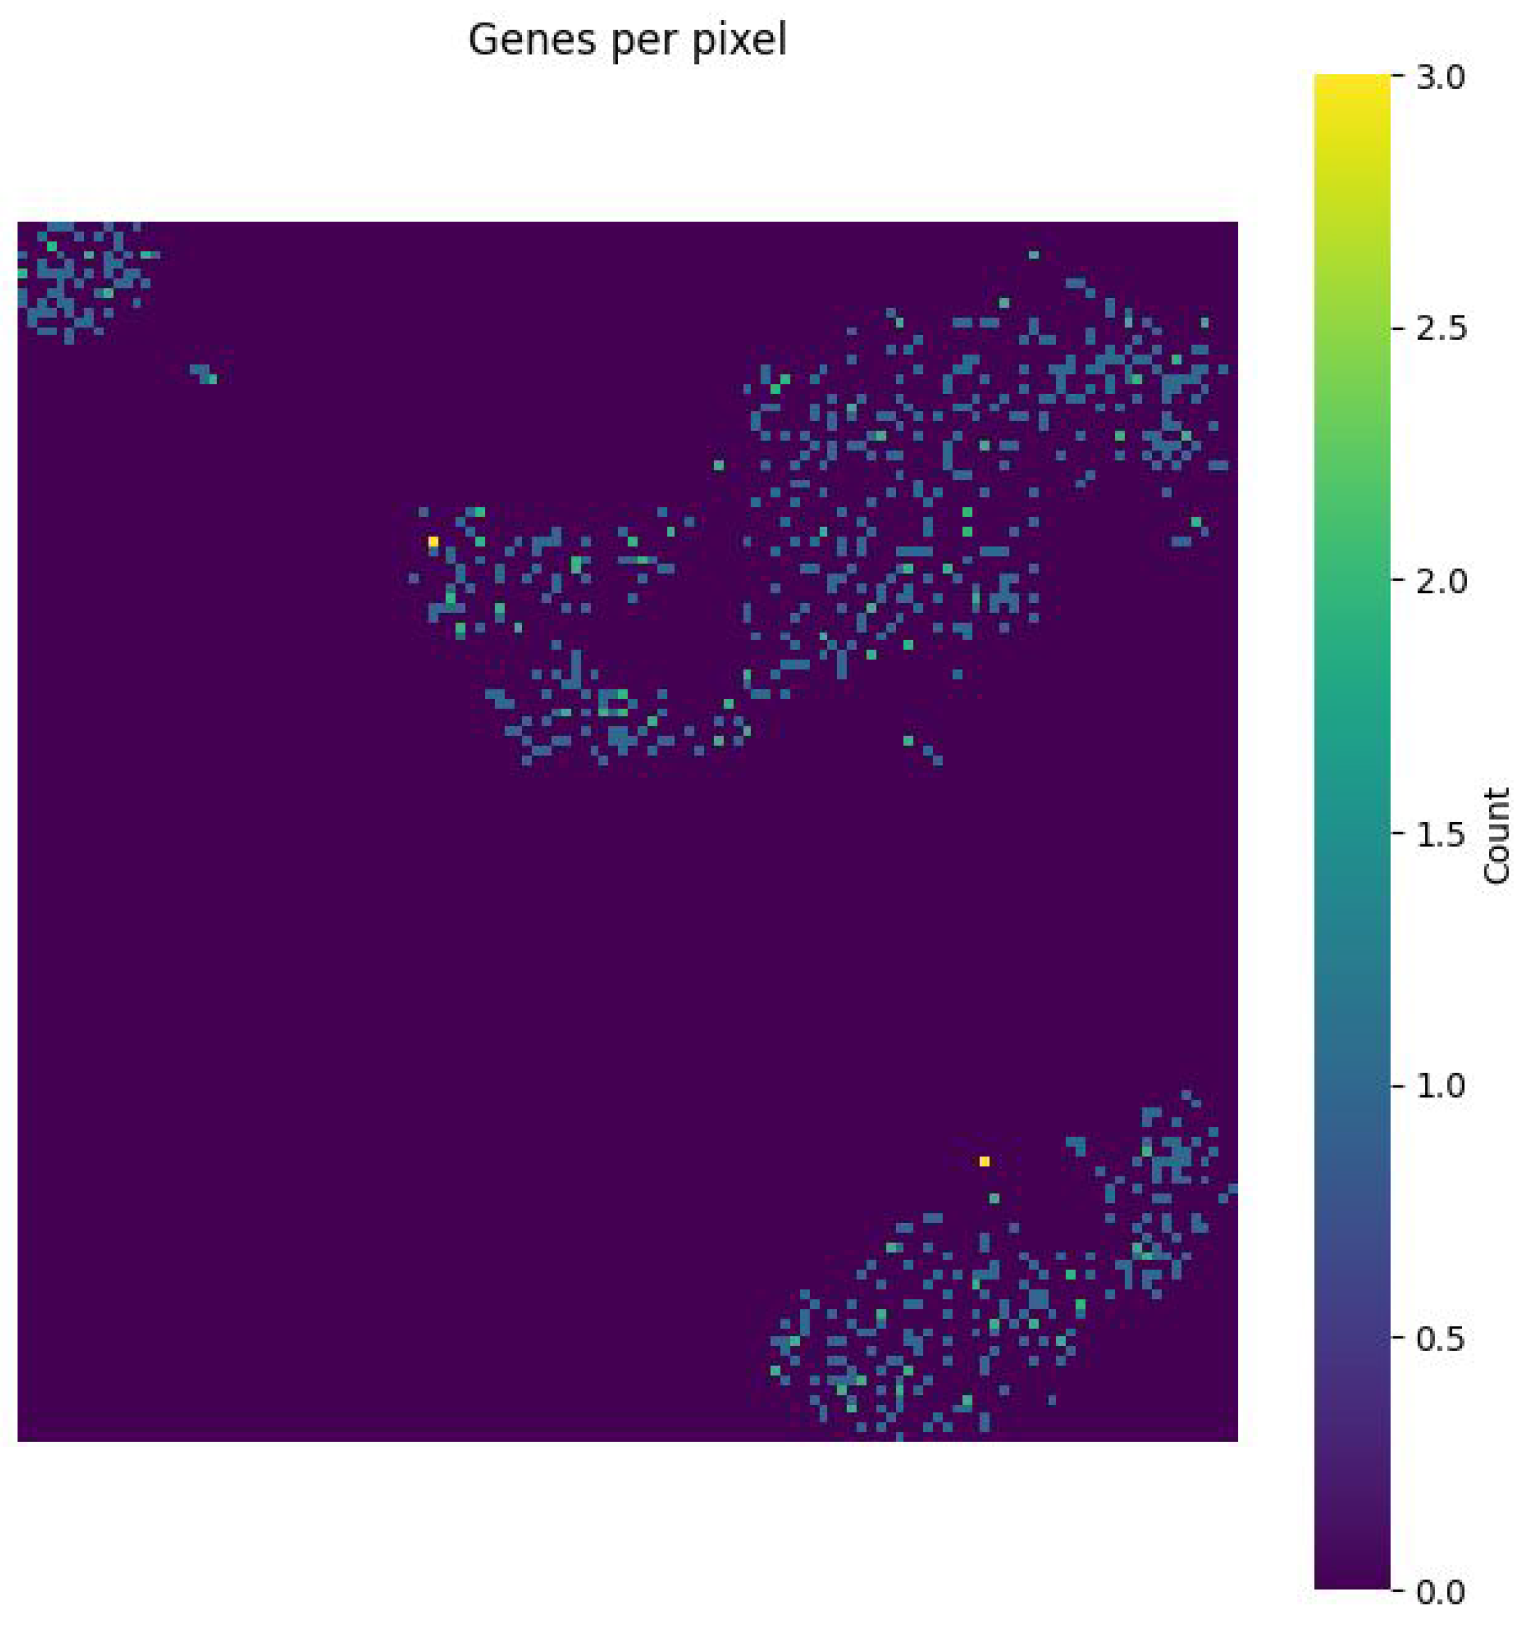
Figure 6 further demonstrates the effective separation of tumour subtypes through a unified pixel map, confirming the model’s ability to learn subtype-specific spatial features. Moreover,
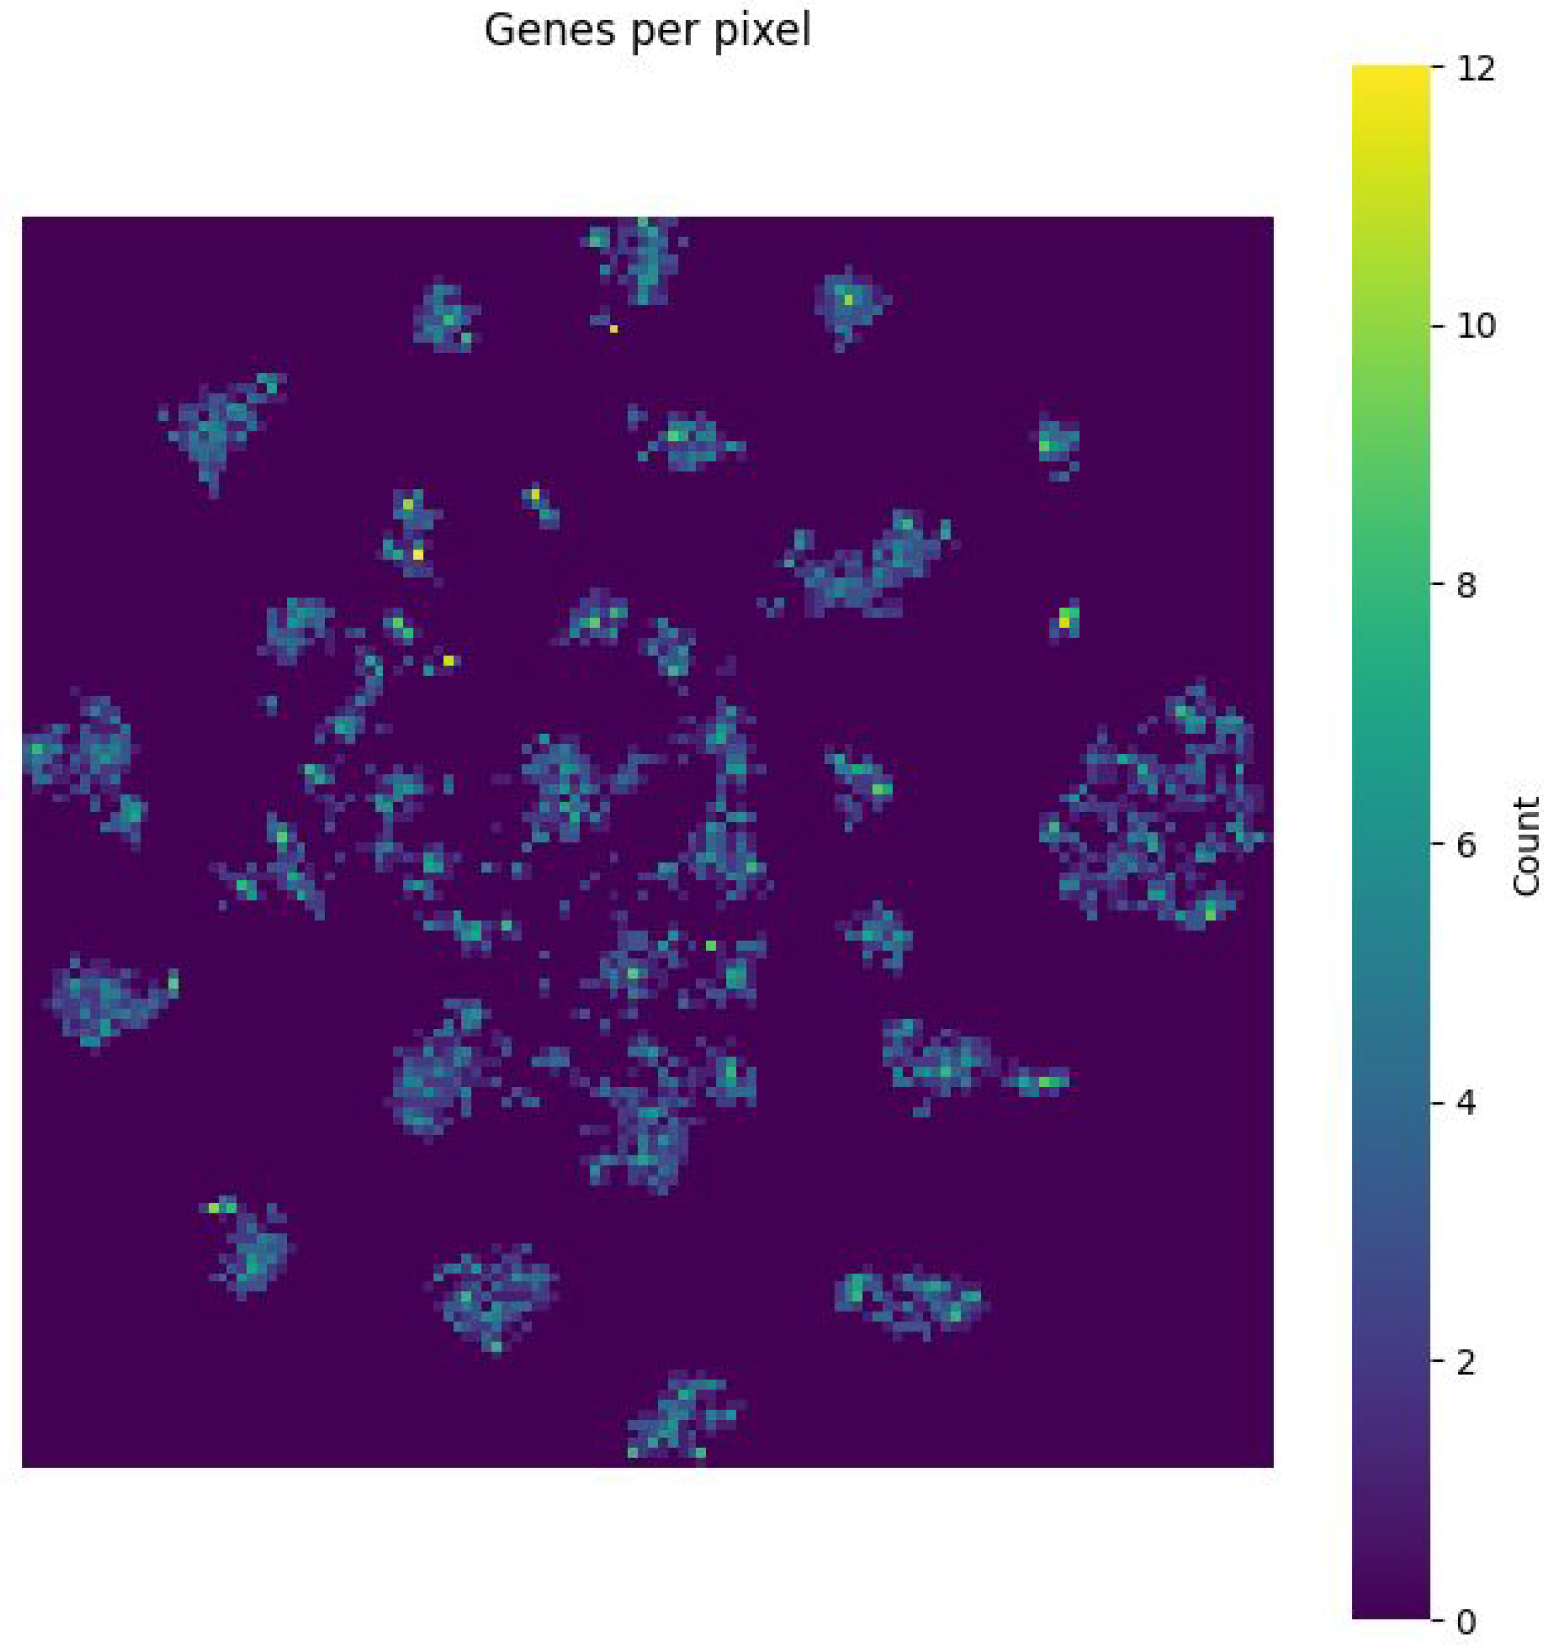
Figure 7 shows the gene density per pixel, indicating that highly salient areas correspond to biologically relevant gene clusters. Collectively, these visualisations validate the biological plausibility of the learned representations and support the interpretability of the saliency-guided CNN framework.
To improve the interpretability of the GSM3828672 dataset, detailed gene-level saliency annotations for selected tumour samples
Figure 8 identified high-impact genes, including LEMD1 (0.73), SERPINA3 (0.60), SNORD72 (0.92), and MIR3671 (0.61), demonstrating the model’s ability to extract biologically meaningful features from transcriptomic profiles.In
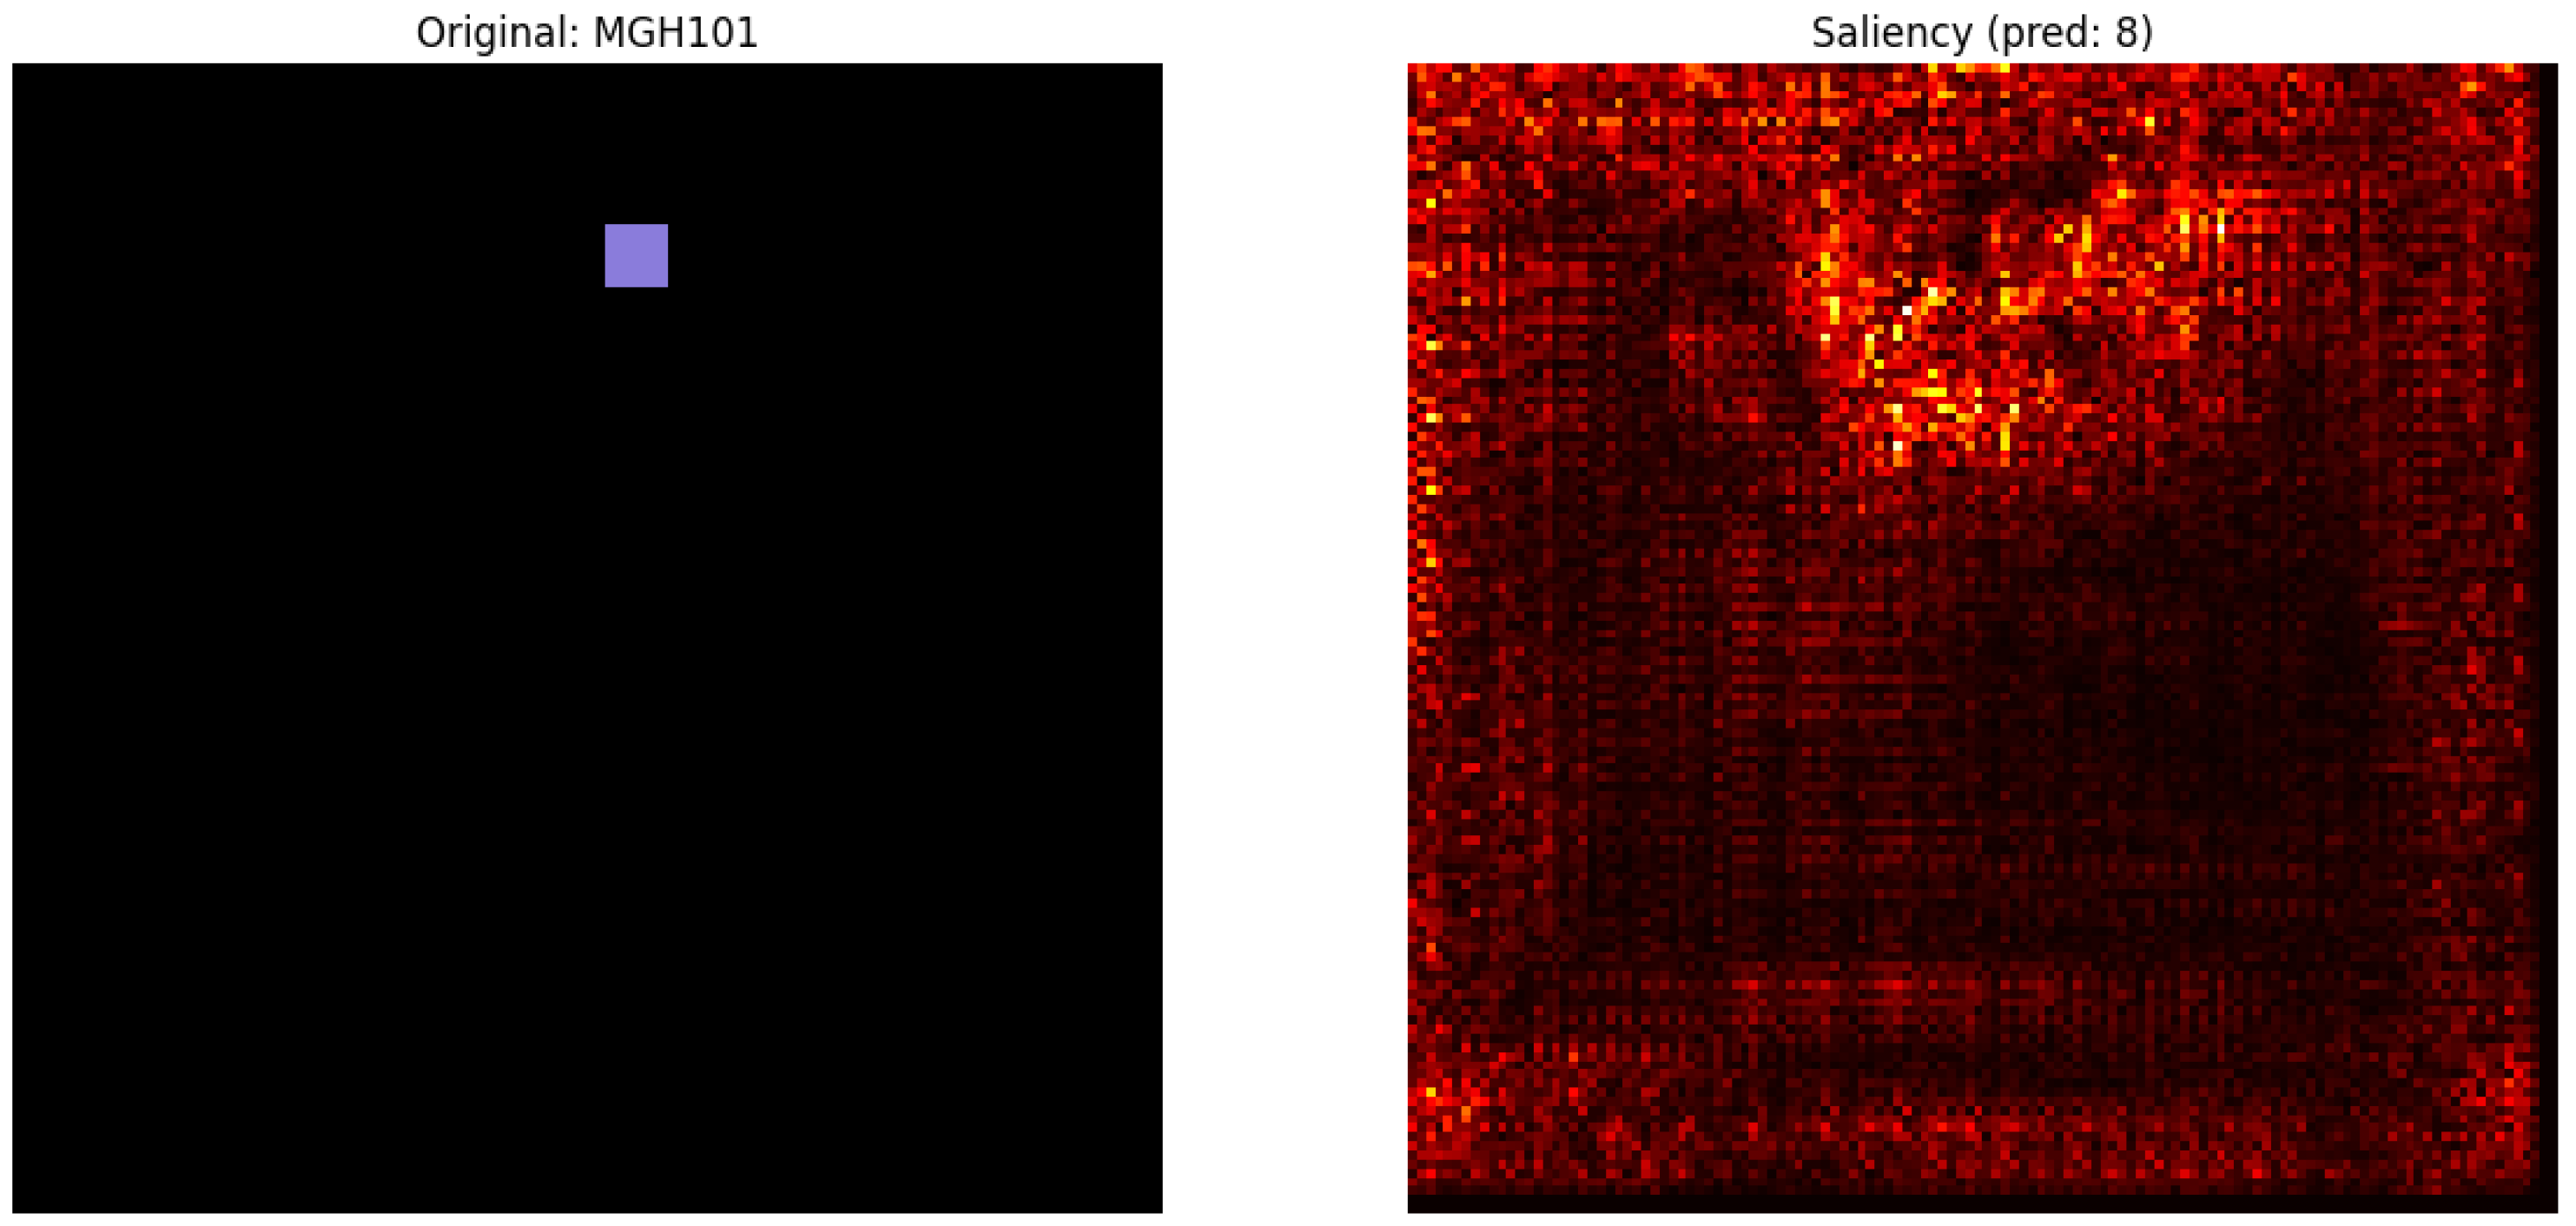
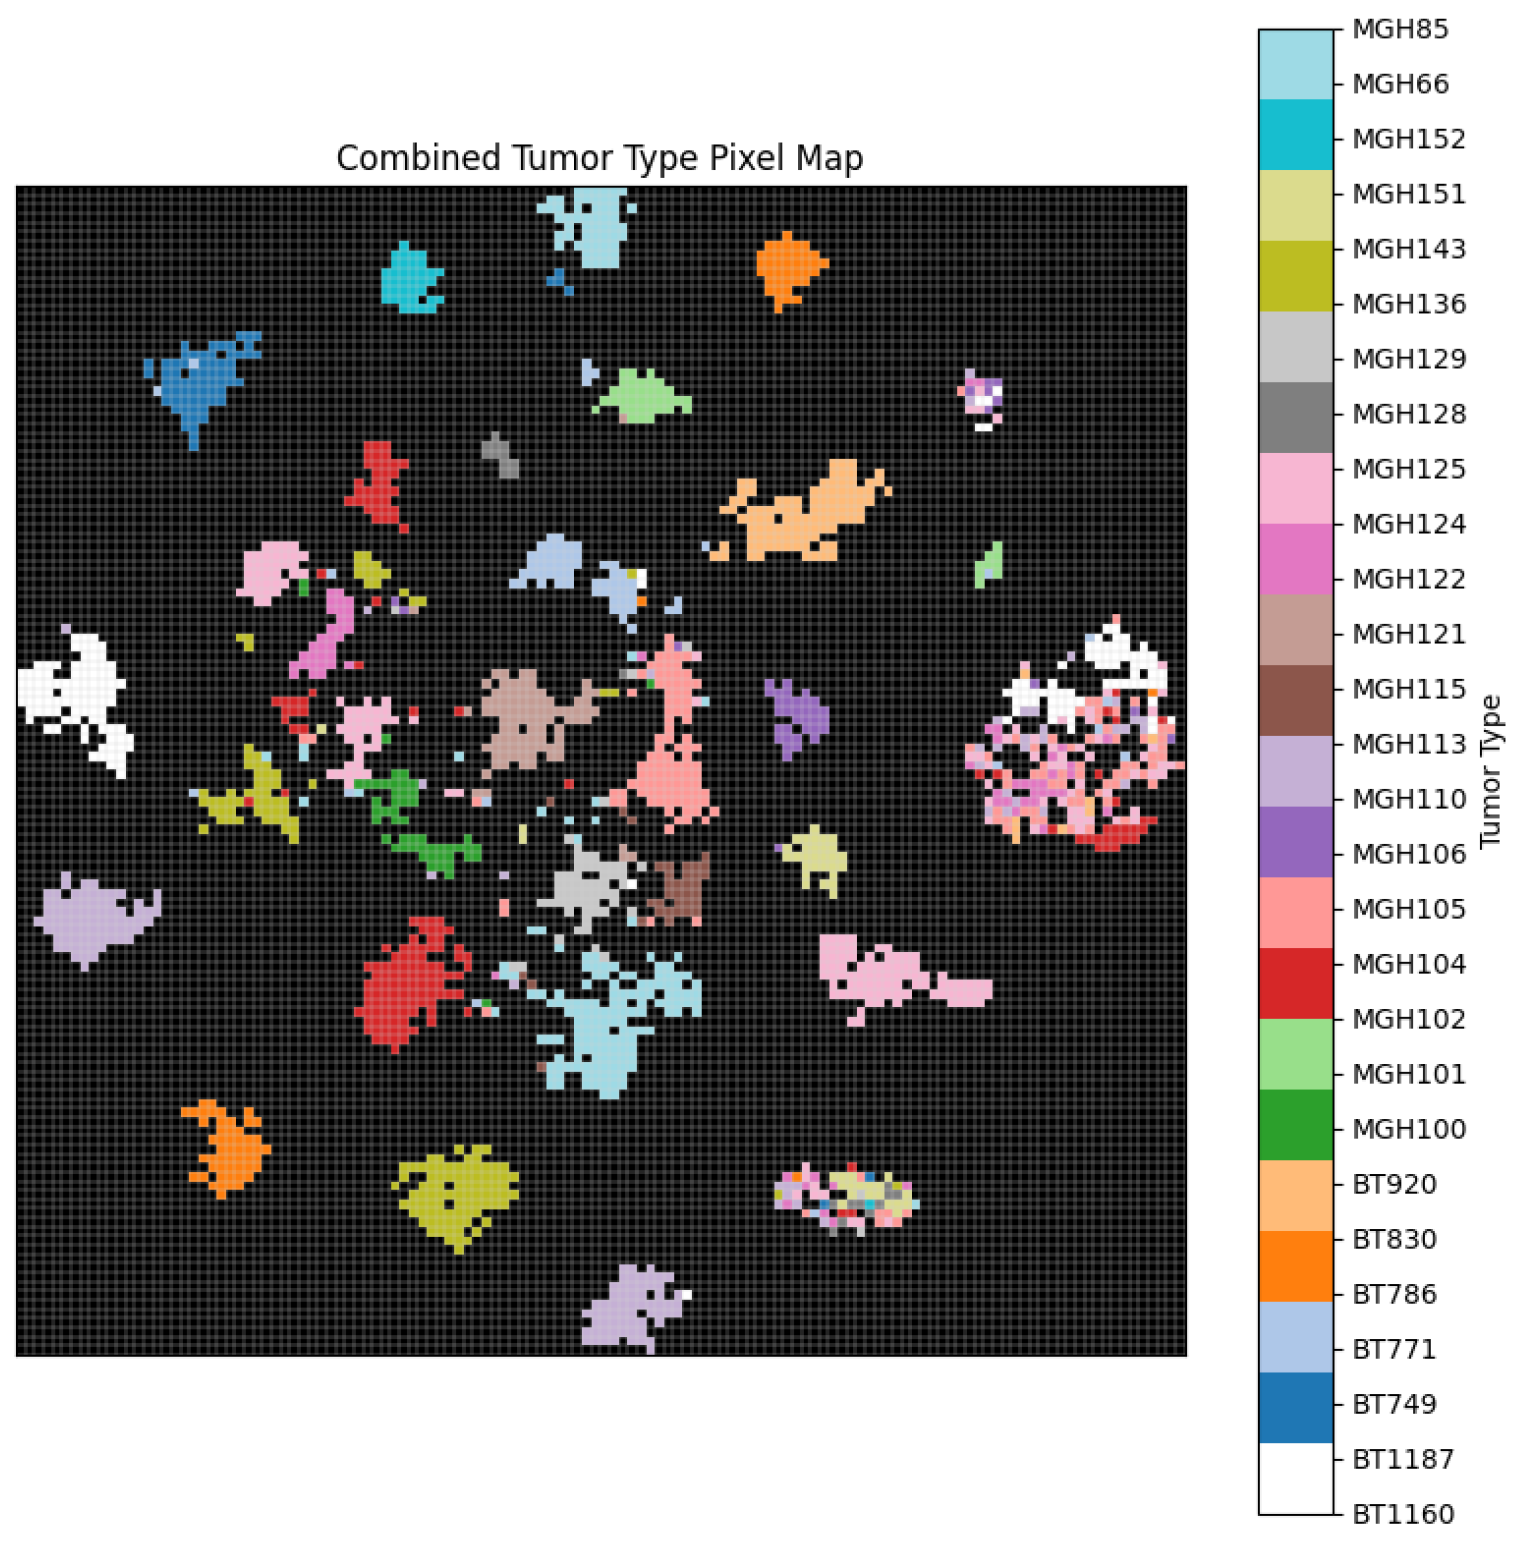
Figure 9, a purple box indicates a specific pixel region in the original image, potentially marking a spatial feature or annotated input. The saliency map (right) highlights regions with the greatest influence on the model’s prediction (class 8), showing spatial clustering that may correspond to cell type-specific profiles. Spatial clustering of cell type profiles
Figure 10 and the corresponding gene density distributions
Figure 11 depict biologically meaningful encodings that support the interpretability of the learned representations.
8. Discussion
This study presents a comparative benchmark of three image-based deep learning approaches: DeepInsight, Fotomics, and a saliency-guided CNN applied to transcriptomic data from two distinct brain tumour datasets, medulloblastoma GSE85217 and glioblastoma GSM3828672. The Results Section demonstrates that transforming gene expression profiles into RGB image representations significantly enhances classification performance, particularly when integrated with state-of-the-art CNN architectures such as ResNet-18 and EfficientNet-B0 [
19]. The saliency-guided CNN consistently produced competitive performance across both datasets, while uniquely offering model interpretability through gradient-based saliency maps. In the medulloblastoma dataset, the saliency-enhanced model achieved high classification accuracy and successfully identified spatial gene features relevant to tumour subtypes
Table 4. Similarly, for the GBM cell types classification experiment, the model maintained stable accuracy across folds while enabling class-specific insight into gene contributions (
Table 3). These results validate the potential of our pipeline to support both diagnostic precision and biological understanding. Compared to traditional approaches, the proposed pipeline benefits from its modular design, integrating dimensionality reduction, image transformation, and CNN classification while preserving statistical and biological structure. DeepInsight enables tabular data to be converted into spatially meaningful image formats using methods such as t-SNE, UMAP, and PCA [
7], while Fotomics captures frequency-based relationships via Fourier transforms [
8]. The RGB encoding further facilitates CNN feature extraction by incorporating complementary structural information. The inclusion of saliency maps provides interpretability by tracing prediction gradients back to input features, a critical requirement in AI healthcare [
9,
10].
To improve interpretability of the CNN model, a three-step process was employed to identify genes contributing to tumour classification. Gene expression features were first embedded into a 2D grid using PCA followed by t-SNE, enabling each gene to be mapped to a unique pixel location. The top 2000 highly variable genes were then selected for focused analysis. Saliency maps were subsequently generated using a trained ResNet-18 model, and genes with saliency scores
were annotated as high-impact contributors. This approach revealed biologically relevant genes in individual samples from the GSM3828672 dataset, including LEMD1, SERPINA3, SNORD72, and MIR3671, as well as subtype-specific markers in the GSE85217, such as CXCR4, TOP2A, CDK6, and WNT5A. Future directions include expanding this pipeline to integrate multi-omics modalities for methylation, proteomics, and spatial transcriptomics, where physical gene coordinates can complement virtual embeddings. Additionally, applying attention-based architectures such as vision transformers could further improve both accuracy and interpretability [
20]. Another promising avenue involves incorporating biological priors, such as pathway information or gene ontologies, into image layout strategies to enhance biological relevance.
Despite the strong performance and interpretability of the proposed framework, several limitations remain. The current pipeline relies on pre-defined dimensionality reduction techniques, which may introduce variability depending on parameter choices. Additionally, the transformation of transcriptomic data into images can obscure original gene–gene relationships if not properly preserved. Finally, while saliency maps provide valuable insights, they do not guarantee causal interpretability and may be sensitive to network architecture or input noise.
9. Conclusions
This study presented an image-based deep learning framework for the classification of brain tumour transcriptomic data, with a particular focus on medulloblastoma GSE85217 and glioblastoma GSM3828672. High-dimensional gene expression profiles were transformed into RGB image representations using dimensionality reduction techniques including PCA, UMAP, and t-SNE. This enabled the application of convolutional neural networks specifically ResNet-18 and EfficientNet for accurate classification of tumour subtypes and cell types.
Among the approaches evaluated, the proposed saliency-guided CNN demonstrated robust classification performance alongside improved interpretability through class-wise saliency maps. Comparative analyses with existing methods, such as DeepInsight and Fotomics, validated the effectiveness of the image-based approach while offering the additional advantage of visualising gene-level contributions to model predictions.
These findings underscore the promise of combining deep learning with omics imagification for developing interpretable, data-driven tools in cancer diagnostics. Future work will aim to incorporate biological priors, extend the framework to spatial and multi-omics datasets, and explore transformer-based architectures to enhance both predictive performance and biological insight.
