Abstract
Brain tumors are among the most lethal diseases, and early detection is crucial for improving patient outcomes. Currently, magnetic resonance imaging (MRI) is the most effective method for early brain tumor detection due to its superior imaging quality for soft tissues. However, manual analysis of brain MRI scans is prone to errors, largely influenced by the radiologists’ experience and fatigue. To address these challenges, computer-aided diagnosis (CAD) systems are more significant. These advanced computer vision techniques such as deep learning provide accurate predictions based on medical images, enhancing diagnostic precision and reliability. This paper presents a novel CAD framework for multi-class brain tumor classification. The framework employs six pre-trained deep learning models as the base and incorporates comprehensive data preprocessing and augmentation strategies to enhance computational efficiency. To address issues related to transparency and interpretability in deep learning models, Gradient-weighted Class Activation Mapping (Grad-CAM) is utilized to visualize the decision-making processes involved in tumor classification from MRI scans. Additionally, a user-friendly Brain Tumor Detection System has been developed using Streamlit, demonstrating its practical applicability in real-world settings and providing a valuable tool for clinicians. All simulation results are derived from a public benchmark dataset, showing that the proposed framework achieves state-of-the-art performance, with accuracy approaching 99% in ResNet-50, Xception, and InceptionV3 models.
1. Introduction
A brain tumor arises from the proliferation of abnormal cells within the brain, which can lead to damage to critical brain tissues and potentially progress to cancer [1]. According to the American Cancer Society, an estimated 24,810 people are projected to be diagnosed with malignant brain tumors in 2024, with 18,990 expected to die from the disease [2]. There are approximately 150 different types of brain tumors in humans, broadly classified into benign and malignant tumors [3]. Benign tumors grow slowly and do not spread to other tissues, posing less immediate danger compared to their malignant counterparts, which are aggressive and can spread rapidly [4]. Among malignant brain tumors, the most common types include Gliomas, Meningiomas, and Pituitary tumors [5]. Gliomas originate from glial cells in the brain and are particularly destructive due to their rapid growth. Meningiomas develop on the protective membranes covering the brain and spinal cord, often leading to significant neurological symptoms as they expand [6]. Although typically benign, Pituitary tumors arise in the Pituitary gland, which is crucial for hormone production and can still cause severe health issues due to hormone imbalances and pressure effects on nearby brain structures.
Magnetic resonance imaging (MRI) is the leading method used in clinical settings for detecting brain tumors due to its ability to produce high-resolution images of soft tissues [7]. However, the manual analysis of brain MRIs requires extensive expertise and experience, presenting inevitable challenges in avoiding misdiagnoses [8]. In recent years, the importance of intelligent healthcare has grown significantly, driven by substantial advancements in computer vision and natural language processing [9]. Computer-aided diagnosis (CAD) systems exemplify this progress by offering swift and precise medical image analysis, yielding consistent and reproducible results. These systems are highly beneficial in the early and accurate diagnosis of brain tumors, crucial for optimizing treatment outcomes [10].
By integrating deep learning with human expertise, the application of deep learning in radiology enhances the capabilities of radiologists [11]. Accurate detection is crucial for effective brain tumor treatment, and deep learning models offer a significant advantage in expediting this process [12]. Despite its invasiveness and associated health risks, biopsy remains the most precise method for identifying specific tumor types. Non-invasive MRI-based techniques are increasingly reliable alternatives being developed. Machine learning algorithms utilize MRI data to differentiate between various types of brain tumors. Convolutional Neural Networks (CNNs) and their variants, such as Inception, Xception, MobileNet, and EfficientNet, have effectively classified brain tumors using MRI data [13].
However, employing deep learning techniques for brain tumor classification poses several challenges. Firstly, the computational cost of deep CNNs is substantial due to their large number of parameters, often requiring long training times even with advanced hardware [14]. Another significant challenge is the availability of data [15]. Deep CNN models thrive on extensive labeled datasets [16,17], yet medical image labeling demands specialized expertise, resulting in smaller datasets than standard computer vision tasks. This scarcity of data can lead to overfitting when training deep CNNs on limited datasets. Lastly, the morphological variability, complex tumor appearances in images, and irregular lighting conditions pose additional challenges. Addressing these complexities requires effective techniques for brain tumor classification to support radiologists in making informed decisions [18].
To address these challenges, this paper establishes a robust framework for the multi-class classification of brain tumors using MRI scans, leveraging deep learning and transfer learning techniques. The main contributions of this paper are outlined as follows:
- Established an efficient framework for multi-class brain tumor classification. This framework is based on MRI scans and is designed to improve the accuracy and efficiency of diagnosing different types of brain tumors.
- Developed and optimized multiple deep learning models. These models leverage transfer learning, specifically fine-tuned for the Brain Tumor MRI Dataset, to utilize pre-trained models for superior classification performance.
- Designed a Grad-CAM-based interpretability method. This method is used to visualize decision pathways within deep learning models when predicting tumor types, enhancing the understanding and trust in the model’s decision-making process.
- Engineered a practical Brain Tumor Detection System with Streamlit, emphasizing improved user interaction and accessibility in medical diagnostics.
The remainder of this paper is organized as follows: Section 2 provides a comprehensive review of brain tumor diagnosis and treatment research. Section 3 outlines the workflow of the proposed framework for brain tumor diagnosis, detailing the Brain Tumor MRI Dataset, data partitioning, and image augmentation techniques. Section 4 discusses the models’ architecture, transfer learning methods, and optimization strategies tailored specifically to the Brain Tumor MRI Dataset. Section 5 presents the experimental setup, results, visualization of decision pathways, real-world application, and comparisons with state-of-the-art methods. Finally, Section 12 summarizes the findings and suggests future research directions.
2. Literature Review
Brain tumors exhibit significant variability in type and severity, influenced by factors such as their location, size, and malignancy [19]. A comprehensive understanding of these classifications is essential for developing effective treatment strategies and advancing research in this field. This section provides a concise overview of recent advancements in brain tumor classification using MRIs. Table 1 presents a comparative study of brain tumor classification methods, highlighting selected recent studies. The table summarizes the models employed, datasets (including database size and image types), types of classification tasks, and the specific challenges addressed in each paper. This comparative analysis aims to provide insights into current methodologies and their implications for improving diagnostic accuracy and patient care.
Rajput et al. [13] (2024) introduced a diagnostic approach utilizing pre-trained CNN models such as VGG19, InceptionV3, and ResNet-50 via transfer learning. These models extracted features from MRI scans and were fine-tuned through fully connected layers for multi-class tumor classification, achieving an average accuracy of 90%. However, a significant limitation of their approach is the allocation of only 10% of the data for testing, which can significantly compromise the testing process by not providing a representative sample of the overall population. Additionally, prior knowledge about the test data can introduce bias, affecting the evaluation’s integrity and undermining the method’s generalizability.
Wang et al. [20] (2024) presented RanMerFormer, a novel method for brain tumor classification. This framework utilizes a pre-trained vision transformer as its core model, incorporating a merging mechanism to enhance computational efficiency by reducing redundant tokens. Additionally, a randomized vector functional link facilitates rapid model training. The evaluation of two public benchmark datasets showcased RanMerFormer’s state-of-the-art performance, indicating promising applications in real-world brain tumor diagnosis. Nonetheless, the method is critiqued for its high computational requirements and system complexity.
Mehnatkesh et al. [21] (2023) proposed an advanced framework integrating deep learning with evolutionary algorithms for brain tumor classification. Their approach focuses on automatically designing efficient ResNet architectures using an optimization-based strategy known as IACO-ResNet. This method optimizes both model architecture and hyperparameters using differential evolution and multi-population operators to balance solution diversity and convergence speed. A drawback noted is the time-consuming nature of the optimization process.
Zhu et al. [22] (2023) introduced RBEBT, a novel model utilizing a fine-tuned ResNet-18 for feature extraction from brain tumor images. Unlike traditional CNNs, RBEBT employs a randomized neural network for classification, optimized via the bat algorithm (BA). However, criticism includes the lack of comparative analysis and the model’s restriction to binary classification tasks.
Asif et al. [23] (2023) proposed a transfer learning model for multi-class brain tumor classification using MRIs. They leveraged popular architectures such as Xception, DenseNet201, DenseNet121, ResNet152V2, and InceptionResNetV2, augmented with a dense block and softmax layer to enhance accuracy. Their study evaluated the model through experiments on three-class and four-class classifications, demonstrating its effectiveness. However, using single protocol T1W MRI data limits the model’s generalizability.
Sharma et al. [24] (2023) introduced a brain tumor detection method based on transfer learning ResNet-50. Their approach involved modifying the ResNet-50 architecture by removing its final layer and incorporating additional layers tailored to the specific task requirements. Performance evaluation indicated improved accuracy in brain cancer categorization. Challenges included the lack of dataset availability and a focus on binary classification tasks.
Kumar et al. [25] (2023) presented a novel Convolutional Neural Network for classifying brain tumors in MRI scans as benign or malignant using transfer learning. Their study compared their proposed model with several existing pre-trained networks, highlighting its potential. However, a drawback cited was the limited size of the dataset used for training and evaluation.

Table 1.
A comparative study of brain tumor classification methods.
Table 1.
A comparative study of brain tumor classification methods.
| Author(s) and Year | Models | Dataset (DS) | Classes of Tumors | Total Images | Classification Type | Drawback |
|---|---|---|---|---|---|---|
| Rajput et al., 2024 [13] | VGG19, InceptionV3, ResNet-50 | Brain tumor MRI dataset | Glioma, Meningioma, Pituitary, and No-tumor | 7023 | Multi-class | Small test set and potential bias from test data knowledge |
| Wang et al., 2024 [20] | RanMerFormer | Brain tumor MRI dataset, Figshare dataset | DS1: Glioma, Meningioma, Pituitary, and No-tumor DS2: Glioma, Meningioma, and Pituitary | DS1: 7023 DS2: 3064 | Multi-class | High computational time, system complexity |
| Mehnatkesh et al., 2023 [21] | IACO-ResNet | Figshare dataset | Glioma, Meningioma, and Pituitary | 3064 | Multi-class | Time-consuming |
| Zhu et al., 2023 [22] | RBEBT | Harvard Medical School website | Normal brain, Cerebrovascular disease, Neoplastic disease, Degenerative disease, and Infectious disease | Not described | Binary | Lack of comparative analysis |
| Asif et al., 2023 [23] | Xception | Brain Tumor Classification (MRI), Figshare dataset | DS1: Glioma, Meningioma, Pituitary, and No-tumor DS2: Glioma, Meningioma, and Pituitary | DS1: 3264 DS2: 3064 | Multi-class | Used single protocol T1W MRI data |
| Sharma et al., 2023 [24] | ResNet-50 | Kaggle dataset | Benign, Malignant | Not described | Binary | Unavailable dataset |
| Kumar et al., 2023 [25] | ResNet-50 | BMIBT dataset | Benign, Malignant | 159 | Binary | Small dataset |
This study presents a robust computer-aided diagnosis (CAD) framework for Brain Tumor Classification. Based on their location, the model distinguishes between benign and malignant tumors and classifies them into specific types, such as Glioma, Meningioma, and Pituitary tumors. To address the challenge of limited brain tumor MRI datasets for training, the comprehensive Brain Tumor MRI Dataset [26] was utilized, aggregating images from Figshare, the SARTAJ dataset, and the Br35H dataset, totaling 7023 images—currently the largest dataset available for such research.
Gradient-weighted Class Activation Mapping (Grad-CAM) was also employed innovatively to visualize decision pathways within deep learning models, enhancing interpretability and transparency in model decision-making, which are often overlooked aspects in prior studies. Additionally, a practical brain tumor diagnosis system was developed using Streamlit, demonstrating its applicability in real-world settings. This system aims to facilitate seamless engagement with medical professionals and enhance the integration of deep learning technologies into clinical workflows. Additionally, comparative evaluations with other models using the same datasets were conducted, addressing a gap in the current literature where such comparative analyses are frequently absent.
3. Proposed Framework
The proposed framework is depicted in Figure 1, illustrating an abstract representation of the various steps for brain tumor classification using MRI scans. The methodology encompasses several essential steps: Firstly, the Brain Tumor MRI Dataset, containing Meningioma, Glioma, and Pituitary MRI scans, was obtained from freely accessible sources. Subsequently, rigorous image preprocessing operations were applied to enhance data quality. Following this, the dataset underwent random partitioning into training, testing, and validation sets, with exclusive application of image augmentation techniques to augment the training images.
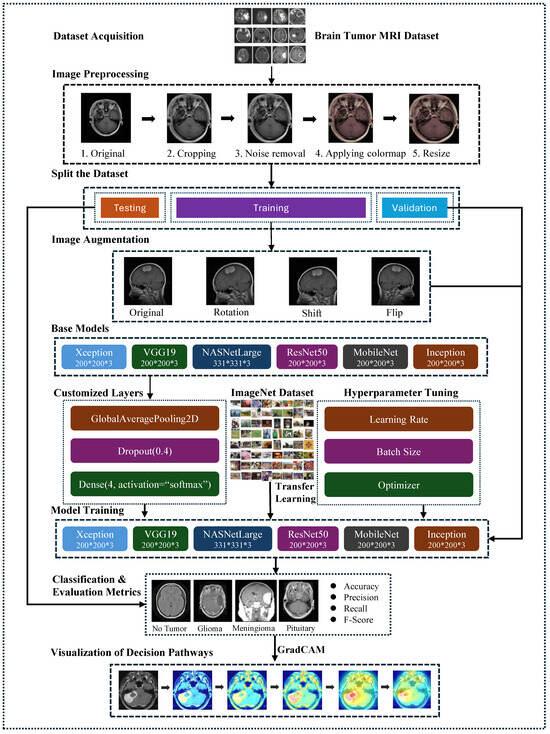
Figure 1.
The structure of the proposed framework for brain tumor classification.
Next, this study employed six fine-tuned pre-trained models: VGG19, ResNet-50, Xception, MobileNetV2, InceptionV3, and NASNetLarge. These models were chosen to evaluate their efficacy in classifying various types of brain tumors. The CNN architectures were initialized with pre-trained layers, and the final layers were adapted to accommodate the specific image classes (Meningioma, Pituitary, and Glioma). The performance of the proposed framework was assessed using standard metrics, including overall accuracy, specificity, sensitivity, F1-score, and confusion matrix.
To enhance transparency and interpretability in the prediction process, Grad-CAM was utilized to visualize the decision pathways of the models. This technique provided insights into how the models made predictions based on MRI scans of brain tumors.
3.1. The Brain Tumor MRI Dataset
The Kaggle-sourced brain tumor MRI dataset represents an extensive resource, encompassing 7023 MRI scans. These images are classified into one of four categories: Glioma tumors, Meningioma tumors, Pituitary tumors, and images where no tumor is present [26]. This classification structure is visually depicted in Figure 2, offering a clear overview of the dataset’s composition. The dataset integrates images from Figshare, the SARTAJ, and the Br35H datasets, ensuring a robust variety of MRI scans. The dataset is partitioned into training and testing subsets. The training set comprises 1457 Pituitary, 1339 Meningioma, 1321 Glioma, and 1595 No-tumor images. Meanwhile, the testing set includes 300 Pituitary, 306 Meningioma, 300 Glioma, and 405 No-tumor images.

Figure 2.
Overview of the brain tumor MRI dataset.
3.2. Preprocessing Techniques for the Brain Tumor MRI Dataset
Effective image preprocessing is crucial in enhancing the performance of deep learning models, particularly in medical imaging tasks. This study systematically applied several preprocessing techniques to the Brain Tumor MRI Dataset to prepare the images for training and improve model accuracy. The preprocessing steps include image cropping, noise removal, colormap application, and resizing. Each step plays a significant role in refining the images, ensuring that the learning algorithms can focus on the most relevant features and standardizing the dataset for consistent input into the model.
3.2.1. Cropping the Images
The first step in preprocessing involves cropping the images. This step is crucial for eliminating unwanted background noise that may be present in the raw MRI scans. Background noise can include non-brain structures or artifacts that are irrelevant for tumor detection. By cropping the images, the algorithm focuses solely on the brain region where tumors are located, enhancing the accuracy of feature extraction. This isolation of the region of interest (ROI) ensures that the model is not distracted by irrelevant parts of the image, thereby improving the quality of the input data for the learning model.
Figure 3 illustrates the process of cropping a brain tumor MRI scan through four distinct steps:

Figure 3.
The cropping process of MRI scans.
- Step 1: Obtain the Original Image. The first image displays the initial MRI scan, capturing the entire head, including the brain and surrounding tissues.
- Step 2: Find the Biggest Contour. In the second image, the largest contour (blue outline) is detected around the brain area, highlighting the primary object of interest.
- Step 3: Find the Extreme Points. The third image indicates the extreme points (red, blue, green, and yellow dots) located on the edges of the brain, which are used for cropping purposes.
- Step 4: Crop the Image. The final image shows a cropped MRI, focusing solely on the brain region and excluding extraneous areas like hair and skin. This step results in a concentrated view of the brain, facilitating subsequent processing and analysis tasks for brain tumor detection and classification.
3.2.2. Noise Removal
After cropping, noise removal is performed using a bilateral filter. The bilateral filter is particularly effective for MRI scans because it smooths the image while preserving edges and fine details [27]. Unlike other filters that might blur important structures along with noise, the bilateral filter considers spatial distance and intensity similarity between pixels. This dual consideration allows the filter to reduce noise while maintaining the integrity of the edges, which are crucial for identifying tumor boundaries. This step is important because MRI scans can be acquired using different imaging protocols and parameters, leading to varying noise levels. The bilateral filter ensures a consistent, high-quality image by minimizing noise without losing important structural details.
3.2.3. Applying Colormap
The next step involves applying a colormap to the images. Colormap application enhances the interpretability of MRI scans by improving the contrast between different tissues or structures within the brain. In grayscale MRI scans, subtle differences in tissue density or type may not be easily distinguishable. A colormap can accentuate these differences, aiding human observers and algorithms in detecting and classifying abnormalities. By mapping pixel intensity values to colors, the colormap adds information highlighting critical features, such as the distinction between tumor and non-tumor areas. This step is crucial in medical imaging, where clear visualization of anatomical structures is essential for accurate diagnosis.
3.2.4. Resize
The final preprocessing step is resizing the images, which is essential for standardizing the input size of the images fed into the learning model. Deep learning models, particularly deep CNNs, require input images of a fixed size [28]. Resizing ensures that all images in the dataset conform to this required size, facilitating consistent processing and analysis. Standardizing the image size also reduces computational complexity and memory usage, enabling more efficient model training. During resizing, care is taken to preserve the aspect ratio of the images to avoid distortion, which could result in the loss of important features. In this experiment, the images were resized to pixels, except for NASNetLarge, which required an input size of pixels.
After all those techniques, the brain tumor MRI scans are obtained as depicted in Figure 4. These preprocessing steps systematically refine the images, ensuring that relevant features can be effectively focused on by the deep learning model. Unnecessary areas are removed through cropping; clarity is enhanced by noise removal; visual representation is standardized by applying a consistent colormap, and uniform input dimensions are ensured by resizing. This process aims to optimize the dataset for improved model accuracy in medical imaging tasks.
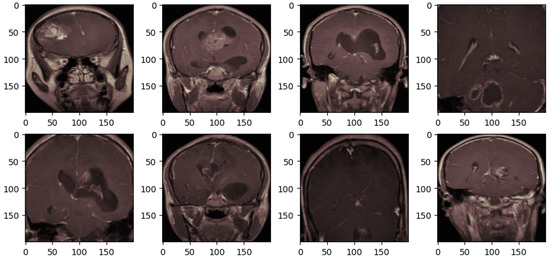
Figure 4.
The brain tumor MRI after preprocessing.
3.3. Data Partitioning: Training, Validation, and Testing Sets
Splitting the dataset into distinct subsets for training, testing, and validation is a critical step in ensuring the robustness and generalization of the model [29]. In this study, the dataset was partitioned into three subsets: training, validation, and testing, as depicted in Table 2.

Table 2.
The details and distribution of datasets.
The training subset, encompassing a substantial 5712 images, is pivotal for the model to learn a broad spectrum of brain tumor variations. To further enhance the model’s adaptability and mitigate overfitting, a subset—constituting 20% or 1143 images of the initial training data—is designated as the validation set. This serves as an intermediary checkpoint, allowing for the tuning of hyperparameters. It ensures that the model does not merely memorize the training data but develops an understanding that is transferable to novel instances. With the validation process iterating upon a subset, the remaining 4569 images within the training dataset continue to refine the model’s learning, reinforcing its capacity to generalize across various cases.
In parallel, a distinct testing set comprising 1311 images remains entirely isolated throughout the model’s development and training phases. Acting as the litmus test for the model’s efficacy, this unseen dataset offers an impartial benchmark for assessing the model’s proficiency in accurately categorizing brain tumor images into predefined classes. Thus, the model’s performance on this test set serves as a critical indicator of its potential in real-world applications, where its ability to handle previously unseen data is essential.
3.4. Image Augmentation
Medical image datasets are critically important yet inherently challenging due to several key factors. Accurate labeling demands specialized expertise, as errors during annotation can significantly impact model training and predictive accuracy. Moreover, stringent data security measures are essential due to the sensitive nature of health information, limiting dataset sharing and complicating the acquisition of adequate training data. Ethical and legal considerations, including compliance with regulations like the Health Insurance Portability and Accountability Act of 1996 (HIPAA), further complicate data handling and access protocols, underscoring the complexity of managing medical image datasets.
Given these challenges, the limited size of medical image datasets poses a significant hurdle. Effective utilization of image augmentation techniques becomes pivotal to overcome this limitation [30]. ImageDataGenerator, provided by Keras, is a crucial tool for augmenting datasets in real-time [31]. By applying diverse transformations such as rotations, shifts, and flips to each image, this approach effectively expands the training dataset. Such augmentation not only enhances model generalization but also helps mitigate overfitting, especially when dealing with sparse training data. These techniques play an instrumental role in improving the robustness and performance of machine learning models trained on medical image datasets.
As depicted in Figure 5, a comparison of four sets of brain tumor MRI scans before and after image augmentation is illustrated. The first row displays a random selection of four images from the training set that have undergone preprocessing, as shown in Figure 4. The second row presents the same images after applying image augmentation.
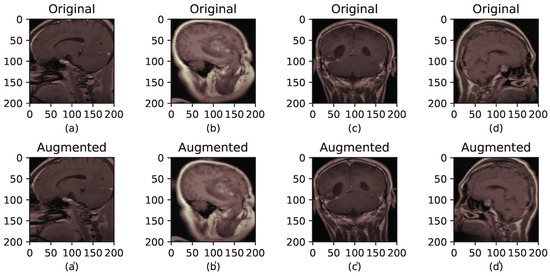
Figure 5.
The brain tumor MRI before and after augmentation. (a–d) correspond to the original images, while (a′–d′) correspond to their augmented versions.
The experimental configuration included parameters: rotation_range = 10, width_shift_ range = 0.05, height_shift_range = 0.05, and horizontal_flip = True. The rotation_range controls the random angle range for rotation applied to each image. Meanwhile, width_shift_range and height_shift_range determine the images’ random horizontal and vertical shifts, respectively. The horizontal_flip parameter decides whether each image is randomly flipped horizontally, with a 50% probability.
It is crucial to emphasize that operations specified in ImageDataGenerator, such as rotation, shift, and flip, are randomly applied to each image. Therefore, each batch of generated images may exhibit variations. This stochastic process enhances the diversity of the training dataset, thereby strengthening the model’s ability to generalize effectively.
4. Deep Learning Models: Design and Implementation
4.1. Convolutional Neural Networks (CNNs)
CNNs represent a pivotal deep learning architecture extensively applied in image classification tasks, adept at automatically discerning patterns from raw image data with minimal preprocessing. Over time, CNNs have advanced significantly, leveraging sophisticated techniques such as transfer learning through fine-tuning and layer freezing, which have markedly elevated their performance beyond traditional machine learning models [32]. Fundamentally, a CNN comprises three essential types of layers, each fulfilling distinct roles within the network structure:
- Convolutional Layer: This applies various kernels to convolve across input images or intermediate feature maps, generating diverse feature maps that capture different facets of the input data’s spatial hierarchy.
- Pooling Layer: Typically situated post-convolutional layers serve to downsample feature maps, effectively reducing spatial dimensions and network parameters. Common implementations include max-pooling and average-pooling functions, pivotal for aggregating information while retaining critical features.
- Fully Connected Layer: It integrates network outputs into a vector of predefined size, typically serving as the final step for classification tasks. However, its extensive parameterization necessitates substantial computational resources during training.
Many adaptations and refinements have been introduced to customize the original architecture of CNNs, aiming to achieve specialized learning outcomes and enhance performance. These modifications have led to the development of various models, including Inception, Xception, ResNet, and others. In this study, six deep learning models—VGG19, InceptionV3, ResNet-50, Xception, MobileNetV2, and NASNetLarge—were selected for brain tumor classification using MRI scans. These models were chosen due to their proven effectiveness and widespread use in image classification tasks. Their diverse architectures and capabilities provide a comprehensive approach to assessing their effectiveness in the specific task of brain tumor classification.
4.1.1. VGG19
VGG19 is renowned for its simplicity and efficiency in object recognition models. It comprises 16 convolutional layers, each followed by pooling layers, and concludes with 3 fully connected layers, totaling 20 million parameters. Despite its straightforward architecture, VGG19 often surpasses other models in performance.
4.1.2. InceptionV3
InceptionV3 is a popular CNN architecture specifically designed for classification tasks. It was developed by enhancing the Inception module and incorporates multiple blocks of convolutional, pooling, and fully connected layers. Additionally, dropout layers are employed to address overfitting concerns. InceptionV3 is structured with 42 layers and a total parameter count of 21.8 million, making it a robust choice for various image classification applications [33].
4.1.3. ResNet-50
ResNet, short for Residual Network, is a deep architecture renowned for its high accuracy in image classification tasks. It achieved first place in the ILSVRC challenge in 2015 [34]. As depicted in Figure 6, ResNet-50, a variant of ResNet, comprises 49 convolutional layers followed by a fully connected layer, totaling 23.6 million learnable parameters. It addresses the issue of vanishing gradients effectively through the use of skip connections.

Figure 6.
The architecture of the ResNet-50 model.
4.1.4. Xception
Xception, a convolutional neural network (CNN) architecture introduced by Chollet in 2017, integrates pointwise convolution and depthwise separable convolution [35]. It comprises 71 layers organized into three main flows: the entry flow, the middle flow, and the exit flow. Unlike conventional architectures, Xception adopts a unique approach where convolution is not conducted across all channels simultaneously. This strategic modification reduces interconnections and effectively reduces the total number of parameters to approximately 21 million.
4.1.5. MobileNetV2
MobileNetV2 is distinguished by its efficient design, leveraging point-wise and depth-wise convolution methods for accelerated processing. It further enhances efficiency through residual connections between bottlenecks. The network initiates with a 32-filter convolutional layer and integrates 19-filter bottleneck layers, optimizing its computational throughput while maintaining performance [36]. In total, MobileNetV2 comprises approximately 2.2 million parameters, striking a balance between computational efficiency and model complexity. This makes it well-suited for applications requiring rapid inference and limited computational resources.
4.1.6. NASNetLarge
NASNetLarge, a notable CNN architecture, stands out for its extensive scale and complexity, designed for achieving high accuracy in image classification. With its massive structure, NASNetLarge incorporates 88 convolutional layers and global average pooling layers, totaling around 84.9 million learnable parameters [37]. This architecture emphasizes neural architecture search techniques to optimize its design, enabling robust performance across diverse datasets.
4.2. Leveraging Transfer Learning with Imagenet Pre-Training
As illustrated in Figure 7, this study leverages transfer learning by initializing the training of models for brain tumor classification with pre-trained weights from the ImageNet dataset. ImageNet is a large-scale visual recognition database encompassing over 14 million labeled high-resolution images across over 20,000 categories. It is primarily used for training and evaluating computer vision models, especially for image classification tasks [38].
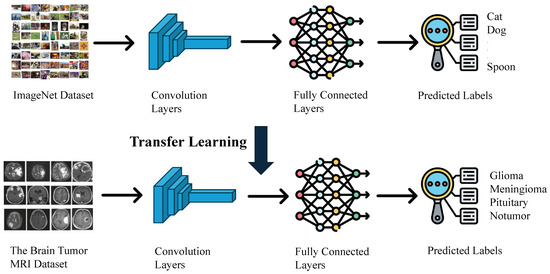
Figure 7.
The transfer learning process leveraging imagenet pre-training.
The pre-trained weights of ResNet-50 on ImageNet include weights of convolutional layers, Batch Normalization parameters, and weights of fully connected layers. Initializing the ResNet-50 model with these pre-trained weights imbues it with knowledge of fundamental features such as edges, textures, and shapes. These features are not specific to any particular dataset but are universally applicable to a wide range of images, including medical images. For brain tumor classification, this initialization is crucial because it allows the model to start from a point where it already understands basic visual patterns, which significantly reduces the amount of training data and time needed.
Moreover, brain tumor datasets are often limited in size due to the challenges associated with collecting medical imaging data. Training a deep neural network like ResNet-50 from scratch on a small dataset can lead to overfitting, where the model performs well on training data but fails to generalize to new, unseen images. By using pre-trained weights, the model can leverage the extensive learning conducted on the ImageNet dataset, providing a robust starting point that helps prevent overfitting and improves generalization.
This initialization accelerates the training process for specific image classification tasks and generally achieves better performance compared to training a model from scratch. In the context of brain tumor classification, it means the model can more quickly and accurately differentiate between tumor types, contributing to more reliable diagnostic tools and better patient outcomes. Thus, leveraging pre-trained weights from ImageNet is not just a convenience but a necessity for effective and efficient model training in medical imaging applications.
4.3. Optimizing Brain Tumor Classification: Training and Tuning Strategies
Hyperparameter tuning further enhances the model’s efficacy after pre-training from the ImageNet dataset. These settings, determined before the training phase begins and not derived from the data itself, profoundly impact the model’s performance, as illustrated in Table 3. In the context of brain tumor classification, hyperparameter tuning is especially crucial due to the complex and varied nature of medical imaging data.

Table 3.
The configuration of hyperparameters for the selected models.
A prime example is the learning rate, set at 0.0001. This parameter governs the pace at which the model adjusts its weights in pursuit of optimization, carefully balancing swift convergence against the risk of overshooting the ideal solution. A well-chosen learning rate ensures that the model learns efficiently, making steady progress towards lower error rates without oscillating or diverging. In medical image classification, where accuracy is paramount, fine-tuning the learning rate can make the difference between a good model and an excellent one.
Another pivotal hyperparameter is the dropout probability, fixed at 0.4. This technique serves as a form of regularization, fortifying the model’s resilience by randomly deactivating a proportion of nodes during training sessions. This process prevents overfitting, which is a significant concern in medical imaging due to the often limited availability of annotated data. By ensuring that the model does not become too tailored to the training data, dropout helps it generalize well to new, unseen data, thus improving its performance on real-world tasks.
Additional hyperparameters, such as batch size and the number of epochs, also play critical roles. In the experiments conducted, the batch size was set to 32 and the number of epochs to 25. The batch size influences the stability of the training process and the model’s generalization capability. Smaller batch sizes can introduce more noise during training, potentially aiding in better generalization, whereas larger batch sizes tend to offer more stable and faster training. The number of epochs determines how many times the model cycles through the entire training dataset and needs careful selection to avoid underfitting (too few epochs) or overfitting (too many epochs).
Moreover, in brain tumor classification, the choice of optimizer, activation functions, and the architecture of additional layers added to the pre-trained model can all be fine-tuned to enhance performance. The Adam optimizer was used in the proposed framework, as it offers better convergence properties for medical imaging tasks.
4.4. Performance Evaluation Metrics
To comprehensively assess the models’ performance in brain tumor classification, several evaluation metrics were utilized. Confusion matrices (CM) provided insights into model predictions, including true positives (TP), false positives (FP), true negatives (TN), and false negatives (FN). From the CM, essential metrics such as accuracy, precision, recall, and F1-score were derived to evaluate different aspects of classification performance.
4.4.1. Accuracy
Accuracy measures the overall correctness of the model’s predictions, calculated as the ratio of correct predictions to the total number of predictions (Equation (1)). In multi-class brain tumor diagnosis, high accuracy indicates that the model is effective in correctly classifying various tumor types. However, it may not fully capture performance, especially in imbalanced datasets.
4.4.2. Precision
Precision evaluates the proportion of positive predictions that are actually correct (Equation (2)). High precision is essential in reducing false positives, which can lead to unnecessary tests and treatments. This is particularly important in medical contexts to avoid misdiagnosing benign conditions as tumors.
4.4.3. Recall (Sensitivity)
Recall (or sensitivity) measures the model’s ability to correctly identify actual positive cases (Equation (3)). High recall is crucial for detecting as many true tumor cases as possible, particularly malignant ones, to ensure timely treatment and improve patient outcomes.
4.4.4. F1-Score
F1-score provides a balance between precision and recall by calculating their harmonic mean (Equation (4)). This metric is particularly useful when there is a need to balance false positives and false negatives, offering a more holistic view of model performance.
Additionally, the time required for the model to make predictions (inference time) was measured to ensure real-time applicability. Training time was also recorded to evaluate the efficiency of retraining models with new data, supporting both offline and online learning paradigms for adaptive healthcare solutions.
4.5. Visualization of Model Decision-Making Process Using Grad-CAM
Deep neural models based on CNNs have revolutionized computer vision tasks, achieving remarkable performance across various domains. However, their complexity and lack of decomposability into intuitive components pose challenges in interpreting their decisions. For brain tumor classification using deep learning models, interpretability and transparency are crucial. Building trust in these intelligent systems requires models that can elucidate the reasoning behind their predictions. Transparent models provide insights into why certain features are weighted more heavily in classification decisions, offering clinicians and researchers a clearer understanding of how the model processes MRI scans and distinguishes between different tumor types.
Grad-CAM (Gradient-weighted Class Activation Mapping) is a powerful class discriminative localization technique that generates visual explanations for any CNN-based network without necessitating architectural changes or re-training [39]. This method leverages the gradient information flowing into the last convolutional layer of a CNN-based deep learning model, assigning importance values to each neuron for a particular decision of interest. By doing so, Grad-CAM highlights the regions of the input image that are most influential in the model’s prediction.
Interpretable Gradient-weighted Class Activation Mapping (Grad-CAM) visualizations provide a window into the decision-making processes of deep learning models. For example, when a model classifies an MRI scan as containing a Glioma, Grad-CAM can highlight the specific areas of the scan that the model focused on to make this determination. These visual explanations are crucial as they reveal whether the model is accurately identifying the tumor regions or if irrelevant features or artifacts are influencing it. By examining these visualizations, clinicians can gain insights into the reliability and accuracy of the model’s predictions. This transparency is particularly important in medical applications, where understanding the basis for a model’s decision can help in assessing its trustworthiness and ensuring it aligns with clinical knowledge and expectations. Moreover, Grad-CAM can aid in identifying potential shortcomings in the model, guiding further refinement and improvement to enhance its diagnostic capabilities.
5. Experimental Study
5.1. Experimental Setup
The experiments were conducted on a Dell Precision 3660 Tower server (Dell Technologies, Round Rock, TX, USA) featuring a 13th Gen Intel Core i9-13900 CPU (16 cores, 2.40 GHz), 64 GB RAM, and an NVIDIA RTX A5000 GPU, running Windows 11. The development environment utilized PyCharm v2024.2.3 for code editing and debugging, Anaconda v2.6.2 for managing Python packages and environments, and Visual Studio Code v1.93.1 for its versatility.
The machine learning pipeline was implemented using Python libraries such as Pandas for data handling, Matplotlib for visualization, and Scikit-learn for machine learning tasks. A comprehensive list of libraries and dependencies is available in the GitHub repository [40] to ensure reproducibility.
The models selected for this study—ResNet-50, VGG19, InceptionV3, NASNetLarge, MobileNetV2, and Xception—are well known for their effectiveness in image classification and their suitability for transfer learning. Each model was trained with a standardized set of hyperparameters (Table 3) to provide a consistent comparison for multi-class brain tumor classification.
The experiments included an analysis of the impact of preprocessing and augmentation techniques on model performance. Models were evaluated using both original and preprocessed datasets, with additional analysis on the effect of augmentation specifically for the ResNet-50 model.
The model performance was assessed using the following metrics:
- Training and Validation Accuracy: to evaluate the model’s generalization ability.
- Training and Validation Loss: to track the convergence behavior.
- Confusion Matrices (CMs) on Test Set: to provide insights into prediction errors.
- Training Time: to assess computational efficiency.
- Number of Model Parameters: to gauge model complexity.
- Prediction Time: to evaluate suitability for real-time applications.
To enhance model interpretability, Grad-CAM was used with the ResNet-50 model to provide visual explanations for its predictions. This approach aids clinicians in interpreting AI-based diagnostic results. The best-performing model was further compared with existing studies using the same dataset to highlight its strengths and suggest potential areas for improvement.
5.2. Experimental Results
Table 4 summarizes the performance metrics of the different models, while Figure 8 illustrates their confusion matrices. A comparative analysis of the models indicates that ResNet-50, Xception, and InceptionV3 are particularly effective for multi-class brain tumor diagnosis, each achieving nearly 99% accuracy, precision, recall, and F1-scores across the four brain tumor classes. Additionally, VGG19, MobileNetV2, and NASNetLarge also demonstrate robust performance, with accuracy levels exceeding 95%.

Table 4.
The comparison of different models in terms of different classification metrics.
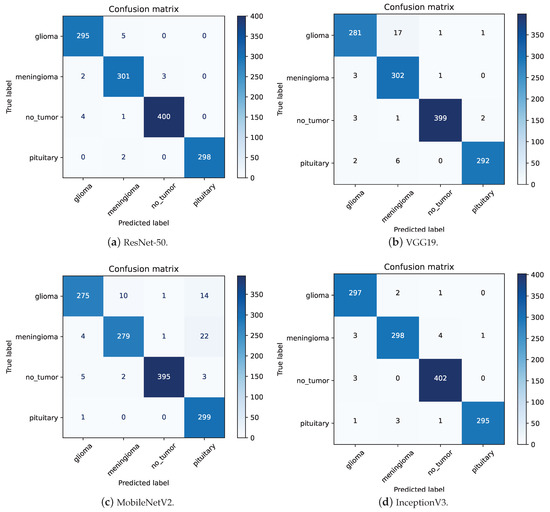
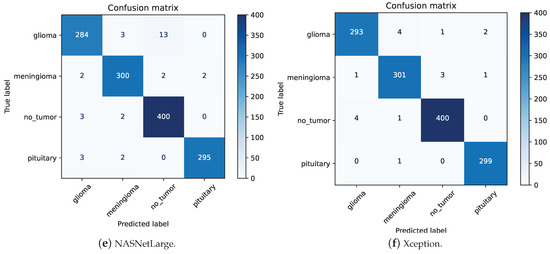
Figure 8.
The confusion matrices for different models.
ResNet-50 has the lowest precision for Meningioma at 0.97. As shown in Figure 8a, out of 309 images predicted as Meningioma, 301 were correctly classified. Among the 8 misclassified images, 5 were Glioma, 2 were Pituitary, and 1 was no-tumor. This high precision highlights the model’s ability to effectively distinguish Meningioma from other tumor types despite its slightly lower performance compared to other classes. InceptionV3 also demonstrates a recall of 0.97 for Meningioma. Analyzing the confusion matrix in Figure 8d, out of 306 “Meningioma” images, 298 were correctly classified. The primary reasons for misclassification were that 3 “Meningioma” images were incorrectly classified as “Glioma” and 4 as “No-tumor”. This indicates robust performance, as the misclassifications are relatively few, highlighting the model’s general capability to accurately classify these tumors.
Upon examining the confusion matrices for ResNet-50, Xception, and InceptionV3, significant misclassifications were evident. Specifically, ResNet-50 inaccurately labeled 4 “No-tumor” images as “Glioma”, while Xception and InceptionV3 misclassified 4 and 3 such images, respectively. Figure 9 underscores that three “No-tumor” images were consistently misdiagnosed as “Glioma” across all models, with InceptionV3 exclusively misclassifying all “No-tumor” images as “Glioma” from these instances.
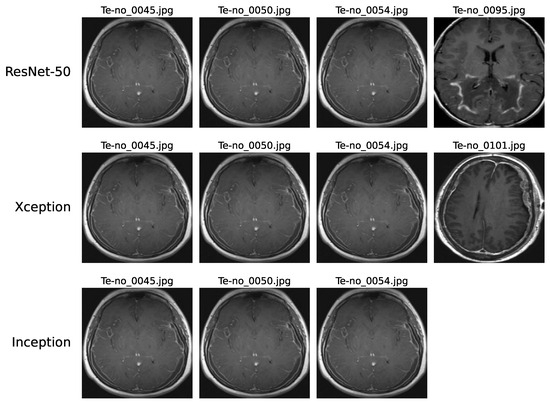
Figure 9.
Instances of no-tumor images misdiagnosed as Glioma on ResNet-50, Xception, and InceptionV3 models.
These misclassifications can be attributed to various factors. The complexity of these models may limit their ability to capture intricate patterns in MRI scans effectively. Issues like low resolution or blurry scans can impede accurate feature extraction, thereby affecting classification precision. Additionally, artifacts or noise prevalent in MRI scans might introduce confusion, challenging the models’ interpretation of image content. Furthermore, discerning early-stage Glioma from MRI scans showing no tumors, which may present minimal discernible differences, poses a notable challenge.
In Figure 10, the error analysis among ResNet-50, Xception, and InceptionV3 illustrates that each model made errors in 17, 18, and 19 images, respectively. Notably, a significant portion of Xception’s and InceptionV3’s errors originated from the same images, highlighting consistent performance trends for these two models on this dataset. This overlap in error patterns can be attributed to the fact that Xception is an evolution of the Inception architecture. Xception builds upon the Inception framework by incorporating depthwise separable convolutions, which maintain a high degree of structural similarity with InceptionV3. Consequently, the similarity in model construction explains why both architectures exhibit comparable error patterns on the same images. Furthermore, six images were misclassified by all three models, emphasizing common challenges across different model architectures. Further in-depth analysis is crucial to pinpoint specific reasons behind these misdiagnoses, offering deeper insights and enabling effective mitigation of underlying issues. Such meticulous examination is pivotal for enhancing the accuracy of model predictions in intricate tasks like multi-class brain tumor classification.
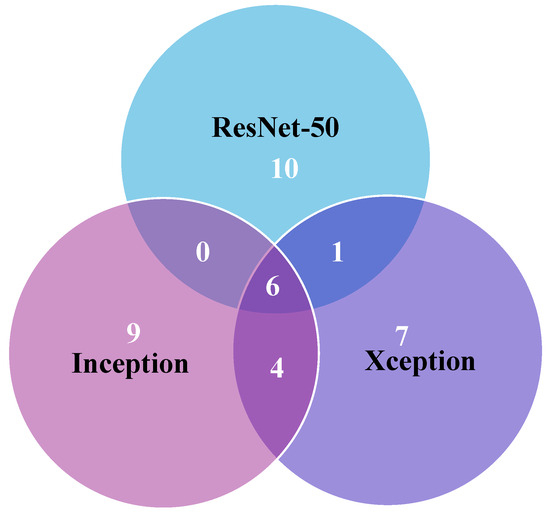
Figure 10.
Error analysis among ResNet-50, Xception, and InceptionV3 models.
The convergence speed of ResNet-50, Xception, and InceptionV3 is prominently displayed in the accuracy and loss plots depicted in Figure 11. These models demonstrate rapid stabilization, often achieving stability within fewer than five epochs. This swift convergence suggests that these models require less training time, thereby potentially reducing overall training costs and computational resources, which is particularly advantageous for large-scale applications in brain tumor medical diagnostics. Conversely, VGG19 exhibits slower convergence, typically taking 10 to 15 epochs to stabilize. This slower convergence not only increases the demand for computational resources but also results in lower accuracy compared the top-performing models.
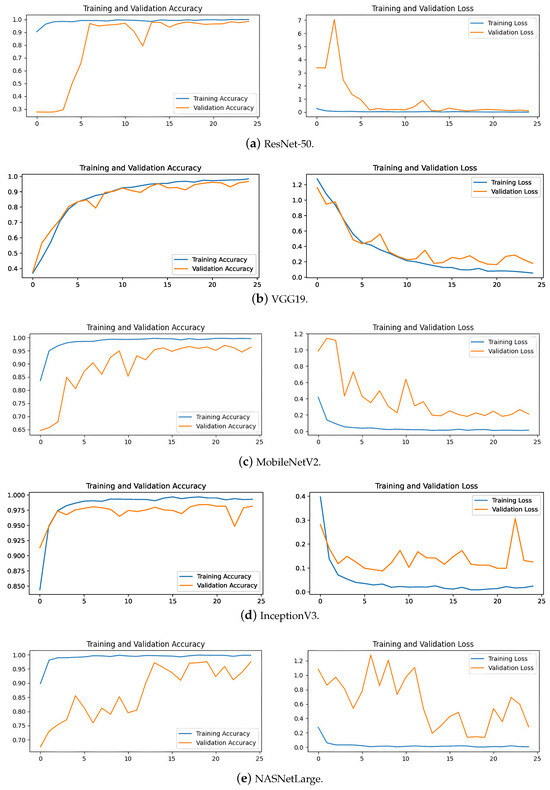

Figure 11.
The accuracy and loss plots for different models.
MobileNetV2 and NASNetLarge display fluctuating trends in their training curves, struggling to converge even after 25 epochs. This difficulty in achieving stability during training correlates with their lower accuracy on the test set. These insights suggest that these models may be less suitable for the precise demands of brain tumor classification due to their instability during the training process.
6. Discussions
6.1. Relationship between Accuracy and the Number of Parameters for Different Models
Table 5 provides an overview of the relationship between model parameters, training time, and accuracy for various models. MobileNetV2 stands out with its minimal 2.2 million parameters and a swift training time of 101 min, achieving an accuracy exceeding 95%. These attributes make it highly suitable for scenarios where computational resources and time are limited, although its accuracy does not match the top-tier performance of more complex models like ResNet-50 and Xception.

Table 5.
Comparison of different models in terms of number of parameters.
Conversely, NASNetLarge exhibits the highest complexity, with 84.9 million parameters and a lengthy training time of 1188 min. While achieving an impressive accuracy of 97.56%, its substantial size poses challenges in terms of computational efficiency and overfitting risk, limiting its practicality in real-world applications that demand both efficiency and robust generalization.
Figure 12 illustrates the performance of ResNet-50, Xception, and InceptionV3, each equipped with slightly over 20 million parameters and achieving nearly 99% accuracy. These models demonstrate a balance between complexity, training time, and performance, showing reduced model complexity and shorter training times compared to NASNetLarge. Specifically, InceptionV3 requires 104 min for training, which is comparable to MobileNetV2, which takes 101 min. Despite this similarity in training time, InceptionV3 has a parameter count that is ten times larger than that of MobileNetV2. This indicates that InceptionV3 not only achieves a performance level comparable to other high-performing models but also manages to do so with a relatively efficient training duration. In contrast, Xception completes training in 217 min, reflecting the additional computational complexity of its architecture. Thus, InceptionV3 demonstrates a notable advantage in training efficiency relative to its parameter size and performance.
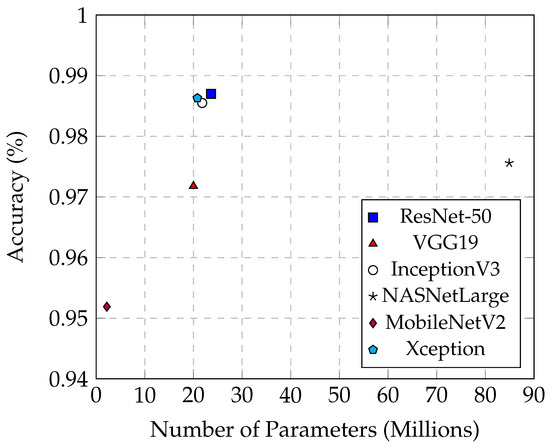
Figure 12.
The relationship between accuracy and the number of parameters across different models.
6.2. Comparison of the Prediction Time across Different Models
The prediction time is a critical factor in the practical application of brain tumor classification models. In a clinical setting, faster prediction times can lead to quicker decision-making and improved patient outcomes. Models with shorter prediction times are preferable for integration into medical imaging systems where real-time analysis is essential.
Table 6 summarizes the average, maximum, and minimum prediction times (in milliseconds) for each model on the entire test set. The average prediction time stands out as the most compelling and representative metric among these measurements.

Table 6.
Comparison of different models in terms of prediction time (ms).
The number of parameters in a model directly impacts its prediction time. MobileNetV2, with a minimal parameter count of 2.2 million, exemplifies the benefits of a lightweight model in terms of speed. It achieves the shortest average prediction time of 40.6 ms and maintains an accuracy of 95.15%. This efficiency is due to its reduced model complexity, which significantly shortens prediction time. Such characteristics make MobileNetV2 highly suitable for applications where quick predictions are crucial, such as real-time diagnostics.
On the other end of the spectrum, NASNetLarge exhibits the longest average prediction time of 329 ms, even surpassing the maximum prediction times of the other five models, despite achieving an accuracy of 97.56%. The extensive parameters of NASNetLarge contribute to its substantial complexity and size, thereby significantly increasing the prediction time. While a high number of parameters can potentially enhance model accuracy by capturing more complex patterns, it also results in heightened computational demands and slower inference times. This trade-off is evident in NASNetLarge, which, despite its high accuracy, is less suitable for real-time applications due to its considerable prediction time.
From Figure 13, it is evident that InceptionV3 exhibits superior average prediction times compared to the other two best-performing models, ResNet-50 and Xception. When their prediction accuracies are similar, InceptionV3 achieves an average prediction time of only 53.5 ms, whereas Xception averages 84.9 ms, and ResNet-50 averages 90.1 ms. These models demonstrate that high performance can be achieved without excessively increasing prediction times, making them well-suited for practical deployment in medical imaging applications. Their balanced combination of accuracy and efficiency is crucial for real-time diagnosis and decision-making processes in clinical settings.
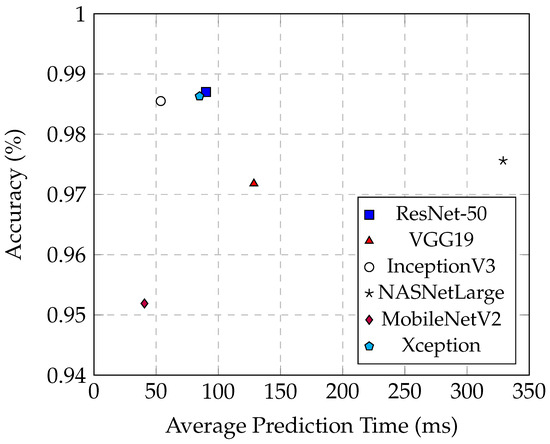
Figure 13.
The relationship between the accuracy and the average prediction time in different models.
6.3. Impact of Image Preprocessing
As illustrated in Figure 14, the experiment compared the classification accuracy of various models on both the original and preprocessed test sets, revealing significant improvements after preprocessing steps like cropping and noise removal. On average, these techniques enhanced accuracy by around 10%. Notably, MobileNetV2 showed a substantial increase from 72.08% to 95.19% after preprocessing, marking a notable 23% improvement.
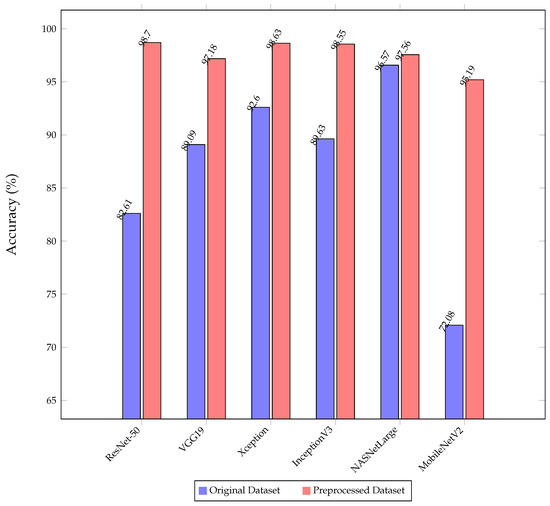
Figure 14.
The comparison of the classification accuracy of the proposed models on the original and preprocessed dataset.
MobileNetV2, known for its lightweight architecture with just 2.2 million parameters, initially struggles to extract crucial features from raw datasets, often affected by background noise. However, preprocessing enhances data quality by isolating the brain region and removing noise, significantly improving the model’s ability to capture essential information accurately.
In contrast, NASNetLarge demonstrated nearly identical performance on both datasets depicted in Figure 14. This consistency can be attributed to NASNetLarge’s robust architecture, boasting over 80 million parameters, which allows it to extract critical features effectively from raw data, showcasing its strong learning capabilities. However, it is essential to consider that NASNetLarge requires significantly longer training and prediction times compared to other models, which is a critical factor in practical applications where computational efficiency is paramount.
6.4. Impact of Image Augmentation
Figure 15 displays the confusion matrix, and Figure 16 shows the accuracy and loss plot for ResNet-50 without image augmentation. The accuracy of the ResNet-50 model without image augmentation is 93.14%, compared to 98.70% with image augmentation. This significant increase in accuracy with augmentation highlights the effectiveness of the applied augmentation techniques in enhancing the model’s performance for multi-class brain tumor diagnosis.
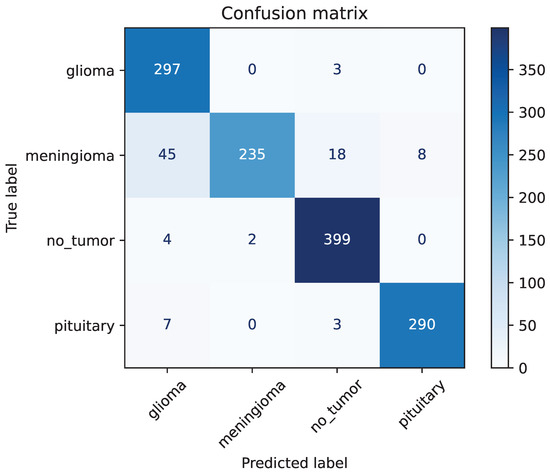
Figure 15.
The confusion matrix of ResNet-50 without image augmentation.

Figure 16.
The accuracy and loss plot of ResNet-50 without image augmentation.
The recall of ResNet-50 without image augmentation for Glioma is only 0.84, the lowest among the four classes. As shown in Figure 15, for the ResNet-50 model, out of 353 images classified as Glioma, 297 were correctly classified, while 45 Meningioma images were misclassified as Glioma. The precision for Meningioma in the ResNet-50 model without image augmentation is the lowest among the four classes, at only 0.77. Out of 306 Meningioma images, only 235 were correctly identified, with 45 misclassified as Glioma, 18 as No-tumor, and 8 as Pituitary. This demonstrates that the primary reason for the poor performance of the ResNet-50 model without image augmentation is its inability to accurately identify Meningioma, leading to a large number of Meningioma images being misclassified into other categories.
This analysis highlights the critical role of image augmentation in improving the model’s recognition accuracy. The augmentation techniques not only enhance the overall accuracy of the model but also significantly improve its ability to correctly classify challenging cases, such as Meningioma and Glioma. The robust performance of ResNet-50, Xception, and InceptionV3 with augmentation underscores the importance of employing such techniques in training effective multi-class brain tumor diagnosis models.
7. Visualization of Decision Pathways in Deep Learning Models
Figure 17 depicts the Visualization of Brain Tumor Classification in ResNet-50. A representative MRI scan of a Meningioma tumor was selected, as depicted in Figure 17a. The image highlights a prominent white region on the right side of the MRI scan, which indicates the presence of the Meningioma tumor. Figure 17b–f display the final heatmap outputs from each stage of ResNet, respectively. It is noticeable that the color intensity increases gradually in the tumor region and decreases in unrelated areas, illustrating the dynamic process that explains the decision-making process of the ResNet-50 model and the basis for its final decision. This visualization not only aids in understanding how the model identifies and distinguishes tumor regions but also provides valuable insights into the features influencing its predictions.
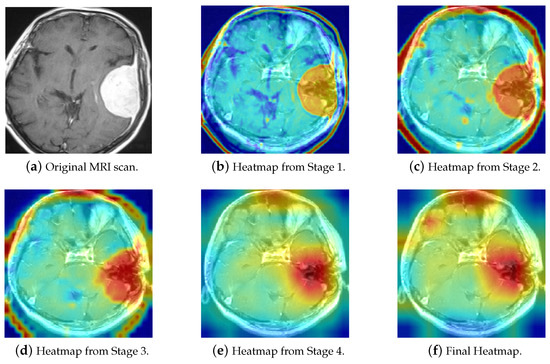
Figure 17.
The Grad-CAM visualization of ResNet-50 decision pathways in brain tumor classification.
Figure 18 includes three correctly classified Glioma images alongside three No-tumor MRI scans that were misclassified as Glioma, as discussed earlier. Grad-CAM was used to elucidate the decision-making process of ResNet-50. As observed, when predicting Glioma, ResNet-50 focuses on the cranial edge of the brain MRI, a similar pattern to the Glioma heatmap. Similarly, the three misclassified No-tumor images also exhibit focus around the cranial edges, resembling the Glioma heatmap. This explains why the model misclassified these three no-tumor images as Glioma. Further analysis of MRI scans reveals significant similarity between some No-tumor and Glioma MRI scans, contributing to their misclassification across multiple models.
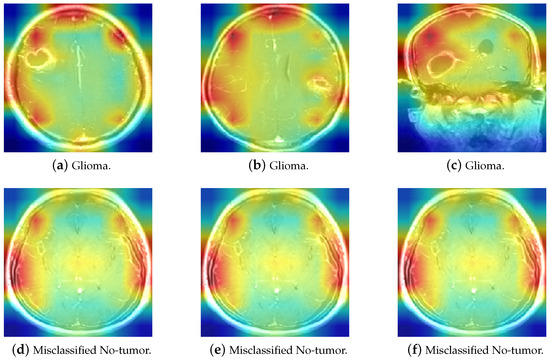
Figure 18.
The comparison of Glioma and misclassified No-tumor MRI heatmaps.
The application of Grad-CAM in brain tumor detection offers invaluable benefits to clinical settings by enhancing the transparency and interpretability of AI models. By visually highlighting the specific regions within MRI scans that influence the model’s predictions, Grad-CAM enables clinicians to thoroughly validate and comprehend the AI’s diagnostic decisions. This capability improves the accuracy of brain tumor classification and lays the foundation for developing more resilient and dependable diagnostic systems. In practice, the detailed visual explanations provided by Grad-CAM empower healthcare professionals to make informed treatment decisions based on AI-driven insights. By understanding which features the model prioritizes in identifying tumor characteristics, clinicians can confidently integrate AI predictions into their diagnostic workflows. This integration streamlines the diagnostic process and ensures that patients receive timely and accurate assessments, potentially leading to earlier detection and intervention. Moreover, Grad-CAM’s ability to generate interpretable visualizations fosters trust in AI technologies among healthcare providers and patients alike. By elucidating the reasoning behind AI predictions in a clear and accessible manner, Grad-CAM facilitates collaborative decision-making and enhances the overall efficacy of medical teams.
8. Proposed Application for Real-World Brain Tumor Detection System
A Brain Tumor Detection System has been developed using Python and Streamlit and is available in the GitHub repository (Zhengkun, 2024, [40]). This system is specifically designed to classify brain tumors into three types—Meningioma, Glioma, and Pituitary tumors—and distinguish normal cases (no tumor) based on MRI scans. The primary objective of this system is to assist clinicians by providing visualizations of the decision pathways taken by the deep learning model.
This interactive platform not only facilitates precise tumor classification but also offers deep insights into the decision-making process of the AI model. By integrating sophisticated AI capabilities with intuitive visualization tools, the system empowers healthcare professionals to make well-informed diagnostic decisions based on AI-driven insights.
In real-world applications, this system is a crucial decision-making tool for doctors and healthcare teams. When a doctor uploads an MRI scan of a suspected tumor to the “Disease Recognition” page (refer to Figure 19), the system begins its analysis using advanced algorithms trained to classify various brain tumors accurately—such as Meningioma, Glioma, and Pituitary tumors—alongside distinguishing cases with no tumors. Upon clicking the “Predict” button, the system rapidly processes the image, giving the doctor detailed prediction results and confidence scores.
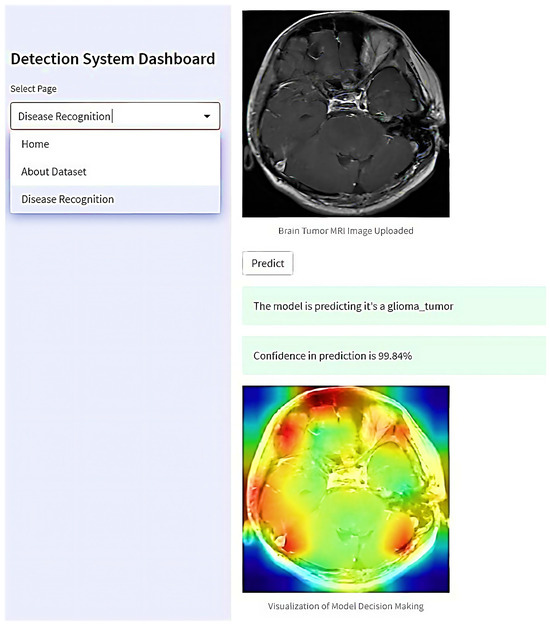
Figure 19.
The proposed web-based interactive application for real-world brain tumor detection.
Moreover, the system generates visualizations illustrating the rationale behind the AI model’s decision. These visual aids show which regions of the MRI scan were critical in determining the tumor classification. This capability enhances the doctor’s understanding of the AI’s assessment and facilitates collaborative decision-making among multiple healthcare professionals.
By enabling doctors to interact with AI-driven insights in a transparent and comprehensible manner, this platform supports collaborative efforts in clinical settings. Multiple doctors can review the same visualizations and prediction results, share insights, and collectively determine the most appropriate treatment strategies for their patients. This collaborative approach not only improves diagnostic accuracy but also ensures that treatment decisions are well-informed and based on the combined expertise of the healthcare team. Thus, the system is pivotal in enhancing diagnostic precision and patient care outcomes in clinical practice.
9. Comparison with Existing Approaches
The results presented in Table 7 provide a comprehensive comparative analysis of the best outcomes from five referenced studies alongside this study’s results. Each study utilized the same Brain Tumor MRI Dataset to ensure consistency and reliability in the comparison. The performance metrics reported for the five referenced papers reflect their results on the entire test set, encompassing various evaluation criteria such as accuracy, precision, recall, and F1-score. This thorough comparison highlights the strengths and weaknesses of each approach, offering valuable insights into the effectiveness of different deep-learning models for brain tumor classification using MRI scans.

Table 7.
A comparative analysis of the best model with state-of-the-art models using the same dataset.
Alnemr et al. [41] (2021) employed a modified pre-trained ResNet152V2 model with data augmentation techniques to classify brain tumors using MRI scans, achieving an overall accuracy of 98.9%. However, this paper lacks specific experimental data, such as precision, recall, and F1-score, and does not provide details on the experimental setup. Additionally, the absence of source code makes the results difficult to replicate, undermining the credibility of the findings.
Rauf et al. [42] (2022) utilized the Discrete Cosine-based Stockwell Transform (DCST) for feature extraction and a Support Vector Machine (SVM) for binary classification of brain MRI scans into tumor and non-tumor categories, achieving an accuracy of 97.71%. Despite addressing a binary classification problem with images of various brain tumor types, this study does not delve into specific tumor subtype classification.
Gómez-Guzmán et al. [43] (2023) evaluated seven deep convolutional neural network (CNN) models, achieving the highest accuracy of 97.12% with the InceptionV3 model. However, this study lacks a comparative analysis of experimental results on the same dataset and does not provide source code, limiting reproducibility. Our experiments using similar models like ResNet-50, InceptionV3, and Xception consistently achieved higher accuracies, showcasing the robustness and superiority of our framework employed.
Özkaraça et al. [44] (2023) developed a new modular deep learning model incorporating DenseNet, VGG16, and basic CNN architectures for brain MRI classification, achieving improved performance but with increased processing time. Their model achieved an accuracy of 94%, which is lower than our worst-performing model, MobileNetV2, demonstrating the potential for enhancement compared to other models.
Shilaskar et al. [45] (2023) employed MRI-based preprocessing, HOG feature extraction, and various ML classifiers, including SVM, Gradient Boost, KNN, XG Boost, and Logistic Regression, achieving up to 92.02% accuracy in brain tumor classification. However, this study achieved a maximum accuracy of 92%, indicating a noticeable gap compared to other studies in the field.
In terms of inference time, Table 7 demonstrates that our method achieves superior performance compared to the approach proposed by Rasheed et al. (2023) [46]. The primary reason for this advantage is that their method relies extensively on pre-processing techniques, which introduce additional overhead and delay during the inference phase. In contrast, our approach minimizes such dependencies, resulting in a more efficient inference process.
Regarding training time, a direct comparison with other works is not feasible due to several factors. First, many prior studies, including Rasheed et al., do not comprehensively report training times. Second, discrepancies in computational environments and hardware configurations across studies make it challenging to draw meaningful comparisons. As such, the reported results for training time remain non-comparable.
This research employs advanced methodologies, including data preprocessing, hyperparameter optimization, image augmentation, and Grad-CAM, utilizing models such as ResNet-50, Xception, and InceptionV3, among others, to achieve outstanding performance in brain tumor classification. The models ResNet-50, Xception, and InceptionV3 achieved remarkable accuracies approaching 99%. These results highlight the robustness and reliability of the framework in handling diverse brain tumor types, which is crucial for precise diagnostics and treatment planning. Moreover, to address the lack of interpretability and transparency in deep learning models, Grad-CAM was employed to visualize the decision pathways of the models. This method addresses a significant research gap by providing insights into the decision-making process involved in using MRI scans for brain tumor prediction. Additionally, a practical Brain Tumor Detection System was developed using Streamlit, which enhances user interaction and accessibility in medical diagnostics, thereby demonstrating its potential for real-world applications.
10. Project Reproducibility
Ensuring project reproducibility is of paramount importance for scientific integrity. To facilitate this, we have made the complete source code of our project publicly available on GitHub. The repository can be accessed using the following URL: https://github.com/Overrated1987/Empowering-MRI-Based-Brain-Tumor-Classification-with-Deep-Learning-and-Grad-CAM/ (accessed on 2 October 2023). By accessing the repository, readers can inspect the code, explore the project structure, and understand the implementation details comprehensively. The repository includes a detailed README file that provides instructions on how to set up and utilize the source code effectively. This documentation assists users in reproducing the project environment and replicating the experimental results. To enhance the readability and transparency of our work, we have utilized Jupyter Notebooks. These notebooks contain the code snippets, data preprocessing steps, DL model implementations, and the corresponding results. The interactive nature of Jupyter Notebooks allows readers to navigate through the code and observe the output easily. By referring to these notebooks, users can gain deeper insights into our methodology and reproduce the experimental outcomes. By providing open access to the source code and utilizing Jupyter Notebooks, we strive to promote transparency, enable reproducibility, and facilitate the verification of our project by the scientific community.
11. Limitations and Future Works
Despite the advancements introduced by our computer-aided diagnosis (CAD) framework, several limitations remain, which need to be addressed to enhance the system’s effectiveness and applicability.
- 1.
- Privacy Concerns and Data Sharing: One of the primary limitations of our current approach is the reliance on MRI datasets, which are often subject to stringent privacy regulations. These privacy concerns significantly restrict the sharing of datasets across institutions and complicate the acquisition of diverse and representative training data. The lack of access to varied datasets can hinder the development of models that are robust and generalizable across different populations and imaging conditions.
- 2.
- Single-Protocol Limitation: The current framework utilizes only T1W MRI scans, which restricts the model’s ability to generalize across different MRI protocols. Different MRI protocols, such as T2W or FLAIR, can provide complementary information that might improve the model’s diagnostic accuracy. Incorporating multiple MRI protocols could enhance the robustness of the CAD system and its applicability to a broader range of clinical scenarios.
To overcome the current limitations and further advance the capabilities of our CAD system, several promising avenues for future research are outlined below.
- 1.
- Federated Learning (FL): To address the privacy issues associated with brain tumor MRI datasets, future research could explore federated learning (FL) techniques. FL allows multiple health institutions to collaboratively train a unified deep learning (DL) model without sharing sensitive patient data. Instead, each institution trains the model locally and only shares model updates, preserving the confidentiality of patient information [48]. This approach could enable the development of more accurate and generalized models while adhering to privacy regulations.
- 2.
- Blockchain Integration: Integrating blockchain technology with federated learning could further enhance the transparency, security, and accountability of the model training process. Blockchain can provide an immutable and verifiable record of model updates and training activities, ensuring that all changes are traceable and auditable [49,50,51]. This added layer of security would address concerns related to data integrity and model reliability, contributing to more secure and trustworthy machine learning practices in healthcare.
- 3.
- Expansion of Data Sources: Expanding the dataset to include MRI scans from multiple institutions and incorporating various MRI protocols is another crucial area for future work. This would involve collecting and integrating data from different sources to build a more comprehensive and diverse dataset. Additionally, exploring techniques such as data synthesis or augmentation could help in creating a more varied training set, further enhancing the model’s performance and generalizability [52].
- 4.
- Real-World Applicability and Usability: Future research should also focus on evaluating the system’s performance in real-world clinical settings. This includes conducting longitudinal studies to assess the system’s effectiveness in diverse patient populations and clinical scenarios. Furthermore, enhancing the user interface and integrating the system with existing clinical workflows would improve its usability and acceptance among healthcare professionals.
Addressing these limitations and pursuing the proposed future research directions will contribute to the advancement of computer-aided diagnosis systems, paving the way for more effective, accurate, and privacy-conscious solutions in brain tumor detection and classification.
12. Conclusions
Recent advancements in medical image applications, particularly those utilizing deep learning (DL) and optimization strategies, have attracted substantial attention due to their practical applications in analyzing natural images. Magnetic resonance imaging (MRI) data, in particular, has become increasingly prevalent in DL approaches for automatic brain tumor detection and classification. This paper presents an effective computer-aided diagnosis (CAD) framework for multi-class brain tumor classification using MRI scans. The framework utilizes six pre-trained DL models and integrates comprehensive data preprocessing and augmentation strategies to enhance computational efficiency. To address challenges related to transparency and interpretability in DL models, Gradient-weighted Class Activation Mapping (Grad-CAM) was employed to visualize the decision-making processes involved in tumor classification from MRI scans. Additionally, a user-friendly Brain Tumor Diagnosis System was developed using Streamlit, demonstrating its practical applicability in real-world settings and providing a valuable tool for clinicians. The system was evaluated using publicly available brain MRI datasets from Kaggle, which include four classes: Glioma, Meningioma, Pituitary tumor, and No tumor, with a total of 7023 images. In addition to accuracy, we assessed the system’s performance using various classification metrics, such as precision, recall, F1-score, and confusion matrices, all of which consistently demonstrated the framework’s effectiveness. Experimental results indicate that the proposed framework achieves remarkable classification performance, with overall accuracy approaching 99% for the ResNet-50, Xception, and InceptionV3 models. This CAD system represents an effective tool for brain tumor classification, offering significant advancements in both accuracy and usability for clinical applications.
Author Contributions
Z.L.: conceptualization, methodology, software, validation, investigation, data curation, writing—original draft, writing—review and editing, visualization. O.D.: conceptualization, methodology, software, validation, investigation, resources, writing—review and editing, visualization, supervision, project administration, funding acquisition. All authors have read and agreed to the published version of this manuscript.
Funding
This research was funded by Wenzhou-Kean University Computer Science and Artificial Intelligence Center (Project No. BM20211203000113), and Wenzhou-Kean University International Collaborative Research Program (Project No. ICRP2023008).
Institutional Review Board Statement
Not applicable.
Informed Consent Statement
Not applicable.
Data Availability Statement
The datasets used during the current study are publicly available in Kaggle.
Acknowledgments
The authors would like to express their sincere gratitude to the reviewers for their thorough and insightful comments. Their constructive feedback has been invaluable in refining our research and enhancing the overall quality of this paper. The authors also extend their gratitude to Wenzhou-Kean University for providing the necessary laboratory facilities and execution resources, which were instrumental in completing this work.
Conflicts of Interest
The authors declare no conflicts of interest.
References
- Hossain, A.; Islam, M.T.; Abdul Rahim, S.K.; Rahman, M.A.; Rahman, T.; Arshad, H.; Khandakar, A.; Ayari, M.A.; Chowdhury, M.E.H. A Lightweight Deep Learning Based Microwave Brain Image Network Model for Brain Tumor Classification Using Reconstructed Microwave Brain (RMB) Images. Biosensors 2023, 13, 238. [Google Scholar] [CrossRef] [PubMed]
- The American Cancer Society; Editorial Content Team. Key Statistics for Brain and Spinal Cord Tumors. 2024. Available online: https://www.cancer.org/cancer/brain-spinal-cord-tumors-adults/about/key-statistics.html (accessed on 10 July 2024).
- Pradhan, A.; Mishra, D.; Das, K.; Panda, G.; Kumar, S.; Zymbler, M. On the Classification of MR Images Using “ELM-SSA” Coated Hybrid Model. Mathematics 2021, 9, 2095. [Google Scholar] [CrossRef]
- Rasool, M.; Ismail, N.A.; Boulila, W.; Ammar, A.; Samma, H.; Yafooz, W.M.S.; Emara, A.H.M. A Hybrid Deep Learning Model for Brain Tumour Classification. Entropy 2022, 24, 799. [Google Scholar] [CrossRef] [PubMed]
- Abd El-Wahab, B.S.; Nasr, M.E.; Khamis, S.; Ashour, A.S. Btc-fcnn: Fast convolution neural network for multi-class brain tumor classification. Health Inf. Sci. Syst. 2023, 11, 3. [Google Scholar] [CrossRef] [PubMed]
- Louis, D.N.; Perry, A.; Reifenberger, G.; Von Deimling, A.; Figarella-Branger, D.; Cavenee, W.K.; Ohgaki, H.; Wiestler, O.D.; Kleihues, P.; Ellison, D.W. The 2016 World Health Organization classification of tumors of the central nervous system: A summary. Acta Neuropathol. 2016, 131, 803–820. [Google Scholar] [CrossRef]
- Vijayalaxmi; Fatahi, M.; Speck, O. Magnetic resonance imaging (MRI): A review of genetic damage investigations. Mutat. Res./Rev. Mutat. Res. 2015, 764, 51–63. [Google Scholar] [CrossRef]
- Crowe, E.M.; Gilchrist, I.D.; Kent, C. New approaches to the analysis of eye movement behaviour across expertise while viewing brain MRIs. Cogn. Res. Princ. Implic. 2018, 3, 12. [Google Scholar] [CrossRef]
- Wang, G.; Badal, A.; Jia, X.; Maltz, J.S.; Mueller, K.; Myers, K.J.; Niu, C.; Vannier, M.; Yan, P.; Yu, Z.; et al. Development of metaverse for intelligent healthcare. Nat. Mach. Intell. 2022, 4, 922–929. [Google Scholar] [CrossRef]
- Chan, H.P.; Hadjiiski, L.M.; Samala, R.K. Computer-aided diagnosis in the era of deep learning. Med. Phys. 2020, 47, e218–e227. [Google Scholar] [CrossRef]
- Saba, L.; Biswas, M.; Kuppili, V.; Godia, E.C.; Suri, H.S.; Edla, D.R.; Omerzu, T.; Laird, J.R.; Khanna, N.N.; Mavrogeni, S.; et al. The present and future of deep learning in radiology. Eur. J. Radiol. 2019, 114, 14–24. [Google Scholar] [CrossRef]
- Yin, S.; Luo, X.; Yang, Y.; Shao, Y.; Ma, L.; Lin, C.; Yang, Q.; Wang, D.; Luo, Y.; Mai, Z.; et al. Development and validation of a deep-learning model for detecting brain metastases on 3D post-contrast MRI: A multi-center multi-reader evaluation study. Neuro-Oncol. 2022, 24, 1559–1570. [Google Scholar] [CrossRef] [PubMed]
- Rajput, I.S.; Gupta, A.; Jain, V.; Tyagi, S. A transfer learning-based brain tumor classification using magnetic resonance images. Multimed. Tools Appl. 2024, 83, 20487–20506. [Google Scholar] [CrossRef]
- Simonyan, K.; Zisserman, A. Very deep convolutional networks for large-scale image recognition. arXiv 2014, arXiv:1409.1556. [Google Scholar] [CrossRef]
- Badjie, B.; Ülker, E.D. A deep transfer learning based architecture for brain tumor classification using MR images. Inf. Technol. Control 2022, 51, 332–344. [Google Scholar] [CrossRef]
- Liu, T.; Fan, W.; Wang, G.; Tang, W.; Li, D.; Chen, M.; Dib, O. A Hybrid Supervised Learning Approach for Intrusion Detection Systems. In International Symposium on Knowledge and Systems Sciences; Springer Nature: Singapore, 2023; pp. 3–17. [Google Scholar] [CrossRef]
- Tang, W.; Li, D.; Fan, W.; Liu, T.; Chen, M.; Dib, O. An intrusion detection system empowered by deep learning algorithms. In Proceedings of the 2023 IEEE International Conference on Dependable, Autonomic and Secure Computing, International Conference on Pervasive Intelligence and Computing, International Conference on Cloud and Big Data Computing, International Conference on Cyber Science and Technology Congress (DASC/PiCom/CBDCom/CyberSciTech), Abu Dhabi, United Arab Emirates, 14–17 November 2023; pp. 1137–1142. [Google Scholar] [CrossRef]
- Sánchez, J.; Martín-Landrove, M. Morphological and fractal properties of brain tumors. Front. Physiol. 2022, 13, 878391. [Google Scholar] [CrossRef]
- Das, S.; Goswami, R.S. Review, Limitations, and future prospects of neural network approaches for brain tumor classification. Multimed. Tools Appl. 2024, 83, 45799–45841. [Google Scholar] [CrossRef]
- Wang, J.; Lu, S.Y.; Wang, S.H.; Zhang, Y.D. RanMerFormer: Randomized vision transformer with token merging for brain tumor classification. Neurocomputing 2024, 573, 127216. [Google Scholar] [CrossRef]
- Mehnatkesh, H.; Jalali, S.M.J.; Khosravi, A.; Nahavandi, S. An intelligent driven deep residual learning framework for brain tumor classification using MRI images. Expert Syst. Appl. 2023, 213, 119087. [Google Scholar] [CrossRef]
- Zhu, Z.; Khan, M.A.; Wang, S.H.; Zhang, Y.D. RBEBT: A ResNet-based BA-ELM for brain tumor classification. Comput. Mater. Contin. 2023, 74, 101–111. [Google Scholar] [CrossRef]
- Asif, S.; Zhao, M.; Tang, F.; Zhu, Y. An enhanced deep learning method for multi-class brain tumor classification using deep transfer learning. Multimed. Tools Appl. 2023, 82, 31709–31736. [Google Scholar] [CrossRef]
- Sharma, A.K.; Nandal, A.; Dhaka, A.; Zhou, L.; Alhudhaif, A.; Alenezi, F.; Polat, K. Brain tumor classification using the modified ResNet50 model based on transfer learning. Biomed. Signal Process. Control 2023, 86, 105299. [Google Scholar] [CrossRef]
- Kumar, S.; Choudhary, S.; Jain, A.; Singh, K.; Ahmadian, A.; Bajuri, M.Y. Brain tumor classification using deep neural network and transfer learning. Brain Topogr. 2023, 36, 305–318. [Google Scholar] [CrossRef] [PubMed]
- Nickparvar, M. Brain Tumor MRI Dataset. 2024. Available online: https://www.kaggle.com/datasets (accessed on 22 July 2024).
- Bhonsle, D.; Chandra, V.; Sinha, G. Medical image denoising using bilateral filter. Int. J. Image Graph. Signal Process. 2012, 4, 36. [Google Scholar] [CrossRef]
- Richter, M.L.; Byttner, W.; Krumnack, U.; Wiedenroth, A.; Schallner, L.; Shenk, J. (Input) size matters for CNN classifiers. In Proceedings of the Artificial Neural Networks and Machine Learning–ICANN 2021: 30th International Conference on Artificial Neural Networks, Bratislava, Slovakia, 14–17 September 2021; Proceedings, Part II 30. Springer: Berlin/Heidelberg, Germany, 2021; pp. 133–144. [Google Scholar] [CrossRef]
- Xu, Y.; Goodacre, R. On splitting training and validation set: A comparative study of cross-validation, bootstrap and systematic sampling for estimating the generalization performance of supervised learning. J. Anal. Test. 2018, 2, 249–262. [Google Scholar] [CrossRef] [PubMed]
- Shorten, C.; Khoshgoftaar, T.M. A survey on image data augmentation for deep learning. J. Big Data 2019, 6, 60. [Google Scholar] [CrossRef]
- Prayogo, R.D.; Hamid, N.; Nambo, H. An Improved Transfer Learning-Based Model with Data Augmentation for Brain Tumor Detection. In Proceedings of the 2024 International Conference on Artificial Intelligence in Information and Communication (ICAIIC), Osaka, Japan, 19–22 February 2024; pp. 602–607. [Google Scholar] [CrossRef]
- Rehman, A.; Naz, S.; Razzak, M.I.; Akram, F.; Imran, M. A deep learning-based framework for automatic brain tumors classification using transfer learning. Circuits Syst. Signal Process. 2020, 39, 757–775. [Google Scholar] [CrossRef]
- Bedi, P.; Ningshen, N.; Rani, S.; Gole, P. Explainable predictions for brain tumor diagnosis using inceptionV3 CNN architecture. In International Conference On Innovative Computing and Communication; Springer: Singapore, 2023; pp. 125–134. [Google Scholar] [CrossRef]
- He, K.; Zhang, X.; Ren, S.; Sun, J. Deep residual learning for image recognition. In Proceedings of the IEEE Conference on Computer Vision and Pattern Recognition, Las Vegas, NV, USA, 27–30 June 2016; pp. 770–778. [Google Scholar] [CrossRef]
- Chollet, F. Xception: Deep learning with depthwise separable convolutions. In Proceedings of the IEEE Conference on Computer Vision and Pattern Recognition, Honolulu, HI, USA, 21–26 July 2017; pp. 1251–1258. [Google Scholar] [CrossRef]
- Sandler, M.; Howard, A.; Zhu, M.; Zhmoginov, A.; Chen, L.C. Mobilenetv2: Inverted residuals and linear bottlenecks. In Proceedings of the IEEE Conference on Computer Vision and Pattern Recognition, Salt Lake City, UT, USA, 18–23 June 2018; pp. 4510–4520. [Google Scholar] [CrossRef]
- Asif, S.; Yi, W.; Ain, Q.U.; Hou, J.; Yi, T.; Si, J. Improving effectiveness of different deep transfer learning-based models for detecting brain tumors from MR images. IEEE Access 2022, 10, 34716–34730. [Google Scholar] [CrossRef]
- Wen, Y.; Chen, L.; Deng, Y.; Zhou, C. Rethinking pre-training on medical imaging. J. Vis. Commun. Image Represent. 2021, 78, 103145. [Google Scholar] [CrossRef]
- Selvaraju, R.R.; Cogswell, M.; Das, A.; Vedantam, R.; Parikh, D.; Batra, D. Grad-CAM: Visual explanations from deep networks via gradient-based localization. Int. J. Comput. Vis. 2020, 128, 336–359. [Google Scholar] [CrossRef]
- Zhengkun, L.; Dib, O. Empowering MRI-Based Brain Tumor Classification with Deep Learning and Grad-CAM. 2024. Available online: https://github.com/Overrated1987/Empowering-MRI-Based-Brain-Tumor-Classification-with-Deep-Learning-and-Grad-CAM/ (accessed on 22 July 2024).
- Alnemer, A.; Rasheed, J. An efficient transfer learning-based model for classification of brain tumor. In Proceedings of the 2021 5th International Symposium on Multidisciplinary Studies and Innovative Technologies (ISMSIT), Ankara, Turkey, 21–23 October 2021; pp. 478–482. [Google Scholar] [CrossRef]
- Raouf, M.H.G.; Fallah, A.; Rashidi, S. Use of Discrete Cosine-based Stockwell Transform in the Binary Classification of Magnetic Resonance Images of Brain Tumor. In Proceedings of the 2022 29th National and 7th International Iranian Conference on Biomedical Engineering (ICBME), Tehran, Iran, 21–22 December 2022; pp. 293–298. [Google Scholar] [CrossRef]
- Gómez-Guzmán, M.A.; Jiménez-Beristaín, L.; García-Guerrero, E.E.; López-Bonilla, O.R.; Tamayo-Perez, U.J.; Esqueda-Elizondo, J.J.; Palomino-Vizcaino, K.; Inzunza-González, E. Classifying brain tumors on magnetic resonance imaging by using convolutional neural networks. Electronics 2023, 12, 955. [Google Scholar] [CrossRef]
- Özkaraca, O.; Bağrıaçık, O.İ.; Gürüler, H.; Khan, F.; Hussain, J.; Khan, J.; Laila, U.e. Multiple brain tumor classification with dense CNN architecture using brain MRI images. Life 2023, 13, 349. [Google Scholar] [CrossRef]
- Shilaskar, S.; Mahajan, T.; Bhatlawande, S.; Chaudhari, S.; Mahajan, R.; Junnare, K. Machine Learning Based Brain Tumor Detection and Classification using HOG Feature Descriptor. In Proceedings of the 2023 International Conference on Sustainable Computing and Smart Systems (ICSCSS), Coimbatore, India, 14–16 June 2023; pp. 67–75. [Google Scholar] [CrossRef]
- Rasheed, Z.; Ma, Y.K.; Ullah, I.; Ghadi, Y.Y.; Khan, M.Z.; Khan, M.A.; Abdusalomov, A.; Alqahtani, F.; Shehata, A.M. Brain Tumor Classification from MRI Using Image Enhancement and Convolutional Neural Network Techniques. Brain Sci. 2023, 13, 1320. [Google Scholar] [CrossRef]
- Celik, M.; Inik, O. Development of hybrid models based on deep learning and optimized machine learning algorithms for brain tumor Multi-Classification. Expert Syst. Appl. 2024, 238, 122159. [Google Scholar] [CrossRef]
- Guan, H.; Yap, P.T.; Bozoki, A.; Liu, M. Federated learning for medical image analysis: A survey. Pattern Recognit. 2024, 151, 110424. [Google Scholar] [CrossRef]
- Dib, O.; Brousmiche, K.L.; Durand, A.; Thea, E.; Hamida, E.B. Consortium blockchains: Overview, applications and challenges. Int. J. Adv. Telecommun. 2018, 11, 51–64. [Google Scholar]
- Dib, O.; Huyart, C.; Toumi, K. A novel data exploitation framework based on blockchain. Pervasive Mob. Comput. 2020, 61, 101104. [Google Scholar] [CrossRef]
- Singh, K.; Dib, O.; Huyart, C.; Toumi, K. A novel credential protocol for protecting personal attributes in blockchain. Comput. Electr. Eng. 2020, 83, 106586. [Google Scholar] [CrossRef]
- Islam, T.; Hafiz, M.S.; Jim, J.R.; Kabir, M.M.; Mridha, M. A systematic review of deep learning data augmentation in medical imaging: Recent advances and future research directions. Healthc. Anal. 2024, 5, 100340. [Google Scholar] [CrossRef]
Disclaimer/Publisher’s Note: The statements, opinions and data contained in all publications are solely those of the individual author(s) and contributor(s) and not of MDPI and/or the editor(s). MDPI and/or the editor(s) disclaim responsibility for any injury to people or property resulting from any ideas, methods, instructions or products referred to in the content. |
© 2024 by the authors. Licensee MDPI, Basel, Switzerland. This article is an open access article distributed under the terms and conditions of the Creative Commons Attribution (CC BY) license (https://creativecommons.org/licenses/by/4.0/).