Proposing an Ontology Model for Planning Photovoltaic Systems
Abstract
:1. Introduction
2. Shading Conditions
2.1. PV Cell Model
2.2. Impacts of Shading Conditions on PV Curves: The Simulation
3. MPPT Methods
3.1. The Application of an MPPT-Based Control System
3.2. MPPTs: A Survey
4. Knowledge-Based Models
4.1. An Overview of Ontology
4.2. The Application of the Semantic Web in Energy Management
4.3. Defining the OWL Model Assertion Axioms and Their Relationships
4.4. Designing the Proposed Ontology
- Creating the class hierarchy.
- Defining the OWL properties: defining their type (functional, transitive, symmetric, reflexive, etc.) and defining their domain/range as per need.
- Describing and defining the classes created for example restrictions (axioms).
- Invoking the reasoner, checking the consistency of the ontology, and creating the inferred view.
- Creating certain individuals by assigning certain OWL properties.
- Executing the reasoner and checking it.
4.5. Ontology Reasoning and SWRL Rules
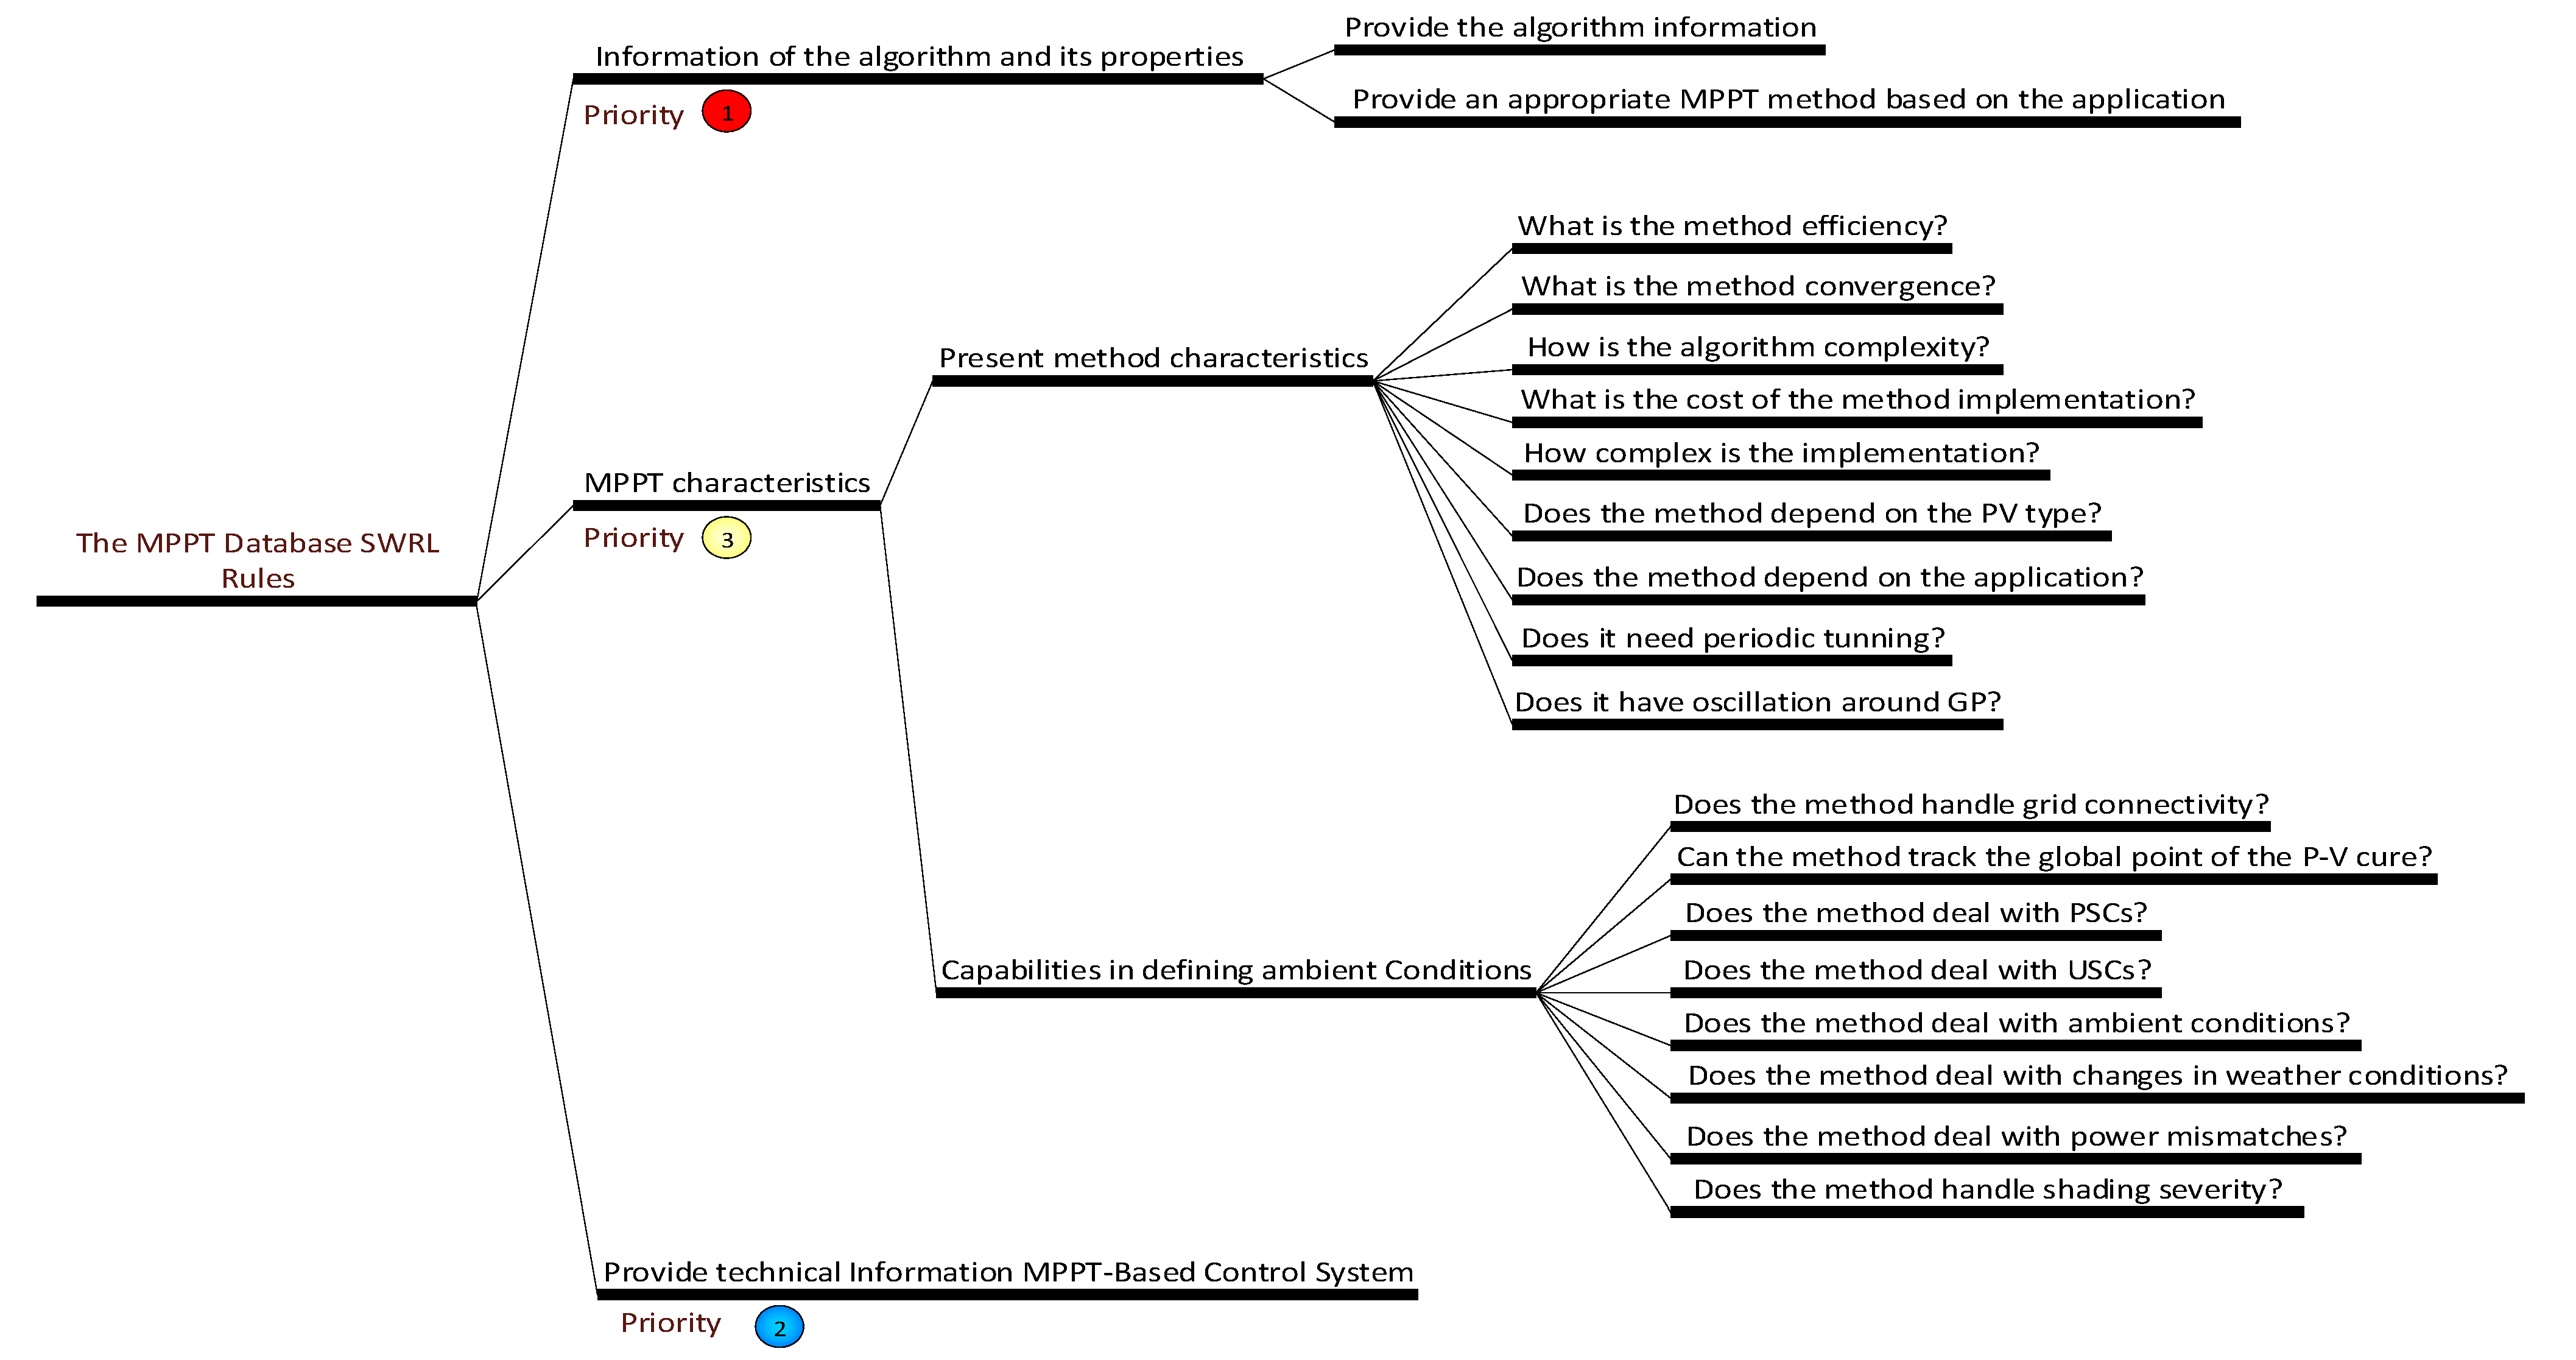
4.5.1. A Rule-Based System for MPPTs
4.5.2. SWRL Rules for Shadings and Tilt Angles
5. Validation of the Proposed Model
5.1. Adjusting Hourly Power Estimations Using the SWRL Rules
5.1.1. Investigating Environmental Factors at the PV Site
5.1.2. Studying Climate Conditions of the Site Location
5.1.3. Defining Shading Conditions due to Snowfall
5.1.4. Applying the Applicable Rules to the Hourly Productions
- Rule P28 (Shading Condition 26)—Snow Depth More Than 2.54 (cm)
- Rule P29 (Shading Condition 29)—Snow Depth Less Than 2.54 (cm)
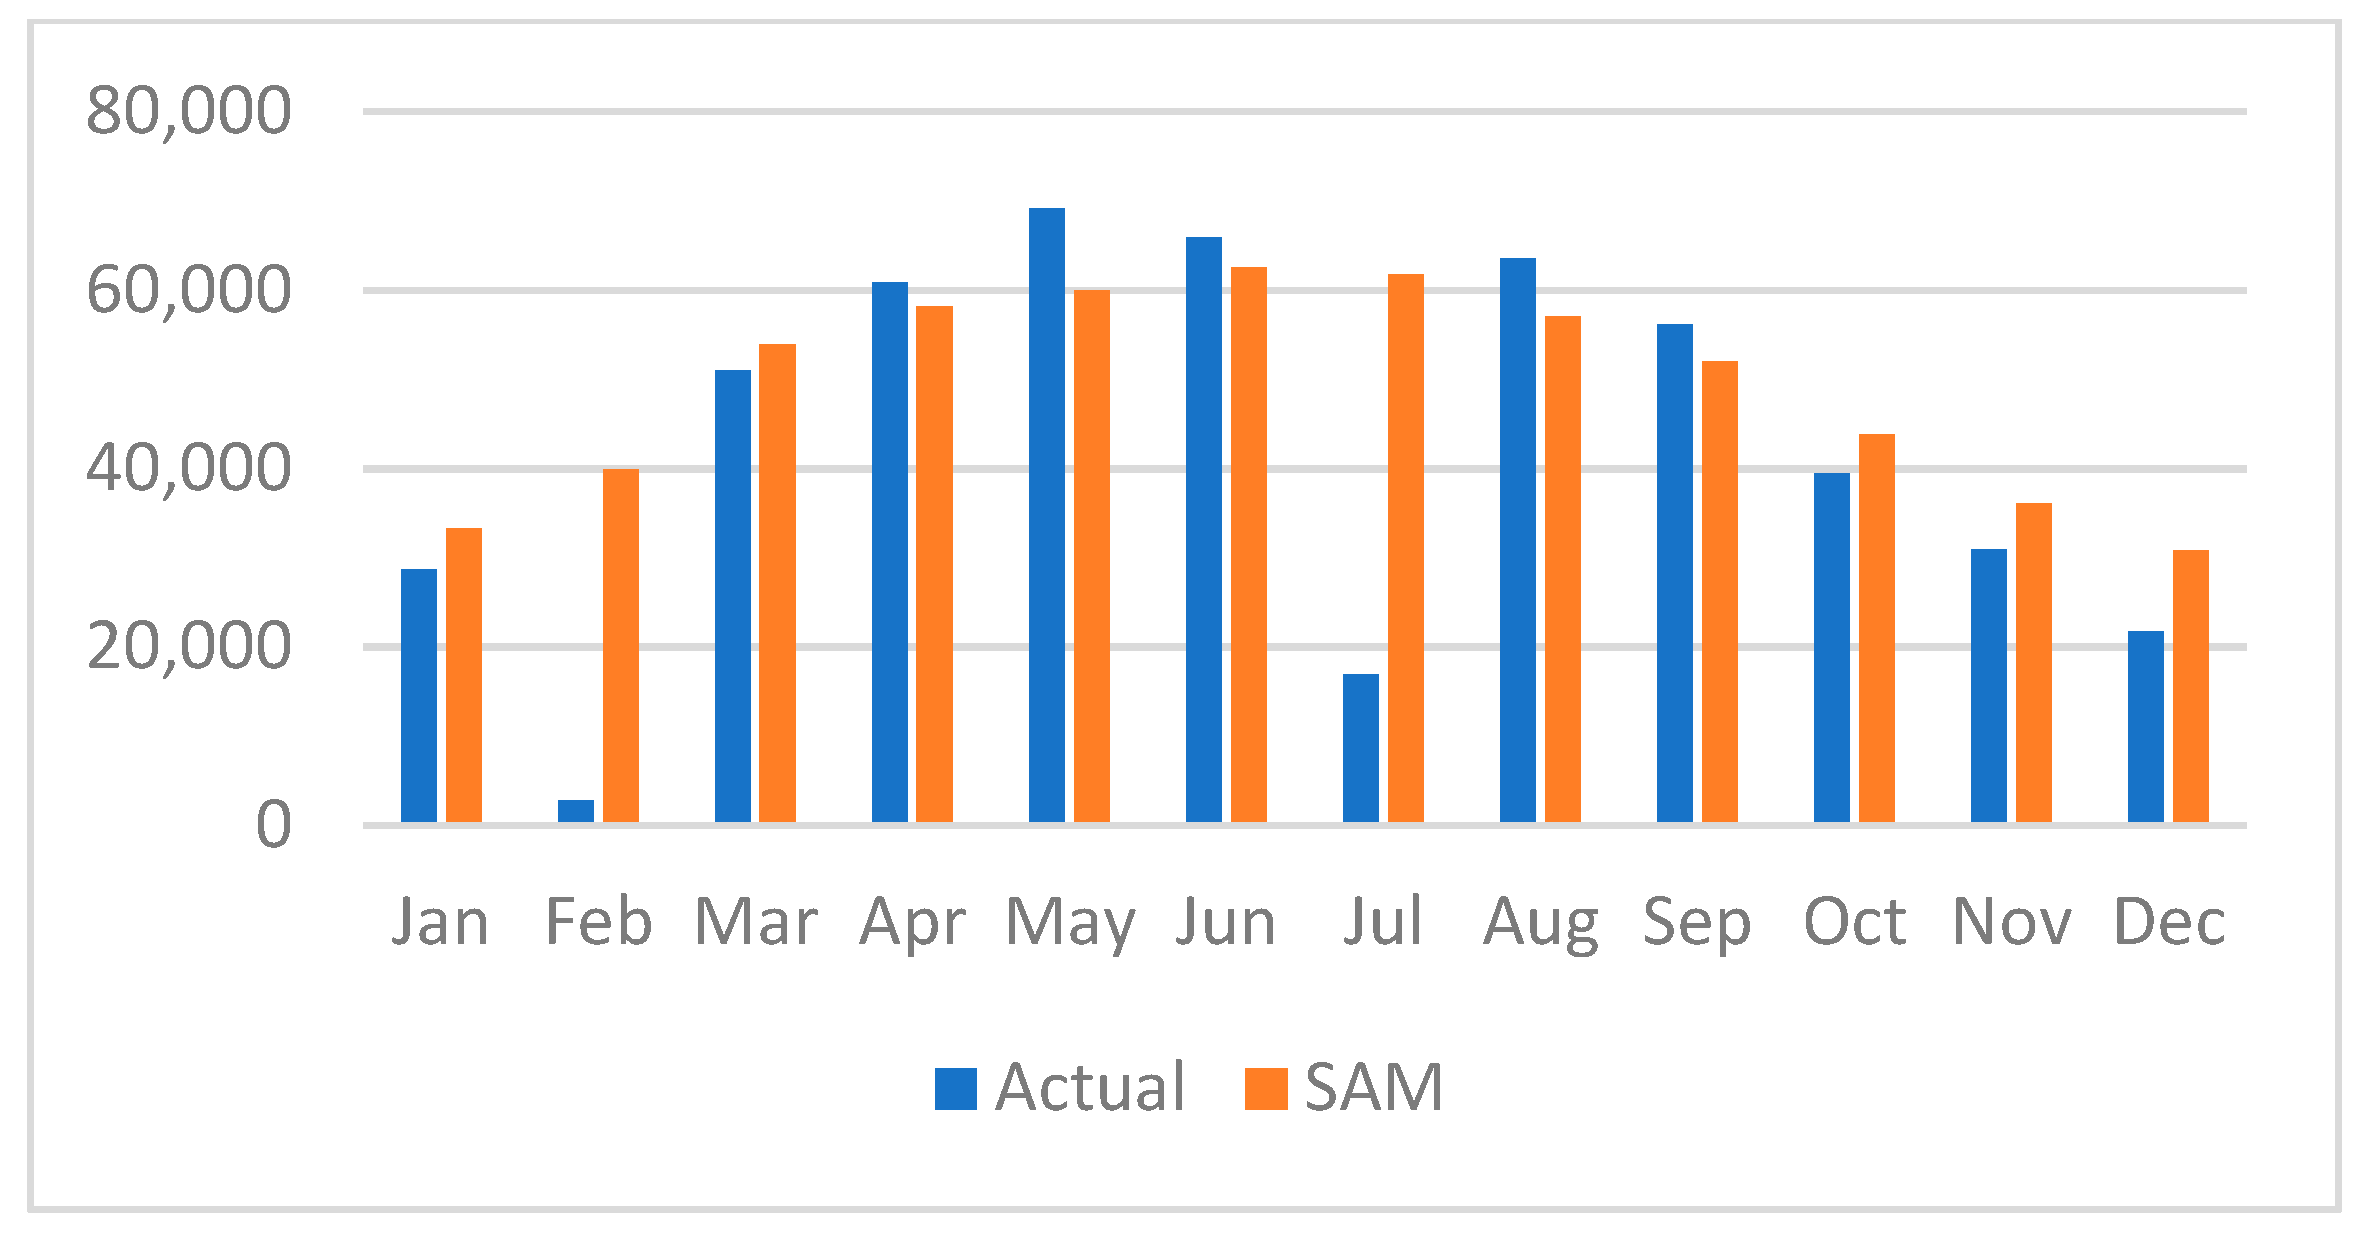
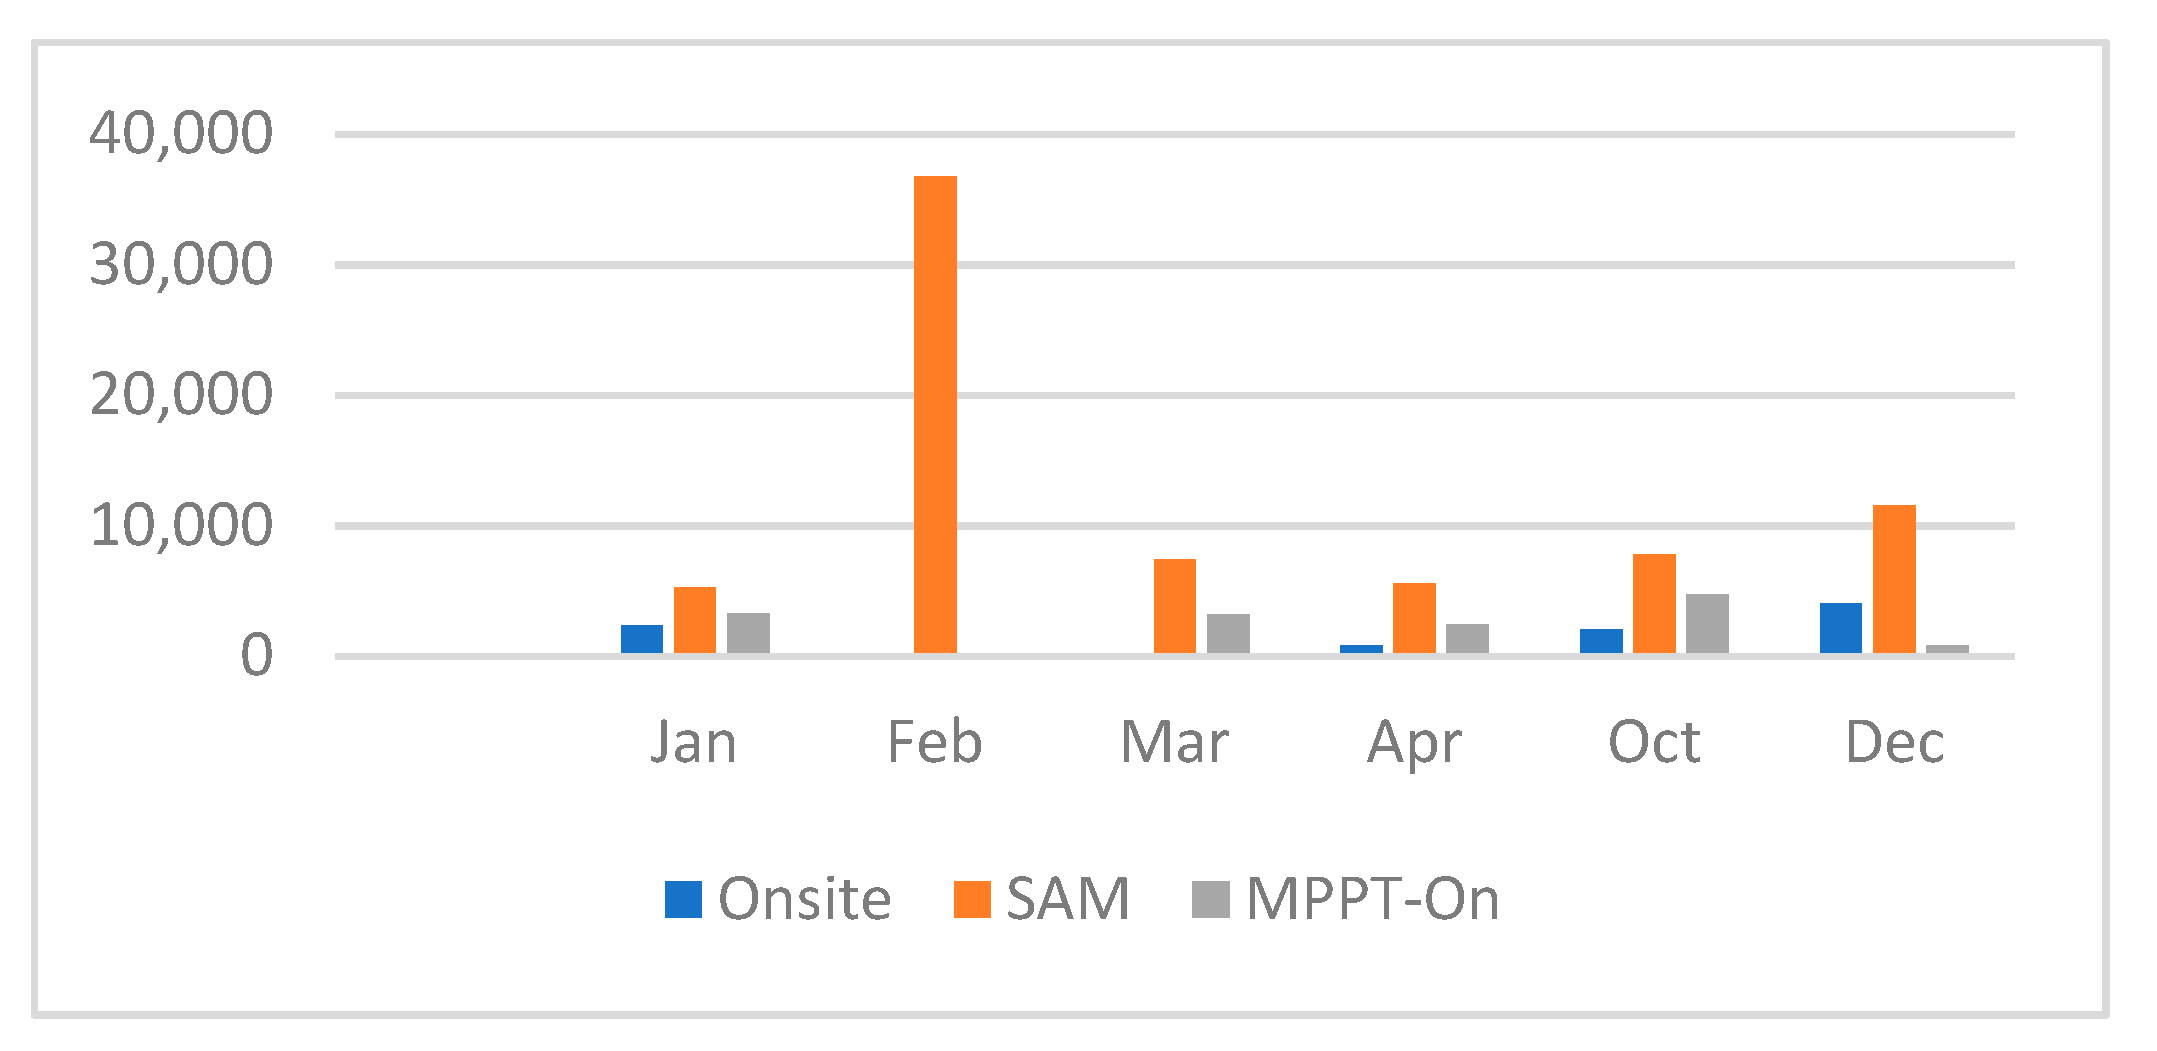
5.1.5. Implementing the Rules to the SAM Report
6. Discussion and Analysis of the Results
7. Conclusions
Author Contributions
Funding
Institutional Review Board Statement
Informed Consent Statement
Data Availability Statement
Conflicts of Interest
References
- Bloom, A.; Helman, U.; Holttinen, H.; Summers, K.; Bakke, J.; Brinkman, G.; Lopez, A. It’s Indisputable: Five Facts About Planning and Operating Modern Power Systems. IEEE Power Energy Mag. 2017, 15, 22–30. [Google Scholar] [CrossRef]
- Morales-Aragonés, J.I.; Dávila-Sacoto, M.; González, L.G.; Alonso-Gómez, V.; Gallardo-Saavedra, S.; Hernández-Callejo, L. A Review of I–V Tracers for Photovoltaic Modules: Topologies and Challenges. Electronics 2021, 10, 1283. [Google Scholar] [CrossRef]
- Morales-Aragonés, J.I.; Gallardo-Saavedra, S.; Alonso-Gómez, V.; Sánchez-Pacheco, F.J.; González, M.A.; Martínez, O.; Muñoz-García, M.A.; Alonso-García, M.d.C.; Hernández-Callejo, L. Low-Cost Electronics for Online I-V Tracing at Photovoltaic Module Level: Development of Two Strategies and Comparison between Them. Electronics 2021, 10, 671. [Google Scholar] [CrossRef]
- Canada, G.O. Renewable Energy Facts. Available online: https://www.nrcan.gc.ca/science-data/data-analysis/energy-data-analysis/energy-facts/renewable-energy-facts/20069 (accessed on 28 July 2021).
- Subiyanto, S.; Mohamed, A.; Hannan, M.A. Intelligent maximum power point tracking for PV system using Hopfield neural network optimized fuzzy logic controller. Energy Build. 2012, 51, 29–38. [Google Scholar] [CrossRef]
- Morales-Aragonés, J.I.; Alonso-García, M.d.C.; Gallardo-Saavedra, S.; Alonso-Gómez, V.; Balenzategui, J.L.; Redondo-Plaza, A.; Hernández-Callejo, L. Online Distributed Measurement of Dark I–V Curves in Photovoltaic Plants. Appl. Sci. 2021, 11, 1924. [Google Scholar] [CrossRef]
- Podder, A.K.; Roy, N.K.; Pota, H.R. MPPT methods for solar PV systems: A critical review based on tracking nature. IET Renew. Power Gener. 2019, 13, 1615–1632. [Google Scholar] [CrossRef]
- Joshi, P.; Arora, S. Maximum power point tracking methodologies for solar PV systems—A review. Renew. Sustain. Energy Rev. 2017, 70, 1154–1177. [Google Scholar] [CrossRef]
- Saravanan, S.; Ramesh Babu, N. Maximum power point tracking algorithms for photovoltaic system—A review. Renew. Sustain. Energy Rev. 2016, 57, 192–204. [Google Scholar] [CrossRef]
- Seyedmahmoudian, M.; Horan, B.; Soon, T.K.; Rahmani, R.; Oo, A.M.; Mekhilef, S.; Stojcevski, A. State of the art artificial intelligence-based MPPT techniques for mitigating partial shading effects on PV systems—A review. Renew. Sustain. Energy Rev. 2016, 64, 435–455. [Google Scholar] [CrossRef]
- Rezk, H.; Fathy, A.; Abdelaziz, A.Y. A comparison of different global MPPT techniques based on meta-heuristic algorithms for photovoltaic system subjected to partial shading conditions. Renew. Sustain. Energy Rev. 2017, 74, 377–386. [Google Scholar] [CrossRef]
- Jordehi, A.R. Maximum power point tracking in photovoltaic (PV) systems: A review of different approaches. Renew. Sustain. Energy Rev. 2016, 65, 1127–1138. [Google Scholar] [CrossRef]
- G’omez-P´erez, A. Evaluation of Ontologies. Int. J. Intell. Syst. 2001, 16, 391–409. [Google Scholar] [CrossRef]
- Fensel, D.; Harmelen, F.V.; Klein, M.; Akkermans, H. On-To-Knowledge: Ontology-based Tools for Knowledge Management. In Proceedings of the eBusiness and eWork2000 Conference, Madrid, Spain, 18–20 October 2000; pp. 1105–1110. [Google Scholar]
- Freeman, J.; Whitmore, J.; Blair, N.; Dobos, A.P. Validation of Multiple Tools for Flat Plate Photovoltaic Modeling Against Measured Data; NREL: Golden, CO, USA, 2014; p. 21.
- Kumari, P.A.; Geethanjali, P. Parameter estimation for photovoltaic system under normal and partial shading conditions: A survey. Renew. Sustain. Energy Rev. 2018, 84, 1–11. [Google Scholar] [CrossRef]
- MathWorks. PV Array. Available online: https://www.mathworks.com/help/physmod/sps/powersys/ref/pvarray.html (accessed on 28 July 2021).
- Chin, V.J.; Salam, Z.; Ishaque, K. Cell modelling and model parameters estimation techniques for photovoltaic simulator application: A review. Appl. Energy 2015, 154, 500–519. [Google Scholar] [CrossRef]
- Reza Reisi, A.; Hassan Moradi, M.; Jamasb, S. Classification and comparison of maximum power point tracking techniques for photovoltaic system: A review. Renew. Sustain. Energy Rev. 2013, 19, 433–443. [Google Scholar] [CrossRef]
- Salem, F.; Awadallah, M.A. Detection and assessment of partial shading in photovoltaic arrays. J. Electr. Syst. Inf. Technol. 2016, 3, 23–32. [Google Scholar] [CrossRef] [Green Version]
- Ross, M.M.D.; Usher, E.P. Modelled and Observed Operation of a Passive Melting Technology for Photovoltaic Arrays. In Proceedings of the 7th International Workshop on Atmosphoric Icing of Structures, Chicoutimi, QC, Canada, 3–6 June 1996; p. 6. [Google Scholar]
- Jelle, B.P. The challenge of removing snow downfall on photovoltaic solar cell roofs in order to maximize solar energy efficiency—Research opportunities for the future. Energy Build. 2013, 67, 334–351. [Google Scholar] [CrossRef] [Green Version]
- Mani, M.; Pillai, R. Impact of dust on solar photovoltaic (PV) performance: Research status, challenges and recommendations. Renew. Sustain. Energy Rev. 2010, 14, 3124–3131. [Google Scholar] [CrossRef]
- Na, W.; Carley, T.; Ketcham, L.; Zimmer, B.; Chen, P. Simple DSP Implementation of Maximum Power Pointer Tracking and Inverter Control for Solar Energy Applications. J. Power Energy Eng. 2016, 04, 61–76. [Google Scholar] [CrossRef] [Green Version]
- Mohanty, S.; Subudhi, B.; Ray, P.K. A Grey Wolf-Assisted Perturb & Observe MPPT Algorithm for a PV System. IEEE Trans. Energy Convers. 2017, 32, 340–347. [Google Scholar] [CrossRef]
- Lyden, S.; Haque, M.E. Maximum Power Point Tracking techniques for photovoltaic systems: A comprehensive review and comparative analysis. Renew. Sustain. Energy Rev. 2015, 52, 1504–1518. [Google Scholar] [CrossRef]
- Gupta, A.; Chauhan, Y.K.; Pachauri, R.K. A comparative investigation of maximum power point tracking methods for solar PV system. Sol. Energy 2016, 136, 236–253. [Google Scholar] [CrossRef]
- Elgendy, M.A.; Zahawi, B.; Atkinson, D.J. Assessment of the incremental conductance maximum power point tracking algorithm. IEEE Trans. Sustain. Energy 2013, 4, 9. [Google Scholar] [CrossRef]
- Mirjalili, S.; Mirjalili, S.M.; Lewis, A. Grey Wolf Optimizer. Adv. Eng. Softw. 2014, 69, 46–61. [Google Scholar] [CrossRef] [Green Version]
- Mirjalili, S.; Saremi, S.; Mirjalili, S.M.; Coelho, L.d.S. Multi-objective grey wolf optimizer: A novel algorithm for multi-criterion optimization. Expert Syst. Appl. 2016, 47, 106–119. [Google Scholar] [CrossRef]
- Salam, Z.; Ahmed, J.; Merugu, B.S. The application of soft computing methods for MPPT of PV system: A technological and status review. Appl. Energy 2013, 107, 135–148. [Google Scholar] [CrossRef]
- Sheraz, M.; Abido, M.A. An Efficient Approach for Parameter Estimation of PV Model Using DE and Fuzzy Based MPPT Controller. IEEE 2014, 5, 1–5. [Google Scholar]
- Sheraz, M.; Abido, M.A. An Efficient MPPT controller Using Differential Evolution and Neural Network. In Proceedings of the IEEE International Conference on Power and Energy (PECon), Kota Kinabalu Sabah, Malaysia, 2–5 December 2012; p. 6. [Google Scholar]
- Mansoor, M.; Mirza, A.F.; Ling, Q. Classification of Daily Irradiance Profiles and the Behaviour of Photovoltaic Plant Elements: The Effects of Cloud Enhancement. J. Clean. Prod. 2020, 274, 5230. [Google Scholar] [CrossRef]
- Mirza, A.F.; Mansoor, M.; Zhan, K.; Ling, Q. High-efficiency swarm intelligent maximum power point tracking control techniques for varying temperature and irradiance. Energy Elsevier 2021, 228, 120602. [Google Scholar]
- Khosrojerdi, F.; Golhkandan, N.H. Microcontroller-based Maximum Power Point Tracking Methods in Photovoltaic systems. In Proceedings of the 9th Power Electronic and Drive Systems and Technologies Conference (PEDSTC), Tehran, Iran, 13–15 February 2018. [Google Scholar]
- Shenoy, P.S.; Kim, K.A.; Johnson, B.B.; Krein, P.T. Differential power processing for increased energy production and reliability of photovoltaic systems. IEEE Trans Power Electron 2013, 68, 2968–2979. [Google Scholar] [CrossRef]
- Petrone, G.; Spagnuolo, G.; Vitelli, M. TEODI: A new technique for Distributed Maximum Power Point Tracking PV Applications. In Proceedings of the 2010 IEEE International Conference on Industrial Technology, Via del Mar, Chile, 14–17 March 2010; pp. 982–986. [Google Scholar]
- Femia, N.; Petrone, G.; Spagnuolo, G.; Vitelli, M. A new analog MPPT technique: TEODI. Prog. Photovolt. Res. Appl. 2010, 18, 28–41. [Google Scholar] [CrossRef]
- Berners-Lee, T.; Hendler, J.; Lassila, O. The Semantic Web. Sci. Am. 2001, 284, 34–43. [Google Scholar] [CrossRef]
- W3C. W3C Semantic Web Activity. Available online: https://www.w3.org/2001/sw/ (accessed on 19 June 2013).
- Zhang, J. Ontology and the Semantic Web. In Proceedings of the North American Symposium on Knowledge Organization (NASKO), Toronto, ON, Canada, 14–15 June 2007; Volume 1, pp. 9–20. [Google Scholar]
- Gruber, T.R. A Translation Approach to Portable Ontology Specifications; Knowledge Systems Laboratory Technical Report KSL 92-71; Computer Science Department, Stanford University: Stanford, CA, USA, 1992; pp. 199–220. [Google Scholar]
- Gruber, T.R. A translation approach to portable ontologies. Knowl. Acquis. 1993, 92, 199–220. [Google Scholar] [CrossRef]
- Kontopoulos, E.; Martinopoulos, G.; Lazarou, D.; Bassiliades, N. An ontology-based decision support tool for optimizing domestic solar hot water system selection. J. Clean. Prod. 2016, 112, 4636–4646. [Google Scholar] [CrossRef]
- Rospocher, M.; Ghidini, C.; Serafini, L. An Ontology for the Business Process Modelling Notation. In Frontiers in Artificial Intelligence and Applications; IOS Press: Clifton, VA, USA, 2014; Volume 267, pp. 133–146. [Google Scholar] [CrossRef]
- Golbreich, C.; Wallace, E.K. OWL 2 Web Ontology Language New Features and Rationale (Second Edition). Available online: https://www.w3.org/TR/2012/REC-owl2-new-features-20121211/ (accessed on 28 July 2021).
- Dean, M.; Schreiber, G. OWL 2 Web Ontology Language: Document Overview (Second Edition); W3C Recommendation; World Wide Web Consortium: Cambridge, MA, USA, 2012; Available online: https://www.w3.org/TR/owl2-overview/ (accessed on 28 July 2021).
- Protégé. Protégé Products. Available online: https://protege.stanford.edu/products.php (accessed on 28 July 2021).
- Daouadji, A.; Nguyen, K.K.; Lemay, M.; Cheriet, M. Ontology-based resource description and discovery framework for low-carbon grid networks. In Proceedings of the International Conference on Smart Grid Communications (SmartGridComm), Gaithersburg, MD, USA, 4–6 October 2010. [Google Scholar]
- Bonino, B.; Corno, F. DogOnt—ontology modeling for intelligent domotic environments. In Proceedings of the Semantic Web—ISWC 2008, Berlin/Heidelberg, Germany, 26–30 October 2008; 2008; pp. 790–803. [Google Scholar]
- Rossello-Busquet, A.; Brewka, L.J.; Soler, J.; Dittmann, L. OWL Ontologies and SWRL Rules Applied to Energy Management. In Proceedings of the 2011 UKSim 13th International Conference on Modelling and Simulation, Cambridge, UK, 30 March–1 April 2011; pp. 446–450. [Google Scholar]
- Keirstead, J.; Samsatli, N.; Shah, N. SynCity: An integrated tool kit for urban energy systems modeling. In Proceedings of the 5th Urban Research Symposium, Marseille, France, 28–30 June 2009. [Google Scholar]
- Keirstead, J.; Van Dam, K.H. A comparison of two ontologies for agent-based modelling of energy systems. In Proceedings of the 1st Int. Workshop on Agent Technologies for Energy Systems (ATES 2010), Workshop of the 9th International Conference on Autonomous Agents and Multiagent Systems (AAMAS 2010), Toronto, ON, Canada, 10–11 May 2010. [Google Scholar]
- Abanda, F.H.; Tah, J.H.M.; Duce, D. PV-TONS: A photovoltaic technology ontology system for the design of PV-systems. Eng. Appl. Artif. Intell. 2013, 26, 1399–1412. [Google Scholar] [CrossRef]
- Ferndndez, M.; Gomez-Perez, A.; Juristo, N. Methontology: From Ontological Art Towards Ontological Engineering. In Proceedings of the AAAI-97 Spring Symposium Series, Palo Alto, CA, USA, 24–25 March 1997; p. 8. [Google Scholar]
- Suárez-Figueroa, M.C.; Gómez-Pérez, A.; Fernández-López, M. The NeOn Methodology for Ontology Engineering. In Ontology Engineering in a Networked World; Springer: Berlin, Germany, 2012; pp. 9–34. [Google Scholar] [CrossRef]
- Breitman, K.; Casanova, M.A.; Truszkowski, W. Semantic Web Concepts, Technologies and Applications; Springer: London, UK, 2007. [Google Scholar]
- Noy, N.F.; McGuinness, D.L. Ontology Development 101: A Guide to Creating Your First Ontology; Stanford University: Stanford, CA, USA, 2001; p. 25. [Google Scholar]
- Khosrojerdi, F. Maximum Power Point Tracking Ontology (MPPT-On). 2019. Available online: https://github.com/khof01/ontology (accessed on 28 July 2021).
- Horrocks, I.; Patel-Schneider, P.F.; Boley, H.; Tabet, S.; Grosof, B.; Dean, M. SWRL: A Semantic Web Rule Language Combining OWL and RuleML. Available online: https://www.w3.org/Submission/SWRL/ (accessed on 28 July 2021).
- O’Conner, M.; Das, A. SQWRL: A Query Language for OWL. In Proceedings of the 6th International Workshop on OWL: Experiences and Directions (OWLED 2009), Chantilly, VA, USA, 23–24 October 2009. [Google Scholar]
- Sirin, E.; Parsia, B.; Grau, B.C.; Kalyanpur, A.; Katz, Y. Pellet: A practical OWL-DL reasoner. J. Web Semant. 2007, 5, 51–53. [Google Scholar] [CrossRef]
- Mohamed, A.O.; Hasan, A. Effect of Dust Accumulation on Performance of Photovoltaic Solar Modules in Sahara Environment. J. Basic Appl. Sci. Res. 2012, 7, 11030–11036. [Google Scholar]
- Hassan, A.H.; Rahoma, U.; Elminir, H.; Fathy, A.M. Effect of airborne dust concentration on the performance of PV modules. J. Astron. Soc. Egypt 2005, 13, 24–38. [Google Scholar]
- Fouada, M.M.; Lamia, A.S.; Morgan, E.I. An integrated review of factors influencing the performance of photovoltaic panels. Renew. Sustain. Energy Rev. 2017, 80, 1499–1511. [Google Scholar] [CrossRef]
- Kalogirou, S.A.; Agathokleous, R.; Panayiotou, G. On-site PV characterization and the effect of soiling on their performance. Elsevier J. Energy 2013, 51, 439–446. [Google Scholar] [CrossRef]
- Zorrilla-Casanova, J.; Piliougine, M.; Carretero, J.; Bernaola, P.; Carpena, P.; Mora-Lopez, L.; Sidrach-de-Cardona, M. Analysis of dust losses in photovoltaic modules. In World Renewable Energy Congress; Linköping University Electronic Press: Linköping, Sweden, 2011. [Google Scholar]
- Adinoyi, M.J.; Said, S.A. Effect of dust accumulation on the power outputs of solar photovoltaic modules. Elsevier J. Renew. Energy 2013, 60, 633–636. [Google Scholar] [CrossRef]
- Ibrahim, A. Effect of shadow and dust on the performance of silicon solar cell. Basic. Appl. Sci. Res. 2011, 1, 222–230. [Google Scholar]
- Mohandes, B.M.A.; El-Chaar, L.; Lamont, L.A. Application study of 500W photovoltaic (PV) system in the UAE. Appl. Sol. Energy 2009, 45, 242–247. [Google Scholar] [CrossRef]
- Touati, F.; Massound, A.M. Effects of environmental and climatic conditions on PV efficiency in Qatar. In Proceedings of the International Conference on Renewable Energies and Power Quality (ICREPQ’13), Bilbao, Spain, 20–22 March 2013. [Google Scholar]
- Boykiw, E. The Effect of Settling Dust in the Arava Valley on the Performance of Solar Photovoltaic Panels. Boykiw Thesis, Allegheny College, Meadville, PA, USA, 2011. [Google Scholar]
- Tanesab, J.; Parlevliet, D.; Whale, J.; Urmee, T.; Pryor, T. The contribution of dust to performance degradation of PV modules in a temperate climate zone. Elsevier J. Sol. Energy Build. 2015, 120, 147–157. [Google Scholar] [CrossRef] [Green Version]
- Mastekbayeva, G.A.; Kumar, S. Effect of dust on the transmittance of low density polyethylene glazing in a tropical climate. Sol. Energy 2003, 2, 135–141. [Google Scholar] [CrossRef]
- Zaihidee, F.M.; Mekhilef, S.; Seyedmahmoudian, M.; Horan, B. Dust as an unalterable deteriorative factor affecting PV panel’s efficiency: Why and how. Renew. Sustain. Energy Rev. 2016, 65, 1267–1278. [Google Scholar] [CrossRef]
- Piliougine, M.; Carretero, J.; Sidrach-de-Cardona, M.; Montiel, D.; Sánchez-Friera, P. Comparitive analysis of the dust losses in photovoltaic modules with different cover glasses. In Proceedings of the 23rd European Photovoltaic Solar Energy Conference and Exhibition, Valencia, Spain, 1–5 September 2008; p. 3. [Google Scholar]
- Powers, L.; Newmiller, J.; Townsend, T. Measuring and modeling the impact of snow on photovoltaic system performance. IEEE 2010, 6, 973–978. [Google Scholar]
- Hussein, A.K.; Khatib, T.; Sopian, K.; Buttinger, F.; Elmenreich, W.; Albusaidi, A.S. Effect of Dust Deposition on the Performance of Multi-Crystalline Photovoltaic Modules Based on Experimental Measurements. Int. J. Renew. Energy Res. 2013, 3, 4. [Google Scholar]
- Sandell, M. The Effect of Snowfall on the Power Output of Photovoltaic Solar Panels in Halifax, NS; Dalhousie University: Halifax, NS, Canada, 2012. [Google Scholar]
- Nakagawa, S.; Tokoro, T.; Nakano, T.; Hayama, K.; Ohyama, H.; Yamaguchi, T. An effect of snow for electric energy generation by 40kw PV system. In Proceedings of the 3rd World Cotfiwrrce on Photovoltaic Energy Conversion, Osaka, Japan, 11–18 May 2003; pp. 2447–2450. [Google Scholar]
- Becker, G.; Schiebelsberger, B.; Weber, W.; Vodermayer, C.; Zehner, M.; Kummerle, G. An approach to the impact of snow on the yield of grid connected PV systems. Bavar. Assoc. Promot. Solar Energy Munich. 2006, 1–4. Available online: citeseerx.ist.psu.edu/viewdoc/download?doi=10.1.1.464.8842&rep=rep1&type=pdf (accessed on 3 August 2020).
- Rob, W.A.; Pearce, J.M. Prediction of Energy Effects on Photovoltaic Systems due to Snowfall Events. IEEE 2011, 6, 3386–3391. [Google Scholar]
- Stridh, B. Evaluation of economical benefit of cleaning of soiling and snow in PV plants at three European locations. IEEE 2011, 4, 1448–1451. [Google Scholar]
- Andrews, R.W.; Pollard, A.; Pearce, J.M. The effects of snowfall on solar photovoltaic performance. Sol. Energy 2013, 92, 84–97. [Google Scholar] [CrossRef] [Green Version]
- Marion, B.; Schaefer, R.; Caine, H.; Sanchez, G. Measured and modeled photovoltaic system energy losses from snow for Colorado and Wisconsin locations. Sol. Energy 2013, 97, 112–121. [Google Scholar] [CrossRef]
- Babatunde, A.A.; Abbasoglu, S.; Senol, M. Analysis of the impact of dust, tilt angle and orientation on performance of PV Plants. Renew. Sustain. Energy Rev. 2018, 90, 1017–1026. [Google Scholar] [CrossRef]
- Elminir, H.K.; Ghitas, A.E.; Hamid, R.H.; El-Hussainy, F.; Beheary, M.M.; Abdel-Moneim, K.M. Effect of dust on the transparent cover of solar collectors. Elsevier J. Energy Convers Manag. 2006, 47, 3192–3203. [Google Scholar] [CrossRef]
- Mehrtash, M.; Rousse, D.R.; Quesada, G. Effects of surroundings snow coverage and solar tracking on photovoltaic systems operating in Canada. J. Renew. Sustain. Energy 2013, 5, 053119. [Google Scholar] [CrossRef]
- NREL. PV Case Studies and Validation. Laboratory, N.R.E., Ed. 2014. Available online: https://sam.nrel.gov/photovoltaic/pv-validation.html (accessed on 28 July 2021).
- Freeman, J.; Whitmore, J.; Kaffine, L.; Blair, N.; Dobos, A.P. System Advisor Model: Flat Plate Photovoltaic Performance Modeling Validation Report; National Renewable Energy Laboratory: Golden, CO, USA, 2013.
- 2012 Air Quality Data Report Air Pollution Control Division; Colorado Department of Public Health and Environment: Denver, CO, USA, 2013.
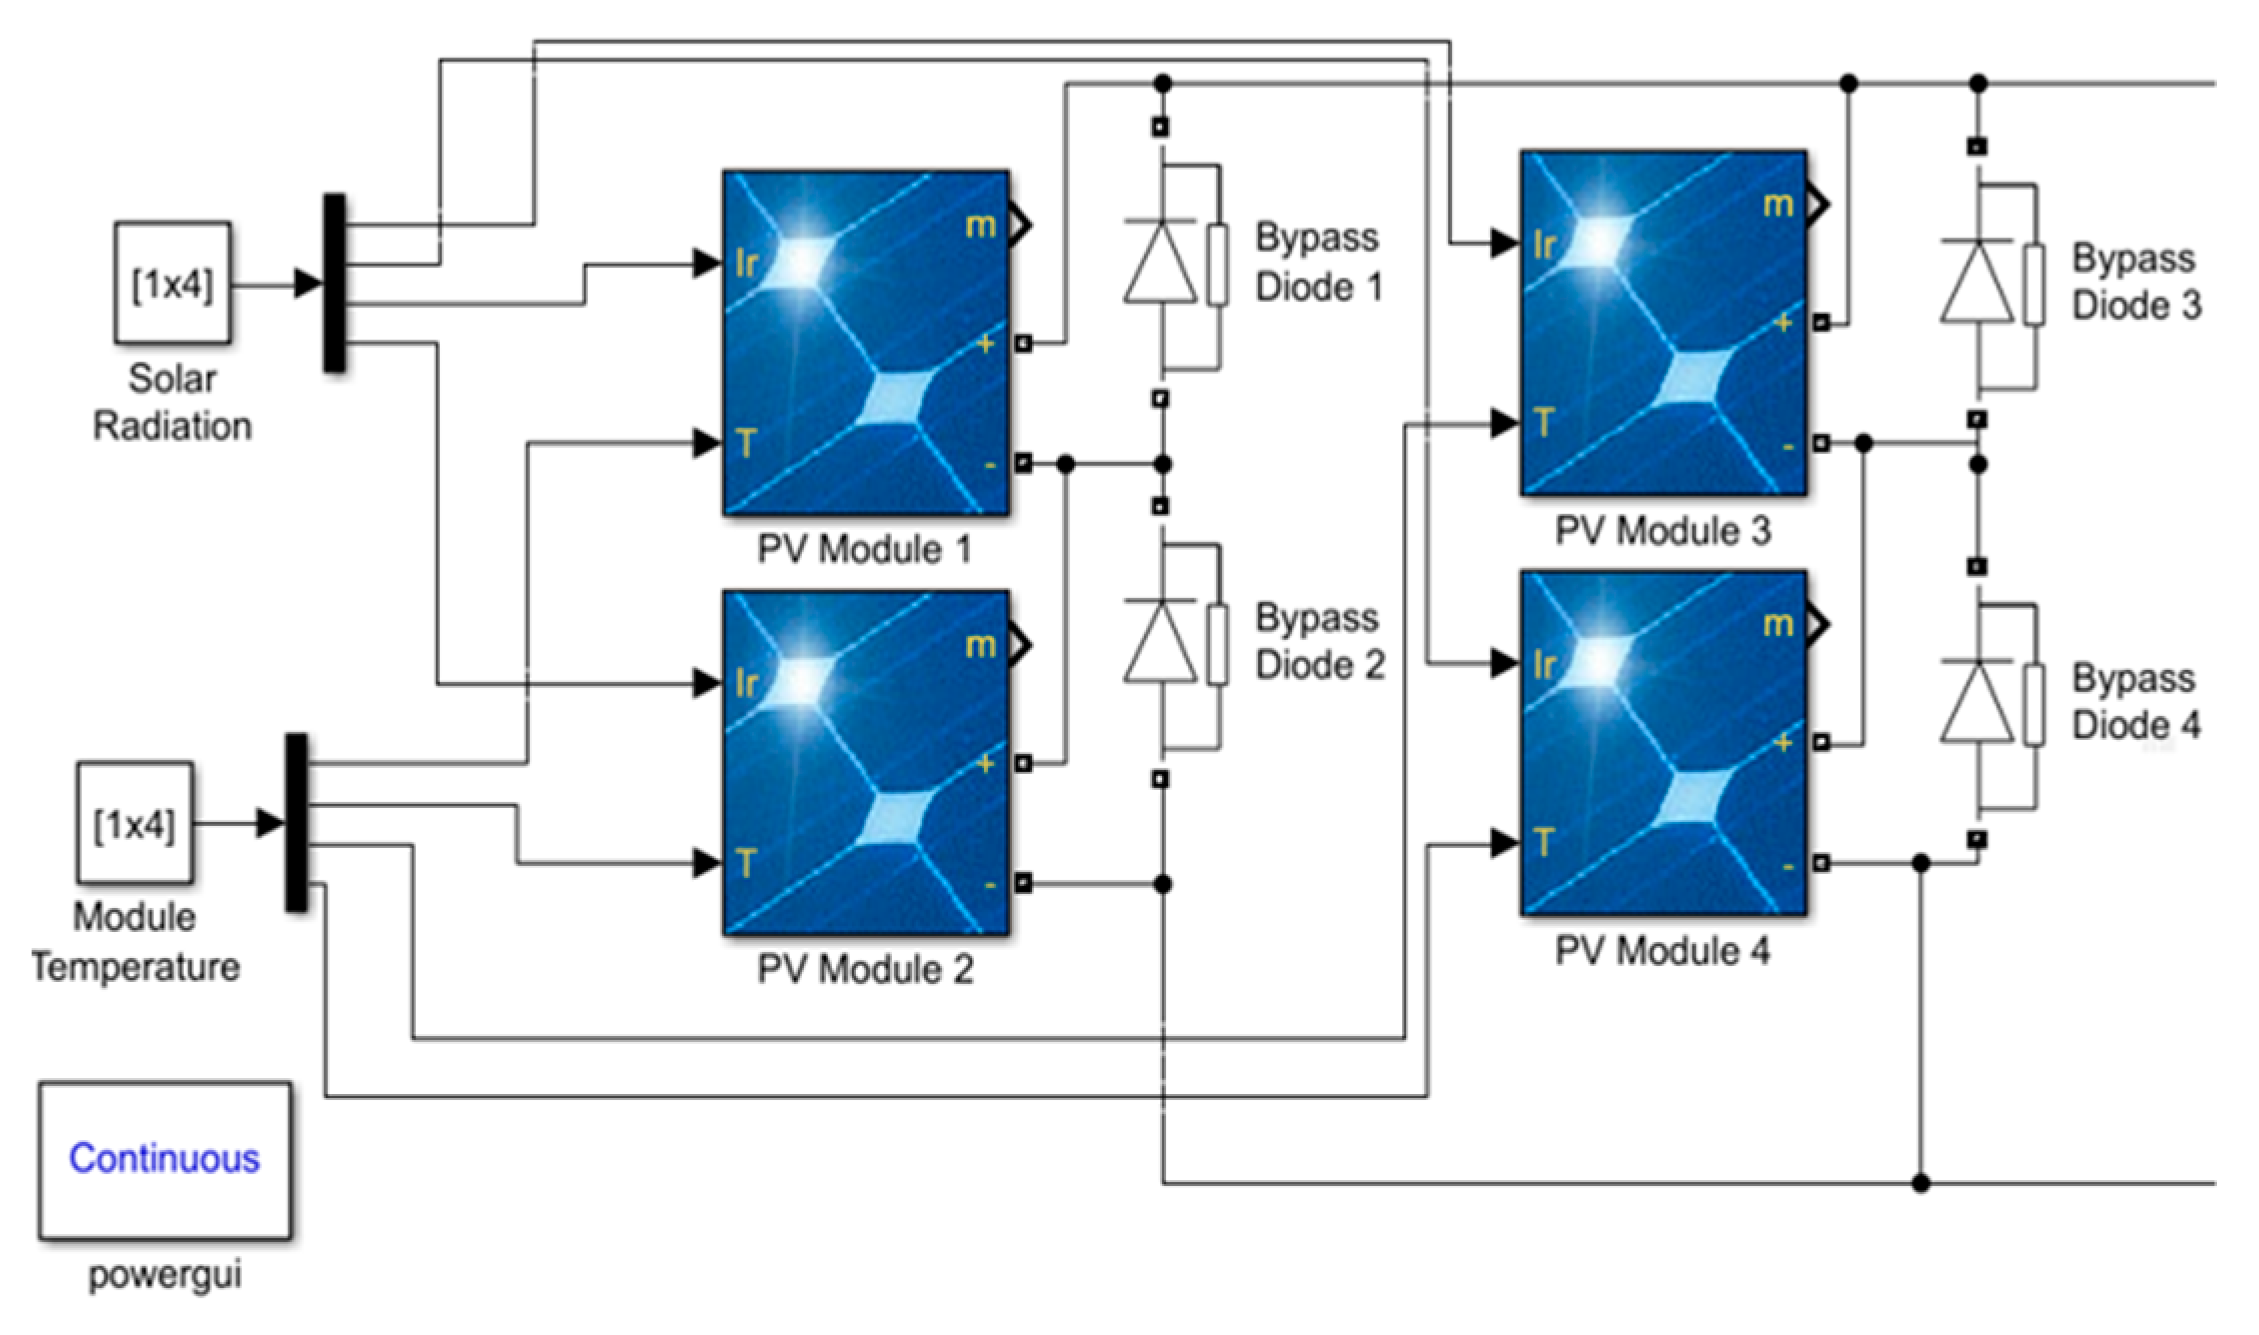

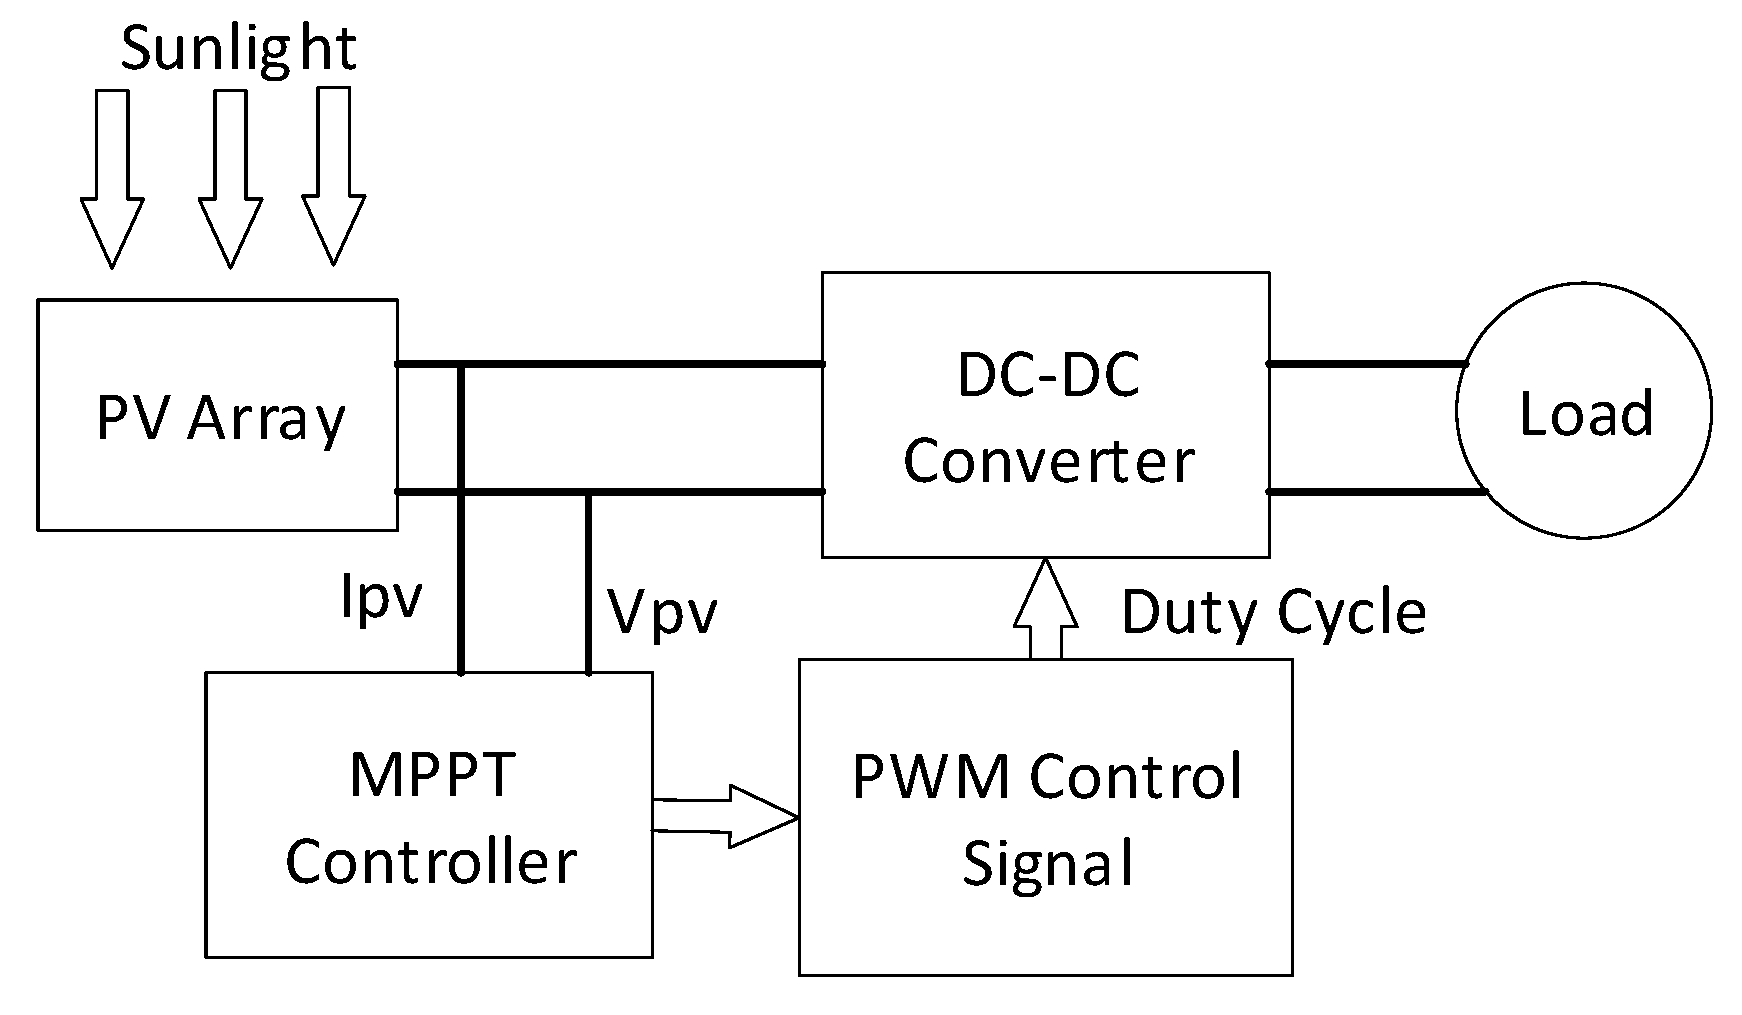
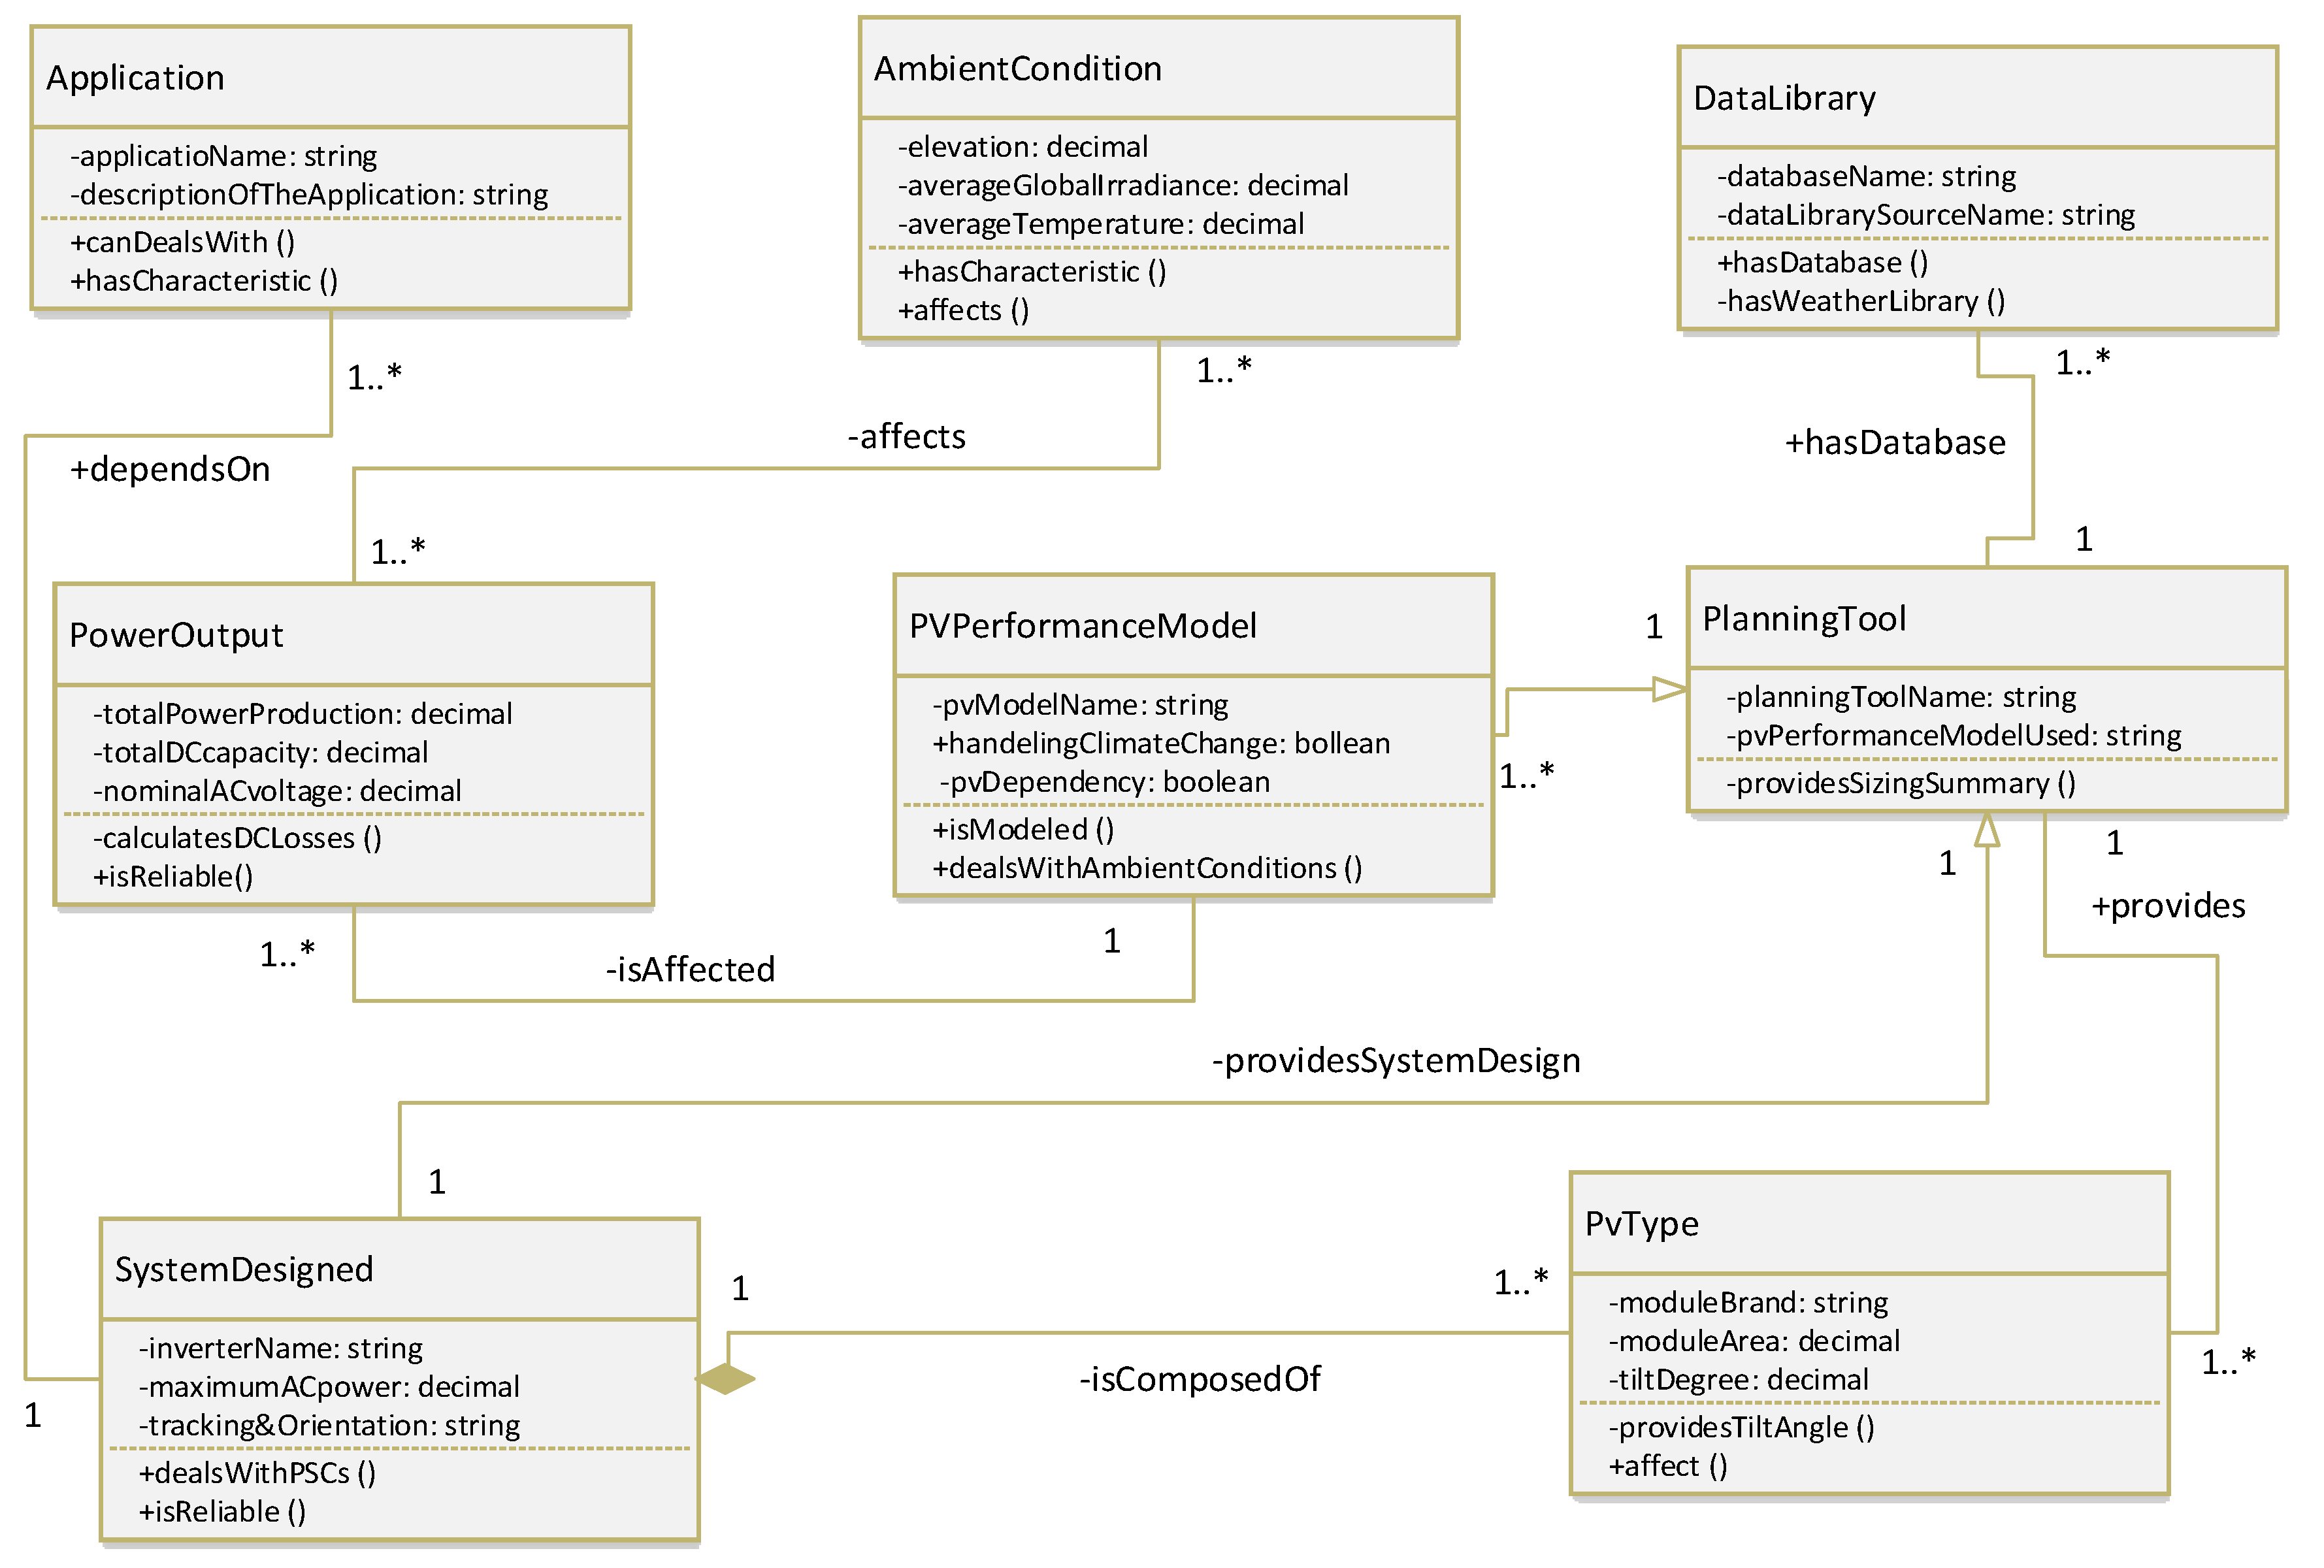
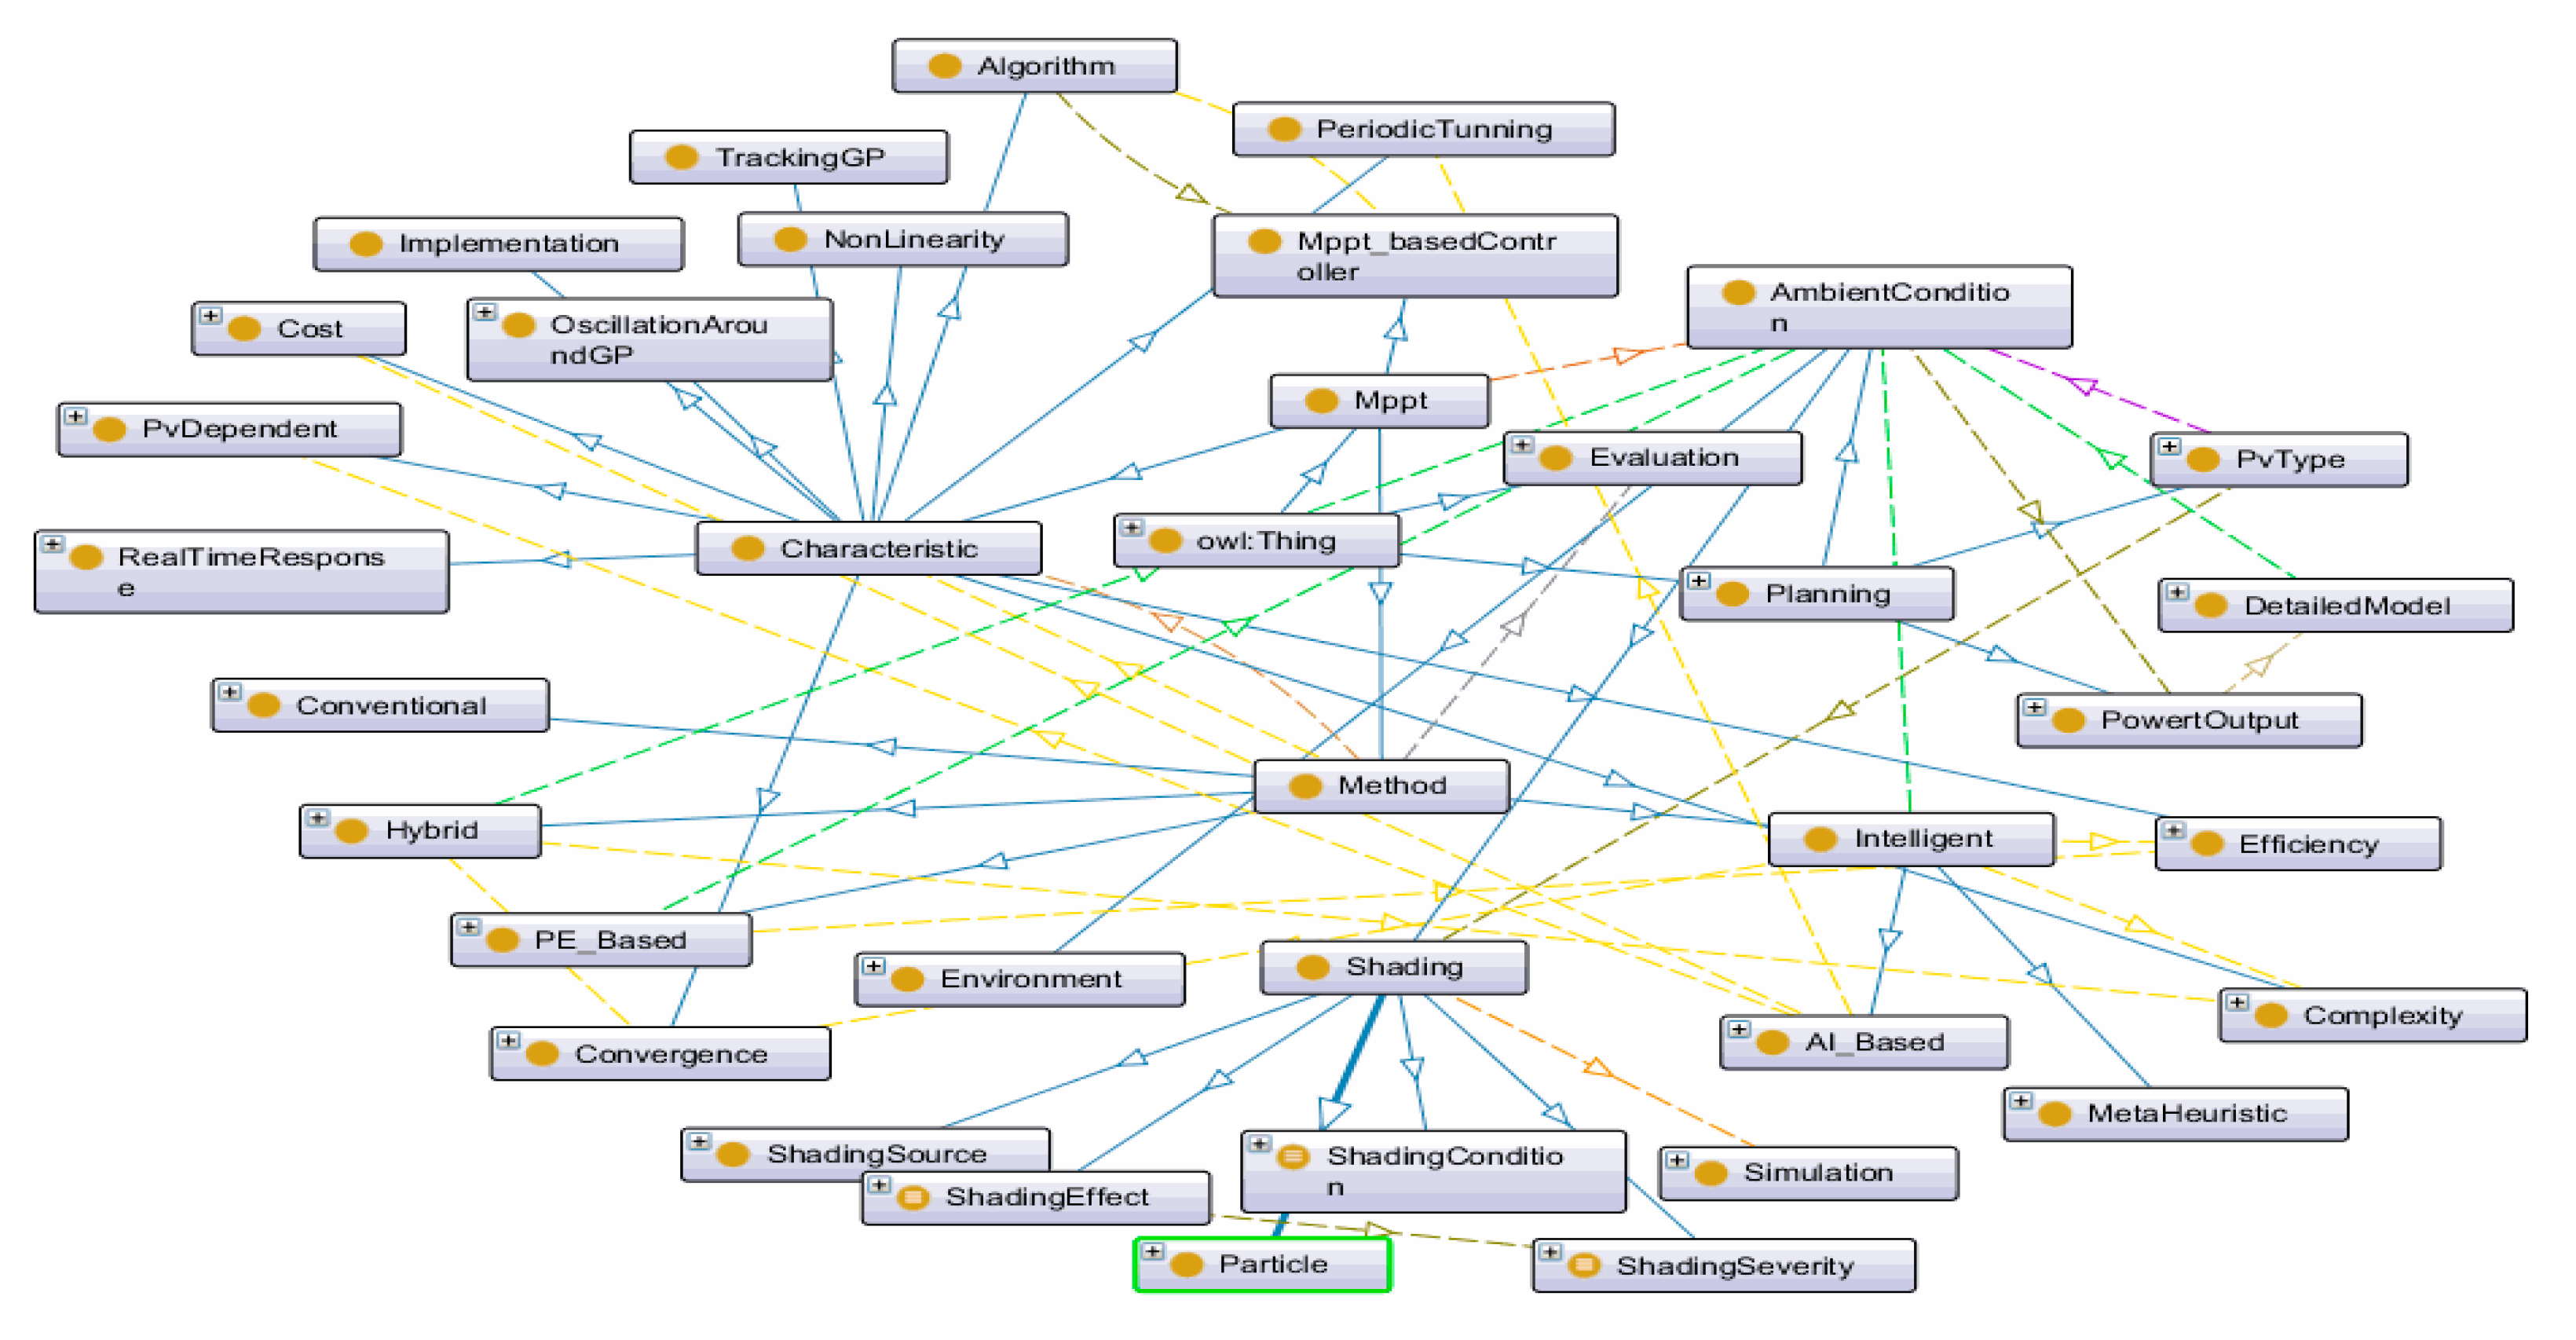
| Parameter | Value |
|---|---|
| Maximum power (PMAX) | 213.15 (W) |
| Open circuit voltage (VOC) | 36.3 (V) |
| Voltage at MPP (VMPP) | 29 (V) |
| Cells per module | 60 |
| Short-circuit current (ISC) | 7.84 (A) |
| Current at MPP (IMPP) | 7.35 (A) |
| Particle Type | Effect on PV Performance |
|---|---|
| Dust and Sand | 2–2.5% decrease in power [64] |
| Airborne Dust | At least 33.5% decrease in efficiency [65] |
| Cement Dust | 80% drop in PV short circuit voltage (deposition of 73 g/m2) [66] |
| Dust | 6–13% decrease in output power ([67]) |
| Average of 4.4% daily energy loss that could increase to 20% in dry conditions [68] | |
| 50% reduction in the power for the panels exposed without cleaning for six months [69] | |
| 2.78% daily reduction for silicon solar panels in short circuit current [70] | |
| 10% power reduction after 5 weeks of the exposure (UAE) and 10% in module efficiency [71,72] | |
| 5–6% decrease in module efficiency [73] | |
| 16–29% degradation of energy yield of 7 different PV modules without any cleaning procedure for 18 years [74] | |
| 11% reduction in the energy production (5 g/m2 dust deposition) [75] | |
| 15–21% decrease in the short circuit current [76] | |
| 2–6% reduction in the open circuit voltage [76] | |
| 15–35% degradation for the efficiency [76] | |
| About 15% losses with periods without rain [77] | |
| 5% or more annual energy losses [78] | |
| Sand | About 4% reduction in PV voltage [79] |
| Red Soil | About 7% decrease in voltage [79] |
| Ash | 25% PV voltage reduction [79] |
| Calcium Carbonate | 5% reduction in PV voltage [79] |
| Silica Gel | About 4% reduction in PV voltage [79] |
| Particle Type | Effect on PV Performance |
|---|---|
| Cloud | 77% reduction in power output [80] |
| Snow | 50% lower than evaluated PV energy [81] |
| 0.3–2.7% decrease in annual yield [82] | |
| 4.25% yearly energy loss [83] | |
| 1.5–5.2% of one year’s production [84] | |
| Snow depth > 2.54 (CM) cause 45% of daily loss, and < 2.54 (CM) cause 11% daily loss (for 30° module angle) [85] Snow depth > 2.54 (CM) cause 26% of daily loss, and < 2.54 (CM) cause 5% daily loss (for 40° module angle) [85] | |
| 1–12% annual energy production losses [86] |
| Inclination | Effect on PV Performance |
|---|---|
| 25° tilt angle | Power is 5.6% to 17.3% higher than 6° tilt depending to the site plant [87] |
| 45° tilt angle | 17.4% energy loss per month for south-facing panels [88] |
| 23° tilt angle | 70% losses in winter months [78] |
| 40° tilt angle | 40% reductions in winter months [78] |
| 0° tilt angle | 18% losses in generation [78] |
| 24° tilt angle | 15% losses (annually estimated) [78] |
| 39° tilt angle | 12% losses (annually estimated) [78] |
| Dual axis | Produce about 30% more electricity than the tilted system [89] |
| 30° tilt angle | Snow depth > 2.54 (CM) cause 45% of daily loss, and < 2.54 (CM) cause 11% daily loss [85] |
| 40° tilt angle | Snow depth > 2.54 (CM) cause 26% of daily loss, and < 2.54 (CM) cause 5% daily loss [85] |
| Technical Term | Value |
|---|---|
| Nameplate DC capacity | 408.018 (kWdc) |
| Total AC capacity | 500 (kWac) |
| Inverters—number and type | 2 (SMA America: SC250U-480V) |
| Modules—number and type | 1295 (SunPower SPR-315E-WHT-D) |
| Number of strings | 185 |
| Month | Snow Data |
|---|---|
| Jan | (7th–22nd) > 2.54 (cm), (17th–19th) < 2.54 (cm) |
| Feb | (3rd–22nd) and (23rd–25th) > 15 (cm) full shading |
| Dec | (19th–21st) > 15 (cm) full shading, (24th–29th) > 2.54 (cm) |
| Month | Onsite * | SAM * | Rules * | Shading Hours | SAM/Onsite * | Rules/Onsite * | p-Value | ||
|---|---|---|---|---|---|---|---|---|---|
| Mean | ST. Dev. | Mean | ST. Dev. | ||||||
| Jan | 2346.99 | 5288.22 | 3240.35 | 47 | 389.811 | 563.468 | 102.209 | 203.819 | 0.0009 |
| Feb | 39.54 | 36731.67 | 39.54 | 261 | 928.94 | 617.641 | 1 | 0 | 4.4 × 10−69 |
| Dec | 4054.73 | 11,572.01 | 853.34 | 105 | 504.572 | 530.747 | 1.501 | 7.242 | 1.5 × 10⁻¹⁶ |
Publisher’s Note: MDPI stays neutral with regard to jurisdictional claims in published maps and institutional affiliations. |
© 2021 by the authors. Licensee MDPI, Basel, Switzerland. This article is an open access article distributed under the terms and conditions of the Creative Commons Attribution (CC BY) license (https://creativecommons.org/licenses/by/4.0/).
Share and Cite
Khosrojerdi, F.; Gagnon, S.; Valverde, R. Proposing an Ontology Model for Planning Photovoltaic Systems. Mach. Learn. Knowl. Extr. 2021, 3, 582-600. https://doi.org/10.3390/make3030030
Khosrojerdi F, Gagnon S, Valverde R. Proposing an Ontology Model for Planning Photovoltaic Systems. Machine Learning and Knowledge Extraction. 2021; 3(3):582-600. https://doi.org/10.3390/make3030030
Chicago/Turabian StyleKhosrojerdi, Farhad, Stéphane Gagnon, and Raul Valverde. 2021. "Proposing an Ontology Model for Planning Photovoltaic Systems" Machine Learning and Knowledge Extraction 3, no. 3: 582-600. https://doi.org/10.3390/make3030030
APA StyleKhosrojerdi, F., Gagnon, S., & Valverde, R. (2021). Proposing an Ontology Model for Planning Photovoltaic Systems. Machine Learning and Knowledge Extraction, 3(3), 582-600. https://doi.org/10.3390/make3030030


