Article

Monitoring Users’ Behavior: Anti-Immigration Speech Detection on Twitter

1
School of Computing, Edinburgh Napier University, Edinburgh EH10 5DT, UK
2
School of Computing and Informatics, Bournemouth University, Poole BH12 5BB, UK
3
Department of Informatics, Athens University of Economics and Business, 104 34 Athina, Greece
*
Author to whom correspondence should be addressed.
Mach. Learn. Knowl. Extr. 2020, 2(3), 192-215; https://doi.org/10.3390/make2030011
Submission received: 25 June 2020 / Revised: 29 July 2020 / Accepted: 30 July 2020 / Published: 3 August 2020
(This article belongs to the Section Privacy)

Abstract

:
The proliferation of social media platforms changed the way people interact online. However, engagement with social media comes with a price, the users’ privacy. Breaches of users’ privacy, such as the Cambridge Analytica scandal, can reveal how the users’ data can be weaponized in political campaigns, which many times trigger hate speech and anti-immigration views. Hate speech detection is a challenging task due to the different sources of hate that can have an impact on the language used, as well as the lack of relevant annotated data. To tackle this, we collected and manually annotated an immigration-related dataset of publicly available Tweets in UK, US, and Canadian English. In an empirical study, we explored anti-immigration speech detection utilizing various language features (word n-grams, character n-grams) and measured their impact on a number of trained classifiers. Our work demonstrates that using word n-grams results in higher precision, recall, and f-score as compared to character n-grams. Finally, we discuss the implications of these results for future work on hate-speech detection and social media data analysis in general.

1. Introduction

Social Networking Sites (SNS) have been established as an important aspect of people’s lives in modern society, seeping into many aspects of our everyday life, both private and public. The number of worldwide social media users as of February 2019 is equal to 3.484 billion people, which is about 45% of the total world population, representing an increase of 280 million between January 2018 and February 2019 [1]. Only in the UK, approximately 45 million people use some kind of social media platform, and this equates to a staggering 67% of the total UK population. In the United States and Canada, these numbers climb even higher at 70% [2].
The revolution of WEB 2.0, transformed the web content from static into dynamic, which enables users to generate online content. This evolution essentially gave a voice to almost everyone capable of being a part of an online community, thus enabling the expression of opinions. However, as SNS represent the everyday social interactions, the online expression of opinions came along with some side effects, one of the most important being hate speech. Hate speech is often the expression of xenophobia also known as anti-immigration speech, which are quite broad terms. According to Cambridge dictionary [3], hate speech is defined as public speech that expresses hate or encourages violence towards a person or group based on something such as race, religion, sex, or sexual orientation. For the purpose of this paper, we will refer to anti-immigration speech as extreme dislike or fear of foreigners, their customs and their religions. The presence of anti-immigration sentiments both in private and public can be motivated by several reasons with terrorist attacks being one of the extreme examples, however often having profound influence on rising anti-immigration sentiments [4]. Politics is another influencing factor, which not only can spark debates about immigration, but also openly display anti-immigration attitudes. Such examples include the 2012 UK Home Office hostile environment policy [5] and the BREXIT campaign [6]. However, it appears that not only political issues can be associated with anti-immigration discourse. The recent outbreak of Coronavirus in China has led to many cases of xenophobic attacks both in real-world and online, where often discourse crossed the thin border between being concerned about own safety and anti-Chinese sentiment [7].
A common theme among such events is that they trigger an intense public debate, which in modern times often takes place in cyberspace, usually through social networks. This leads to privacy concerns, as harvesting user-generated data has become almost effortless, especially concerning public social networks, such as Twitter, which, on one hand, distributes its data freely via Application Programming Interfaces (APIs), and on the other hand seems to treat private data as a valuable asset, by providing paid premium access to its APIs that can enhance data mining capabilities. The availability of user data in combination with provocative events, motivated several academic studies. For example, hate speech on Twitter was examined during and after the most recent US election campaign, using a significant corpus of Tweets originating from US users [8], along with 50 million Facebook accounts [9]. Williams & Burnap [10] analyzed hate speech on Twitter in the aftermath of a terrorist attack in London, focusing on the propagation of hate, showing changing presence of hateful messages over time, as well as depicting event-related Twitter traffic per geo-location. Basile et al. [11] examined both English and Spanish Tweets for anti-immigration rhetoric without focusing on any specific country. UK-based xenophobia has also been researched previously focusing on the Polish minority; however, the data were collected via interviews with individuals rather than online discourse [12]. Another study, analyzed real public Twitter data, limited to anti-Islamic hashtag-related rhetoric [13].
Our work differentiates from previous approaches, as it leverages the bespoke data mining capabilities to investigate the expression of online users’ opinions, by crawling and analyzing a dataset of publicly available Tweets with a focus on anti-immigration/xenophobic opinions. In comparison to previous approaches, we gain a broader view of the problem by leveraging the geo-location feature to obtain data from three English speaking countries (UK, USA, and Canada), which had a rise to anti-immigration rhetoric, to create a diverse dataset of immigration-related Tweets. The dataset was manually annotated to capture anti-immigration sentiment. Finally, three classifiers were trained and evaluated to perform hate-speech detection based on two representation methods: word and character n-grams with the TF-IDF approach. Naïve Bayes, Support Vector Machines (SVM) and Logistic Regression were used for classification and performance comparison between encoding/representation methods, i.e., character n-grams vs word n-grams. Additionally, the labeled data were analyzed for the presence of unique lexical characteristics that could be used to distinguish between neutral and anti-immigration rhetoric. Furthermore, hyperlinks embedded in gathered Tweets were also assessed with relation to the publicly available list of malicious domains, to explore whether xenophobic discourse can be associated with the spread of malicious links. Through the aforementioned empirical study, a wider problem of users’ privacy on social media was brought to attention i.e., users’ discourse can be gathered and extensively analyzed without requiring their consent.
The contributions of our work can be summarized, as follows:
  • We created a new, manually labeled, immigration-related dataset of publicly available Tweets from three English speaking countries.
  • We explore whether text classification using machine learning is feasible when dealing with a combination of UK, USA, and Canadian English language and different immigration-related topics by practically testing our dataset while using three different machine learning (ML) algorithms.
  • Finally, we measure the impact of different language features on the classification performance, we discuss the implication for hate-speech detection, and provide directions for future studies.
The remaining of the paper is organised, as follows: Section 2 discusses the related work on social media data analysis by considering the related ML techniques. Section 3 introduces our methodology, while Section 4 presents the our results. Finally, Section 6 draws the conclusions and provides avenues for future work.

2. Background

2.1. Social Media Usage Motives

Before we dive deeper into the technical background of our work, we should first identify the motivations that drive people to participate in SNS. Quinn [14] evaluates the social media participation through the Uses and Gratification Theory (UGT) and highlights the gratification that people seek from the use of media. Whitting and Williams [15] conducted an exploratory study with a small group of people, regarding the use of social media through in-depth interviews. The results of their work proved that the majority of people seek gratification through social interaction, information seeking, and passing time while using the social media. Smith et al. [16] explained that social media platforms vary not only in functionality and architecture, but also in terms of norms and culture, with Facebook being more suitable for social interaction as compared to YouTube, which has evolved differently. Kim [17] also supported the latter opinion about YouTube, which, after its acquisition by Google in 2006, transformed from User Generated Content media (UGC) to Professionally Generated Content media (PGC), prioritizing advertisements. Consequently, the platform shifted towards being predominantly an information seeking and entertainment platform, rather than a social interaction medium, such as Facebook. More recently, Khan [18] analyzed what motivates user participation and consumption on YouTube, with regards to uses and gratification framework, and distinguished five main factors that influence user engagement on this platform, namely: (i) information seeking, (ii) giving information, (iii) self-status seeking, (iv) social interaction, and (v) relaxing entertainment.
Smith et al. [16] identified as the predominant usage motive for using Twitter, information sharing in the form of news, opinions, or even complaints. Fundamentally, Twitter has a micro-blogging nature, which allows for a convenient way of posting and viewing short messages (Tweets), which can contain text, photos, videos, audio, as well as clips or links [19]. Selim et al. [20] compared the cultural context of Twitter between the UK and Saudi Arabia and proved that Saudi users appeared to seek distinctiveness, while, for the British users, belonging somewhere was a stronger motive. Williams & Burnap [10] observed that Twitter gave a stand to people to publicly express their reactions to events of national significance. The follow feature encourages user relations to be established, while the use of hashtags associates the Tweet with a topic that can be searched, thus leading to effortless information exchange.

2.2. Social Media and Privacy

The processing of data that are generated by social media users could be deemed as a double-edged sword. One the one hand the profiling that is achieved could enable defenders (such as law enforcement, security analysts, etc.) to identify attackers who are committing or will commit a crime. Nonetheless, at the same time, this profiling technology could be used for mass surveillance of the public, irrespective of whether they are malicious or not, which constitutes a violation of their privacy.
Privacy on social media has been a major concern over the past years with a lot of scandals reaching the public domain due to the privacy breaches of SNS. However, surprisingly, the worldwide participation on SNS continues to grow. One of the main objectives of our work is to emphasize the importance of privacy and raise the user’s awareness on how information posted on social media can be exploited. It should be noted that self-disclosure is an integral part of SNS, and often highly sensitive information is being shared [21]. Tsay et al. [22] focused on Twitter and explained that the exposure to the ubiquitous information exchange, which takes place on SNS, impacts users’ perception of privacy and makes them more tolerant to disclosure practices. If someone takes a closer look at Twitter’s Privacy Policy [23], then it is evident that most user data on the platform is public by default. It should be noted that users are allowed to change their privacy settings, with only a few users being aware of that feature.
In 2009, Utz et al. [24] suggested that SNS users are becoming concerned about privacy, while more recently in 2016 Quinn [14] identified that users are prepared to sacrifice their privacy to meet social objectives. We should not neglect the fact that the nature of SNSs encourages users to actively engage with the platform to acquire social satisfaction, e.g., staying connected with friends [25]. However, the real awakening of users with regards to their privacy and the social media came along with the Cambridge Analytica scandal. Cambridge Analytica, the firm that worked for Donald Trump’s election team and the winning Brexit campaign, harvested 50 million Facebook accounts of US voters, as stated by Cadwalladr & Graham-Harrison [9]. Other sources suggest that the number of gathered accounts was significantly higher, reaching a staggering 87 million [26,27]. The modus operandi of the company was to gather users’ profiles by luring them to do a personality test, profiling them afterwards and sending personalized political messages influencing their voting decisions. Furthermore, the target users’ friends lists were also obtained [9] and Facebook’s open API was used to also gather the full profiles of those lists [27].
Profiling people and creating behavioral patterns for defence purposes is not a new theme. FBI’s behavioral analysis unit interview serial killers to create their behavioral patterns and assist law enforcement [28]. Likewise, social media open APIs were also used in the past way before the Cambridge Analytica scandal emerged for insider threat prediction or detection [29]. Kandias et al. [30,31,32] gathered publicly available data from Twitter and created a taxonomy to classify users based on their usage intensity, Klout score and influence. They were also able to gather YouTube comments and classify them using Machine Learning techniques, determining political affiliation and predisposition to law enforcement. The magnitude of the problem of user profiling seems even more substantial when one considers the broader spectrum of profiling possibilities, which include the analysis of psycho-social traits, such as introversion, social and personal frustrations, divided loyalty, entitlement/narcissism, as well as political beliefs and group dynamics.

2.3. Machine Learning Applied on Social Media Content

A variety of scientific methodologies exist that one can use to analyze social media content, with the most popular relying on Natural Language Processing (NLP) using Machine Learning. NLP corresponds to a range of computational techniques for the automatic analysis and representation of human language [33]. With regards to our work, NLP is utilized to recognize hate towards foreigners in Tweets. However, in the literature, most scientists use NLP predominantly for sentiment analysis often applied on politics. Tumasjan et al. [34] proved that the analysis of political Tweets can reveal the extent that the social media platform is used for political discourse and, even, predict fairly well election results. Other scientists [33], nonetheless, insist that NLP technologies did not evolve as rapid as others, and still mostly rely on word or pattern matching, while trying to ascertain the meaning of text by processing it at the word level.
NLP enables the representation of text as vectors through traditional approaches, such as tokenization or neural language representation approaches (e.g., BERT [35]). Tokenization, the process where a text is split into tokens, i.e., sentences or individual words [36], is one of the fundamental pre-processing techniques associated with NLP. Several other processing features exist and are used in NLP that were proven to yield good results in online discourse analysis, including the bag of words approach (unigrams, where token represents one word), n-grams (where each token represents n-number of words), and character n-grams (where each token represents n-number of characters). The latter technique is useful for spelling variation, which is common in social media studies, e.g., replacing letter s with $ [37]. The aforementioned features are usually combined with more advanced techniques, such as syntactic features, e.g., POS tags where words are tagged with the corresponding part of speech tags (noun, adjective, etc.) [38].
Word generalization is another interesting NLP feature which proves to be useful when there are not enough data for classification (data sparsity), as in the case of Tweets that may not contain enough words for training/test data. Generalization creates clusters of similar words, e.g., apple, pear, can all belong to the same cluster as both are fruits [37], then the cluster itself is used as an additional feature. Another useful feature of NLP is the use of Lexical resources, where especially in hate speech detection, it can be utilized with lists containing negative words e.g., insults. Lists can also be customized to a specific theme e.g., ethnic prejudice. Additionally, more discrete lexical features can be used, such as the number of question marks, punctuation, etc. [38]. Despite the fact that NLP predominantly relies on word level procedures, semantics is becoming increasingly important in NLP systems, where knowledge about the world or the examined topic is applied, providing a knowledge base for the system referred to as common sense knowledge and common-knowledge [33]. Cambria & White [33] distinguish common sense and common knowledge as the difference between knowing the name of an object and understanding the same object’s purpose.

2.4. Detecting Hate Speech and Xenophobia

Studying contextual data in hate speech can be more compelling if the data relates to a pubic trigger event, as defined by Williams & Burnap [39]. In their work, they analyzed Twitter discourse in the aftermath of the murder of a British soldier in 2013, focusing on offensive language concerning race, ethnicity, and religion. Their model combined n-gram hateful terms with n-gram word grammatical dependencies, as well as Bag of Words (BoW), further utilizing supervised machine learning by training and testing the classifier using annotated data and 10-fold cross-validation approach, which provided a less biased estimate. Although a large volume of data was used in the study (450 thousand Tweets), it is unclear whether its quality was verified, e.g., analyzed for Tweet duplicates. The same authors [10] utilized the aforementioned methodology and examined the same trigger event; however, this time focusing on several hypotheses, one of which being that hate speech spikes immediately after such event. Additionally, they proposed a detection approach based on three types of cyberhate: race, sexual orientation, and disability [40]. One of their major contributions was obtaining and running the tests on a large and diverse data set gathered from Twitter immediately after three major events, namely: (a) 2012 Barack Obama re-election, (b) 2013 Jason Collins’ sexual orientation declaration, and (c) 2012 London Paralympic opening ceremony. Their methodology allowed for the classification of not only individual types of hate, but also intersections between each type, creating a blended model, which can recognize offensive language that targets more than one characteristic, such as sexuality and race.
Chen et al. [41] went beyond simple swear word spotting and proposed a more comprehensive approach, namely Lexical Syntactic Feature (LSF), which utilizes a two-phase offensive content detection. The first phase focused on sentence level detection, using NLP in order to obtain syntactic (context) and lexical (offensive words) features. The latter utilized user offensiveness estimation based on the offensiveness of collection of user’s sentences and their language style. Support Vector Machines (SVM) and Naïve–Bayes (NB) were used for classification, thus achieving a detection precision of 98.24%. Kwok & Wang [42] adopted a more straightforward approach to detect hate speech targeting black people on Twitter, using Naïve–Bayes and a bag-of-words model with unigrams (single words), achieving relatively low accuracy of 76%.
Mehdad & Tetreault [43] proved that character n-grams achieve better results than word n-grams in hateful content detection, in three different machine learning approaches: Distributional Representation of Comments, Recurrent Neural Network Language Model, and Support Vector Machine with Naïve Bayes Features (NBSVM). NBSVM with only n-gram features proved to be the most effective, even with comparison to previous studies that used a variety of more advanced features than sole n-grams. The effectiveness of character n-grams in hate speech detection is also supported by Waseem & Hovy [44], who examined racism and sexism in a large corpus of Tweets, employing logistic regression classifier to evaluate which features improve performance. They found that char n-grams along with Tweet author’s gender achieved best scores, outperforming word n-grams. Nobata et al. [38] compared various NLP features, using a supervised classifier and also found character n-grams to be most promising among other features testing two different data sets. Basile et al. [45] made an even more comprehensive comparison of different methodologies, identifying SVM with sentence embeddings as the best performing model for hate speech detection against immigrants in English Tweets.
Assuming that hate speech is usually associated with negative sentiment [37], it seems logical to incorporate sentiment analysis in the detection process. Schmidt & Wiegand [37] pointed out that some studies utilize sentiment analysis as an additional classification method, adopting a multi-step approach as a result. Sood et al. [46] applied the same approach, outperforming previous work at the time in terms of insult and negative content detection. The authors used social site news comments, employing valence analysis (sentiment of a comment) and relevance analysis (relevance to the object being commented, e.g., article, video), further utilizing SVM trained using word stems as binary features to discover insults and another SVM to classify the target that was insulted. Dinakar et al. [47] concentrated on cyber-bullying and harassment on social media emphasizing on sexuality, intelligence, as well as race and culture. They used the model of common-sense reasoning, where common sense concepts are connected in a network of correlations and labeled with a flag, which can represent either positive or negative polarity, demonstrating the limitations of traditional supervised machine approaches in the case of detecting subtle types of abuse.
More recently, Gitari et al. [48] assumed that subjective expression that is present in text can be heavily associated with hate speech. They proposed a multi-step approach, where firstly a distinction is made between subjective and objective expression, later creating a lexicon of semantic, hate, and theme-based features, thus creating a basis for rule-based classifier designed to recognize hate-speech. When compared to Dinakar et al. [47], Gitari et al. [48] reported better results when incorporating semantic reasoning. A different approach was adopted in a recent study by Rodriguez et al. [49], which was focused on the detection of popular topics on Facebook, which can spread hateful expressions. They reported promising results when incorporating sentiment and emotion analysis, further utilizing NLP features to pre-process and group posts by topic using Term Frequency-Inverse Document Frequency (TFIDF) and the unsupervised machine clustering algorithm k-means without including semantic features.
The latest attempts on offensive language detection use Deep Learning techniques. Pitsilis et al. [50] argued that NLP methods used in literature are heavily dependent on the language used. They proposed a different model, where the focus is on additional features derived from Twitter user’s history and privacy settings, which expose their tendency to racism, sexism or neutral. With the use of Long Short-Term Memory (LSTM), which is a type of Recurrent Neural Network, the authors demonstrated that deep learning methods perform better than traditional NLP approaches. However, as their methodology depends on users’ history, it can prove problematic when applied to users without history or users who suddenly shift their behavior to achieve misclasification. Zhang et al. [51] also used LSTM, combining it with Convolutional Neural Networks in order to recognize hate speech, further conducting a comprehensive comparison of results, based on large publicly available datasets. They reported that the model outperforms previously studied methods to a large extent. They also examined how feature selection influences the performance of algorithms (SVM) and found that automatic selection yields better results than manual selection. Badjatiya et al. [52] followed an even more comprehensive approach and experimented with several Deep Learning models, reporting their best results when they combined LSTM with Gradient Boosted Decision Trees and random embeddings where Tweet embeddings were initialized to random vectors.
Several studies have investigated the problem of xenophobia. Rzepnikowska [12] highlighted xenophobic incidents reported by Polish immigrants from Greater Manchester before and after the Brexit referendum in the UK by interviewing individuals. Evolvi [13] analyzed the effects of Brexit on Twitter from the perspective of the Muslim community, while using manual labeling of Tweets and observed that religion was not the only factor influencing negative sentiment, but also politics, ethnicity, and even gender. Siegel et al. [8] studied different political events that occurred in the US, focusing on an estimated rise of hate speech on Twitter during the 2016 presidential campaign and the election of Donald Trump. Their methodology employed a dictionary-based approach, supervised machine learning, and a dataset of over one-billion Tweets, out of which about 750 million related to the presidential campaign and 400 million being random. They revealed that there was no correlation between Donald Trump’s campaign and the rise of hate speech in the US. However, certain hate speech spikes were reported, which were a result of certain announcements (e.g., Trump’s travel ban order) during the campaign and election period. From a different point of view, Florio et al. [53], investigated the Italian Twittersphere and anti-immigration discourse without focusing on any specific political event. The authors utilized Support Vector Machines to automatically detect xenophobic content in a dataset of 15,653 geolocated Tweets. They further compared the results with a database of criminal activity, employment and education trends per Italian country region and found a correlation with hate speech. However, a relatively low score of the model for Recall (52 points) suggests a cautious approach to the bespoke correlation is needed, as low Recall metric indicates many Tweets being misclassified as not hate speech, resulting in high number of False Negatives.
As depicted in Table 1, our work differentiates from all previous approaches, because it aims at detecting anti-immigration rhetoric by using a newly structured dataset from Twitter, which includes: (a) three different varieties of the English language, namely US, UK, and Canadian English that may differ in pronunciation, vocabulary, spelling and grammar; and, (b) diverse political events taking place the time the data were acquired.

3. Methodology

In this section, we first provide a brief description of the data collection and dataset creation methodology. Subsequently, we outline the challenges of creating an appropriate dataset for hate speech detection (Section 3.1). Secondly, we describe our approach to text representation, including the initial pre-processing steps, such as stop-word removal and feature extraction (Section 3.2). Finally, we present our classification models for anti-immigration rhetoric detection in Tweets (Section 3.3).

3.1. Dataset Creation

To create our dataset, we used the Twitter public API, which offers free access to all Twitter data that are generated by users. Recently, Twitter has made a small step towards protecting the privacy of its users by requiring a developer Twitter account in order to obtain the aforementioned information. However, the application process did not create a significant barrier as it is quite simple and straightforward to obtain access.
The data was collected from 1 January to 31 January 2020, and included English Tweets with a specific focus on three countries, namely: UK, USA and Canada. The reasoning for selecting these countries was the substantial amount of immigration debate taking place in those countries during the past few years, often inspired by political events, which may have escalated from day to day lives into social media providing valuable data for analysis. In the UK, Brexit appeared to be predominantly motivated by anti-immigration sentiments [54]. In the USA, the election of Donald Trump gave rise to more heated debates around immigration. Despite the fact that Canada did not go through the same changes involving right-wing politics, it appears that anti-immigration sentiment is rising [55], which again can lead to interesting discourses taking place in Social Networks, with Twitter being one of them.
When considering the fact that a single Twitter API request can return only a maximum of 100 Tweets per searched term, it was important to utilize a variety of keywords instead of a single Immigration term. To achieve this task, a combination of keywords and hashtags were selected that were found to be associated with the topic. Keywords included terms such as migrants, refugees, immigration, and multiculturalism. Hashtags were mostly associated with negative rhetoric towards foreigners and included: #refuggesnotwelcome, #Antiimmigration, #DeportThemALL, #defendeurope. However, neutral hashtags were also utilized in order to make the data more diversified, e.g., #immigration, #refugees. The geolocation feature of the Twitter Search API allowed for obtaining Tweets from several locations in the aforementioned countries. To prevent us from gathering duplicate data, reTweets were excluded from the search and any possible duplicates found later were also removed. This was possible, as each Tweet has a unique identification number and any reoccurring IDs were filtered out. This resulted in obtaining a dataset of 47,976 Tweets.
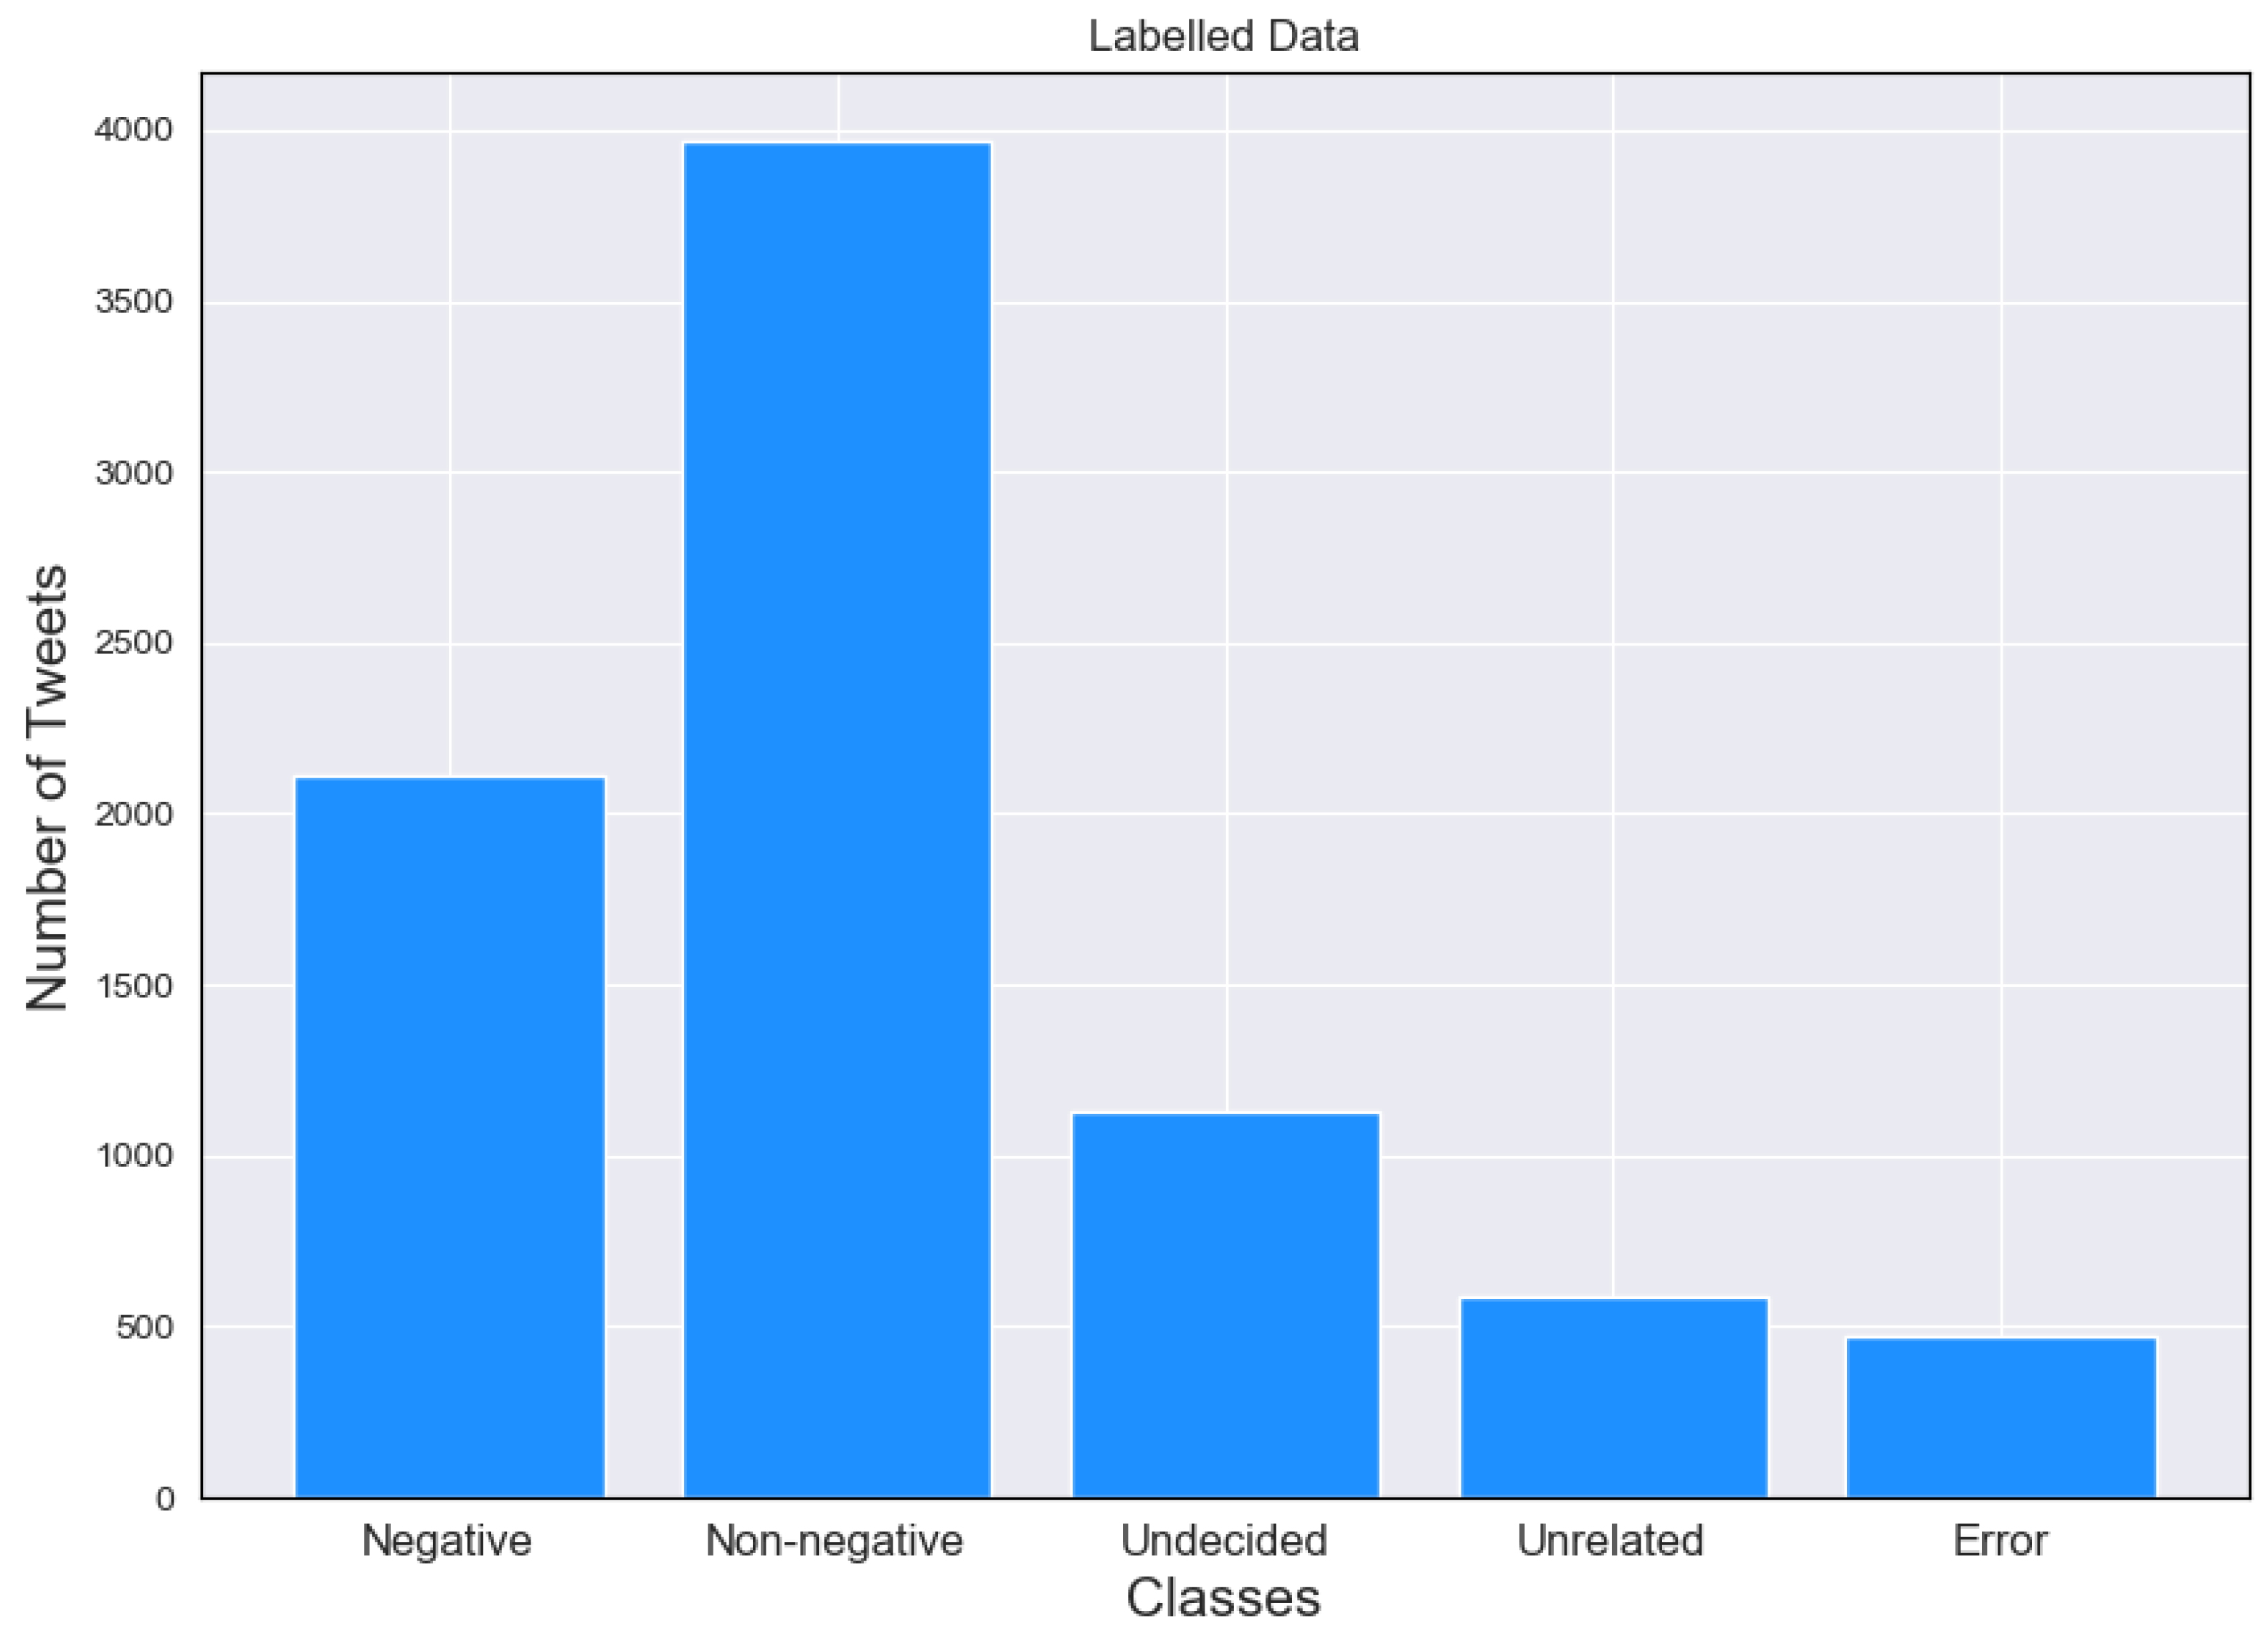
For the purpose of our work, the data were manually annotated for xenophobic/anti-immigration rhetoric into the following five different labels: (i) Negative, which refers to Tweets containing anti-immigration rhetoric, (ii) Non-Negative in the opposite occasion, (iii) Undecided, where it was not possible to determine the person’s view, (iv) Unrelated in case any Tweet happens to be approximately the same as any of the previous ones, despite removing duplicates previously. This occurred as some Tweets were copies of others with some additional different user mentions or URLs, thus reproducing the same content with minor differences only. The last label we used was (v) Error, which was used in cases that we were not able to process the Tweet content, e.g., in Tweets containing special characters. It is worth clarifying that these Tweets were a minority.
To annotate the dataset we followed principles from Waseem et al. [44]. As such, a Tweet is labelled as xenophobic if it:
  • uses xenophobic slurs;
  • attacks criticizes or strives to discredit an individual or a group that is part of immigrant minority;
  • defends Xenophobia; and,
  • propagates xenophobic hashtags, such as #Antiimmigration, #DeportThemALL.
As a result, a total of 8270 Tweets were annotated, where 2114 were labeled as Negative towards foreigners and 3971 as Non-Negative. Figure 1 summarizes the results of our labeling exercise. To validate the annotations and to ensure that the dataset is reliable, a second annotator labelled a subset of the Tweets (fifty random Tweets) and Cohen’s kappa was used to calculate the inter-annotator agreement ( κ = 1 ).

Dataset Creation Challenges

The challenge with automatic identification of xenophobic discourse on Twitter and, in any other similar source of opinions, is that xenophobia is a very broad term, as already mentioned, referring to dislike towards foreigners. Consequently, a foreigner can be a person from any country in the world meaning that they can be referred to by many names derived from the country of origin e.g., Pole, German, and other ethnic slurs. Additionally, religion is often used to “assign people” to a certain group of foreigners, e.g., Muslims. Previous studies have either focused on narrower groups of people, such as sexual minorities, racial groups or even disabled people, or concentrated on groups with regard to religion/ethnicity [40,44]. Foreigners, as a group, includes several subgroups making the classification task challenging. Therefore, to collect the training data, we focused on more broad terms, such as migrant, immigration, or even refugees, to include as many groups as possible in the set.
Another challenge of our dataset creation activities was grasping the dislike sentiment, which covers a certain scope of language. This ranged from discrete forms of negative opinions to the most obvious ones and the use of swear words. Sarcasm and humor pose another classification challenge, as the classifier would need to be specifically trained on this type of language to yield valid results. As our results suggest, the use of hashtags discloses the true meaning of the Tweets, therefore preserving them in the data pre-processing, while providing additional features for the algorithm.

3.2. Feature Extraction and Text Representation

Tweets and many other user-generated social media messages, include significant amount of noise, i.e., they contain a substantial number of unwanted data that can lead to misclassifications. This include data, such as hashtags, user mentions, or URLs, thus the use of several pre-processing steps is necessary. All of the Tweets were stripped off of any mentions of users, as well as links embedded in the text, by filtering words beginning with @ for user mentions and http for links. Subsequently, all newline characters were replaced with spaces, hash characters were removed from hashtags and all punctuation characters were replaced with spaces.
Next, NLP techniques were applied to create word tokens and remove any stop words, such as and, to, etc. using the Natural Language Toolkit (NLTK) to ensure that the classifier focuses on the relevant features. Tokens were lower-cased and filtered for any non-alphanumeric characters. Finally, the tokens were lemmatized to their root form to limit the number of words representing the same meaning e.g., invaders, invading, invaded have the same root form invade. This way words with similar base meanings can be considered as a single feature by the classifier.
We employed a more sophisticated approach compared to the standard Bag of Words, where single word frequencies are used as predictive features for the classifier. This was achieved by splitting the word tokens created previously into word and character n-grams. In our setup, word n-grams of length one to three and character n-grams of length one to four were chosen, spaces included. The purpose of this model was to evaluate whether character n-grams would outperform word n-grams in detecting anti-immigration rhetoric.
The text was vectorized using the TF-IDF vectorizer (https://scikit-learn.org/stable/modules/generated/sklearn.feature_extraction.text.TfidfVectorizer.html). TF-IDF stands for Term Frequency-Inverse Document Frequency and it operates by providing a score that represents the importance of a word to the document it appears in, based on its frequency in other documents. The higher the value the more important the word is. TF-IDF is calculated, as follows:
T e r m   F r e q u e n c y ( t ) = ( N u m b e r   o f   t i m e s   t e r m   t   a p p e a r s   i n   d o c u m e n t / t o t a l   t e r m   i n   t h e   d o c u m e n t )
I n v e r s e   d o c u m e n t   F r e q u e n c y ( t ) = L o g ( N u m b e r   o f   d o c u m e n t / n u m b e r   o f   d o c u m e n t s   c o n t a i n i n g   t )
S c o r e = T e r m   F r e q u e n c y I n v e r s e   D o c u m e n t   F r e q u e n c y
Consequently, the greater the number of documents containing a certain word, the less important that word is to the document it appears in. TF-IDF is appropriate for this type of classification because the data was retrieved through keyword searches, such as immigration, thus making highly probable that these would be omnipresent throughout the corpus, both in the Negative and the Non-Negative classes. Therefore, it was necessary to weigh down frequent terms so that more discrete terms could have been highlighted, as these are more indicative of the class they belong to. The training and testing of the supervised classifier were performed using the 10-fold cross-validation approach, which has been used for similar tasks in related literature [44].
Lexical characteristics can be thought of as certain unique features in text-based data, which can be used to distinguish each class of the set i.e., Negative Tweets from Non-Negative. Drawing information from previous literature [38,44,56], we evaluated several lexical characteristics of the same previously labeled dataset. One of our motivations was to discover whether a combination of USA, UK, and Canadian English language, which differs considerably, can have predictable lexical characteristics in Negative and Non-Negative class. This covered a wide range of tests, which are described below. Before running the tests, the data was pre-processed as described previously, where user mentions were not removed, and hashtags were not stripped of the hash character, as this was used to locate them in the dataset. Additionally, words were not lemmatized, in order to retain all different variations and the dataset was not balanced to include all labeled Tweets from both classes. Apart from the aforementioned changes, data preparation was the same.

3.3. Classification Models

Although Deep Learning approaches have been successful in text classification, they require vast amounts of data, which are often unavailable, expensive, and labor-intensive to obtain. Taking this under consideration, it was necessary to work with traditional ML algorithms that have been used in related tasks in the past. Consequently, three popular supervised ML algorithms were chosen that are used in literature for text classification: Support Vector Machines (SVM), Naïve–Bayes (NB), and Logistic Regression (LR) (regularized logistic regression, with L2 regularization (https://scikit-learn.org/stable/modules/generated/sklearn.linear_model.LogisticRegression.html)). These approaches have been used for abusive speech detection in previous work. Specifically, SVMs has been previously used for hateful Tweet classification [40], while NB combined with SVM performed very well in abusive language detection [43]. LR was previously utilized for the detection of racist and sexist content in Tweets [44]. Because the dataset was imbalanced, under-sampling was used to keep all Tweets from the smaller class Negative and to randomly choose the same amount from the larger class Non-Negative.

3.4. Testbed Environment

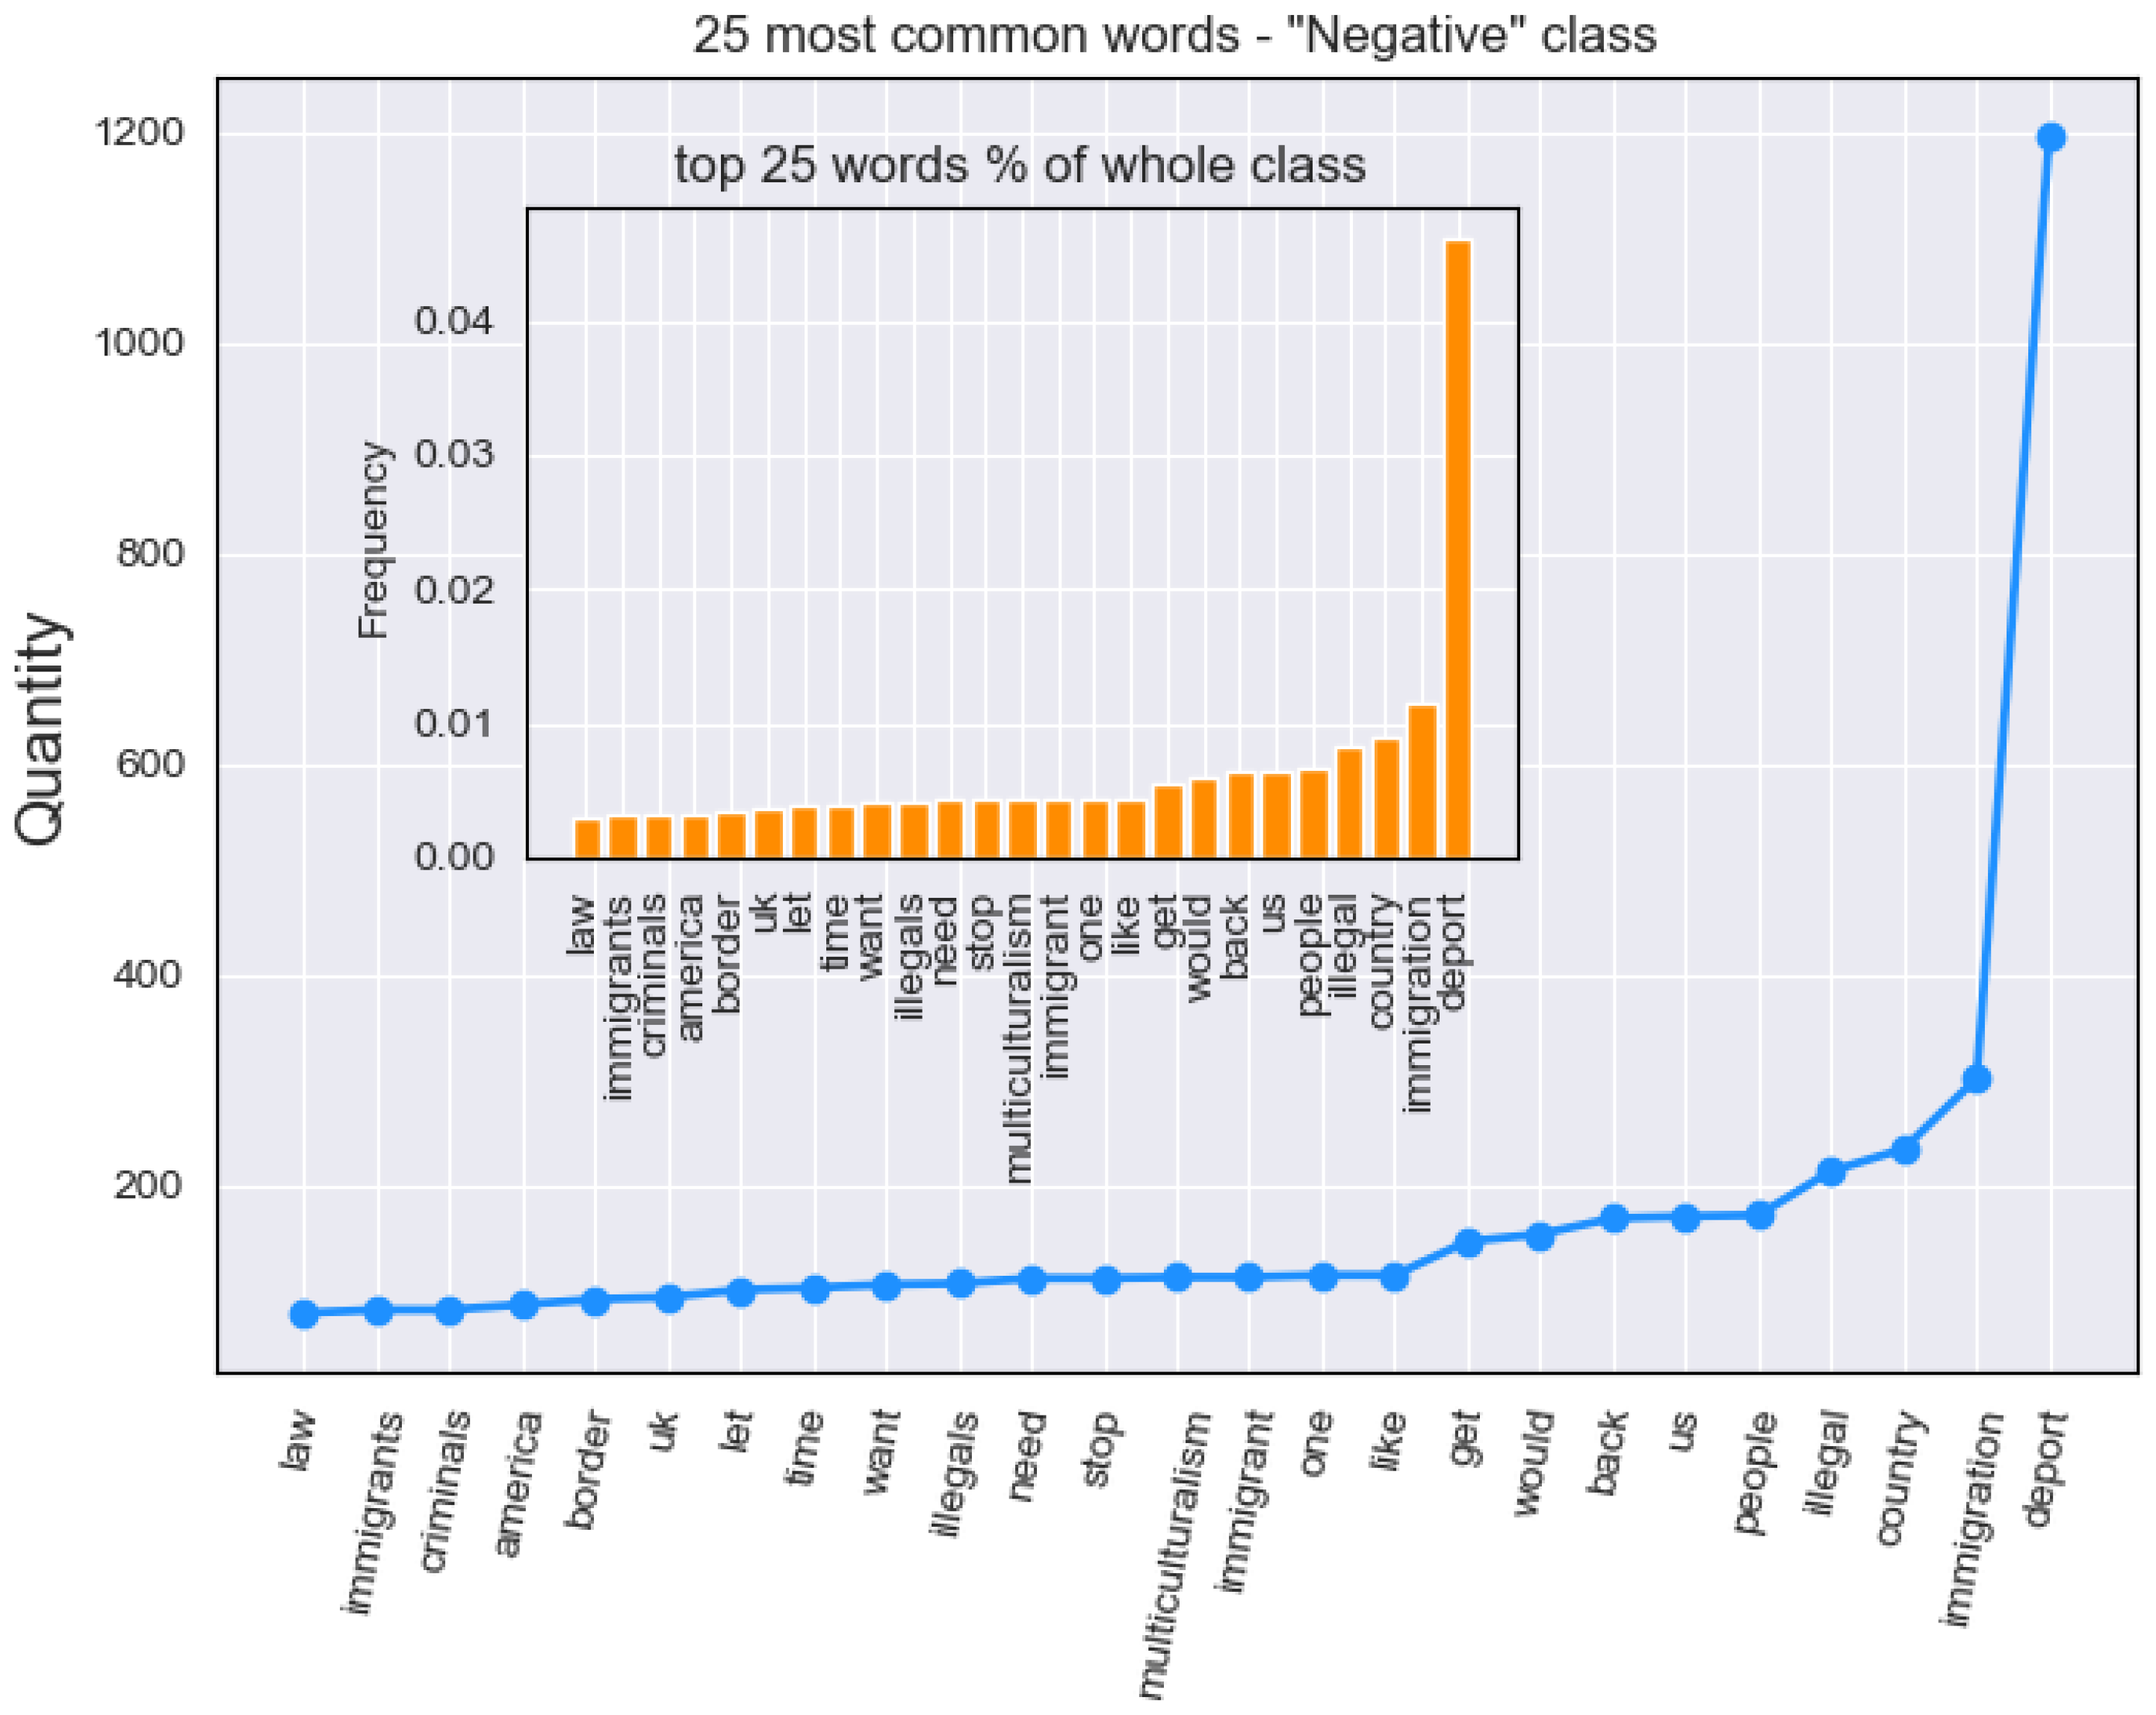
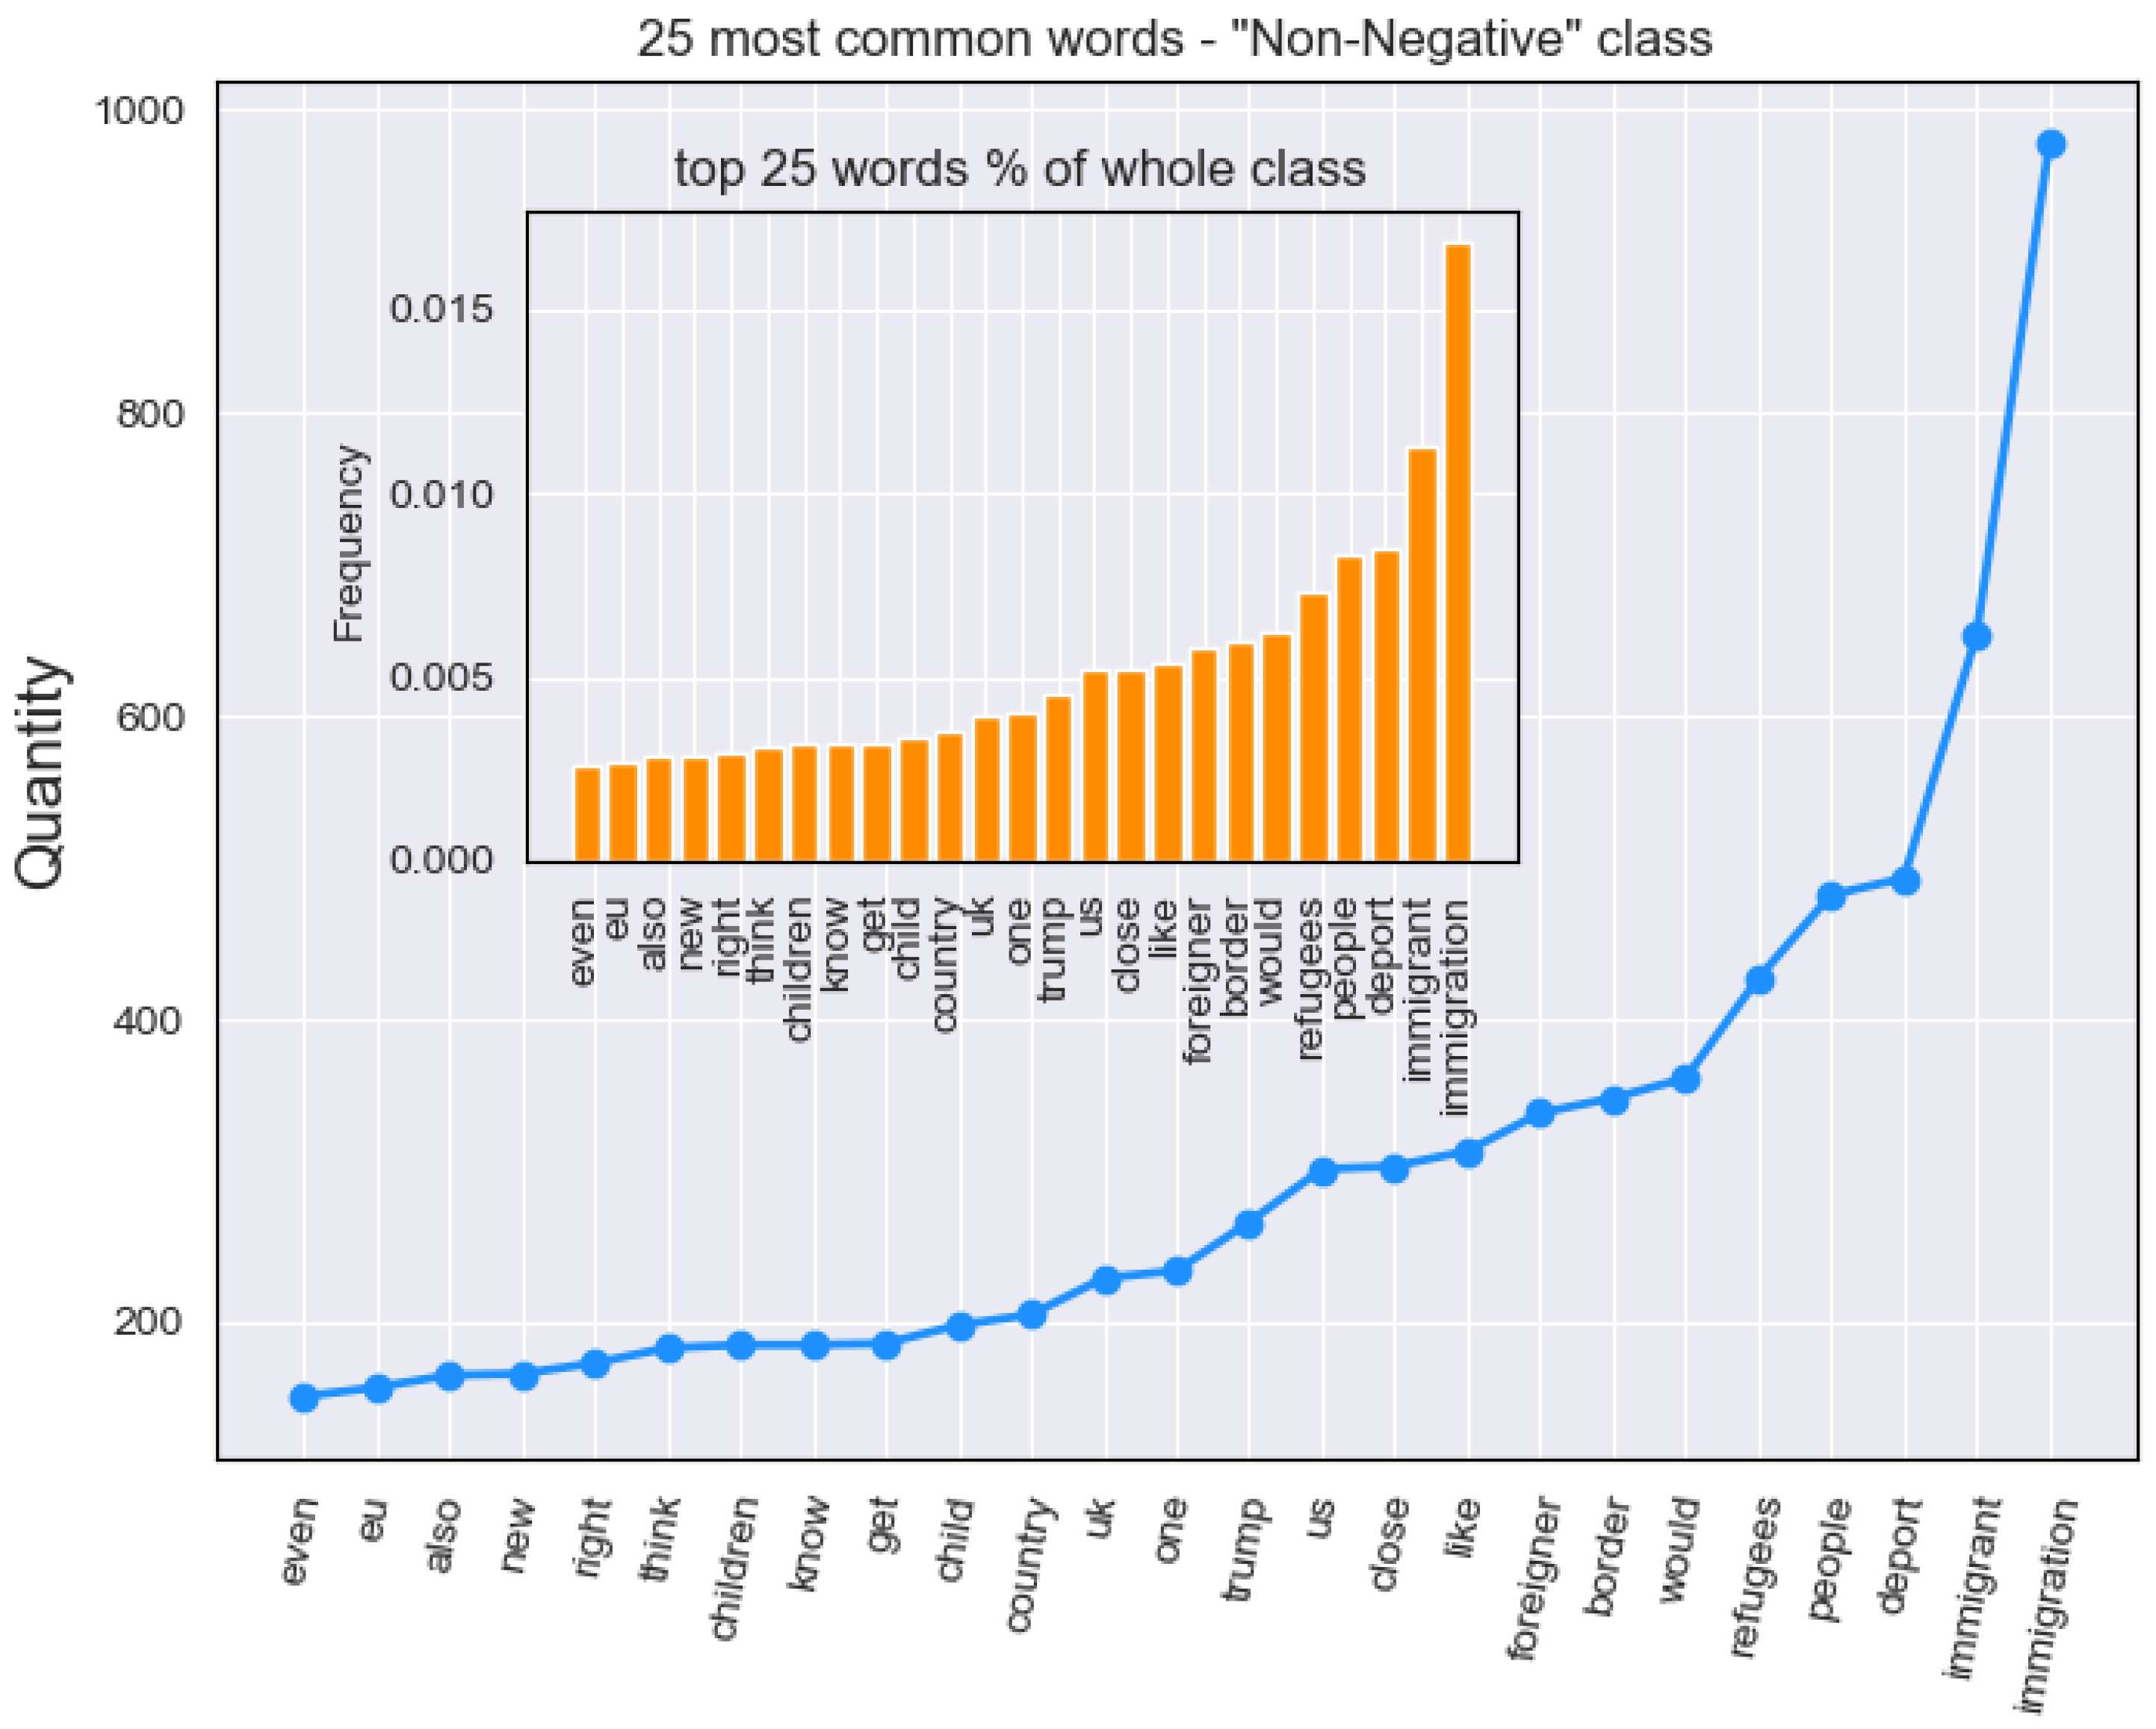
We initially analyzed (Section 4.1) the standard word frequency (illustrated in Figure 2 and Figure 3). The goal was to establish differences in wording between the classes, by selecting 25 most frequent words per class. This threshold was selected, as it was empirically found that the largest variation in word frequency occurs in the top 25 words. The rest of the words in the set appeared to be less indicative of the class that they belong to.
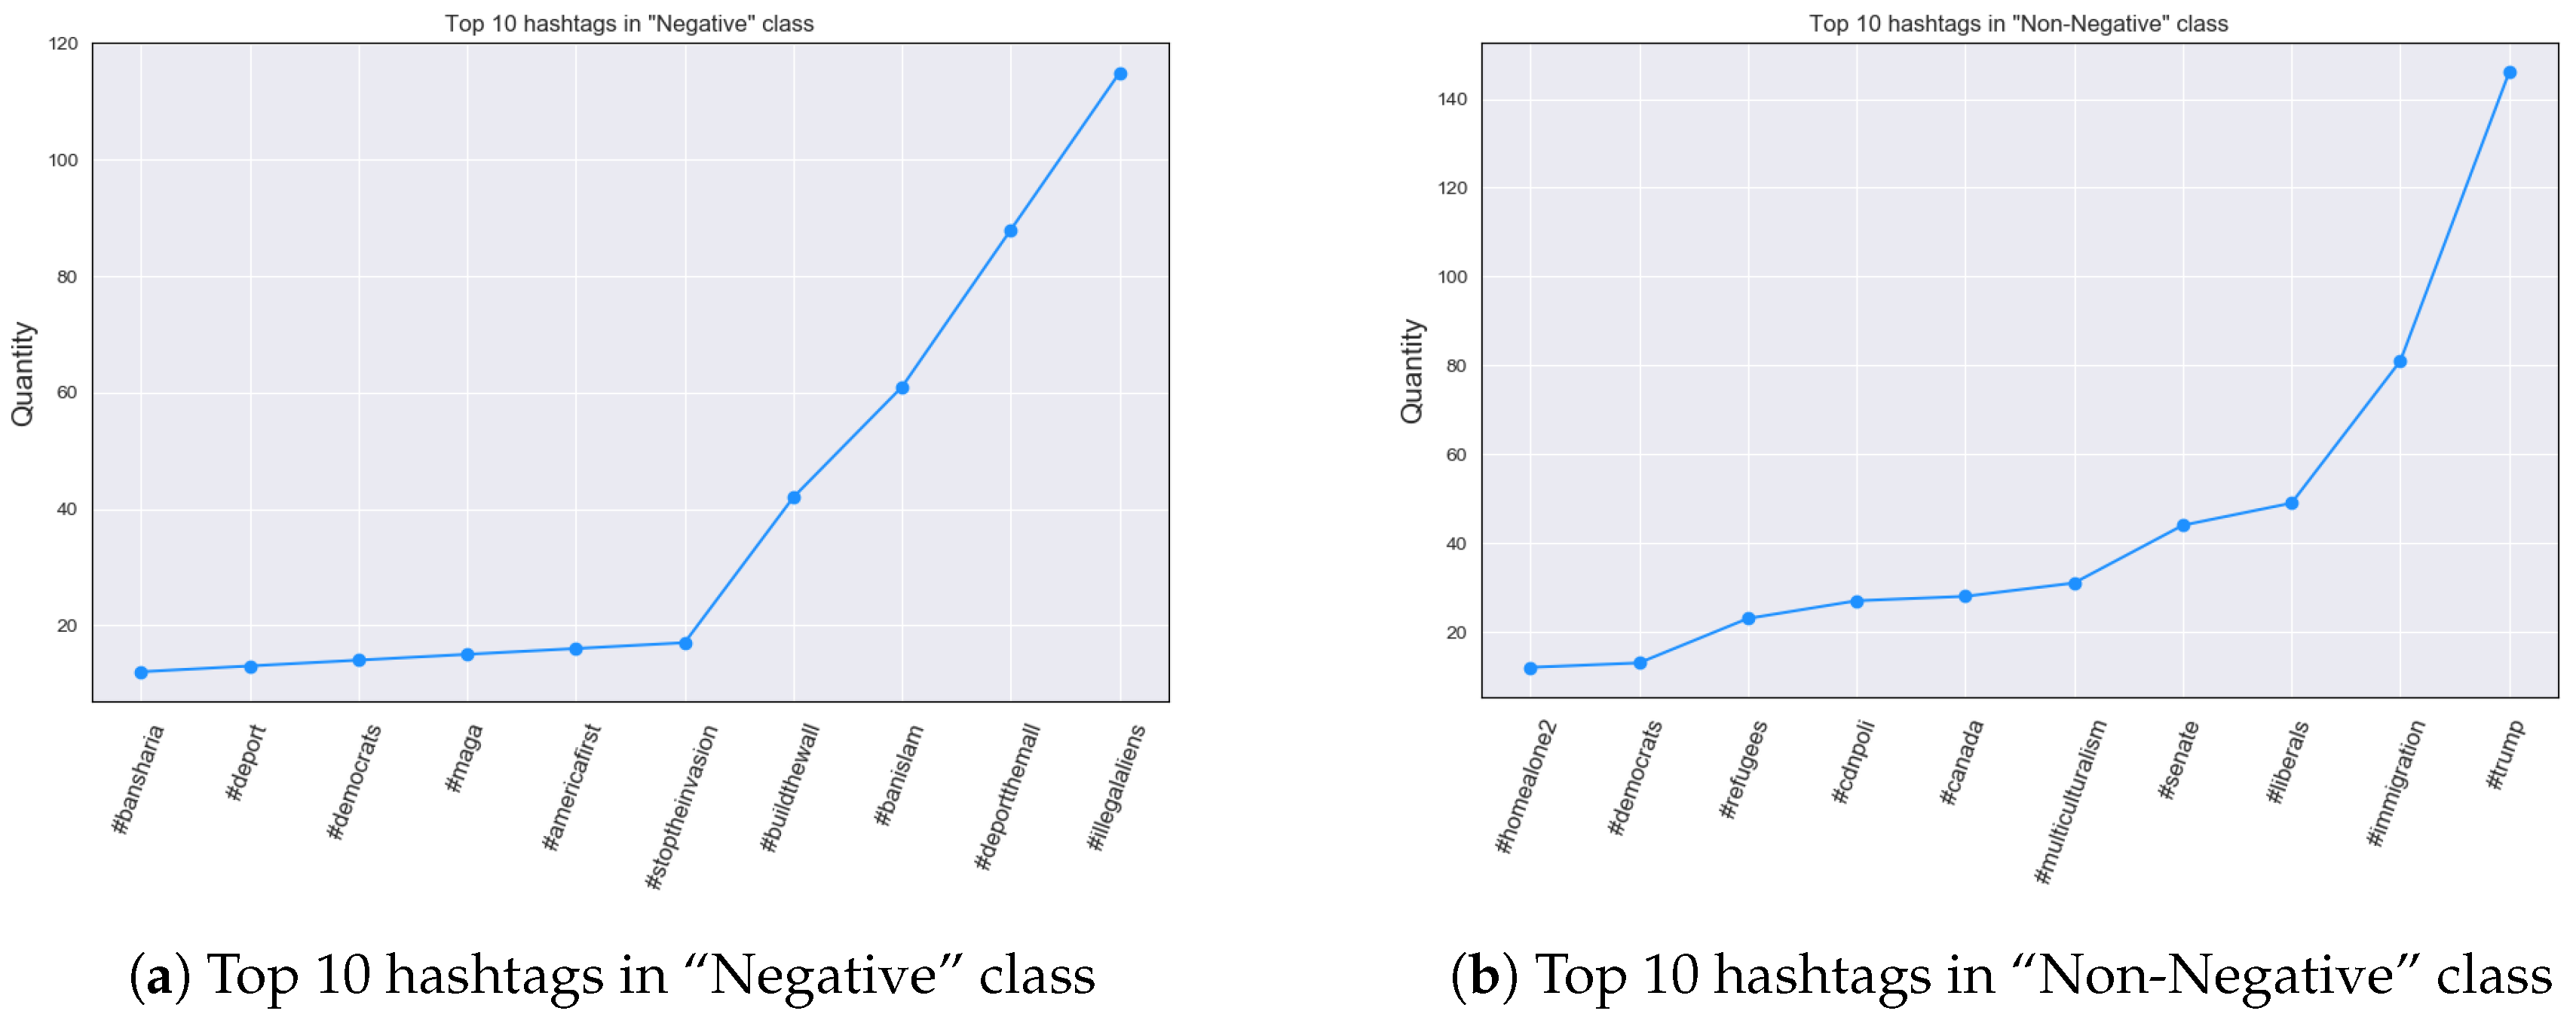
Secondly, we explored the frequency of hashtags present in both classes, as these are very powerful keywords that can convey a substantial amount of information, particularly because they are often used to declare a personal affiliation to certain opinions or groups. Our results suggest that the most interesting and indicative hashtags were present in the top 10 occurrences for both classes; therefore, this was used as a threshold when presenting the findings.
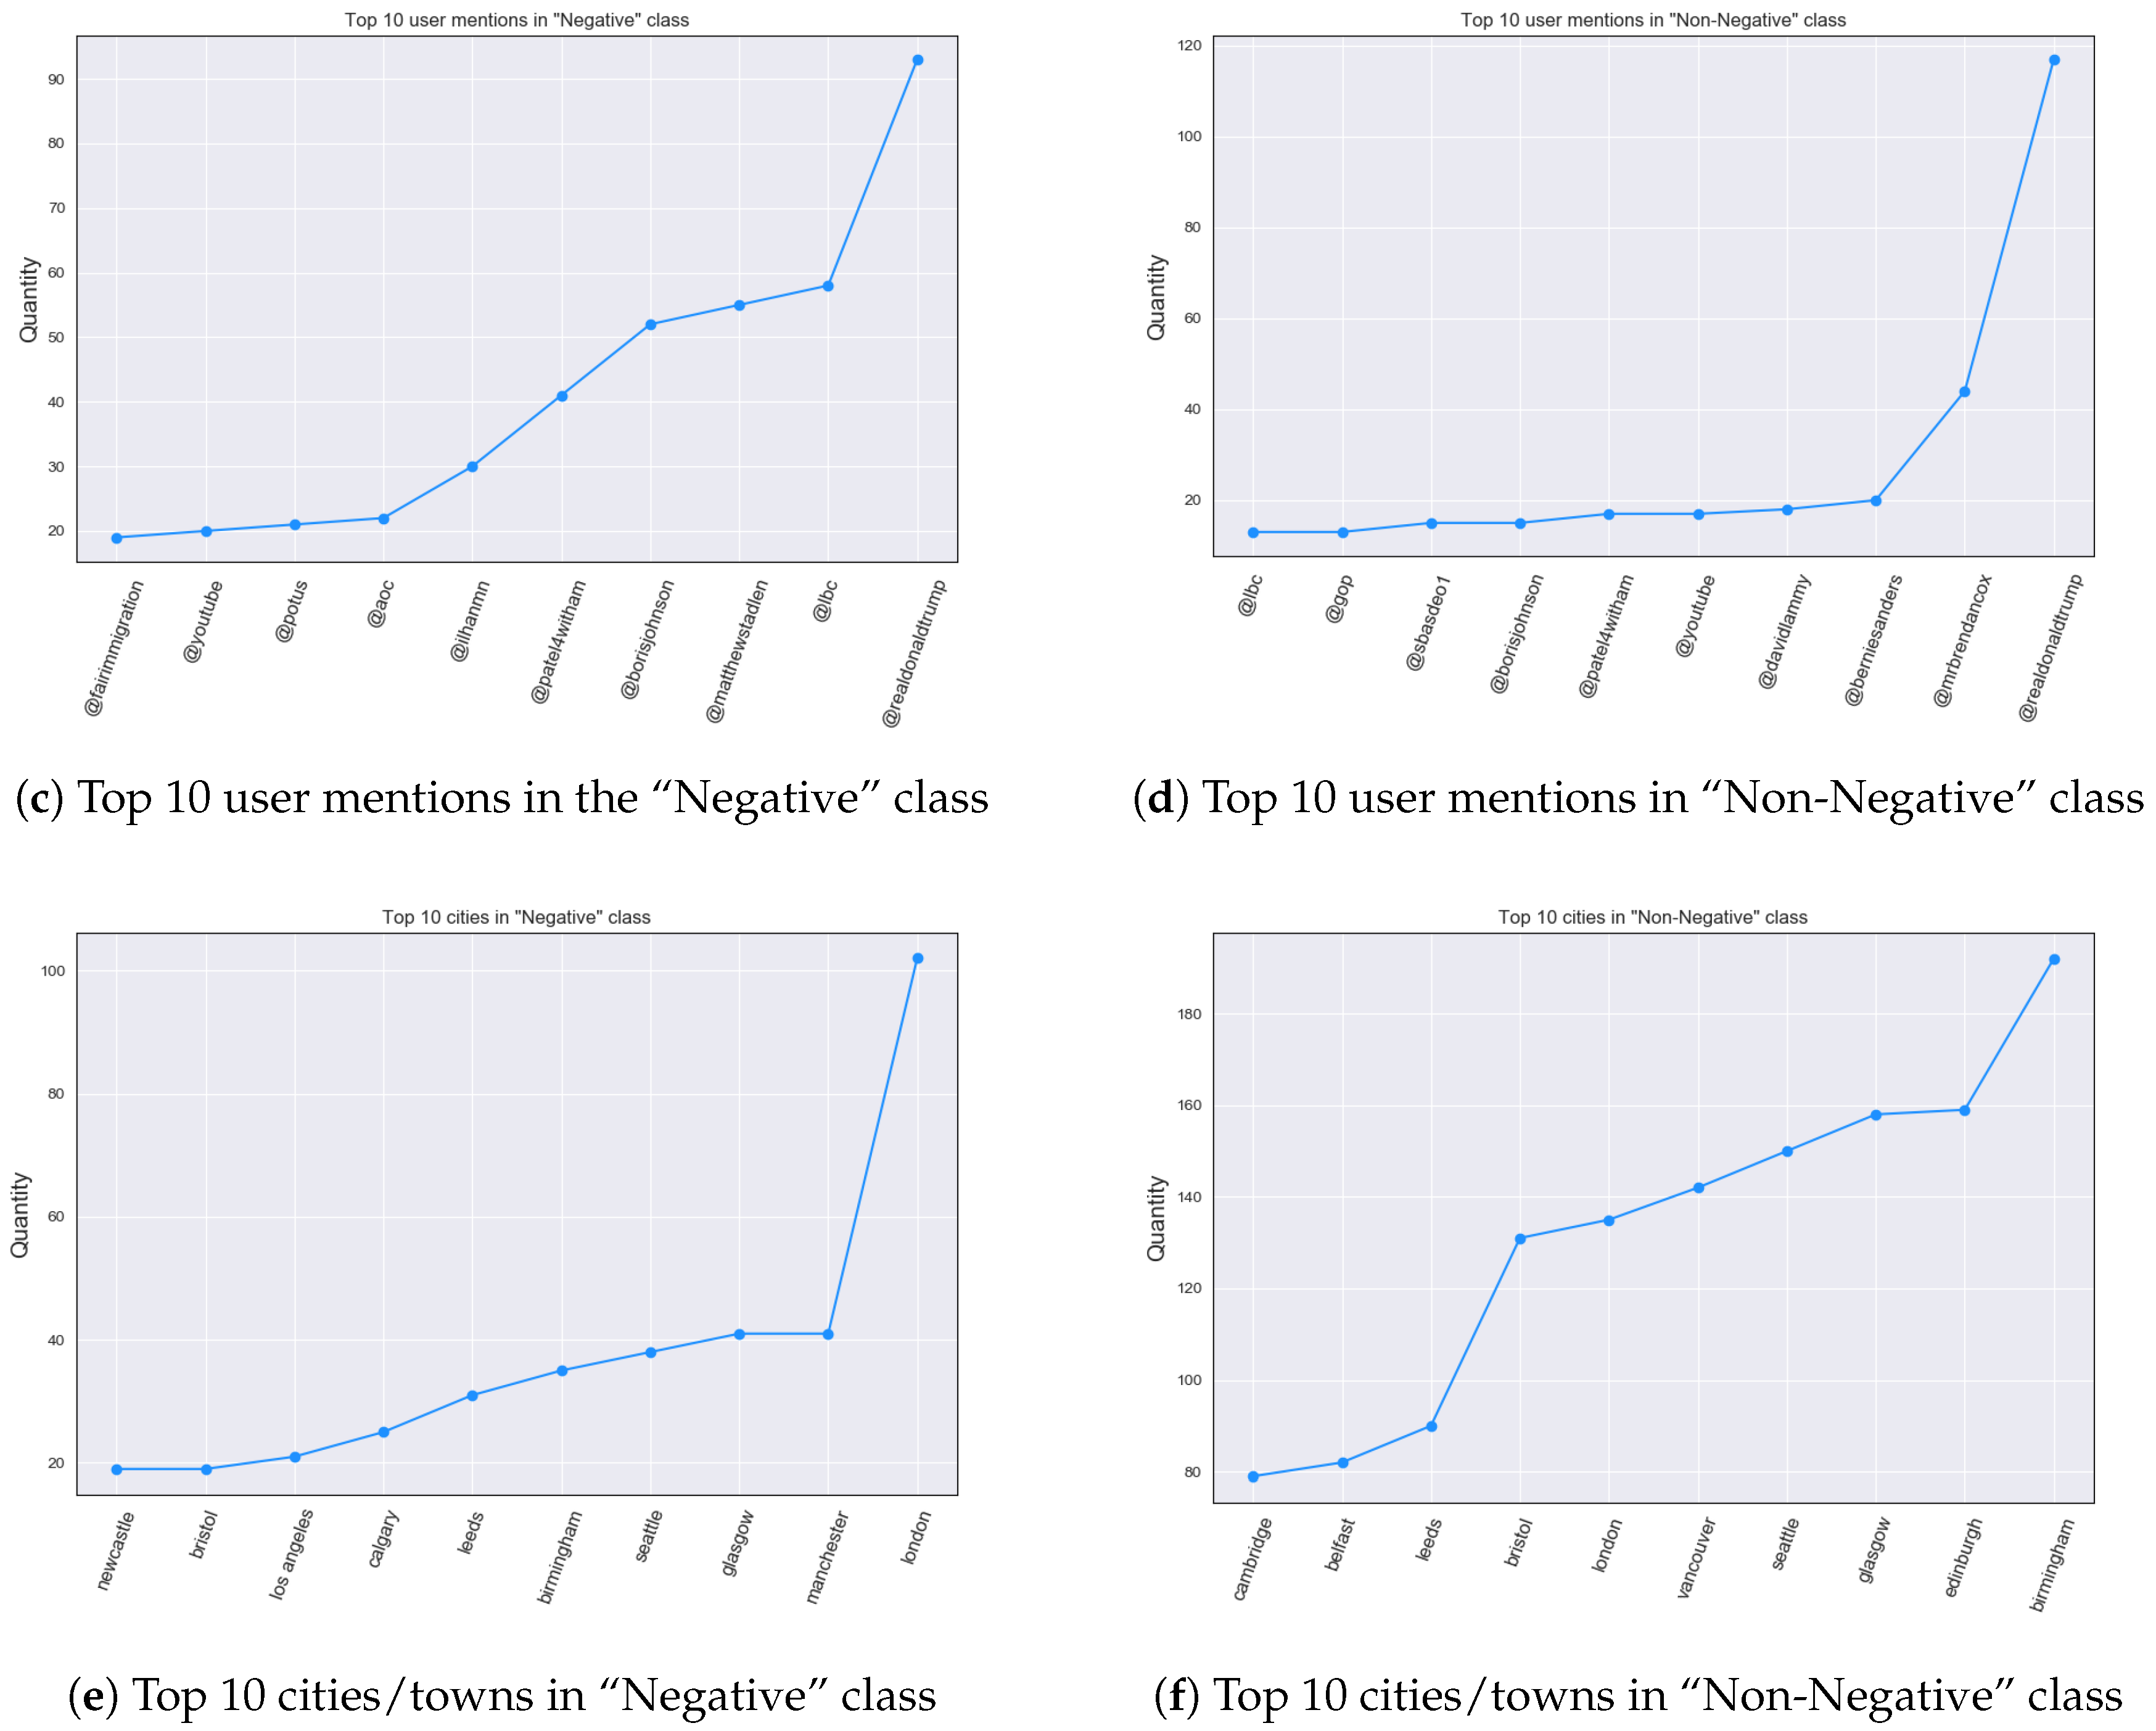
As mentioned previously, different countries can have different causes, often being political, which spark immigration-related debate. Apart from normal words and hashtags, user mentions can also convey some information regarding the topic related to immigration discourse. This phenomenon happens, because political personas can be often brought forward in the conversations through user mentions. Consequently, user mention occurrences needed to be examined. Once again, a threshold of the top 10 was chosen, as this is where the most discrepancies were present, based on our empirical analysis.
Because the Twitter data was geo-located, it seemed compelling to investigate more detailed origins of both Negative and Non-Negative Tweets, especially with regard to cities. Although the Twitter API does not necessarily return Tweets with the exact geo-location details, the Location parameter is often present, which can be utilized to unveil Tweet city/town of origin. The issue was that this parameter is user-defined, therefore it can contain valid, incorrect, general locations (e.g., only Alberta, which is a province in Canada), or it can also be omitted. These limitations hindered the obtaining of comprehensive results, as well as our analysis showed that only a relatively small number of users unveil their real location in our dataset. To identify users that provided city name as their location, a list of 19,709 city names from the three countries was utilized. Additionally, some error correction had to be conducted as some city/town names in the list were the same as country or province/state name, e.g., a city named Florida, which is also a state in the USA. Therefore, when looking at the location parameter such as Tampa, Florida the Tweet could be assigned to two different cities both Tampa and Florida. For that reason, the list had to be stripped from country or state/county names. Similarly, based on our empirical analysis the top 10 terms was used as the threshold.
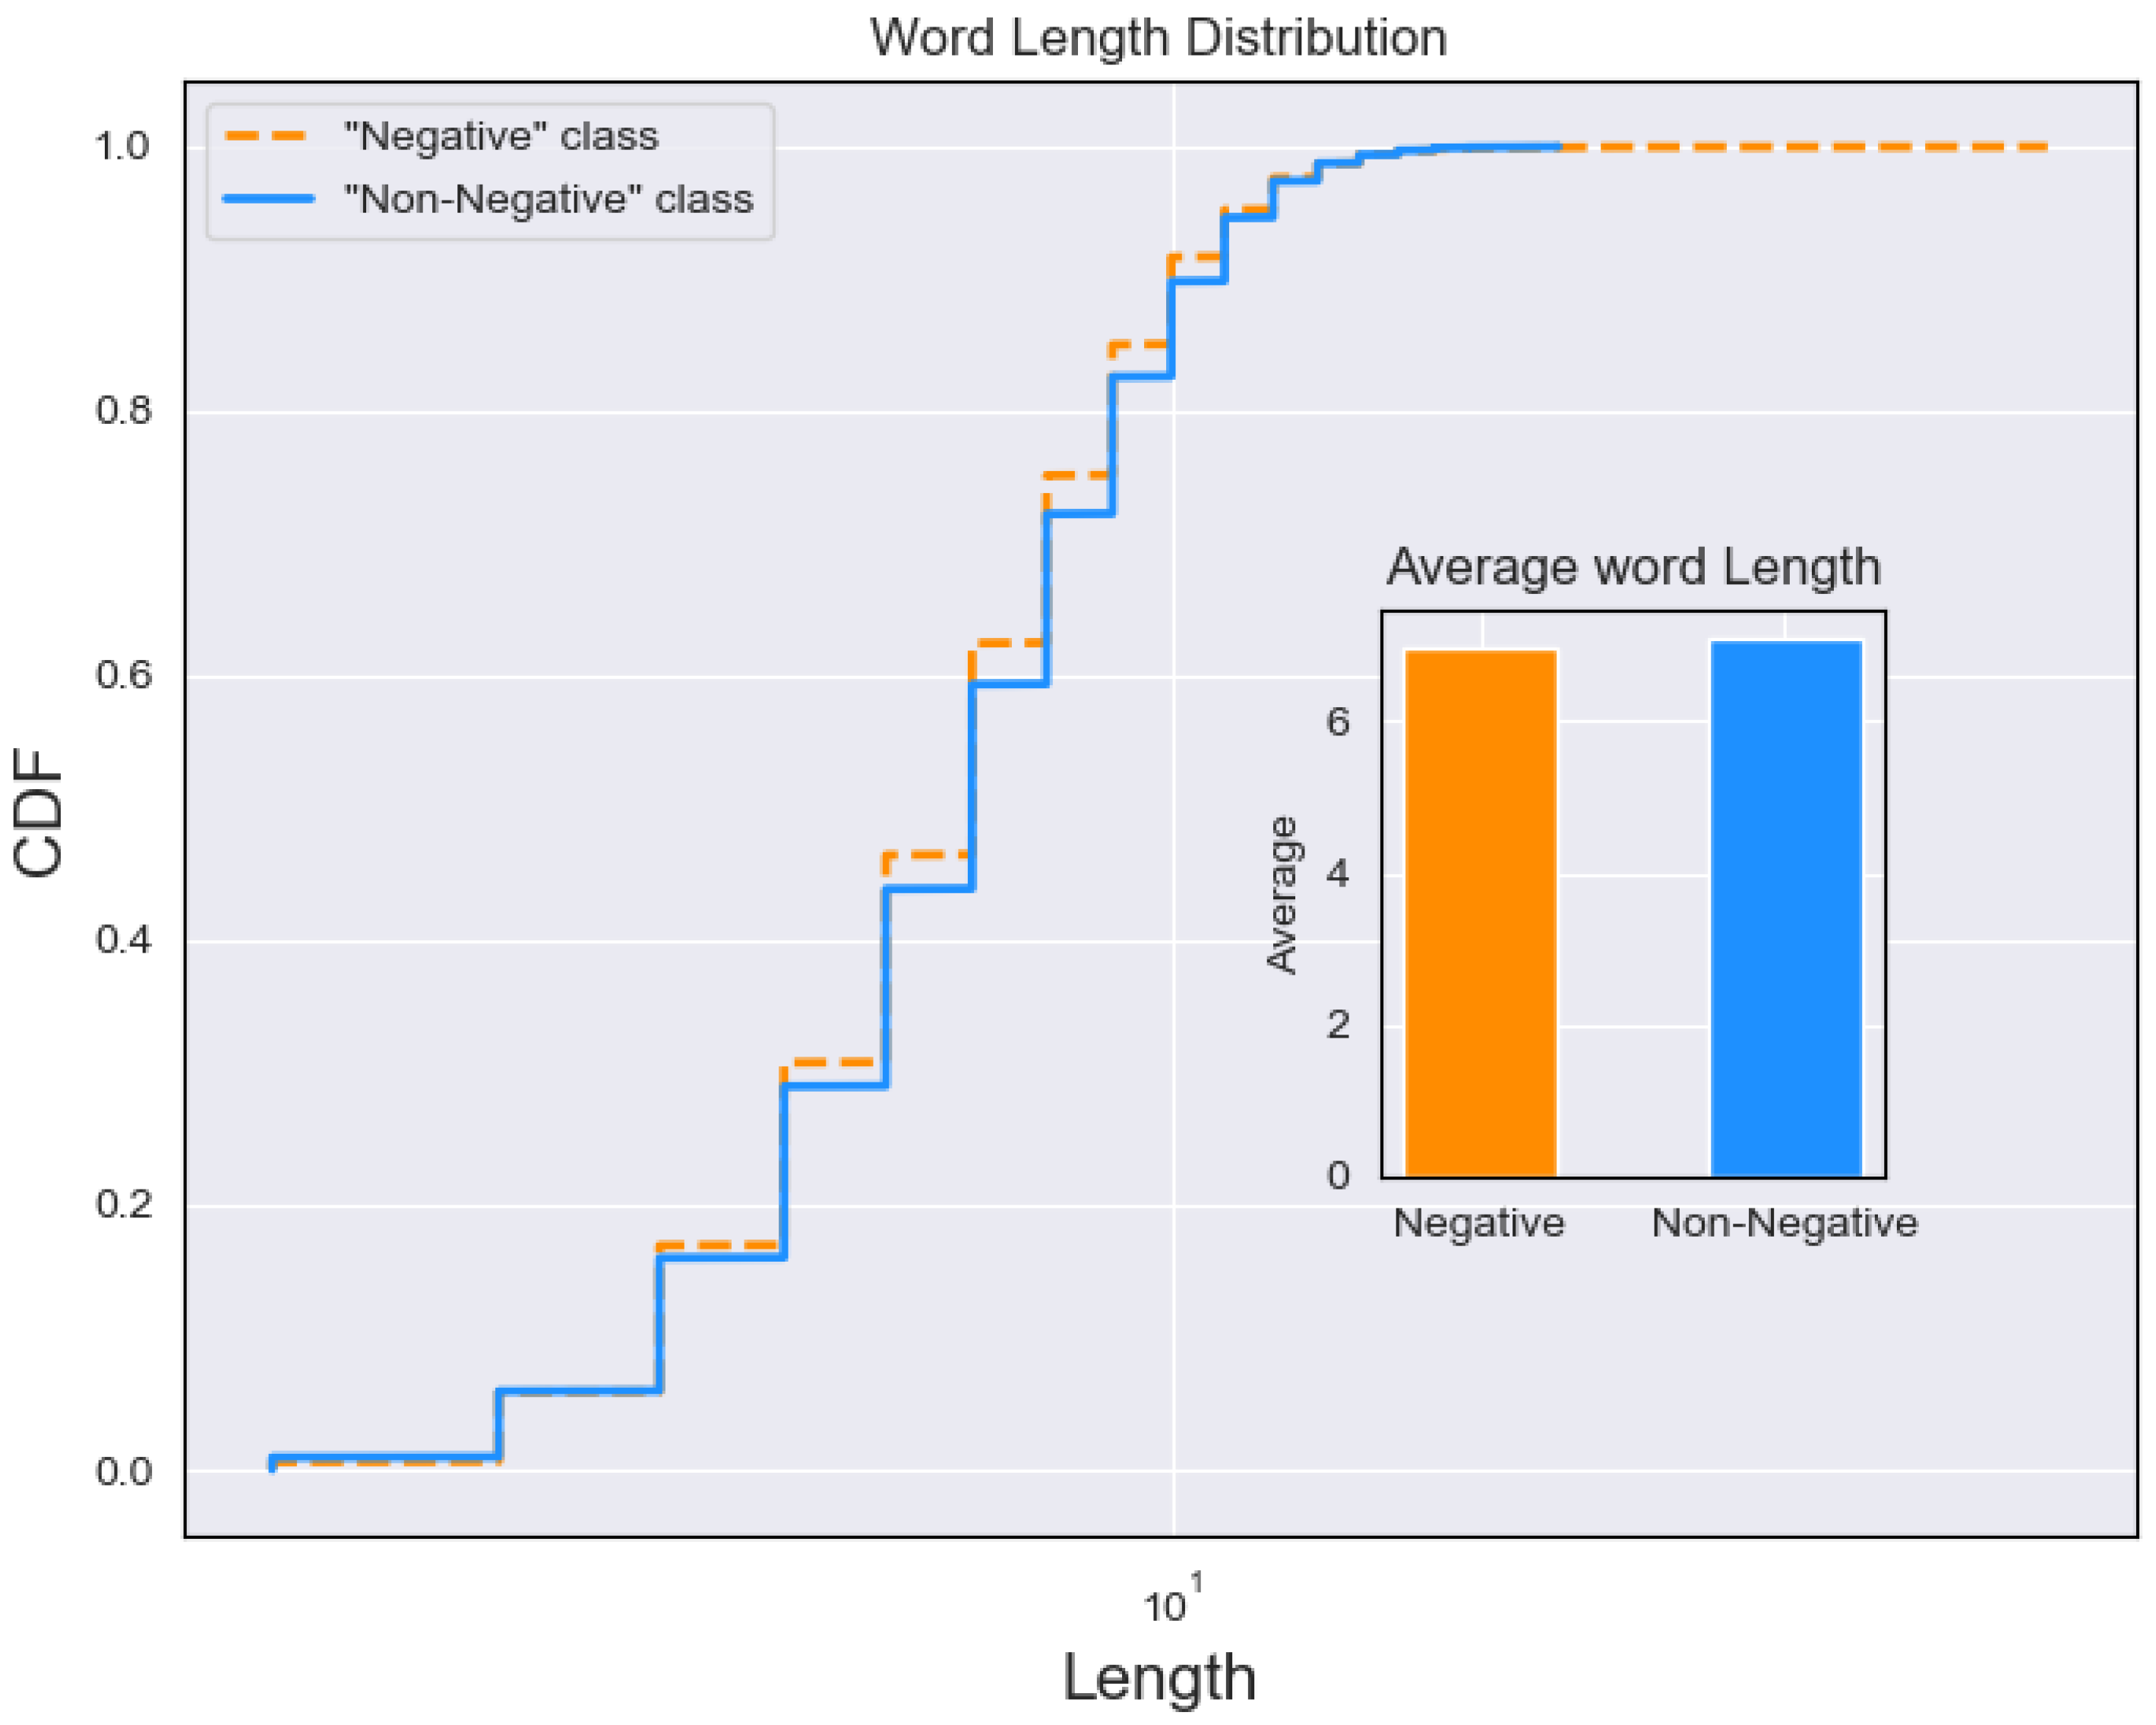
Another feature that we considered was the length of Tweets and words for each class. Although the total length of Tweets was taken under consideration in the past [44], this could not be used in our work, because the analyzed dataset was imbalanced i.e., number of Tweets per class was different, which would result in biased values. Thus, the length of all Tweets/words for each class were used instead, in order to present differences/similarities between these features through Cumulative Distribution Function (CDF), which has been previously used to represent data in similar tasks [56].
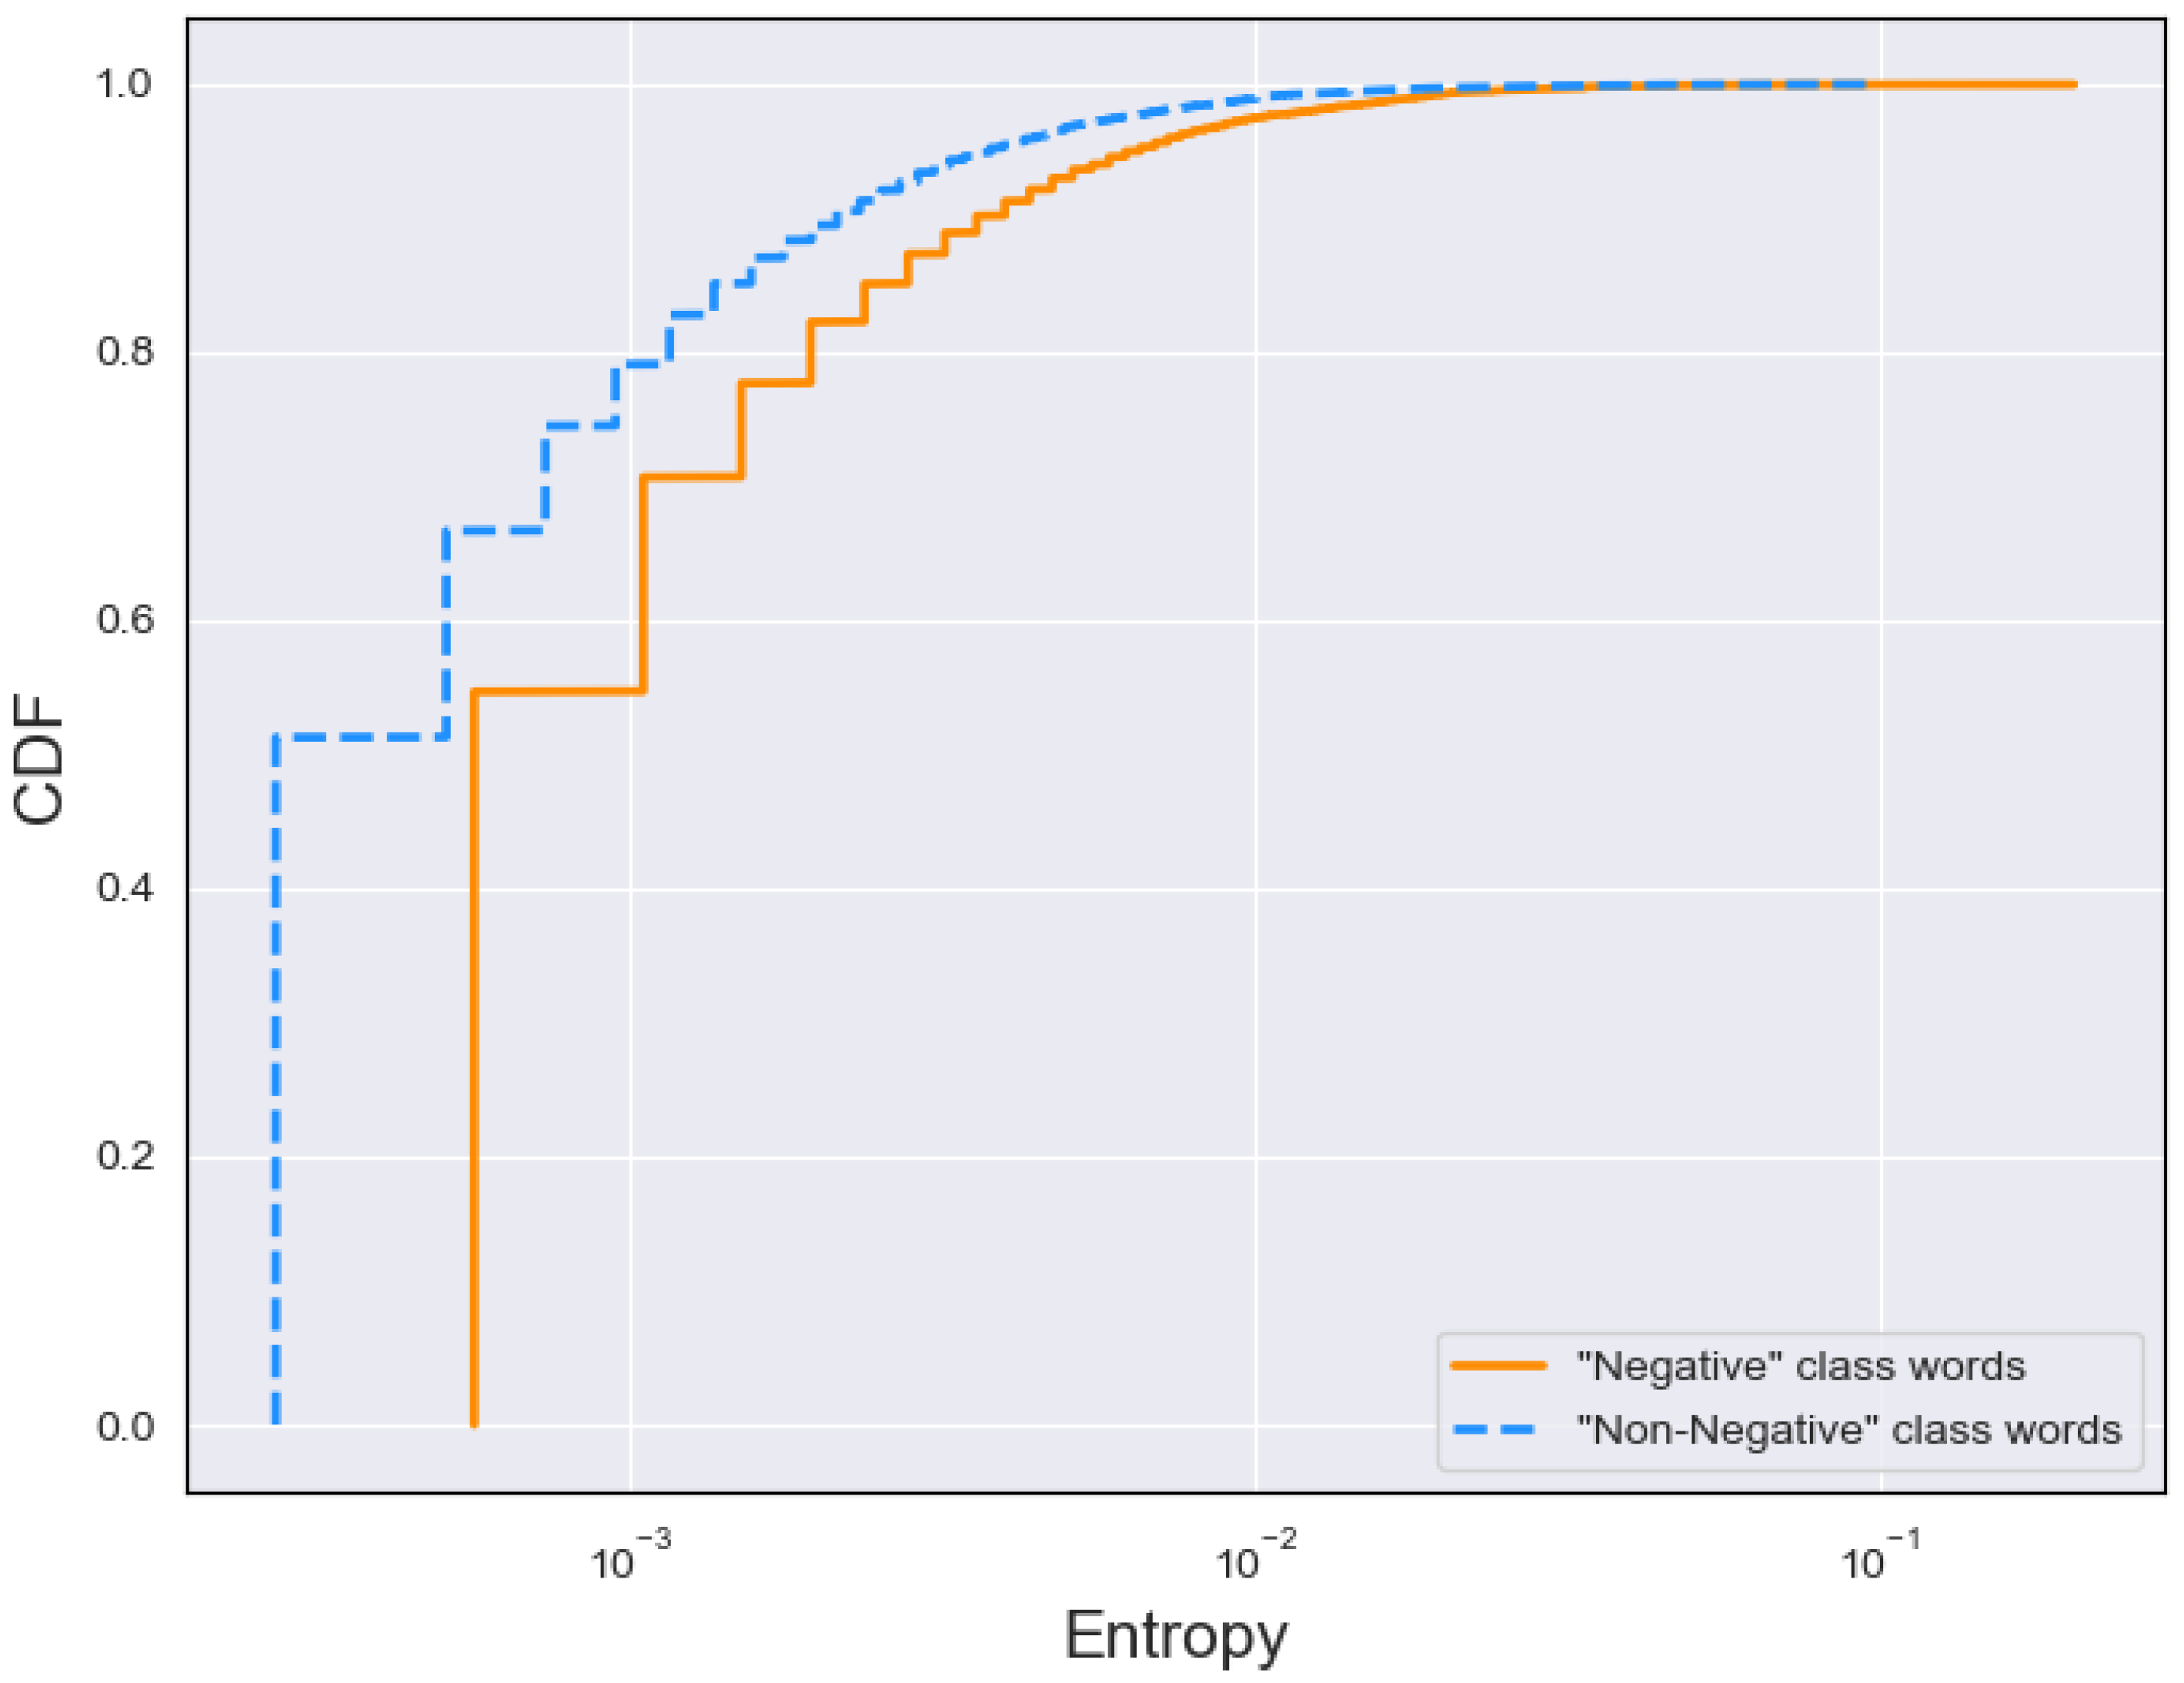
Next, we analyzed the entropy, which refers to a measure of information, sometimes referred to as a measure of uncertainty. Whhen considering word frequency in a text as an example, the highest uncertainty to whether a word will appear is when its frequency is 0.5, which means it has 50% chances of appearing. On the contrary, if the frequency of a word is high or low, there is less uncertainty to whether it will appear (low entropy). Low-frequency word is unlikely to occur; therefore, we are more certain that it will not show up, with the same applied to the high-frequency word, which is more likely to occur. Therefore, entropy is the highest for uniform distributions, e.g., in a text where each word has a similar probability (frequency). In our work the entropy of each word is calculated for both Tweet classes and, as previously, depicted as a CDF. Our objective was to determine which class has lower word entropy, therefore being less random, with our calculations being based on Shannon’s entropy formula.
H x = i = 1 n P i l o g 2 p i
where H is the entropy of X and p is the probability of word I (frequency). In our work, the entropy is calculated and presented for each word separately (CDF); therefore, the values are not summed up as in the formula.

4. Results and Evaluation

4.1. Lexical Characteristics Results

4.1.1. Most Frequent Words

The analyses were conducted as described in the methodology section. The first analyzed feature was the most frequently occurring words, which already showed statistically significant differences in terms of the top 25 words used in each labeled class. Figure 2 shows such words in the Negative class, where deport is the most frequent term totaling 1200 occurrences, which represents 4% of the total words in class (inner plot). Our results becomes even more interesting when compared to the second most frequent term immigration, which occurred approximately 300 times and took up only just above 1% of the entire class. The terms country (235 occurrences) and illegal (216) were ranked the 3rd and 4th, respectively. On the other hand, the distribution for the Non-Negative differed significantly. As illustrated in Figure 3, although the term deport appeared as well in this class, it did only on thurd position (i.e., 493 times, 0.8% of the whole class), following immigration, which was the most frequent word (almost 1000 and approximately 1.7% of the class), and immigrant is the second most frequent (i.e., approximately 650 occurrences, thus 1.1% of the class). As expected, the word illegal while used quite frequently in the Negative class, did not occur in Non-Negative Tweets. The results show that the second class had a more uniform vocabulary, where the words are more evenly distributed in the set, which is particularly true for the top 25 occurrences.

4.1.2. Most Frequent Hashtags

We explored the top 10 hashtags for both classes. Table 2 depicts our findings and Figure A1a illustrates the volume for the Negative class, indicating that there were four most omnipresent hashtags, namely: #illegalaliens with 115 occurrences, followed by #deportthemall (88), #banislam (61) and #buildthewall (42). A similar pattern can be observed in the top 25 words for the same class. Very few terms constitute the most common, followed by a sudden drop and almost even distribution of other hashtags. On the contrary, the Non-Negative class again showed a slightly more even distribution, with hashtag #trump being the most common (145 occurrences) followed by #immigration, which appeared almost half as much as the top one (81), #liberals and #senate with occurrences of 49 and 44, respectively ( Table 2 and Figure A1a).
With regards to user mentions our results for the top 10 user mentions for each class are summarized in Table 2 for Negative (Figure A1c) and for Non-Negative (Figure A1d), respectively. Another trend can be observed when compared to the previous results. Here the distribution tends to be slightly more even in the Negative set, which means that a larger group of users was mentioned frequently. Surprisingly, the most common mention in both classes was the same, namely @realdonaldtrump with 92 occurrences in Negative and 116 in the other. Moreover, other political personas were found in both classes such as @borisjohnson in Negative with 52 occurrences and @berniesanders with 20 occurrences.

4.1.3. Tweet Location

Next, four Tweet locations were analyzed identifying the top 10 cities from which xenophobic and non-xenophobic discourse originated. As discussed previously, analysis was quite limited due to Twitter API restrictions. Consequently, the results presented are for a very narrow slice of the dataset; however, they provide an indication to what extent the discourse is focused in certain locations. Table 2 also represents cities from the Negative class (Figure A1e), which, apart from Seattle, Calgary, and Los Angeles, are all in the UK (seven cities). London, despite the fact that it seems the predominant location in terms of volume of xenophobic Tweets (102), the number reflects the 43% of the total Tweets. It is followed by the city of Glasgow, which has 20.6% Negative Tweets (41), while Manchester has 74.5% negative (41).
The numbers from the Non-Negative set were found to be slightly more diversified (Figure A1f). In Table 2, we can observe cities originating from all three countries (US, UK, Canada), again UK cities being the majority (eight cities), with Birmingham ranking first with 192 Tweets, which reflect the 84.5% of the total number of Tweets, followed by Edinburgh (158, which is estimated as 91.9% of the total number of Tweets) and Glasgow (157, which is estimated as 79.4% of the total Tweets). Interestingly, the majority of cities were the same in both sets (six common cities).

4.1.4. Tweet Length

Figure 4 illustrates a CDF representing the results from our analysis, which measures the Tweet lengths in both classes. As the results suggest, a noticeable difference exists in Tweet lengths, as the majority of Negative Tweets are shorter than Non-Negative. 40% of the distribution represents the differences where Negative Tweets had length of 10 or less and Non-Negative 13 or less. Looking at 60% of the distribution Negative had length of 15 words or less and Non-Negative 18 words or less. The inner plot shows averages for Tweet lengths, where the difference can also be observed at approximately 2% between classes with 13% for Negative and just over 15% for the other. Figure 5 illustrates a CDF representing the results for word lengths. No significant differences in word lengths were found and only a very trivial variation can be observed both in terms of CDF and averages (inner plot).
Figure 6 is a CDF representing our findings for each class’ entropy. We observed a statistically significant difference between the two sets, with the Negative class having higher values. The entropy values were very low. Specifically, at 80% of the distribution the Negative class had entropy of 0.0019 or less and Non-Negative had even lower values of 0.0011 or less.

4.2. Classification: Automatic Detection of Hate-Speech

This section presents the classifiers used to automatically detect anti-immigration rhetoric. To assess their performance, the common machine learning metrics were used, namely: Precision, Recall, and F-Score [39]:
P r e c i s i o n = T r u e   P o s i t i v e s / ( T r u e   P o s i t i v e s + F a l s e   P o s i t i v e s )
R e c a l l = T r u e   P o s i t i v e s / ( T r u e   P o s i t i v e s + F a l s e   P o s i t i v e s )
F S c o r e = 2 ( ( P r e c i s i o n x R e c a l l ) / ( P r e c i s i o n   +   R e c a l l ) )
In the context of our work, True Positives represent the tweets that have been correctly categorized as elements of anti-immigration rhetoric, while the False Positives are tweets that are misclassified as anti-immigration rhetoric. False Negatives are tweets that are misclassified in the "Non-Negative" class, while containing anti-immigration rhetoric. Precision is the ratio of correctly predicted anti-immigration rhetoric observations to the total predicted, including the false observations. In Precision, True positives (correctly categorized as positive) are denominated by themselves plus any occurring False Positives (incorrectly categorized as positive). Recall is the ratio of correctly predicted ant-immigration rhetoric observations to the all observations that belong in the same class, regardless of whether they were misclassified. Recall can indicate how many Positives were missed. F-Score is defined as the weighted average of Precision and Recall, thus being the harmonic mean between Precision and Recall, and it can be regarded as an indication of a balance between these metrics.
Table 3 summarizes our evaluations with the aforementioned metrics. We indicate with bold the best scores, which are a mean of ten tests conducted using 10-fold cross-validation. Based on our analysis, the best performing model was SVM with word n-grams, achieving the best balance between precision and recall, with an F-Score of 84%. Although NB with word n-grams had the highest precision (i.e., 85%), it had relatively low recall score (79%), thus considerably more xenophobic Tweets were misclassified when compared to other models. The highest recall was achieved by LR with both word and character n-grams (87%).
It appears that, in our dataset in the case of the anti-immigration rhetoric, the word n-grams model outperformed the character n-gram approach. Additionally, the single SVM with words as features outperformed the char n-gram NB combined with SVM from the first baseline by seven points in terms of F-Score and 14 points for Recall. However, it achieved slightly less in terms of Precision, namely 2 points. All of the approaches outperformed the second baseline in terms of F-Score, with the best model scoring 19 points higher.

5. Discussion

The first goal of our work was to successfully classify xenophobic content on social media. Our results suggest that, contrarily to previous studies [38,43], in some cases, word n-grams outperformed character n-grams (i.e., having best char f-score of 83 against 84 for word). This suggests that carefully chosen features, such as specific unigrams, can be useful for the classification of abusive text.
The results provide us with some additional insights. We show that discriminative methods, such as SVMs and LR, are better suited for this task and less sensitive to the underlying features (char n-grams vs word n-grams). Although previous works (e.g., by Waseem) have used character n-grams for such models, for our task, the choice of model seems to be more important than the choice of features. However, when considering a generative model, such as NB, which takes into account the sequence of characters, character n-grams perform better. Essentially, these results provide us with insights regarding feature engineering, which is a very important task when using traditional ML (rather than deep learning, where feature engineering is not needed). It is evident from the results that generative models are less sensitive to characters, whereas discriminative models, such as SVMs and LR, can work well with both. If one considers Precision and Recall, there are differences in scores, i.e., some models are more prone to Type I errors (i.e., False Positive Errors) and some are more prone to Type II errors (i.e., False Negative Errors). The classification scores for the models that have been tested suggest that there is no difference with regards to F-Score, which is their harmonic mean of Precision and Recall. However, we consider that one that is deploying a hate-speech detection engine would opt to select the models that scored higher in our tests in the Recall metric. This holds true, as this would mean that the hate-speech detection engine would have less False Negative, i.e., less Tweets with anti-immigration rhetoric which have been misclassified in the “Non-Negative” class. Such misclassifications could be decreased with the creation of more sophisticated features that consider sarcasm and humor, which seem to be the main reason for their existence. While we anticipate that this would increase the accuracy of the hate-speech detection engine, we consider this as out of scope of this work.
As mentioned previously, the majority of our dataset was obtained using xenophobic hashtags as keywords for the API. Additionally, the results from our hashtags measurements are omnipresent throughout the Negative class. The presence of such hashtags made the classification of xenophobic Tweets easier, and as a result, improved model performance. On the other hand, the TF-IDF approach should lower the importance of frequent terms occurring throughout the documents, which was not true in our analysis due to the variety of such hashtags. Additionally, our work uncovers terms that strongly indicate anti-immigration sentiment and prevail in the Negative class, such as Deport and Illegal, or get, back, and country. Consequently, it can be deduced that the wording for each class exhibits significant differences in terms of most frequent words, a result that aligns with previous study findings [44].
Moving to the hashtags measurements, there were at least six hashtags that can be considered related to xenophobia (e.g., #deport, #stoptheinvasion). However, it must be noted that different variations of certain hashtags were considered as a single feature, as they express essentially the same attitude. For example #Deport and #deport are treated similarly in the context of our analysis. Additionally, as already discussed, the Tweets were searched using keywords, with xenophobic hashtags being one of them. It was also mentioned that religion can be used to assign people to immigration groups, something that can be observed in the results where hashtags representing negative sentiment towards Muslim communities (#bansharia, #banislam). However, the other class favors more neutral hashtags, some of which are related to politics (e.g., #senate), which proves our original assumption that politics can be a major trigger factor in the immigration debate. Surprisingly, even though Donald Trump is often associated with political incorrectness [57], his name (#trump) was the most frequently occurring hashtag in Non-Negative class and did not occur at all in the Negative, despite some of his ideologies being present (such as #maga, #buildthewall). One possible explanation for this was that he was being brought forward in non-xenophobic discourse to criticize him or his agenda.
Political personas were involved in discourse through user mentions. In this case, @realdonaldtrump was found at the top in both classes. This indicates that even though this persona is often invoked in the immigration debate, associating his presence on Twitter with either class is not a simple task, as he appears on both sides of the debate, which is in line with findings from a previous study [8]. On the other hand, British politicians seem to be predominant in Negative Tweets, with @borisjohnson appearing almost three times as often when compared to the other class along with others such as Priti Patel (@patel4witham). Another interesting matter brought forward through our analysis, was the ability to associate real Twitter users with content that they publish and drawing conclusions about their suggested policies towards certain topics, such as immigration. Thus, through such simple processing it was possible to profile users, which has been previously identified as a threat to privacy on Twitter [32].
The geo-location analysis showed that most certainly UK and USA cities dominated the Negative class where only Calgary is a Canadian city. However, the same can be observed in the second class where only Vancouver is a Canadian city and this reflects that Canadian cities prevailed in the Non-Negative class, something that was expected, as Canada was not going through major political events at that period of time. On the other hand, the limitations of this analysis suggest a careful approach to the evidence as our analysis suggests that the use of geographical information as a text classification feature is not feasible, which was previously supported by related literature [44]. Nonetheless London dominated the xenophobic Tweets, whereas it was ranked 6th in the Non-Negative class. This is quite surprising as cities such as London appear to be multicultural and encouraging immigration. However, the aforementioned observation could be challenged by the fact that the cultural differences could manifest themselves in local communities, which may indicate that what we observe in general does not necessarily apply to local communities. If we take into consideration that social media can give voice to almost anyone, such differences can be expressed online, as it can be seen in the results.
The Tweet lengths were in fact smaller for Negative class in most of the distribution, with averages having similar differences. On the other hand, word lengths do not present significant differences, both in terms of overall distribution and averages (slightly higher for Non-Negative), which also confirms the initial expectations. The results suggest that Tweet lengths could be used as features in text classification as they demonstrate differences between classes. One reason that could have affected previous work is the fact that at that time twitter posts were limited 140 characters, which changed in 2017, as compared to today, where there is more room for variance.
Our entropy results indicate that the Negative class tends to be more uniform, suggesting higher entropy. This further indicates that the top 25 words cannot be used to make assumptions for the entire set, as other potentially less frequent words can also have an impact on entropy. Nonetheless, the entropy difference between classes, although small, seems to be present for the majority of the distribution, suggesting a possible use of this characteristic as a classification feature.

6. Conclusions

The political changes seen throughout modern societies have led to heated debates that, along with the availability of WEB 2.0, have been elevated from private level discussions into public debates. These often take place in social media, resulting in the expression of opinions that can be harvested and analyzed. The controversial topics discussed in these debates have often led to the expression of negative opinions with regards to immigrants [45,53] or racial minorities [13]. Such controversial debates, while being disturbing, provide an opportunity to study and better understand mechanisms behind such discourse, which can then be utilized to improve classification methods. They also can raise awareness regarding the absence of privacy on social media, where disclosing antagonistic opinions can have far-reaching consequences, even in form of imprisonment [39].
Our work is an attempt to investigate the presence of anti-immigration rhetoric on Twitter, by providing another insight into the broad field of online content analysis. It differs from previous attempts in related literature because it incorporated a combination of text classification of xenophobic content, along with in-depth analysis of lexical characteristics of such discourse. All of these were feasible through the creation of a new, manually labeled, unique dataset of Tweets, constituted of a compelling combination of UK, USA and Canadian English language. Our model proved that besides the existence of certain language differences in every English-speaking country, accurate text classification can still be feasible. We also studied the lexical differences between xenophobic and non-xenophobic discourse, while emphasizing on the importance of privacy on social media.
The next steps for our work would be to first create a larger dataset by employing expert annotators, which will make Deep Learning approaches feasible. We also plan to test our current model on different datasets offered by the community, providing more knowledge regarding the generalizability of our results. We plan to test other models as well as improving the current model’s features by incorporating more sophisticated semantic features, which could further improve model accuracy. This could allow addressing challenges, such as sarcasm and humor, which are one of the biggest challenges in hateful content classification. Finally, our plans include the exploration of privacy-preserving machine learning methods to minimize the threat of information leakage and promote the privacy of the users.

Author Contributions

All authors contributed in the conceptualization and methodology of the manuscript. K.K. performed the data preparation and N.P. writing, D.G., R.L., A.M. and M.K. reviewed and edited the manuscript. All authors have read and agreed to the published version of the manuscript.

Funding

This research received no external funding.

Conflicts of Interest

The authors declare no conflict of interest.

Abbreviations

The following abbreviations are used in this manuscript:
MDPIMultidisciplinary Digital Publishing Institute
DOAJDirectory of open access journals
MLMachine Learning
SNSSocial Networking Sites
NLPNatural Language Processing
BoWBag of Words
NLTKNatural Language Toolkit

Appendix A. Results Summary

Figure A1. Top 10 hashtags, user mentions and cities/towns for “Negative” and “Non-Negative“ classes.
Make 02 00011 g0a1aMake 02 00011 g0a1b

References

  1. Battisby, A. The Latest UK Social Media Statistics for 2019; Avocado Social: London, UK, 2019; Available online: https://avocadosocial.com/latest-social-media-statistics-and-demographics-for-the-uk-in-2019/ (accessed on 30 July 2020).
  2. We Are Social, Hootsuite. The Global Digital Report 2019. 2019. Available online: https://wearesocial.com/global-digital-report-2019 (accessed on 30 July 2020).
  3. Dictionary, C. Cambridge Advanced Learner’S Dictionary; Cambridge University Press: Cambridge, UK, 2008. [Google Scholar]
  4. Legewie, J. Terrorist events and attitudes toward immigrants: A natural experiment. Am. J. Sociol. 2013, 118, 1199–1245. [Google Scholar] [CrossRef] [Green Version]
  5. Grierson, J. Hostile environment: Anatomy of a policy disaster. The Guardian, 27 August 2018; p.1. [Google Scholar]
  6. Goodman, S. “Take Back Control of Our Borders”: The Role of Arguments about Controlling Immigration in the Brexit Debate. Rocznik Instytutu Europy Środkowo-Wschodniej 2017, 15, 35–53. [Google Scholar]
  7. Aguilera, J. Xenophobia ‘is a pre-existing condition’. How harmful stereotypes and racism are spreading around the coronavirus. Time, 1 February 2020; p.1. [Google Scholar]
  8. Siegel, A.; Nikitin, E.; Barberá, P.; Sterling, J.; Pullen, B.; Bonneau, R.; Nagler, J.; Tucker, J.A. Trumping Hate on Twitter? Online Hate Speech in the 2016 US Election Campaign and Its Aftermath; Alexandra Siegel: New York, NY, USA, 2019; Available online: https://alexandra-siegel.com/wp-content/uploads/2019/08/qjps_election_hatespeech_RR.pdf (accessed on 30 July 2020).
  9. Cadwalladr, C.; Graham-Harrison, E. Revealed: 50 million Facebook profiles harvested for Cambridge Analytica in major data breach. Guardian 2018, 17, 22. [Google Scholar]
  10. Williams, M.L.; Burnap, P. Cyberhate on social media in the aftermath of Woolwich: A case study in computational criminology and big data. Br. J. Criminol. 2016, 56, 211–238. [Google Scholar] [CrossRef] [Green Version]
  11. i Orts, Ò.G. Multilingual Detection of Hate Speech Against Immigrants and Women in Twitter at SemEval-2019 Task 5: Frequency Analysis Interpolation for Hate in Speech Detection. In Proceedings of the 13th International Workshop on Semantic Evaluation, Minneapolis, MN, USA, 6–7 June 2019; pp. 460–463. [Google Scholar]
  12. Rzepnikowska, A. Racism and xenophobia experienced by Polish migrants in the UK before and after Brexit vote. J. Ethnic Migr. Stud. 2019, 45, 61–77. [Google Scholar] [CrossRef] [Green Version]
  13. Evolvi, G. # Islamexit: Inter-group antagonism on Twitter. Inf. Commun. Soc. 2019, 22, 386–401. [Google Scholar]
  14. Quinn, K. Why we share: A uses and gratifications approach to privacy regulation in social media use. J. Broadcast. Electron. Media 2016, 60, 61–86. [Google Scholar] [CrossRef]
  15. Whiting, A.; Williams, D. Why people use social media: A uses and gratifications approach. Qual. Market Res. Int. J. 2013. [Google Scholar] [CrossRef] [Green Version]
  16. Smith, A.N.; Fischer, E.; Yongjian, C. How does brand-related user-generated content differ across YouTube, Facebook, and Twitter? J. Interact. Market. 2012, 26, 102–113. [Google Scholar] [CrossRef]
  17. Kim, J. The institutionalization of YouTube: From user-generated content to professionally generated content. Media Cult. Soc. 2012, 34, 53–67. [Google Scholar] [CrossRef]
  18. Khan, M.L. Social media engagement: What motivates user participation and consumption on YouTube? Comput. Hum. Behav. 2017, 66, 236–247. [Google Scholar] [CrossRef]
  19. Nations, D. What Is Microblogging? Sprout Social: Chicago, IL, USA, 2017. [Google Scholar]
  20. Selim, H.A.; Long, K.M.; Vignoles, V.L. Exploring identity motives in Twitter usage in Saudi Arabia and the UK. Annu. Rev. Cyberther. Telemed. 2014, 199, 128–132. [Google Scholar]
  21. Nosko, A.; Wood, E.; Molema, S. All about me: Disclosure in online social networking profiles: The case of FACEBOOK. Comput. Hum. Behav. 2010, 26, 406–418. [Google Scholar] [CrossRef]
  22. Tsay-Vogel, M.; Shanahan, J.; Signorielli, N. Social media cultivating perceptions of privacy: A 5-year analysis of privacy attitudes and self-disclosure behaviors among Facebook users. New Media Soc. 2018, 20, 141–161. [Google Scholar] [CrossRef]
  23. Twitter. Twitter Privacy Policy. Available online: https://twitter.com/en/privacy (accessed on 15 May 2020).
  24. Utz, S.; Krämer, N.C. The privacy paradox on social network sites revisited: The role of individual characteristics and group norms. Cyberpsychology 2009, 2, 3. [Google Scholar]
  25. Vitak, J. The impact of context collapse and privacy on social network site disclosures. J. Broadcast. Electron. Media 2012, 56, 451–470. [Google Scholar] [CrossRef]
  26. Davies, H. Ted Cruz using firm that harvested data on millions of unwitting Facebook users. Guardian 2015, 11, 2015. [Google Scholar]
  27. Isaak, J.; Hanna, M.J. User data privacy: Facebook, Cambridge Analytica, and privacy protection. Computer 2018, 51, 56–59. [Google Scholar] [CrossRef]
  28. Douglas, J.E.; Ressler, R.K.; Burgess, A.W.; Hartman, C.R. Criminal profiling from crime scene analysis. Behav. Sci. Law 1986, 4, 401–421. [Google Scholar] [CrossRef]
  29. Kandias, M.; Mylonas, A.; Virvilis, N.; Theoharidou, M.; Gritzalis, D. An insider threat prediction model. In International Conference on Trust, Privacy and Security in Digital Business; Springer: Berlin/Heidelberg, Germany, 2010; pp. 26–37. [Google Scholar]
  30. Kandias, M.; Mitrou, L.; Stavrou, V.; Gritzalis, D. Which side are you on? A new Panopticon vs. privacy. In Proceedings of the 2013 International Conference on Security and Cryptography (SECRYPT), Reykjavik, Iceland, 29–31 July 2013; pp. 1–13. [Google Scholar]
  31. Kandias, M.; Stavrou, V.; Bozovic, N.; Mitrou, L.; Gritzalis, D. Can we trust this user? Predicting insider’s attitude via YouTube usage profiling. In Proceedings of the 2013 IEEE 10th International Conference on Ubiquitous Intelligence and Computing, Vietri sul Mere, Italy, 18–21 December 2013; pp. 347–354. [Google Scholar]
  32. Mitrou, L.; Kandias, M.; Stavrou, V.; Gritzalis, D. Social media profiling: A Panopticon or Omniopticon tool? In Proceedings of the 6th Conference of the Surveillance Studies Network, Barcelona, Spain, 7–9 July 2014. [Google Scholar]
  33. Cambria, E.; White, B. Jumping NLP curves: A review of natural language processing research. IEEE Computat. Intell. Mag. 2014, 9, 48–57. [Google Scholar] [CrossRef]
  34. Tumasjan, A.; Sprenger, T.O.; Sandner, P.G.; Welpe, I.M. Election forecasts with Twitter: How 140 characters reflect the political landscape. Soc. Sci. Comput. Rev. 2011, 29, 402–418. [Google Scholar] [CrossRef] [Green Version]
  35. Devlin, J.; Chang, M.W.; Lee, K.; Toutanova, K. BERT: Pre-training of Deep Bidirectional Transformers for Language Understanding. In Proceedings of the 2019 Conference of the North American Chapter of the Association for Computational Linguistics: Human Language Technologies, Volume 1 (Long and Short Papers), Minneapolis, MN, USA, 3 June 2019; pp. 4171–4186. [Google Scholar]
  36. Sun, S.; Luo, C.; Chen, J. A review of natural language processing techniques for opinion mining systems. Inf. Fusion 2017, 36, 10–25. [Google Scholar] [CrossRef]
  37. Schmidt, A.; Wiegand, M. A survey on hate speech detection using natural language processing. In Proceedings of the Fifth International Workshop on Natural Language Processing for Social Media, Valencia, Spain, 3 April 2017; pp. 1–10. [Google Scholar]
  38. Nobata, C.; Tetreault, J.; Thomas, A.; Mehdad, Y.; Chang, Y. Abusive language detection in online user content. In Proceedings of the 25th International Conference on World Wide Web, Montreal, QC, Canada, 11–15 April 2016; pp. 145–153. [Google Scholar]
  39. Burnap, P.; Williams, M.L. Cyber hate speech on twitter: An application of machine classification and statistical modeling for policy and decision making. Policy Internet 2015, 7, 223–242. [Google Scholar] [CrossRef] [Green Version]
  40. Burnap, P.; Williams, M.L. Us and them: Identifying cyber hate on Twitter across multiple protected characteristics. EPJ Data Sci. 2016, 5, 11. [Google Scholar] [CrossRef] [Green Version]
  41. Chen, Y.; Zhou, Y.; Zhu, S.; Xu, H. Detecting offensive language in social media to protect adolescent online safety. In Proceedings of the 2012 International Conference on Privacy, Security, Risk and Trust, Amsterdam, The Netherlands, 3–5 September 2012; pp. 71–80. [Google Scholar]
  42. Kwok, I.; Wang, Y. Locate the hate: Detecting tweets against blacks. In Proceedings of the Twenty-Seventh AAAI Conference on Artificial Intelligence, Washington, DC, USA, 14–18 July 2013. [Google Scholar]
  43. Mehdad, Y.; Tetreault, J. Do characters abuse more than words? In Proceedings of the 17th Annual Meeting of the Special Interest Group on Discourse and Dialogue, Los Angeles, CA, USA, 13–15 September 2016; pp. 299–303. [Google Scholar]
  44. Waseem, Z.; Hovy, D. Hateful symbols or hateful people? predictive features for hate speech detection on twitter. In Proceedings of the NAACL Student Research Workshop, San Diego, CA, USA, 13–15 June 2016; pp. 88–93. [Google Scholar]
  45. Basile, V.; Bosco, C.; Fersini, E.; Nozza, D.; Patti, V.; Pardo, F.M.R.; Rosso, P.; Sanguinetti, M. Semeval-2019 task 5: Multilingual detection of hate speech against immigrants and women in twitter. In Proceedings of the 13th International Workshop on Semantic Evaluation, Minneapolis, MN, USA, 6–7 June 2019; pp. 54–63. [Google Scholar]
  46. Sood, S.O.; Churchill, E.F.; Antin, J. Automatic identification of personal insults on social news sites. J. Am. Soc. Inf. Sci. Technol. 2012, 63, 270–285. [Google Scholar] [CrossRef]
  47. Dinakar, K.; Jones, B.; Havasi, C.; Lieberman, H.; Picard, R. Common sense reasoning for detection, prevention, and mitigation of cyberbullying. ACM Trans. Interact. Intell. Syst. 2012, 2, 1–30. [Google Scholar] [CrossRef] [Green Version]
  48. Gitari, N.D.; Zuping, Z.; Damien, H.; Long, J. A lexicon-based approach for hate speech detection. Int. J. Multimed. Ubiquitous Eng. 2015, 10, 215–230. [Google Scholar] [CrossRef]
  49. Rodríguez, A.; Argueta, C.; Chen, Y.L. Automatic detection of hate speech on facebook using sentiment and emotion analysis. In Proceedings of the 2019 International Conference on Artificial Intelligence in Information and Communication (ICAIIC), Okinawa, Japan, 11–13 February 2019; pp. 169–174. [Google Scholar]
  50. Pitsilis, G.K.; Ramampiaro, H.; Langseth, H. Effective hate-speech detection in Twitter data using recurrent neural networks. Appl. Intell. 2018, 48, 4730–4742. [Google Scholar] [CrossRef] [Green Version]
  51. Zhang, Z.; Robinson, D.; Tepper, J. Detecting hate speech on twitter using a convolution-gru based deep neural network. In European sEmantic Web Conference; Springer: Berlin, Germany, 2018; pp. 745–760. [Google Scholar]
  52. Badjatiya, P.; Gupta, S.; Gupta, M.; Varma, V. Deep learning for hate speech detection in tweets. In Proceedings of the 26th International Conference on World Wide Web Companion, Perth, Australia, 3–7 April 2017; pp. 759–760. [Google Scholar]
  53. Florio, K.; Basile, V.; Lai, M.; Patti, V. Leveraging Hate Speech Detection to Investigate Immigration-related Phenomena in Italy. In Proceedings of the 2019 8th International Conference on Affective Computing and Intelligent Interaction Workshops and Demos (ACIIW), Cambridge, UK, 3–6 September 2019; pp. 1–7. [Google Scholar]
  54. Goodwin, M.; Milazzo, C. Taking back control? Investigating the role of immigration in the 2016 vote for Brexit. Br. J. Politics Int. Relat. 2017, 19, 450–464. [Google Scholar] [CrossRef]
  55. Wright, T. Majority of Canadians Think Immigration Should Be Limited: Poll. Global News. 2019. Available online: https://globalnews.ca/news/5397306/canada-immigration-poll/ (accessed on 30 July 2020).
  56. Kintis, P.; Miramirkhani, N.; Lever, C.; Chen, Y.; Romero-Gomez, R.; Pitropakis, N.; Nikiforakis, N.; Antonakakis, M. Hiding in plain sight: A longitudinal study of combosquatting abuse. In Proceedings of the 2017 ACM SIGSAC Conference on Computer and Communications Security, Dallas, TX, USA, 30 October–3 November 2017; pp. 569–586. [Google Scholar]
  57. Gantt Shafer, J. Donald Trump’s “political incorrectness”: Neoliberalism as frontstage racism on social media. Soc. Media Soc. 2017, 3, 2056305117733226. [Google Scholar] [CrossRef] [Green Version]
Figure 1. Breakdown of the labeled dataset by category.
Make 02 00011 g001
Figure 2. Top most frequent words for “Negative” class.
Make 02 00011 g002
Figure 3. Top most frequent words for “Non-Negative” class.
Make 02 00011 g003
Figure 4. Averages (inner plot) and Cumulative Distribution Function of Tweet lengths for both classes.
Make 02 00011 g004
Figure 5. Cumulative Distribution Function of word lengths and averages (inner plot) for both classes.
Make 02 00011 g005
Figure 6. Cumulative Distribution Function representing text entropy for both classes.
Make 02 00011 g006
Table 1. Comparison of our work with related literature studies.
PaperTwitter Data SourceDiverse Political EventsEnglish Language Varieties
Evolvi [13]
Florio et al. [53]
Rzepnikowska [12]
Siegel et al. [8]
Waseem et al. [44]
Our work
Table 2. Top 10 hashtags, user mentions and cities/towns for “Negative” and “Non-Negative“ classes.
Top 10 HashtagsTop 10 User MentionsTop 10 Cities/Towns
NegativeNon-NegativeNegativeNon-NegativeNegativeNon-Negative
#illegalaliens#trump@realdonaldtrump@realdonaldtrumplondonbirmingham
#deportthemall#immigration@lbc@mrbrendancoxglasgowedinburgh
#banislam#liberals@matthewstadlen@berniesandersmanchesterglasgow
#buildthewall#senate@borisjohnson@davidlammyseattleseattle
#stoptheinvasion#multiculturalism@patel4witham@youtubebirminghamvancouver
#americafirst#canada@ilhanmn@patel4withamleedslondon
#maga#cdnpoli@aoc@borisjohnsoncalgarybristol
#democrats#refugees@potus@sbasdeo1los angelesleeds
#deport#democrats@youtube@gopnewcastlebelfast
#bansharia#homealone2@fairimmigration@lbcbristolcambridge
Table 3. Comparison of classification models.
ModelsRec.Prec.F-Score
NB word n-grams798582
SVM word n-grams868184
LR word n-grams878083
NB char n-grams867882
SVM char n-grams868083
LR char n-grams877983

