Article

Synergistic Integration of Graphene Nanoparticles in Colloidal TiO2 for Grätzel Cells (DSSC)

1
Dipartimento di Ingegneria per l’Ambiente, Università della Calabria, I-87036 Arcavacata di Rende, CS, Italy
2
Dipartimento di Matematica e Informatica, Università della Calabria, I-87036 Arcavacata di Rende, CS, Italy
3
Dipartimento di Ingegneria Meccanica, Energetica e Gestionale, Università della Calabria, I-87036 Arcavacata di Rende, CS, Italy
*
Author to whom correspondence should be addressed.
J. Compos. Sci. 2025, 9(11), 612; https://doi.org/10.3390/jcs9110612
Submission received: 29 September 2025 / Revised: 23 October 2025 / Accepted: 3 November 2025 / Published: 6 November 2025
(This article belongs to the Section Composites Applications)

Abstract

This study presents the development and characterization of Grätzel cells (DSSCs), part of third-generation photovoltaic technologies, fabricated with and without the addition of graphene nanoparticles. A TiO2 paste was prepared by combining colloidal solutions of Polyethylene Glycol (PEG) and Titanium Tetrachloride (TiCl4), and then deposited on FTO (Fluorine-doped Tin Oxide) glass substrates via spin coating and sensitized with N719 dye. Each cell was assembled using two FTO electrodes, a photoanode (TiO2/N719) and a platinum-coated counter electrode, separated by a liquid iodide/triiodide-based electrolyte to complete the redox cycle. The core objective was to optimize the graphene nanoparticle concentration within the TiO2 matrix to improve photovoltaic performance. Samples with 0.1%, 0.2%, and 0.5% graphene were tested under simulated illumination (AM 1.5G), evaluating photocurrent, efficiency, and Fill Factor (FF). Optical analysis included desorption of N719 using NaOH to quantify intrinsic light absorption. Graphene’s high transparency and charge transport properties positively affected light harvesting. Results showed that graphene dosage is critical; 0.1% yielded the best efficiency, while excess concentrations diminished electronic and optical behavior. Controlled integration of graphene nanoparticles enhances DSSC performance and supports the development of more efficient and sustainable solar cells.

1. Introduction

Over the next fifty years, global energy demand is expected to grow exponentially, potentially doubling the current values. Today, most energy is generated from non-renewable sources such as petroleum, natural gas, coal, and uranium [1], whose utilization results in solid, liquid, and gaseous emissions with significant environmental impacts [2]. In this scenario, the shift toward sustainable sources becomes essential, and photovoltaics represents one of the most promising energy technologies due to their versatile applications and continuous development.
Photovoltaic technologies are categorized into three generations. First-generation solar cells use mono- and polycrystalline silicon, widely adopted and highly efficient, yet produced through complex processes involving toxic compounds like silicon chloride [3], high water consumption, and hazardous waste generation [4], posing environmental and health risks [5]. Second-generation cells are based on thin-film semiconductors deposited on low-cost substrates, offering flexibility and lightness, although with lower energy performance than silicon. The third generation—still under optimization—includes multijunction, concentrator, OPV (Organic Photovoltaics), quantum dots [6], perovskite cells [7], and Dye-Sensitized Solar Cells (DSSCs), also known as Grätzel cells, inspired by photosynthetic mechanisms [8].
DSSCs, developed by Prof. Michael Grätzel at EPFL in Lausanne [9,10], offer a compelling alternative to traditional technologies. Their operating principle relies on a photosensitive dye (e.g., N719) adsorbed onto a nanoporous titanium dioxide (TiO2) matrix. Upon light absorption, the dye injects electrons into the TiO2; the electrons then travel toward the electrode, while the oxidized dye is regenerated by a redox electrolyte containing iodine (Figure 1).
This chemical cycle echoes chlorophyll-based photosynthesis. DSSCs offer several technical and environmental advantages: low cost, ease of fabrication, stable efficiency under diffuse light, transparency, and mechanical flexibility, making them suitable for curved surfaces and fabrics with minimal ecological impact. Advanced DSSC configurations have reached efficiencies above 11%, comparable to silicon-based cells but with more sustainable manufacturing processes. The remaining challenges include stability issues, primarily due to electrolyte volatility and gradual dye degradation [11].
To enhance performance and address structural limitations, research has introduced innovative 2D materials such as graphene and graphene oxide (GO) [12]. Graphene, a single layer of carbon atoms arranged in a hexagonal lattice, exhibits extraordinary features: high electrical conductivity, exceptional optical transparency, mechanical flexibility, chemical stability, compatibility with organic semiconductors and polymers, and scalability, with decreasing costs enabled by Chemical Vapor Deposition (CVD). CVD-based synthesis and subsequent nitrogen doping tailor its electronic properties, making graphene highly effective as a transparent electrode in DSSCs.
Graphene oxide (GO), a functionalized derivative of graphene, presents a layered structure with oxygen-containing groups (carboxyl, epoxy, hydroxyl), rendering it chemically versatile. It has been employed to improve the interface between TiO2 and the electrode, enhance dye adhesion, act as a diffusion barrier for metals, and increase stability. Under controlled temperature and pressure, GO’s reactivity can be tuned, allowing for composite synthesis and surface functionalization.
Habibi Jetani and Rahmani synthesized TiO2/GO nanocomposites and demonstrated that even extremely low concentrations of GO (0.001 wt%) slightly enhance the current density (from 10.18 to 10.79 mA·cm−2). However, the introduction of oxygen-containing functional groups (–OH, –COOH, –C=O) acts as scattering centers, increasing the series resistance and causing conductivity losses of up to 15–20%. In contrast, the non-oxidized graphene employed in our study retains a continuous sp2 lattice, free of oxidized sites, thereby avoiding such charge dispersion and ensuring an increase in Jsc of approximately 0.7 mA·cm−2 and a photovoltaic efficiency improvement of 12–15% compared to TiO2/GO composites [13].
However, integrating graphene and GO into DSSCs poses challenges: industrial graphene production via CVD remains costly, GO functionalization must be precisely managed to prevent conductivity loss, and compatibility with printing or deposition techniques requires optimization. Despite these hurdles, the enhancement potential remains high, with research advancing toward hybrid multilayer films (GO/graphene/fullerene), self-healing GO-modified interfaces, flexible transparent electrodes for wearable technologies, and architectural integration.
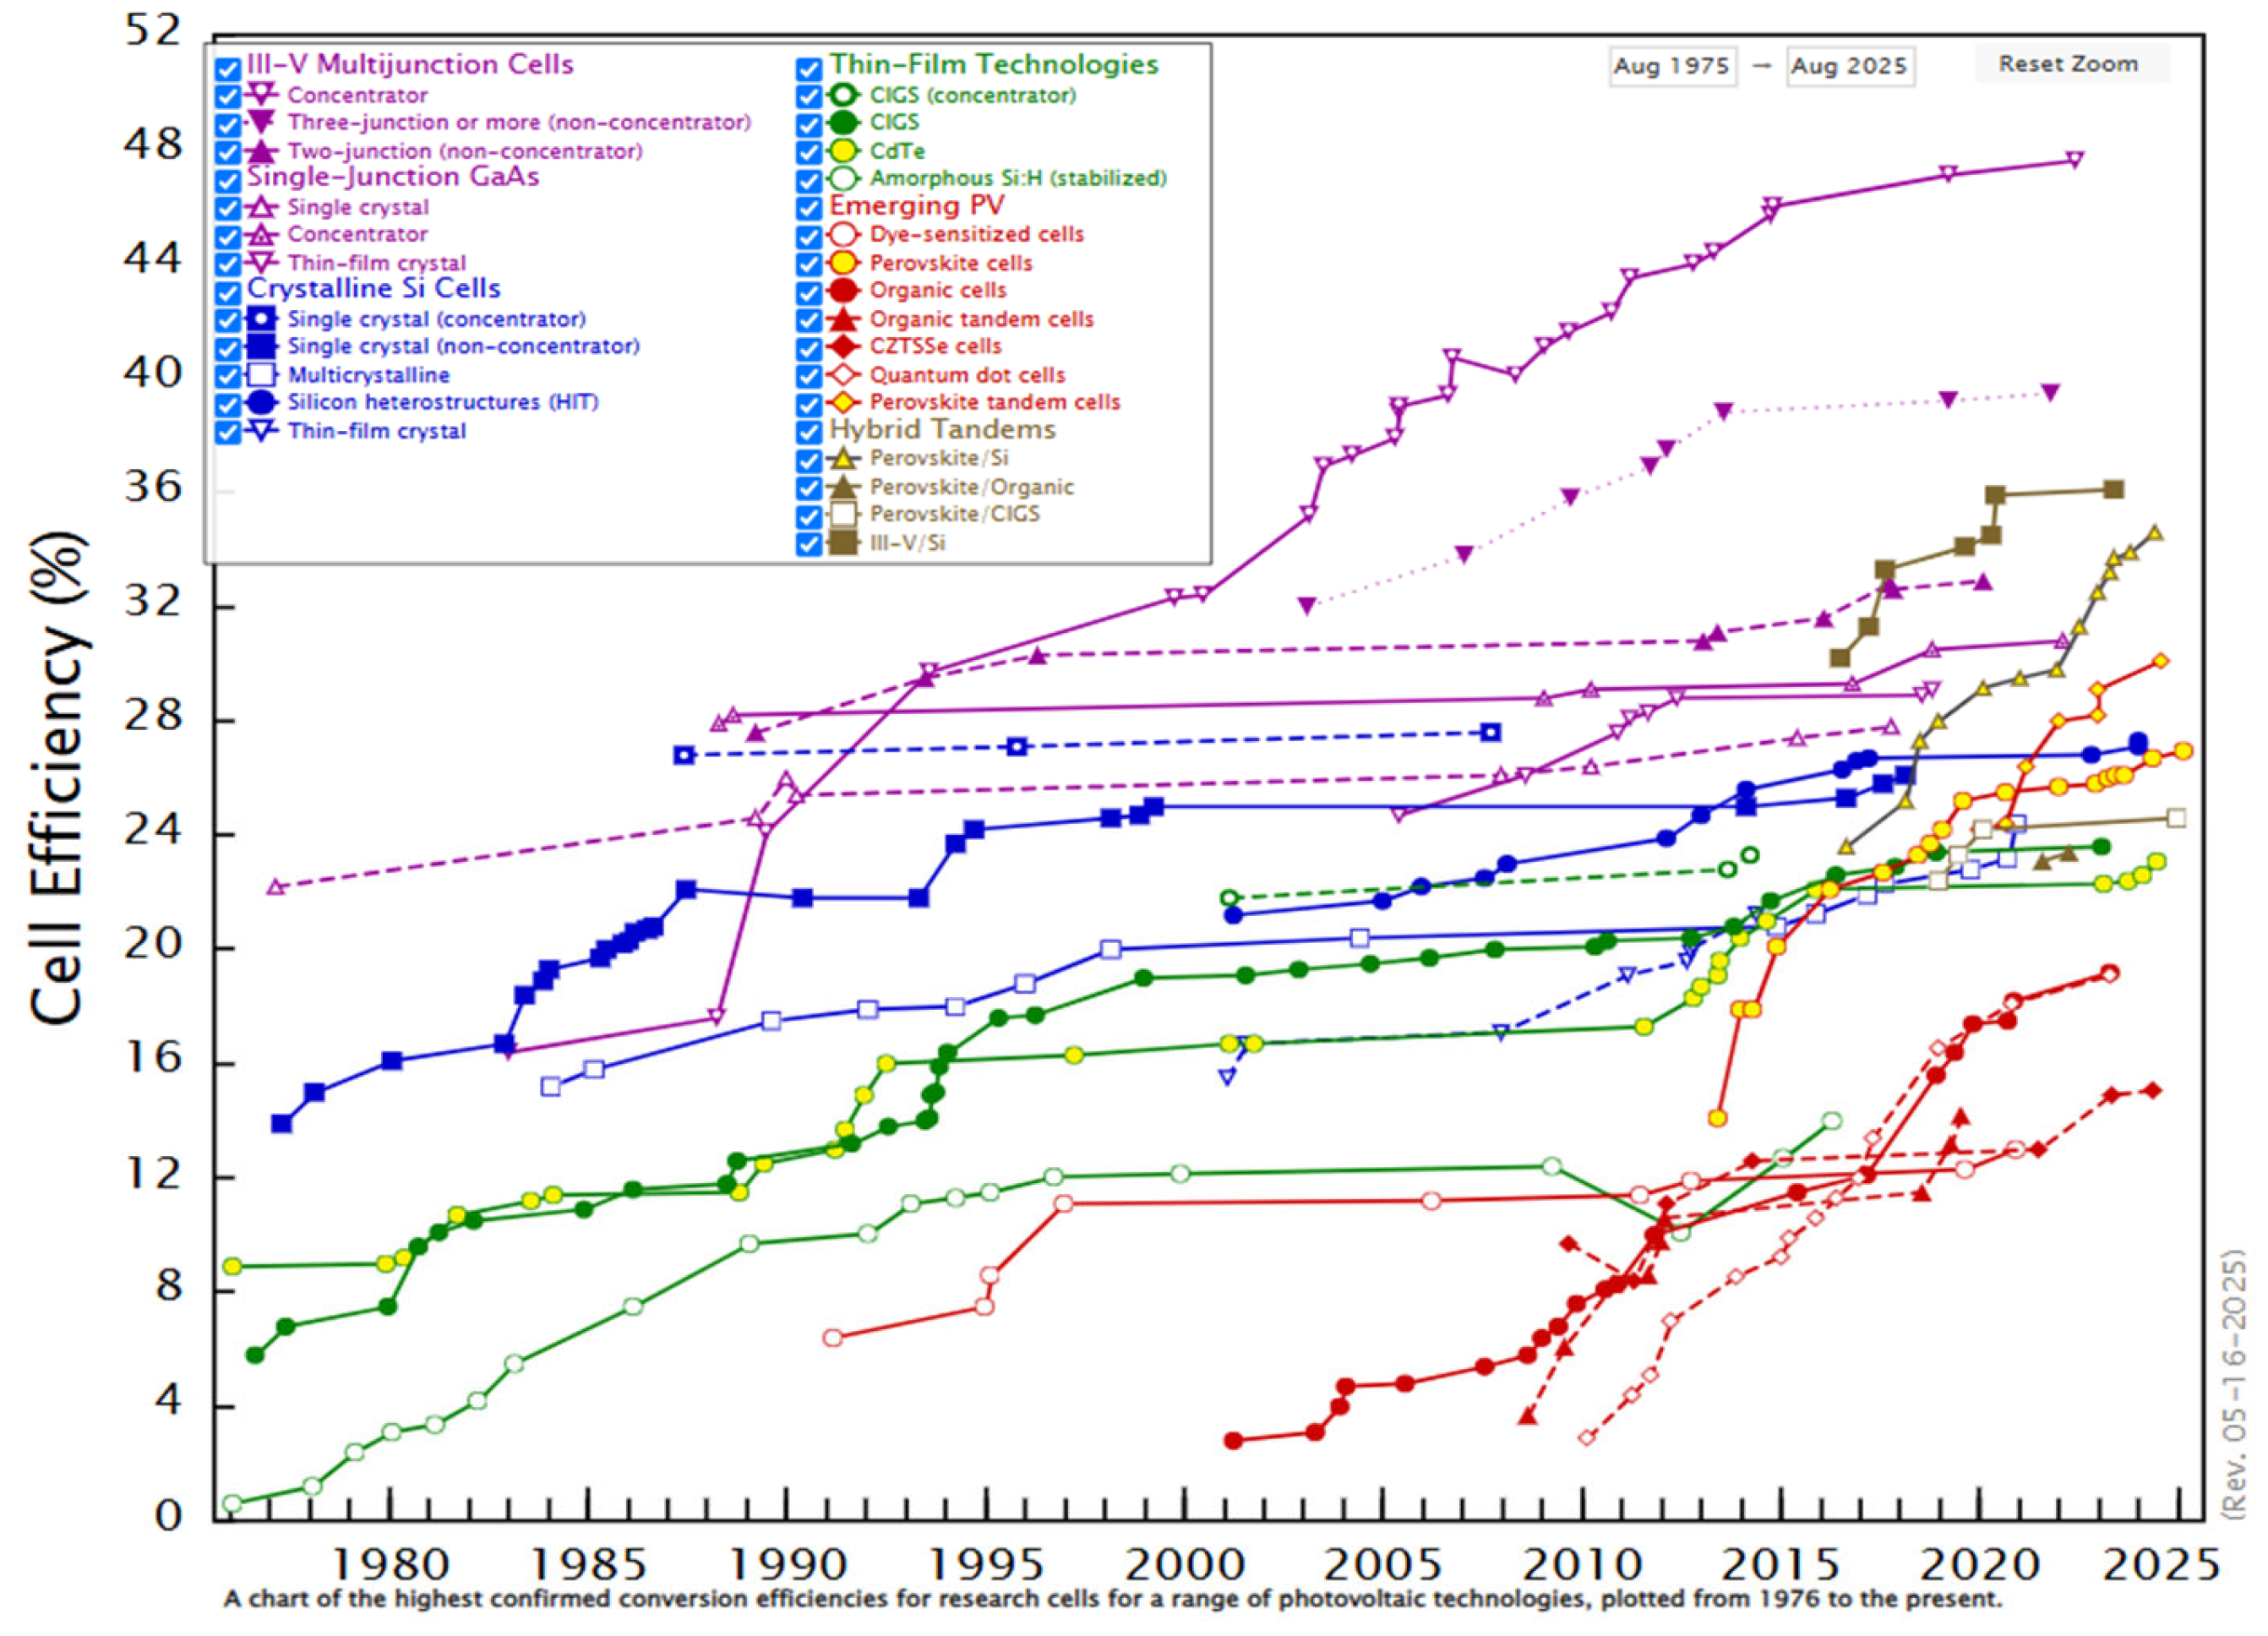
According to Verified Market Reports, the market for graphene-enhanced DSSCs—estimated at $0.1 billion in 2022—may reach $0.5 billion by 2030, with a projected annual growth rate of 21% between 2024 and 2030 [14]. This expansion is supported by incentive policies such as the Solar Investment Tax Credit (ITC), growing demand for clean energy solutions, and increasing awareness around eco-sustainable materials. The technological evolution of photovoltaics, documented over decades of increasing efficiencies, helps to contextualize the role of graphene-based DSSCs in the broader energy innovation landscape. This perspective highlights their relevance in the renewable energy transition and their potential for sustainable, high-performance applications [15]. To better understand historical developments in photovoltaic efficiency and the positioning of various technologies, a comparison chart showing performance trends from 1975 to 2025 is provided (Figure 2) [16].
Although DSSCs currently exhibit lower efficiencies compared to traditional silicon cells, numerous studies have demonstrated that the integration of advanced materials such as graphene can significantly improve the efficiency η [17,18]. Future directions focus on the evolution of optoelectronic components, aiming to close the performance gap with silicon-based devices, which today exceed 26% efficiency [19,20,21].
In this context, the present study focuses on the design and characterization of DSSCs based on TiO2, selected for its versatility—further confirmed by experimental analysis on limestone surfaces, where WO3@TiO2 nanoparticles demonstrated notable photocatalytic activity [22]. TiO2’s ability to facilitate light-induced reactions was harnessed using N719 dye and optimized via the addition of graphene nanoparticles at varying concentrations (0.1%, 0.2%, 0.5%).
This work employs non-oxidized graphene in nanoparticle form, embedded in the TiO2 colloidal matrix to assess its influence on the photovoltaic behavior of DSSC devices. The choice of graphene as a functional material in DSSCs is supported by solid experimental and theoretical evidence. Zhao and Chen [23] demonstrated that graphene oxide, obtained via electrochemical synthesis, can be effectively employed as a counter-electrode due to its high conductivity and lamellar structure, which facilitates charge transfer. Alavi and Ghanbari [24] highlighted how the chemical reduction of graphene oxide (GO → rGO) significantly improves cell efficiency by reducing electron recombination and increasing carrier mobility. Ramadhan and Aminoto [25] confirmed that the integration of rGO into the porous TiO2 matrix enables the formation of a highly conductive two-dimensional network, which enhances electron transport and improves charge collection. Taken together, these studies show that the planar structure of graphene, free from hydroxyl and epoxy groups, promotes π-electron delocalization, making it a strategic component for optimizing photovoltaic performance in DSSCs.
Graphene’s uniform optical transparency allows efficient transmission of light to the photoactive layer [26], improving light harvesting without introducing spectral selectivity. Furthermore, the absence of oxygenated groups minimizes electrochemical interference with the electrolyte and dye, promoting greater operational and chemical stability.
In the context of the degradation of the I/I3 electrolyte, Liu and Li demonstrated that the consumption of triiodide and the evaporation of the solvent induce a deterioration in redox potential and a gradual decline in the performance of DSSCs [27]. Similarly, Grätzel highlighted how the formation of aggressive radicals accelerates such electrolyte degradation phenomena. The introduction of unoxidized graphene as a passivating layer creates a physical barrier that limits the diffusion of radicals and reduces solvent evaporation, preserving the concentration of I/I3 ions and delaying electrolyte degradation [28]. Regarding the N719 dye was reported that UV irradiation and humidity promote bleaching and desorption of the dye, with losses in Jsc within a few weeks [29]. Ito and colleagues also showed that the oxidative species produced by the electrolyte accelerate photochemical degradation of the dye, further reducing the cell’s performance. Coating the photoanode with non-oxidized graphene reduces the direct exposure of the dye to the aggressive environment, maintaining over 80% of the short-circuit current density after 100 h of aging [30]. This study adopts a systematic approach to evaluating different concentrations of graphene nanoparticles in TiO2 paste, with the goal of identifying an optimal balance between conductivity, chemical–structural compatibility, and photovoltaic potential.

2. Materials and Methods

To construct the Grätzel solar cell, specific materials were selected to ensure the device’s efficiency, stability, and functionality. Each component plays a key role within the photoelectrochemical system, from conductive substrates to light-sensitive materials, as well as elements that facilitate electron transfer and complete the electron recombination cycle. The careful choice of these materials allowed the assembly of a cell capable of effectively converting solar energy into electrical energy. Key performance metrics, such as the power conversion efficiency (η), were evaluated using multiple replicates (n ≥ 3), and results are reported with corresponding error margins (e.g., ±SD) to ensure statistical reliability. Below are the materials used:
(a)
FTO Glass Slides (FL2446, Stanford Advanced Materials, Santa Ana, CA, USA): Transparent glass coated with a conductive layer of fluorine-doped tin oxide (FTO) was used. This serves as the base substrate—transparent and conductive—used for the anode, while the counter electrode consists of platinum also deposited on FTO glass. The slides feature one conductive surface and an insulating opposite side, making them suitable for directional electric flow. Dimensions: 2.5 cm × 2.5 cm.
(b)
N719 Dye (Alfa Chemical, CAS No. 207347-46-4, Jiaozuo City, China): A ruthenium complex was employed due to its broad visible light absorption spectrum, high electron injection efficiency, and good stability. N719 is one of the most used sensitizers in dye-sensitized solar cells (DSSCs), thanks to its excellent photochemical properties and operational stability. Chemical formula: Di-tetrabutylammonium cis-bis(isothiocyanato)bis(2,2′-bipyridyl-4,4′-dicarboxylate) ruthenium (II). This dye plays a fundamental role in sensitizing TiO2, extending its spectral response from the UV to the visible region—crucial for efficient current production in the cell [31,32,33].
(c)
Electrolyte Solution (I/I3): Prepared in the lab using lithium iodide (LiI) and molecular iodine (I2) from Alfa Chemical (Zhengzhou, China), with acetonitrile (CH3CN) as the solvent, purchased from Alfasigma (Bologna, Italy). The preparation involves dissolving 0.5 mol/L of LiI in acetonitrile under continuous magnetic stirring. Once fully dissolved, 0.05 mol/L of I2 is gradually added and mixed until completely dissolved. The formation of the triiodide complex (I3) is indicated by a reddish color shift. The final solution is stored in a sealed dark glass container to prevent photochemical degradation. Electrolyte insertion is done with a fine-needle pipette by introducing 2–3 drops into the open edge between the glass slides. Capillary action distributes the liquid to the center. This iodide/triiodide solution was chosen for its low viscosity, high ionic mobility, and excellent dye regeneration capability [34].
(d)
Titanium Dioxide (TiO2), 99% purity (AEROXIDE® P25, Essen, Germany): The anatase crystalline form was selected for its excellent electronic and structural properties. This material acts as a photoactive semiconductor, able to transport photoexcited electrons generated by the light-sensitive dye. Its nanoporous morphology provides a high specific surface area, promoting efficient dye adsorption (e.g., N719) and enhancing photovoltaic performance. Optoelectronically, anatase has a direct band gap of approximately 3.2 eV, corresponding to an absorption peak around 388 nm in the ultraviolet region, which is crucial for capturing sunlight and initiating the photoinduced process inside the DSSC [35].
(e)
Graphene Nanoplatelets (Gh-nanoplatelets, PlasmaChem GmbH, 99.0% purity, Berlin, Germany) (Figure 3): Used to improve the cell’s electronic properties. Integrating graphene into the TiO2 colloidal paste in DSSCs is an advanced strategy for enhancing photoanode performance (Table 1).
(f)
PEG (Polyethylene glycol 20000, Merck Schuchardt (Hohenbrunn, Germany): A dispersing and binding agent that contributes to the formation of the paste by improving the viscosity and colloidal stability of the TiO2 suspension. It promotes a uniform spread on the FTO glass slide and acts as a rheological modifier to regulate the fluidity of the colloidal paste.
(g)
TiCl4 (Titanium tetrachloride, CAS: 7550-45-0, Alfa Chemical, Zhengzhou, China): Used as a precursor to promote the formation of a compact TiO2 layer through hydrolysis:
TiCl4 + 2H2O → TiO2 + 4HCl
This reaction enhances the connectivity between TiO2 nanoparticles, reducing electron recombination.
(h)
Triton X-100 (Sigma-Aldrich, Darmstadt, Germany): A non-ionic surfactant from the alkylphenol ethoxylate family. When introduced into the titanium colloidal paste, it functions as a thickening and stabilizing agent.
(i)
Acetylacetone (Acac) (Sigma-Aldrich, Darmstadt, Germany): A thickener that plays a complexing role, stabilizing TiO2 nanoparticles and preventing their aggregation. It regulates the pH and slows the subsequent hydrolysis of TiCl4, improving the particle size distribution of the colloidal paste.
These components work synergistically to obtain a stable, homogeneous, and easily spreadable TiO2/Gh colloidal paste with optimal properties for sintering and dye absorption. The quality of the paste directly impacts the efficiency of the DSSC.
The following instruments were used for the fabrication and characterization of the DSSC:
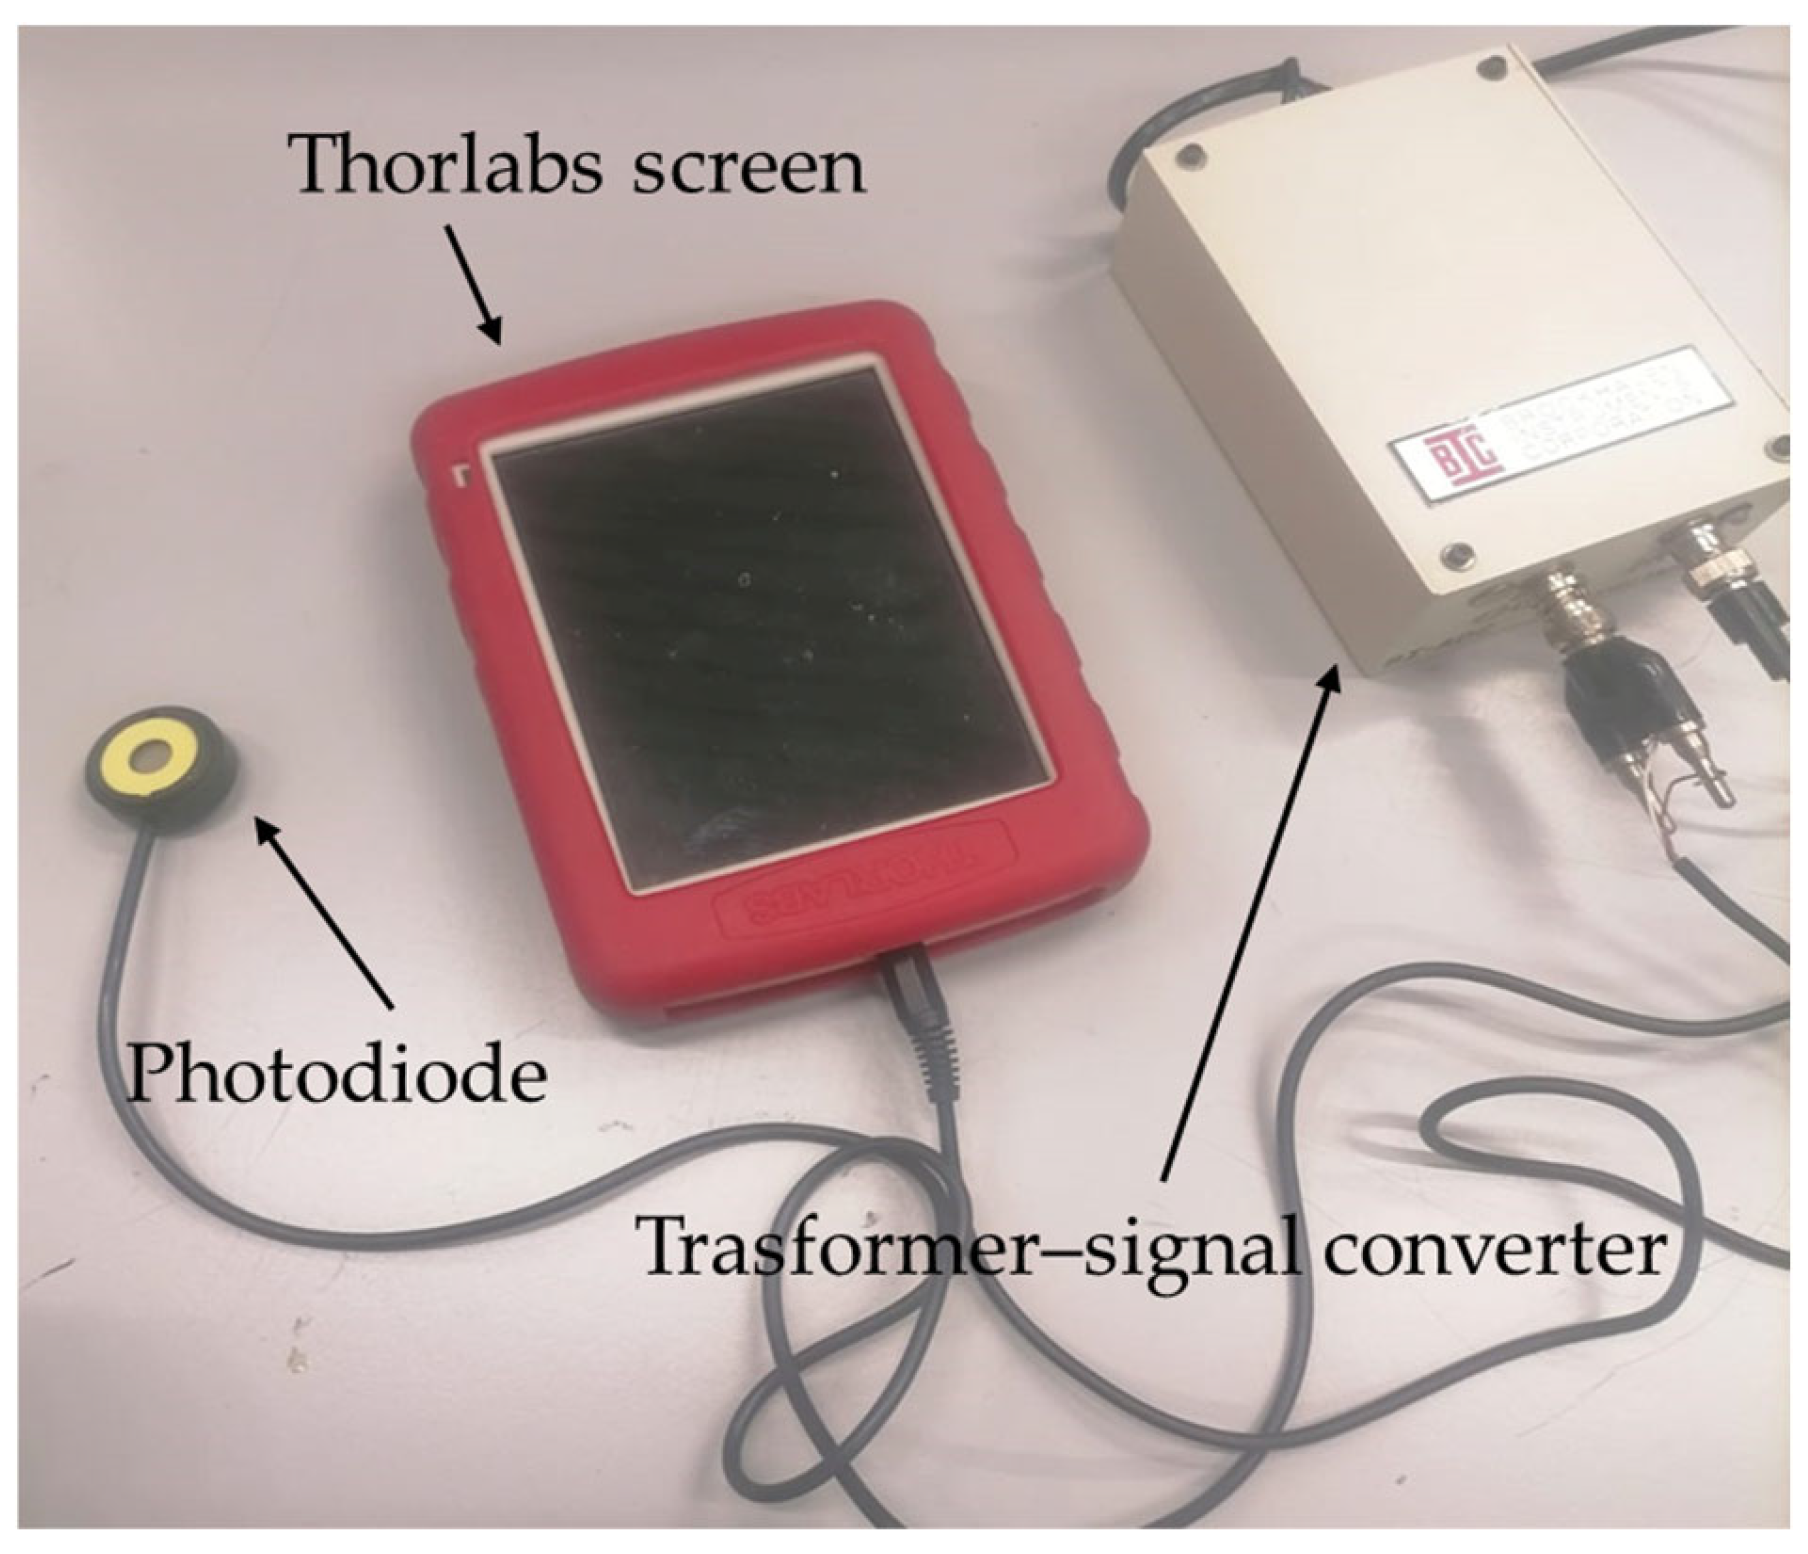
  • Potentiometer (Thorlabs Inc., Newton, NJ, USA): Employed to measure the current generated by incident light. The device integrates a high-sensitivity photodiode and a transimpedance amplifier, enabling conversion of the optical current into a proportional voltage. It was used to assess the photovoltaic response of the cell in relation to light intensity and wavelength (Figure 4).
  • Spectrophotometer (UV 3100 PC, VWR, West Chester, PA, USA): This instrument was used to analyze the absorption spectrum of the dye and the sensitized TiO2 film. It allowed verification of the actual coverage of the visible spectrum by the N719 dye and helped monitor any changes occurring during the experimental phase.
  • Digital Multimeter (CEN-TECH, Harbor Freight Tools Group, Calabasas, CA, USA): This device was used to measure direct current (DC) voltage and current generated by the cell. Additionally, it enabled identification of the conductive surface of the FTO glass slides by detecting a specific resistance in the range of tens of ohms. Finally, the conductivity of the FTO substrates was experimentally verified using a tester applied in configurations A and B to confirm the suitability of the conductive substrates (Figure 5).
  • Spin Coater (WS-650 MZ-23NPP, Laurell Technologies, PA 19446, USA): A fundamental device for the deposition of thin, uniform films on planar substrates such as FTO glass. The graphene-containing film was prepared by spin coating, a widely used technique for DSSC fabrication. Although no direct thickness measurements were performed, the parameters adopted and the nature of the solution suggest that the resulting film likely falls within the optimal range (400–700 nm) reported in the literature, ensuring appropriate transparency, adhesion, and conductivity for photovoltaic application [37]. The spin coating process is based on the centrifugal distribution of a precursor solution dispensed onto a rotating substrate, allowing precise control over the thickness and uniformity of the active layer. The use of nitrogen flow under controlled conditions reduces environmental contamination, promotes solvent evaporation, and improves the quality of the coating. This technique is particularly suitable for depositing semiconductor layers, transparent electrodes, or interfacial layers in thin-film photovoltaic cells, such as perovskite or organic heterojunction cells. Its reproducibility, metrological precision, and compatibility with a wide range of materials make it an essential tool for research and optimization of photovoltaic performance [38,39] (Figure 6).
The process consists of four main stages (Figure 7):
(A)
Initial Deposition: The precursor solution is distributed on the substrate, either stationary or rotating. The mode of deposition affects the final film thickness.
(B)
Acceleration: The support reaches the set rotation speed. Part of the fluid is expelled from the surface by centrifugal force until the film becomes thin enough to resist rotational force due to its viscosity.
(C)
Steady Rotation: The substrate rotates at a constant speed. The film thinning is regulated by the viscosity of the solution.
(D)
Evaporation: Rotation continues while the solvent evaporates; the film reaches its final thickness and stabilizes.
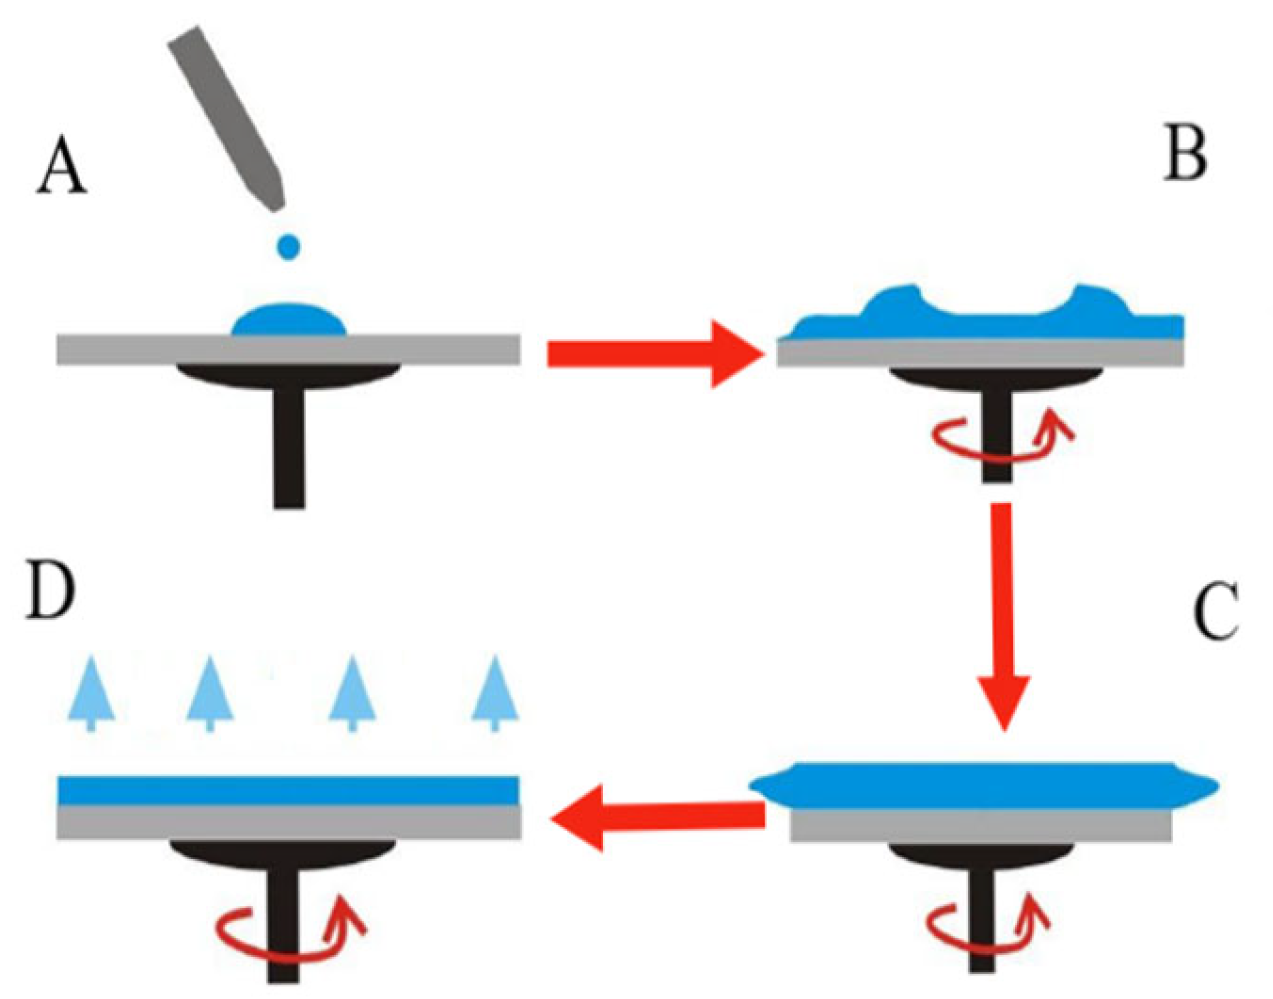
Figure 7. Thin-film creation phases using the Spin Coating technique characterized by the 4 phases specified previously.
Jcs 09 00612 g007
The unit of measurement is rpm/s (revolutions per minute per second), which describes the rate at which the rotation changes over time—specifically, the acceleration or deceleration applied to the disk.
  • Sonicator (VWR USC 100 TH (Avantor) ultrasonic cleaner, Radnor, PA, USA): This instrument operates through the emission of high-frequency ultrasound, used to promote the dispersion of colloidal systems and the homogenization of liquid solutions. By exploiting the phenomenon of acoustic cavitation, it generates intense pressure waves that break up particle aggregates and enhance molecular mixing. Operating frequencies may range from 20 kHz to 1 MHz depending on the application and the nature of the sample being processed.
  • Solar Lamp (LS0106, Quantum Design GmbH, Pfungstadt, Germany): A high-precision instrument designed for photovoltaic testing in laboratory conditions. This xenon solar lamp has a power output of 150 W with a typical irradiance of 90 mW/cm2 ± 20%, featuring an integrated AM 1.5G filter to simulate standard solar radiation. It is tailored for photovoltaic evaluations and scientific applications.

2.1. Preparation of Titanium Paste (TiO2)

The preparation of titanium dioxide paste was the first step in fabricating the photoanode. Initially, 3.1 g of TiO2 were weighed and dispersed in 6 mL of distilled water, forming the first mixture, which was collected in a beaker. In parallel, a second mixture was prepared by dissolving 1.2 g of PEG 2000 in 6 mL of distilled water. This solution underwent sonication for 15 min to achieve better homogenization. The two mixtures were then combined in a single beaker, to which 50 µL of Triton X-100 and 240 µL of Acetylacetone were added as thickening and binding agents. The entire solution was sonicated again for another 15 min to ensure uniform distribution of the components. The resulting mixture was placed on a hot plate at 60 °C for 30–40 min to increase viscosity and promote partial evaporation of volatile solvents, resulting in a dense and compact TiO2 paste. Next, the paste was uniformly deposited onto an FTO glass slide using a Spin Coater system, forming an even film. The coated substrates were then sintered in an oven (Gefran 600 ZE, Gefran S.p.A., Provaglio d’Iseo, BS, Italy) at 500 °C for 30 min to strengthen the nanocrystalline structure of the TiO2. Cooling occurred by thermal inertia within the oven. To further improve film efficiency, the sintered slides were immersed in a solution of TiCl4 (titanium tetrachloride), prepared by dissolving 40 mmol in 200 mL of distilled water. Immersion was carried out at 60 °C for 30 min on a hot plate. After treatment, the slides were rinsed with ethanol, dried using a nitrogen flow, and baked again under the same conditions (500 °C for 30 min). The prepared photoanode glass slide was immersed in a beaker containing the N719 dye solution. To prevent light interference during the adsorption phase, the container was completely wrapped in aluminum foil and left undisturbed for 24 h, allowing effective interaction between the dye and the TiO2 film. This duration was selected based on findings from scientific literature and preliminary investigations, which confirmed that extending the soaking time—e.g., to 48 h—does not significantly enhance the photovoltaic efficiency of DSSCs. Therefore, 24 h was identified as the optimal time to ensure efficient dye absorption while minimizing material waste and supporting a more sustainable production process [40]. Finally, the slide was removed, rinsed with ethanol, dried with nitrogen, and coupled with the counter electrode (cathode) for final cell assembly.

2.2. Preparation of Titanium Paste with Graphene (Gh)

To fabricate the Grätzel cell modified with graphene, 0.0065 g of graphene were weighed using a digital scale and dispersed in 18 mL of distilled water in a beaker. The suspension underwent sonication for 4 h to achieve uniform nanoparticle dispersion. Once sonication was completed, the graphene-containing solution was added to a second beaker containing 3.10 g of TiO2. From this point on, the same protocol was followed as described in the previous section for the pure TiO2 paste. The final suspension enabled the formation of an active film composed of TiO2 with a graphene mass percentage of 0.2%. This percentage was calculated according to the formula:
% ( G h ) = m G h m t o t · 100
where mGh = mass of graphene and mtot = total mass of the solution
To obtain cells with different graphene concentrations (0.1% and 0.5%), the amount of graphene used was kept constant, while the quantities of TiO2, PEG, and additives were appropriately adjusted according to calculated proportions. This ensured balance in the composition of the paste (Table 2).
Graphene was dispersed in a solution containing polyethylene glycol (PEG) and Xitron as dispersing agents in order to improve colloidal stability and prevent particle agglomeration. The dispersion was subjected to ultrasonic treatment for 30 min (power: 100 W; frequency: 40 kHz), obtaining a homogeneous suspension. Subsequently, TiCl4 was added to promote the formation of a TiO2 layer by controlled hydrolysis, improving the interaction between graphene and the FTO substrate. The resulting graphene/TiO2 composite was applied by spin coating on FTO substrates, with parameters optimized to ensure uniformity and adhesion. This approach resulted in an active film with good photoelectrochemical properties and stability. The selected amounts of graphene are the result of preliminary tests aimed at optimizing the distribution of the material within the TiO2 layer. These tests allowed us to identify concentrations that ensure good homogeneity of the composite, minimizing, as much as possible, phenomena of aggregation or uneven dispersion, and ensuring experimental conditions compatible with the DSSC structure.
Figure 8a,b show the assembled cell containing the TiO2/graphene-based film sensitized with N719 dye, ready for photovoltaic efficiency measurement.

2.3. Experimental Application and Cell Structure

The Grätzel cells were fabricated using the spin coating technique, which was applied to uniformly deposit TiO2-based suspensions—either pure or modified with graphene (Gh)—onto conductive FTO glass substrates. Each deposited film was consolidated through a baking process on a hot plate at 60 °C for 30 min, aiming to promote the physico-chemical stabilization of the material. The parameters used (solution volume, acceleration, rotation speed, and baking conditions) are reported in Table 3.
The cell was assembled using two FTO electrodes: the photoanode, consisting of a TiO2 layer subsequently sensitized with N719 dye, and the counter electrode, coated with a catalytic platinum layer. The two electrodes were separated by a liquid iodide/triiodide-based electrolyte, which enabled electron transfer and dye regeneration. The following Table 4 provides a description of the composition of the samples.
Irradiation of the cell generated a measurable electric current in the external circuit, thanks to electron injection from the dye into the TiO2 and the subsequent completion of the redox recombination cycle. Finally, the two glass slides were assembled and held together by two clips (Figure 8). Two separate devices were prepared, and three independent measurements were performed on each. Upon completion of all measurements, including the data collected from both devices, an overall average was calculated to ensure a more reliable and consistent representation of photovoltaic performance.

2.4. Light Absorption in the Fabricated Samples

Light absorption is a crucial parameter for the operation of photovoltaic cells, as it is responsible for generating electron-hole pairs in semiconductor materials. This process depends on the material’s band gap width, the wavelength of the incident radiation, and the sample’s intrinsic optical properties such as thickness, surface roughness, and refractive index. Transmittance (T = I0/IT) quantifies the fraction of light passing through the material, while absorbance (A = ελ · c · l), described by the Lambert–Beer law, provides a measure of the absorbed light as a function of the concentration of the active material and the optical path length [41]. Experimentally, the photoanode composed of FTO/TiO2 sensitized with N719 was treated with an alkaline NaOH solution (0.8 g dissolved in 20 mL of deionized water and 20 mL of ethanol). The use of NaOH serves two purposes: first, the strongly basic environment breaks the bonds between the N719 dye and the TiO2 surface, facilitating selective chemical desorption; second, the salt’s exothermic dissolution generates localized heat that accelerates dye evaporation. This allowed for the preparation of a dye-free sample, enabling reliable measurement of residual light absorption.
The same treatment was applied to samples containing graphene. Known for its high optical transparency (absorbs approximately 2.3% of visible light per single layer, uniformly across the spectrum) [42], graphene does not introduce spectral selectivity and thus allows homogeneous light transmission to the photoactive layer. Combined with its exceptional electron transport properties, graphene proves to be highly promising as a transparent, conductive electrode in advanced optoelectronic applications. Experimental results comparing pure TiO2 samples and those containing graphene are reported in the following section.

2.5. Investigation of Theoretical Characteristic Parameters

To characterize the photovoltaic performance of the DSSCs fabricated in the laboratory, a benchtop solar simulator with controlled irradiance of approximately 70 mW/cm2 was used, selected to replicate conditions comparable to natural solar radiation. The cell was positioned perpendicularly to the light beam to maximize optical absorption and ensure uniform illumination across the active area. After turning on the light source, a thermal and photometric stabilization period of 2–5 min was observed. Then, the incident irradiance (G, in W/cm2) was measured using a pyranometer to ensure consistency with standardized conditions. Next, the device was connected to a variable load to perform electrical scanning under illumination. Voltage (V) and current (I) values were recorded as a function of the load, generating the characteristic I–V curve (Figure 9).
The I–V curve (Figure 9) is more ‘square,’ which means that the cell is able to convert a greater fraction of the incident solar energy into useful electrical energy. In other words, a more ‘square’ curve is a sign of lower internal losses and better-quality materials and interfaces.”. From this curve, the key electrical parameters were extracted and are summarized in Table 5.
The quality of the cell is described through the FF:
F F =   P m a x V o c   I s c =   V m   I m V o c   I s c
where
P m a x : maximum power output of the cell; V o c : open-circuit voltage; I s c : short-circuit current; and V m , I m : voltage and current at the maximum power point.
Finally, the efficiency η of the cell is calculated as:
η   % =   P m a x P i n · 100 =   V o c   I s c F F P i n · 100 =   V m   ·   I m P i n   · 100
where Pin = G·A is the input power and is considered a constant value, as it results from the contribution of the lamp’s radiation intensity (G) multiplied by the area (A) in cm2 of the cell being used. The parameters Isc, Voc, FF, and η provide a complete description of the cell’s performance. As illustrated in Figure 9, two fundamental graphical representations are shown for the electrical characterization of DSSCs. In panel (A), the variation in the current at the maximum power point (Im) is shown as a function of the corresponding voltage at maximum power (Vm). This graph allows identification of the optimal operating point of the cell, that is, the point at which the product Im × Vm—representing the maximum power output—reaches its peak value. The position and shape of this point offer practical insights into the quality of the active material and the internal resistance of the device. In panel (B), the current–voltage characteristic curve (I–V) is shown, highlighting two key parameters: the short-circuit current (Isc), which represents the maximum current deliverable by the cell when the voltage is zero, and the open-circuit voltage (Voc), which is the maximum measurable voltage when no load is applied. The graph reveals the shape of the characteristic curve, whose squareness is directly related to the value FF. A more “square” curve indicates higher device efficiency. These two representations offer an immediate overview of the cell’s performance under simulated artificial illumination and serve as the starting point for accurate estimation of overall efficiency. I–V measurements were carried out under stable conditions with appropriate waiting times between scans, to minimize possible hysteresis effects, which are generally negligible in DSSC devices [43].

3. Results and Discussion

3.1. Characterization of Reagents and the Light Source

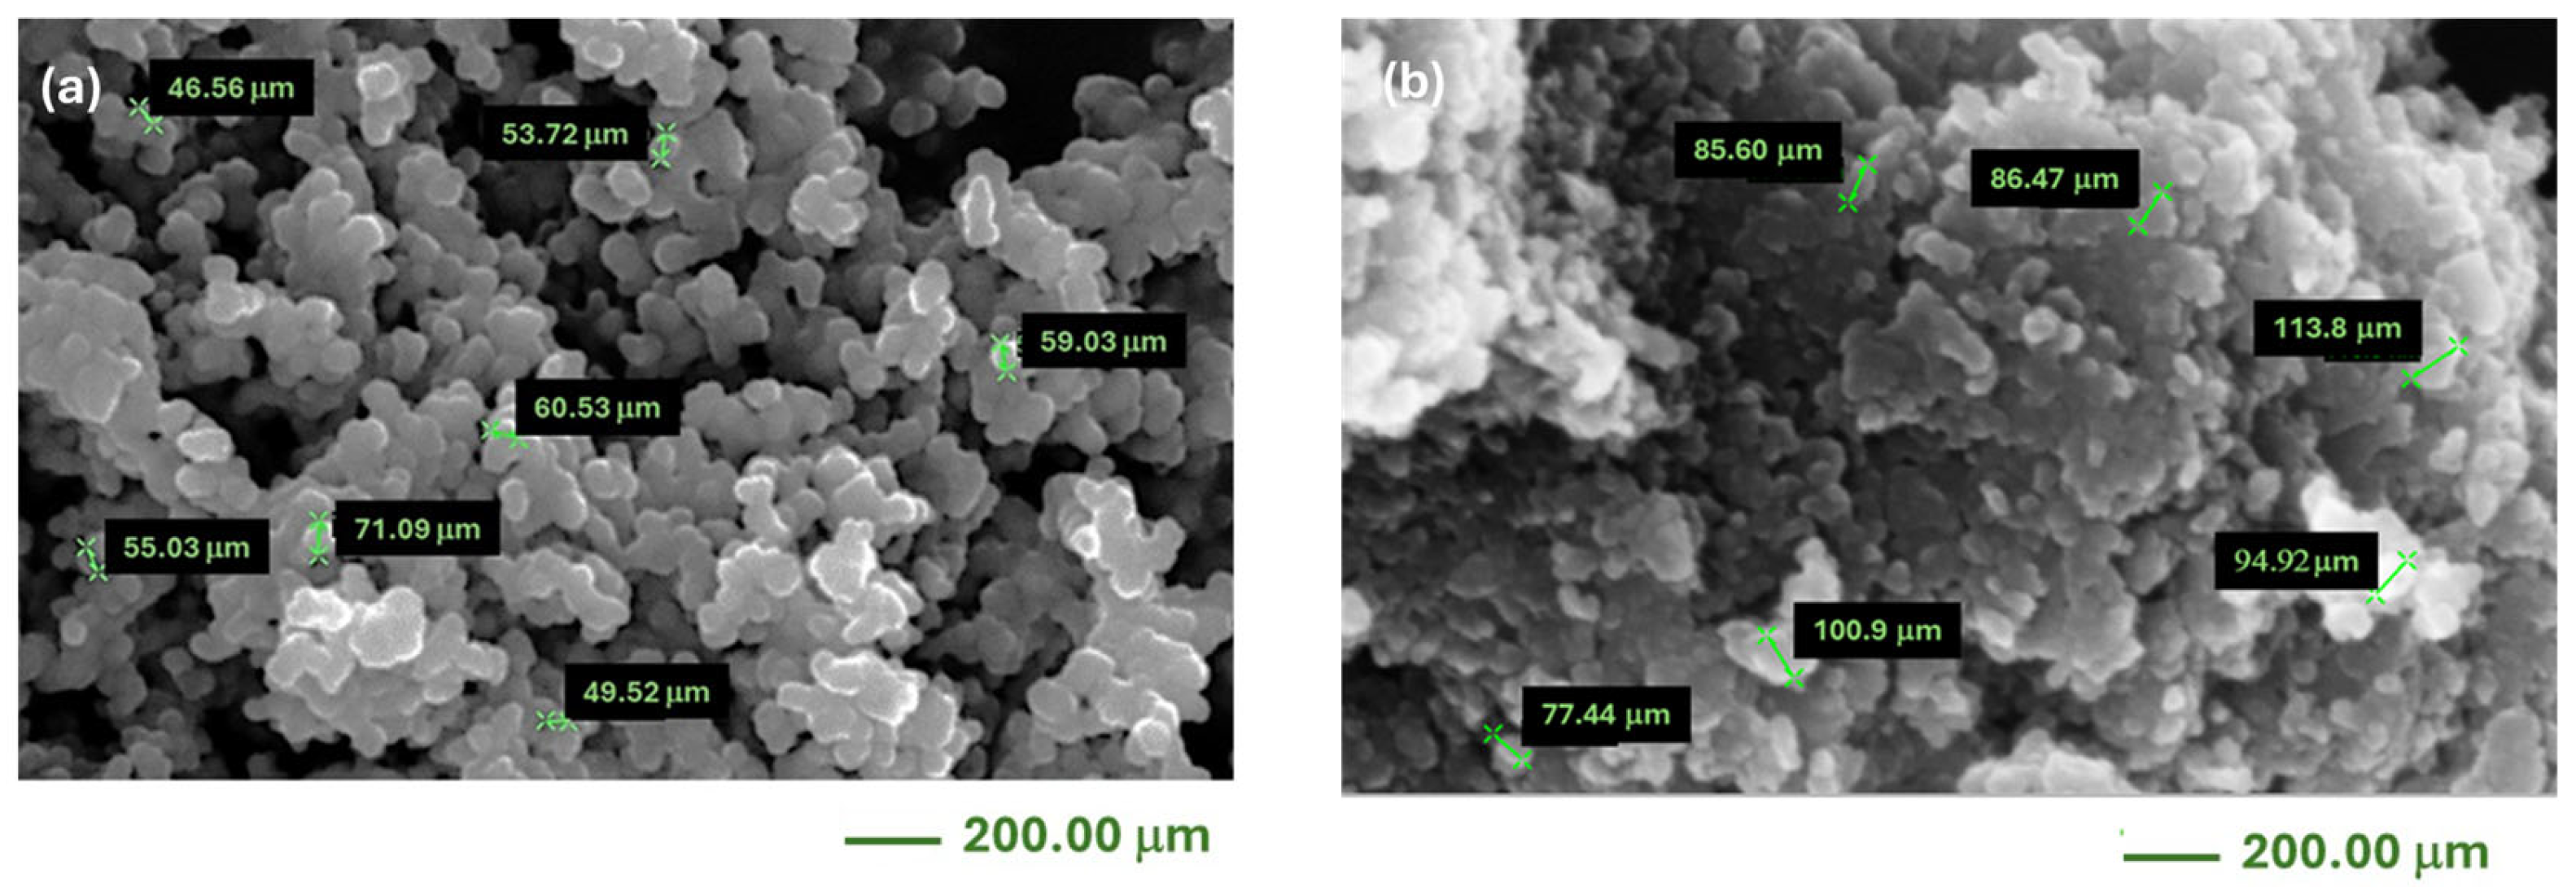
The initial phase involves the in-depth characterization of graphene, titanium dioxide, and the light source, aimed at ensuring a comprehensive understanding of the physicochemical properties of the reagents used and the efficiency of the light radiation applied. This preliminary step proved fundamental for correctly defining the experimental conditions and ensuring the reliability of the results obtained in the subsequent stages. In particular, the morphology of graphene and titanium dioxide was analyzed through scanning electron microscopy (SEM). The images obtained highlight the presence of nanoscale aggregates and confirm the small particle sizes, consistent with values reported in the literature. These observations, illustrated in Figure 10, are crucial for understanding the interactions between the reagents and the light radiation, directly affecting the performance of the photocatalytic system under investigation.
To verify the quality of the radiation used for the operation of the DSSC solar cell during the experimental phase, the spectral power density emitted by the lamp was compared, using an amplified photodetector, with that of the standard solar spectrum AM 1.5G (Air Mass 1.5 Global). The latter represents the spectral distribution of solar energy that reaches the Earth’s surface after passing through the atmosphere at an average incidence angle of approximately 48° relative to the zenith.
As shown in Figure 11, the comparison between the spectroscopic curves of the lamp and the AM 1.5G spectrum reveals a substantially equivalent area under the curve.
This indicates that, despite potential local variations at individual wavelengths, the overall amount of irradiated energy is comparable. Moreover, the distribution is sufficiently continuous and balanced to consider the artificial source an effective simulation of real sunlight. Such fidelity enables meaningful and transferable measurements of photovoltaic efficiency under controlled laboratory conditions.

3.2. Correlation Between Optical and Electrical Parameters in Grätzel Cells with Varying Graphene Concentrations

In DSSC (Grätzel-type) solar cells fabricated with different concentrations of graphene, characteristic parameters were analyzed to evaluate overall performance and to understand the functional role of the conductive material. Specifically, a systematic and comparative study was conducted on the following parameters: fill factor (FF), transmittance, current intensity (I), power voltage (V), and photovoltaic efficiency (η). These parameters were correlated with the amount of graphene used to identify the most favorable configurations for enhancing cell efficiency. The analysis of relationships between optical and electrical variables allowed for the identification of significant trends and performance patterns linked to graphene concentration. The adopted approach enabled a clearer outline of the most advantageous operating conditions, providing useful insights into the structural and functional optimization of DSSCs. The experimental results obtained are presented below in tabular and graphical form to facilitate data interpretation and the identification of recurring functional dependencies.

3.2.1. Analysis of Vm in DSSCs

To effectively represent the electrical performance of the DSSCs, two distinct graphs were generated using Excel office 2021 data analysis software:
-
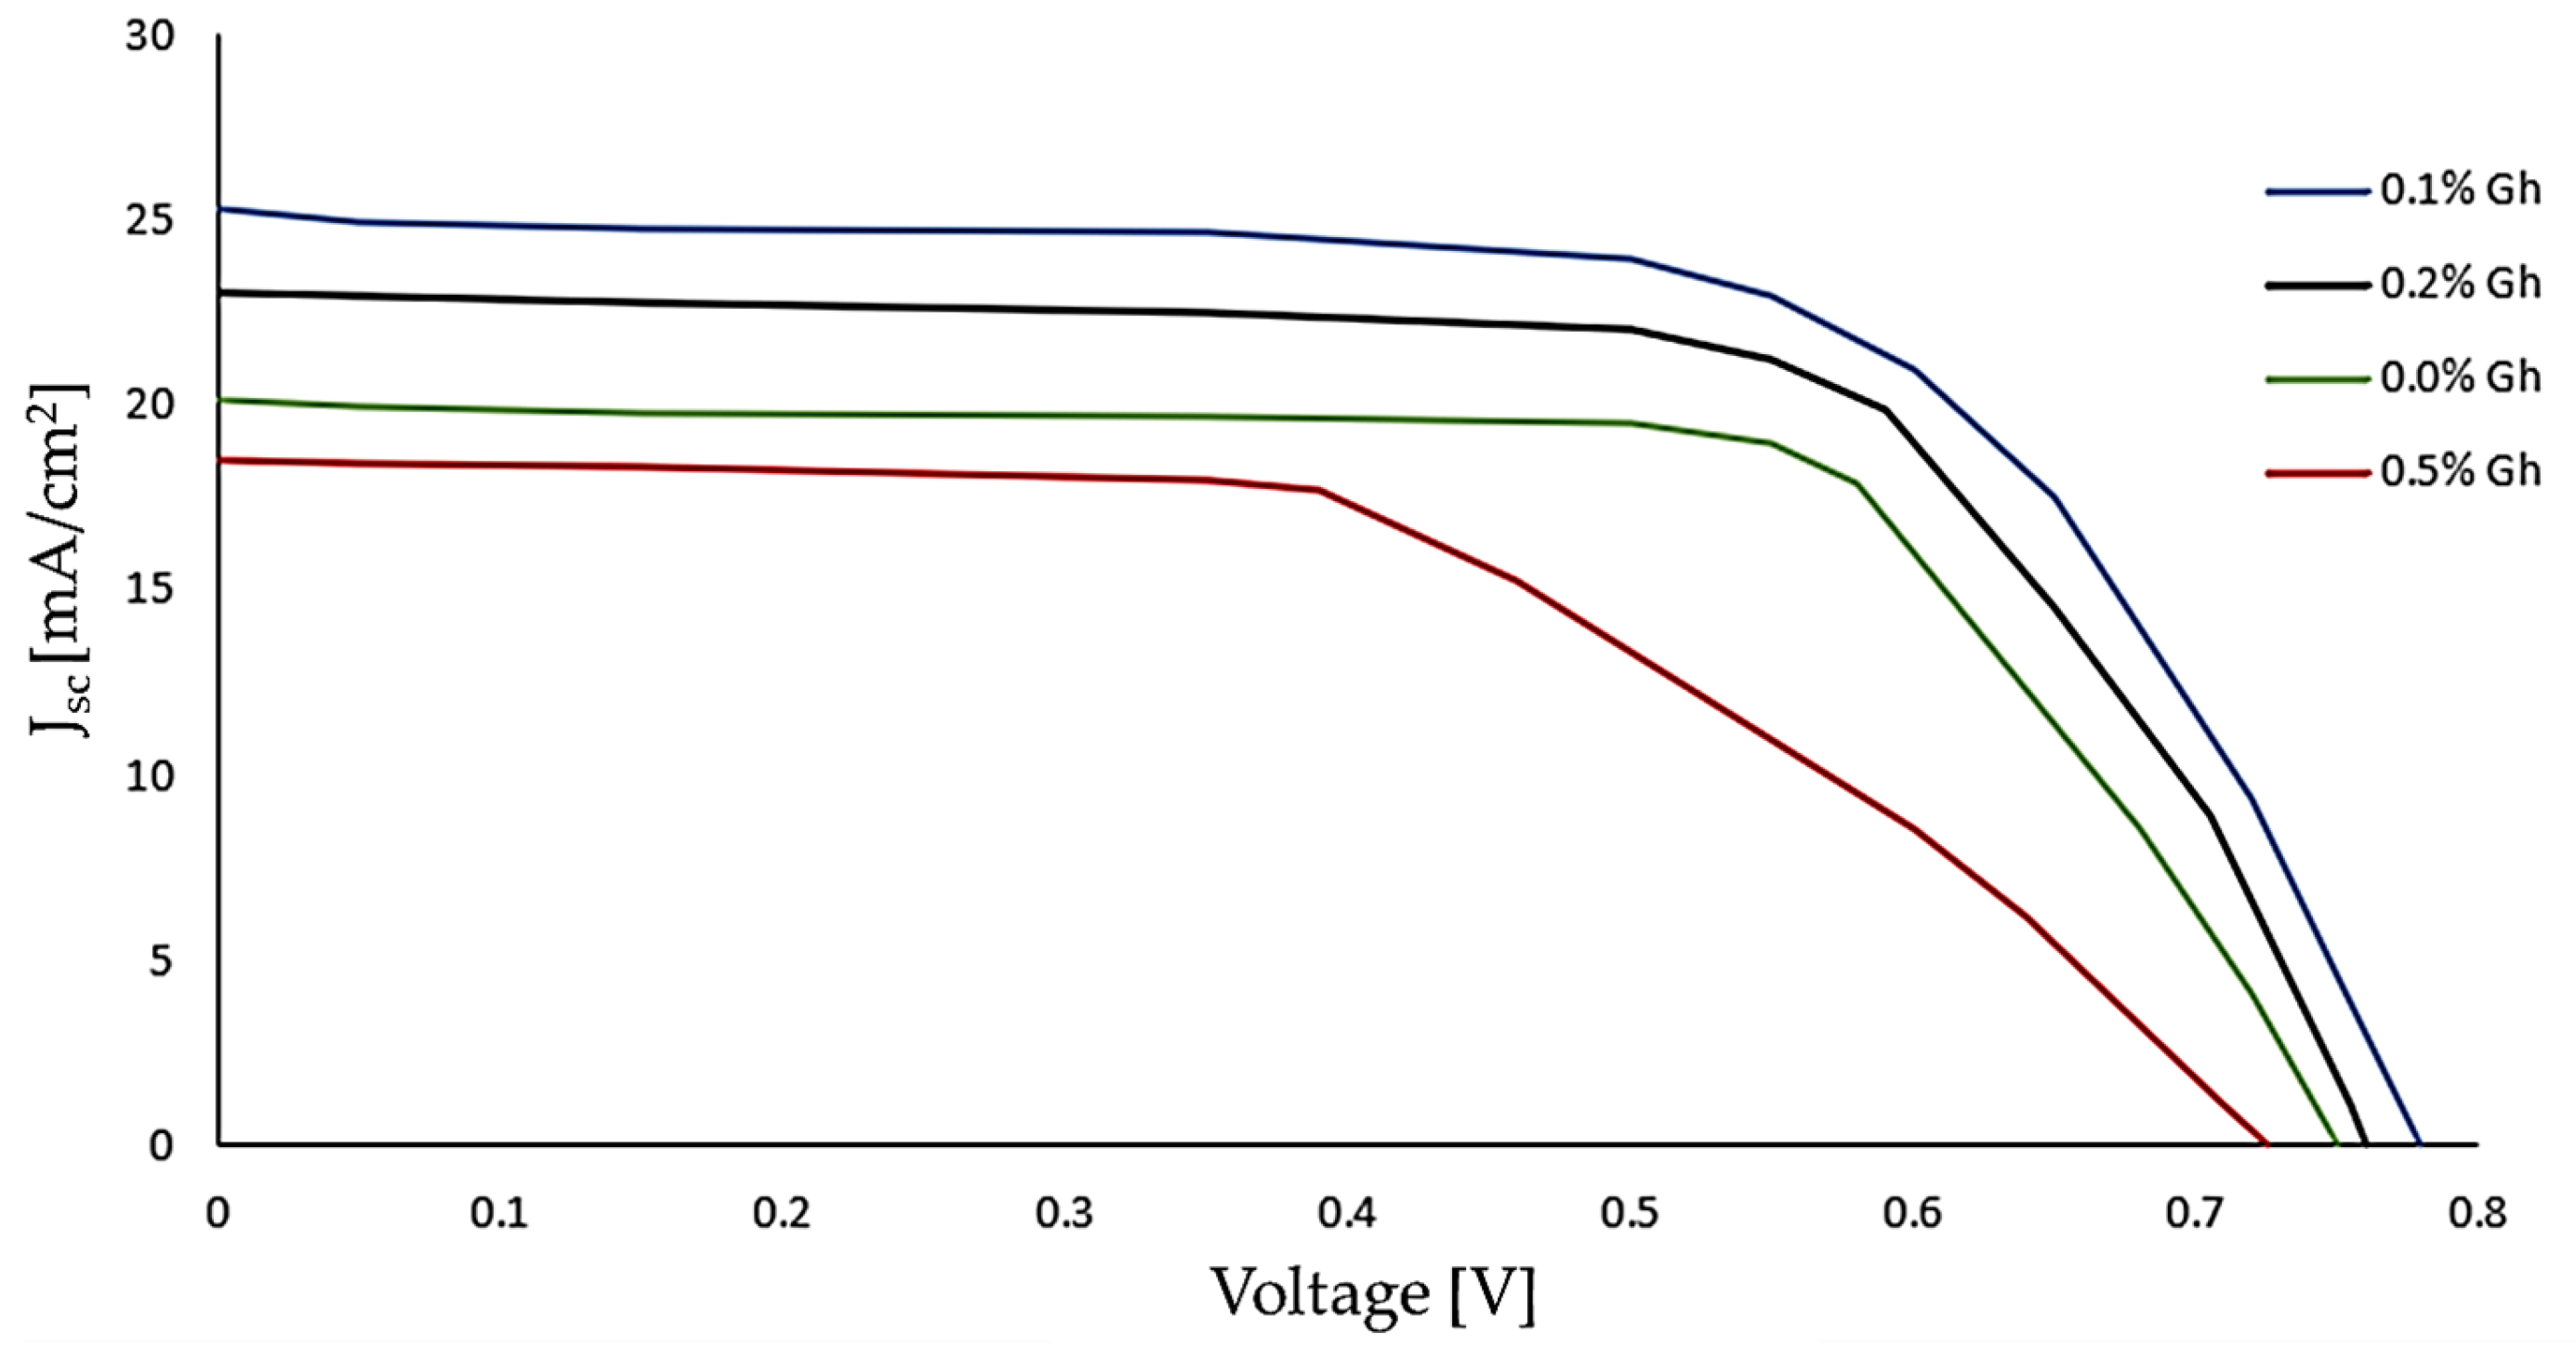
The variation in current density (J) as a function of voltage (V) for each type of cell (Figure 12).
-
The trend of current (Im) and voltage at the maximum power point (Vm) for the same configurations (Figure 13).
The J–V curves revealed significant differences in relation to the graphene concentration present in the devices. The cell containing 0.1% graphene exhibited a broader and more rectangular curve, with higher Jsc and Voc values—indicative of efficient charge collection, low internal resistance, and effective coupling between the electrode and the dye. Conversely, the cell with 0.5% graphene showed a narrower and more slanted curve, characterized by reduced Jsc and Voc, suggesting more pronounced ohmic losses and possible graphene aggregation phenomena that hinder electron transport. The cell without graphene occupied an intermediate position, confirming that a small amount of graphene can enhance device performance, while excessive concentrations are counterproductive. The second graph (Figure 13), focused on the optimal operating point—i.e., the condition of maximum power output—enabled a targeted assessment of the impact of graphene on DSSC performance.
The cell containing 0.1% graphene recorded the highest values in both current (Im) and voltage (Vm), experimentally confirming that this concentration represents an optimal balance between electrical conductivity, optical transparency, and electrode morphology. The cell without graphene showed lower performance yet still surpassed that of the 0.5% graphene cell—highlighting that the introduction of graphene is advantageous only within well-defined thresholds. The cell with the highest graphene content also reported the lowest values in this analysis, in line with the trends observed in the I–V curves, suggesting that high concentrations may impair electron transport due to aggregation phenomena. Overall, the cell containing 0.1% graphene proved to be the most efficient among those analyzed. The experimental conditions adopted, including the use of titanium paste (described in the Section 2), enabled assessment of the impact of this composition. Graphene concentration emerged as a critical parameter: moderate amounts improved conductivity and preserved the structural integrity of the device, whereas excessive amounts promoted aggregate formation and microstructural alterations in the electrode, negatively affecting ion diffusion in the electrolyte.

3.2.2. Efficiency as a Function of Maximum Power Voltage

The graph shown in Figure 14 illustrates the efficiency of DSSCs as a function of voltage at maximum power (Vm), for devices fabricated with varying graphene concentrations.
The analysis highlights that the cell containing 0.1% graphene exhibits a higher Vm, indicative of an optimal operating point, with more efficient electron transport and charge collection. This result suggests that the controlled insertion of graphene nanoparticles can enhance photovoltaic conversion without introducing excessive internal resistance. In contrast, a higher concentration (0.5%) leads to a reduction in Vm and overall efficiency, likely due to material aggregation, which impairs electron mobility and interaction with the electrolyte.

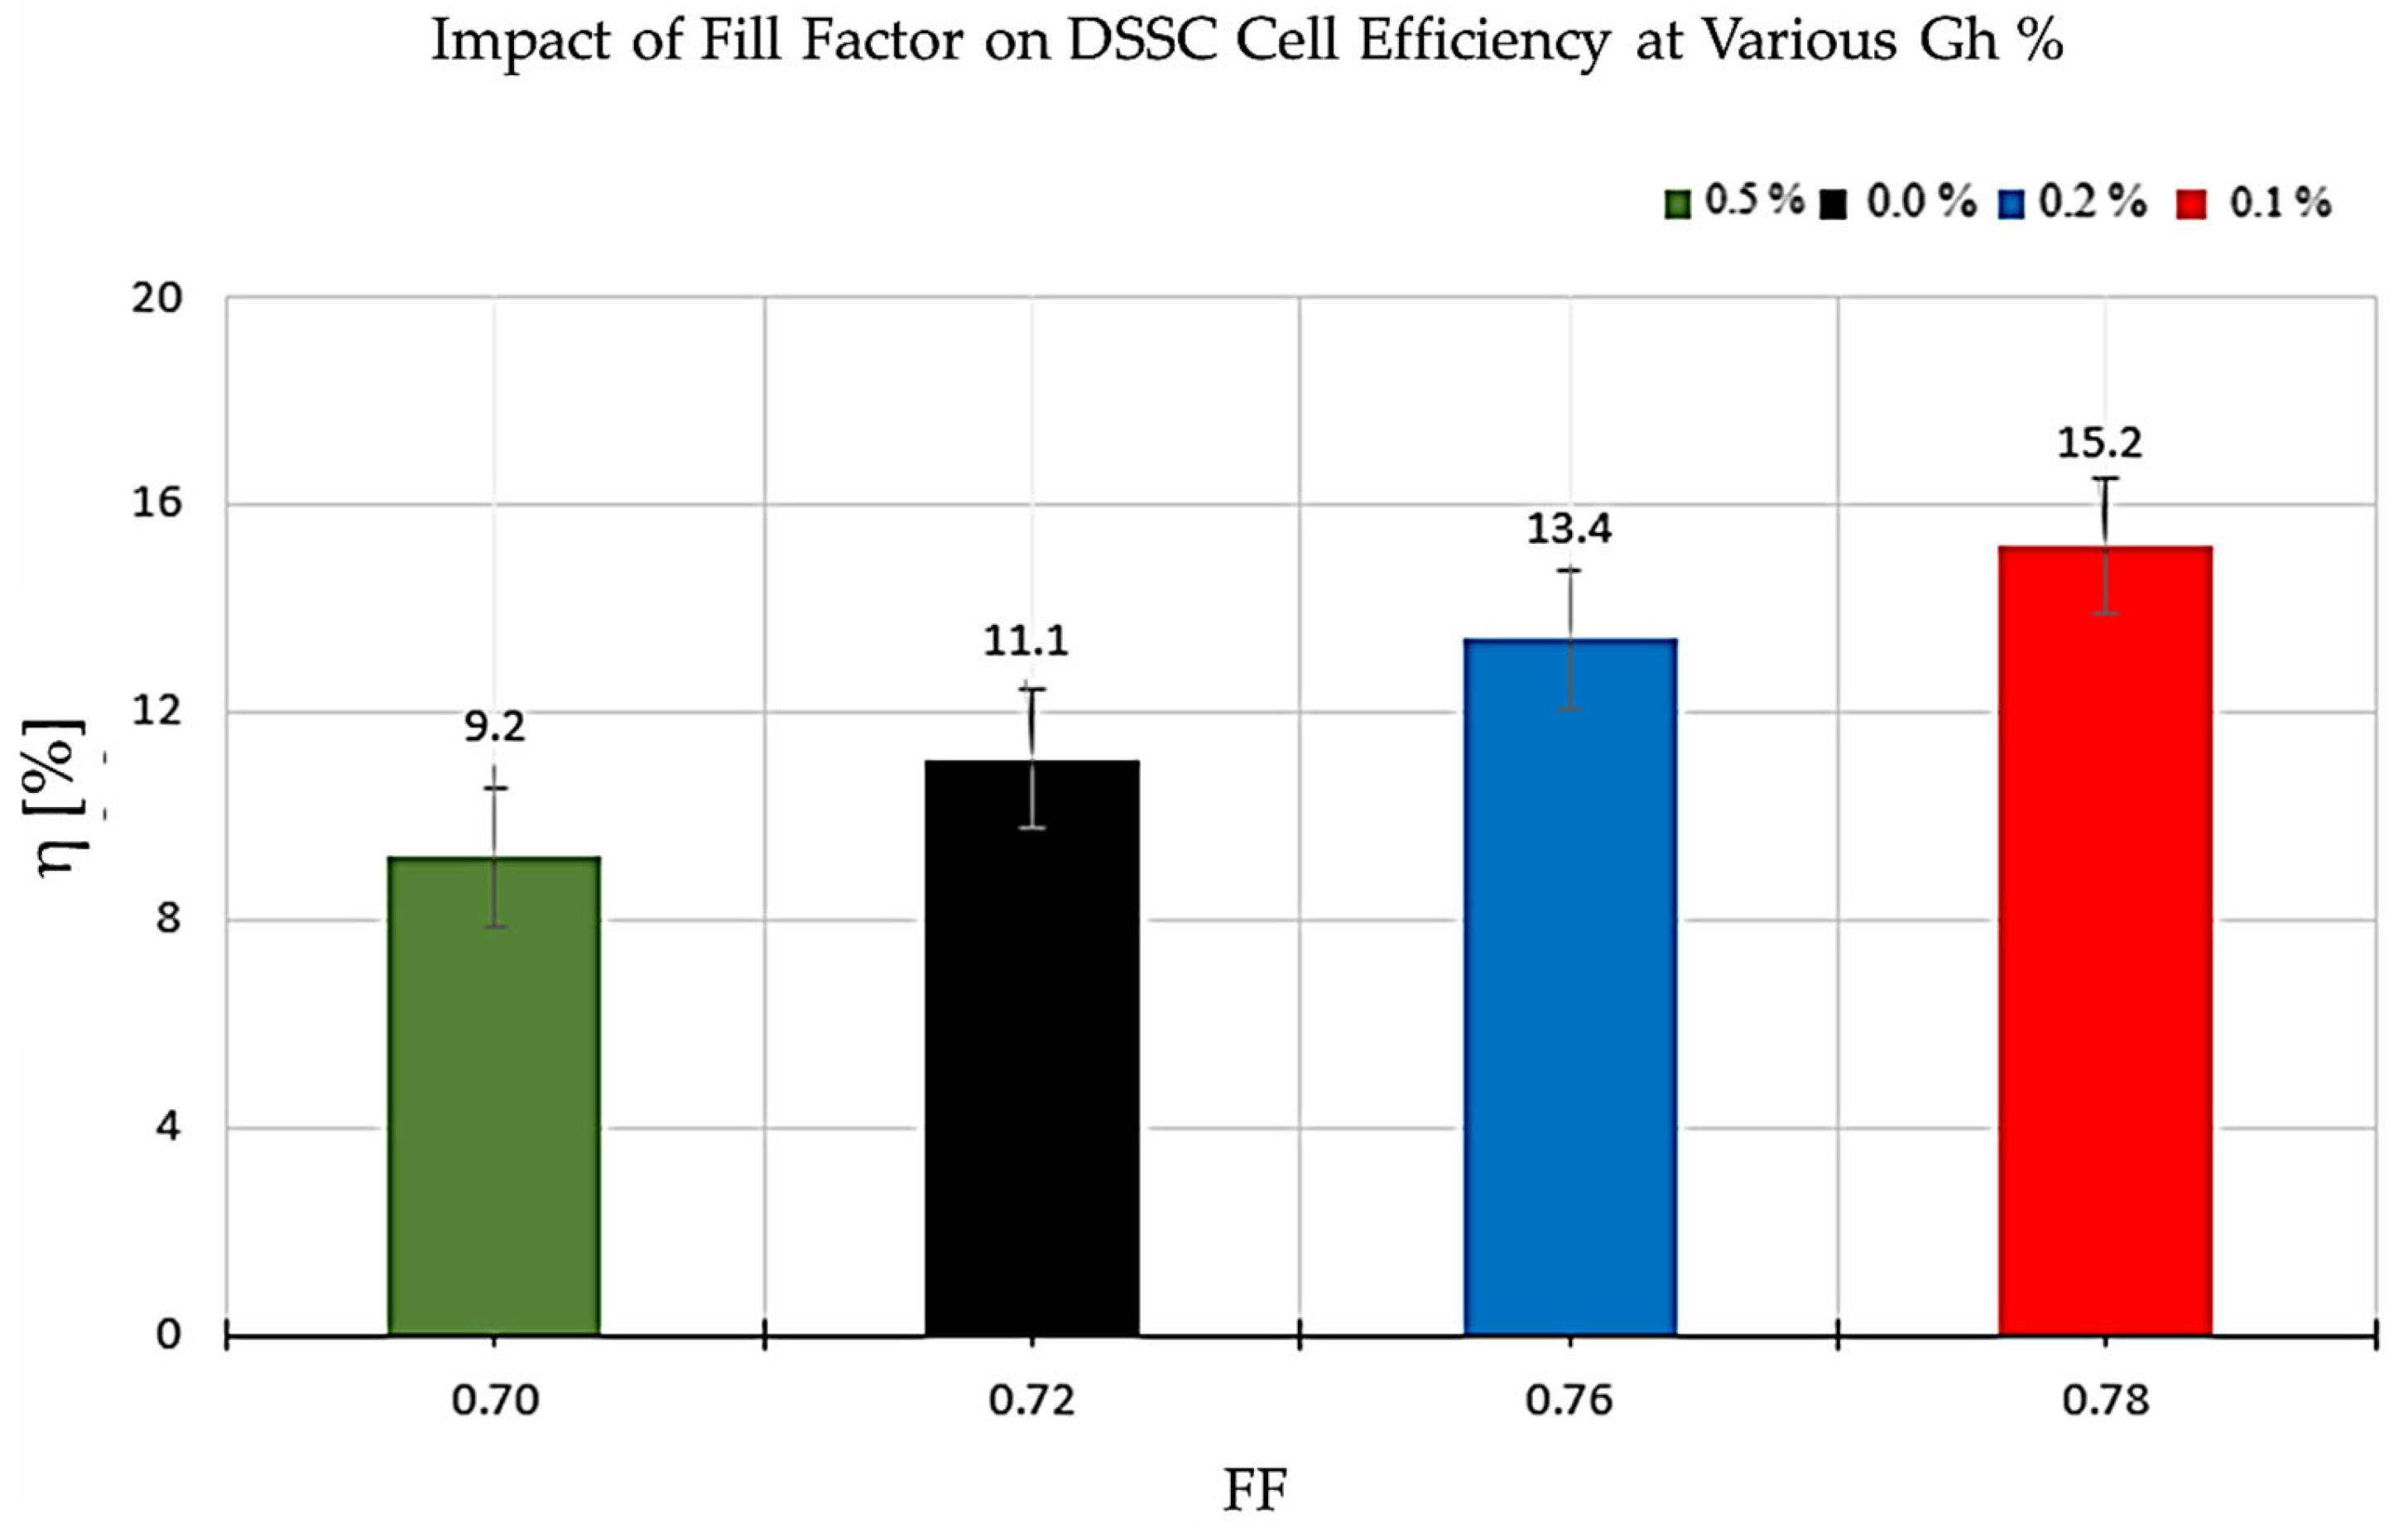
3.2.3. Relationship Between Photovoltaic Efficiency (η) and Fill Factor (FF)

The graph shown in Figure 15 illustrates the correlation between photovoltaic efficiency and the FF for DSSCs fabricated with different graphene concentrations. The FF is a key parameter in evaluating solar cell performance, as it represents the ratio between the actual maximum power output and the theoretically available power. High FF values indicate optimal energy conversion management, with minimal resistive losses and effective separation of electron-hole pairs
Experimental data show that the cell containing 0.1% graphene exhibits the highest values of both FF and efficiency, suggesting an optimal balance between electron transport and charge collection. This result confirms that a low concentration of graphene can enhance electrode conductivity, reduce internal resistance, and promote interaction with the electrolyte. In contrast, the cell with 0.5% graphene displays the lowest FF and efficiency values—even lower than those of the cell without graphene. This behavior is attributed to the formation of graphene aggregates, which hinder electron mobility and generate structural defects, compromising conductivity and increasing energy losses.
Cells with 0.2% graphene occupy an intermediate position, reaffirming that the effect of graphene is not linear and that there exists an optimal concentration range. Uneven dispersion or excessive dosing can indeed inhibit cell performance rather than improve it. The joint analysis of photovoltaic parameters (Table 6) reveals that all key quantities—Voc, FF, Vm, Jsc, and Im—reach their peak values with the introduction of just 0.1% graphene. Under this condition, Voc increases from 0.75 V to 0.78 V, while FF rises from 0.72 to 0.78, indicating a significant reduction in recombination processes at the photoanode–electrolyte interface. Simultaneously, Vm increases from 0.54 V to 0.61 V and Jsc from 20.2 to 25.3 mA·cm−2, resulting in a 36% increase in Im and an operational efficiency gain (Im/Vm) exceeding 20%. This synergistic enhancement stems from the improved conductivity of the TiO2 film enriched with graphene, which facilitates electron transport, and from the formation of a more homogeneous TiO2–graphene network that maximizes dye adsorption and charge collection. Beyond the 0.1% threshold, performance progressively declines: at 0.2%, both Voc and FF begin to decrease, and at 0.5%, minimum values are reached (Voc 0.72 V, FF 0.70), due to the aggregation of graphene sheets that obstruct active sites and reduce the sensitized area. These findings clearly delineate an optimal range for graphene incorporation in N719-based Grätzel cells, where small quantities consistently enhance all photovoltaic metrics, whereas higher doses prove counterproductive. Furthermore, to validate these results, a transmittance measurement of the cells was conducted, confirming the data as discussed in the following paragraph.
The efficiency of dye-sensitized solar cells (DSSCs) based on nanostructured TiO2 is influenced by factors such as particle size and porosity. In parallel, it has been observed that the structural configuration of directly synthesized graphene significantly affects the current-voltage behavior and photovoltaic performance [44]. Similarly, academic studies conducted at the University of Bologna report efficiencies between 8% and 10% for unmodified DSSCs based on pure TiO2 and the N719 dye [45]. Our result of 15.2% therefore represents a significant improvement, attributable to the controlled integration of graphene nanoparticles into the TiO2 paste. This enhancement is linked to increased electronic conductivity, reduced recombination phenomena, and more efficient charge separation, as confirmed by the optimization of electron transport in nanostructured materials [46]. This comparison reinforces the validity of our approach and highlights its potential for advanced photovoltaic applications, positioning our methodology among the most promising in the field of third-generation solar cells.

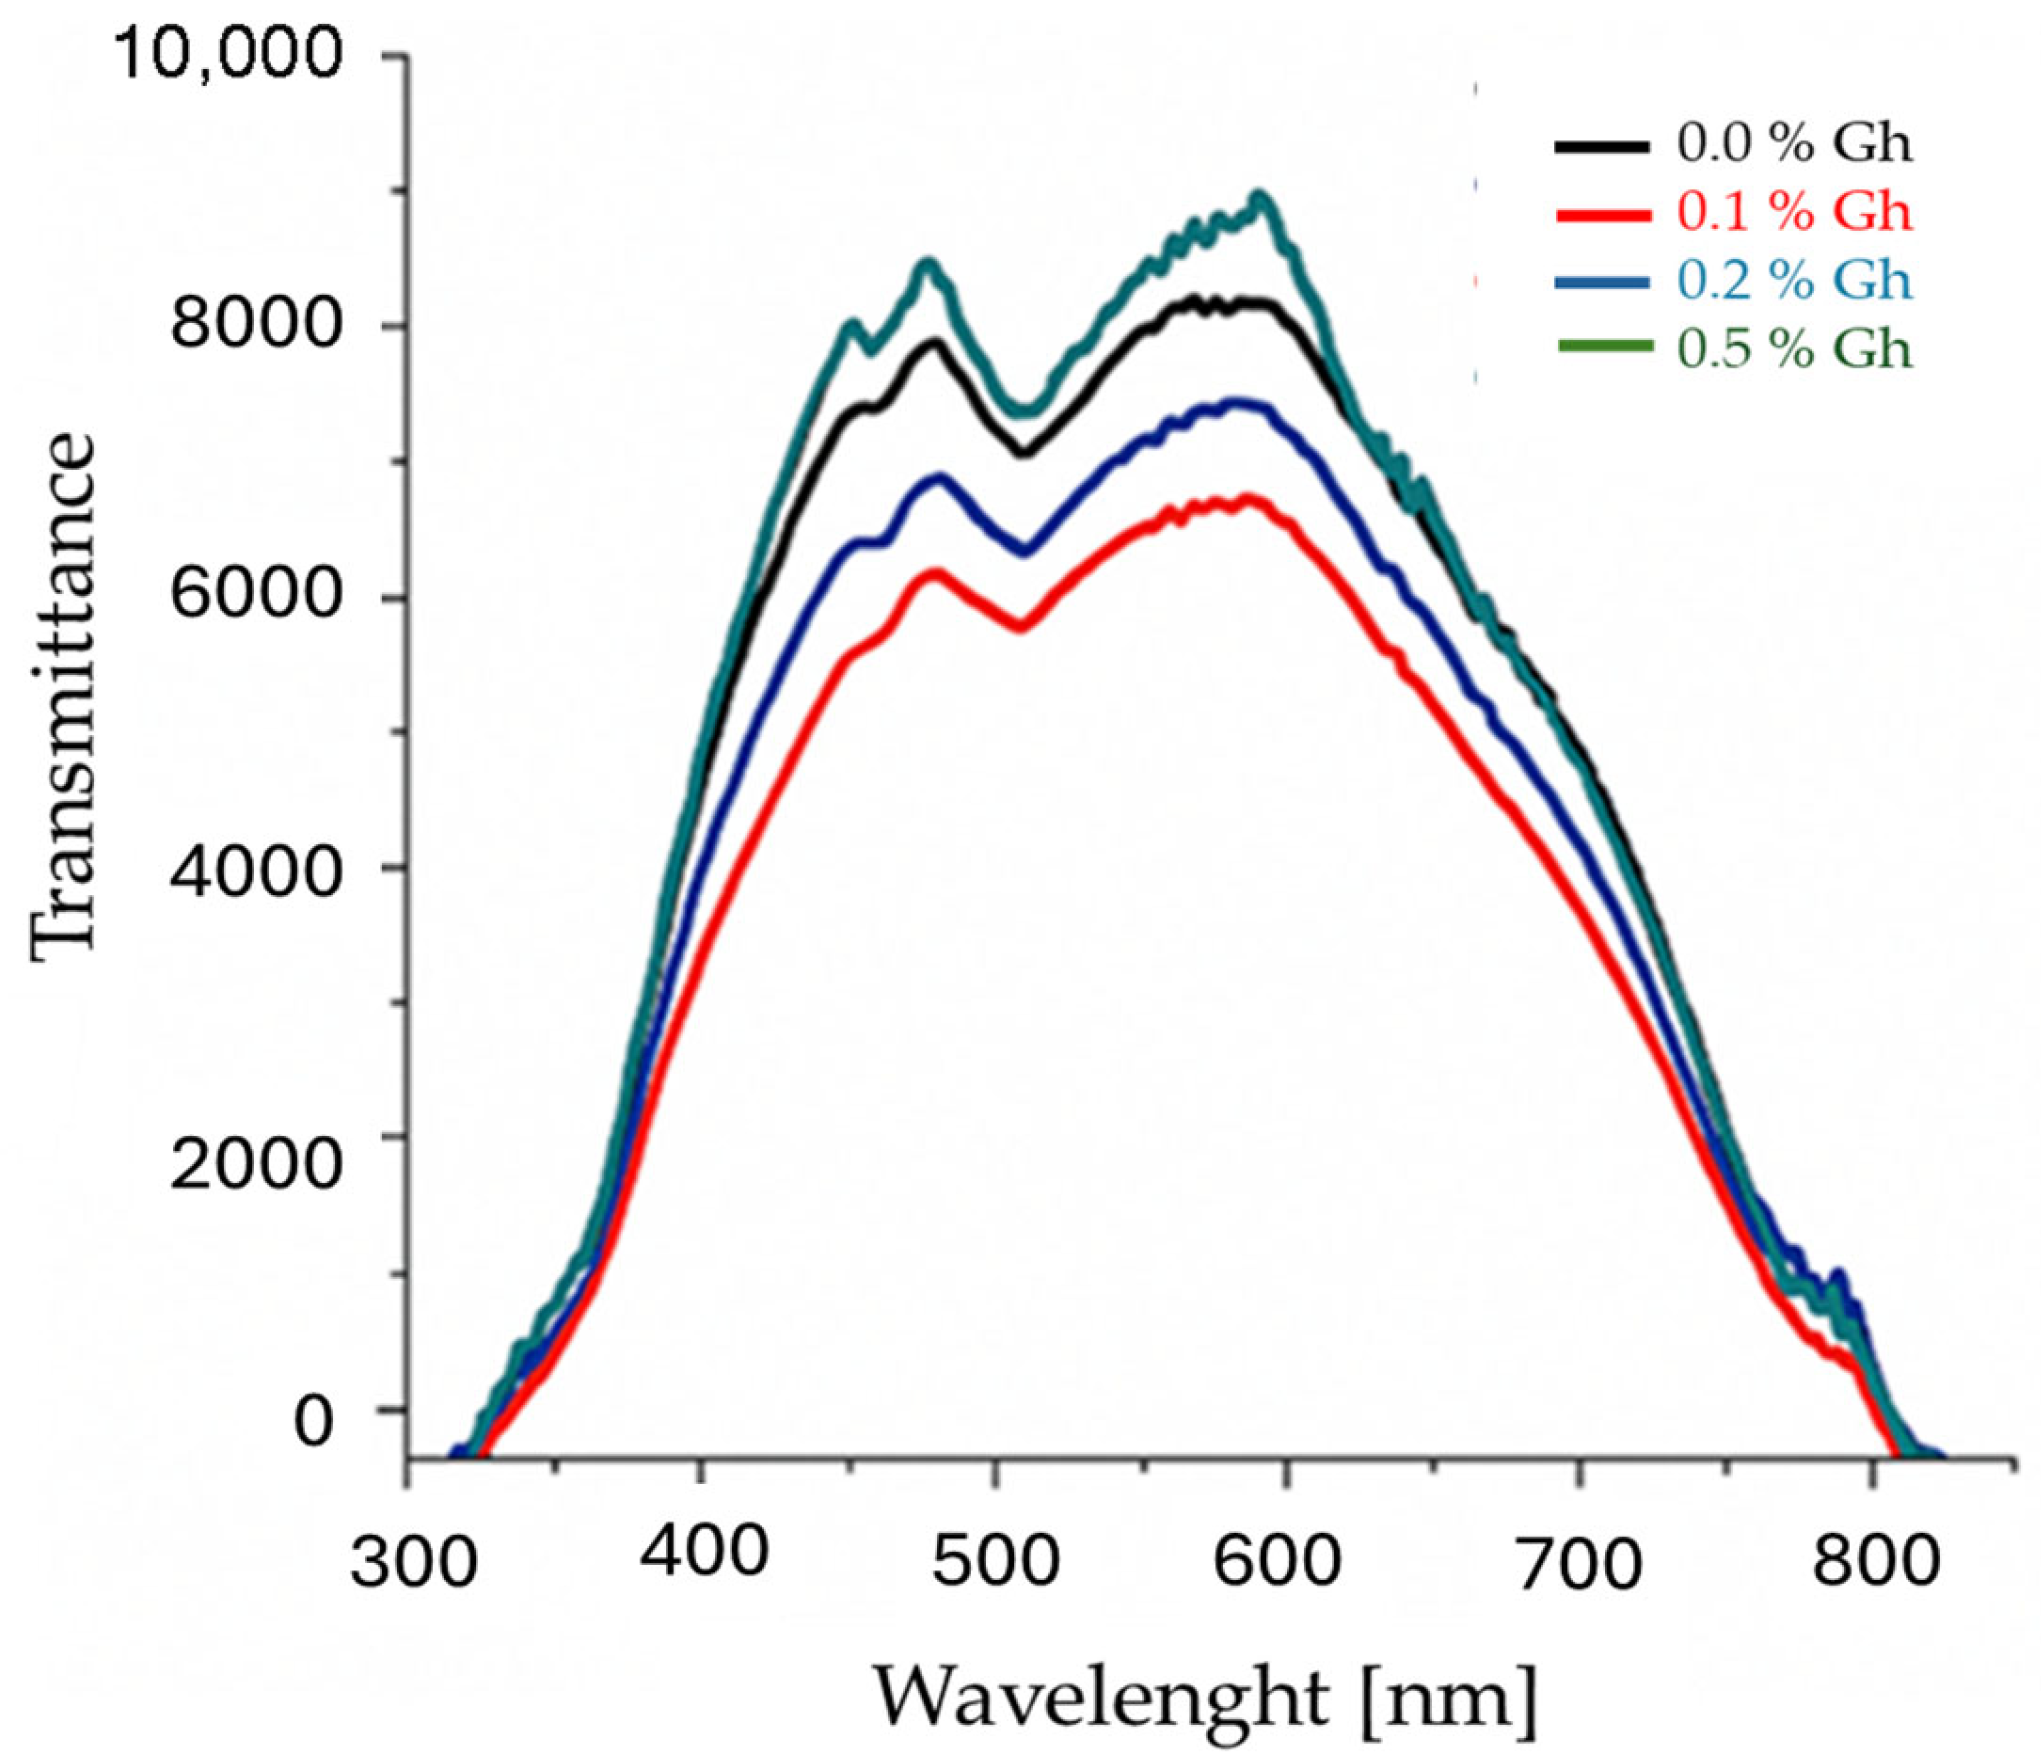
3.2.4. Transmittance

The graph shown in Figure 16 illustrates the spectral transmittance behavior of DSSC solar cells with respect to the wavelength of incident light, comparing devices fabricated with different graphene concentrations in the photoanode.
The scientific analysis of optical transmittance for the four DSSC solar cells, fabricated with varying graphene concentrations, reveals a distinctly non-linear behavior—an indication of profound variations in the photoanode’s microstructure and functional capacity. The cell lacking graphene (0% concentration) exhibits an intermediate transmittance value, consistent with a moderate capability to absorb incident light. The absence of conductive additives such as graphene ensures good uniformity in TiO2 distribution but limits electron transport efficiency, which remains reliant solely on the semiconducting matrix. In this configuration, photovoltaic conversion is stable but not particularly optimized.
As the graphene concentration increases, significant variations emerge; the cell with 0.1% graphene shows a marked reduction in transmittance, indicative of more effective light absorption. This behavior may be associated with an increase in film optical density and the formation of localized conductive networks that facilitate electron mobility. However, effectiveness is highly dependent on graphene dispersion quality and the system’s ability to separate and transport photo-generated charges without resistive losses.
With a concentration of 0.2%, transmittance is slightly higher than that of the 0.1% cell, suggesting partial recovery of optical transparency. In this configuration, graphene continues to play an active role in enhancing conductivity, but signs of aggregation begin to appear, compromising the uniformity of the photoanode. These aggregates can impede ionic transport and introduce electrical discontinuities, leading to a decrease in the device’s overall efficiency.
The situation becomes more complex with the 0.5% graphene cell, which—unexpectedly—shows transmittance levels even higher than those of the reference cell without graphene. This counterintuitive increase in transparency may be attributed to the formation of macroporosity, inhomogeneous nanoparticle dispersion, or poorly integrated graphene clusters within the TiO2 matrix. The result is a significant loss in effective optical density, resulting in reduced photon interaction and diminished photocurrent generation. Furthermore, internal structural alterations may amplify the system’s electrical resistance and reduce charge collection capacity.
Ultimately, the graphene content in the photoanode proves to be a critical factor in balancing optical transparency and electronic functionality. A concentration that is too low may fail to enhance the conductive properties of graphene, while an excessive amount can compromise the device’s structural and functional integrity. Only careful optimization of the composition allows for maximization of photovoltaic performance through effective synergy between light absorption, electron mobility, and material uniformity.

3.2.5. Quantitative Impact of Graphene Concentration on Photovoltaic Performance

The comparative analysis of dye-sensitized solar cells (DSSCs) with increasing graphene concentrations in the photoanode—0.0%, 0.1%, 0.2%, and 0.5%—revealed a marked and non-linear influence on all key photovoltaic parameters: conversion efficiency (η), open-circuit voltage (Voc), short-circuit current density (Jsc), and fill factor (FF). The controlled incorporation of graphene into the TiO2 semiconducting matrix produced significant effects, with performance varying according to weight percentage. The cell containing 0.1% graphene achieved the highest energy conversion efficiency (15.2%), showing simultaneous increases in Voc (+4%), Jsc (+25%), and FF (+8%) compared to the reference cell. This result may be attributed to the formation of a nanostructured conductive network that facilitates electron transport through the photoactive film while enabling more efficient separation of photogenerated charges. The observed reduction in transmittance suggests optimized absorption of incident radiation, consistent with high optical density in the active layer. This scenario directly benefits electron mobility, charge extraction, and electrolyte interface quality. At a concentration of 0.2%, efficiency slightly decreases to 13.4%, although it remains higher than the graphene-free cell. Voc and FF still increase, albeit less prominently, while short-circuit current density rises more moderately (+14%). This may indicate a transitional regime in which graphene dispersion begins to exhibit structural inhomogeneities. The emergence of micro-aggregates can disrupt electron transport, hinder ionic diffusion, and increase internal resistance, partially compromising overall conversion efficiency. At 0.5%, the benefits of graphene disappear entirely, with efficiency dropping to 9.2%, lower than that of the reference cell. The reductions in Voc (−4%), Jsc (−8%), and FF (−3%) clearly reflect the negative impact of excessive concentration. The photoanode structure appears visibly more porous, accompanied by a paradoxical increase in transmittance. This behavior is plausibly linked to the formation of non-uniform porosity and irregular dispersion of graphene nanoparticles within the TiO2 matrix. Such structural conditions may produce poorly integrated clusters within the photoactive film, lowering optical density and impairing light absorption. The result is reduced interaction between the active material and incident radiation, diminished photocurrent generation, and increased charge recombination losses. The graphene-free cell (0.0%) serves as the experimental reference, with a moderate efficiency of 11.1%. Although all parameters are balanced, the absence of auxiliary conductive materials limits electron transport potential. Its intermediate transmittance suggests adequate photo-optical interaction, though insufficient to offset the reduced charge mobility. These trends are quantitatively summarized in Table 7, which presents the key electrical parameters of DSSCs as a function of graphene concentration, along with percentage variations relative to the graphene-free reference.

4. Conclusions

In conclusion, graphene dosage in DSSC photoanodes is a critical determinant of device performance. An optimal concentration of 0.1% enables maximum efficiency through synergistic enhancement of light absorption, conductivity, and electron transport. Exceeding this threshold, however, induces aggregation and irregular dispersion phenomena that impair optoelectronic properties and compromise overall cell functionality. Based on the experimental results obtained, some general reflections can be formulated regarding the effectiveness and strategic relevance of graphene-enhanced DSSCs. The non-linear performance behavior as a function of graphene concentration, together with the strong dependence on the structural properties of the photoanode, underscores how nanomaterial optimization serves as a key lever in the advancement of photovoltaic technologies. In particular, the identification of an optimal threshold (0.1%) highlights the importance of a systemic design approach that simultaneously addresses physicochemical, electrical, and morphological aspects of the device architecture. Beyond functional benefits, the integration of graphene also introduces significant advantages from both economic and environmental perspectives. Compared to first-generation silicon-based cells, graphene DSSCs are distinguished by their low production costs, simplified disposal processes, and use of environmentally friendly materials. These features promote the adoption of more accessible and sustainable energy solutions aligned with the principles of circular economy. Overall, graphene-enhanced DSSC technology emerges as a promising platform for the future of solar energy—not only due to its achievable performance levels, but also for its ability to combine material innovation, operational efficiency, and environmental responsibility within a unified energy model. This represents a meaningful milestone and simultaneously opens new avenues for research and industrial development.

Author Contributions

Conceptualization, L.M., P.D.L. and P.S.; Methodology, L.M. and P.S.; Validation, L.M. and P.D.L.; Formal analysis, L.M.; Investigation, L.M.; Writing—original draft preparation, L.M. and P.D.L.; Writing—review and editing, L.M. and P.D.L.; Supervision, L.M., P.D.L. and A.M. All authors have read and agreed to the published version of the manuscript.

Funding

This research received no external funding.

Institutional Review Board Statement

Not applicable.

Informed Consent Statement

Not applicable.

Data Availability Statement

Data are contained within the article.

Conflicts of Interest

The authors declare no conflicts of interest.

References

  1. Petrović, A.M. Renewable and nonrenewable energy potential. Afford. Clean Energy 2020, 1, 1–10. [Google Scholar]
  2. Chen, H.; Xie, Z.; Zhang, X.; Hao, J.H. Engine combustion and emission fuelled with natural gas: A review. J. Energy Inst. 2019, 92, 1123–1136. [Google Scholar] [CrossRef]
  3. Green, M. Photovoltaics: Technology overview. Energy Policy 2000, 28, 989–998. [Google Scholar] [CrossRef]
  4. Khomenko, S.; Cirach, M.; Pereira-Barboza, E.; Mueller, N.; Barrera-Gómez, J.; Rojas-Rueda, D.; de Hoogh, K.; Hoek, G.; Nieuwenhuijsen, M. Premature mortality due to air pollution in European cities: A health impact assessment. Lancet Planet. Health 2021, 5, 121–134. [Google Scholar] [CrossRef]
  5. Zito, R. Ionizing radiation hazards: Dangerous goods IV. J. Syst. Saf. 2021, 56, 12–33. [Google Scholar] [CrossRef]
  6. Kumar, S.; Bharti, P.; Singh, B.P. Performance optimization of efficient PbS quantum dots solar cells through numerical simulation. Sci. Rep. 2023, 13, 10511. [Google Scholar] [CrossRef] [PubMed]
  7. Magliano, E.; De Carlo, A.; Lamberti, C.M.; Tresso, E.; Penna, M.P.; Pugliese, A.M. Semitransparent perovskite solar cells with ultrathin protective buffer layers. ACS Appl. Energy Mater. 2023, 6, 10340–10353. [Google Scholar] [CrossRef] [PubMed]
  8. Coppola, C.; Visibelli, A.; Parisi, M.L.; Santucci, A.; Zani, L.; Spiga, O.; Sinicropi, A. A combined ML and DFT strategy for the prediction of dye candidates for indoor DSSCs. npj Comput. Mater. 2025, 11, 28. [Google Scholar] [CrossRef]
  9. Grätzel, M. Photoelectrochemical cells. Nature 2001, 414, 338–344. [Google Scholar] [CrossRef]
  10. Ren, Y.; Zhang, D.; Suo, J.; Cao, Y.; Eickemeyer, F.T.; Vlachopoulos, N.; Zakeeruddin, S.M.; Hagfeldt, A.; Grätzel, M. Hydroxamic acid preadsorption raises efficiency of cosensitized solar cells. Nature 2022, 610, 614–620. [Google Scholar] [CrossRef]
  11. Arkan, F.; Pakravesh, F.; Barati Darband, F.; Sabagh, S.; Izadyar, M. Recent Progress toward High-Performance Dye-Sensitized Solar Cells: A Review. J. Iran. Chem. Soc. 2024, 21, 577–638. [Google Scholar] [CrossRef]
  12. Casaluci, S.; Gemmi, M.; Pellegrini, V.; Di Carlo, A.; Bonaccorso, F. Graphene-based large area dye-sensitized solar cell modules. Nanoscale 2016, 8, 5368–5378. [Google Scholar] [CrossRef]
  13. Habibi Jetani, G.; Rahmani, M.B. TiO2/GO Nanocomposites: Synthesis, Characterization, and DSSC Application. Eur. Phys. J. Plus 2020, 135, 720. [Google Scholar] [CrossRef]
  14. Verified Market Reports. Graphene Market Size and Forecast (2023–2033); ID Report: 554963; Verified Market Reports: Washington, DC, USA, 2025; Available online: https://www.verifiedmarketreports.com/it/product/graphene-market-size-and-forecast/ (accessed on 9 July 2025).
  15. National Renewable Energy Laboratory (NREL). Best Research-Cell Efficiency Chart. Available online: https://www.nrel.gov/pv/cell-efficiency (accessed on 9 July 2025).
  16. National Renewable Energy Laboratory (NREL). Interactive Best Research-Cell Efficiency Chart. Last Updated: September 2025. Maintained by: U.S. Department of Energy, Office of Energy Efficiency and Renewable Energy. Available online: https://www.nrel.gov/pv/interactive-cell-efficiency (accessed on 13 October 2025).
  17. Wang, H.; Hu, Y.H. Graphene as a counter electrode material for dye-sensitized solar cells. Energy Environ. Sci. 2012, 5, 8182–8188. [Google Scholar] [CrossRef]
  18. Muchuweni, E.; Martincigh, B.S.; Nyamori, V.O. Recent advances in graphene-based materials for dye-sensitized solar cell fabrication. RSC Adv. 2020, 10, 44453–44469. [Google Scholar] [CrossRef] [PubMed]
  19. Kim, S.; Lee, J. Unusual enhancement in efficiency of DSSCs upon modifying photoanodes with reduced graphene oxide. RSC Adv. 2022, 12, 45577–45586. [Google Scholar] [CrossRef] [PubMed]
  20. Bett, A.W.; Dimroth, F.; Stollwerck, G.; Siefer, G.; Schöne, J.; Krause, R.; Wiesenfarth, M.; Philipps, S.P. Metamorphic Epitaxy for Multijunction Solar Cells. MRS Bull. 2016, 41, 183–188. [Google Scholar] [CrossRef]
  21. Beenakker, C.W.J.; van Houten, H. Quantum transport in semiconductor nanostructures. Solid. State Phys. 1991, 44, 1–228. [Google Scholar] [CrossRef]
  22. Xu, F.; Madeo, L.; Sapia, P.; Versace, C. Photocatalytic activities of WO3@TiO2 nanoparticles coated on a limestone surface. Nanotechnol. Environ. Eng. 2025, 10, 41. [Google Scholar] [CrossRef]
  23. Zhao, Y.; Chen, D. Electrochemical synthesis of graphene oxide and its application as counter electrode in DSSC. J. Renew. Sustain. Energy 2014, 6, 013125. [Google Scholar] [CrossRef]
  24. Sun, L.; Zhang, Q.; Liang, Q.; Li, W.; Li, X.; Liu, S.; Shuai, J. α-Fe2O3/Reduced Graphene Oxide Composites as Cost-Effective Counter Electrode for Dye-Sensitized Solar Cells. Catalysts 2022, 12, 645. [Google Scholar] [CrossRef]
  25. Hatib, R.; Anwar, K.; Magga, R.; Astak, M.A.; Widhiyanuriyawan, D.; Wardoyo, W. Performance Enhancement of Dye Sensitized Solar Cell (DSSC) through TiO2/rGO Hybrid: Comprehensive Study on Synthesis and Characterization. J. Mech. Eng. Sci. Technol. (JMEST) 2024, 8, Article 11. Available online: https://citeus.um.ac.id/jmest/vol8/iss1/11 (accessed on 2 November 2025). [CrossRef]
  26. Rahman, M.Y.A.; Islam, R. Review of graphene and its modification as cathode for dye-sensitized solar cells. J. Mater. Sci. Mater. Electron. 2021, 32, 1465–1480. [Google Scholar] [CrossRef]
  27. Liu, Y.; Li, Z. Degradation mechanisms of I/I3 electrolyte in dye-sensitized solar cells under thermal stress. J. Power Sources 2015, 285, 93–100. [Google Scholar]
  28. Grätzel, M. Stability issues in electrolytes of dye-sensitized solar cells. Acc. Chem. Res. 2017, 50, 448–455. [Google Scholar]
  29. Cai, C.-Y.; Tseng, S.-K.; Kuo, M.; Lin, K.-Y.A.; Yang, H.; Lee, R.-H. Photovoltaic Performance of a N719 Dye-Based Dye-Sensitized Solar Cell with Transparent Macroporous Anti-Ultraviolet Photonic Crystal Coatings. RSC Adv. 2015, 5, 102803–102810. [Google Scholar] [CrossRef]
  30. Tanifuji, N.; Shimizu, T.; Shimizu, A.; Shimizu, K.; Abe, K.; Tanaka, M.; Wang, H.; Yoshikawa, H. Stability Modification of Dye-sensitized Solar Cells by Ruthenium Dyes Embedded on Eggshell Membranes. Materials 2023, 16, 6654. [Google Scholar] [CrossRef]
  31. King, R.R.; Law, D.C.; Edmondson, K.M.; Fetzer, C.M.; Kinsey, G.S.; Yoon, H.; Sherif, R.A.; Karam, N.H. 40% Efficient Metamorphic GaInP/GaInAs/Ge Multijunction Solar Cells. Appl. Phys. Lett. 2007, 90, 183516. [Google Scholar] [CrossRef]
  32. Katsnelson, M.I. Graphene: Carbon in Two Dimensions. Mater. Today 2007, 10, 20–27. [Google Scholar] [CrossRef]
  33. Novoselov, K.S.; Geim, A.K.; Morozov, S.V.; Jiang, D.; Zhang, Y.; Dubonos, S.V.; Grigorieva, I.V.; Firsov, A.A. Electric Field Effect in Atomically Thin Carbon Films. Science 2004, 306, 666–669. [Google Scholar] [CrossRef]
  34. Ryndyk, D.A. Theory of Quantum Transport at Nanoscale: An Introduction; Springer Series in Solid-State Sciences; Springer: Berlin/Heidelberg, Germany, 2016; Volume 184. [Google Scholar] [CrossRef]
  35. Tsega, M. Structural and Optical Properties of Mn-Doped Anatase-Rutile TiO2 Nanoparticles. Indian J. Phys. 2025, 99, 177–189. [Google Scholar] [CrossRef]
  36. Montes-Zavala, J.; Méndez-Hernández, C.; Martínez-Magadán, J.M.; Cruz-Sosa, L.; Guerrero-Sánchez, C. Colloidal Stability of Graphene in Aqueous Medium: A Theoretical Approach Through Molecular Dynamics. J. Mol. Model. 2023, 29, 220. [Google Scholar] [CrossRef]
  37. Li, M.; Xie, L.-J.; Yi, Z.-L.; Liu, D.; Wang, Z.; Niu, R.-H.; Jia, H.; Kong, Q.-Q. Preparation of Reduced Graphene Oxide Films with High and Uniform Thickness for Electromagnetic Interference Shielding. Crystals 2024, 14, 322. [Google Scholar] [CrossRef]
  38. Novoselov, K.S.; Jiang, D.; Zhang, Y.; Morozov, S.V.; Stormer, H.L.; Zeitler, U.; Maan, J.C.; Boebinger, G.S.; Kim, P.; Geim, A.K. Electronic Properties of Graphene. Phys. Status Solidi B 2007, 244, 4106–4111. [Google Scholar] [CrossRef]
  39. Wei, L.; Kuo, P.K.; Thomas, R.L.; Anthony, T.R.; Banholzer, W.F. Thermal Conductivity of Isotopically Modified Single Crystal Diamond. Phys. Rev. Lett. 1993, 70, 3764–3767. [Google Scholar] [CrossRef]
  40. Wu, T.-C.; Huang, W.-M.; Meen, T.-H.; Tsai, J.-K. Performance Improvement of Dye-Sensitized Solar Cells with Pressed TiO2 Nanoparticles Layer. Coatings 2023, 13, 907. [Google Scholar] [CrossRef]
  41. Class for Physics of the Royal Swedish Academy of Sciences. Scientific Background on the Nobel Prize in Physics 2010: Graphene; Royal Swedish Academy of Sciences: Stockholm, Sweden, 2010; Available online: https://www.nobelprize.org/uploads/2018/06/advanced-physicsprize2010.pdf (accessed on 2 November 2025).
  42. Nair, R.R.; Blake, P.; Grigorenko, A.N.; Novoselov, K.S.; Booth, T.J.; Stauber, T.; Peres, N.M.R.; Geim, A.K. Fine Structure Constant Defines Visual Transparency of Graphene. Science 2008, 320, 1308. [Google Scholar] [CrossRef] [PubMed]
  43. Zhang, Q.; Cao, G. Nanostructured Photoelectrodes for Dye-Sensitized Solar Cells. Nano Today 2011, 6, 91–109. [Google Scholar] [CrossRef]
  44. Jankauskas, Š.; Gudaitis, R.; Vasiliauskas, A.; Guobienė, A.; Meškinis, Š. The Graphene Structure’s Effects on the Current-Voltage and Photovoltaic Characteristics of Directly Synthesized Graphene/n-Si (100) Diodes. Nanomaterials 2022, 12, 1640. [Google Scholar] [CrossRef]
  45. Antuch, M.; Grigoriev, S.A.; El Rouby, W.M.A.; Millet, P. Implementation of a TiO2/N719-Dye Photo-Anode in a DSSC and Performance Analysis. Russ. J. Electrochem. 2020, 56, 929–937. [Google Scholar] [CrossRef]
  46. Bendoni, R. Processi di Deposizione di Blocking Layers di TiO2 per Dye-Sensitized Solar Cells (DSSC). Master’s Thesis, Università di Bologna, Bologna, Italy, 2012. Available online: https://amslaurea.unibo.it/id/eprint/3041/ (accessed on 2 November 2025).
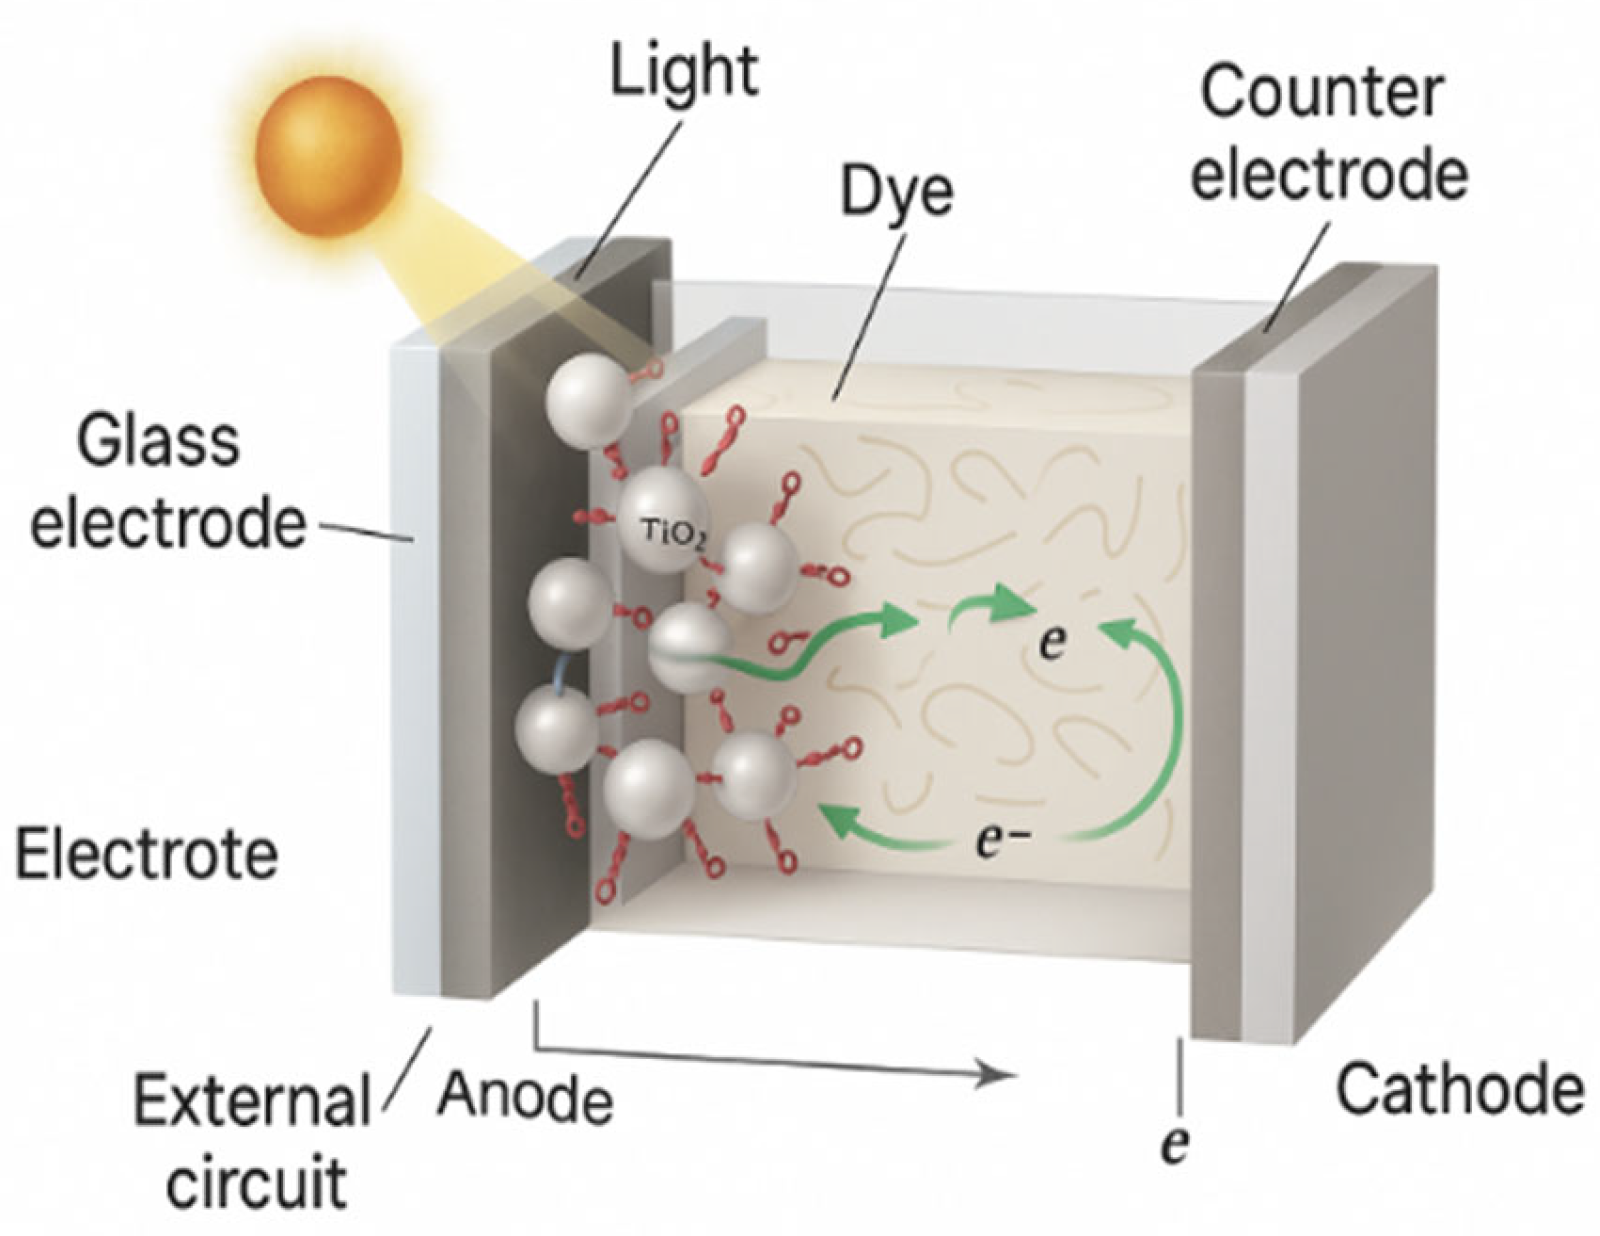
Figure 1. Operating principle and structure of a Grätzel cell (DSSC).
Jcs 09 00612 g001
Figure 2. National Renewable Energy Laboratory (NREL). 2025. “Best Research-Cell Efficiency Chart.” Image used with the author’s consent. https://www.nrel.gov/pv/cell-efficiency (Accessed on 10 July 2025).
Jcs 09 00612 g002
Figure 3. Graphene nanoplatelets in (a) commercial packaging and (b) powder format.
Jcs 09 00612 g003
Figure 4. Electronic device that uses a photodiode to measure light intensity and obtain information on current and voltage.
Jcs 09 00612 g004
Figure 5. Checking the conductivity of the FTO slide side with a non-conductive tester (A), the conductive slide side (B) and two slides placed on the workbench awaiting the application of the colloidal paste (C).
Jcs 09 00612 g005
Figure 6. Spin Coater WS-650 MZ-23NPP used in the laboratory.
Jcs 09 00612 g006
Figure 8. (a) DSSC (TiO2+ Dye N719+ electrolyte) with slide assembly. Anode and cathode with clips; (b) schematic of the dye-sensitized solar cell (DSSC).
Jcs 09 00612 g008
Figure 9. Variation in the maximum power current as a function of the maximum voltage in box (A); while in box (B) we have the short circuit current and open circuit voltage [31,32,33,34].
Jcs 09 00612 g009
Figure 10. SEM image of (a) Titanium dioxide; (b) Graphene.
Jcs 09 00612 g010
Figure 11. Spectroscopic curves of the lamp used and the AM 1.5G solar spectrum.
Jcs 09 00612 g011
Figure 12. Variation in current density (J) as a function of maximum power voltage (V) in DSSCs with different graphene concentrations (Gh).
Jcs 09 00612 g012
Figure 13. Trend of current at maximum power (Im) as a function of voltage at maximum power (Vm), measured on DSSCs with varying percentages of graphene (Gh). Im was experimentally measured over the active surface of each cell, and it is expressed as a current density in mA/cm2.
Jcs 09 00612 g013
Figure 14. Photovoltaic efficiency graph of cells with different graphene (Gh) concentrations as a function of voltage at maximum power.
Jcs 09 00612 g014
Figure 15. Photovoltaic efficiency as a function of FF in cells with varying graphene content.
Jcs 09 00612 g015
Figure 16. Transmittance as a function of wavelength in DSSCs with varying graphene content.
Jcs 09 00612 g016
Table 1. Functional property of graphene in colloidal paste with TiO2 [36].
Properties of GrapheneEffect in DSSC
High electrical conductivityPromotes rapid electron transport in TiO2
UV-vis absorptionIt contributes to the collection of light in synergy with the dye
Barrier effectReduces the recombination of electrons with the electrolyte
Two-dimensional structureImproves connectivity between TiO2 nanoparticles
Table 2. Amount of TiO2 and graphene (Gh) used for each cell made.
TiO2
[g] ± 0.0001
Gh
[g] ± 0.0001
Gh
[%]
3.10010.0
3.10050.00310.1
3.10040.00650.2
3.10030.01550.5
Table 3. Experimental parameters of spin coating.
Cells TypeQuantity of Solution
[mL]
Acceleration
[rpm/s]
Speed
[rpm]
Baking
[°C × min]
TiO2 + 0% Gh5700150060 °C × 30 min
TiO2 + 0.1% Gh5700150060 °C × 30 min
TiO2 + 0.2% Gh5700150060 °C × 30 min
TiO2 + 0.5% Gh5700150060 °C × 30 min
Table 4. Composition of materials used on FTO slides for DSSC formation, specifying anode and counter electrode.
Samples on FTO SlidesDescriptionFunctionality
Anode—FTO + TiO2 + Dye N719FTO (conductive and transparent) slide coated with TiO2 and organic dyeAbsorbs light and generates electrons
Anode—FTO + TiO2 + Gh + Dye N719FTO (conductive and transparent) slide coated with TiO2, graphene and organic dyeIt generates electrons and the addition of graphene should improve light absorption
Counter electrode—FTO + PlatinumFTO slide with thin platinum layerFacilitates electron transfer and regeneration by dye
Table 5. Characteristic parameters required for measuring the efficiency of the photovoltaic cell.
Characteristic ParametersSymbolUnit
Current densityJscmA/cm2
Short-circuit currentIscmA
Open-circuit voltageVocV
Voltage and current at maximum power per unit areaVm, ImV, mA/cm2
Active cell areaAcm2
Incident powerPinmW/cm2
Table 6. Photovoltaic parameters (Voc, FF, Vm, Jsc, Im) measured at different concentrations of Gh (%). Values are reported as mean ± standard deviation to reflect the variability across multiple measurements. The experiments were carried out under an irradiation of 70 mW/cm2, which corresponds to the incident power of the lamp used.
% GhVoc
[V]
FFVm
[V]
Jsc
[mA/cm2]
Im *
[mA/cm2]
0.00.75 ± 0.020.720.54 ± 0.0420.20 ± 2.6214.54 ± 2.62
0.10.78 ± 0.030.780.61 ± 0.0525.30 ± 2.7419.73 ± 2.54
0.20.76 ± 0.020.760.58 ± 0.0523.10 ± 2.5117.56 ± 2.60
0.50.72 ± 0.030.700.50 ± 0.0418.50 ± 2.7112.95 ± 2.69
* Im was experimentally measured over the active surface of each cell, and it is expressed as a current density in mA/cm2.
Table 7. Photovoltaic parameters of DSSCs with varying graphene concentrations and relative changes compared to the reference cell (0.0% Gh).
DSSC Typeη
[%]
Percentage Increase
in Efficiency Δη
[%]
Voc
[V]
Δ Voc
[%]
Jsc
[mA/cm2]
Δ Jsc
[%]
FFΔ FF
[%]
0.0% Gh11.10.75 ± 0.0220.20 ± 2.620.72
0.1% Gh15.2+37%0.78 ± 0.034%25.30 ± 2.7425%0.788%
0.2% Gh13.4+21%0.76 ± 0.021%23.10 ± 2.5114%0.766%
0.5% Gh9.2–17%0.72 ± 0.03–4%18.50 ± 2.71–8%0.7–3%
Disclaimer/Publisher’s Note: The statements, opinions and data contained in all publications are solely those of the individual author(s) and contributor(s) and not of MDPI and/or the editor(s). MDPI and/or the editor(s) disclaim responsibility for any injury to people or property resulting from any ideas, methods, instructions or products referred to in the content.