Article

Study on the Mechanical Properties and Fracture Mechanisms of Anchor Cable Specimen Materials

1
College of Civil Engineering and Architecture, Xiamen University of Technology, Xiamen 361024, China
2
Engineering Research Center of Structure Crack Control for Major Project, Fujian Province University, Xiamen 361024, China
3
Xiamen Chengzhi New Materials Technology Co., Ltd., Xiamen 361006, China
4
Xiamen Jiehang Engineering Testing Technology Co., Ltd., Xiamen 361006, China
5
Fujian Academy of Building Sciences Co., Ltd., Fuzhou 350108, China
*
Author to whom correspondence should be addressed.
J. Compos. Sci. 2025, 9(9), 508; https://doi.org/10.3390/jcs9090508
Submission received: 21 August 2025 / Revised: 15 September 2025 / Accepted: 16 September 2025 / Published: 19 September 2025

Abstract

This study investigated the tensile behaviors of 12.70 mm and 15.20 mm diameter anchor cable specimens with ultimate tensile strengths of 1860 MPa and their material specimens through experiments and finite element (FE) simulations. Material specimens and anchor cable specimen tensile samples were prepared, and the complete engineering stress–strain curves were obtained via uniaxial tensile tests. FE analysis was used to simulate the uniaxial tensile tests, and the applicability of different constitutive models for describing the true stress–strain relationships was evaluated by comparing the simulated and experimental engineering stress–strain curves. The results showed that the Ludwik, Hollomon, and Swift models, fitted using the pre-necking hardening stage, overestimated the post-necking true stress, while the Voce model underestimated it. In contrast, the Ling and Swift + Voce models provided accurate post-necking true stress predictions. Based on the Ling model and the Rice and Tracey fracture criterion, the load–displacement relationship and fracture behavior of the 12.7 mm anchor cable specimen were best described with W = −0.1 and a = 2, whereas W = −0.1 and a = 3 yielded optimal predictions for the 15.2 mm anchor cable specimen.

1. Introduction

Anchor cable technology, as a mature method in geotechnical engineering support, is widely used in tunnel, slope, and foundation pit projects. It demonstrates significant economic advantages [1,2,3]. In such projects, anchor cables are primarily employed to provide tensile forces for structural stabilization. For instance, they are used in roadways to prevent surrounding rock collapse, in slope engineering to mitigate slope sliding, and in foundation pit projects to support pit walls against soil collapse. With social economic development and the expansion of construction projects, the demand for urban underground space continues to grow. However, upon completion of existing support works, numerous anchor cables remain embedded underground, posing significant impediments to subsequent underground space development. The long-term performance of anchor cables in geotechnical support systems—particularly their tensile strength and fracture mechanisms—is critical in ensuring structural safety and stability. Consequently, investigating the mechanical properties and fracture behaviors of anchor cables during service, along with their post-project long-term durability, carries substantial theoretical and practical significance. Therefore, studying the true stress–strain relationships and fracture criteria of anchor cables through experiments and detailed finite element (FE) simulations [4] is of great theoretical and practical significance in understanding their mechanical properties and fracture mechanisms.
In recent years, scholars around the world have conducted extensive research on the mechanical properties and failure behaviors of anchor cables. Songling Xue et al. [5] studied the fracture characteristics of high-strength anchor cables under random corrosion. Through tensile tests, they obtained a constitutive model for steel wires with different corrosion levels. Using Python (Python 2.0, CWI, Amsterdam, The Netherlands) and Fortran (Fortran2008, SC22, Geneva, Switzerland) they developed a random corrosion model and analyzed the impact of corrosion on the failure modes of anchor cables. The results showed that corrosion reduces the ultimate strength and fracture strain of an anchor cable, making it brittle and significantly decreasing the fracture force.
Maricely de Abreu et al. [6] studied the fracture behaviors of high-strength low-carbon duplex stainless-steel anchor cables under transverse and longitudinal loads. They found that the bidirectional loads had a significant impact on the tensile and fatigue properties of the anchor cables. Xing Gao et al. [7] used the FLAC3D (FLAC3D v7.0, Inc., Minneapolis, MN, USA) software to study the dynamic responses of anchor cable failure modes (including anchorage failure, grout failure, and bolt fracture failure) under different seismic intensities and their impact on slope stability. Zhao Chen [8] proposed non-concrete failure modes of mechanical anchors in concrete under tension, focusing on the formation mechanisms of pull-out, pull-through, and composite failure modes, as well as a prediction model for the ultimate tensile strength. Feng Chao [9] studied the shear failure mechanism of 1 × 7 − Ø17.8 mm prestressed anchor cables in the free section through experiments, theoretical analysis, and numerical simulations. He revealed the coupled growth characteristics of the axial and shear forces under joint surface shear, as well as the tensile–shear composite failure mode.
Shi Mingfeng [10] investigated the fracture behavior of 7 × 19 IWS anchor cables in reinforced-concrete (RC) reinforcement beams. He analyzed the bending performances and fatigue responses under different prestress levels. The results showed no significant fatigue failure after 2 million fatigue load cycles. Zhao Guohao [11] conducted 31 shear failure tests to investigate the shear failure mechanism of pretensioned, prestressed concrete hollow slab beams under bond loss of the anchor cables, revealing that bond failure of anchor cables is a significant failure mode of hollow slab beams.
In summary, previous research primarily focused on the fracture behaviors of anchor cables under various conditions, such as those involving corrosion, biaxial loading, and seismic effects, as well as the non-concrete failure modes of mechanical anchorages in concrete and the shear failure mechanisms of prestressed anchor cables. However, no study has yet thoroughly explored the true stress–strain relationships and fracture criteria of anchor cable materials.
Researchers worldwide have conducted research on mathematical models for steel materials to describe the stress–strain relationships after necking. An accurate mathematical expression of the true stress–strain relationship is crucial for predicting large deformations and ductile fractures in anchor cables. The engineering stress–strain curves of steel materials are typically obtained from tensile specimen tests, and the engineering stress–strain relationships before necking can be directly converted into the true stress–strain relationships. Over the past several decades, numerous mathematical expressions have been employed to characterize the true stress–strain relationship of post-necking steel, including the Hollomon model [12], Voce model [13], Ludwik unsaturated extrapolation model [14], Swift diffuse necking model [15], and Ling combined linear-power law model [16]. Ling proposed using a combined linear and power function relationship to describe this post-necking behavior and validated the true stress–strain relationship through FE analysis.
When studying the plastic fracture behaviors of anchor cable materials, it is crucial to accurately input the material’s plastic properties and select an appropriate fracture criterion. Coupled damage models can effectively link the plastic response with the fracture criteria, but their parameter calibration is complex and requires extensive experimental validation. For instance, Wang et al. [17] proposed an extended Gurson–Tvergaard–Needleman (GTN)–Thomason model that accounts for the effect of dynamic recrystallization on void evolution to predict the ductile fracture behavior of Fe–Cr–Mo–Mn steel. Bao and Wierzbicki [18] suggested that in high-stress-triaxiality η regimes, fracture is primarily caused by void nucleation, whereas in low-triaxiality regions, it may develop through a combination of shear and void growth. Yang et al. [4] employed this model to investigate the failure mechanisms in steel under tension and revealed the correlation between thread stripping and manufacturing processes.
Compared to coupled damage models, uncoupled models can independently handle the material plasticity and fracture criteria, with relatively simpler parameter calibration requiring only partial experimental validation. Typical uncoupled fracture criteria include the modified Mohr–Coulomb (MMC) criterion [19], Lou’s series of models [20,21,22,23,24,25], and the Hosford–Coulomb model [26,27]. The MMC criterion, developed based on the Mohr–Coulomb model, was initially designed for characterizing fracture in geological materials like rock and soil, but it has been successfully applied to various metals (e.g., aluminum alloys, magnesium sheets, and titanium alloys). Lou’s models are based on microscopic mechanisms of void nucleation, growth, and shear coalescence, while the Hosford–Coulomb model assumes that ductile fracture initiation coincides with the formation of localization bands at the micro- or meso-scale. Both models demonstrate good performances in predicting the ductile fracture behaviors of metallic materials. In steel fracture studies, the Rice and Tracey (R-T) model [28,29] particularly emphasizes the influence of the stress triaxiality η on the fracture strain. It indicates that the fracture strain decreases with increasing stress triaxiality η and establishes an exponential relationship between them. With only a single parameter involved, this model maintains remarkable simplicity.
In this study, 4.3 and 5.2 mm diameter material specimens and 12.7 and 15.2 mm diameter anchor cables were investigated, all with ultimate tensile strengths of 1860 MPa. Using combined experimental and FE methods, we examined the load–displacement relationships of the anchor cables and the true stress–strain relationships of the material specimens, along with their fracture criteria. We evaluated the applicability of the Ludwik, Hollomon, Voce, Swift, Ling, and Swift+Voce models for describing the true stress–strain relationships. The FE simulation results were compared with experimental engineering stress–strain curves through standard deviation and correlation coefficient analyses. The ductile fracture (R-T) model was implemented in the FE simulations to predict specimen fracture. Finally, the validated true stress–strain models and the R-T fracture criterion were applied to study the anchor cable load–displacement behaviors, revealing their tensile mechanisms. This study pioneers the integration of classical steel material models, including Ludwik and Hollomon, with Ling’s expression to characterize the post-necking true stress–strain relationship of anchor cables, and establishes a failure prediction method based on the R-T fracture criterion.

2. Experimental Program

2.1. Specimen Configuration

Table 1 lists the dimensions of the tensile and anchor cable specimens. The anchor cable specimens had seven-wire single-strand anchor cable structures with nominal diameters of 12.70 and 15.20 mm (actual diameters: 12.71 and 15.22 mm; deviations: 0.01 and 0.02 mm, respectively). All the specimens had lengths of 850 mm. Tensile tests were conducted on material specimens with two nominal diameters (4.30 and 5.20 mm; actual diameters—4.30 ± 0.00 mm and 5.20 ± 0.00 mm, respectively). The 270 mm long specimens were machined to create 24.00 mm long reduced sections with final diameters of 3.70 and 4.68 mm, respectively, ensuring fracture occurred within the extensometer measurement range. All specimens exhibited diameter variations within ±0.02 mm, with maximum relative errors below 0.22%.
Figure 1a,b show the geometric configurations of the tensile and anchor cable specimens, respectively. The key dimensions were L0 (total length), Lc and Lk (clamped and machined section lengths, respectively), R (radius of machined region), and d0 (nominal diameter). Previous studies [30] demonstrated that the gauge length of the test specimen significantly influences the stress–strain curve measurements during the post-necking phase. Accordingly, a standard 50 mm gauge length was employed in this study to determine the engineering stress–strain curves for both anchor cable specimen diameters.

2.2. Tensile Specimen Test Set-Up and Results

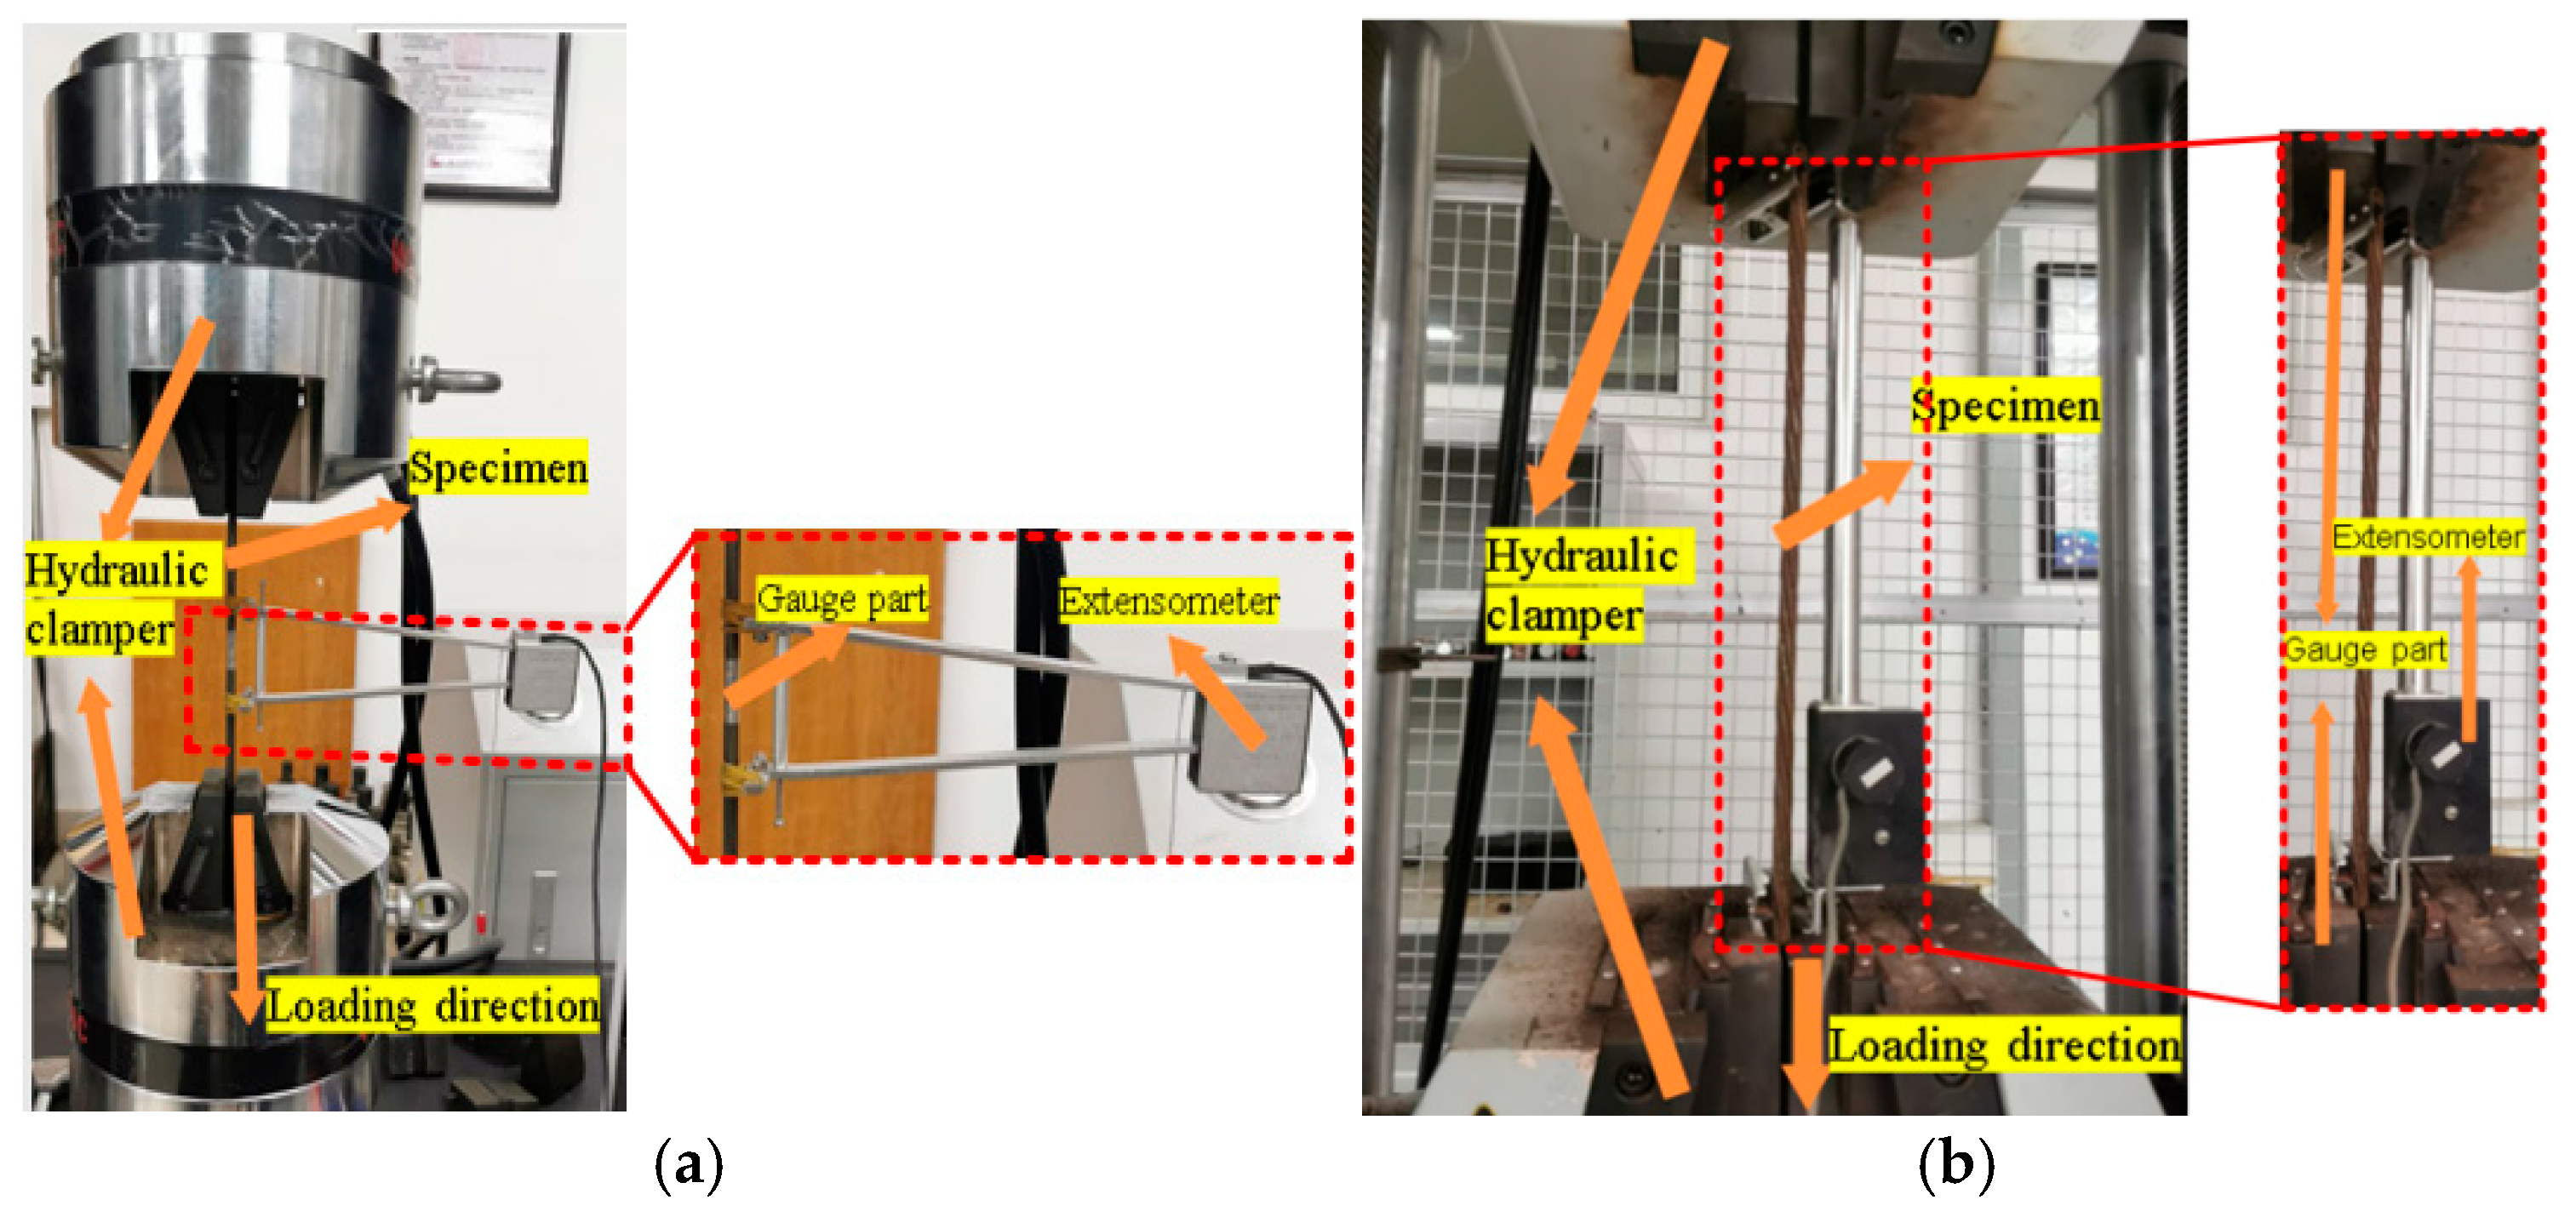
Figure 2a shows the material testing setup, where a 100 kN universal testing machine [31] was used for the experiments. The tests were conducted according to the GB/T 228-2015 standard [32], with the specimen ends secured by hydraulic grips. Vertical loading was applied through the upper grip at a displacement-controlled rate of 0.50 mm/min. An extensometer was used to measure specimen deformation, with a 50.00 mm gauge length, 25.00 mm measurement range, and 0.0018 mm resolution. The extensometer was removed after specimen fracture, and the complete engineering stress–strain curves were obtained.
Figure 3a,b present the complete engineering stress–strain curves for tensile specimens a and b, respectively. The engineering stress was calculated as the tensile force divided by the initial cross-sectional area of the parallel section, while the engineering strain was determined as the extensometer elongation divided by its gauge length. All tensile specimens fractured within the machined parallel section. During initial loading, the specimen exhibited elastic behavior until the engineering stress–strain relationship became nonlinear and reached the ultimate strength. Necking initiated in the parallel section, after which the engineering stress decreased until final fracture occurred.
All the tensile specimens fractured within the parallel section during material testing, as shown in Figure 4. These experimental results were suitable for analyzing the true stress–strain relationships and fracture characteristics. Table 2 presents the mechanical properties of the a and b material specimens, including the elastic modulus E, yield stress fy, defined at a 0.2% plastic deformation [30], ultimate stress fu, taken as the yield limit, fracture strain εf, indicating the deformation capacity, and elongation δ. Both specimen types exhibited ultimate stresses exceeding their tensile strengths.

2.3. Anchor Cable Specimen Test Set-Up and Results

Figure 2b shows the tensile testing setup for the anchor cable specimens with the 1000 kN universal testing machine [31]. The anchor cable specimen tensile tests were conducted according to GB/T 228-2015. Anti-slip tabs were installed at both ends to enhance the friction between the specimen and the testing apparatus. Hydraulic grips constrained the specimen while vertical loading was applied through the upper grip at a displacement-controlled rate of 1.00 mm/min. An extensometer with 500.00 mm gauge length and 0.50 mm resolution (500.00 mm range) measured the deformation until specimen fracture, yielding complete load–displacement curves.
Figure 5a,b present the load–displacement curves of anchor cable specimens A and B, respectively. During initial loading, both specimens exhibited elastic behavior, followed by nonlinear strain hardening until reaching the ultimate strength. Both specimens demonstrated similar failure behaviors, with the outer wires fracturing first followed by the inner wires.
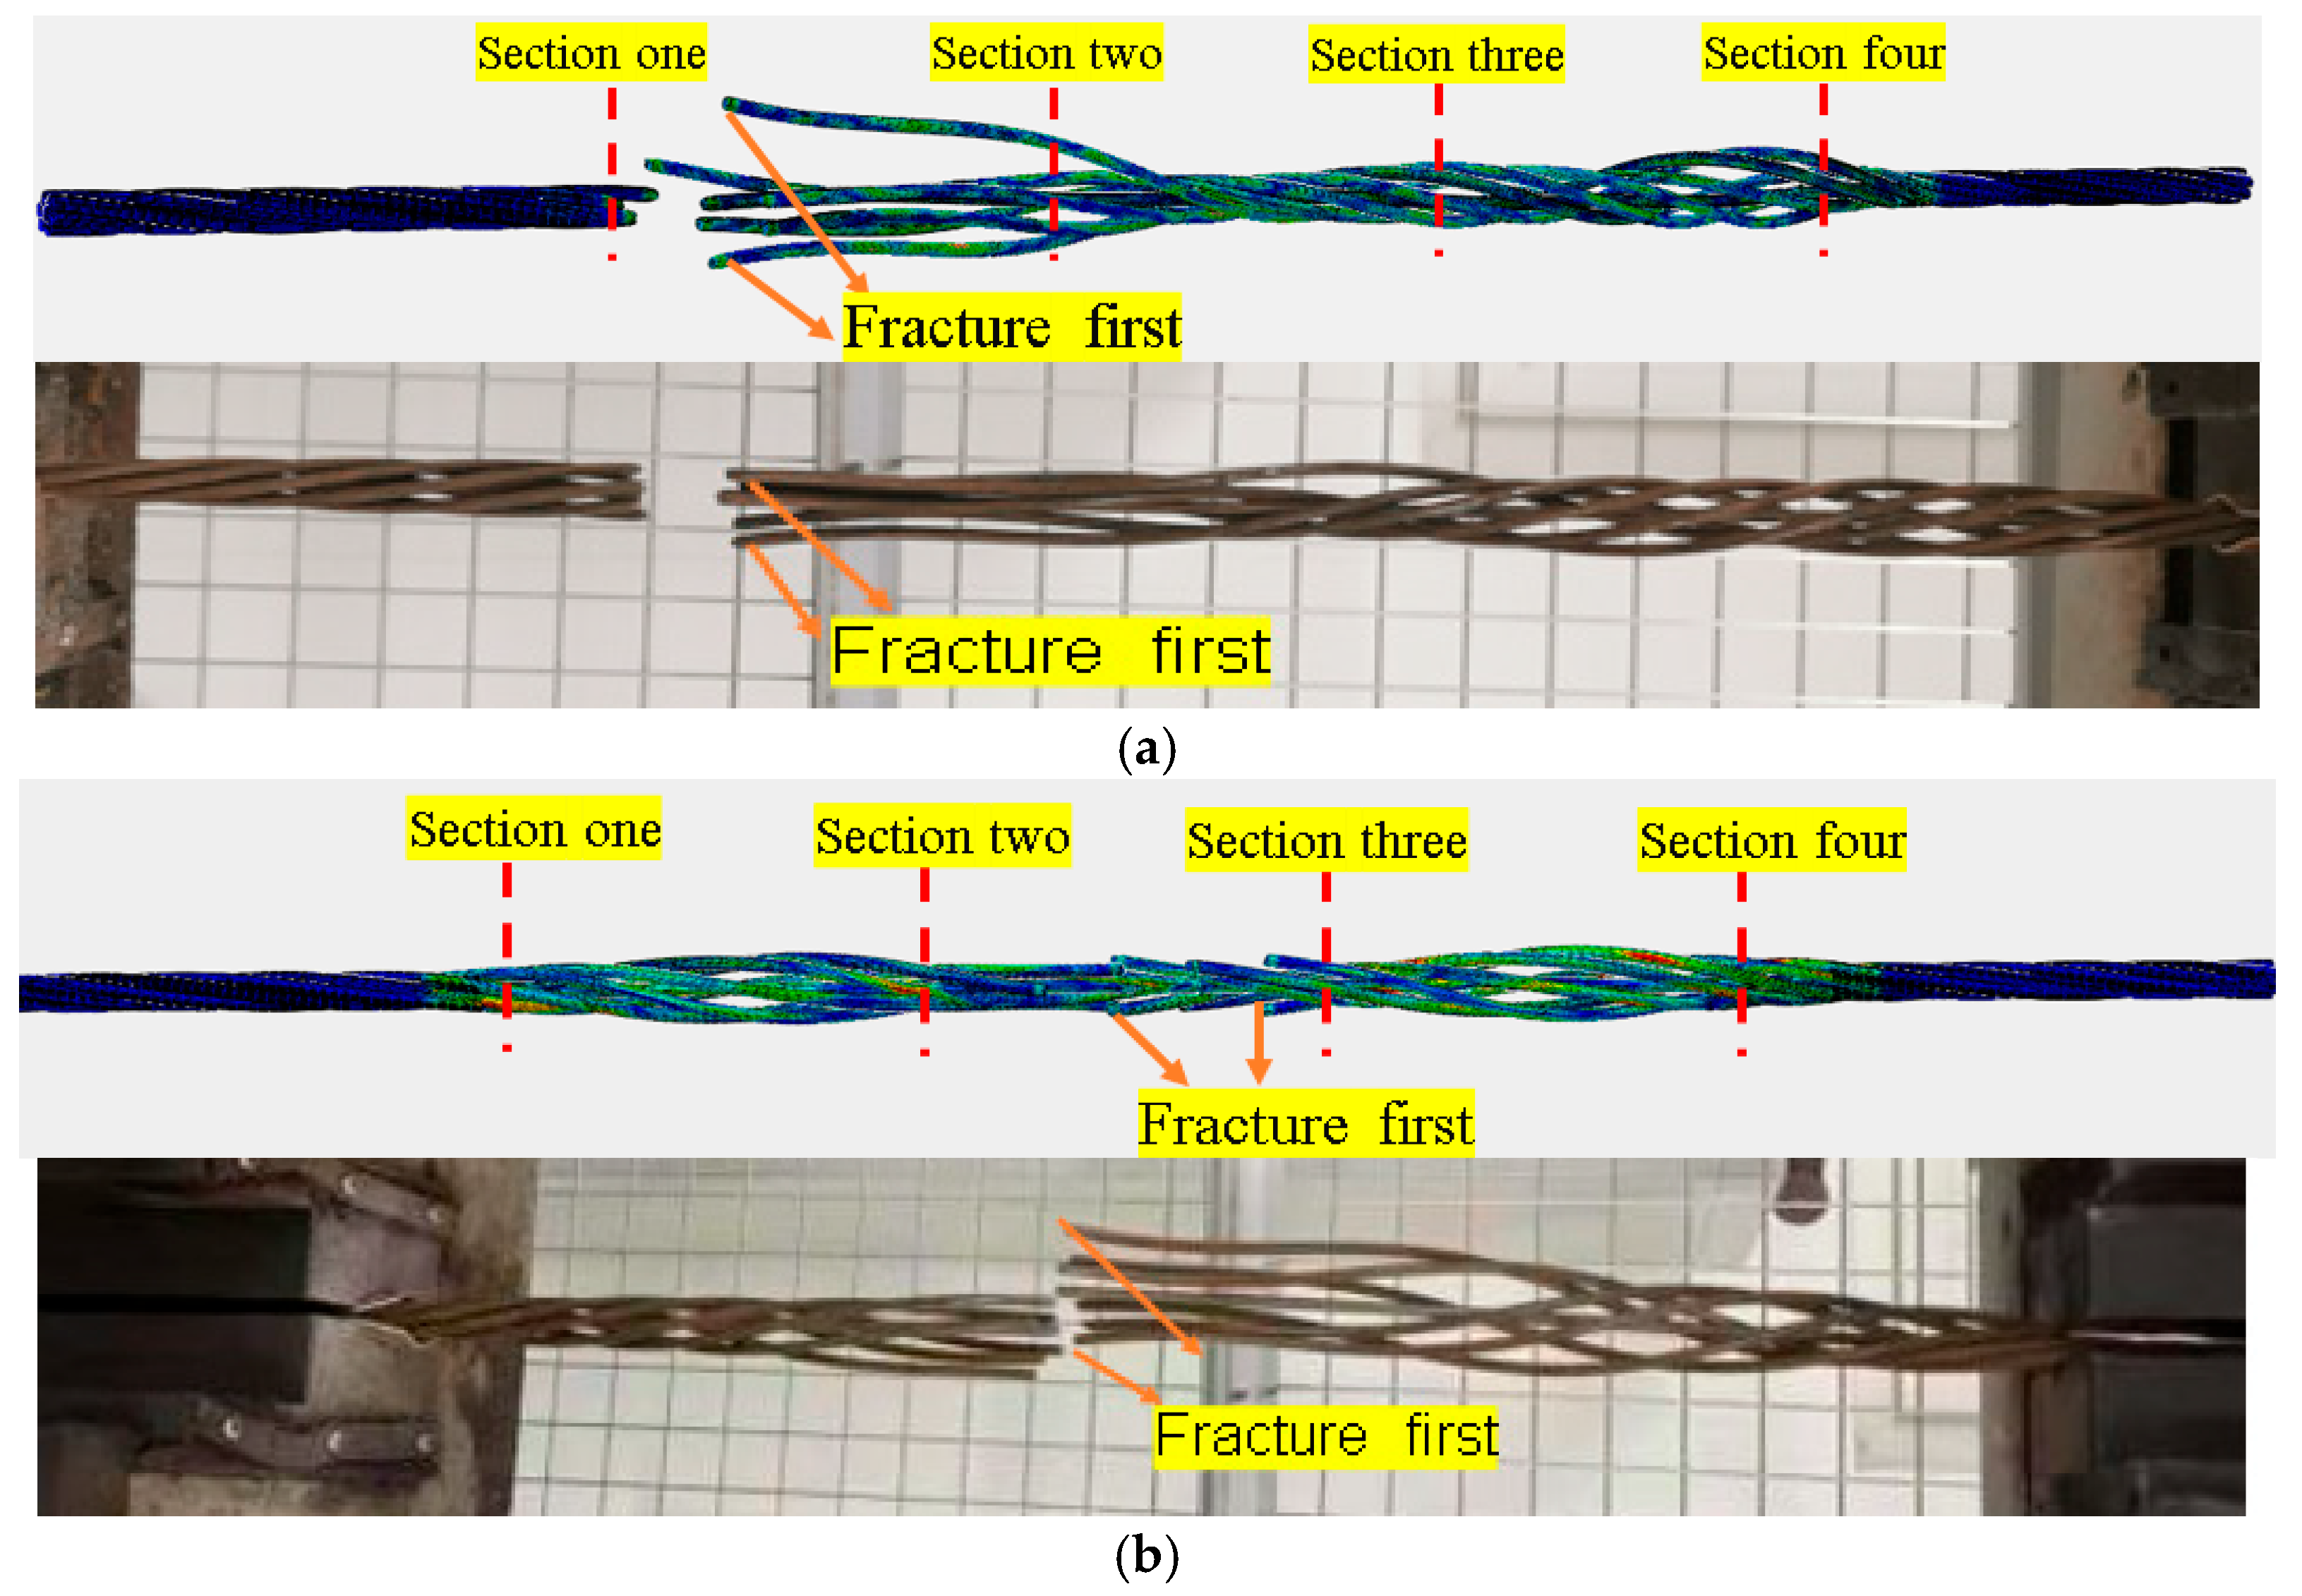
All anchor cable specimens fractured within the extensometer measurement range during tensile testing, as shown in Figure 6. Table 3 summarizes the ultimate load Fu and ultimate displacement ΔX values for anchor cable specimens A and B obtained from the load–displacement curve analysis. The average ultimate load Fu was 195.7 kN for anchor cable specimen A and 268.99 kN for anchor cable specimen B. The average ultimate displacement ΔX was 32.04 mm for anchor cable specimen A and 35.07 mm for anchor cable specimen B.

3. Finite Element (FE) Simulation

3.1. FE Model

The tensile tests were simulated using Abaqus [33]. Figure 7 shows the FE model, which replicated the actual specimen dimensions: total length L0 of 500 mm for both specimen types, gripped length Lc of 50 mm, and machined section length Lk of 14 mm. The machined radius R was 3.70 mm for tensile specimen and 4.68 mm for tensile specimen b, with nominal diameters d0 of 4.3 and 5.2 mm, respectively.
Figure 8 presents the FE model for the anchor cable specimen test, which had the same dimensions as the actual specimen. The total length Ls was 850 mm for both types, and the extensometer-measured length Ld was 500 mm for both. The whole anchor cable specimen diameter ds was 12.7 mm for anchor cable specimen A and 15.2 mm for anchor cable specimen B. The individual wire diameter d0 was 4.3 mm for anchor cable specimen A and 5.2 mm for anchor cable specimen B. The mesh size and material properties matched those of the material test specimen. To simulate frictional effects between the wires, the contact properties were set with a friction coefficient of 0.2 and “hard” normal behavior [34].
The ABAQUS software (ABAQUS2023, Dassault Systèmes, Vélizy-Villacoublay, France)was employed to simulate the tensile tests of the specimens. In previous FE simulations of steel material tests [35], a sensitivity analysis revealed that a mesh size of 1.00 mm overestimated the engineering stress and strain after necking, whereas mesh sizes of 0.50 and 0.25 mm accurately captured the post-necking behavior. The computational time for the 0.50 mm mesh model was only one-fourth of that for the 0.25 mm mesh model. Therefore, a mesh size of 0.5 mm was adopted for the parallel section of both the tensile and anchor cable specimens, while a coarser mesh size of 1.0 to 2.0 mm was used for the non-test sections to improve the computational efficiency.
The tensile test simulations of the material specimens under vertical displacement employed eight-node linear brick elements with reduced integration (C3D8R) for solid modeling. These elements are computationally efficient and suitable for large strain analyses. Two reference points (RP-1 and RP-2) were defined at the centroids of the two ends of the specimen. All degrees of freedom of the nodes on the end faces were kinematically coupled to their respective reference points to simulate the gripping conditions. The right reference point (RP-1) was fully constrained, while a smooth, displacement-controlled amplitude curve was applied to the left reference point (RP-2) to simulate the quasi-static loading. To improve computational efficiency while maintaining quasi-static conditions, a mass scaling factor was applied to limit the kinetic energy of the system to less than 5% of its internal energy throughout the simulation, ensuring dynamic effects were negligible. For quasi-static analysis of the tensile tests, the ABAQUS explicit solver was used with a target time increment of 0.001 s and a total loading time of 200 s. The von Mises yield criterion was adopted in the FE simulations to evaluate the mechanical behavior of the anchor cable specimen material. Isotropic hardening was assumed, defined by the true stress–strain curves derived from the Ling model (Section 3.3).
In the FE analysis, the engineering stress and strain were calculated using the relative deformation between two nodes located 50 mm apart (for material coupons) or 500 mm apart (for anchor cable specimens) to mimic the experimental extensometer setup. The reaction force at reference point RP-2 was used to represent the applied load. The simulated results were then compared with experimental data to validate the model’s accuracy.

3.2. True Stress–Strain Relationship Model

In the FE simulations of the tensile tests, the true stress–strain relationship needed to be input. The elastic stage could be characterized by Young’s modulus (E), while the strain-hardening stage needed to be calibrated by converting the engineering stress–strain data obtained from material tests. The relationships between the true and engineering stresses (σt and σe, respectively) and between the true engineering strains (εt and εe, respectively) are as follows:
σ t = σ e 1 + ε e ,
ε t = ln 1 + ε e ,
During the yielding stage, localized necking occurs in the tensile specimen, resulting in a non-uniform stress distribution within the necking region. Consequently, directly converting engineering stress–strain curves to true stress–strain relationships becomes invalid. Extrapolation methods using relevant stress–strain expressions are required to determine the post-necking behavior. These calibration approaches can be categorized into two types: single extrapolation models and material parameter models.
A single extrapolation model fits the material parameters using the strain hardening curve from the pre-necking stage to derive the true stress–strain relationship after necking. Several representative models are presented below:
Ludwik’s model [14]:
In 1909, Ludwik introduced the first widely used stress–strain relationship model:
σ = σ y + A ε p n ,
where σy is the yield strength, εp is the plastic strain, and A and n are fitting parameters
Hollomon’s model [12]:
In 1945, Hollomon, while studying the tensile deformation of metal materials, removed the parameter σy (yield strength) from Ludwik’s expression to simplify it:
σ = A ε n ,
where ε represents the true strain.
Voce’s model [13]:
In 1948, Voce first proposed using an exponential function to describe the strain hardening behaviors of metal materials:
σ = σ y + A [ 1 e x p ( B ε p ) ] ,
where A and B are fitting parameters.
Swift’s model [15]:
In 1952, Swift proposed a power-law strain hardening model based on Hollomon’s model:
σ = A ( ε y + ε p ) n ,
A material parameter model uses the stress–strain state at the necking onset as the calibration reference point, combined with FE simulations to verify the true stress–strain relationship. The Ling model [16] was developed to determine the post-necking true stress–strain relationship in tensile tests by calibrating the model curve using a weighting factor W. After necking, material plastic deformation becomes localized within a small region, making conventional stress–strain curves inadequate for accurate material characterization. Yajun Zhang [35] employed a Swift–Voce combined weighting model for steel materials, which can accurately describe the true stress–strain relationship through calibration with a weighting factor K. The models for simulating a material’s plastic behavior are as follows.
Ling model.
In 1996, Ling proposed a weighted averaging method to calibrate the post-necking true stress–strain relationship of metallic materials:
σ = W ( a ε t + b ) + 1 W K ε t n ,
where W, a, b, K, and n are material parameters.
Swift-Voce weighting model.
A previous study [35] compared FE analysis results with measured engineering stress–strain curves of tensile specimens. The results showed that the engineering stress–strain curve calculated by the Swift model was higher than the actual measured values. The Voce model tended to saturate under large deformations. This led to lower calculated engineering stress–strain curves. To address this issue, a weighting factor K was introduced. It linearly combined the Swift and Voce models, as follows:
σ = k [ A ( ε y + ε p ) n ] + ( 1 k ) [ σ y + A ( 1 e x p ( B ε p ) ) ] ,
This combination describes the true stress–strain relationship of a material.

3.3. Fitting of True Stress–Strain Relationship

The post-necking true stress–strain relationships for tensile specimens a and b were extrapolated using the Ludwik, Swift, Voce, and Hollomon constitutive models. Both the Ling and Swift–Voce models successfully fitted the true stress–strain curves beyond the necking point for these specimens. Through calibration of the weighting factors W and K (with W = −0.1 and K = 0.5), both models effectively predicted the true stress–strain behavior after the ultimate stress point.
Figure 9 presents the true stress–strain curves of both tensile specimens obtained from the six constitutive models. The Ludwik, Hollomon, and Swift models, which are non-saturation extrapolation models with no upper stress limits, overestimated the post-necking true stress, showing continuously increasing stress values that ultimately exceeded the material’s actual stress. In contrast, the Voce model, which is a saturation extrapolation model with an upper stress limit, underestimated the post-necking true stress, as its fitted stress plateau approached but did not exceed the necking stress σn, whereas the actual post-necking stress should be higher than σn. Both the Ling model and the Swift–Voce combination model accurately captured the post-necking behavior, with their predicted stresses closely matching the actual true stresses of the necked specimen.
Figure 10 compares the FE results based on different true stress–strain models with the experimental data. The Ludwik model significantly overestimated the engineering stress–strain curve, and the Hollomon and Swift models also showed overestimation compared to the experimental results. Conversely, the Voce model underestimated the engineering stress–strain response. In contrast to both non-saturation and saturation fitting models, the extrapolation models (Ling and Swift+Voce) yielded engineering stress–strain curves that closely matched the experimental data.
Table 4 presents the standard deviations and correlation coefficients for the experimental engineering stress–strain data and FE simulation results from six constitutive models for both material specimens. For tensile specimen a and tensile specimen b, the Ludwik, Hollomon, Swift, and Voce models exhibited significantly larger standard deviations than the Ling and Swift–Voce models. The correlation coefficients of the Ling and Swift–Voce models were closer to 1 than those of the other four models, demonstrating their superior simulation accuracy.
Based on the comparison of the engineering stress–strain curves obtained using the different constitutive models, both the Ling and Swift+Voce models demonstrated superior calibration capabilities. Notably, the Ling model offers a simpler calibration procedure than the Swift+Voce model, making it more practical for engineering applications. Therefore, the Ling model was adopted for subsequent FE simulations.

3.4. Fracture Model

The ductile fracture criterion is not coupled with the material’s plastic response, and thus, independent calibration of both the true stress–strain relationship and the fracture criterion are required for the material specimen. The R-T model, also known as the void growth model (VGM), employs an exponential function to characterize crack formation:
ε f ( η ) = α e β · 1.5 ,
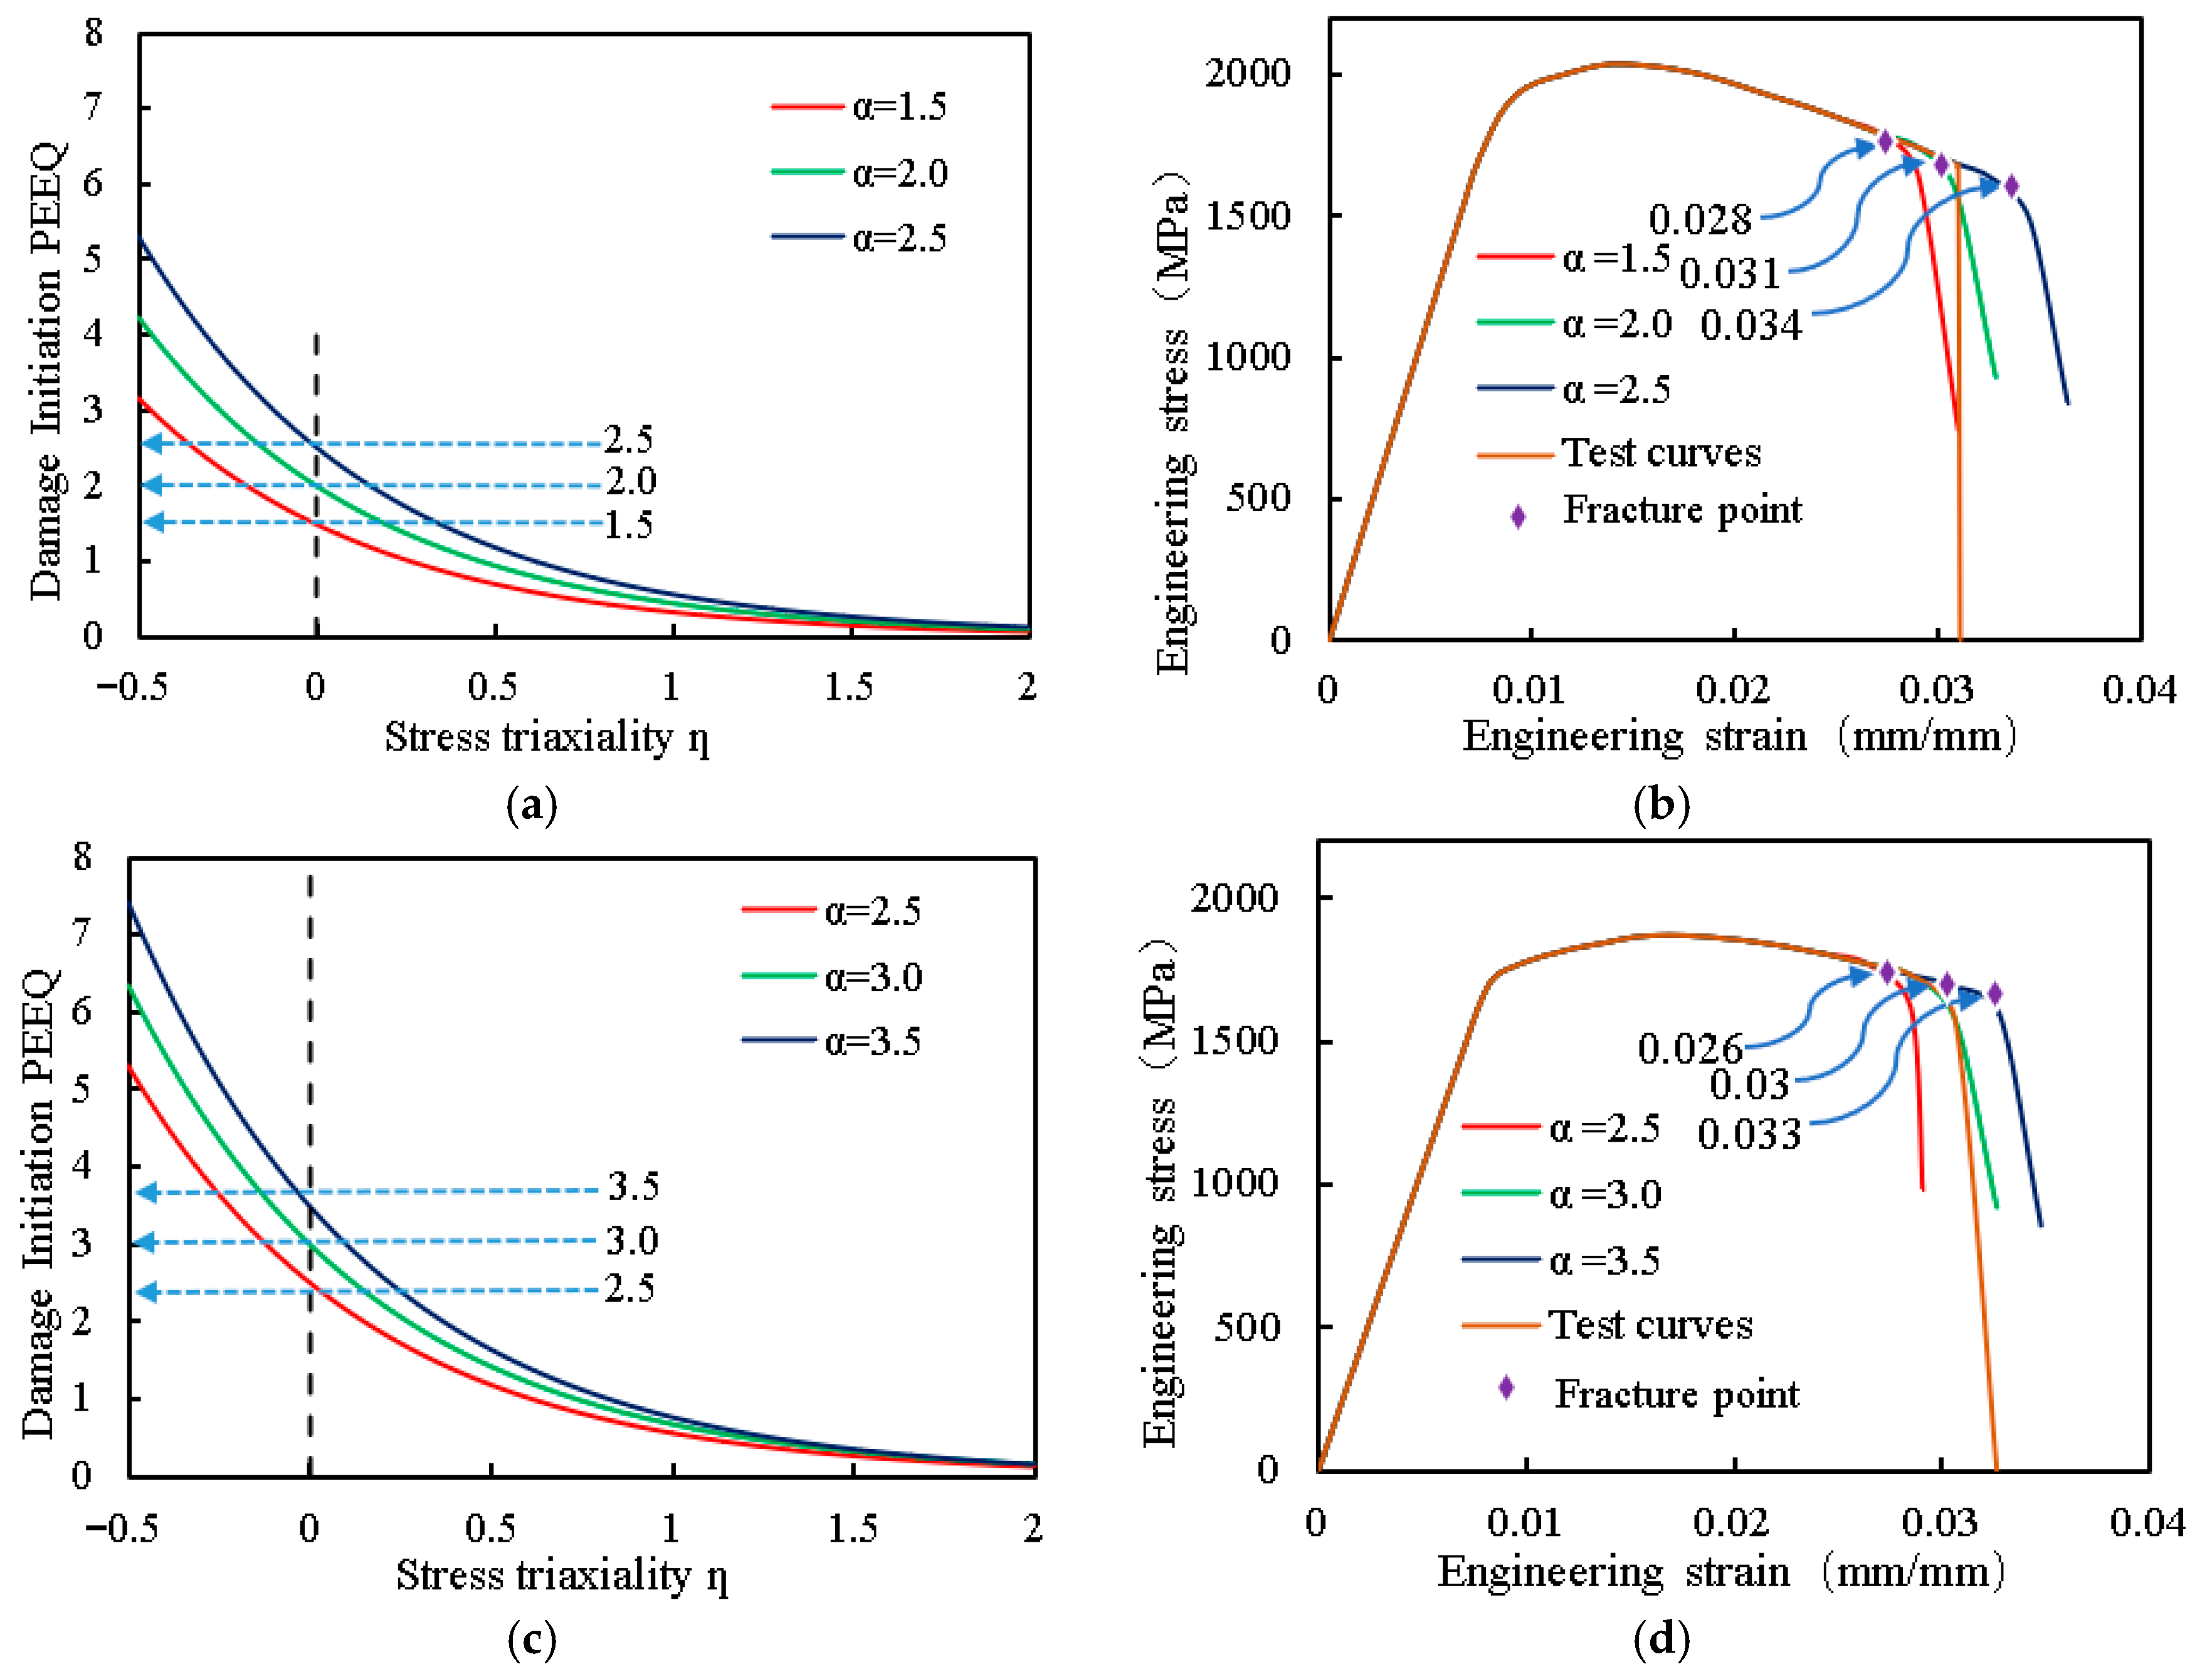
where εf represents the initial damage equivalent plastic strain (PEEQ) as a function of the stress triaxiality η, where α and β are material parameters. The parameter β was set to 1.5 based on previous studies [36,37], while α was obtained through tensile specimen tests. For the monotonic tensile specimens, the R-T model predicts fracture initiation through the combined effect of the fracture PEEQ and the stress triaxiality η in the necking region:
The fracture behavior of the tensile specimen was simulated using FE analysis by integrating the true stress–strain relationship derived from the Ling model with the calibrated parameters of the R-T fracture model. Figure 10 shows the fracture model and the corresponding engineering stress–strain curves. Figure 11 present the relationship between the initial damage PEEQ and stress triaxiality η for tensile specimens a and b, respectively. The results indicated that increasing the parameter α at a fixed stress triaxiality η enhanced the PEEQ, thereby increasing the material’s fracture strain. Through systematic investigation of the fracture parameter α for both specimen types, optimal values were determined: α = 2.0 for tensile specimen a yielded simulated fracture displacements consistent with the experimental measurements, while α = 3.0 achieved comparable accuracy for tensile specimen b.

3.5. Anchor Cable Specimen and Fracture Model

Figure 12 shows the material test results and the model predictions with various values of the material parameters in the Ling model for the true stress–strain and the R-T fracture model. The simulations of the specimen tensile tests showed the influence of different α values on the fracture displacement. For anchor cable specimen A, the fit was best when α = 2.0, while for anchor cable specimen B, the optimal fit occurred at α = 3.0.
Table 5 presents the FE results of anchor cable specimens A and B with different α values. Compared with the experimental data, the ratios of the ultimate loads obtained by the FE simulations and experiments (FE/EXP ratios) were 0.9967 and 0.9936 for specimens A and B, respectively, with corresponding standard deviations of 0.0030 and 0.0019. The FE/EXP ratios of the fracture displacement were 1.0046 and 1.0332 for specimens A and B, respectively, with corresponding standard deviations of 0.0319 and 0.0280. The near-zero standard deviations indicated close agreement between the simulation and experimental results. A comparative analysis of the fracture processes between the FE simulations and experimental tests of the anchor cable specimens, as presented in Figure 13a,b, revealed a high degree of consistency in both the fracture sequence and failure mode. The FE simulation results indicated that under tensile loading, the outer wires, influenced by geometric configuration and localized stress concentration, first reached the material’s fracture limit, exhibiting significant plastic strain localization and damage accumulation, which led to their preferential fracture. Subsequently, the center wire, deprived of load-sharing support from the outer wires, experienced a rapid increase in stress, ultimately resulting in its fracture. The fracture behavior observed in the experiments was in complete agreement with this sequence: the outer wires fractured prior to the center wire, which then failed subsequently. This consistency validates the effectiveness of the established FE model in predicting the tensile fracture mechanism of the anchor cable specimens, particularly its accurate capture of the critical phenomenon of preferential fracture of the outer wires.

4. Tensile Fracture Mechanism of Anchor Cable Specimen

4.1. Analysis of Stress Distribution of Monofilament in Anchor Cable Specimen

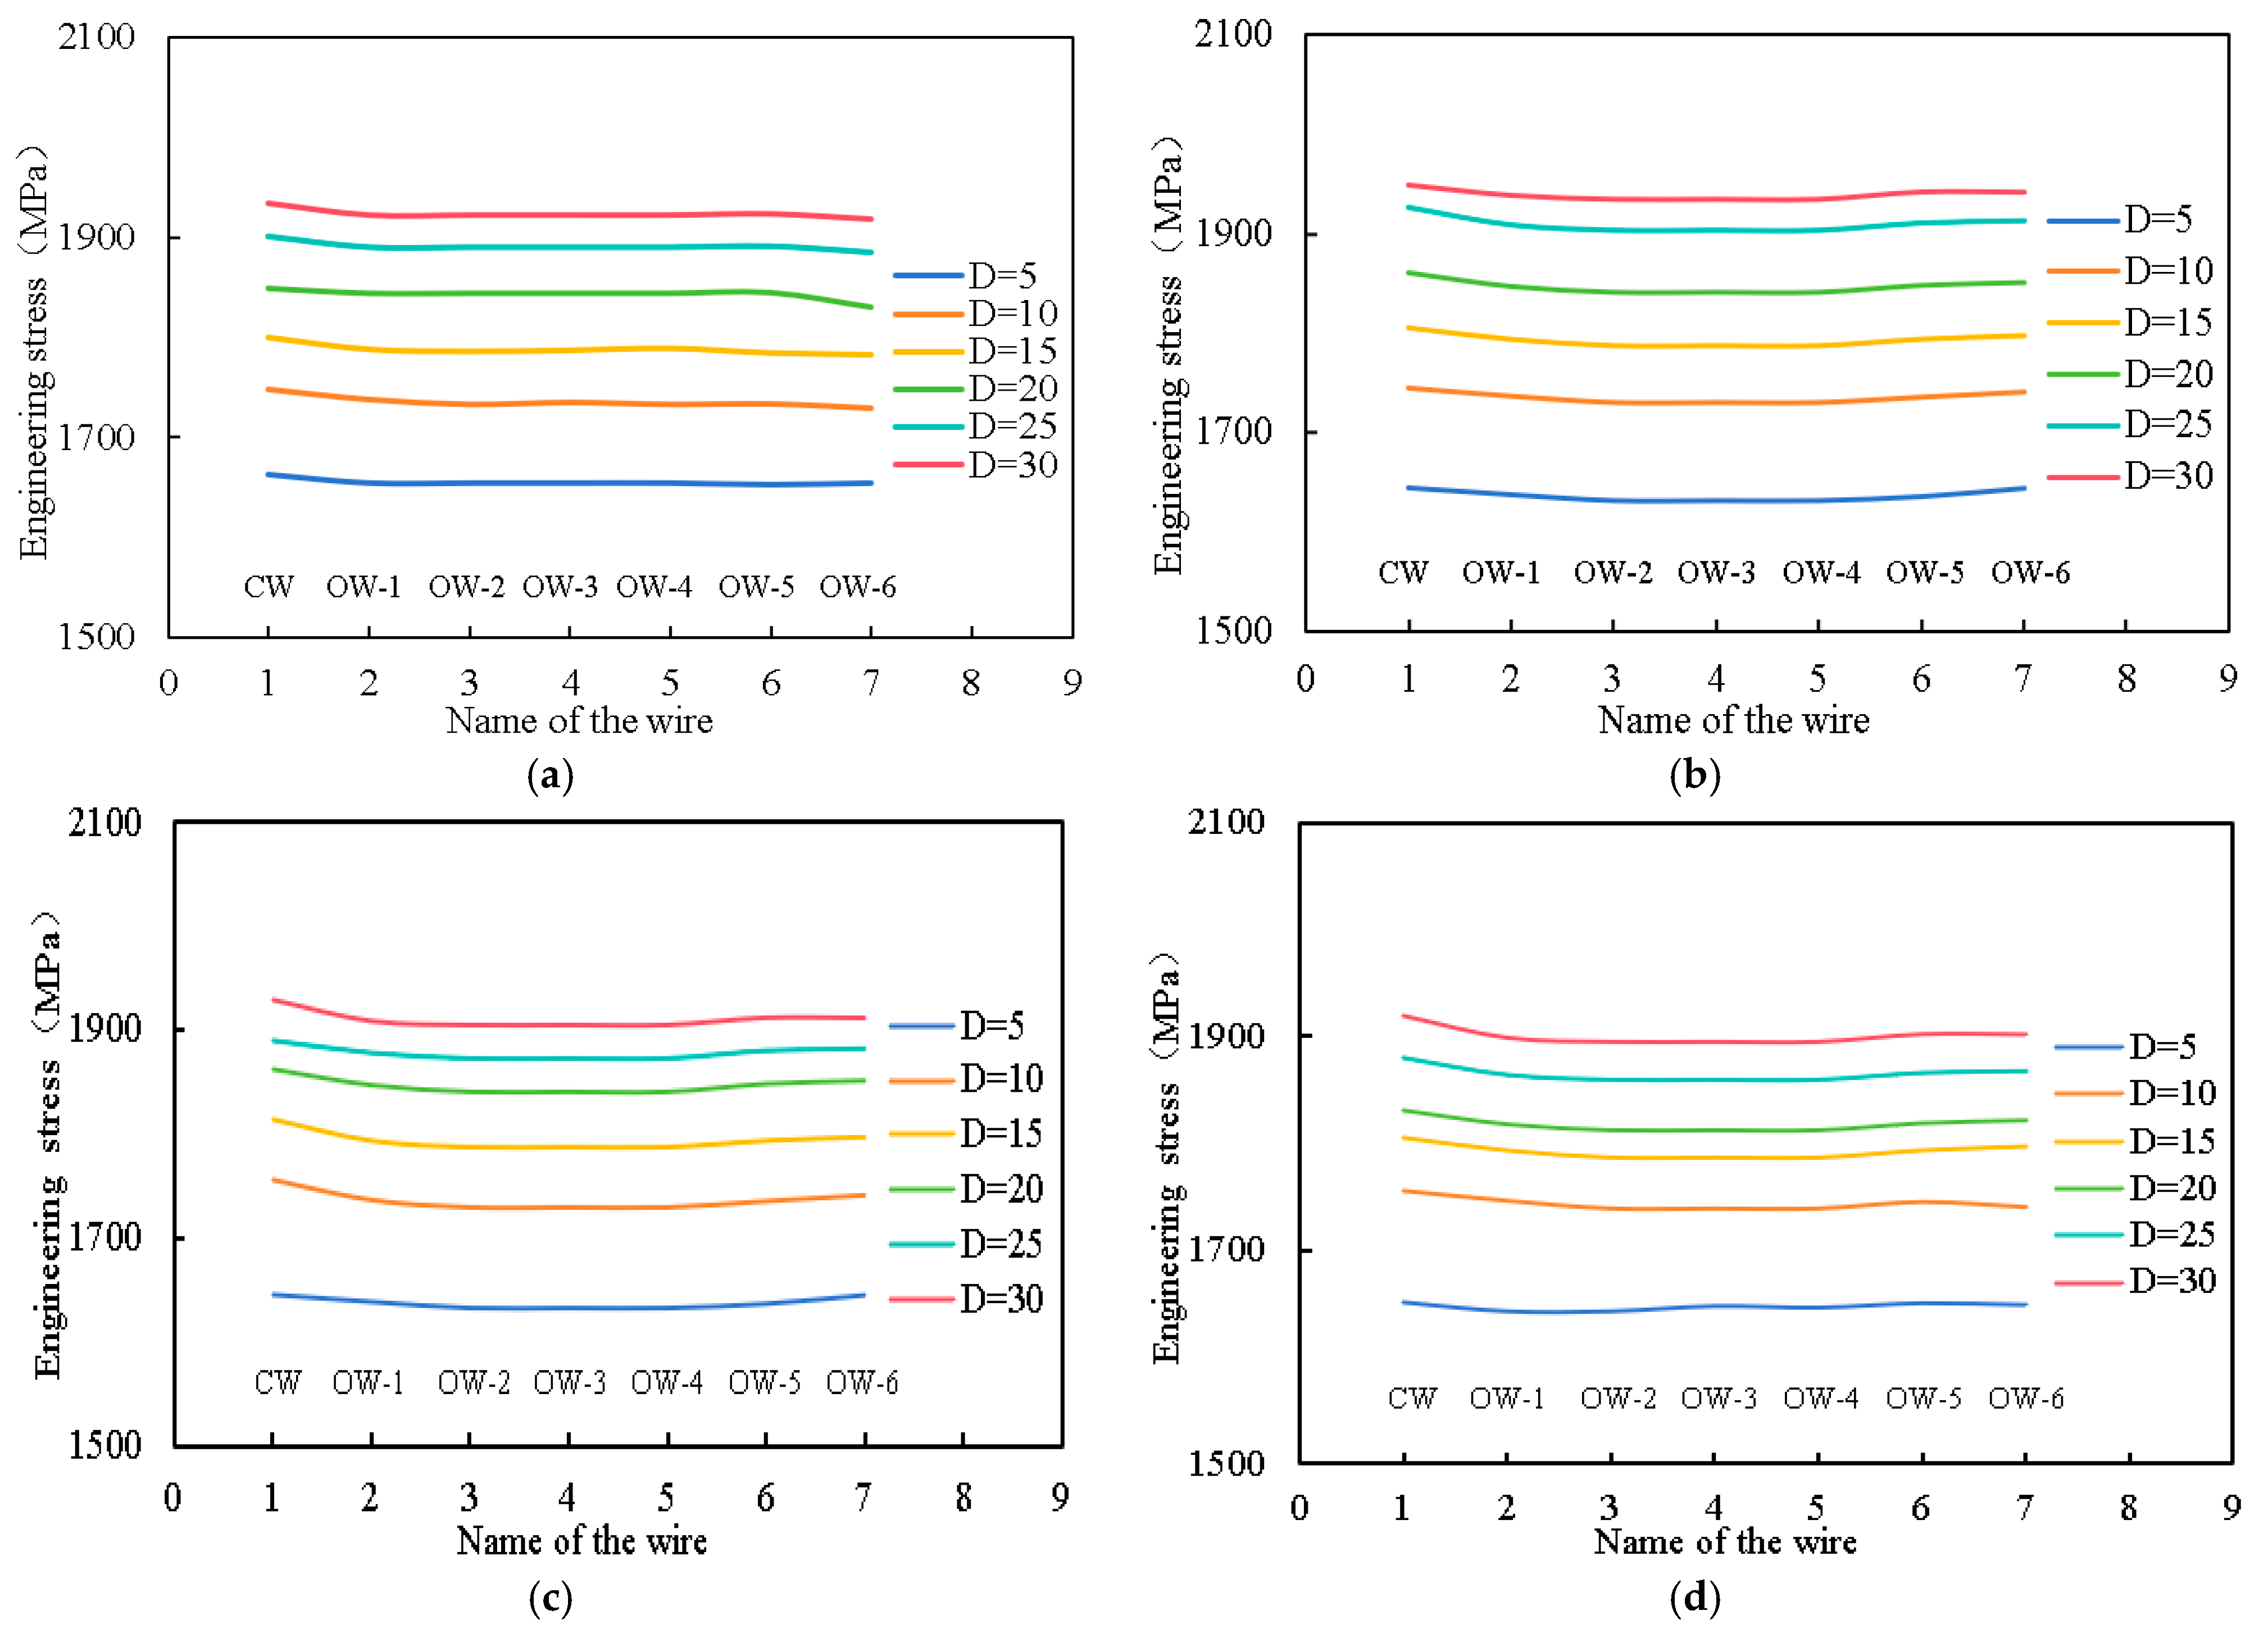
Figure 14 and Figure 15 show the stress distributions of individual filaments in anchor cable specimens A and B, respectively. The 500 mm measurement section of the anchor cable was taken as the study object, and it was divided into four cross-sections, spaced 125 mm apart, as shown in Figure 13. The average stress of each wire in each section was extracted, and the values were compared. In Figure 14 and Figure 15, “D” represents “displacement,” “CW” represents “center wire,” and the outer wires are denoted by “OW-” followed by the wire number, e.g., “OW-1”. By comparing the stress magnitudes of each wire at displacements of 5, 10, 15, 20, 25, and 30 mm, the stress distribution of the anchor cable specimen during the loading process was revealed.
Figure 14a–d present the single-wire stress distribution patterns across different cross sections of anchor cable specimen A (12.7 mm diameter) during tensile loading. The experimental and numerical simulation results indicated that for a displacement of 5 mm, the stress distributions of the individual wires in each cross section were relatively uniform, with low stress levels. This demonstrated that the anchor cable was in the elastic deformation stage at this point, consistent with the mechanical behavior characteristics of linear elastic materials. As the displacement continued to increase, the average stress of the center wire (CW) gradually exceeded those of the outer wires (OW-1 to OW-6) [38], revealing that the CW progressively became the primary load-bearing component during force transmission. However, when the stress on the anchor cable further increased to near its ultimate strength (combined with the stress concentration factor analysis data in Table 6), the local stresses of the outer wires began to significantly surpass that of the CW. This stress concentration caused the outer wires to reach the material’s fracture limit first, leading to tensile fracture failure. After the outer wires fractured, the CW, deprived of the load-sharing support from the outer wires, experienced a sharp increase in the tensile stress, ultimately failing because it exceeded the material’s strength limit [39].
Figure 15a–d present the single-wire stress distribution diagrams of cross sections for anchor cable specimen B (15.2 mm diameter). The observed trend was highly consistent with that of anchor cable specimen A. During the initial loading stage, the stress distributions of individual wires were uniform, demonstrating excellent cooperative load-bearing characteristics. As the displacement increased, the stress growth rate in the central wires became significantly higher than those in the outer wires, further verifying the dominant role of central wires in the load distribution. Notably, when the load approached its peak value, the stress concentration coefficients (Table 6) of the outer wires were generally higher than those of the central wires (e.g., OW-1 to OW-6 showed stress concentration coefficients of 1.040–1.050, while that for CW only reached 1.019). This difference directly led to the outer wires fracturing first due to accumulated local plastic deformation. Subsequently, the central wires rapidly entered a plastic instability stage through stress redistribution, ultimately resulting in fracture. The results indicated that the anchor cables with both diameters shared a common fracture mechanism, where stress concentration and non-uniform distribution of plastic deformation served as key factors causing preferential failure of the outer wires.

4.2. Analysis of Stress Characteristics of Anchor Cable Specimen Under Fracture

Table 6 presents the values of the stress concentration factor X calculated from the maximum stress σmax and the average stress σAvg of a single wire extracted from Abaqus, defined as follows:
X = σ m a x / σ A v g
For anchor cable specimen A, the stress concentration factor of the center wire before fracture failure was 1.034, significantly lower than those of the outer wires (1.070, 1.061, 1.061, 1.058, 1.062, and 1.060). For anchor cable specimen B, the stress concentration factor of the center wire before fracture failure was 1.018, which was also lower than those of the outer wires (1.040, 1.044, 1.044, 1.039, 1.050, and 1.046). The data indicated that in both types of anchor cable specimens, the outer wires exhibited higher stress concentration factors than the center wire, suggesting that they experienced greater localized stress concentrations during loading and were thus more prone to fracture failure.
Figure 16 shows the equivalent plastic strain versus stress triaxiality curves of a single wire in both anchor cable specimens. By selecting nodal points at stress concentration locations on the two outer wires and the center wire [40], the relationship between the stress triaxiality and the equivalent plastic strain was analyzed. The stress triaxiality of the wires exhibited irregular variations during loading, particularly when the equivalent plastic strain was below 0.1, where significant jumps in the stress triaxiality values occurred. This indicated that there was material instability during the initial plastic deformation stage. However, when the equivalent plastic strain exceeded 0.1, it increased as the stress triaxiality increased, and the outer wires showed a notably faster growth rate in the equivalent plastic strain than the center wire. Consequently, the outer wires accumulated damage more readily during plastic deformation, accelerating fracture initiation [41].
Table 7 presents the maximum equivalent plastic strain values of a single wire at stress concentration locations for both anchor cable specimen types. Comparative analysis revealed that the outer wires consistently exhibited higher equivalent plastic strain values than the center wire in both specimen types. Since equivalent plastic strain is closely related to the material fracture behavior, larger values indicate more severe localized plastic deformation and earlier fracture initiation. Consequently, the outer wires reached their fracture points sooner than the center wire, which aligned with the stress concentration factor analysis results.
In summary, comprehensive analysis of the stress concentration factors, equivalent plastic strain–stress triaxiality curves, and maximum equivalent plastic strain values demonstrated that for both anchor cable specimen diameters, the side wires were more susceptible to fracture failure due to their higher stress concentration factors and faster equivalent plastic strain accumulation rates under loading.

5. Conclusions

In this study, experiments and numerical simulations employing the Ling model were employed to describe the full-range true stress–strain relationships of material specimens and the load–displacement behavior of the entire anchor cable specimen. The ductile fracture behaviors of the material specimens were determined by simulations using the uncoupled damage model, specifically the R-T model. The following major conclusions were drawn:
(1) The test results showed that for the 12.7 and 15.2 mm diameter anchor cables with ultimate tensile strengths of 1860 MPa, the average yield-stress-to-ultimate-stress ratios (fu/fy) were 1.09 and 1.10, the fracture strains were 0.033 and 0.031, and the elongations were 2.06% and 1.63%, respectively.
(2) The investigation of different expressions for the true stress–strain relationships of the anchor cable specimen materials revealed that the Ling model with a weight factor W could accurately describe the materials’ true stress–strain relationships. This model had a single calibration parameter, making it suitable for engineering applications. The uncoupled damage model, particularly the Rice–Tracey (R-T) criterion, could effectively simulate the fracture behaviors of both the material specimens and the full-scale anchor cable specimens under monotonic loading. For the anchor cable specimen materials with ultimate tensile strengths of 1860 MPa and a diameter of 12.7 mm, the weight factor W in the Ling model was −0.1, and the fracture parameter α was 2.5. For anchor cable specimen materials with ultimate tensile strengths of 1860 MPa and a diameter of 15.2 mm, the weight factor W in the Ling expression was −0.1, and the fracture parameter α was 3.0.
(3) When analyzing the fracture mechanisms of the two anchor cable diameters, the stress concentration factors were determined by comparing the average and maximum stresses in individual wires. It was found that the edge wires exhibited stress concentration earlier than the center wires, causing them to fracture first.
(4) The equivalent plastic strain (PEEQ) served as a key criterion for fracture evaluation. For the two anchor cables of different diameters, the PEEQ values were extracted from stress-concentrated elements prior to fracture. The results demonstrated that the PEEQ values of the outer wires were consistently higher than those of the central wires, indicating that the outer wires accumulated damage faster during plastic deformation, leading to their earlier fracture compared to the central wires.
Suggestions for Further Research: Based on the findings of this study, several directions for future research are recommended:
(1)
Investigation of the long-term durability and corrosion effects on the fracture behavior of anchor cables under combined mechanical and environmental loading
(2)
Extension of the current model to include cyclic loading and fatigue failure analysis for a more comprehensive understanding of anchor cable performance in real-world applications
(3)
Exploration of the influence of different wire arrangements and cable geometries on stress distribution and fracture mechanisms
(4)
Validation of the proposed Ling and R-T models under multi-axial stress states and complex boundary conditions to enhance their generalizability.

Author Contributions

Conceptualization, C.W.; Writing—review and editing, C.W.; Data curation, G.F. and K.Z.; Writing—original draft, G.F. and K.Z.; Formal analysis, Y.Z.; Software, J.L. and M.Z.; Methodology, W.H.; Validation, S.S. All authors have read and agreed to the published version of the manuscript.

Funding

This study was funded by Transportation Science and Technology Plan Project of Fujian Province grant number [2024Y009]; The APC was funded by Engineering Research Center of Structure Crack Control for Major Project, Fujian Province University.

Institutional Review Board Statement

Not applicable.

Informed Consent Statement

Not applicable.

Data Availability Statement

The original contributions presented in this study are included in the article. Further inquiries can be directed to the corresponding author(s).

Acknowledgments

We thank LetPub (www.letpub.com.cn) (accessed on 26 June 2025) for linguistic assistance and pre-submission expert review. This work was supported by the Engineering Research Center of Structure Crack Control for Major Project, Fujian Province University.

Conflicts of Interest

Author Chenfei Wang was employed by Xiamen Chengzhi New Materials Technology Co., Ltd. Author Kai Zhang was employed by Xiamen Jiehang Engineering Testing Technology Co., Ltd. Author Mincheng Zhang was employed by Fujian Academy of Building Sciences Co., Ltd. The remaining authors declare that the research was conducted in the absence of any commercial or financial relationships that could be construed as a potential conflict of interest.

References

  1. Bo, M.; Qian, Y.; Wen, H.J.; Liu, S. Stability control of deep-buried roadways using large deformation and increasing resistance anchor cables. J. Cent. South Univ. 2024, 31, 558–575. [Google Scholar]
  2. Cui, Z.; Tian, W.; Liu, K.; Guo, D. Seasonal frozen soil area frame beam anchor rod slope support structure frost heave mechanical characteristics simplified calculation model. Environ. Earth Sci. 2024, 83, 425. [Google Scholar] [CrossRef]
  3. Xing, T.; Liu, H.; Zheng, J.; Yu, X.; Li, Y.; Peng, H. Study on the Effect of Anchor Cable Prestress Loss on Foundation Stability. Appl. Sci. 2024, 14, 4908. [Google Scholar] [CrossRef]
  4. Yang, F.; Veljkovic, M.; Liu, Y. Ductile damage model calibration for high-strength structural steels. Constr. Build. Mater. 2020, 263, 120632. [Google Scholar] [CrossRef]
  5. Xue, S.; Shen, R.; Xue, H.; Zhu, X. Failure analysis of high-strength steel wire under random corrosion. Structures 2021, 33, 720–727. [Google Scholar] [CrossRef]
  6. Abreu, D.M.; Iordachescu, M.; Valiente, A. Influence of transversal loading on tensile and fatigue behaviour of high-strength lean duplex stainless steel wires. Eng. Fail. Anal. 2019, 102, 417–424. [Google Scholar] [CrossRef]
  7. Gao, X.; Jia, J.; Bao, X.; Mei, G.; Zhang, L.; Tu, B. Investigation of dynamic responses of slopes in various anchor cable failure modes. Soil Dyn. Earthq. Eng. 2025, 188, 109077. [Google Scholar] [CrossRef]
  8. Zhao, C. Non-concrete breakout failure modes of concrete mechanical anchors in tension a literature review. Constr. Build. Mater. 2023, 366, 130222. [Google Scholar]
  9. Feng, C.; Liu, S.W.; Fu, M.X.; Lyu, Q.; He, D.; He, Y. Study on the shear failure mechanism of the free section of prestressed anchor cables. Chin. J. Rock Mech. Eng. 2024, 43, 1468–1479. [Google Scholar]
  10. Shi, M.F. Study on Fatigue Performance and Failure Mechanism of Prestressed Steel Strand Reinforced RC Beams Under Different Parameters. Master’s Thesis, Huaqiao University, Xiamen, China, 2019. [Google Scholar]
  11. Zhang, F.; Zhao, G.-H.; Wu, Y.-F.; Zhang, Y. Effect of strand debonding on the shear strength of existing pretensioned PC hollow slab. Eng. Struct. 2023, 291, 116417. [Google Scholar] [CrossRef]
  12. Hollomon, J.H. Tensile Deformation. AIME Trans. 1945, 162, 268–290. [Google Scholar]
  13. Voce, E. The Relationship Between Stress and Strain for Homogeneous Deformation. J. Inst. Met. 1948, 74, 537–562. [Google Scholar]
  14. Ludwik, P. Elemente der Technologischen Mechanik; Springer: Berlin, Germany, 1909. [Google Scholar]
  15. Swift, H.W. Plastic instability under plane stress. J. Mech. Phys. Solids 1952, 1, 1–18. [Google Scholar] [CrossRef]
  16. Ling, Y. Uniaxial true stress-strain after necking. AMPJ. Technol. 1996, 5, 37–48. [Google Scholar]
  17. Wang, F.; Liu, G.; Shen, D.; Guo, N.; Guo, F.; Zhang, Z.; Sun, W.; Tang, B. Extended GTN-Thomason Model for Modeling Ductile Fracture of Fe-Cr-Mo-Mn Steel at a Wide Range of Stress States and Temperatures. J. Mater. Eng. Perform. 2025, 1–27. [Google Scholar] [CrossRef]
  18. Bao, Y.; Wierzbicki, T. On fracture locus in the equivalent strain and stress triaxiality space. Int. J. Mech. Sci. 2004, 46, 81–98. [Google Scholar] [CrossRef]
  19. Bai, Y.; Wierzbicki, T. Application of extended Mohr-Coulomb criterion to ductile fracture. Int. J. Fract. 2010, 161, 1–20. [Google Scholar] [CrossRef]
  20. Lou, Y.; Chen, L.; Clausmeyer, T.; Tekkaya, A.E.; Yoon, J.W. Modeling of ductile fracture from shear to balanced biaxial tension for sheet metals. Int. J. Solids Struct. 2017, 112, 169–184. [Google Scholar] [CrossRef]
  21. Lou, Y.; Huh, H. Extension of a shear-controlled ductile fracture model considering the stress triaxiality and the Lode parameter. Int. J. Solids Struct. 2013, 50, 447–455. [Google Scholar] [CrossRef]
  22. Lou, Y.; Huh, H. Prediction of ductile fracture for advanced high strength steel with a new criterion: Experiments and simulation. J. Mater. Process. Technol. 2013, 213, 1284–1302. [Google Scholar] [CrossRef]
  23. Lou, Y.; Huh, H.; Lim, S.; Pack, K. New ductile fracture criterion for prediction of fracture forming limit diagrams of sheet metals. Int. J. Solids Struct. 2012, 49, 3605–3615. [Google Scholar] [CrossRef]
  24. Lou, Y.; Yoon, J.W.; Huh, H. Modeling of shear ductile fracture considering a changeable cut-off value for stress triaxiality. Int. J. Plast. 2014, 54, 56–80. [Google Scholar] [CrossRef]
  25. Lou, Y.; Yoon, J.W.; Huh, H.; Chao, Q.; Song, J.-H. Correlation of the maximum shear stress with micro-mechanisms of ductile fracture for metals with high strength-to-weight ratio. Int. J. Mech. Sci. 2018, 146–147, 583–601. [Google Scholar] [CrossRef]
  26. Gu, G.; Mohr, D. Anisotropic Hosford-Coulomb fracture initiation model: Theory and application. Eng. Fract. Mech. 2015, 147, 480–497. [Google Scholar] [CrossRef]
  27. Mohr, D.; Marcadet, S.J. Micromechanically-motivated phenomenological Hosford-Coulomb model for predicting ductile fracture initiation at low stress triaxialities. Int. J. Solids Struct. 2015, 67–68, 40–55. [Google Scholar] [CrossRef]
  28. Zhang, Z.; Wu, Y.; Huang, F. Extension of a shear-controlled ductile fracture criterion by considering the necking coalescence of voids. Int. J. Solids Struct. 2022, 236–237, 111324. [Google Scholar] [CrossRef]
  29. Rice, J.R.; Tracey, D.M. On the ductile enlargement of voids in triaxial stress fields*. J. Mech. Phys. Solids 1969, 17, 201–217. [Google Scholar] [CrossRef]
  30. Ho, H.C.; Chung, K.F.; Xiao, T.Y.; Yam, M.C.H.; Nethercot, D.A. Non-linear necking behaviour of S275 to S960 structural steels under monotonic tension. Eng. Struct. 2022, 261, 114263. [Google Scholar] [CrossRef]
  31. Microcomputer-Controlled Electro-Hydraulic Servo Universal Testing Machine; Shijin Group Co., Ltd.: Jinan, China, 2006.
  32. GB/T228.1-2015; Metallic Materials—Tensile Testing—Part 1: Method of Test at Room Temperature. Standardization Administration of China: Beijing, China.
  33. Anon. Abaqus Analysis User’s Guide, Version 2020; Dassault Systèmes Simulia Corp: Providence, RI, USA, 2020.
  34. Anon. Abaqus Analysis User’s Guide, Version 6.13; Dassault Systèmes Simulia Corp: Providence, RI, USA, 2013.
  35. Zhang, Y.; Liu, Y.; Yang, F.; Zhou, Q.; Chen, A. Plasticity and ductile fracture of high-strength bolt materials under monotonic tension. J. Constr. Steel Res. 2024, 214, 108475. [Google Scholar] [CrossRef]
  36. Kanvinde, A.M.; Deierlein, G.G. The void growth model and the stress modified critical strain model to predict ductile fracture in structural steels. J. Struct. Eng. 2006, 132, 1907–1918. [Google Scholar] [CrossRef]
  37. Kanvinde, A.M.; Deierlein, G.G. Finite-element simulation of ductile fracture in reduced section pull-plates using micromechanics-based fracture models. J. Struct. Eng. 2007, 133, 656–664. [Google Scholar] [CrossRef]
  38. Jeon, C.-H.; Lee, J.-B.; Lon, S.; Shim, C.-S. Equivalent material model of corroded prestressing steel strand. J. Mater. Res. Technol. 2019, 8, 2450–2460. [Google Scholar] [CrossRef]
  39. Tan, D.; Luo, Y.; Tao, Y.; Peng, Y.; Luo, H.; Ji, B. Research on Broken Wire Based on a Fine Finite Element Model of Steel Strands. Materials 2025, 18, 3148. [Google Scholar] [CrossRef]
  40. Orhan, Y.; Marios, T.; Huanxin, Y.; Afshan, S. Comparative study on fracture characteristics of carbon and stainless steel bolt material. J. Constr. Steel Res. 2023, 210, 108102. [Google Scholar] [CrossRef]
  41. Wu, P.; Kardani, A.; Liu, M.; Lin, Z.; Bagherifard, S. Exploring the bonding mechanism in cold spray deposition of engineered graphene nanoplates-Ni nanocomposite powder. Compos. Part A Appl. Sci. Manuf. 2025, 191, 108741. [Google Scholar] [CrossRef]
Figure 1. Specimen configurations (unit: mm): (a) tensile specimens; (b) anchor cable specimens.
Jcs 09 00508 g001
Figure 2. Experimental set-up: (a) 100 kN universal testing machine; (b) 1000 kN universal testing machine.
Jcs 09 00508 g002
Figure 3. Measured engineering stress–strain curves of tensile specimens: (a) tensile specimen a; (b) tensile specimen b.
Jcs 09 00508 g003
Figure 4. Tensile specimens after failure: (a) 12.7 mm tensile specimen; (b) 15.2 mm tensile specimen.
Jcs 09 00508 g004
Figure 5. Measured load–displacement curves of anchor cable specimens: (a) anchor cable specimen A; (b) anchor cable specimen B.
Jcs 09 00508 g005
Figure 6. Anchor cable specimens after failure: (a) 12.7 mm anchor cable specimen; (b) 15.2 mm anchor cable specimen.
Jcs 09 00508 g006
Figure 7. Finite element (FE) model of tensile coupon.
Jcs 09 00508 g007
Figure 8. FE model of anchor cable coupon test.
Jcs 09 00508 g008
Figure 9. FE results of various true stress–strain models: (a) 12.7 mm tensile specimen; (b) 15.2 mm tensile specimen.
Jcs 09 00508 g009
Figure 10. FE results of various engineering stress–strain models: (a) 12.7 mm tensile specimen; (b) 15.2 mm tensile specimen.
Jcs 09 00508 g010
Figure 11. Relationship between ductile fracture model and stress–strain curves: (a) tensile specimen a—damage initiation PEEQ vs. stress triaxiality; (b) tensile specimen a—fracture strains for various α values; (c) tensile specimen b—damage initiation PEEQ vs. stress triaxiality; (d) tensile specimen b—fracture strains for various α values.
Jcs 09 00508 g011
Figure 12. FE simulation and experimental results of anchor cable specimens: (a) fracture strain of specimen A for various α values; (b) fracture strain of specimen B for various α values.
Jcs 09 00508 g012
Figure 13. FE simulation and experimental results of anchor cable specimen fracture: (a) anchor cable specimen A; (b) anchor cable specimen B.
Jcs 09 00508 g013
Figure 14. Breaking stresses of monofilaments for anchor cable specimen A: (a) Section one; (b) Section two; (c) Section three; (d) Section four.
Jcs 09 00508 g014
Figure 15. Breaking stresses of monofilaments for anchor cable specimen B: (a) Section one; (b) Section two; (c) Section three; (d) Section four.
Jcs 09 00508 g015
Figure 16. Equivalent plastic strain at fracture as a function of stress triaxiality for anchor cable specimens: (a) anchor cable specimen A; (b) anchor cable specimen B.
Jcs 09 00508 g016
Table 1. Tensile and anchor cable specimen dimensions.
SpecimensNominal Diameter (mm)Measured Diameter (mm)Machining Diameter
(mm)
SpecimensNominal Diameter (mm)Measured Diameter
(mm)
Machining Diameter
(mm)
a-12.7-T14.304.283.73b-15.2-T15.205.224.70
a-12.7-T24.304.313.66b-15.2-T25.205.214.65
a-12.7-T34.304.303.71b-15.2-T35.205.184.69
Mean4.304.303.70Mean5.205.204.68
A-12.7-T112.7012.69-B-15.2-T115.2015.22-
A-12.7-T212.7012.74-B-15.2-T215.2015.23-
A-12.7-T312.7012.70-B-15.2-T315.2015.21-
Mean12.7012.71-Mean15.2015.22-
Note: The specimen naming convention is “letter+anchor cable diameter-Tnumber,” where a denotes a 12.7 mm tensile specimen, b denotes a 15.2 mm tensile specimen, A denotes a 12.7 mm anchor cable specimen, B denotes a 15.2 mm anchor cable specimen, and T stands for tensile coupon.
Table 2. Experimental results of tensile specimen.
SpecimensE (GPa)fu (MPa)fy (MPa)fy/fuεf (mm/mm)Elongation δ%
a-12.7-T1194.511741.041990.421.090.0352.02
a-12.7-T2190.231693.611949.151.090.0322.01
a-12.7-T3189.411752.481990.401.080.0312.15
Average191.281729.041976.661.090.0332.06
b-15.2-T1201.731777.141982.031.110.0311.72
b-15.2-T2199.271765.271937.951.080.0321.51
b-15.2-T3202.381743.041942.151.110.0301.63
Average201.131767.401954.041.100.0311.63
Note: E—Young’s modulus (GPa), fu—yield stress (MPa), fy—ultimate stress (MPa), εf—fracture strain (mm/mm).
Table 3. Experimental results of anchor cable specimens.
SpecimensUltimate Load Fu (kN)Limit Displacement ΔX (mm)
A-12.7-T1196.6834.54
A-12.7-T2195.4735.27
A-12.7-T3194.9635.49
Average195.7035.07
B-15.2-T1268.5831.84
B-15.2-T2269.6531.62
B-15.2-T3268.7432.65
Average268.9932.04
Table 4. Standard deviations and correlation coefficients.
Tensile Specimen ATensile Specimen B
ModelSdCcModelSdCc
Ling2.67180.9996Ling7.20190.9846
Swift+Voce2.71320.9987Swift+Voce7.24140.9836
Voce25.07490.8097Voce22.68610.8456
Ludwik42.02520.7099Ludwik44.31140.8773
Hollomon13.57020.9174Hollomon18.73260.8404
Swift24.43320.8560Swift22.21540.8400
Note: Sd: standard deviation; Cc: correlation coefficient.
Table 5. FE simulation and experimental results of anchor cable specimens.
UlFdAulAfdUl
FEA/EXP
Fd
FEA/EXP
Anchor cable specimen A194.6034.09--0.99430.972
194.8935.28195.7035.070.99581.006
195.7836.33--1.00011.0359
Average195.0935.50195.7035.070.99671.0046
266.7432.07--0.99161.0009
Anchor cable specimen B267.2633.13268.9932.040.99361.034
267.7934.11--0.99551.0646
Average267.2633.10268.9932.040.99361.0332
Note: Ul—ultimate load (kN); Fd—fracture displacement (mm); Aul—average ultimate load (kN); Afd—average fracture displacement (mm).
Table 6. Stress concentration coefficients of anchor cable specimens.
Type A Anchor Cable Specimen Type B Anchor Cable Specimen
σmaxσAvgX σmaxσAvgX
CW212320521.034659CW196919331.018624
OW-1213819971.070606OW-1198619091.040335
OW-2213420101.061692OW-2198118961.044831
OW-3213120071.061784OW-3198419051.044147
OW-4213220151.058065OW-4198619101.039791
OW-5213520091.062718OW-5198718921.050211
OW-6213020081.060757OW-6198218941.046463
Table 7. Equivalent plastic strain at the element nodes.
Type A Anchor Cable SpecimenType B Anchor Cable Specimen
Damage Initiation PEEQ Damage Initiation PEEQ
CW0.783CW1.095
OW-11.191OW-11.787
OW-21.174OW-21.699
OW-31.082OW-31.414
OW-41.042OW-41.544
OW-51.146OW-51.631
OW-61.139OW-61.569
Disclaimer/Publisher’s Note: The statements, opinions and data contained in all publications are solely those of the individual author(s) and contributor(s) and not of MDPI and/or the editor(s). MDPI and/or the editor(s) disclaim responsibility for any injury to people or property resulting from any ideas, methods, instructions or products referred to in the content.