Article

The Effect of Methacrylate-POSS in Nanosilica Dispersion Addition on Selected Mechanical Properties of Photo-Cured Dental Resins and Nanocomposites †

1
Student Science Club “Materials in Dentistry”, Division of Dentistry, Faculty of Medicine, Medical University of Lodz, 251 Pomorska St., 92-213 Lodz, Poland
2
University Laboratory of Materials Research, Medical University of Lodz, 251 Pomorska St., 92-213 Lodz, Poland
3
“DynamoLab” Academic Laboratory of Movement and Human Physical Performance, Medical University of Lodz, 251 Pomorska St., 92-215 Lodz, Poland
4
Faculty of Medical Sciences for Physiotherapy, Warsaw Medical Academy, 59 Okopowa St., 01-043 Warsaw, Poland
5
Department of General Dentistry, Medical University of Lodz, 251 Pomorska St., 92-213 Lodz, Poland
6
Department of Physical Chemistry and Technology of Polymers, Faculty of Chemistry, Silesian University of Technology, 9 Strzody St., 44-100 Gliwice, Poland
*
Author to whom correspondence should be addressed.
The results of the work were presented during the XXII Conference of “Biomaterials and mechanics in dentistry”, Wisła, Poland, 10–13 October 2024, and published as an abstract in the conference’s program and materials.
J. Compos. Sci. 2025, 9(8), 403; https://doi.org/10.3390/jcs9080403 (registering DOI)
Submission received: 25 June 2025 / Revised: 24 July 2025 / Accepted: 28 July 2025 / Published: 1 August 2025
(This article belongs to the Special Issue Innovations of Composite Materials in Prosthetic Dentistry)

Abstract

Background: This study aimed to assess the impact of methacrylate-functionalized polyhedral oligomeric silsesquioxanes dispersed in nanosilica (MA/Ns-POSS) on the mechanical properties of light-curable dental resins and composites. The primary goal was to evaluate how different concentrations of MA/Ns-POSS (0.5–20 wt.%) affect the hardness, flexural strength, modulus, diametral tensile strength, polymerization shrinkage stress, and degree of conversion of these materials. Methods: A mixture of Bis-GMA, UDMA, TEGDMA, HEMA, and camphorquinone, with a tertiary amine as the photoinitiator, was used to create resin and composite samples, incorporating 45 wt.% silanized silica for the composites. Hardness (Vickers method, HV), flexural strength (FS), and flexural modulus (Ef) were assessed using three-point bending tests, while diametral tensile strength (DTS) polymerization shrinkage stresses (PSS), and degree of conversion (DC) analysis were analyzed for the composites. Results: The results showed that resins with 10 wt.% MA/Ns-POSS exhibited the highest Ef and FS values. Composite hardness peaked at 20 wt.% MA/Ns-POSS, while DTS increased up to 2.5 wt.% MA/Ns-POSS but declined at higher concentrations. PSS values decreased with increasing MA/Ns-POSS concentration, with the lowest values recorded at 15–20 wt.%. DC analysis also showed substantial improvement for 15–20 wt.% Conclusion: Incorporating MA/Ns-POSS improves the mechanical properties of both resins and composites, with 20 wt.% showing the best results. Further studies are needed to explore the influence of higher additive concentrations.

1. Introduction

In modern restorative dentistry, dental composite resins (DCRs) have become arguably the most important tooth filling materials. Composite restorations surpassed the previously widely used amalgam fillings because of their increased biocompatibility, amazing aesthetic properties, safety, and relative preservation of tooth tissue [1]. Another advantage of dental composites is the possibility of modifying their formulations to enrich specific properties. These include increased mechanical strength, antimicrobial properties, or remineralization potential [1,2,3]. However, despite being introduced about 50 years ago, DCRs still present significant disadvantages [4]. According to recent research, dental composite restorations show annual failure rates up to 27.11%, with secondary caries and fracture being the most frequent complications [5]. This could be attributed to two main underlying causes: high polymerization shrinkage, shrinkage stress, and low mechanical properties. Also, patient- and dentist-related factors (e.g., caries risk, dentist experience) were proven to affect the DCR restoration success rate [6]. Despite this fact, it is undeniable that current dental resin-based composites need continuous improvements to facilitate the work of the dentist and enable higher success rates for these restorations, which sets the overall goal of and driving force behind this study.
Polyhedral oligomeric silsesquioxanes (POSS) are a group of organic/inorganic hybrid nanomaterials composed of an inorganic silicon–oxygen core and covalently bonded organic substituents [7,8,9]. These peripheral groups, including hydrogen, acryl, alkene, hydroxyl, or amino groups, affect POSS molecule properties and could be designed to suit specific purposes [9,10]. Methacrylate POSS (MA-POSS) is a cage structure, 1.5 nm molecule with eight methacrylate groups attached, which act as multifunctional crosslinkers [11,12]. The methacrylate groups therefore enable synthesis with the polymer matrix. Incorporating MA-POSS into the composite resin could, according to the literature, reduce some of the DCRs flaws by increasing its mechanical strength [13,14,15], decreasing water sorption leading to hydrolysis resistance [16,17] or reducing volumetric shrinkage [4,8,14]. Importantly, it is well-proven that improvement of composite properties is highly dependent on POSS concentration in the resin, with high concentrations showing a decrease in mechanical properties [18]. Xiaorong Wu et al. [19] reported that experimental composites with 2 wt.% MA-POSS showed overall improved mechanical characteristics. Hao Fong et al.’s [14] findings indicate 10 wt.% MA-POSS composite exhibits highest diametral tensile strength (DTS) and flexural strength (FS) values, but Young’s modulus was highest for 2 wt.% MA-POSS addition. Experimental composites investigated in these studies varied in composition, influencing the results and impeding comparisons between the studies.
In this study, we used methacrylate-functionalized polyhedral oligomeric silsesquioxane with nanosilica dispersion (MA/Ns-POSS) to develop an experimental dental composite aimed at enhancing mechanical properties and reducing polymerization shrinkage stress. To date, MA/Ns-POSS has not been used to create dental composites. Liu et al. [20] reported the effects of nanosilica addition on dental resins modified with 2 wt.% POSS, showing that nano-SiO2 improved mechanical properties, but only at low concentrations. According to the manufacturer (Hybrid Plastics, MA0735.08.30), MA/Ns-POSS offers improved flow and optical properties while maintaining the mechanical advantages of nanosilica addition. To address inconsistencies in the literature and better understand the optimal MA/Ns-POSS-to-DCR ratio, we investigated various MA/Ns-POSS concentrations. The null hypothesis was that the incorporation of MA/Ns-POSS would have a significant effect on the mechanical properties of the experimental resin and composite.

2. Materials and Methods

2.1. Materials’ Composition

Monomers: bisphenol A glycerolate dimethacrylate (bis-GMA, 98%), triethylene glycol dimethacrylate (TEGDMA, 95%), diurethane dimethacrylate (UDMA, 97%), 2-hydroxyethyl methacrylate (HEMA, 97%) were purchased from Sigma-Aldrich Co., St. Louis, MO, USA. Nanosilica dispersed in methacryl-functional polysilsesquioxanes (MA/Ns-POSS) used for experimental groups was purchased from Hybrid Plastics (Hattiesburg, MS, USA). This mixture contains 30 wt.% of untreated nanosilica particles 20 nm in size. Eighteen different mixtures were prepared. Each mixture additionally contained 0.4 wt.% camphorquinone (CQ, 97%, Sigma-Aldrich Co., St. Louis, MO, USA) as a photointiator, 0.1 wt.% 2,6-di(tert-butyl-1-d1)-4-methyl-d3-phenol-3,5-d2 (BHT, Sigma-Aldrich Co., St. Louis, MO, USA) as an inhibitor of polymerization, and 0.8 wt.% 2-(dimethylamino)ethyl methacrylate (DMAEMA, 98%, Sigma-Aldrich Co., St. Louis, MO, USA) as a co-initiator. Half of the prepared mixtures were filled with silica (Arsil, Chemical Plant “RUDNIKI” S.A., Rudniki, Poland) silanized with γ-methacryloxypropyltrimethoxy silane (Unisil Ltd., Tarnów, Poland) to create composites. For the purposes of this study, the wt.% of MA/Ns-POSS was calculated relative to the resin matrix only, rather than the entire composite mixture, in order to facilitate accurate and consistent sample preparation.

2.2. Sample Preparation

Bis-GMA, TEGDMA, UDMA, and HEMA monomers were mixed with CQ, DMAEMA, and BHT, creating a 30 g mixture. The monomers were mixed using a standard heated magnetic stirrer with the mixing temperature below 50 °C to increase the mobility of polymer chains but avoid their degradation. Then the mixture was divided equally into nine containers of 3 g each. MA/Ns-POSS was added to the composition using a Hauschild SpeedMixer (TM DAC 150 FVZ, Hauschild and Co., Hamm, Germany) in 1500 rpm cycles for 20 s. Prepared matrices were stored for a week before undergoing any studies. This was followed by light curing the samples for 20 s per 1.5 mm of material. The light curing unit (Mini L.E.D, Satelec, France) was inspected with a radiometer system (Digital Light Meter 200, Rolence Enterprise Inc., Taoyuan, Taiwan) each time prior to polymerization of the materials and displayed real power of 1200 mW/cm2, emitting light in a range from 450 to 490 nm. Experimental composites were prepared similarly to matrices, the only difference being that after the addition of MA/Ns-POSS, the samples rested for one week. After the addition of MA/Ns-POSS, the composite samples were subsequently filled with 45 wt.% of silica calculated for the whole composite, using the Hauschild SpeedMixer (TM DAC 150 FVZ, Hauschild and Co., Hamm, Germany). This silica concentration was selected as it provides a good balance between manufacturing feasibility, satisfactory mechanical properties, and contraction stress, according to previous laboratory experience [21]. Our decision was also based on previous investigations showing that in order to achieve baseline recommended mechanical properties, filler content should exceed 40 wt.% [22]. Filler was added gradually in small doses to ensure even distribution within the matrix, with a speed of 1500 rpm up to 3000 rpm, which depended on increasing mixture viscosity.

2.3. Flexural Strength

A three-point bending test was performed to assess flexural strength (FS). The test was conducted according to ISO 4049 [23], using Zwick Roell Z020 universal testing machine (Zwick-Roell, Ulm, Germany) with 1 mm/min traverse speed. Rectangular 2 mm × 2 mm × 25 mm samples were used. Each study group, for both matrices and composites, consisted of six samples tested. Elasticity modulus in bending (Ef) was also calculated during the tests. The following equation was used to calculate FS:
F S = 3 F l 2 b h 2 M P a ,
F—force, which caused the destruction of the sample [N];
l—distance between supports, 20 mm;
b—width of the sample [mm];
h—height of the sample [mm].

2.4. Diametral Tensile Strength

A diametral tensile strength (DTS) test was performed on cylindrical samples 6 mm in diameter and 3 mm in height. The tests were carried out for nine samples, only for composite study groups using a Zwick Roell Z020 universal testing machine (Zwick-Roell, Ulm, Germany). Traverse speed was 2 mm/min. The following equation was used to calculate DTS:
D T S = 2 F π d h [ M P a ] ,
F—force that caused the destruction of the sample [N];
d—diameter of the sample [mm];
h—height of the sample [mm].

2.5. Hardness

The hardness of the tested matrices and composites was measured using the Vickers method with a Zwick ZHV2-m semi-automatic hardness tester (Zwick-Roell, Ulm, Germany). Nine measurements in total were performed on three out of nine DTS samples in each study group. The applied load was 1000 g (approx. 9.81 N), and the penetration time was 10 s.

2.6. Polymerization Shrinkage Stress

Photoelastic analysis enables the quantitative assessment and visualization of polymerization shrinkage stress (PSS) that arises during the photopolymerization of resin-based composites. PSS measurements were conducted exclusively on composite samples, without separate resin samples, in order to focus on filled composite, as in this form composites are used clinically. The pivotal aim of this study was to mimic contraction stress state on the interface between composite and epoxy plate (that in vitro represent tooth tissue). Calibrated orifices 3 mm in diameter and 4 mm in thickness were prepared in photoelastically sensitive epoxy resin plates (Epidian 53, Organika-Sarzyna SA, Nowa Sarzyna, Poland). The diameter of the orifices was chosen to mimic clinical conditions of an average size tooth cavity. The orifices were then filled with composite in one layer and cured for 20 s on both sides. Three samples were prepared for each of the tested composite formulations. The generated strains in the plates were visualized in a circular transmission polariscope FL200 (Gunt, Hamburg, Germany), and photoelastic strain calculations were based on the Timoshenko equation [24]. A more detailed description of this method is presented in our previous works [25,26].

2.7. FTIR Analysis

Fourier-transform infrared (FTIR) measurements were carried out only for composite samples in attenuated total reflectance mode (ATR) utilizing a PerkinElmer Spectrum Two FTIR spectrometer. The instrument operated with a resolution of 4 cm−1, and spectra were collected over the range of 4000–400 cm−1. Liquid samples were applied onto a diamond/ZnSe crystal as thin films, whereas solid samples were applied as fine powders and compressed to ensure good contact.
Samples were analyzed before and after curing to evaluate the degree of conversion (DC) of double bonds. The following equation was used to calculate the DC:
D C = 1 A C = C A A r p o l A C = C A A r m o n × 100   %
AC=C—the intensity of the absorption band corresponding to the C=C stretching vibration in the methacrylate group;
AAr—the intensity of the absorption band corresponding to the skeletal stretching vibrations in the benzene ring;
pol—the polymer, which corresponded to the cured sample;
mon—the monomer, which corresponded to the uncured sample.

2.8. Statistical Analysis

For the statistical analysis of the results, Statistica v. 13 was used. To evaluate the distribution of particular parameters, the Shapiro–Wilk test of normality was applied. In cases of normal distribution of particular parameters, the equality of variances was assessed with the use of the Levene test. In the case of distribution non-consistent with normal distribution, the Kruskall–Wallis test with a post hoc test was used. For equal variances, ANOVA with the Scheffe post hoc test was applied. The accepted level of significance was p = 0.05.

3. Results

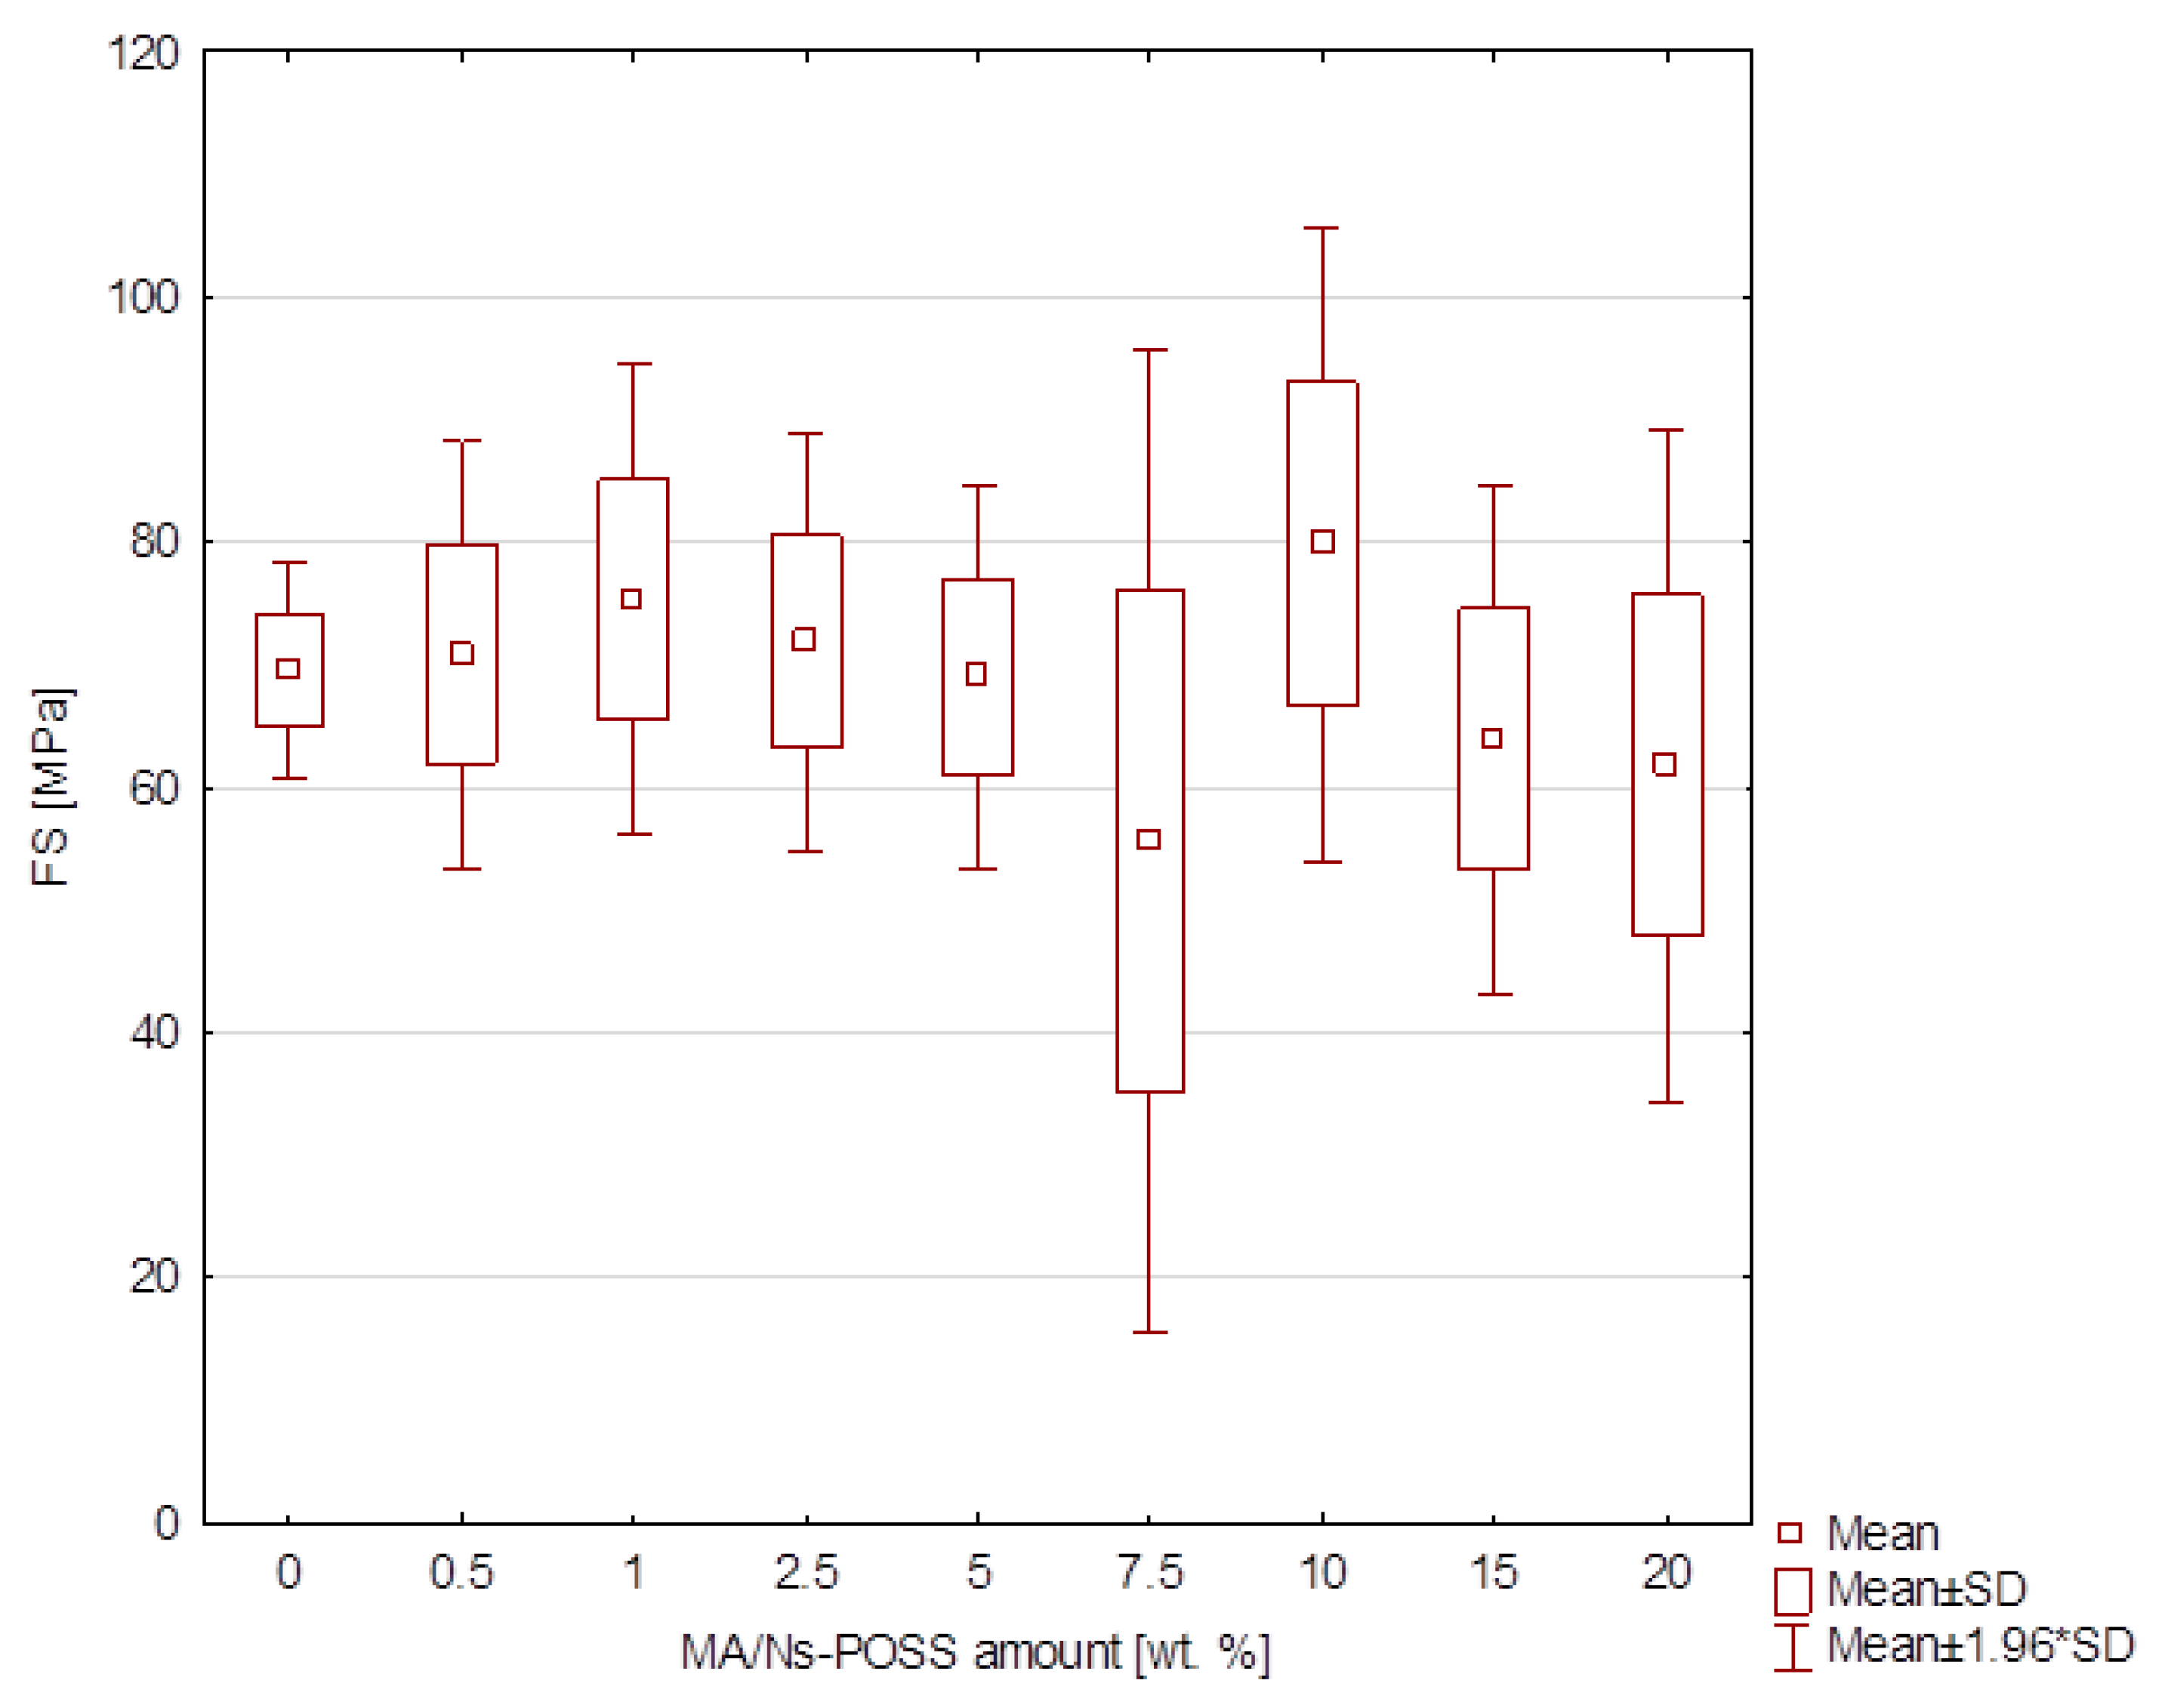
3.1. Flexural Strength

Flexural strength measured for resins achieved values varying from 55.7 and 75.6 MPa, whereas for composites it ranged from 31.3 to 97.6 MPa. The values of mean, standard deviation, median, minimum, and maximum of each tested property of matrix and composite are presented in Table A1 and Table A2, respectively. Resin samples’ flexural strength was significantly influenced by experimental composition (p < 0.05). Average flexural strength values for resin samples containing 0.5 to 10 wt.% MA/Ns-POSS did not differ significantly (Figure 1), whereas post hoc analysis indicated that there was a significant (p = 0.03) drop in flexural strength median values for matrices with incorporation of 15 wt.% MA/Ns-POSS, in comparison to the material with 10 wt.%.
The FS mean values of composite samples ranged between 55.72 MPa for the 7.5 wt.% MA/Ns-POSS group and 79.84 MPa for the composite with 10 wt.% addition, with average values of 69.56 MPa for unmodified samples. However, no significant difference was found among the experimental composite samples (p > 0.05), with the 10 wt.% MA/Ns-POSS composite achieving maximum mean values (Figure 2).

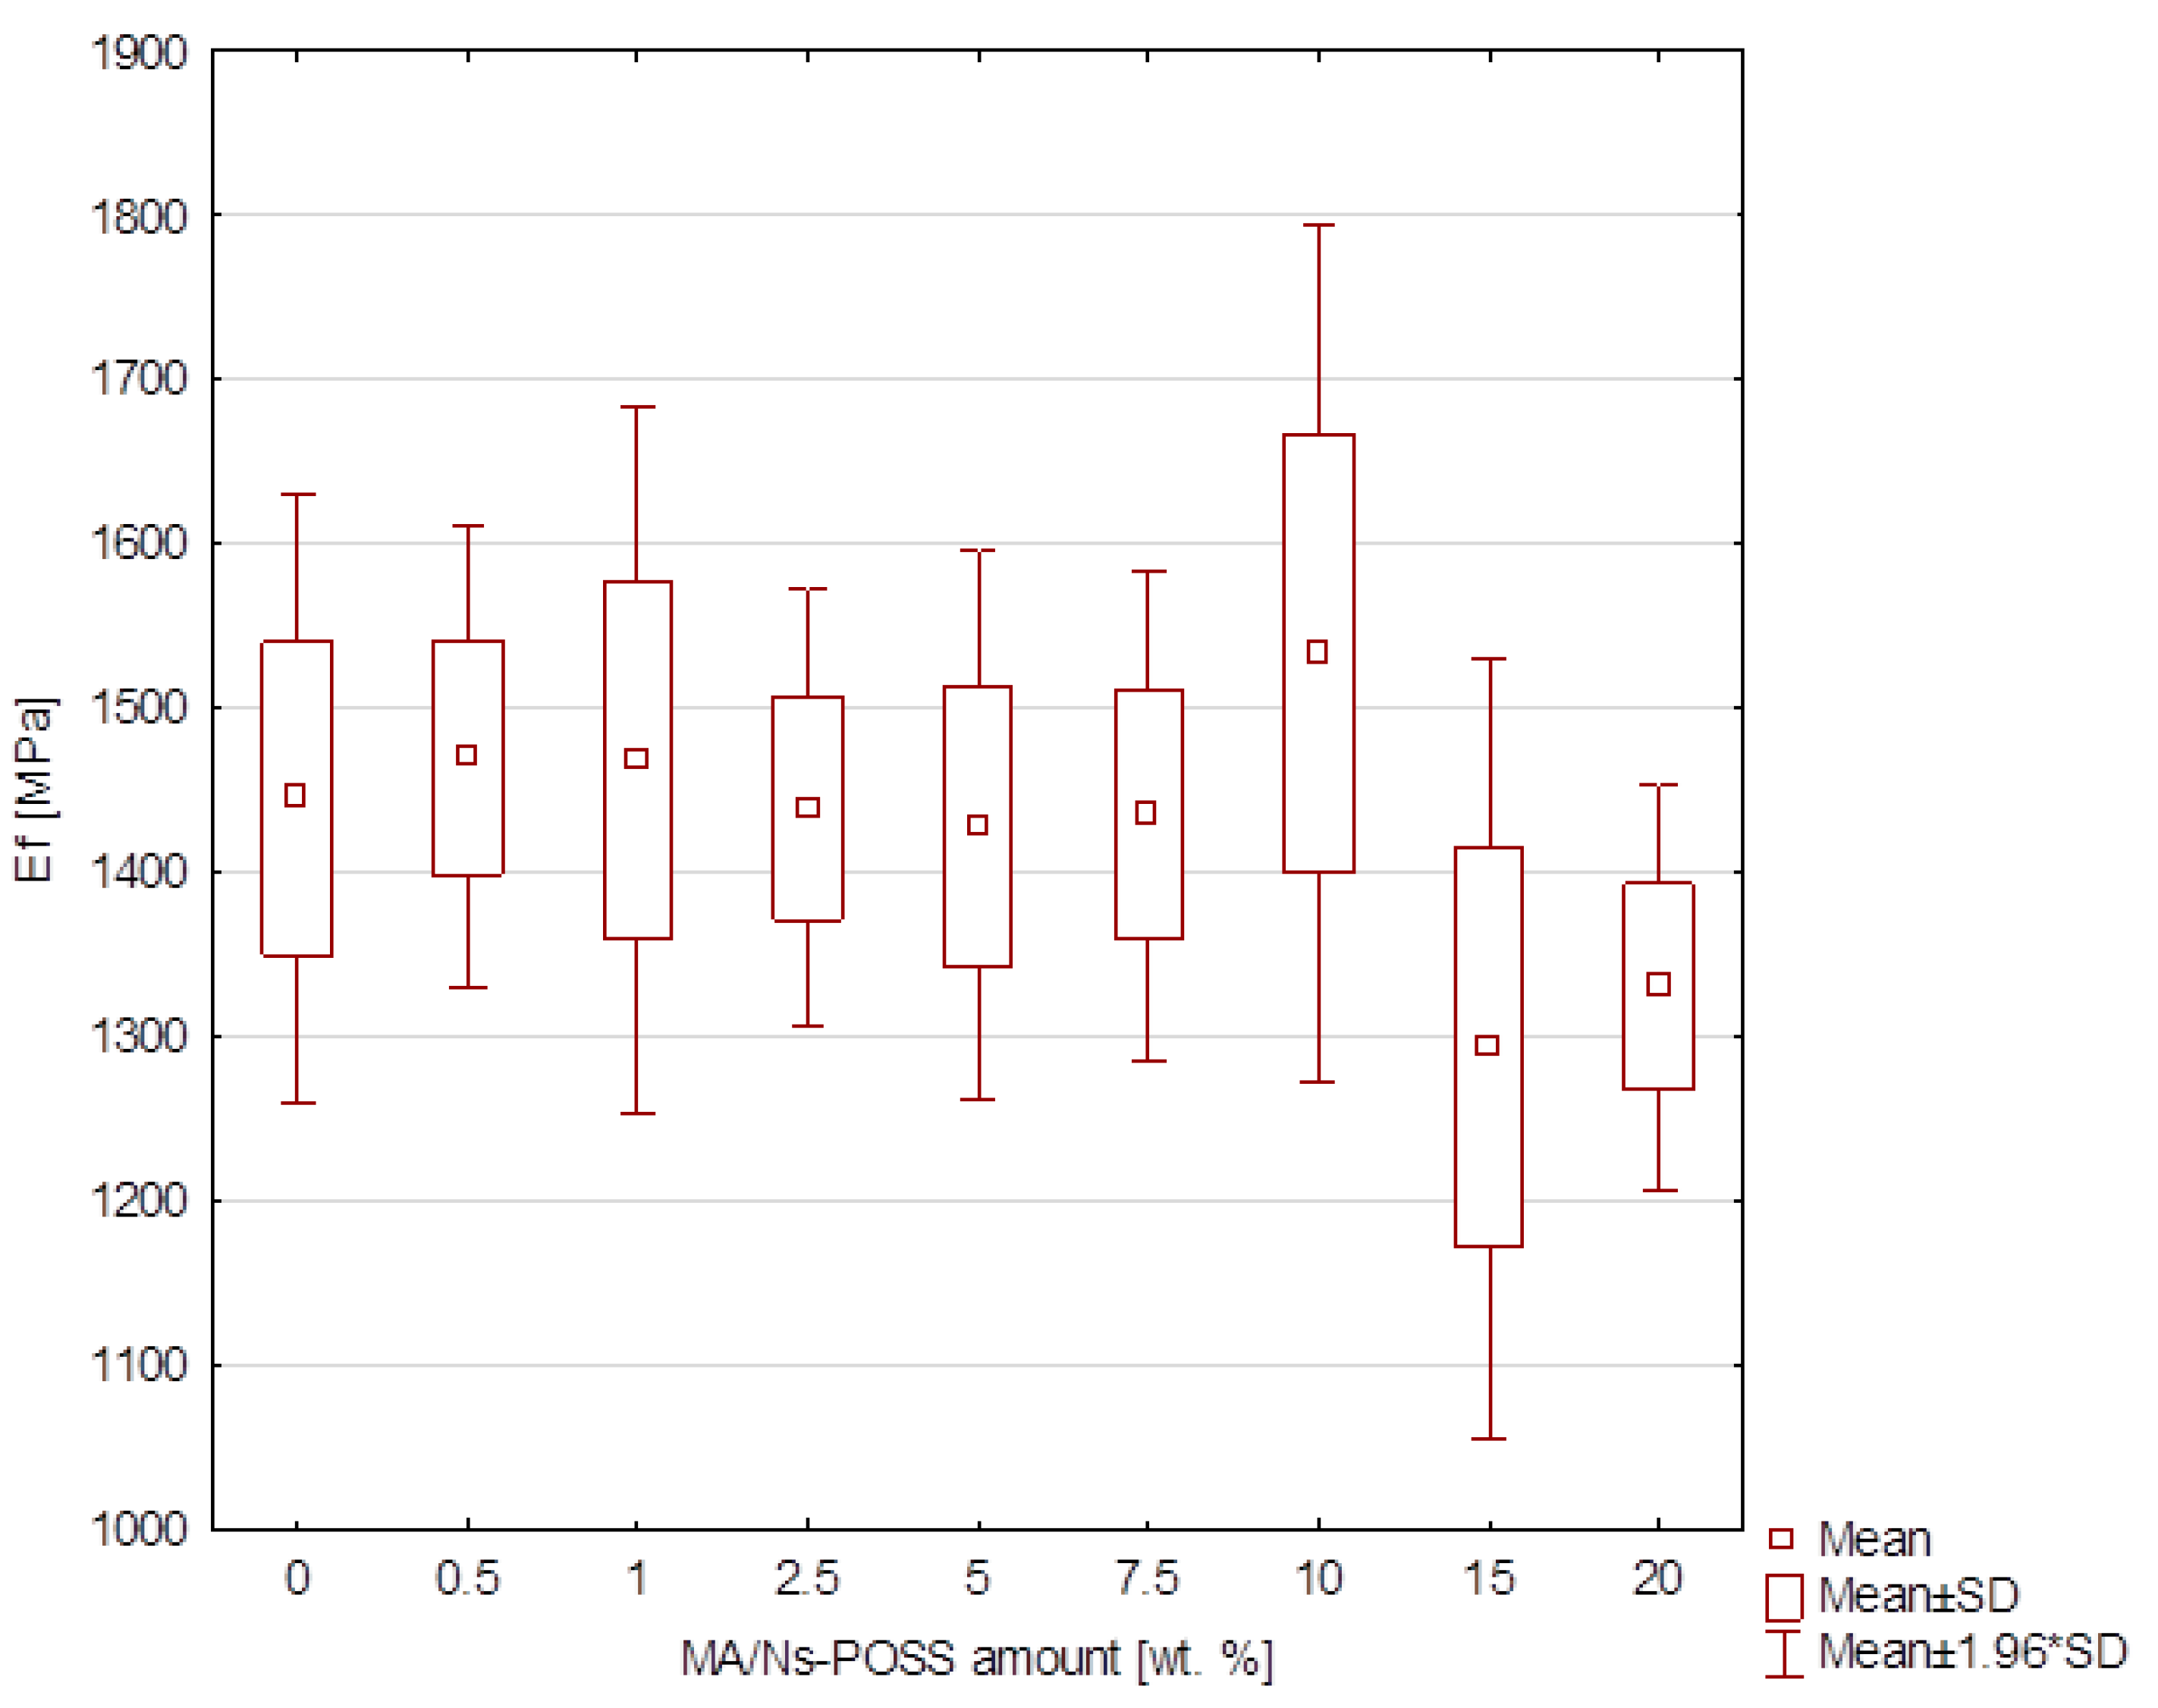
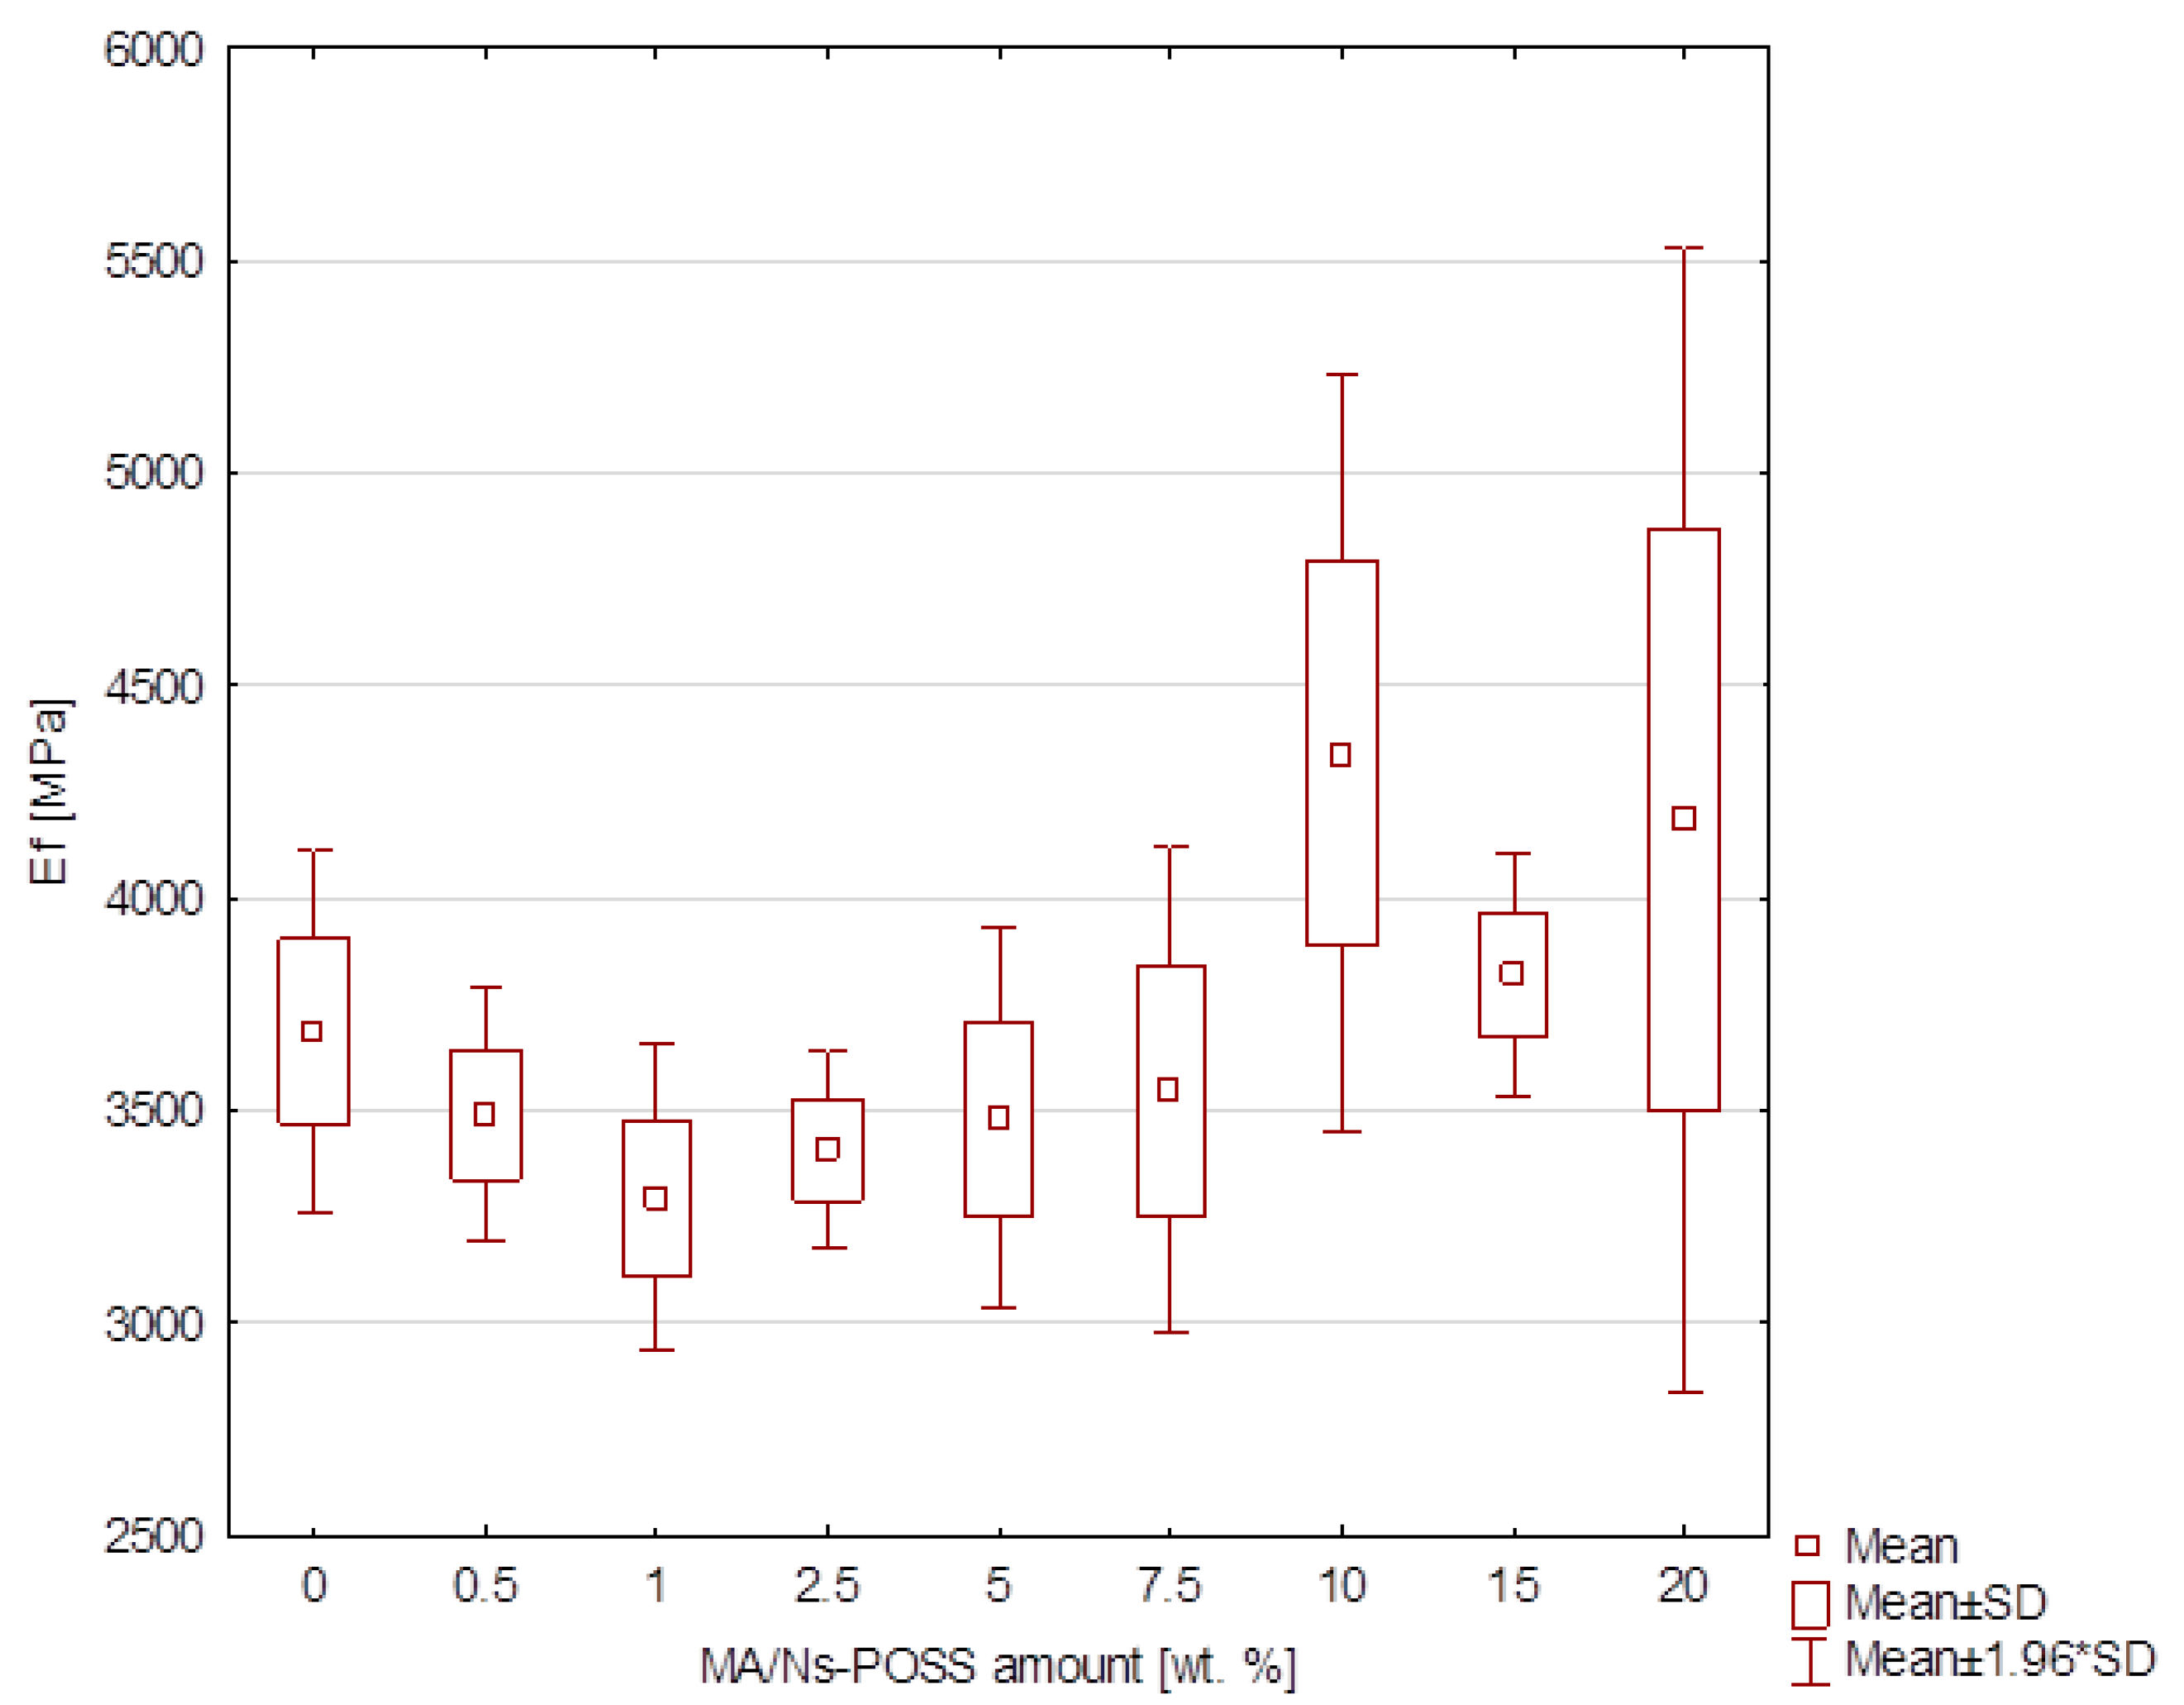
3.2. Elasticity Modulus in Bending

The elasticity modulus in bending for resin samples exhibited values within the range of 1060–1700 MPa, whereas composite samples, as expected, revealed higher values compared to resin samples, and were between 3110 and 4990 MPa. An ANOVA test of the Ef results, which was calculated during the three-point bending test, revealed significant differences between resin sample groups (p < 0.05). The Scheffe test was performed, indicating significant difference between matrices that contained 10 wt.% and 15 wt.% Ma/Ns-POSS (p < 0.05), as presented in Figure 3, with the latter exhibiting the lowest values of elasticity modulus. The highest median and average values of 1530 MPa and 1533.3 MPa, respectively, were noted for the 10 wt.% Ma/Ns-POSS addition to the resin sample; however, they were not significantly different from those of the unmodified resin or resins with 0.5 to 7.5 wt.% Ma/Ns-POSS addition.
Similarly, for composites, significant differences were observed among the tested groups (p < 0.05). Post hoc analysis revealed a significant increase in elasticity modulus values for composite samples with the addition of 10 wt.% MA/Ns-POSS as compared to those with additions of 1 wt.% and 2.5 wt.% (p < 0.05), as shown in Figure 4. Additionally, an increase was observed when comparing the 20 wt.% MA/Ns-POSS composite sample to the 1 wt.% group. Average and median values were the highest for 10 wt.% composite samples.

3.3. Diametral Tensile Strength

DTS was assessed only for the composite samples (Figure 5). The range for DTS results was within 14.51–42.38 MPa. The average and median values were the highest for the composites with the lowest (0.5 wt.%) concentration of MA/Ns-POSS, appropriately 35.37 MPa and 35.33 MPa, and decreased with the addition of MA/Ns-POSS. Composite samples with a 5 wt.% MA/NS-POSS addition displayed the lowest average DTS values of 23.42 MPa. Statistical analysis revealed a significant effect of MA/Ns-POSS addition to the experimental group (p = 0.0000). There was a noticeable decrease in DTS for samples containing 5 wt.% MA/Ns-POSS as compared to 0.5 wt.% and 1 wt.% (p < 0.05). The decrease was still noted for higher concentrations (7.5, 10, 15, and 20 wt.%) in comparison to composite with 0.5 wt.% POSS addition (p < 0.05).

3.4. Hardness

The resins displayed the minimum HV values of 17 for material with 1 wt.% MA/Ns-POSS and maximum of 28 for material with 10 wt.% MA/Ns-POSS, with the latter also obtaining the highest median and average values. Composite samples’ testing disclosed results falling within the 32–46 HV range. Considering average values, the hardness was statistically impacted by the MA/Ns-POSS addition, both for the resins (p = 0.0179) and composites (p = 0.0000). For resins (Figure 6), the highest hardness was obtained for the 10 wt.% Ma/Ns-POSS addition and was significantly higher than for the one with 20 wt.%.
As for the composite samples, modification with 20 wt.% MA/Ns-POSS resulted in the highest hardness (42.22 HV), whereas the unmodified composite had the lowest one. Pairwise comparison of composite samples revealed a significant increase for 0.5 and 20 wt.% POSS (p < 0.05) when compared to the control group. An increase was also noticeable when samples containing 20 wt.% MA/Ns-POSS were compared with the 5, 7.5, and 10 wt.% Ma/Ns-POSS groups shown in Figure 7.

3.5. Polymerization Shrinkage Stress

Table 1 shows polymerization stress values for control and experimental groups of composite samples. The results indicate a decrease for 10 wt.% composite samples as compared to the control group and lower concentration groups. For higher concentrations, the decreasing trend was also visible and more pronounced compared to the unmodified composite. Mean stress values were lowest for composites with 15 and 20 wt.% MA/Ns-POSS concentrations.

3.6. Degree of Conversion Analysis

The degree of conversion (DC) was measured exclusively for the composite samples, with the results presented in Table 2. The sample containing 15 wt.% MA/Ns-POSS exhibited the highest mean DC value of 78%, representing a significant increase compared to the control group, which showed a DC of 58.0%. The lowest DC was observed in the 1 wt.% group—53%. Overall, composites with up to 10 wt.% MA/Ns-POSS showed only slight or insignificant differences in DC relative to the control. A sharp increase in DC occurred at 15 wt.%, followed by a decrease at 20 wt.%, which still demonstrated a relatively high DC of 70.0%—substantially greater than that of the pure composite.

4. Discussion

This study investigated the effect of methacrylate-POSS in nanosilica dispersion addition on the mechanical properties of experimental dental resins and composites. To thoroughly examine the impact of MA/Ns-POSS addition on the samples, both resin matrices and composites were tested. This enabled the authors of this study to evaluate the behavior of the samples before and after filler addition. The results in both groups suggest that there were minor but significant differences for some mechanical properties, although the trends were not identical in resin and composite groups. Therefore, the null hypothesis is accepted; however, it needs to be highlighted that the increase in mechanical properties for many groups was not highly pronounced. Fong et al. [14] indicated that the substitution of Bis-GMA with methacrylate-POSS leaving 10% or less mass fraction of POSS in the samples resulted in the best mechanical properties. Similar conclusions can be found in Wu X et al.’s [19] work, where samples with MA-POSS concentrations higher than 10 wt.% displayed a sharp decrease in mechanical properties. The authors feel obligated to note that in order to compare these conclusions with the current study, the differences in methodology should be underlined. For this study, the wt.% of POSS addition was calculated only for the matrices instead of the whole mixture to facilitate sample preparation. This was also the case for composite samples. This means that the authors chose to calculate POSS mass fraction for the already prepared matrices containing 35 wt.% Bis-GMA, 35 wt.% UDMA, 20 wt.% TEGDMA, and 10 wt.% HEMA. Therefore, 10 wt.% POSS addition in the current article is approx. 9.09 wt.% calculated for the whole mixture. In reality, this number is even lower because of the nanosilica dispersion of the MA-POSS used in this study, further diluting the MA-POSS content to 6.37 wt.%. Since previous studies did not use MA-POSS with nanosilica dispersion, this could significantly contribute to the differences in mechanical properties when comparing mean wt.% values between these articles. Nevertheless, some studies observed the maximum increase in mechanical properties for composite samples with MA-POSS concentrations below 5 wt.% [27] or even 2 wt.% [19], which was not observed in our study. All of the above raise attention to the complexity of further studies on MA-POSS nanocomposites and resins. This study follows a more standardized protocol for the mechanical testing of experimental materials. Also, the authors acknowledge that another limitation of this study is the absence of wear resistance measurements, which are also important for evaluating clinical applicability.

4.1. Flexural Strength and Elasticity Modulus in Bending

The three-point bending test is a well-known test performed to predict dental material behavior under mechanical loads such as occlusal forces [28]. To determine if a certain filler will enhance the properties of a material, flexural strength should also be tested as a standard for mechanical property testing. In our study, only resin samples modified with MA/Ns-POSS revealed a statistically significant difference in FS. Although this does not give us insight into methacrylate-POSS’s influence on the prepared samples, it is worth noting that the properties did not decrease in comparison to the control material. With other properties slightly increased, this constitutes a reasonable argument for MA/Ns-POSS addition. In light of our study, this leads to the conclusion that MA/Ns-POSS, even in the highest concentration measured, offered stable flexural strength and elasticity modulus in bending, with a possible increase in other properties. The lack of statistical difference between flexural properties of unmodified and modified materials can be attributed to two facts. Firstly, as we discussed earlier, even the addition of 20 wt.% (which amount is in fact even lower if calculated for the whole matrix and pure MA-POSS) might still be insufficient to drastically improve or diminish composite properties. Further studies with even higher additions of MA-POSS could presumably produce more insightful results. Secondly, the addition of silica filler improved the mechanical properties of composite samples compared to resin samples enough to counter and mask the decrease seen between the FS of resins modified with 20 wt.% or 10 wt.% MA/Ns-POSS. This tendency, however, was not observed in elasticity modulus in bending, and, as shown in Figure 4, both resins and composites achieved satisfactory properties, even with the highest concentrations of MA/Ns-POSS. For composites, the increase of 10 wt.% and 20 wt.% might indicate another third explanation related to the nanosilica dispersion of POSS. Because MA/Ns-POSS acts as an organic/inorganic filler particle [29], its addition correlates with the addition of nanosilica from the prefabricated mixture and silanized silica. In Yizhi Liu’s work [27], we can find the possible mechanism explaining our results, as they stated that an additional filler could be beneficial for the mixture—however, only up to a certain point, in which aggregation occurs. Due to aggregation, the more densely packed soft shell of MA-POSS particles intercepts the hard inorganic core’s ability to withstand higher mechanical stress. Effectively, this results in inferior mechanical properties of the composite or resin. The results of this study might be in line with the explanation described above, but the MA-POSS load might be too low to observe an unequivocal decrease. The MA/Ns-POSS mixture is, according to product information, excellently dispersed, which allows for better flow properties [12] and perhaps reduces the tendency of MA/Ns-POSS particles to aggregate, allowing for higher loads in composite and resin samples.

4.2. Diametral Tensile Strength

DTS was assessed only for composite samples, a decision made by the authors taking into account the specific nature of the test. Resin samples lack filler content, which makes them much more plastic, and therefore it is more difficult to record the destruction point of the cylindrical sample. The DTS test revealed, contradictory to the results described in paragraph 4.1, an increase in properties and the highest median for the lowest concentration of MA/Ns-POSS, 0.5 wt.%. This could be partially attributed to the composite becoming more brittle with higher POSS concentrations, a mechanism described in Hao Fong et al.’s work [14]. A higher methacrylate POSS load in the dental composite can make it “over-crosslinked”, as described by the authors, resulting in increased brittleness, which correlates directly with the lower DTS values obtained, as this is a test sensitive to changes in said mechanical property.

4.3. Hardness

Hardness, alongside flexural strength and elasticity modulus in bending, is a key property of dental composite materials and restorations. It reflects the surface behavior of a material and can be correlated with its wear over time. The hardness of dental filling material should closely match that of the natural tooth to minimize wear when in contact with opposing teeth, restorations, or food during mastication. For cured matrices, the highest values were obtained for material with 10 wt.% of MA/NS-POSS. Contrarily, composite samples revealed the same principle but for modification with 20 wt.%. The hypothesis for this difference could be attributed to insufficient MA/Ns-POSS dispersion within the matrix samples and the beneficial effect of additional filler being dispersed within the composite, thus increasing surface hardness. Importantly, statistical analysis revealed a difference between resin samples with 20 wt.% and 10 wt.% MA/Ns-POSS; however, the hardness of samples with higher concentrations of the addition did not differ from the control group. This fact reinforces the argument made by the authors that it was not the high MA/Ns-POSS load that negatively affected the sample; rather, higher filler content reinforced the sample, increasing the hardness of the material.

4.4. Polymerization Shrinkage Stress

Polymerization stress measurement is a way of obtaining data related to one of the key dental composite properties directly related to volumetric shrinkage [25,30]. High volumetric shrinkage and therefore high polymerization stress can be described as one of the most important factors causing microleakage, which can consequently lead to bacteria, saliva, and debris trapped within the narrow crevice between composite restoration and tooth structure [31]. Naturally, this can cause secondary caries and ultimately restoration failure. The addition of various fillers influences volumetric shrinkage and polymerization shrinkage stress, striving to reduce these forces and improving the clinical utility of the tested composite materials. Despite being a relative novelty, MA-POSS has already shown to radically decrease volumetric shrinkage, usually with the increase in MA-POSS addition [19,27,32]. However, it is important to note that some studies also suggest that MA-POSS substitution of Bis-GMA did not affect volumetric shrinkage substantially [14]. In our study, MA/Ns-POSS proved to reduce polymerization shrinkage stress composites with 10 wt.%, 15 wt.%, and 20 wt.% MA/NS-POSS. This effect is in line with other results of the highest tested concentrations, proving beneficial to the experimental composite, which underlines the need for further studies utilizing loads exceeding 20 wt.% of MA/Ns-POSS to examine the possible threshold of the properties decreasing in the mechanisms described previously. As for polymerization shrinkage reduction, the main mechanism prevalent and described in the literature is related to matrix volume changes during radical polymerization reactions. This effect does not influence POSS particles and with its unchanged volume polymerization stress and shrinkage are reduced [18]. Importantly, MA-POSS is proven to be a part of the polymer matrix due to the double bonds present in eight methacrylate groups attached to the inorganic core, subsequently resulting in participation in the cross linking of polymer chains from the matrix [33]. An additional explanation arises from the fact that MA-POSS particles can affect the plasticity of the composite, facilitating free flow and in turn the rearrangement of the material. Subsequently, this would reduce the internal stress within the composite and reduce polymerization shrinkage stress.

4.5. Degree of Conversion Analysis

Double bond conversion analysis is essential for assessing polymerization progress and establishing meaningful correlations between the incorporation of novel fillers and the mechanical performance of experimental dental composites. An increased degree of conversion (DC) positively influences key mechanical properties such as surface hardness and flexural modulus [34]. In the present study, the highest DC values were observed for the samples containing 15 wt.% and 20 wt.% of MA/Ns-POSS. This corresponds with HV and Ef results. This enhancement may be attributed to the fact that the rigid structure of MA-POSS participates in the delay in reaching the gel point and thus provides more time for the polymerization process and double C=C bond conversion [35]. The extension of the pre-gel phase, in addition to increasing the efficiency of double bond conversion, also allows for a reduction in the shrinkage stresses generated, which was also visible in our studies. The authors note that the DC analysis was carried out only for composite samples, which represents one of the limitations of this study.

5. Conclusions

The differences in mechanical properties of experimental resins and composites containing up to 20 wt.% MA/Ns-POSS exhibited moderate but meaningful trends. Notably, the addition of 10 wt.% POSS showed promising improvements in elasticity modulus in bending (for both resins and composites), Vickers hardness, and polymerization shrinkage stress. Furthermore, composites with 20 wt.% MA/Ns-POSS displayed the lowest shrinkage stress values and the highest surface hardness, with a significantly increased degree of conversion, indicating that higher MA/Ns-POSS loadings may further enhance specific properties. These findings provide a strong rationale for future investigations exploring concentrations above 20 wt.% of MA/Ns-POSS.

Author Contributions

Conceptualization, N.S. and K.B.; methodology, N.S., K.B., K.K., M.K., I.B.-R. and P.K.; validation, K.B.; formal analysis, K.K.; investigation, N.S., M.K., I.B.-R., P.K. and K.B.; resources, N.S. and K.B.; data curation, K.K.; writing—original draft preparation, N.S.; writing—review and editing, K.B., I.B.-R. and B.L.; visualization, N.S., P.K. and B.L.; supervision, K.B.; project administration, K.B.; funding acquisition, B.L. All authors have read and agreed to the published version of the manuscript.

Funding

This research received no external funding.

Institutional Review Board Statement

Not applicable.

Informed Consent Statement

Not applicable.

Data Availability Statement

Data will be available upon request.

Conflicts of Interest

The authors declare no conflicts of interest.

Appendix A

Table A1. Mean, standard deviation, median, minimum, and maximum values of Vickers hardness, diametral tensile strength (DTS), three-point bending flexural strength (TPB), and modulus of elasticity in bending (FS modulus) of the tested resins.
Amount of MA/Ns-POSS
[wt.%]
MeanSDMedianMinMax
Hardness HV [-]
021.001.7121.018.025.0
0.520.582.0720.518.024.0
120.582.2721.017.025.0
2.521.331.1522.019.023.0
520.831.6421.018.023.0
7.521.001.7121.018.025.0
10 *23.502.3923.020.028.0
1521.081.5121.019.023.0
20 *20.081.1620.019.022.0
Flexural modulus [MPa]
01445.0095.031480.01290.01530.0
0.51470.0071.551465.01380.01580.0
11468.33109.441485.01310.01600.0
2.51439.1768.291435.01330.01540.0
51428.3385.651435.01320.01540.0
7.51435.0076.091445.01300.01510.0
10 *1533.33133.671530.01370.01700.0
15 *1293.33121.271315.01060.01410.0
201330.0062.931325.01240.01410.0
Flexural strength [MPa]
067.554.3567.8561.0074.10
0.569.173.0369.1565.8072.90
167.922.4867.8065.0070.60
2.569.971.4470.1567.7071.90
567.101.9166.2565.2070.30
7.566.905.3067.9058.5072.50
10 *71.623.5871.6567.5075.60
15 *63.584.4263.7055.7069.10
2065.182.9766.0559.2067.20
* marks the samples differing significantly (p < 0.05) in the measured properties.
Table A2. Mean, standard deviation, median, minimum, and maximum values of Vickers hardness, diametral tensile strength (DTS), three-point bending flexural strength (TPB), and modulus of elasticity in bending (FS modulus) of the tested composites.
Amount of MA/Ns-POSS
[wt.%]
MeanSDMedianMinMax
Hardness [-]
0 *34.221.5634.032.037.0
0.538.781.7239.037.042.0
137.331.7337.035.040.0
2.537.671.9438.033.040.0
5 *36.561.3336.035.039.0
7.5 *36.111.8336.034.040.0
10 *35.892.0336.033.038.0
1537.561.5138.035.040.0
20 *42.221.8642.040.046.0
Flexural modulus [MPa]
03686.0217.783720.03470.03990.0
0.53490.0151.663530.03270.03650.0
1 *3294.0183.523200.03140.03560.0
2.5 *3408.0119.043370.03310.03600.0
53482.0228.193470.03200.03760.0
7.53548.0292.523540.03110.03900.0
10 *4340.0453.824330.03700.04780.0
153818.0147.213760.03680.04050.0
20 *4184.0687.813900.03510.04990.0
Flexural strength [MPa]
069.564.4668.864.676.8
0.570.848.8969.259.080.9
175.289.871.266.988.3
2.571.848.6570.560.780.7
569.067.9969.660.677.2
7.555.7220.4559.531.384.3
1079.8413.2383.864.997.6
1563.9410.6168.846.471.9
2061.7613.9458.347.178.2
Diametral tensile strength [MPa]
027.615.2427.8617.3433.51
0.5 *35.371.2435.3333.5737.84
1 *33.314.7634.7022.2636.95
2.531.456.4132.3021.9642.38
5 *23.425.1522.0817.2032.36
7.5 *25.465.1025.3318.5434.28
10 *25.435.6426.6314.5133.26
15 *25.944.5426.7919.4931.80
20*24.451.7824.1922.3727.81
* marks the samples differing significantly (p < 0.05) in the measured properties.

References

  1. Yadav, R.; Kumar, M. Dental Restorative Composite Materials: A Review. J. Oral. Biosci. 2019, 61, 78–83. [Google Scholar] [CrossRef] [PubMed]
  2. Wang, Y.; Zhu, M.; Zhu, X.X. Functional Fillers for Dental Resin Composites. Acta Biomater. 2021, 122, 50–65. [Google Scholar] [CrossRef]
  3. Xue, J.; Wang, J.; Feng, D.; Huang, H.; Wang, M. Application of Antimicrobial Polymers in the Development of Dental Resin Composite. Molecules 2020, 25, 4738. [Google Scholar] [CrossRef]
  4. Wang, W.; Sun, X.; Huang, L.; Gao, Y.; Ban, J.; Shen, L.; Chen, J. Structure–Property Relationships in Hybrid Nanocomposite Resins Containing and Multifunctional Oligomeric Silsesquioxanes. Int. J. Nanomed. 2014, 9, 841–852. [Google Scholar] [CrossRef] [PubMed]
  5. Shah, Y.; Shiraguppi, V.; Deosarkar, B.; Shelke, U. Long-Term Survival and Reasons for Failure in Direct Anterior Composite Restorations: A Systematic Review. J. Conserv. Dent. 2021, 24, 415. [Google Scholar] [CrossRef]
  6. Demarco, F.F.; Cenci, M.S.; Montagner, A.F.; de Lima, V.P.; Correa, M.B.; Moraes, R.R.; Opdam, N.J.M. Longevity of Composite Restorations Is Definitely Not Only About Materials. Dent. Mater. 2023, 39, 1–12. [Google Scholar] [CrossRef]
  7. Zheng, Y.; Gao, Z.; Han, J. Current Chemistry of Cyclic Oligomeric Silsesquioxanes. Curr. Org. Chem. 2018, 21, 2814–2828. [Google Scholar] [CrossRef]
  8. Abbasi, M.R.; Karimi, M.; Atai, M. Modified POSS Nano-Structures as Novel Co-Initiator-Crosslinker: Synthesis and Characterization. Dent. Mater. 2021, 37, 1283–1294. [Google Scholar] [CrossRef]
  9. Yu, X.; Yang, S.; Han, D.; Wang, T.; Xie, Q.; Xie, W. A Novel Dental Resin Composite Based on POSS and MDP-Modified Zirconia: Preparation and Evaluation. J. Dent. 2025, 155, 105638. [Google Scholar] [CrossRef]
  10. Liu, S.; Guo, R.; Li, C.; Lu, C.; Yang, G.; Wang, F.; Nie, J.; Ma, C.; Gao, M. POSS Hybrid Hydrogels: A Brief Review of Synthesis, Properties and Applications. Eur. Polym. J. 2021, 143, 110180. [Google Scholar] [CrossRef]
  11. Yudovin-Farber, I.; Beyth, N.; Nyska, A.; Weiss, E.I.; Golenser, J.; Domb, A.J. Surface Characterization and Biocompatibility of Restorative Resin Containing Nanoparticles. Biomacromolecules 2008, 9, 3044–3050. [Google Scholar] [CrossRef] [PubMed]
  12. Szwarc-Rzepka, K.; Ciesielczyk, F.; Jesionowski, T. Preparation and Physicochemical Properties of Functionalized Silica/Octamethacryl-Silsesquioxane Hybrid Systems. J. Nanomater. 2013, 2013, 674237. [Google Scholar] [CrossRef]
  13. Blanco, I.; Abate, L.; Bottino, F.A.; Bottino, P. Synthesis, Characterization and Thermal Stability of New Dumbbell-Shaped Isobutyl-Substituted POSSs Linked by Aromatic Bridges. J. Therm. Anal. Calorim. 2014, 117, 243–250. [Google Scholar] [CrossRef]
  14. Fong, H.; Dickens, S.; Flaim, G. Evaluation of Dental Restorative Composites Containing Polyhedral Oligomeric Silsesquioxane Methacrylate. Dent. Mater. 2005, 21, 520–529. [Google Scholar] [CrossRef] [PubMed]
  15. Wang, J.; Liu, Y.; Yu, J.; Sun, Y.; Xie, W. Study of POSS on the Properties of Novel Inorganic Dental Composite Resin. Polymers 2020, 12, 478. [Google Scholar] [CrossRef]
  16. Kreutz, M.; Wiegand, A.; Stawarczyk, B.; Lümkemann, N.; Rizk, M. Characterization of Methacrylate-Based Resins Containing Methacryl-Polyhedral Oligomeric Silsesquioxanes (MA-POSS-8). Materials 2021, 14, 1680. [Google Scholar] [CrossRef]
  17. Canellas, T.A.T.; de Almeida Neves, A.; dos Santos, I.K.B.; de Rezende, A.R.P.; Fellows, C.E.; da Silva, E.M. Characterization of Low-Shrinkage Dental Composites Containing Methacrylethyl-Polyhedral Oligomeric Silsesquioxane (ME-POSS). J. Mech. Behav. Biomed. Mater. 2019, 90, 566–574. [Google Scholar] [CrossRef]
  18. Ozimek, J.; Łukaszewska, I.; Pielichowski, K. POSS and SSQ Materials in Dental Applications: Recent Advances and Future Outlooks. Int. J. Mol. Sci. 2023, 24, 4493. [Google Scholar] [CrossRef]
  19. Wu, X.; Sun, Y.; Xie, W.; Liu, Y.; Song, X. Development of Novel Dental Nanocomposites Reinforced with Polyhedral Oligomeric Silsesquioxane (POSS). Dent. Mater. 2010, 26, 456–462. [Google Scholar] [CrossRef] [PubMed]
  20. Liu, Y.; Sun, Y.; Zeng, F.; Xie, W.; Liu, Y.; Geng, L. Effect of Nano SiO2 Particles on the Morphology and Mechanical Properties of POSS Nanocomposite Dental Resins. J. Nanopart. Res. 2014, 16, 2736. [Google Scholar] [CrossRef]
  21. Bociong, K.; Szczesio, A.; Krasowski, M.; Sokolowski, J. The Influence of Filler Amount on Selected Properties of New Experimental Resin Dental Composite. Open Chem. 2018, 16, 905–911. [Google Scholar] [CrossRef]
  22. Sabbagh, J.; Ryelandt, L.; Bachérius, L.; Biebuyck, J.-J.; Vreven, J.; Lambrechts, P.; Leloup, G. Characterization of the Inorganic Fraction of Resin Composites. J. Oral. Rehabil. 2004, 31, 1090–1101. [Google Scholar] [CrossRef] [PubMed]
  23. ISO 4049; Dentistry—Polymer-Based Restorative Materials. ISO: Geneva, Switzerland, 2019.
  24. Timoshenko, S.; Timoshenko, S.; Goodier, J.N. Theory of Elasticity, 2nd ed.; Timoshenko, S., Goodier, J.N., Eds.; McGraw-Hill Book Company: New York, NY, USA, 1951. [Google Scholar]
  25. Bociong, K.; Szczesio, A.; Sokolowski, K.; Domarecka, M.; Sokolowski, J.; Krasowski, M.; Lukomska-Szymanska, M. The Influence of Water Sorption of Dental Light-Cured Composites on Shrinkage Stress. Materials 2017, 10, 1142. [Google Scholar] [CrossRef]
  26. Domarecka, M.; Szczesio-Wlodarczyk, A.; Krasowski, M.; Fronczek, M.; Gozdek, T.; Sokolowski, J.; Bociong, K. A Comparative Study of the Mechanical Properties of Selected Dental Composites with a Dual-Curing System with Light-Curing Composites. Coatings 2021, 11, 1255. [Google Scholar] [CrossRef]
  27. Liu, Y.; Wu, X.; Sun, Y.; Xie, W. POSS Dental Nanocomposite Resin: Synthesis, Shrinkage, Double Bond Conversion, Hardness, and Resistance Properties. Polymers 2018, 10, 369. [Google Scholar] [CrossRef]
  28. Gundogdu, M. The Evaluation of Flexural Strength of Composite Resin Materials with and without Fiber. Dentistry 2014, 4, 1. [Google Scholar] [CrossRef]
  29. Baldi, F.; Bignotti, F.; Fina, A.; Tabuani, D.; Riccò, T. Mechanical Characterization of Polyhedral Oligomeric Silsesquioxane/Polypropylene Blends. J. Appl. Polym. Sci. 2007, 105, 935–943. [Google Scholar] [CrossRef]
  30. Sokolowski, G.; Szczesio, A.; Bociong, K.; Kaluzinska, K.; Lapinska, B.; Sokolowski, J.; Domarecka, M.; Lukomska-Szymanska, M. Dental Resin Cements-The Influence of Water Sorption on Contraction Stress Changes and Hydroscopic Expansion. Materials 2018, 10, 11973. [Google Scholar] [CrossRef]
  31. Li, Z.; Zhang, H.; Xiong, G.; Zhang, J.; Guo, R.; Li, L.; Zhou, H.; Chen, G.; Zhou, Z.; Li, Q. A Low-Shrinkage Dental Composite with Epoxy-Polyhedral Oligomeric Silsesquioxane. J. Mech. Behav. Biomed. Mater. 2020, 103, 103515. [Google Scholar] [CrossRef] [PubMed]
  32. Correa Netto, L.R.; Borges, A.L.S.; Guimarães, H.B.; de Almeida, E.R.N.; Poskus, L.T.; da Silva, E.M. Marginal Integrity of Restorations Produced with a Model Composite Based on Polyhedral Oligomeric Silsesquioxane (POSS). J. Appl. Oral Sci. 2015, 23, 450–458. [Google Scholar] [CrossRef] [PubMed]
  33. Madhuranthakam, C.M.R.; Pandiyan, S.; Elkamel, A. Molecular Simulations of Low-Shrinkage Dental Resins Containing Methacryl-Based Polyhedral Oligomeric Silsesquioxane (POSS). Polymers 2023, 15, 432. [Google Scholar] [CrossRef] [PubMed]
  34. Stansbury, J.W.; Dickens, S.H. Determination of Double Bond Conversion in Dental Resins by near Infrared Spectroscopy. Dent. Mater. 2001, 17, 71–79. [Google Scholar] [CrossRef] [PubMed]
  35. Zhou, Q.; Lin, J.; Li, Q. Study of High-Strength, Low-Shrinkage Dental Resin Composites with Bifunctional Polysilsesquioxane. Dent. Mater. 2025, 41, 755–767. [Google Scholar] [CrossRef] [PubMed]
Figure 1. The influence of MA/Ns-POSS addition on flexural strength (FS [MPa]) of photo-cured resin samples (1250 mW/cm2, 20 s per 1.5 mm of material).
Jcs 09 00403 g001
Figure 2. The influence of MA/Ns-POSS addition on flexural strength (FS [MPa]) of photo-cured experimental composites (1250 mW/cm2, 20 s per 1.5 mm of material).
Jcs 09 00403 g002
Figure 3. The influence of MA/Ns-POSS addition on elasticity modulus in bending (Ef [MPa]) of photo-cured resin samples (1250 mW/cm2, 20 s per 1.5 mm of material).
Jcs 09 00403 g003
Figure 4. The influence of MA/Ns-POSS addition on elasticity modulus in bending (Ef [MPa]) of photo-cured experimental composites (1250 mW/cm2, 20 s per 1.5 mm of material).
Jcs 09 00403 g004
Figure 5. The influence of MA/Ns-POSS addition on diametral tensile strength (DTS [MPa]) of photo-cured experimental composites (1250 mW/cm2, 20 s per 1.5 mm of material).
Jcs 09 00403 g005
Figure 6. Effect of MA/Ns-POSS addition on Vickers hardness (HV [-]) of photo-cured resin samples (1250 mW/cm2, 20 s per 1.5 mm of material).
Jcs 09 00403 g006
Figure 7. Effect of MA/Ns-POSS addition on Vickers hardness (HV [-]) of photo-cured experimental composites (1250 mW/cm2, 20 s per 1.5 mm of material).
Jcs 09 00403 g007
Table 1. Effect of MA/NS-POSS addition on shrinkage stress values (σr—radial stress, σθ—circumferential stress, σint—reduced shrinkage stress) of photo-cured experimental composites (1250 mW/cm2, 20 s per 1.5 mm of material).
Amount of MA/Ns-POSS
[wt.%]
σr
[MPa]
σϴ
[MPa]
σint
[MPa]
012.2 ± 0.7−13.6 ± 0.825.8 ± 1.5
0.512.3 ± 0.2−13.8 ± 0.226.0 ± 0.3
1.011.9 ± 1.4−13.8 ± 1.125.7 ± 2.5
2.511.8 ± 0.8−13.4 ± 0.725.2 ± 1.5
5.011.5 ± 0.8−13.1 ± 0.724.6 ± 1.4
7.512.1 ± 0.2−13.6 ± 0.225.7 ± 0.4
10.011.2 ± 0.4−12.8 ± 0.424.1 ± 0.8
15.09.4 ± 1.6−10.9 ± 1.420.3 ± 3.0
20.010.0 ± 0.8−11.4 ± 1.021.4 ± 1.8
Table 2. Effect of MA/NS-POSS addition on the degree of conversion (DC, %) of photo-cured experimental composites (1250 mW/cm2, 20 s per 1.5 mm of material).
Amount of MA/Ns-POSS
[wt.%]
DC [%]
058.0
0.558.4
1.053.0
2.560.0
5.063.1
7.560.6
10.060.6
15.078.0
20.070.0
Disclaimer/Publisher’s Note: The statements, opinions and data contained in all publications are solely those of the individual author(s) and contributor(s) and not of MDPI and/or the editor(s). MDPI and/or the editor(s) disclaim responsibility for any injury to people or property resulting from any ideas, methods, instructions or products referred to in the content.

