
Additive Manufacturing of Composite Structures with Transverse Thermoelectricity


Abstract
1. Introduction
2. Materials and Methods
2.1. Material Synthesis
2.2. Printer Setup
2.3. Printing Process
2.4. Post-Processing
2.5. Testing Instruments
3. Results and Discussion
3.1. Printability
3.2. Shrinkage
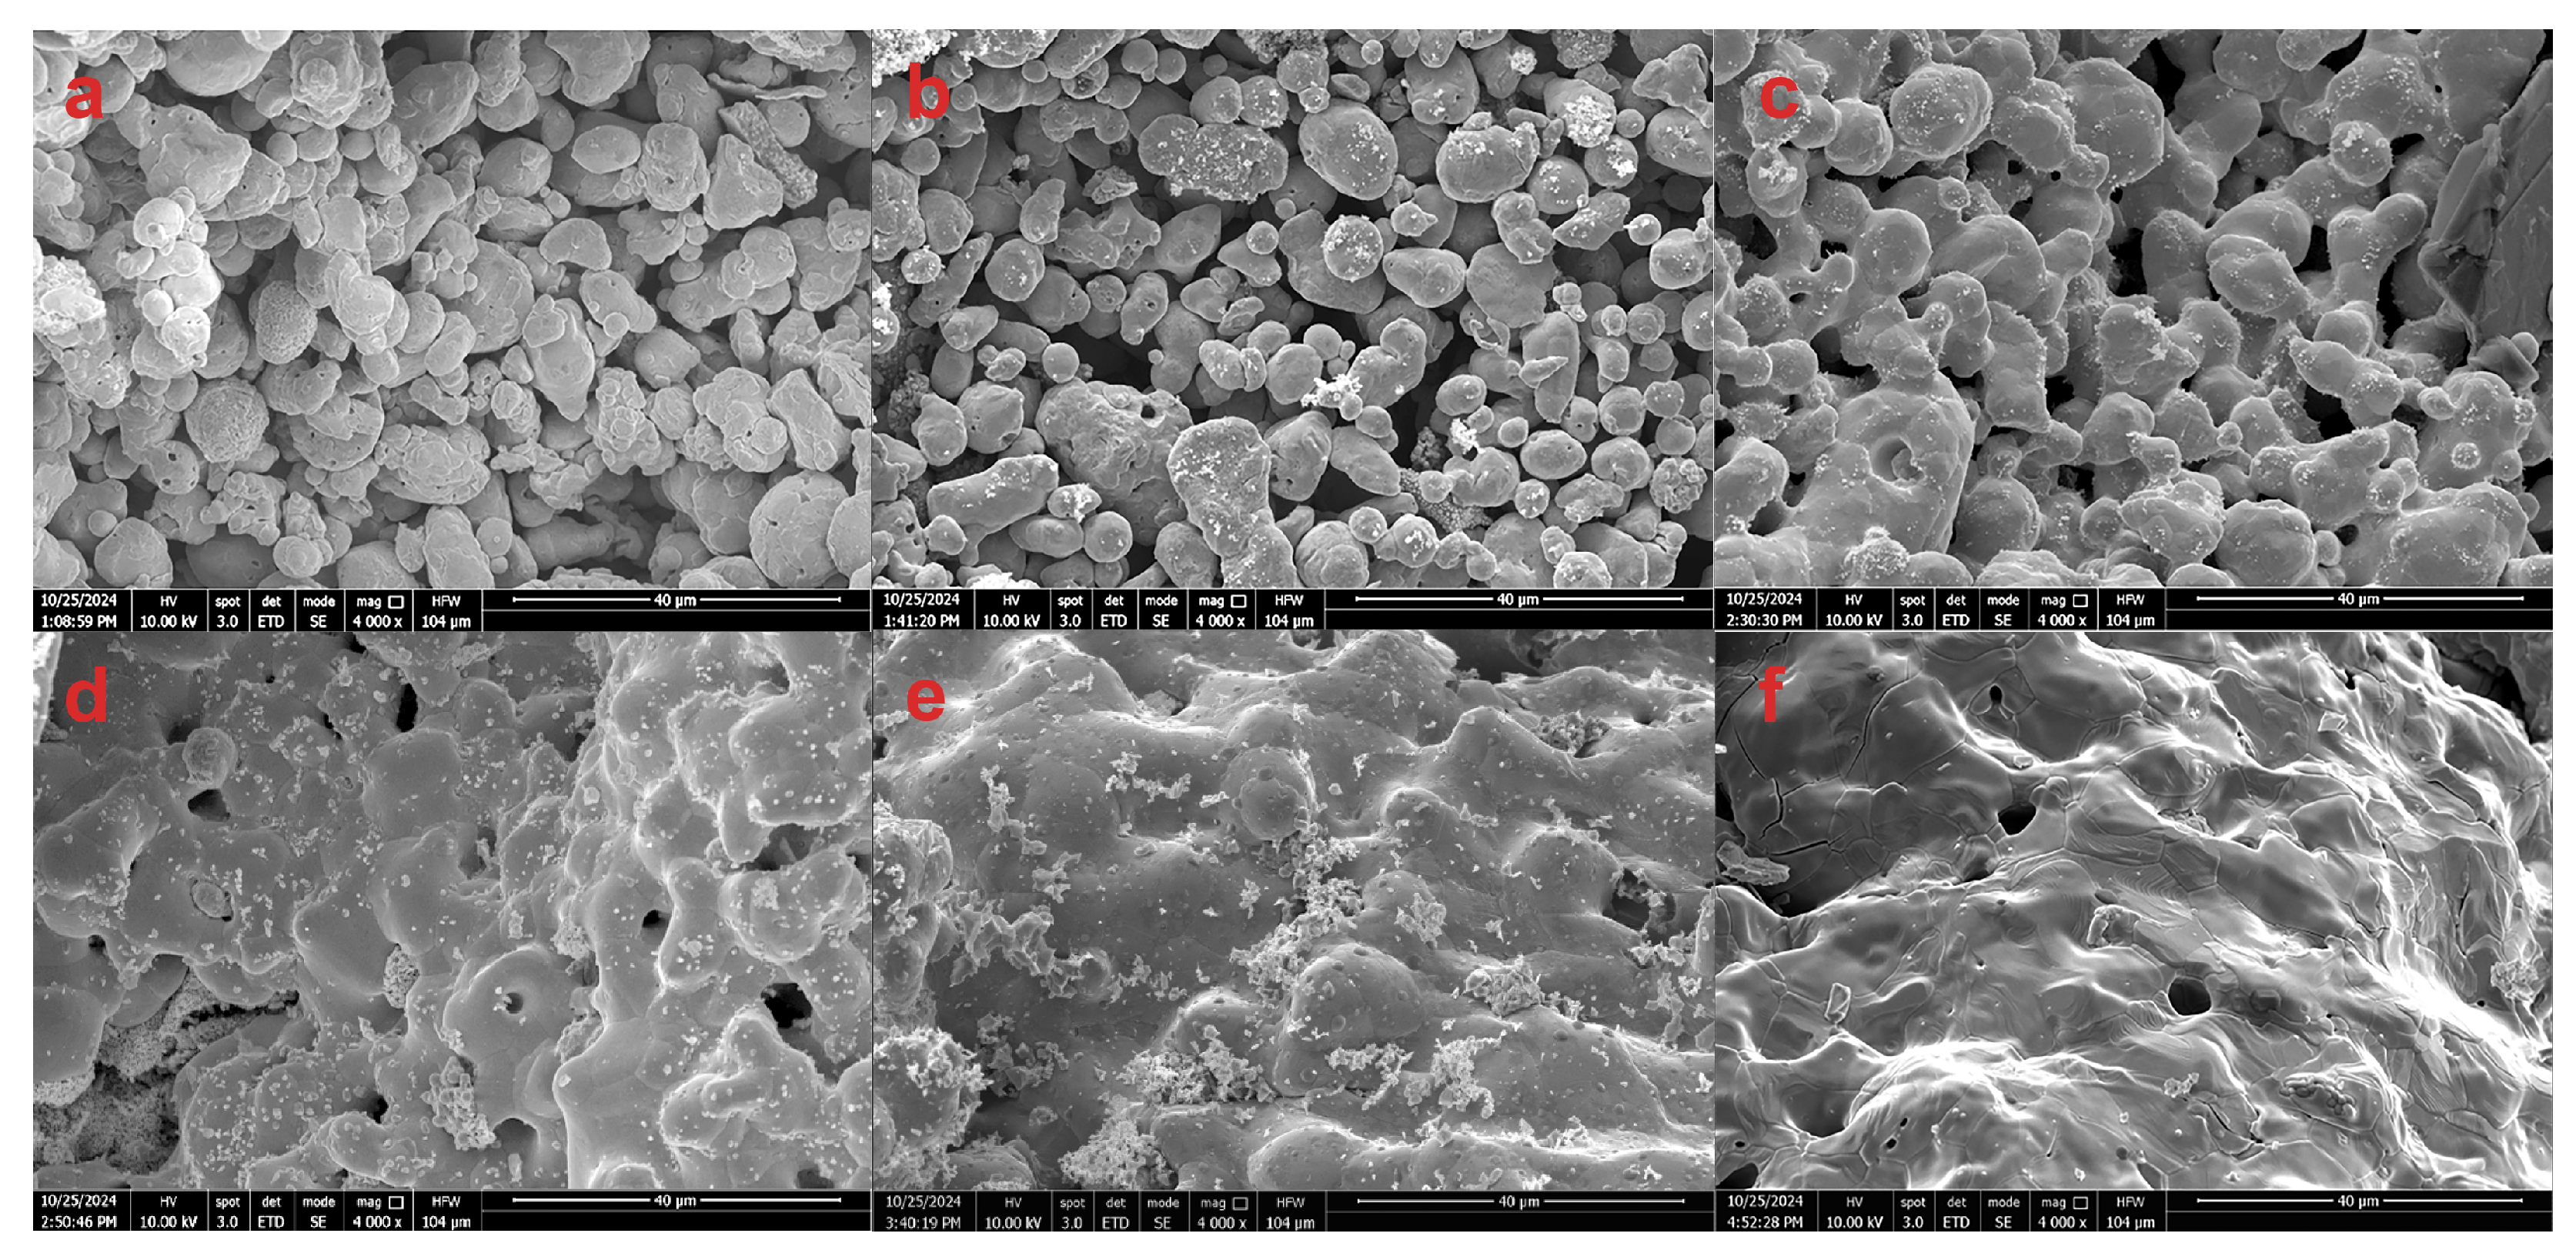
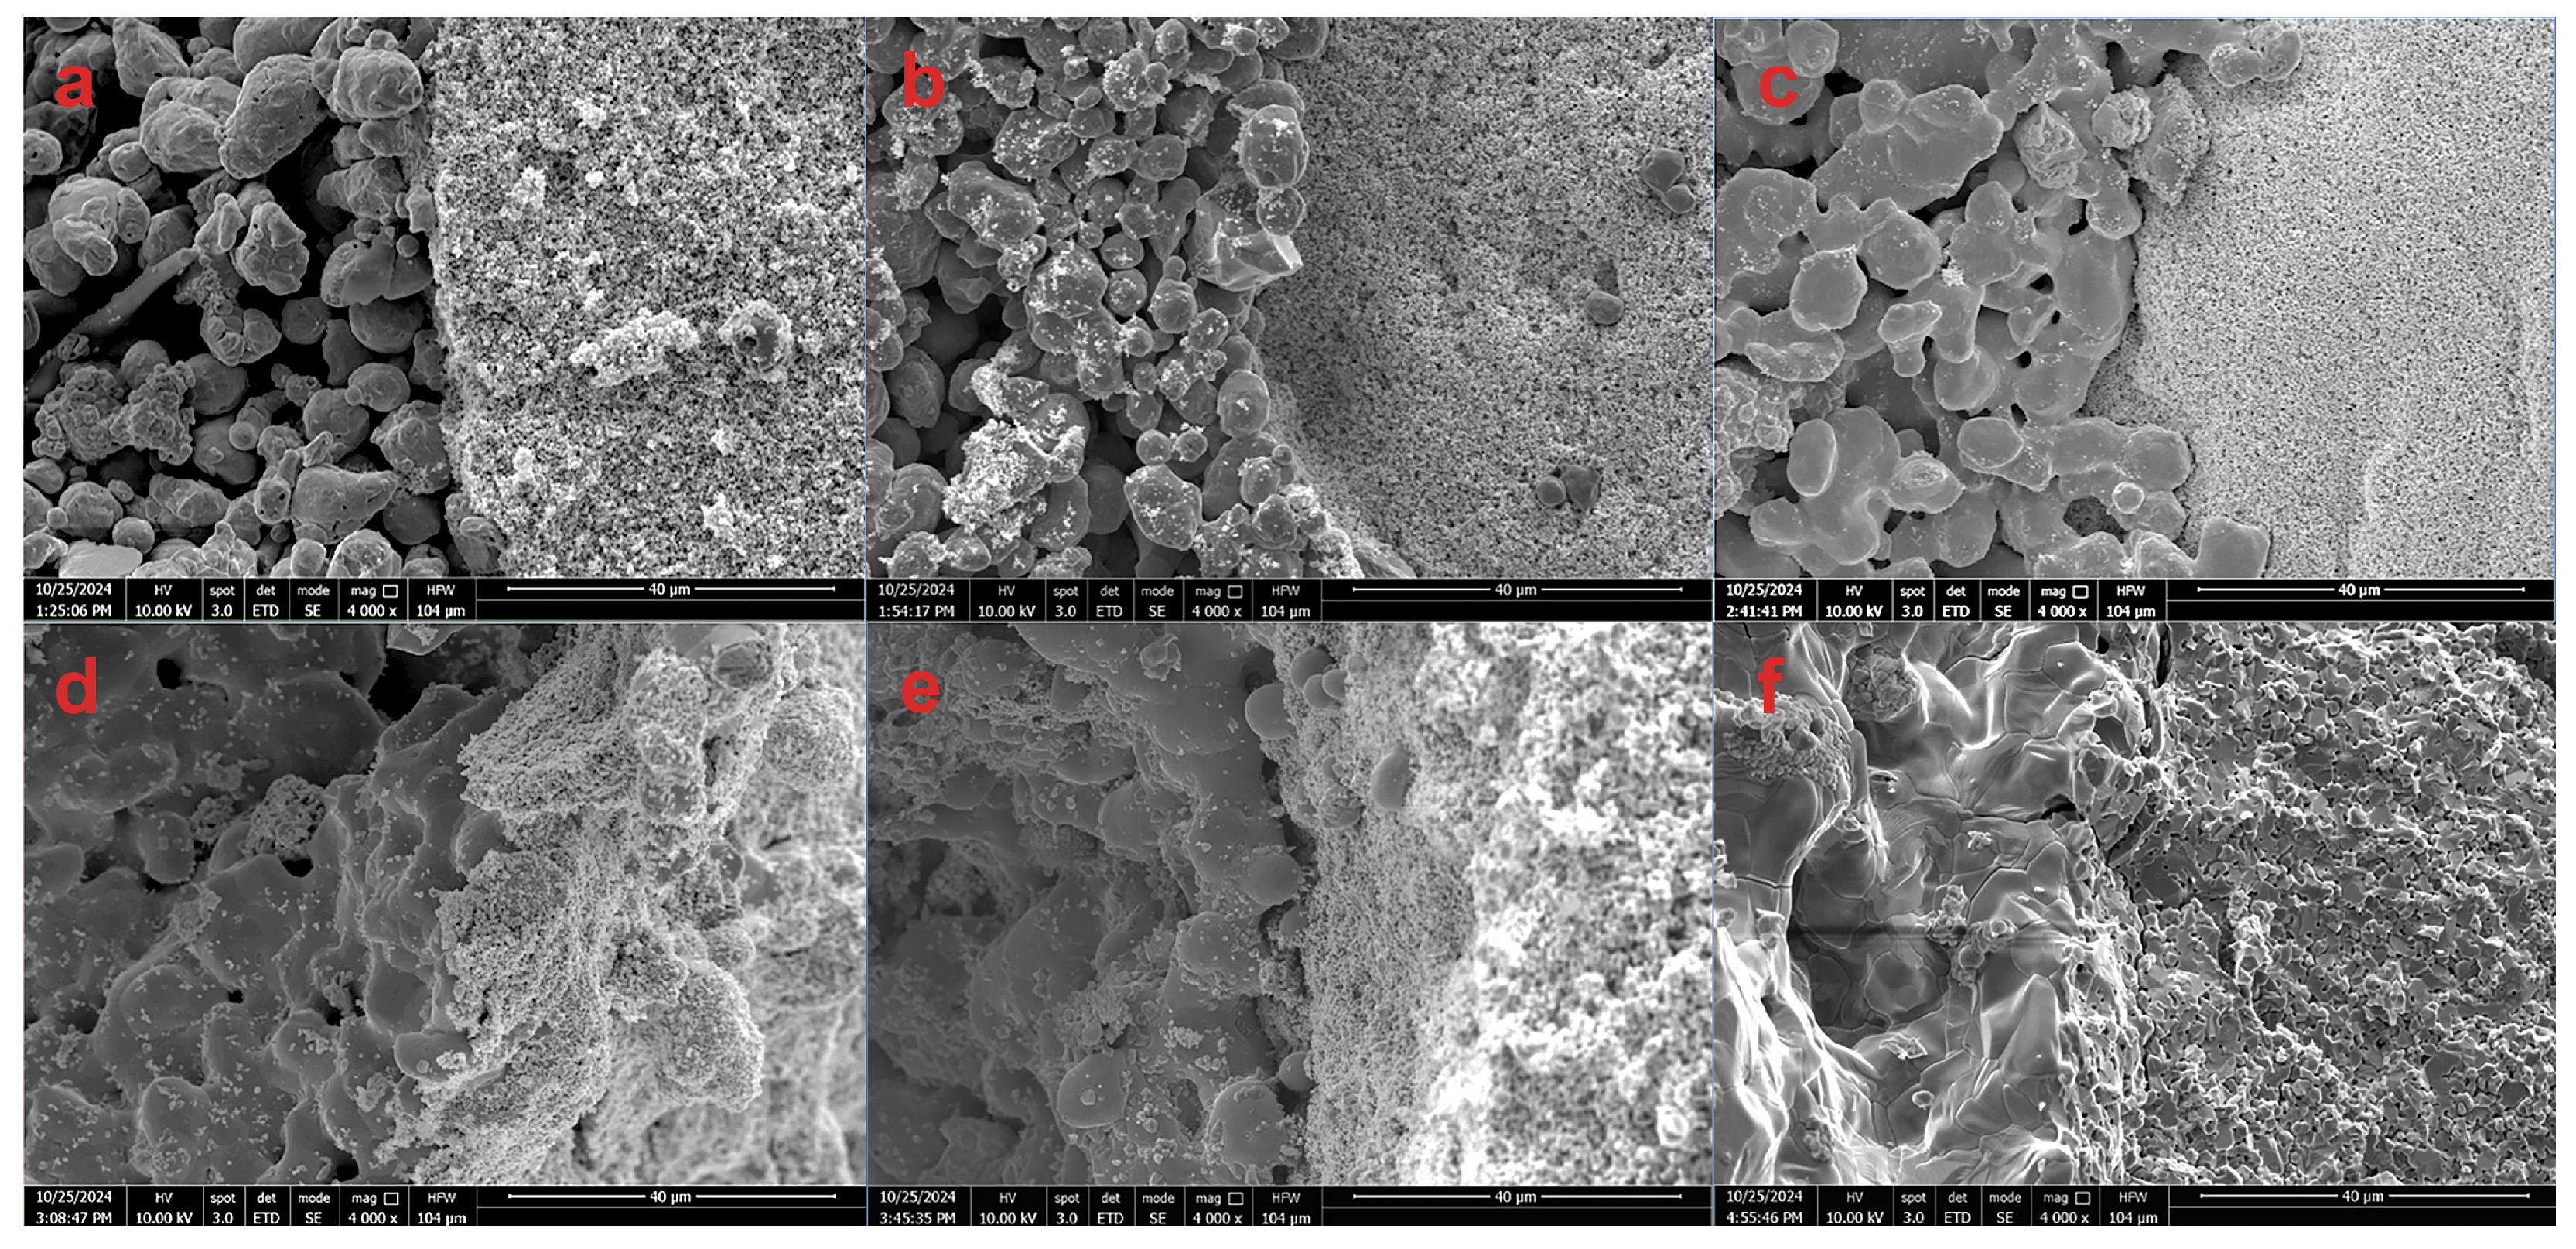
3.3. SEM Analysis
3.3.1. Oxide Zinc Sintering
3.3.2. Copper Sintering
3.3.3. Sintering at the Zinc Oxide–Copper Interface
3.4. Seebeck Coefficient Measurement
4. Conclusions
Author Contributions
Funding
Data Availability Statement
Acknowledgments
Conflicts of Interest
Abbreviations
| AM | Additive Manufacturing |
| TTE | Transverse Thermoelectric |
| TE | Thermoelectric |
| DIW | Direct Ink Writing |
| FDM | Fused Deposition Modeling |
| IPA | Isopropyl Alcohol |
| SEM | Scanning Electron Microscopy |
| FE-SEM | Field Emission Scanning Electron Microscopy |
| Cu | Copper |
| ZnO | Zinc Oxide |
| SOVOL | SOVOL3D Cura (slicing software) |
| TEC | Thermoelectric Cooler |
| PVP | Polyvinylpyrrolidone |
| SPS | Spark Plasma Sintering |
| S | Seebeck Coefficient |
References
- Snyder, G.J.; Toberer, E.S. Complex thermoelectric materials. Nat. Mater. 2008, 7, 105–114. [Google Scholar] [CrossRef] [PubMed]
- Goldsmid, H.J. Introduction to Thermoelectricity, 2nd ed.; Springer: Berlin, Germany, 2016. [Google Scholar] [CrossRef]
- Zhao, L.; Lo, S.H.; Zhang, Y.; Sun, H.; Tan, G.; Uher, C.; Wolverton, C.; Dravid, V.P.; Kanatzidis, M.G. Ultralow thermal conductivity and high thermoelectric figure of merit in SnSe crystals. Nature 2014, 508, 373–377. [Google Scholar] [CrossRef]
- Jouhara, H.; Khordehgah, N.; Almahmoud, S.; Delpech, B.; Chauhan, A.; Tassou, S.A. Waste heat recovery technologies and applications. Therm. Sci. Eng. Prog. 2018, 6, 268–289. [Google Scholar] [CrossRef]
- Singh, Y.; Singh, S.K.; Hazra, P. The quest for high-efficiency thermoelectric generators for extracting electricity from waste heat. JOM 2021, 73, 4070–4084. [Google Scholar] [CrossRef]
- Wang, W.; Cionca, V.; Wang, N.; Hayes, M.; O’Flynn, B.; O’Mathuna, C. Thermoelectric energy harvesting for building energy management wireless sensor networks. Int. J. Distrib. Sens. Netw. 2013, 9, 232438. [Google Scholar] [CrossRef]
- Palaporn, D.; Tanusilp, S.; Sun, Y.; Pinitsoontorn, S.; Kurosaki, K. Thermoelectric materials for space explorations. Mater. Adv. 2024, 5, 5351–5364. [Google Scholar] [CrossRef]
- Goldsmid, H.J. Porous materials in synthetic transverse thermoelements. J. Electron. Mater. 2010, 39, 1987–1989. [Google Scholar] [CrossRef]
- Goldsmid, H.J. Theory of thermoelectric refrigeration and generation. In Introduction to Thermoelectricity, 2nd ed.; Springer: Berlin, Germany, 2009; Volume 121, pp. 7–21. [Google Scholar]
- Qian, B.; Zhao, Y.; Ren, F. Effect of material anisotropy on the transverse thermoelectricity of layered composites. Int. J. Energy Res. 2018, 43, 181–188. [Google Scholar] [CrossRef]
- Qian, B.; Ren, F.; Zhao, Y.; Wu, F.; Wang, T. Enhanced thermoelectric cooling through introduction of material anisotropy in transverse thermoelectric composites. Materials 2019, 12, 2049. [Google Scholar] [CrossRef]
- Goldsmid, H.J. Application of the transverse thermoelectric effects. J. Electron. Mater. 2010, 40, 1254–1259. [Google Scholar] [CrossRef]
- Qian, B.; Ren, F. Transverse thermoelectricity in fibrous composite materials. Materials 2017, 10, 1006. [Google Scholar] [CrossRef]
- Özgür, Ü.; Alivov, Y.I.; Liu, C.; Teke, A.; Reshchikov, M.A.; Dogan, S.; Avrutin, V.; Cho, S.-J.; Morkoç, H. A comprehensive review of ZnO materials and devices. J. Appl. Phys. 2005, 98, 041301. [Google Scholar] [CrossRef]
- Mazaheri, M.; Zahedi, A.M.; Sadrnezhaad, S.K. Two-step sintering of nanocrystalline ZnO compacts: Effect of temperature on densification and grain growth. J. Am. Ceram. Soc. 2008, 91, 56–63. [Google Scholar] [CrossRef]
- Rowe, D.M. (Ed.) Thermoelectrics Handbook; CRC Press: Boca Raton, FL, USA, 2018. [Google Scholar]
- Suárez, M.; Fernández, A.; Menéndez, J.L.; Torrecillas, R.; Kessel, H.U.; Hennicke, J.; Kirchner, R.; Kessel, T. Challenges and Opportunities for Spark Plasma Sintering: A Key Technology for a New Generation of Materials. In Sintering Applications; InTech: Rijeka, Croatia, 2013. [Google Scholar] [CrossRef]
- Seshan, K.; Schepis, D. Handbook of Thin Film Deposition, 4th ed.; William Andrew Publishing: Norwich, NY, USA, 2018. [Google Scholar]
- Greiner, M.T.; Chai, L.; Helander, M.G.; Tang, W.; Lu, Z. Metal/metal-oxide interfaces: How metal contacts affect the work function and band structure of MoO3. Adv. Funct. Mater. 2013, 23, 215–226. [Google Scholar] [CrossRef]
- Zocca, A.; Colombo, P.; Gomes, C.M.; Günster, J. Additive manufacturing of ceramics: Issues, potentialities, and opportunities. J. Am. Ceram. Soc. 2015, 98, 1983–2001. [Google Scholar] [CrossRef]
- Chen, Z.; Li, Z.; Li, J.; Liu, C.B.; Lao, C.; Fu, Y.; Liu, C.Y.; Li, Y.; Wang, P.; He, Y. 3D printing of ceramics: A review. J. Eur. Ceram. Soc. 2019, 39, 661–687. [Google Scholar] [CrossRef]
- Kim, F.; Kwon, B.; Eom, Y.; Lee, J.E.; Park, S.; Jo, S.; Park, S.H.; Kim, B.S.; Im, H.J.; Lee, M.H.; et al. 3D printing of shape-conformable thermoelectric materials using all-inorganic Bi2Te3-based inks. Nat. Energy 2018, 3, 301–309. [Google Scholar] [CrossRef]
- Burton, M.R.; Mehraban, S.; Beynon, D.; McGettrick, J.; Watson, T.; Lavery, N.P.; Carnie, M.J. 3D Printed SnSe Thermoelectric Generators with High Figure of Merit. Adv. Energy Mater. 2019, 9, 1900201. [Google Scholar] [CrossRef]
- de Beauvoir, T.H.; Dursun, S.; Gao, L.; Randall, C. New opportunities in metallization integration in cofired electroceramic multilayers by the cold sintering process. ACS Appl. Electron. Mater. 2019, 1, 1198–1207. [Google Scholar] [CrossRef]
- Zhao, Y.; Gao, W.; Xi, J.; Li, H.; Ren, F. Development of copper powder paste for direct printing and soft mold casting. Addit. Manuf. 2020, 31, 100992. [Google Scholar] [CrossRef]
- Callister, W.D.; Rethwisch, D.G. Materials Science and Engineering: An Introduction, 10th ed.; Wiley: Hoboken, NJ, USA, 2020. [Google Scholar]
- Green, D.J.; Guillon, O.; Rödel, J. Modern Ceramic Engineering: Properties, Processing, and Use in Design, 4th ed.; CRC Press: Boca Raton, FL, USA, 2018. [Google Scholar]
- Lim, J.H.; Yeoh, C.K.; Teh, P.L.; Arif, W.M.; Chik, A. The effect of sintering temperature to the properties of zinc oxide. Adv. Mater. Res. 2013, 795, 419–423. [Google Scholar] [CrossRef]
- Jantrasee, S.; Moontragoon, P.; Pinitsoontorn, S. Thermoelectric properties of Al-doped ZnO: Experiment and simulation. J. Semicond. 2016, 37, 092002. [Google Scholar] [CrossRef]


Disclaimer/Publisher’s Note: The statements, opinions and data contained in all publications are solely those of the individual author(s) and contributor(s) and not of MDPI and/or the editor(s). MDPI and/or the editor(s) disclaim responsibility for any injury to people or property resulting from any ideas, methods, instructions or products referred to in the content. |
© 2025 by the authors. Licensee MDPI, Basel, Switzerland. This article is an open access article distributed under the terms and conditions of the Creative Commons Attribution (CC BY) license (https://creativecommons.org/licenses/by/4.0/).
Share and Cite
Gao, W.; Yu, S.; Tan, B.; Ren, F. Additive Manufacturing of Composite Structures with Transverse Thermoelectricity. J. Compos. Sci. 2025, 9, 344. https://doi.org/10.3390/jcs9070344
Gao W, Yu S, Tan B, Ren F. Additive Manufacturing of Composite Structures with Transverse Thermoelectricity. Journal of Composites Science. 2025; 9(7):344. https://doi.org/10.3390/jcs9070344
Chicago/Turabian StyleGao, Weixiao, Shuai Yu, Buntong Tan, and Fei Ren. 2025. "Additive Manufacturing of Composite Structures with Transverse Thermoelectricity" Journal of Composites Science 9, no. 7: 344. https://doi.org/10.3390/jcs9070344
APA StyleGao, W., Yu, S., Tan, B., & Ren, F. (2025). Additive Manufacturing of Composite Structures with Transverse Thermoelectricity. Journal of Composites Science, 9(7), 344. https://doi.org/10.3390/jcs9070344