Article

Recycling of Pultruded Vinyl Ester Thermoset Scraps into Polyethylene Composites: Toward Circular Composite Manufacturing

Materials Processing and Applications Development (MPAD) Department of Mechanical and Materials Engineering, The University of Alabama at Birmingham (UAB), Birmingham, AL 35233, USA
*
Author to whom correspondence should be addressed.
J. Compos. Sci. 2025, 9(12), 641; https://doi.org/10.3390/jcs9120641 (registering DOI)
Submission received: 28 October 2025 / Revised: 14 November 2025 / Accepted: 21 November 2025 / Published: 23 November 2025
(This article belongs to the Section Composites Manufacturing and Processing)

Abstract

Thermoset pultrusion waste was mechanically recycled as vinyl ester–glass (RVC) filler and compounded—without compatibilizers—into LDPE and HDPE (10–50 wt.%) by single-screw extrusion and compression molding. In LDPE, flexural strength increased from 15 MPa to over 30 MPa, and the modulus rose more than fourfold, with the 30 wt.% composition showing the best strength-stiffness balance. For HDPE, tensile modulus improved by more than 300%, and flexural strength reached about 36 MPa at 20–30 wt.% loading. Impact toughness also improved markedly, particularly for LDPE, where the absorbed energy more than doubled. SEM and optical analyses linked optimum performance to 20–30 wt.% filler content, while higher loadings caused agglomeration and void formation. The study demonstrates a scalable route to valorize thermoset waste into functional polyolefin composites for circular material design.

1. Introduction

The rapid increase in the use of composite materials across various industries such as aerospace, automotive, construction, wind energy, and marine applications is attributed to their superior properties compared to traditional engineering materials—namely, high specific strength, stiffness, and durability [1]. In this context, thermoset matrix composites reinforced with glass or carbon fibers are widely preferred in critical applications due to their high mechanical performance, chemical resistance, and dimensional stability. Among these, vinyl ester (VE) resins stand out for their balanced properties in terms of cost, processability, and performance [2]. Continuous fiber-reinforced polymer composites produced via the pultrusion method—which enables the fabrication of constant cross-section profiles—are extensively used in load-bearing structures due to their high structural integrity [3]. However, the end-of-life management of such thermoset composites poses significant environmental and economic challenges. Thermoset resins form permanent cross-linked networks during curing, which prevents reshaping or dissolution. Consequently, most production scraps and end-of-life parts are landfilled or incinerated [4]. Two main approaches have emerged in the literature to address this issue: (i) the development of reprocessable thermoset resins containing dynamic covalent bonds, and (ii) the mechanical or thermal recycling of existing thermoset waste. The first approach involves next-generation reprocessable thermosets known as “vitrimers,” which, due to formulation complexity and high costs, have limited industrial applicability [5]. In contrast, mechanical recycling offers a more practical, scalable, and economically viable solution in the short term. Pultrusion scrap, defective parts, or end-of-life products can be converted into micron-sized particles, short fiber bundles, or resin-rich fragments. These waste phases can be utilized as reinforcement elements in thermoplastic matrices through appropriate processing techniques. In this regard, the incorporation of recycled thermoset-based composite fillers into thermoplastic matrices presents a promising strategy for both environmental sustainability and materials engineering. The integration of stiff composite fillers with ductile thermoplastics such as polyethylene (PE) enables the development of versatile composite systems. To evaluate the effectiveness of this approach, several studies have investigated the reinforcement efficiency and interfacial interactions of recovered fibers. For instance, Yildirir et al. [6] demonstrated that oxidized carbon fibers recovered from thermoset composites provided superior mechanical performance and strong interfacial bonding when used as reinforcement in LDPE matrices. Bream et al. [7] showed that thermoset recyclates could serve as functional fillers in polypropylene matrices. Tapper et al. [8] reported that discontinuous carbon fiber-reinforced polypropylene composites retained their mechanical properties even after two closed-loop recycling cycles. La Rosa et al. [9] revealed that carbon fiber/epoxy composites produced with a novel amine-based epoxy curing agent could be chemically treated to recover clean fibers and thermoplastic polymers. Nonetheless, it has also been reported that while short glass fibers can enhance tensile and flexural moduli in thermoplastic matrices, high filler content may lead to fiber agglomeration, fiber shortening, and weak interfacial bonding, which limit overall performance [10]. Moreover, the morphology, particle size distribution, and surface characteristics of recycled fibers directly influence their reinforcement efficiency [11].
Beyond mechanical strength, long-term durability is also a critical research focus for such composites. Moisture absorption, interfacial stability, and microstructural heterogeneity are key factors determining hygrothermal performance. Studies have shown that HDPE matrices, due to their semi-crystalline structure, offer relatively better barrier properties; however, increasing filler content may lead to the formation of micropores and water ingress pathways, adversely affecting long-term structural integrity [12,13].
This study explores the mechanical recycling of vinyl ester–glass fiber composites through controlled fragmentation, sieving, and morphological analysis. The reinforcement potential of the resulting recycled composite fragments in LDPE and HDPE matrices was evaluated. By systematically analyzing their effects on physical, microstructural, and mechanical properties, the relationship between filler content, fiber morphology, and composite performance was established. Unlike previous studies that mainly focused on fiber recovery or chemical degradation of thermoset waste, this work introduces a direct and scalable mechanical upcycling route in which recycled thermoset fragments are incorporated into polyolefin matrices without compatibilizers. This practical approach not only enhances mechanical performance but also aligns with circular economy principles by reintroducing thermoset waste into new material streams as functional fillers. Thus, a feasible and sustainable pathway for the reuse of thermoset composite waste is proposed, contributing to both resource efficiency and circular composite manufacturing [14,15]. This approach not only bridges the existing research gap in thermoset composite recycling but also underscores the industrial and environmental importance of reusing waste materials within a circular materials framework. This originality is further reflected in the comparative use of two polyolefin matrices (LDPE and HDPE), enabling a direct evaluation of how matrix crystallinity influences filler dispersion, interfacial bonding, and mechanical performance under identical recycling conditions.

2. Materials and Methods

2.1. Materials

The reinforcement/fillers used in this study were obtained by mechanically shredding of vinyl ester-based unidirectional glass fiber pultruded composite profiles supplied by Avient Corporation, Birmingham, AL, USA. These pultruded profiles exhibit excellent mechanical performance, attributed to their high glass fiber content and continuous fiber reinforcement. These profiles have various cross-sectional geometries such as round, square and rectangular; they were obtained from products that fell outside of the technical tolerance limits determined by the customer or from errors that occurred during the production process and were therefore evaluated as scrap. According to the manufacturer data sheet, the supplied pultrude composite profiles exhibit a wide range of mechanical properties. Glass fiber content is 70–80% (ASTM D2584), tensile strength is 750–1000 MPa (ASTM D3916/D638), tensile modulus is 38–48 GPa (ASTM D3916/D638), flexural strength is 700–900 MPa (ASTM D4476/D790), flexural modulus is 38–45 GPa (ASTM D4476/D790), compressive strength is 415–750 MPa (ASTM D695), and density is 1.9–2.0 g/cm3 (ASTM D792). The morphological appearances of the vinyl ester-based unidirectional glass fiber reinforced pultrusion rods used in the study are given in Figure 1.
Two thermoplastic matrices were selected for this study, both belonging to the polyethylene family: low-density polyethylene (LDPE) and high-density polyethylene (HDPE). Low-density polyethylene has a crystallinity of approximately 50–60% due to the high short and long side chain branching [16]. In contrast, high-density polyethylene reaches a high crystallinity level of >90% due to its linear molecular structure [17]. The high-density polyethylene (HDPE, density: 0.98 g/cm3, tensile strength at break: 41.4 MPa), commercially known as PolyOne TrilliantTM; low-density polyethylene (LDPE, melt flow index [MFI]: 2.0–5.0 g/10 min, density: 0.93 g/cm3) is known as PolyOne MaxxamTM and both materials were supplied by Avient Corporation, Birmingham, AL, USA.

2.2. Preparation and Processing of Thermoset-Filled PE Composites (VPCs)

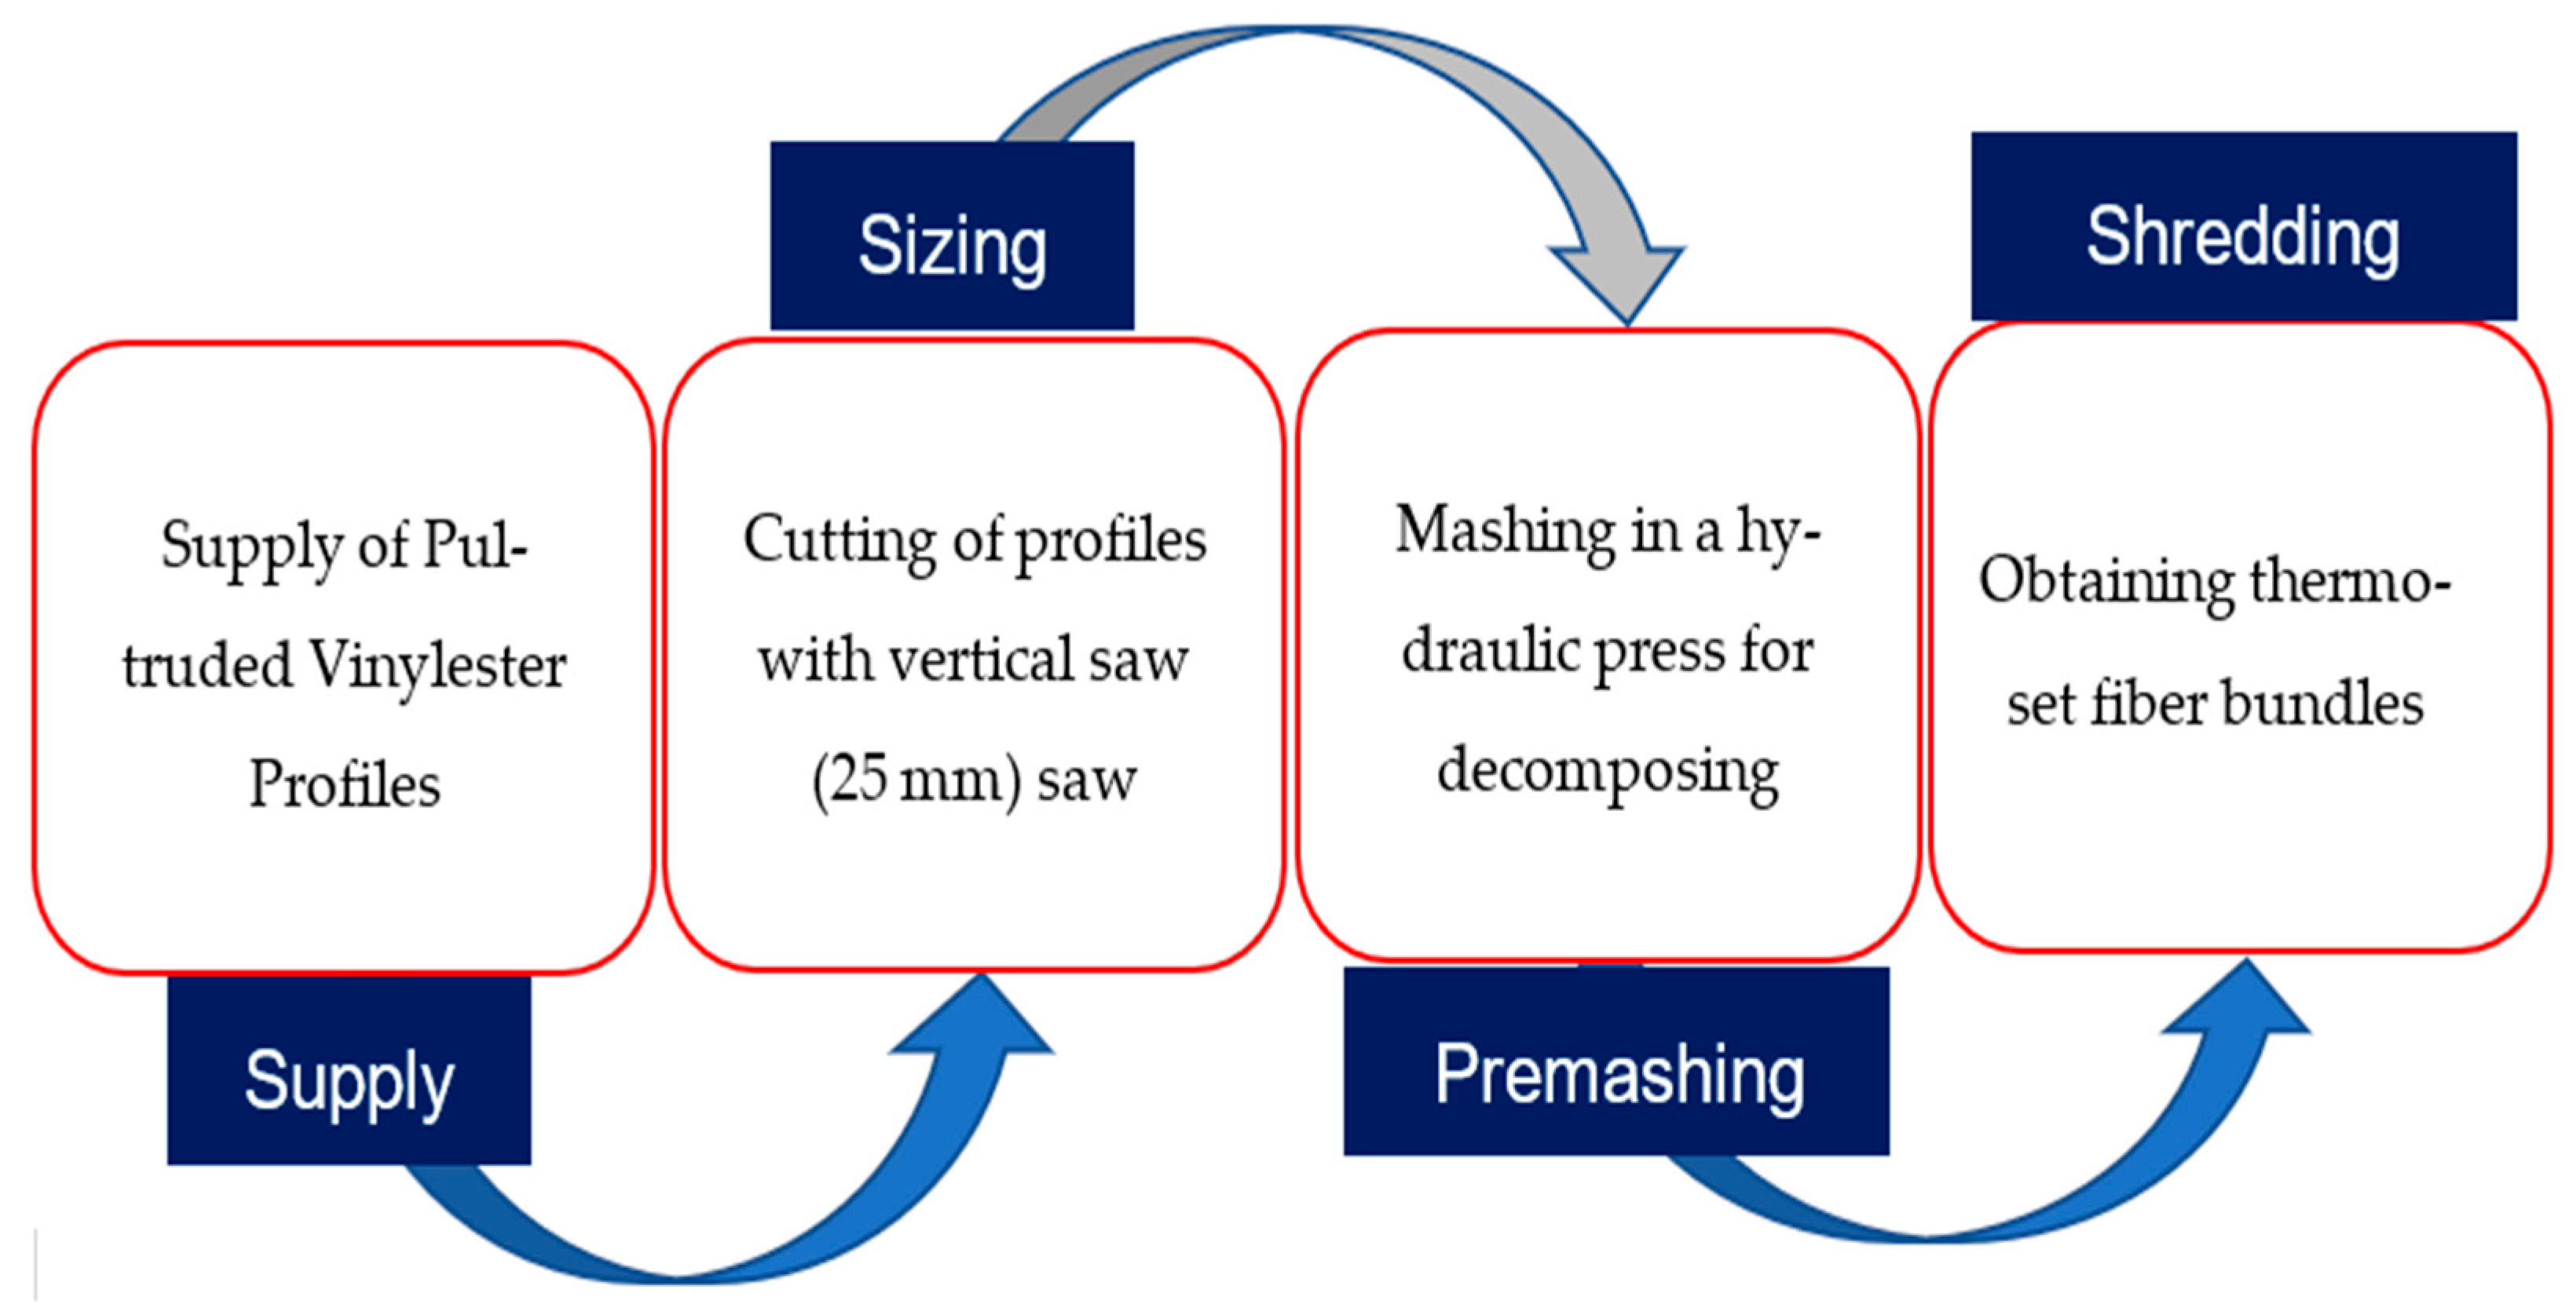
In this study, recycled vinyl ester composite are referred to as RVC, while polyethylene matrix composites containing these fillers are referred to as VPC. Specifically, composites with an LDPE matrix are designated as VLC, and those with an HDPE matrix are designated as VHC. Vinyl ester-based glass fiber reinforced profiles produced by the pultrusion method were cut into pieces with a maximum length of 25 mm using a vertical band saw (Model G0621X, Grizzly Ind., MO, USA) brand, regardless of their geometric shapes, to limit the fiber length and to ensure homogeneity in the shredding process. Sized vinyl ester–glass fiber scraps were initially compressed using a hydraulic press to facilitate subsequent shredding. Then, crushed composite fragments were mechanically reduced by shredded them multiple times using a disintegrator (Model 1012/B, SEM Inc., MA, USA). It was observed that in each mechanical shredding cycle, the fine dust fraction in the obtained material gradually increased and the fiber bundles were separated into individual fiber structures. The RVC fillers exhibited a heterogeneous composition comprising micron-sized particles and short fiber fragments. The recycling materials were characterized by considering parameters such as fiber-to-matrix ratio, dimensional distribution and mass percentage dependent on particle size. The schematic representation of the process steps for obtaining RVC fillers is presented in Figure 2.
The production process of thermoplastic matrix (LDPE, HDPE) composites reinforced with RVC fillers includes certain process steps. As the first step of the production process, thermoplastic matrix materials and RVC fillers were dried using a NovaWheel Dryer (Model NWB-DC, Novatech, Inc., MD, USA) at 80 °C for 2 h and 12 h, respectively, before extrusion. Then, VPC mixtures with different filler ratios were prepared and their details are given in Table 1.
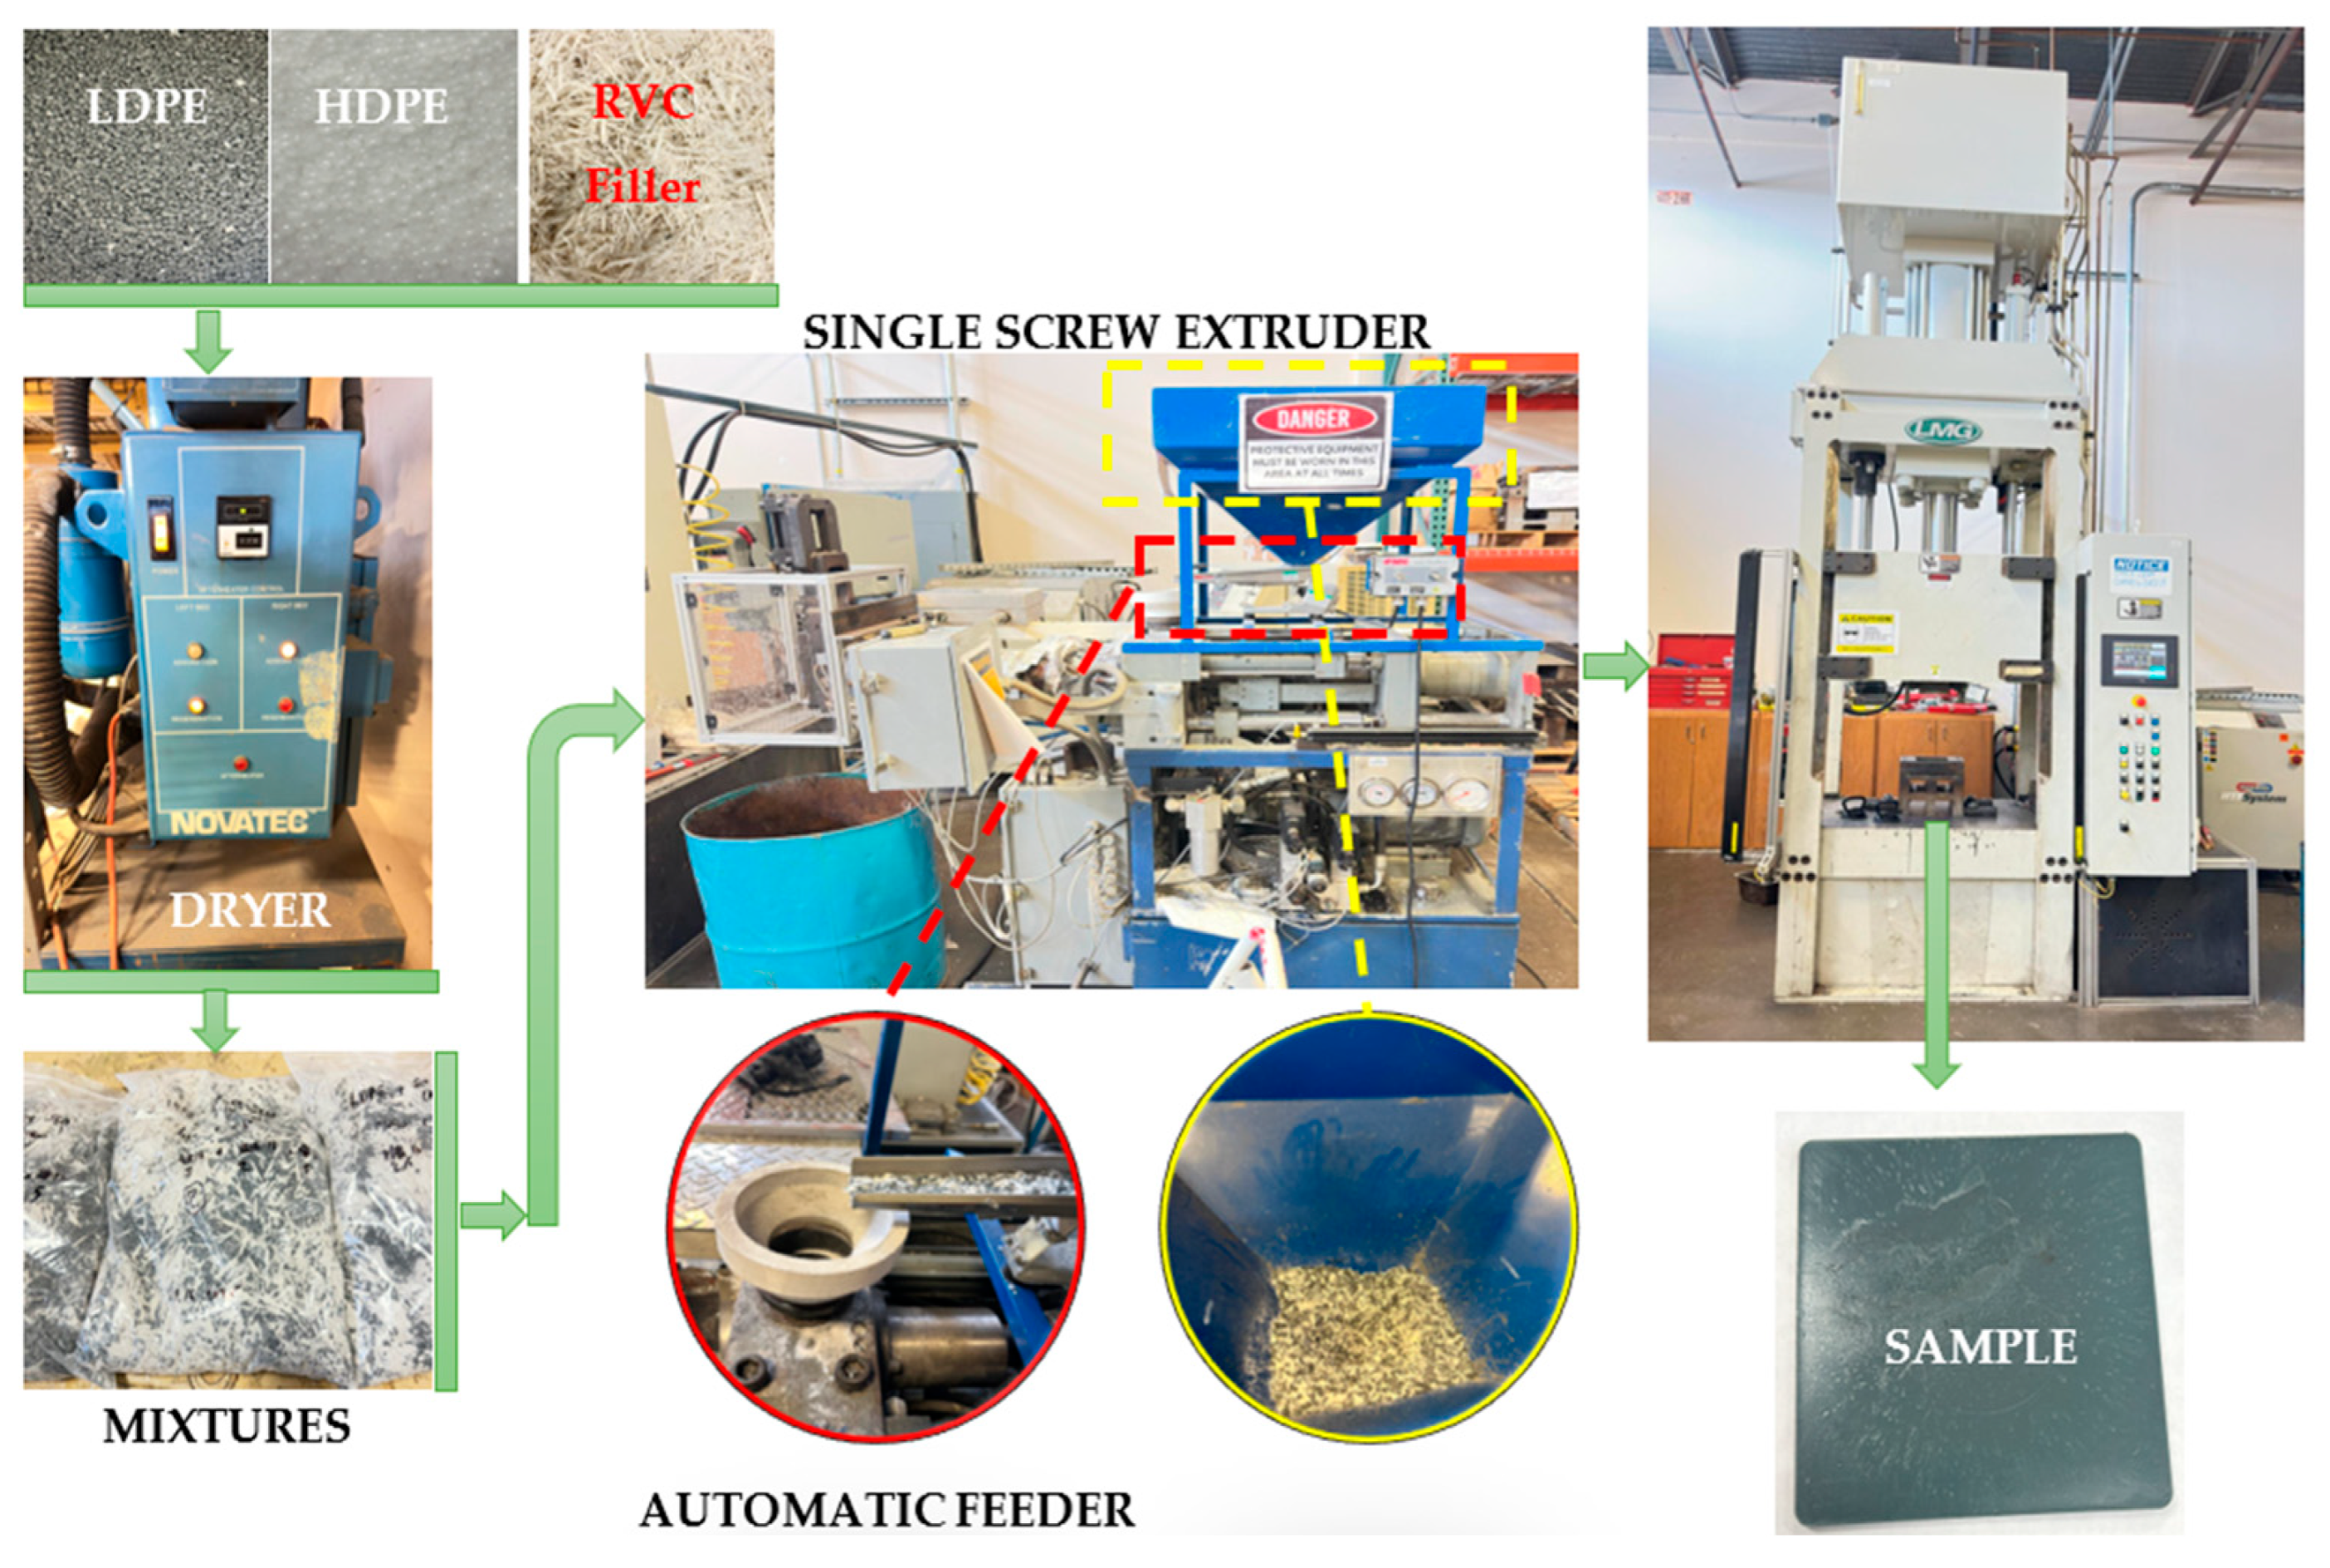
All composite mixtures were manually pre-blending in a sealed zip bag to ensure homogeneous phase distribution and to make them ready for production. After the pre-mixing process was completed, composite raw materials were transferred to the single screw extruder hopper. An automatic feeder (Syntron Power Pulse, FMC Co., PA, USA) with adjustable vibration amplitude ensured steady and uniform material feeding into the extruder, with the feeding rate kept constant at 1.45 ± 0.1 kg/h to maintain stable flow and homogeneous mixing. In order to ensure that the mixture was fed to the extruder in appropriate proportions and in a balanced manner, the vibration settings of the automatic feeder system were optimized and flow measurements were made. According to the evaluations, content changes were observed in the mixture composition as the filler ratio increased. In particular, the change in the amount of RVC fillers remained at the level of ±2% up to 20% filler ratio, while this deviation decreased to ±1.5% at ratios above 30%. VPC samples were produced using a single screw extruder with a diameter of 60 mm and a length of 750 mm developed by the Materials Processing and Application Development (MPAD) Center, University of Alabama. The screw rotation speed was adjusted between 40 and 55 rpm depending on the RVC fillers ratio; it was kept below 45 rpm in order to ensure homogeneity, especially in mixtures with filler content over 40%. The extruder process parameters used for polyethylene-based systems were based on experimental protocols previously validated at the MPAD center, under which the melting temperatures (Tm) of LDPE and HDPE were determined to be approximately 110 °C and 130 °C, respectively. To enable a fair comparison of filler–matrix interactions, the same temperature profile was applied to both LDPE and HDPE systems, ensuring consistent shear and residence-time conditions [18]. Depending on the matrix type, the extruder temperature range was set as 160–210 °C for LDPE and 170–220 °C for HDPE; within these ranges, the upper limits were selected to ensure complete polymer melting and adequate wetting of the recycled filler. These temperatures also remain well below the thermal degradation onset of polyolefins (≈260 °C), providing stable melt viscosity and effective filler dispersion during extrusion [19]. After mixing, the melt was directed to a 152 mm × 152 mm mold attached to a hydraulic press manufactured by LMG Machinery (Trinks Inc., De Pere, WI, USA). The molten composites were subjected to a pressure of 3.45 MPa for two minutes, after which the samples were demolded to obtain the final composite specimens. An illustrative schematic of the manufacturing workflow is presented in Figure 3, summarizing the sequential steps of composite production—from scrap fragmentation to extrusion and compression molding.

2.3. Physical Characterization of Recycled Vinyl Ester Composite (RVC) Filler

The multicomponent thermosetting filler phase obtained by mechanical disintegration of pultruded vinyl ester-glass fiber rods consists of fiber-rich sections containing staple and oriented glass fiber bundles, micron-sized crumbs with high surface area, matrix-derived vinyl ester resin residues, and capillary-sized microfiber networks [20,21]. Mechanical disintegration led to the breakdown of internal cohesion within some staple fiber bundles in fiber-rich fractions, resulting in fibrous separation and the formation of thin, loosely structured filaments (microtufs) [22]. The suitability of vinyl ester-based composite wastes for reuse was investigated through the physical and chemical properties of the recycled filler components using multi-dimensional characterization techniques. As part of the material assessment, the morphology of the fibers, matrix residues remaining on the surface and their length distributions; were examined using optical microscope and scanning electron microscopy to determine both their microstructural structures and their potential effects on the VPC production process [23]. Moreover, not only the fibrous morphology of the filler phase but also its particle size distribution was evaluated in detail. To determine the fractional size distribution, a dry sieving protocol in accordance with the ASTM E11 standard was used. Accordingly, a sieve set containing eight-stage stainless steel sieves with pore sizes ranging from 4.75 mm to <106 µm was utilized. The sieving process was carried out by oscillation in the horizontal plane with a high-frequency vibrator. The RVC particles accumulated in each sieve fraction were weighed with a balance (AG204, Mettler -Toledo LLC, OH, USA; readability 0.1 mg; linearity ±0.2 mg), and the particle size distribution was determined in terms of weight percent. Five independent RVC scrap samples (n = 5) were sieved separately to determine the weight-based particle size distribution across the sieve stack, and results were reported as mean ± standard deviation (SD). Following the determination of the particle size distribution, fiber length characteristics within each sieve fraction were evaluated separately to enable a higher-resolution morphological analysis. Fiber length determination is a non-standardized and technically quite complex analysis due to the fact that even very small samples contain thousands of fibers. In this study, fibers belonging to each sieve fraction were imaged using an optical microscope (Smartzoom 5, Carl Zeiss GmbH, Oberkochen, Germany) with 200× magnification; then, measurements were performed by digitizing them using a specially developed computer software. At least 250 vinyl ester fibers belonging to each sieve fraction were measured and length data were obtained and based on these measurements, the numerical weighted average fiber length (Fl) was calculated using the following equation [24,25]:
F l = i = 1 n w i y i i = 1 n w i
where n is the number of terms, y i is data values, w i is weights applied to x-values
As a continuation of the morphological and dimensional assessments, burn-off tests based on thermal decomposition were carried out to determine the matrix and glass fiber content in the RVC samples [26]. The tests were performed using a programmable industrial furnace (Ney 2-160 Series II, Dentsply Sirona, York, PA, USA), in accordance with the ASTM D3171-22 standard.
Each burn-off test was performed on small-scale samples (up to 8 g) taken from conditioned RVC waste, using a temperature- and time-controlled cyclic heating program [27,28]. The furnace temperature was increased at a rate of 20 °C per minute to 520 °C and held for 2 h, followed by a rise to 560 °C at the same rate and maintained for another 2 h. During this period, the organic matrix decomposed completely, volatile components were released, and the samples were gradually cooled within the furnace [29,30]. After the process, the remaining glass fibers were weighed with a precision balance, and their content was calculated relative to the initial sample mass [31]. Five replicate burn-off tests (n = 5) were performed on independently prepared RVC samples to ensure statistically reliable determination of glass fiber content, and the results were reported as mean ± standard deviation (SD).

2.4. Analysis of Thermoset-Filled PE Composites (VPC)

The incorporation of RVC fillers into thermoplastic matrices for the production of VPCs offers a viable strategy for integrating recycled composite materials into sustainable product design. However, the single-screw extrusion process employed in this method exposes the reinforcing fibers to elevated temperatures and shear forces, which can lead to alterations in their dimensional and morphological characteristics. Such structural changes influence the dispersion of fibers within the matrix and play a critical role in determining the mechanical performance of the final composite. To quantitatively determine the glass fiber content and evaluate possible fiber degradation resulting from processing, a thermal decomposition procedure based on the burn-off test was conducted. In this context, five specimens measuring 30 × 30 mm were extracted from different regions of the composite panels and subjected to a controlled furnace treatment at temperatures exceeding 560 °C for a total duration of five hours. This controlled process ensured the complete removal of the polymer matrix while preserving the glass phase, with combustion conditions optimized to prevent carbonization and ash formation. Following the burn-off, residual fibers were cooled to room temperature, weighed using a precision balance (±0.001 g), and analyzed microscopically to assess surface resin residues as well as fiber length distribution. For each composite type, fiber length measurements were performed on 100 individual fibers per sample using ImageJ software (Version 1.53n), and the results from five replicate tests were statistically evaluated and reported as mean values with associated standard deviations.

2.4.1. Optical and Scanning Electron Microscopy (SEM) Analysis

The random distribution and morphological characteristics of RVC fillers embedded within polyethylene-based thermoplastic matrices were examined using a scanning electron microscopy (FEI Quanta 650 FEG, Thermo Fisher Scientific, Hillsboro, OR, USA) operating at 1000× magnification and an accelerating voltage of 25 kV. Prior to microstructural analysis, the fractured surfaces of the samples were gold-coated under vacuum using a coating system (Desk V, Denton Vacuum, Moorestown, NJ, USA) to enhance electron conductivity and optimize imaging resolution, as recommended in comparative coating strategies for SEM imaging [32]. SEM observations provided detailed insights into fiber shape, dispersion, and surface topography, which are critical parameters in composite morphology studies [33]. For optical surface characterization, high-resolution imaging was performed using a digital microscope (VHX-6000, VHX-6000, Keyence Corporation, Osaka, Japan) equipped with a wide-range zoom lens (VH-Z100R, Keyence Corporation, Osaka, Japan), supported by advanced multi-focus imaging techniques and automated scanning modes. Resolution and light intensity parameters were carefully optimized to increase edge clarity, in accordance with current digital microscopy practices for surface analysis [34].

2.4.2. Density and Moisture Absorption of the VPCs

The density measurements of VPC specimens were conducted in accordance with ASTM D792, using a high-precision analytical balance equipped with a compatible density determination kit (Pioneer Precision, OHAUS Corporation, Parsippany, NJ, USA). To minimize the influence of ambient moisture, all samples were pre-dried under controlled conditions prior to testing. For each composite type, five independent specimens were analyzed, and the resulting density values were statistically evaluated. The mean and standard deviation were calculated to assess the consistency and structural uniformity of the composites, as supported by recent studies on thermoplastic composite characterization.
To evaluate the long-term durability of VPCs under humid environments, water absorption tests were conducted at room temperature in accordance with ASTM D5229. Five replicate specimens (100 × 25 mm) were prepared for each composite type, pre-dried to constant weight, and immersed in water under controlled temperature and humidity conditions. The amount of absorbed moisture was determined gravimetrically by comparing the initial and final weights. The average and standard deviation values were calculated to assess the reproducibility of the results. This approach enabled the evaluation of moisture diffusion behavior, void content effects, and fiber–matrix interfacial stability, all of which are known to significantly influence the mechanical performance of polymer composites after environmental exposure [35,36].

2.5. Mechanical Properties of the VPCs

The mechanical performance of polyethylene composites reinforced with recycled thermoset-based composite fillers was comprehensively evaluated through a series of standardized tests in accordance with internationally recognized protocols. Tensile properties were assessed following the ASTM D3039 standard, while flexural behavior was characterized in line with the ASTM D7264 standard. All mechanical tests were performed using a high-precision universal hydraulic testing machine (Instron Model 1331, Instron, Norwood, MA, USA). Prior to testing, all specimens were conditioned for 48 h under controlled room conditions to minimize environmental variability and enhance measurement accuracy. Tensile tests were conducted at a constant crosshead speed of 2 mm/min, with seven independent replicates performed for each composite configuration to ensure statistical reliability. The resulting data were analyzed based on key mechanical parameters, including tensile modulus, tensile strength, yield strength, and maximum tensile strength. Similar procedures have been employed in recent studies evaluating thermoset and thermoplastic composites under standardized loading conditions [37,38]. Flexural properties were evaluated using three-point bending tests on the same testing apparatus. Specimens were prepared with dimensions of 127 mm in length and 12.7 mm in width. A span-to-thickness ratio of 16:1 was applied, corresponding to a test span of 64 mm. The bending tests were carried out at a constant loading rate of 1.7 mm/min, and displacement values were precisely recorded over a deformation length of 25.4 mm. The flexural data were interpreted in terms of bending modulus, bending strength, and maximum load-bearing capacity.
In addition to quasi-static mechanical tests, the impact resistance of the composites was assessed in accordance with the ASTM D256 standard using a low-energy pendulum-type impact tester (IT 504, Tinius Olsen, Horsham, PA, USA). Notches were precisely machined into the specimens using a benchtop CNC milling machine to ensure dimensional consistency. Impact tests were conducted at a nominal energy of 7.56 J and an impact velocity of 3.85 m/s, simulating low-energy dynamic loading conditions. For each composite series, ten independent specimens were tested to determine the average impact energy absorption capacity. Following impact testing, fracture surfaces were examined using scanning electron microscopy (SEM) to investigate fiber–matrix interfacial bonding, crack initiation, and propagation mechanisms. SEM-based microstructural analysis has proven effective in identifying interfacial failure modes and assessing the integrity of fiber-reinforced polymer composites [39]. This combined mechanical and microstructural approach provided a comprehensive understanding of the structural integrity, energy dissipation behavior, and failure modes of thermoset-filled PE composites under both static and dynamic loading conditions. The findings offer valuable insights into the suitability and performance potential of these materials for advanced engineering applications.

3. Results and Discussion

3.1. Assessment of Recycled Vinyl Ester Based Composite (RVC) Fillers

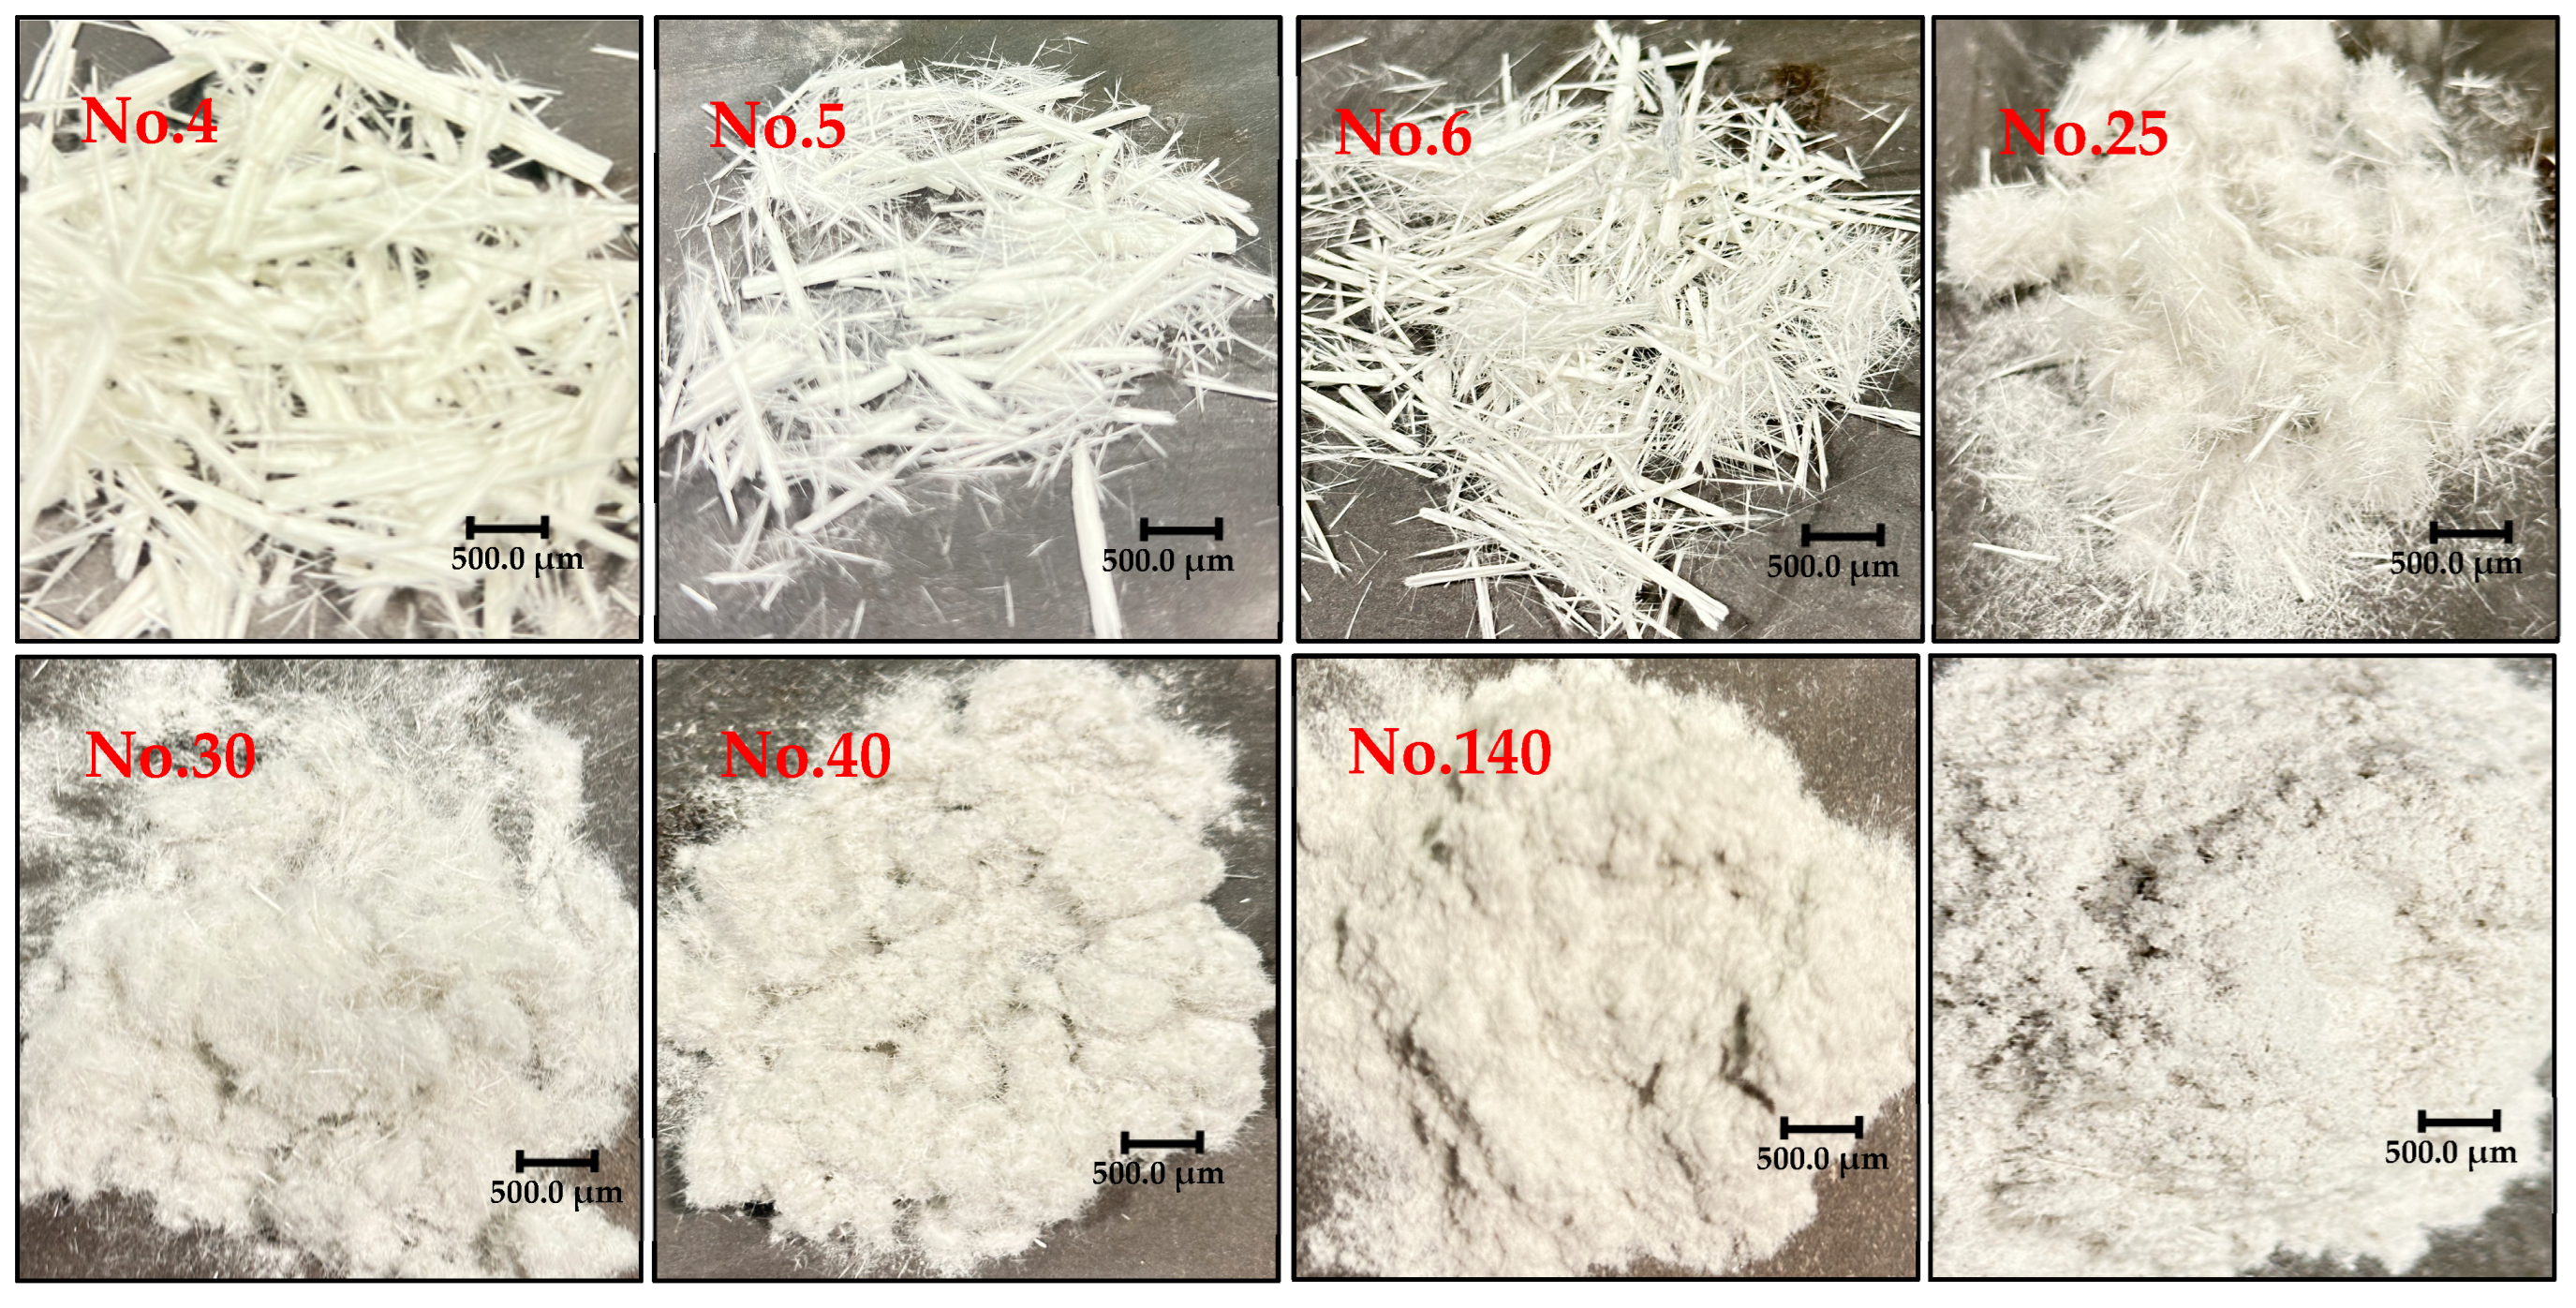
Vinyl ester-based glass fiber reinforced rods produced by pultrusion method were cut into 25 mm lengths with a saw, regardless of their geometric forms, and then subjected to mechanical recycling process and shredded. As a result of this process, the maximum lengths of the obtained scrap fibers and/or fiber bundles were limited, thus ensuring dimensional stability and homogeneous distribution in thermoset-based filling materials. Mechanical recycling led to limited fiber separation, with the material primarily disintegrating into fiber bundles instead of single filaments. This indicates that the liquid vinyl ester-based thermosetting resin was effectively wetted the fibers, creating a strong matrix-fiber integrity. Furthermore, the random positioning of glass fiber reinforcements within the shredder during the recycling process and the frictional effect resulting from the rotational speed of the cutting blades cause the fibers to wear and break down unevenly. This leads to inhomogeneous fiber breakage, creating a wide length distribution; some fibers also undergo significant shortening and develop morphological deteriorations such as bifurcation or surface roughness at their ends. Changes in fiber size and morphology are considered important parameters that directly affect the contact surface of recycled reinforcements with the matrix and, consequently, the mechanical bonding performance within the composite. Therefore, a dry sieving method was applied to determine the dimensional distribution of the recycled fibers. Figure 4 presents representative images of vinyl ester-based glass fibers passing through different sieve openings.
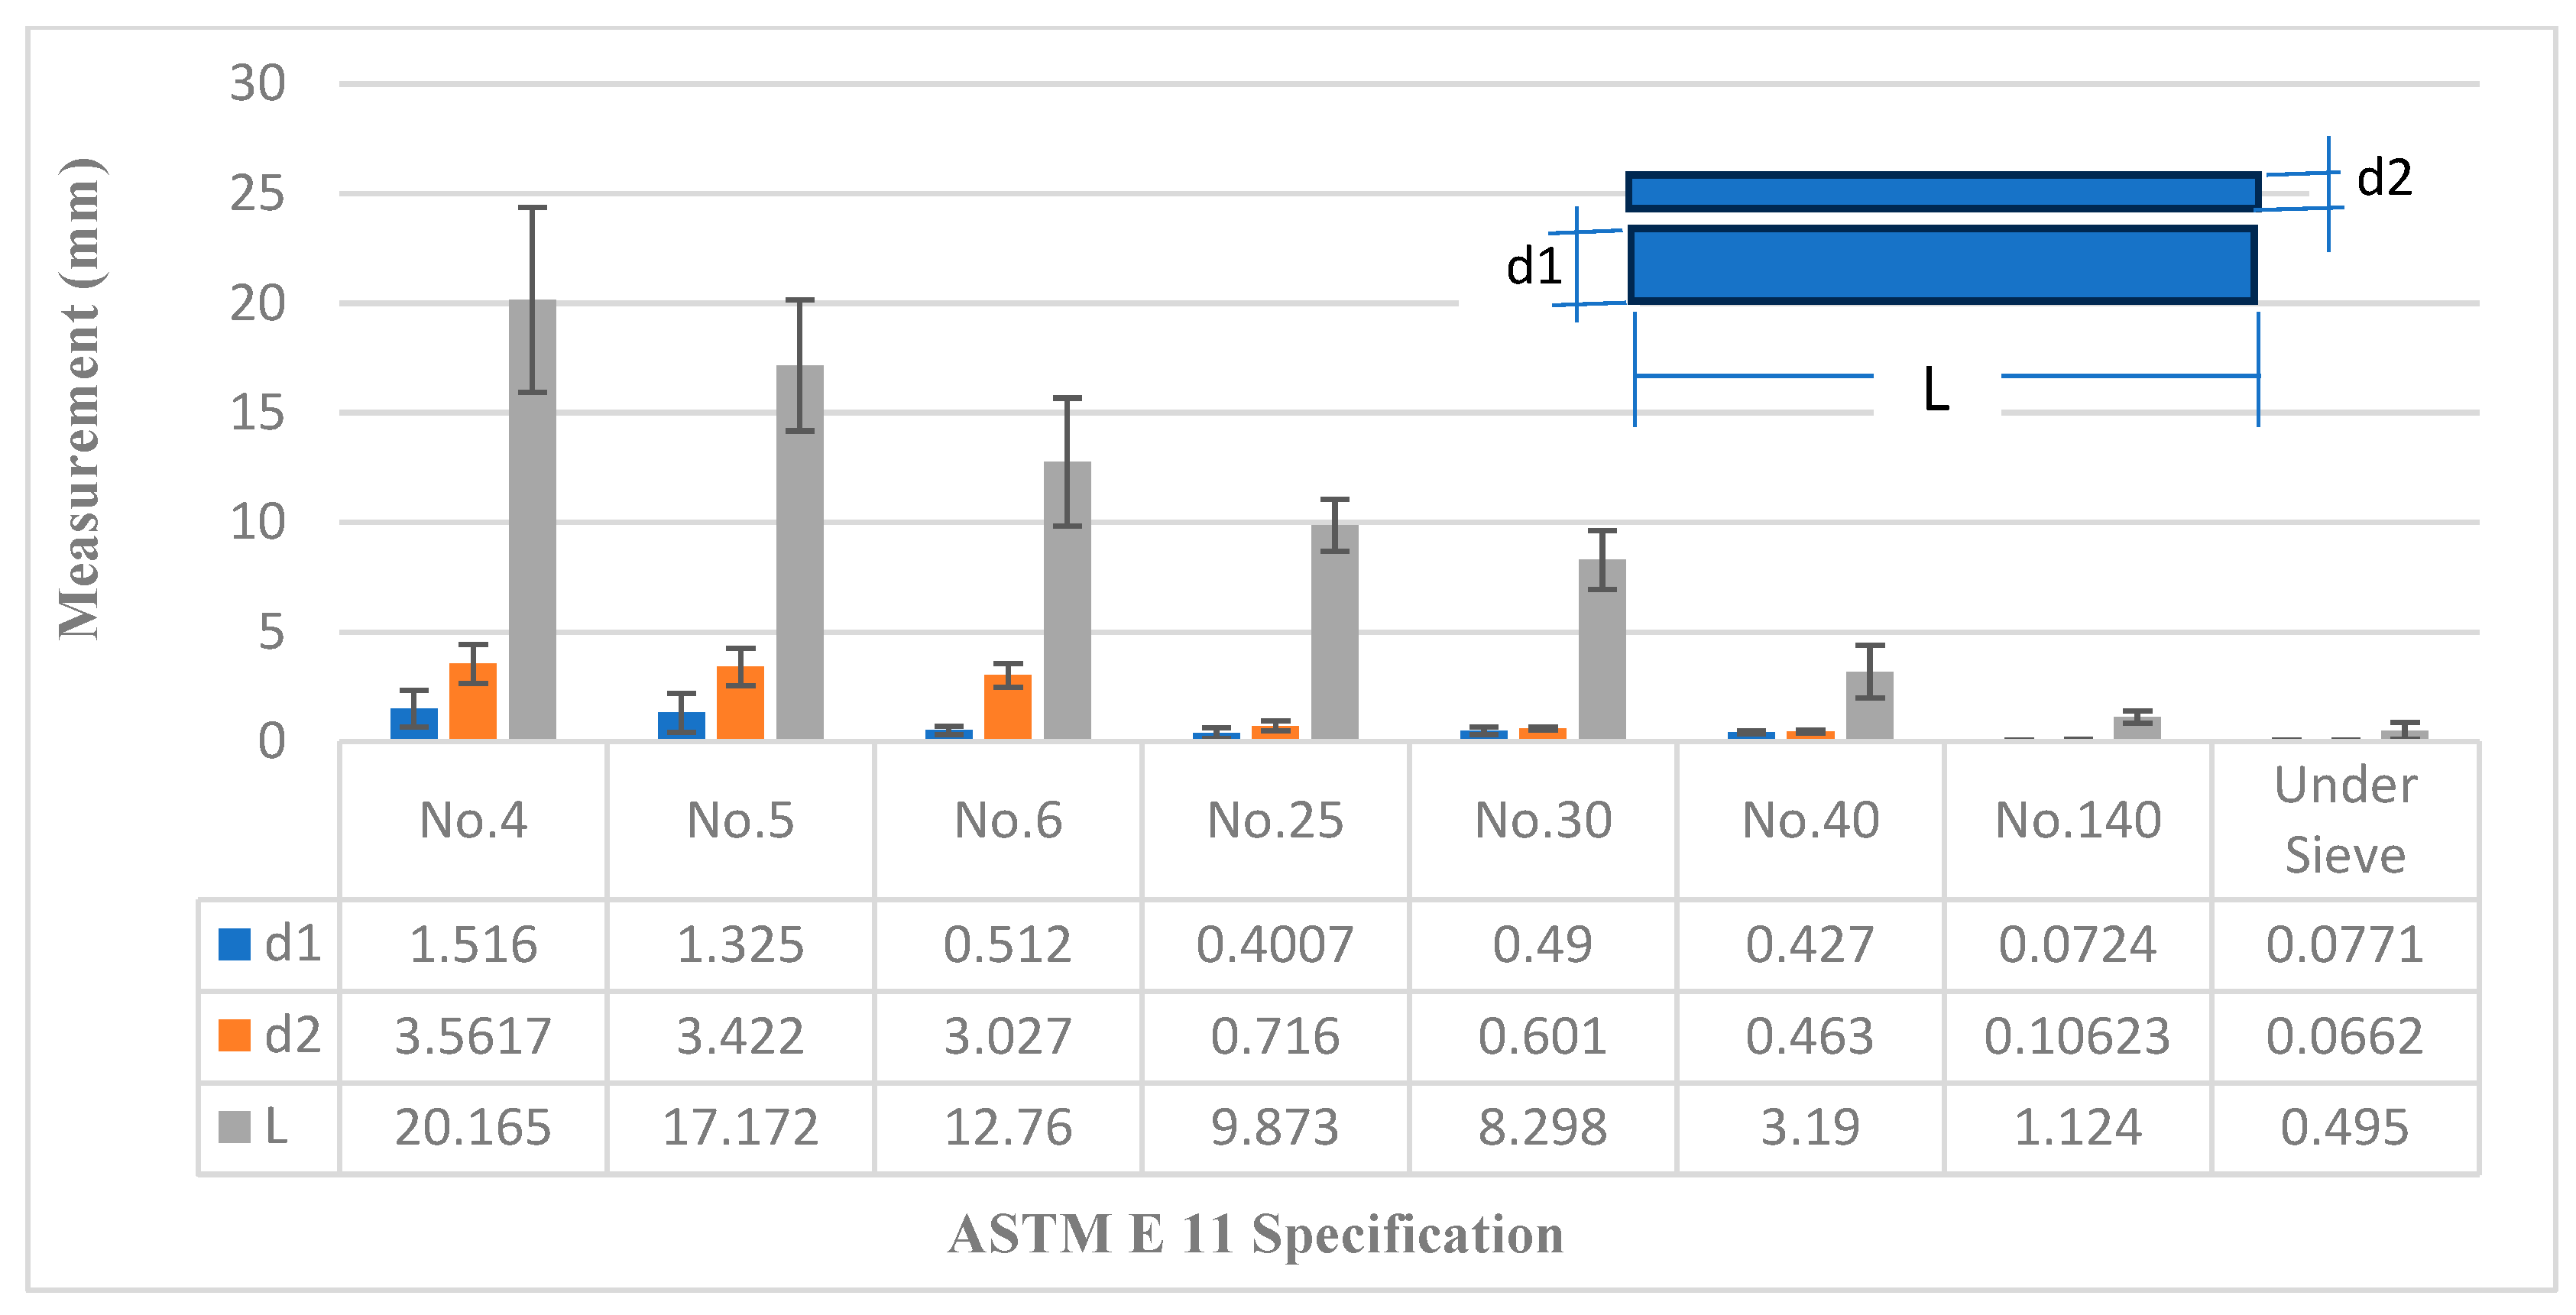
The fiber fractions obtained through sieving processes exhibit distinct morphological differences based on fragment size. These differences directly impact the reuse potential of fibers obtained through mechanical recycling. The fractions collected in the 4–5 mesh range (>4 mm) and having the largest fragment sizes consist primarily of thick, dense fiber bundles with a high fiber shape factor and largely retain their original fiber orientation [26]. These fiber structures are generally cohesive or slightly disaggregated, offering high structural integrity. Due to these characteristics, these fractions are considered the most suitable and have the highest reinforcement potential for use in composite production after mechanical recycling [4]. In contrast, fragments collected in the 6-mesh fraction (~3.35 mm) exhibited a partially fragmented structure, with limited separation of individual fibers and significantly reduced fiber lengths. The fiber bundle density in this group was lower, with medium-sized fiber segments dominating. Therefore, the 6-mesh fraction is a suitable intermediate class for use as a secondary reinforcement material. The smaller 25–30 mesh fractions (~710–600 microns) contain largely short, fragmented individual fiber particles and matrix residues [40]. While fiber character is still observable, the distinction between fiber and matrix phases is partially blurred. These fractions are considered semi-functional fillers that provide limited mechanical benefits, as also reported in recent studies where short or recycled glass fibers with lengths below the critical aspect ratio exhibited poor stress transfer efficiency and acted mainly as semi-reinforcing or inert fillers with marginal contribution to stiffness and strength [41,42]. The finest fractions, the 40–140 mesh range (~425–105 microns) and the under-mesh (<105 microns), consist largely of amorphous particles in the form of dust, resin residues, and micro-sized fiber particles. Fiber integrity is completely impaired in this group, and fiber character is almost completely lost. Therefore, this fraction is only suitable for use in low-value applications such as volumetric fill or energy recovery [43]. This classification helps assess how fiber morphology affects reuse potential after recycling. Structural changes resulting from differences in pore size play an important guiding role in determining the composite design strategies to be applied in subsequent stages. These data are presented in Table 2.
RVC clusters were sorted according to particle thickness by passing through sieve openings in accordance with ASTM E 11 standard, and the dimensional parameters of each fraction were quantitatively characterized by high-accuracy measurement methods. High-shape-factor, thick, and dense fiber bundles are classified as fiber clusters that fail to fully separate from the matrix phase during the mechanical recovery process, partially retain their integrity, and are structurally interconnected [26]. The fiber distribution obtained in sieve fractions No. 4 and 5 consists of coarse fiber segments with a high shape factor, with at least one cross-sectional dimension exceeding 4 mm. Representing approximately 65.89% of the total thermoset-based composite waste, these fractions predominantly comprise multilayered, compact fiber clusters that were found to largely maintain fiber orientation and interfiber bonding properties during mechanical recycling [44]. The macro-sized, compact fiber clusters, thought to cause high viscosity increases and insufficient blend homogeneity, were reduced in size by mechanical pre-crushing before mixing [45]. This increased the surface area in contact with the matrix material, allowing for more effective interaction with the matrix. A notable change in the dimensional characteristics of the fiber segments was observed with decreasing mesh opening sizes. The fibers retained in the No. 6 mesh fraction exhibited lengths exceeding 3.35 mm along at least one axis and were identified as partially separated, volumetrically large segments [46]. However, this fraction accounts for only 2% of the total thermoset-based composite waste and primarily consists of particles with smaller surface area and volume. Although this dimensional reduction may limit the fiber–matrix interfacial interaction capacity, the No. 6 fraction can still be considered as a source of intermediate-scale reinforcement elements within the mixture [47]. The fiber fragments obtained in the No. 25 and No. 30 mesh fractions-comprising approximately 15.36% of the total thermoset-based composite waste—consist predominantly of short microfibers that are partially coated with remnants of the original matrix phase. As the mesh opening size decreases, the mechanical recycling process induces more intensive fragmentation and breakage of fibers, resulting in a marked reduction in aspect ratios [47,48]. Consequently, these fractions are primarily composed of micron-scale, low aspect ratio fiber particles [49,50]. Although these microfibers may not possess substantial load-bearing capacity, they can still contribute to the composite structure through volumetric reinforcement at the microscale. Acting similarly to functional fillers, they positively influence dimensional stability, stiffness, and rheological control within the composite system [51]. However, the partial coverage of their surfaces by the former matrix phase limits interfacial bonding with the new matrix material, which may in turn lead to weakened fiber–matrix adhesion mechanisms [52]. The fiber fragments retained in the No. 40, No. 140, and pan fractions account for approximately 16.76% of the total thermoset-based composite waste and predominantly consist of amorphous powder particles, resin residues, and micro-scale fiber fragments. Due to their limited load-bearing capacity, an increased proportion of these fine constituents within the composite matrix leads to a noticeable reduction in mechanical performance [45]. The thermoset resin residues, being non-meltable, hinder effective interfacial bonding [53], while the randomly oriented microfibers, despite offering isotropic reinforcement, may induce local stress concentrations and the formation of weak zones due to their non-uniform distribution [54].
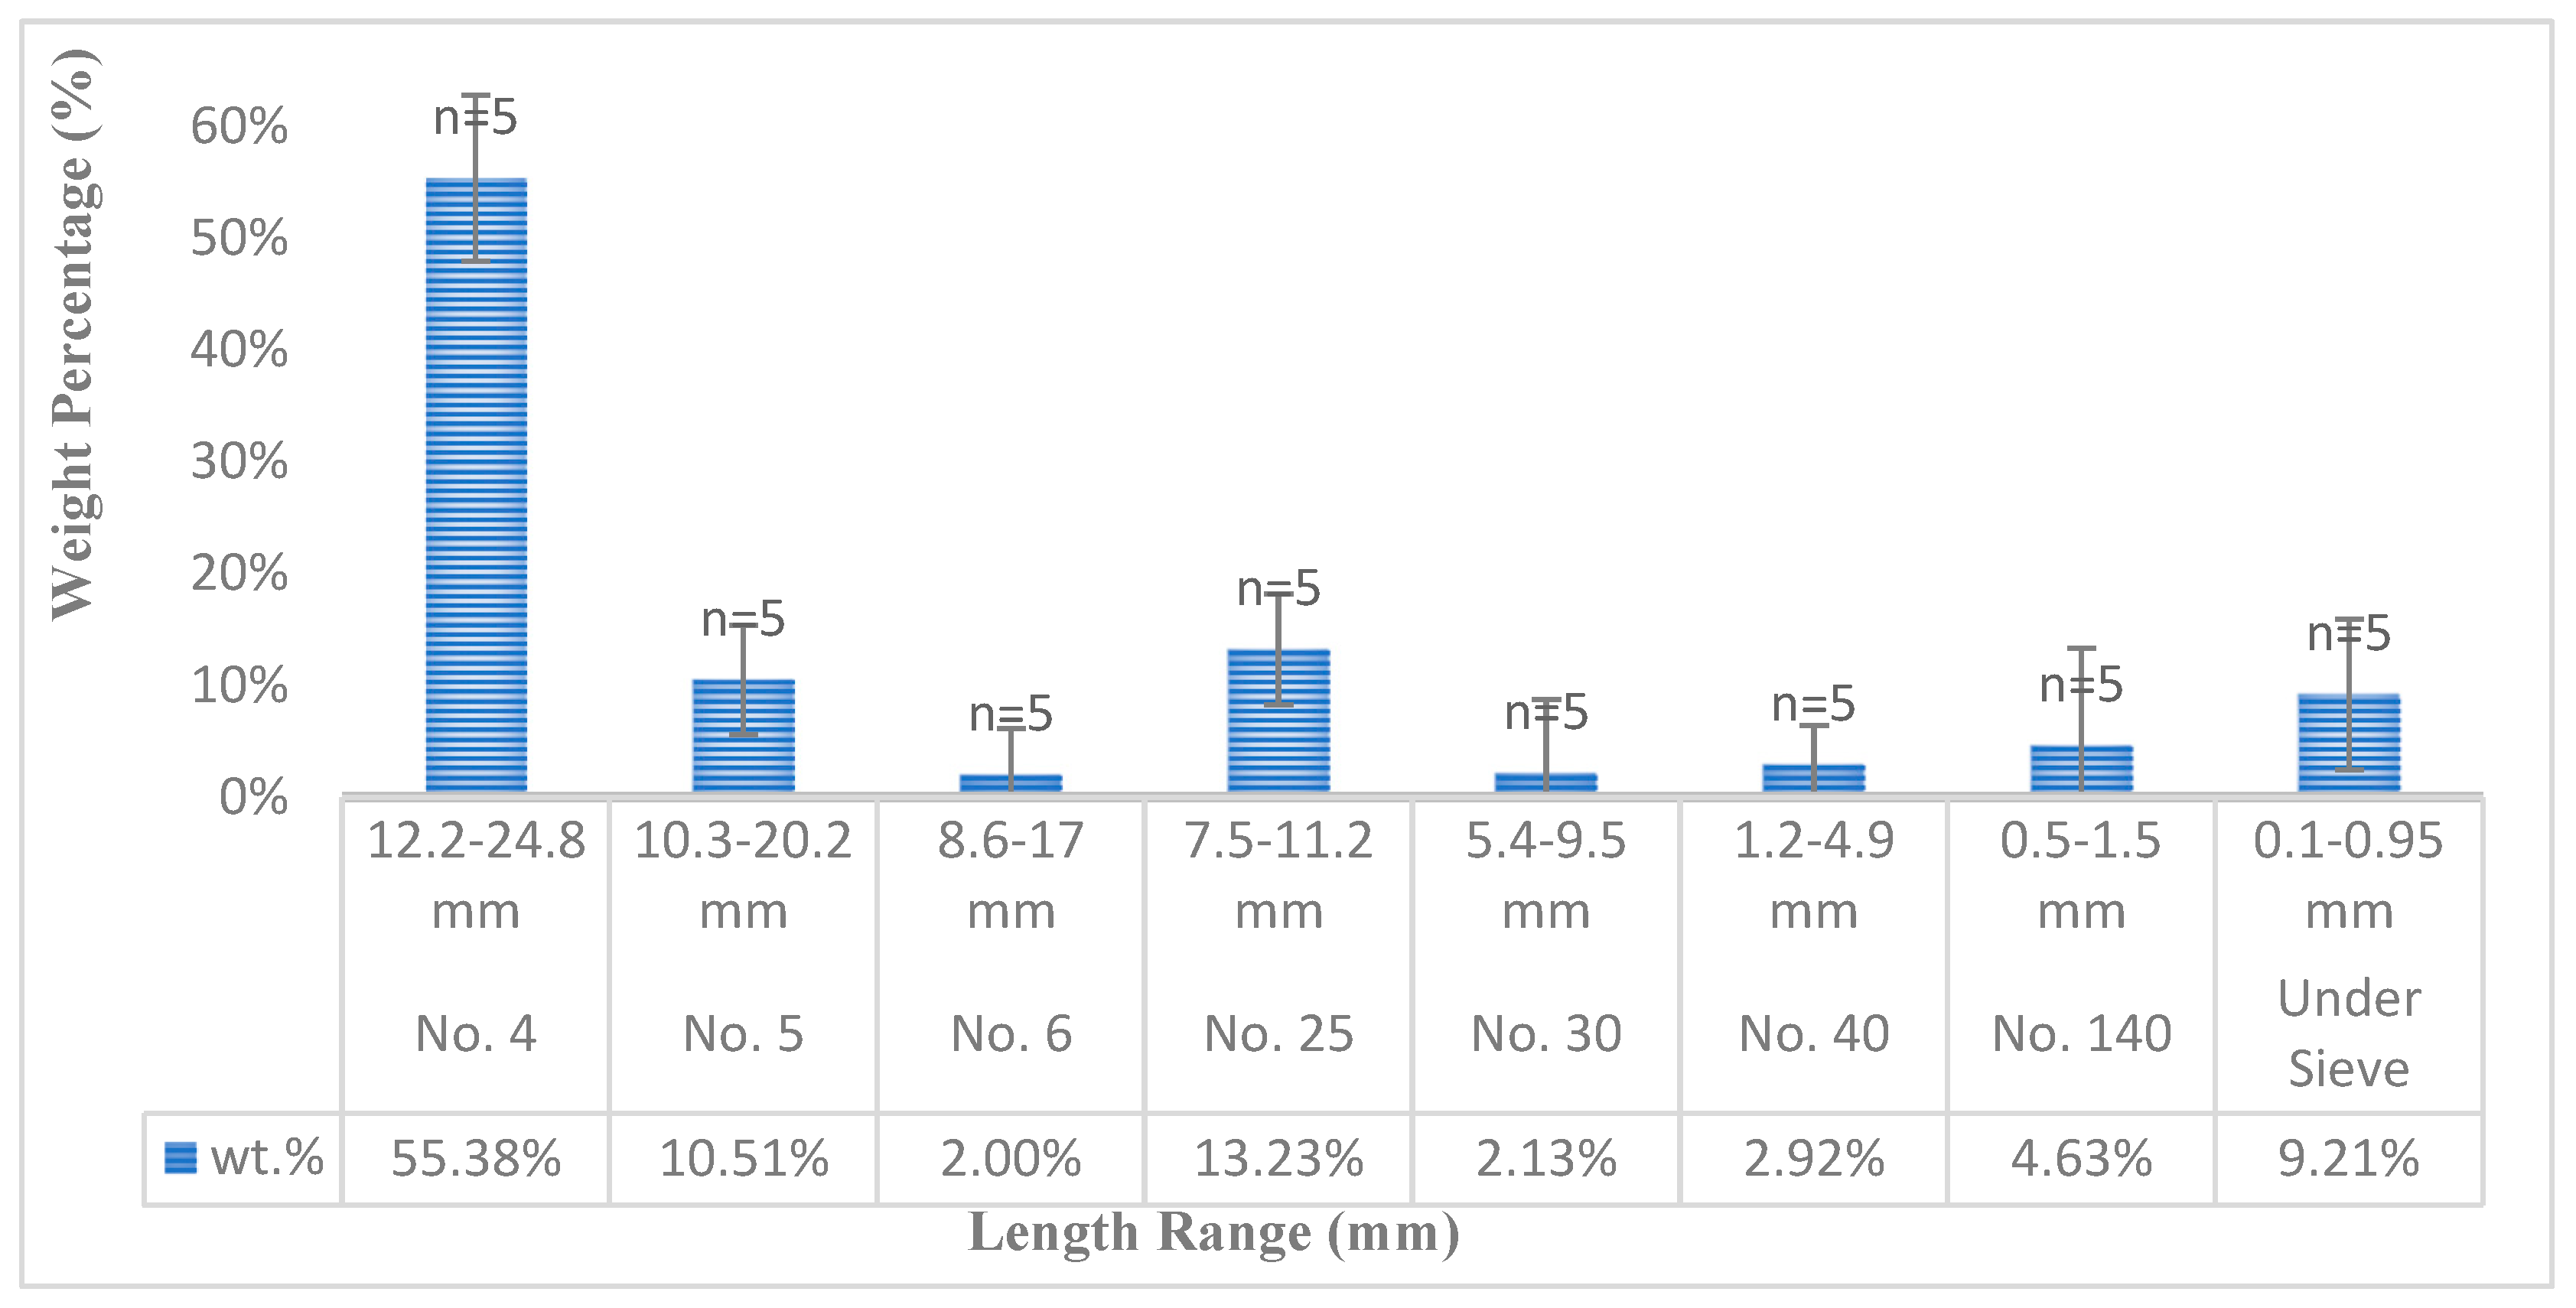
Figure 5 illustrates a histogram representing the fiber length distribution and corresponding weight percentages of the screened fractions obtained from mechanically recycled vinyl ester-based composite waste. Experimental analyses revealed that the average fiber length was approximately 9.13 mm, depending on the internal distribution within the samples. The wide range of fiber lengths, varying from below 0.1 mm to 24.8 mm, introduces notable heterogeneity and measurement uncertainty, particularly in fractions rich in short fibers [55,56]. In the finest fraction, retained below the No. 140 mesh, direct measurement of fibers shorter than 0.1 mm is methodologically constrained due to their irregular morphologies and the resolution limits of conventional measurement systems. Therefore, in such cases, particle size distribution data are employed as an indirect indicator for assessing fiber length characteristics [57,58].
Figure 6 provides a detailed representation of the morphological diversity of RVC particles by illustrating their dimensional characteristics, including length, width, and thickness distributions. This analysis enables a more comprehensive understanding of the geometric features of fiber cross-sections and their dispersion behavior within the composite matrix. Particle size distribution measurements revealed that approximately 83.25% of the recycled filler material consisted of particles larger than 4.9 mm, 2.92% fell within the range of 1.2 mm to 4.9 mm, and 13.83% were smaller than 1.5 mm. These findings highlight the heterogeneous nature of the filler material and reflect the effectiveness of the size classification process [59].
This distribution reveals the influence of mechanical recycling on the physical heterogeneity between particle sizes and corresponding fiber fractions. During the sieving stage, certain fiber segments retained on specific mesh levels were observed to possess at least one-dimensional attribute—such as width or thickness—exceeding the nominal aperture size of the mesh, despite their fiber lengths being shorter. Since these anomalies do not align with the systematic classification principles established for particle separation, they were categorized as exceptions. Accordingly, their occurrence was documented qualitatively but excluded from the quantitative percentage calculations to preserve the integrity of the classification methodology and ensure consistent interpretation across the dataset [60,61].
The dimensional diversity and morphological irregularities of RVC fillers play a decisive role in shaping the mechanical performance of VPC systems. In particular, the poor dispersion of voluminous, coarse, and geometrically inconsistent fillers within the matrix tends to weaken interfacial bonding efficiency and disrupt stress transfer pathways [62,63]. These localized structural instabilities may lead to stress concentration zones and inefficient load distribution [64]. Under mechanical loading—especially tensile and flexural stresses—such irregularities can significantly compromise the overall strength and durability of the composite structure [65].
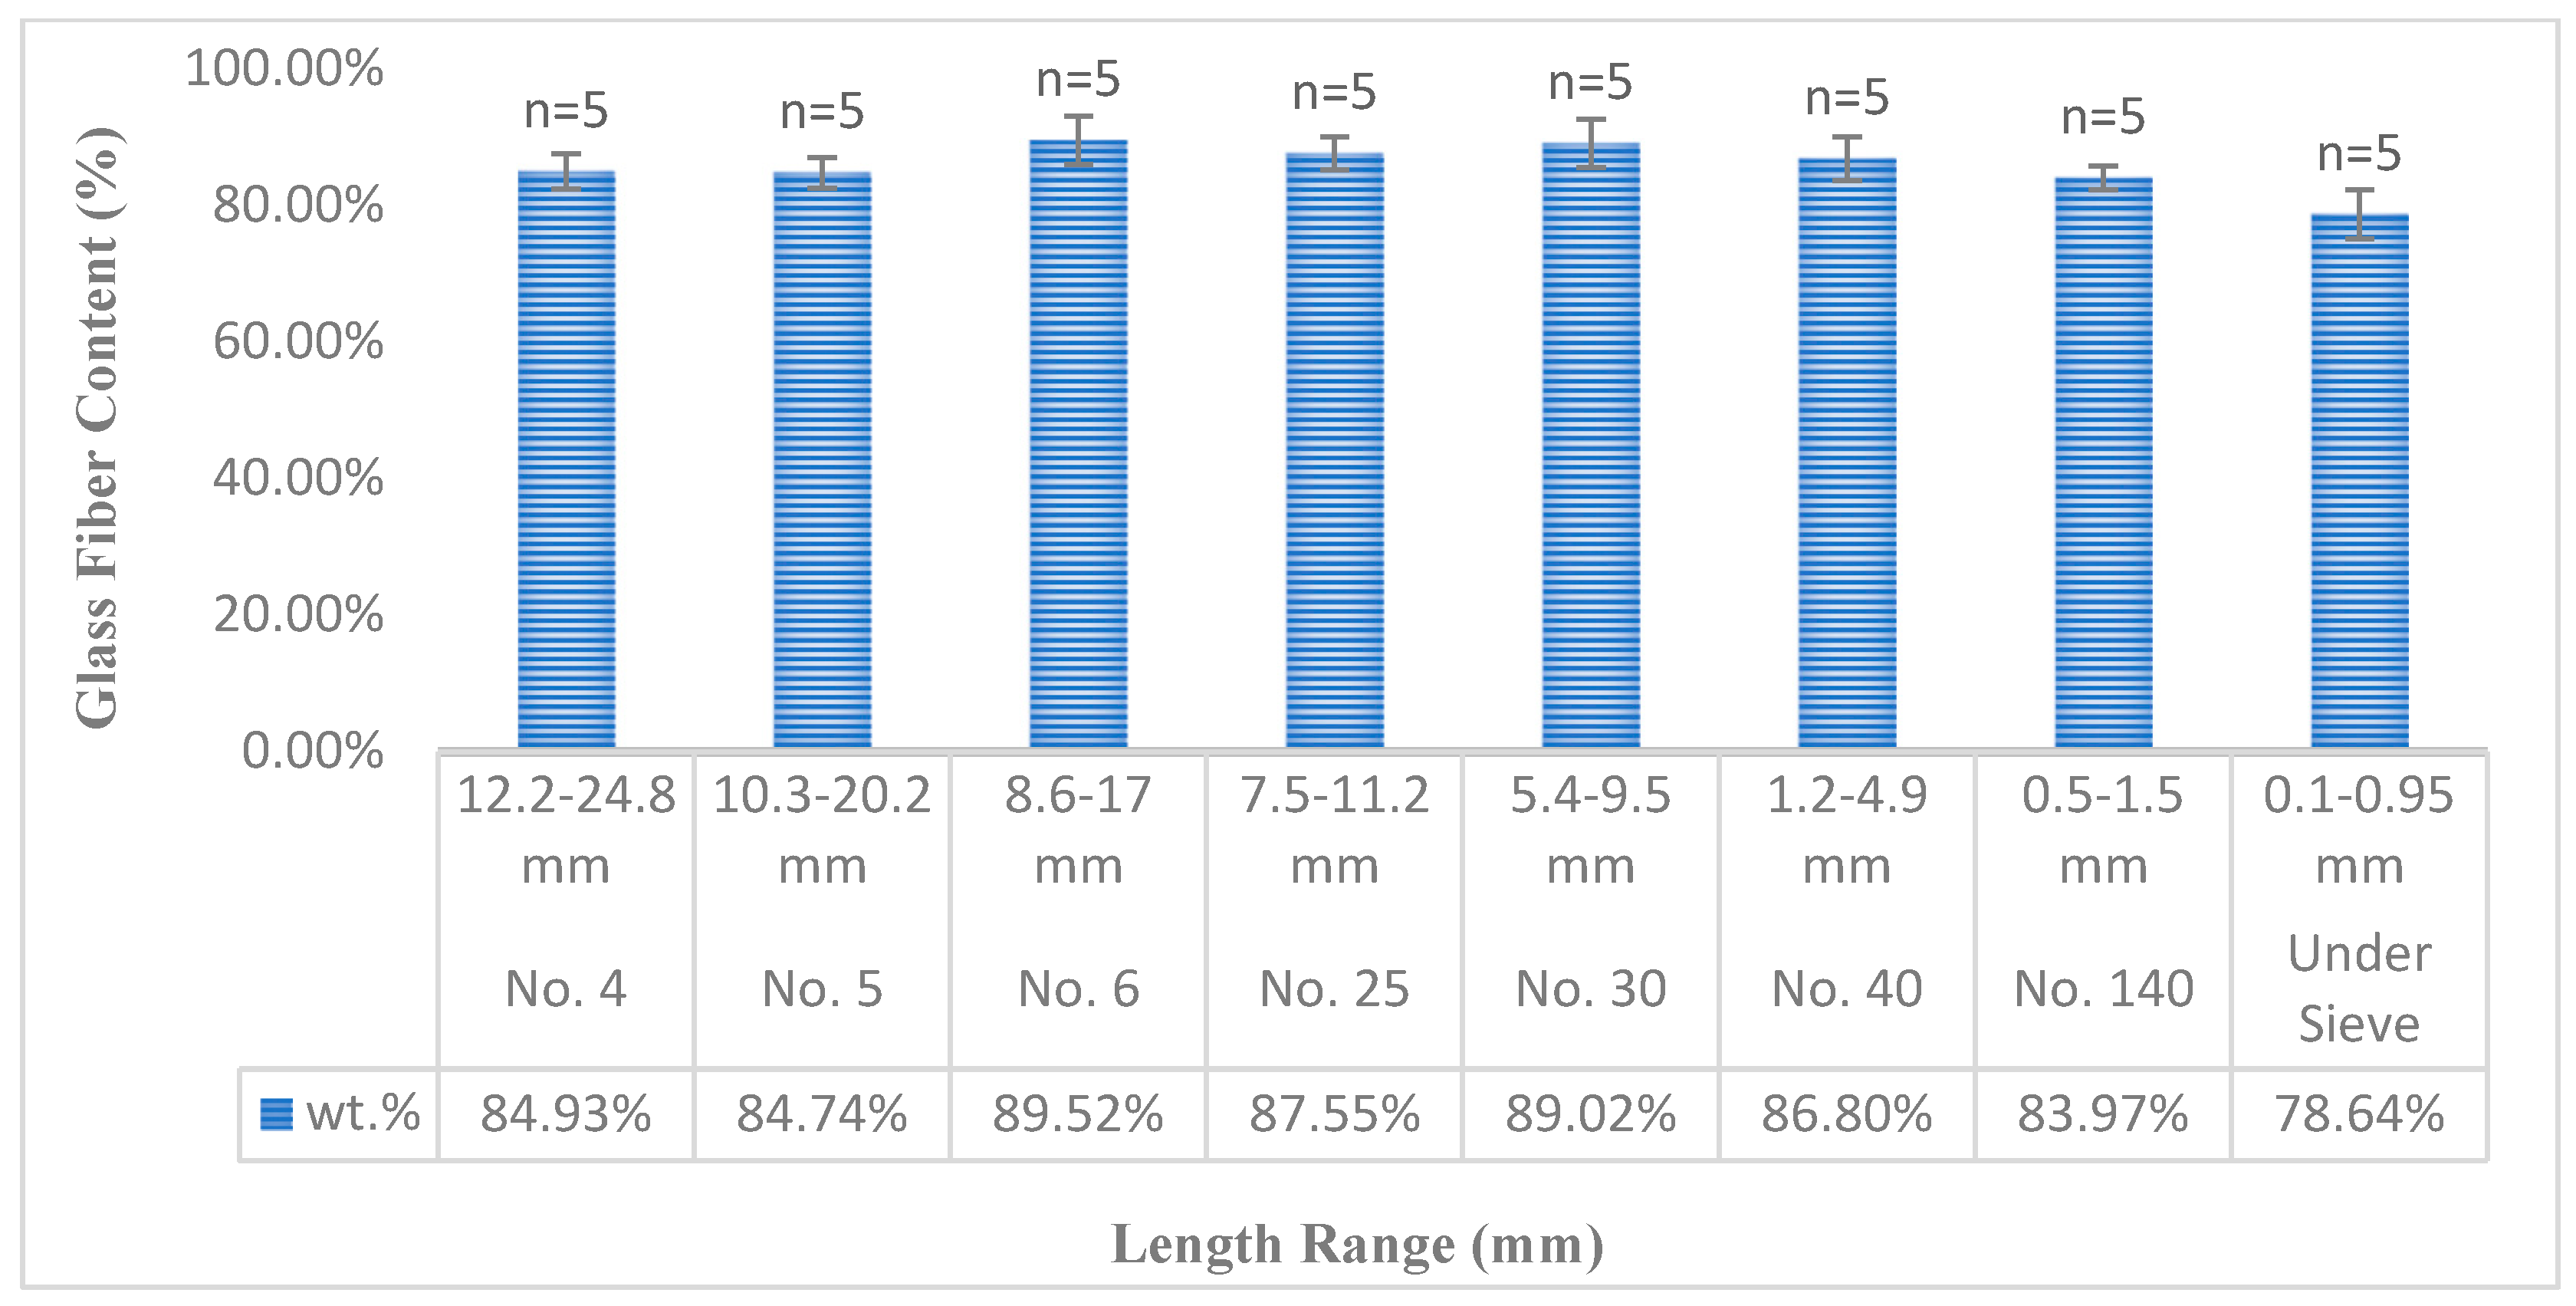
Compositional analysis of glass fiber–reinforced composite rods manufactured via the pultrusion process using a vinyl ester (VE) matrix revealed glass fiber and resin contents of 78.77% and 21.23%, respectively. Following mechanical grinding for material recovery, the RVC fillers exhibited an increased glass fiber content of 85.06%, while the resin proportion decreased to 14.94%. This approximately 7.99% increase is attributed to the separation of the matrix phase from the fibers or its transition into finer fractions during the recycling process. The physically more stable nature of glass fibers contributes to their enrichment in the recovered filler after grinding [66,67]. Quantitative data related to the glass fiber and resin distributions in the sieved fractions are presented in Figure 7.
RVC particles retained in the No. 6, 25, 30, and 40 mesh fractions contained an average glass fiber ratio of 88.22%, indicating a 3.72% increase compared to the overall average. This rise is mainly attributed to the structural characteristics of the original pultruded vinyl ester rods, which have a high fiber volume and unidirectional alignment. During mechanical recycling, the rigid and dimensionally stable glass fibers tend to remain in coarser fractions, while the more brittle thermoset matrix is more prone to fragmentation. Conversely, in the No. 140 and pan fractions, a decrease in glass fiber content and an increase in matrix residue were observed. This pattern reflects the migration of fragmented resin into finer fractions, while shorter and thinner glass fiber segments are either separated during sieving or become too small to be detected by the measurement system.

3.2. Assessment of Thermoset-Filled PE Composites (VPCs)

In the fabrication of VPCs, recycled vinyl ester–based glass fiber reinforced polymer waste materials (RVC) were utilized as particulate fillers. These fractions contain not only glass fibers but also residual thermoset matrix components, making it necessary to perform additional analyses to quantify the actual glass fiber content in the final composite. Therefore, controlled burn-off tests were conducted in accordance with ASTM D3171, which provides a standard procedure for determining fiber content via post-combustion residue analysis. For clarity, the sample codes used in this study are as follows: VLC1–VLC5 denote LDPE-based composites containing 10–50 wt.% recycled vinyl ester–glass fillers, whereas VHC1–VHC5 refer to the corresponding HDPE-based formulations. The quantitative results obtained are presented in Table 3.
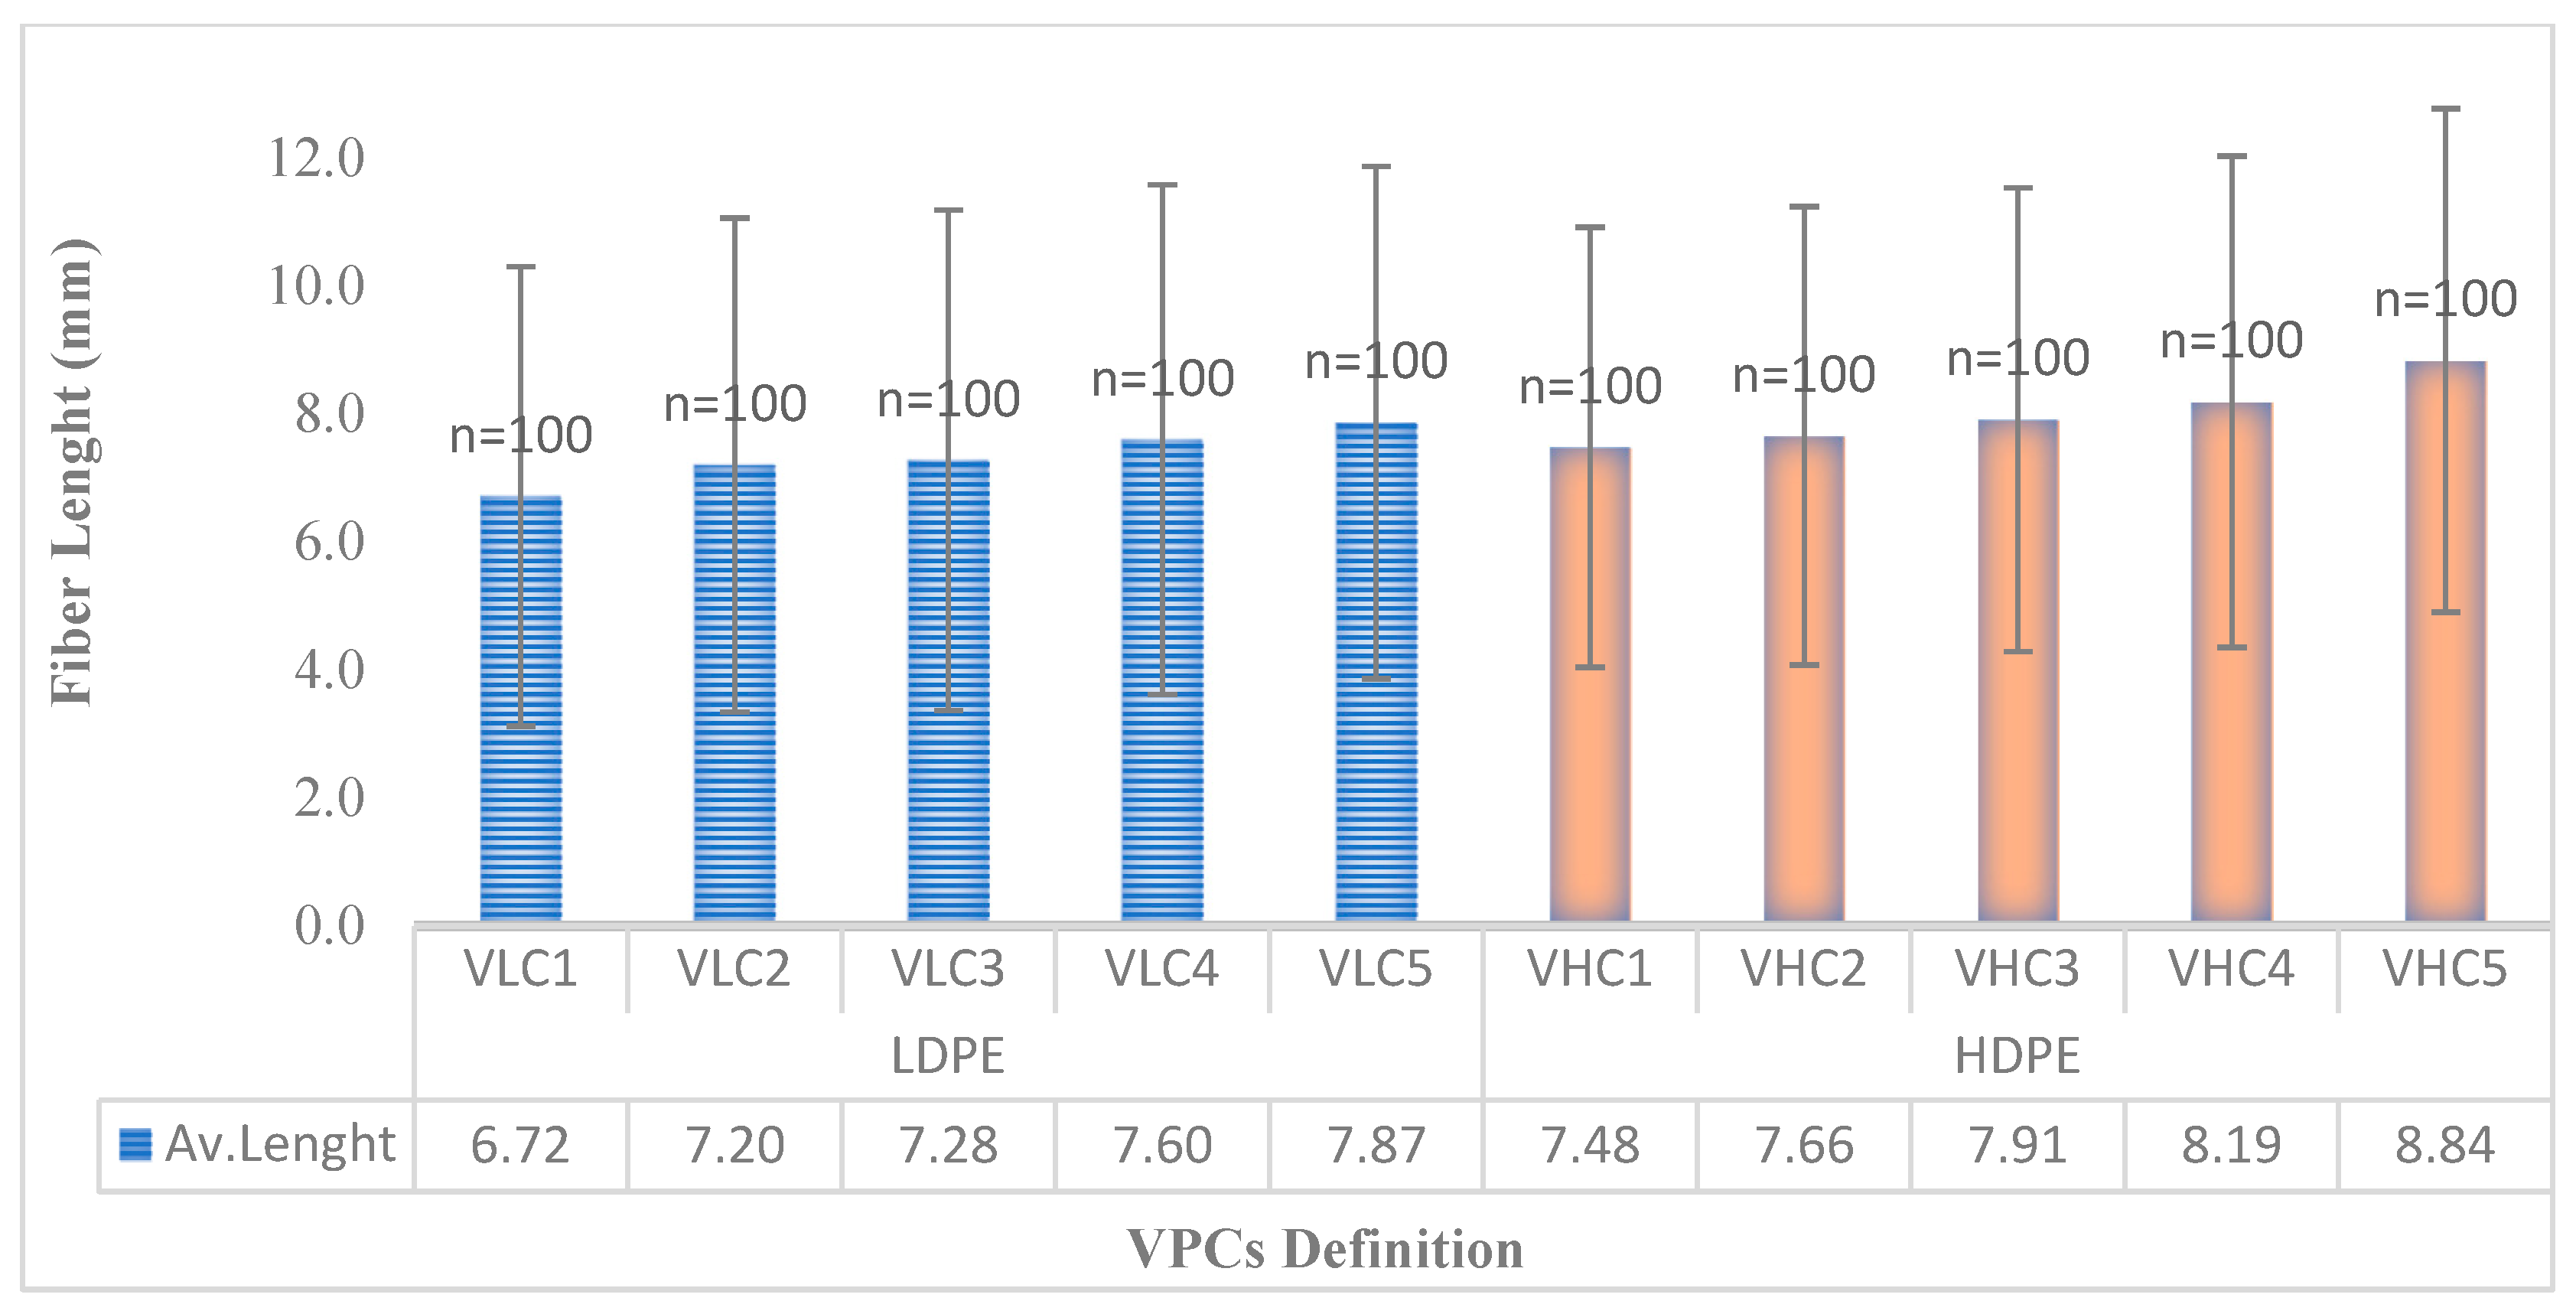
Burn-off test results indicate that increasing RVC fillers content in VPCs leads to a higher proportion of glass fiber residue (see Table 3). This rise in filler content not only affects thermal degradation pathways but also introduces microstructural heterogeneity, which contributes to variability in post-combustion residue morphology. Notably, composites with HDPE matrices exhibit greater inconsistency in residue structure compared to those with LDPE, a trend attributed to HDPE’s semi-crystalline nature that amplifies interfacial irregularities between filler and matrix. In contrast, the more amorphous LDPE matrix facilitates uniform filler dispersion and stress transfer, resulting in more consistent combustion behavior and residue formation [68,69]. The average size distribution of glass fibers in VPCs is significantly influenced by both the intrinsic mechanical properties of the matrix and the applied processing conditions. As illustrated in Figure 8, the fiber length distribution varies notably across composite samples. Strong shear forces encountered in single-screw extrusion result in the wear and fragmentation of glass fiber bundles [70]. Interfacial friction between the thermoset matrix and the fibers further contributes to fiber breakage, occasionally reducing fragments to micron-scale particles [71]. Additionally, the thermal energy generated during mixing alters the rheological behavior of the vinyl ester powder, affecting matrix viscosity and flow characteristics [72]. These changes directly influence fiber–matrix interactions and ultimately define the resulting fiber morphology. Therefore, processing parameters such as matrix viscosity, compounding temperature, residence time, and screw speed are critical in governing fiber integrity and distribution, which in turn determine the mechanical performance of the final composite system [56]. Ville et al. [73] demonstrated that fiber breakage is directly influenced by processing parameters such as screw speed and residence time. Specifically, they reported that increasing screw speed accelerates fiber breakage, while increasing feed rate—thereby reducing residence time—helps minimize fiber degradation. Their findings also highlight the importance of evaluating not only the average fiber length but also the fiber length distribution for accurately assessing processing-induced damage, especially in relation to the presence of longer fibers. Chang et al. [74] developed a particle-level numerical model to investigate the breakage behavior of glass fibers under simple shear flow. Each fiber was modeled as a chain of rods subjected to hydrodynamic, elastic, and interaction forces, and the simulation results were validated by comparison with experimental data obtained from a Couette-type rheometer. The model incorporated fiber cluster relaxation behavior and failure probability theory to account for complex effects such as fiber entanglement, enabling better alignment between numerical predictions and experimentally observed fiber length distributions. The study successfully predicted the decreasing trends in both number-average and weight-average fiber lengths, providing insight into the mechanisms of fiber damage under shear flow conditions. Zhu et al. [75] developed a finite element model to analyze fiber breakage in multi-fiber composites. The study showed that shear bands near matrix cracks significantly affect stress distribution at the fiber–matrix interface, playing a key role in initiating fiber failure. It also highlighted that matrix properties and fiber volume fraction can be optimized to improve composite performance by controlling stress concentrations. Haque et al. [54] demonstrated that fiber end geometry in short fiber-reinforced composites significantly influences stress distribution and failure mechanisms. Their findings highlight the importance of optimizing micro-mechanical design parameters to enhance the mechanical performance of composites.
The average glass fiber lengths were measured as 7.33 mm and 8.02 mm for RVC-filled LDPE and HDPE matrix composites, respectively. This variation is primarily attributed to the higher melt viscosity and mechanical strength of HDPE compared to LDPE, which mitigates fiber fragmentation during compounding [76]. For example, the VHC5 sample exhibited an average fiber length of approximately 8.84 mm, whereas VLC5 showed 7.87 mm. These differences are closely associated with the mechanical interactions between the fillers and the polymer matrix, as well as the flow behavior of the polymer melt [68]. Furthermore, increasing the proportion of RVC fillers slightly improved fiber retention. In the LDPE group, the average fiber length increased from 6.72 mm in VLC1 to 7.87 mm in VLC5. This suggests that rigid thermoset filler fragments contribute to dimensional stability by partially limiting fiber attrition during processing [77].

3.3. Evaluation of Density and Hygroscopic Behavior in VPCs

The density data presented in Table 4 indicates a notable increase in material density with the rising filler content in vinyl ester-based thermoset waste composites (VPCs). This trend is primarily attributed to the volumetric replacement of the polymer matrix by the denser filler phase, thereby elevating the overall system density [78]. Furthermore, the increased filler loading induces microstructural rearrangements within the composite, which not only affect the density distribution but also influence the mechanical performance by modifying the internal architecture and interfacial interactions [79].
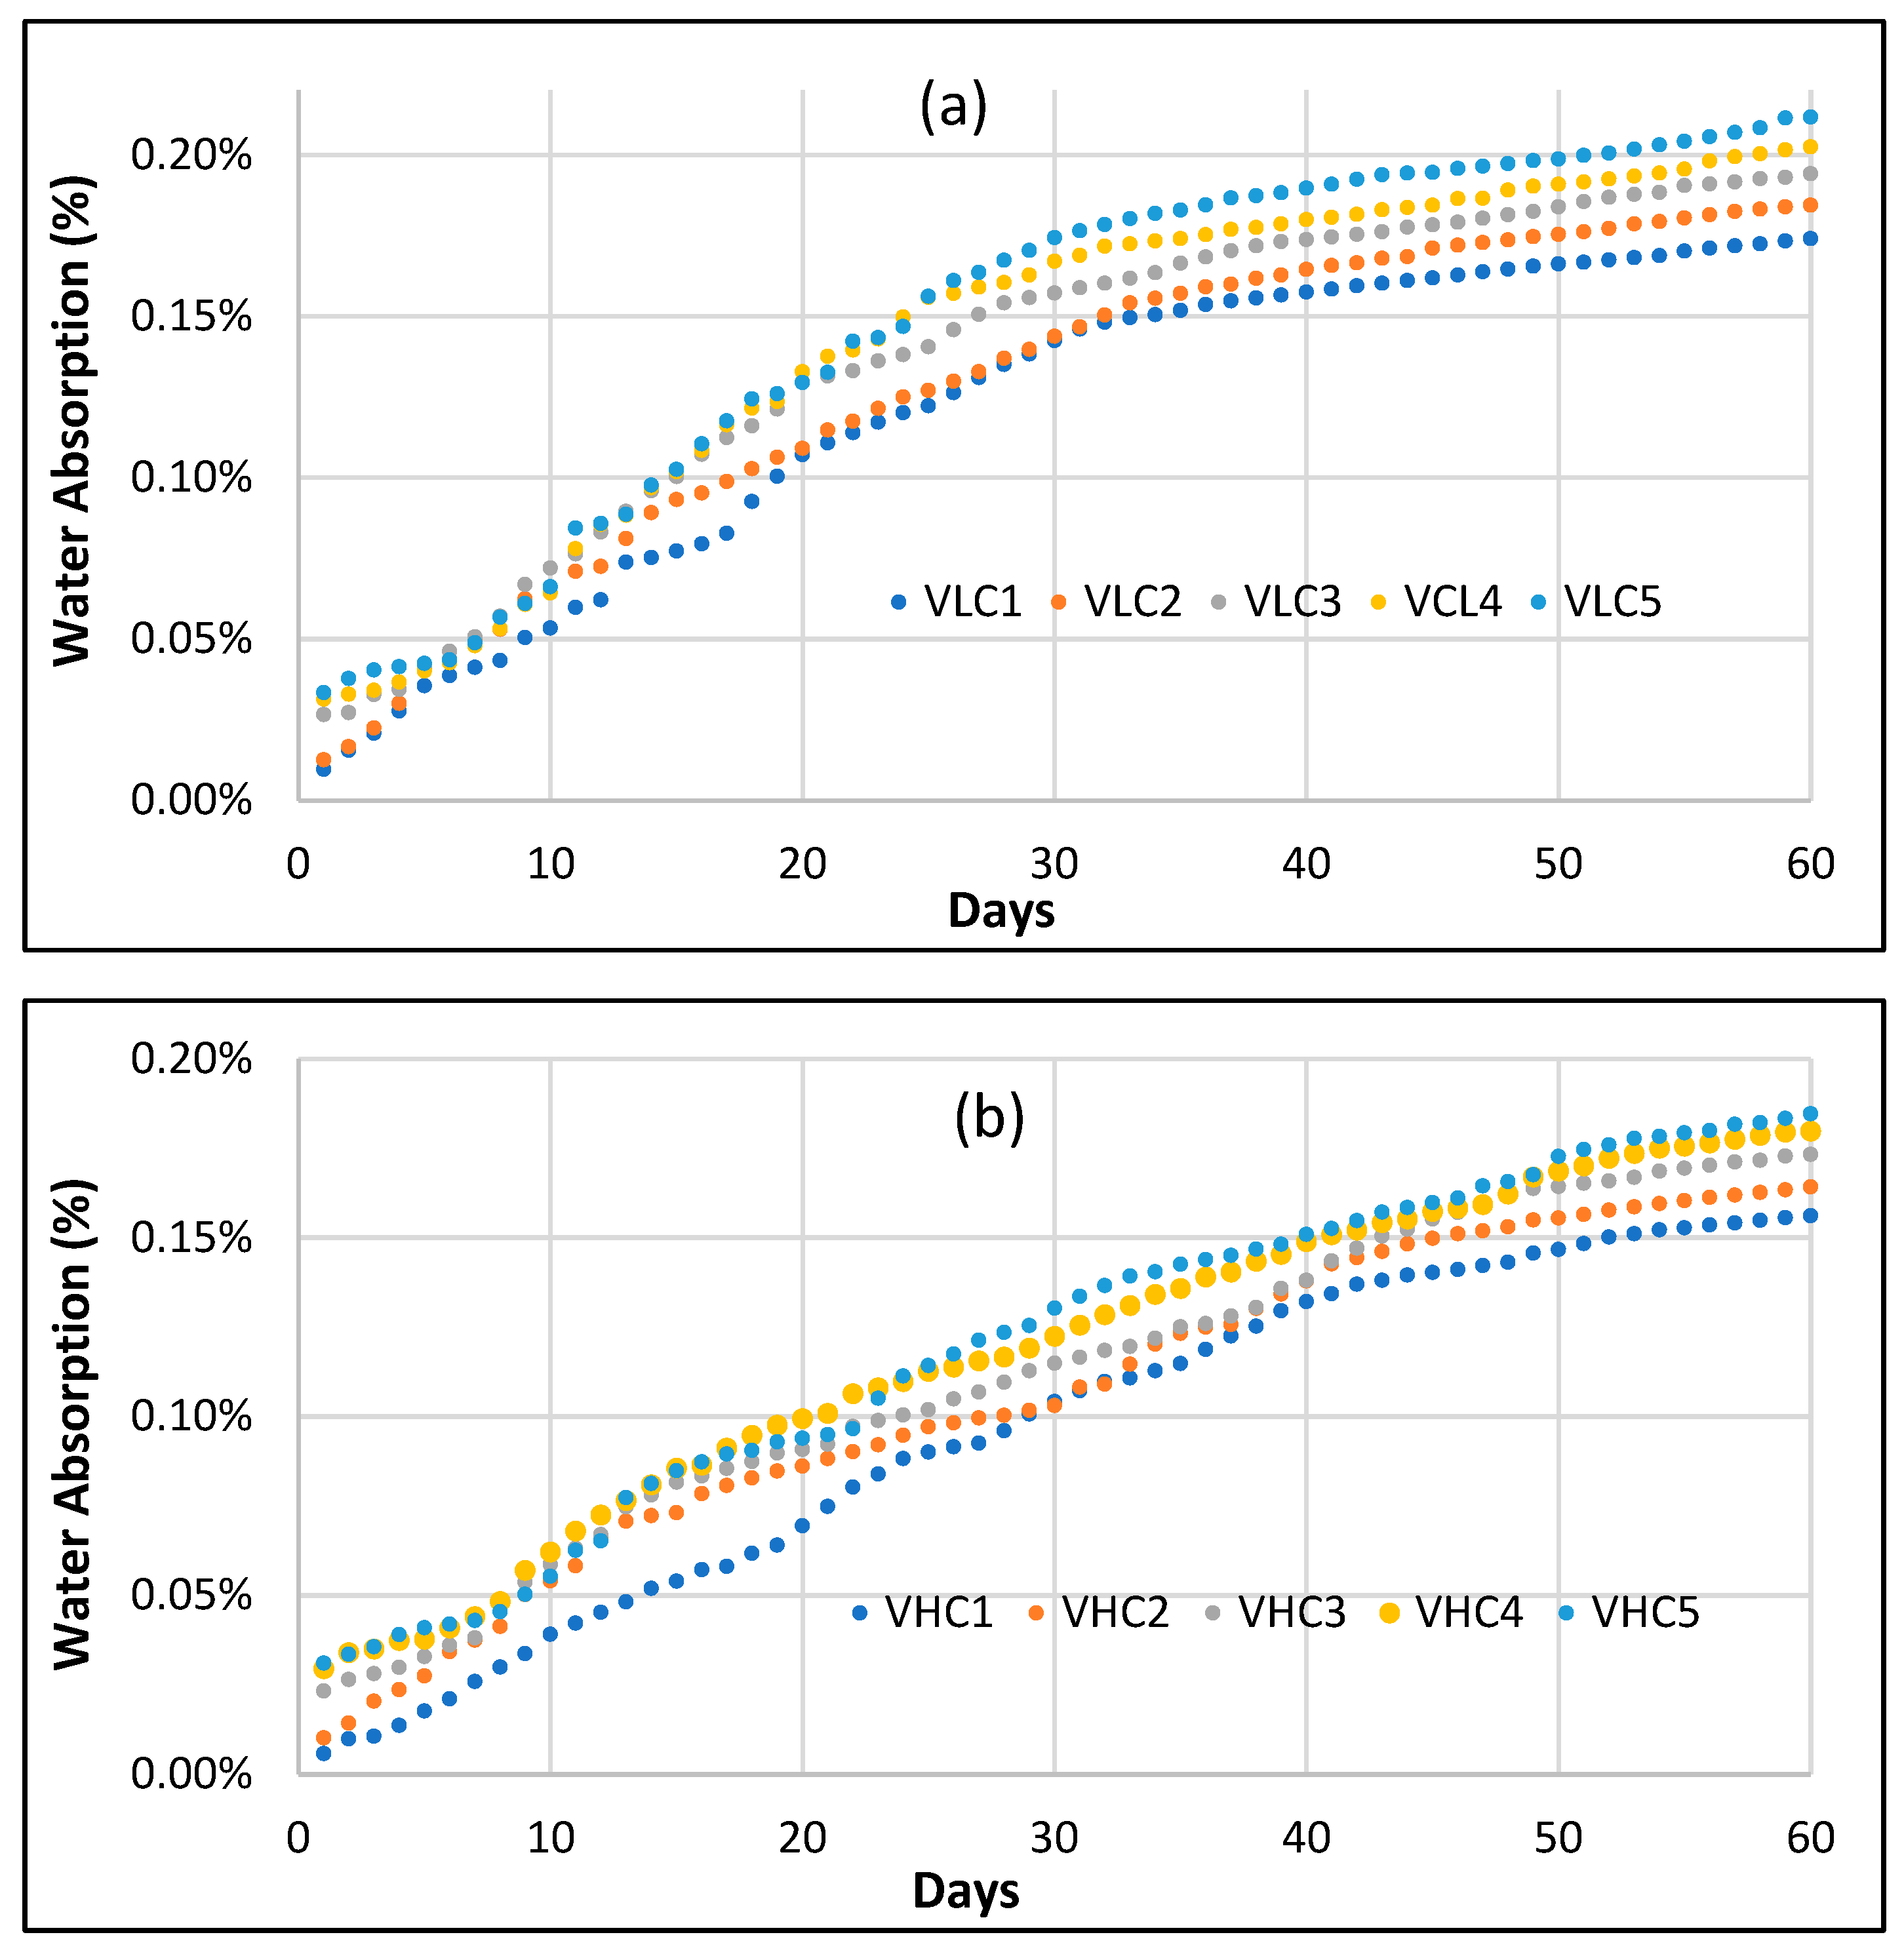
The water absorption behavior of recycled vinyl ester–glass fiber composite (RVC) fillers reinforced thermoplastic polymer composites (VPCs) was evaluated through 60-day gravimetric diffusion experiments, revealing time-dependent uptake characteristics within the polymer matrix. In thermoplastic matrix composites, moisture ingress is influenced by three primary factors: (i) the chemical structure and polarity of the polymer matrix [80], (ii) the integrity of the fiber–matrix interface [81], and (iii) the microstructural void content induced by filler morphology [82]. Matrices such as LDPE and HDPE, known for their low polarity and semicrystalline structure, typically exhibit reduced water permeability and enhanced resistance to long-term moisture-induced degradation. Glass fibers additionally serve as passive diffusion barriers, disrupting the continuity of water migration pathways within the composite architecture [55]. Despite these properties, increasing the proportion of RVC fillers—particularly in the 40–50 wt.% range—can introduce structural heterogeneities, including fiber agglomeration, vinyl ester-induced phase transitions, and micro void clustering [83,84]. These morphological defects create easy pathways for water to penetrate, especially where the vinyl ester matrix forms weak interfaces [85]. Capillary movement through interconnected voids, segmental mobility of polymer chains, and interface dissolution contribute to non-Fickian diffusion behavior that may deviate from classical predictions based on Fick’s second law [86]. Consequently, elevated water absorption in high-RVC fillers-content VPCs has been associated with matrix relaxation, interfacial debonding, crack propagation, and fiber erosion, all of which compromise long-term mechanical stability [87,88].
As shown in Figure 9, the 60-day gravimetric water absorption data for VPCs revealed distinct moisture uptake trends governed by the matrix type and filler content. In LDPE-based composites (VLC1–VLC5), water uptake steadily increased with rising RVC fillers content, ranging from 0.174% in VLC1 to 0.212% in VLC5. This near-linear increase indicates that, despite the inherently hydrophobic nature of the LDPE matrix, higher filler loadings facilitate water diffusion through the formation of micro voids and discontinuities at the matrix–filler interface. Conversely, HDPE-based composites (VHC1–VHC5) exhibited consistently lower water absorption, with values ranging from 0.156% in VHC1 to 0.184% in VHC5. This reduction is attributed to the higher crystallinity and denser molecular packing of the HDPE matrix, which restricts the penetration of water molecules and acts as a more effective moisture barrier. A comparative assessment showed that both matrix systems demonstrated relatively low overall water absorption levels after 60 days (<0.25%). However, HDPE-based composites maintained a more stable barrier performance despite increasing RVC fillers content. In contrast, the LDPE-based systems exhibited slightly higher moisture permeability, likely due to structural relaxation and degradation of interfacial morphology at elevated filler levels. These findings underscore the critical influence of matrix selection on the hygrothermal durability of thermoplastic composites. Excessive incorporation of RVC fillers can compromise morphological integrity—particularly in matrices with lower crystallinity—thereby accelerating water diffusion kinetics and potentially degrading long-term performance.

3.4. Analysis of Fiber Morphology and Distribution in VPCs

3.4.1. Optical Microscopy Analysis

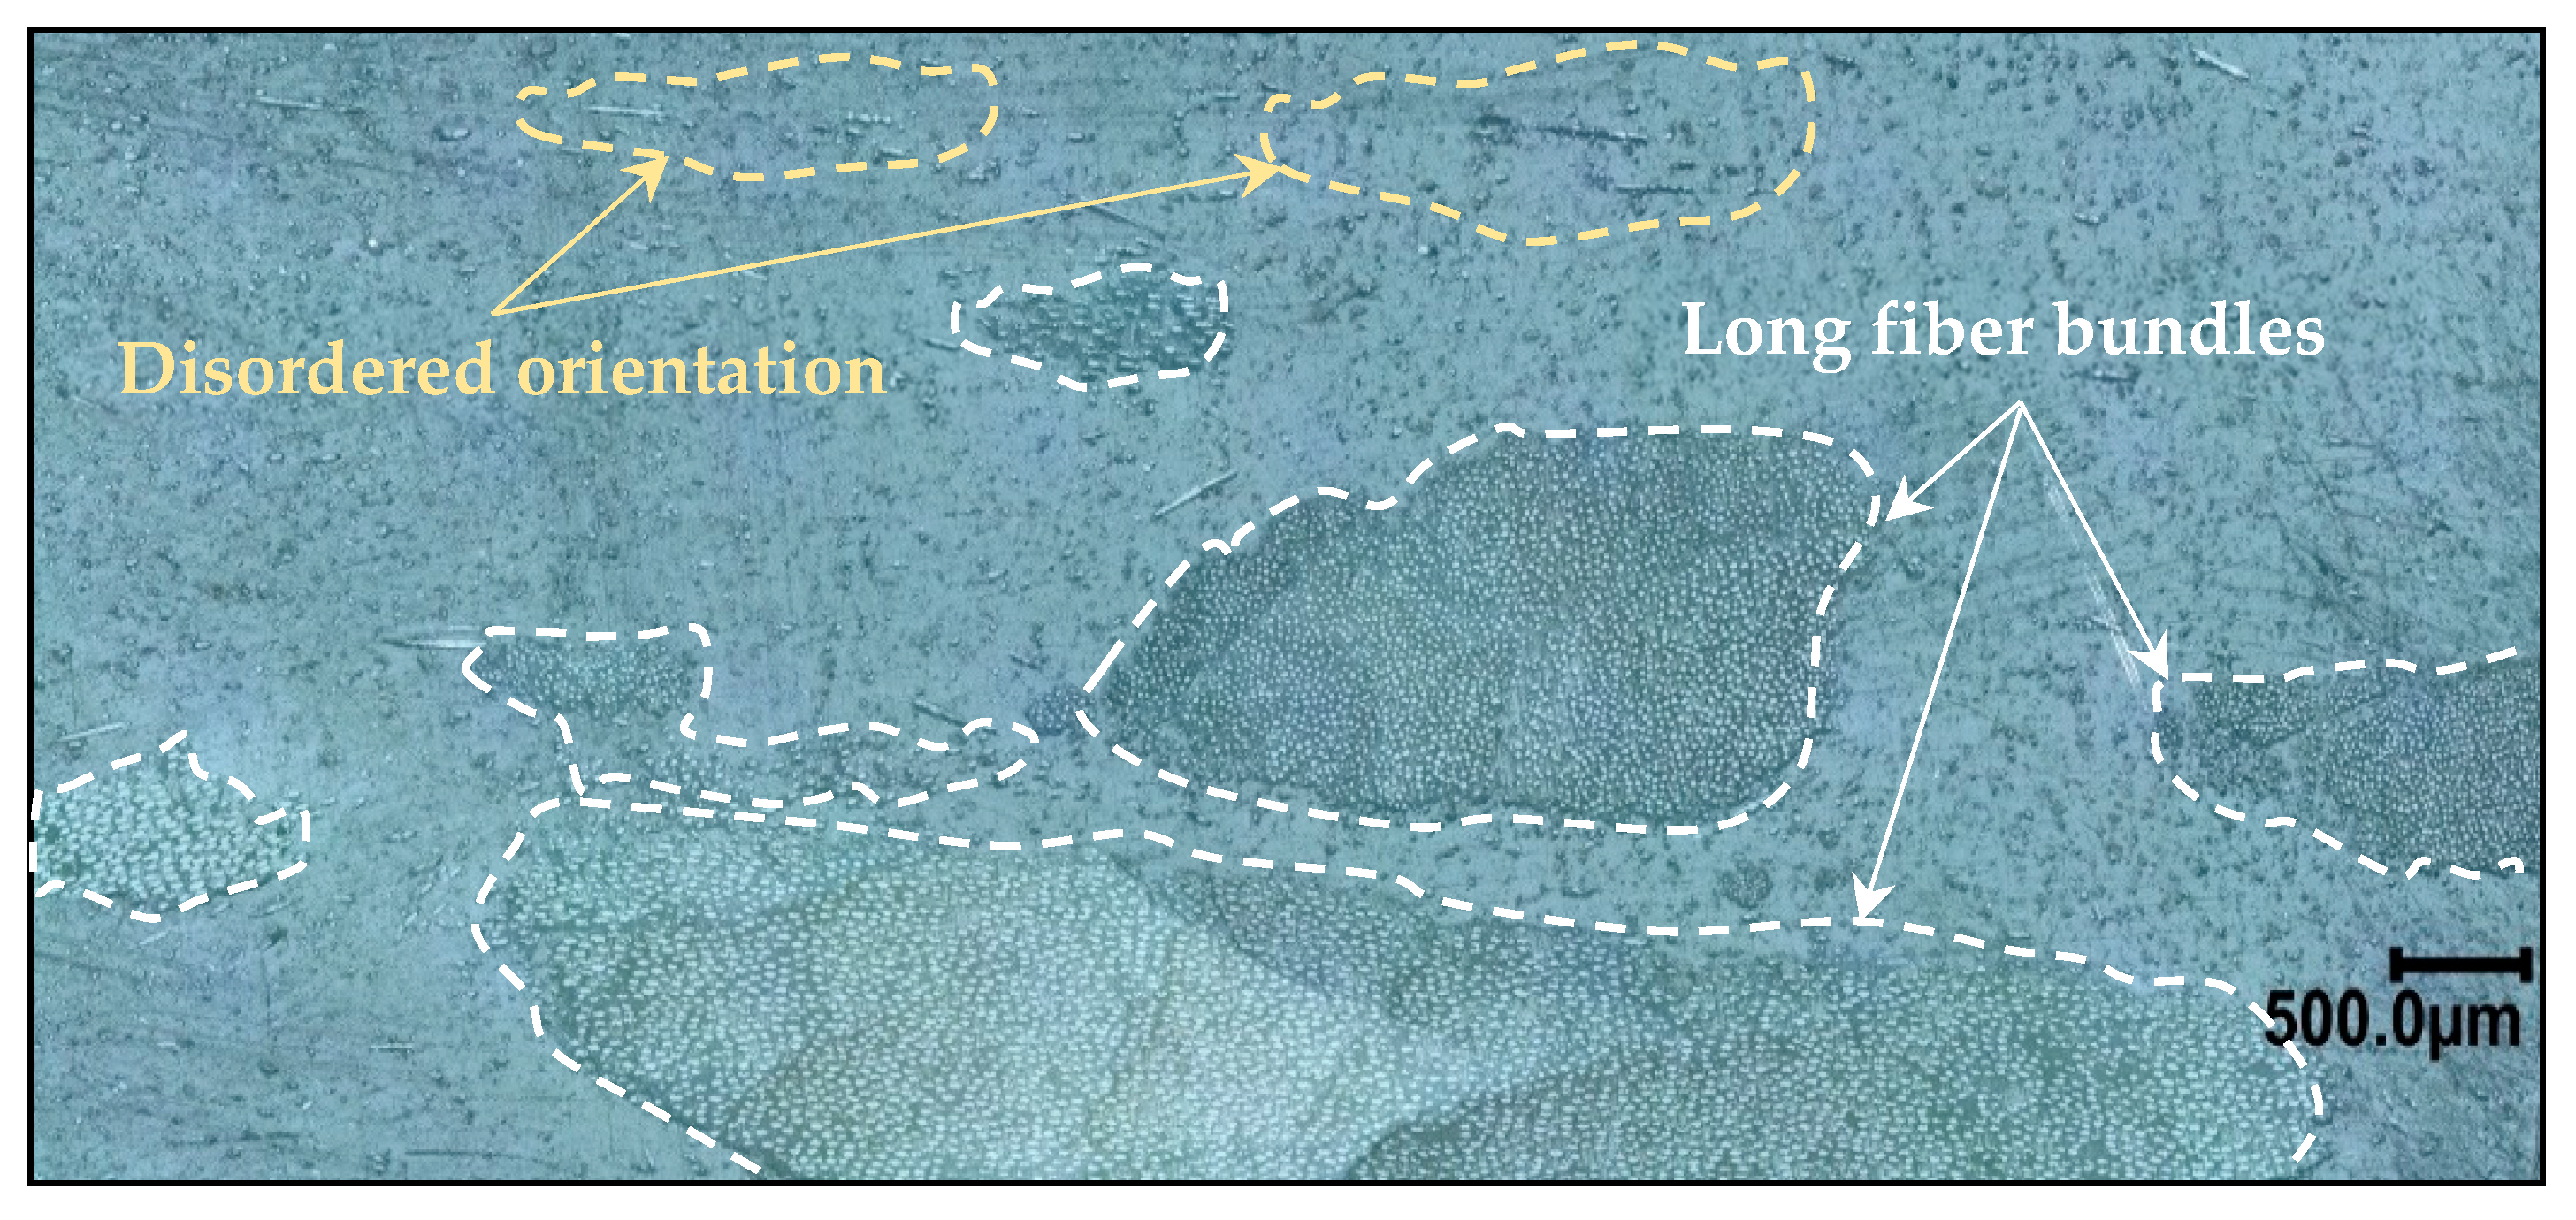
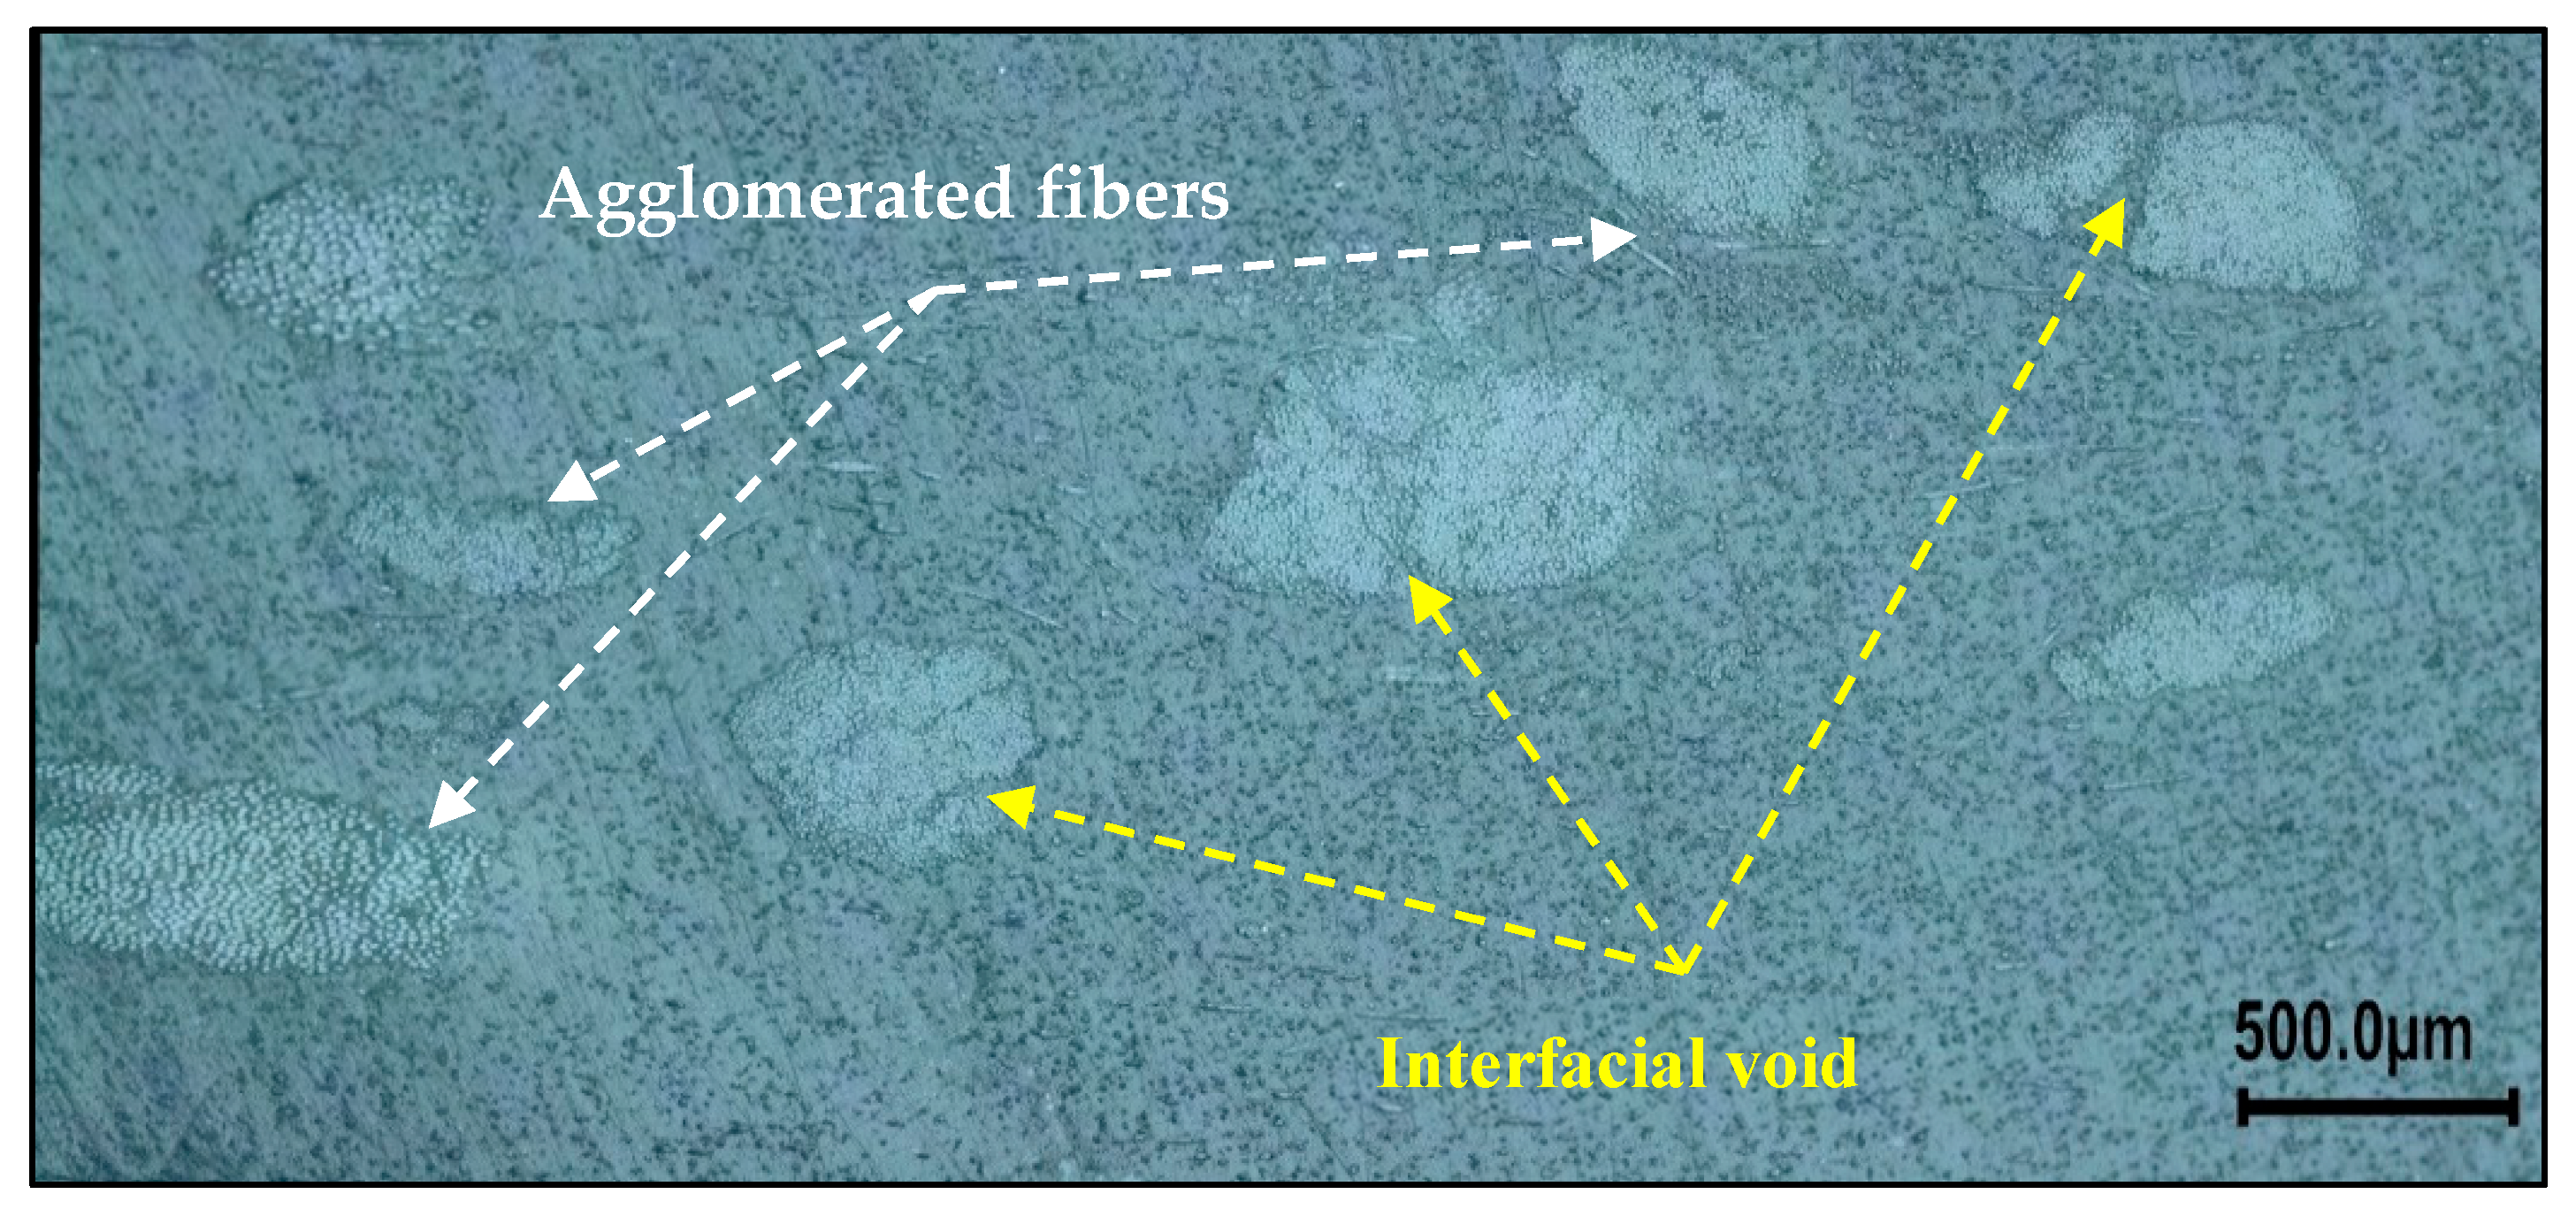
Optical microscopic examinations provide valuable microstructural insights into the distribution, morphological characteristics, and void formation tendencies of recycled vinyl ester-based glass fiber (RVC) fillers embedded in a polyethylene (PE) thermoplastic matrix. In this study, VPCs with varying RVC filler contents were analyzed, with detailed assessments focused on the VLC5 and VHC5 specimens containing 50% RVC fillers. High-magnification images revealed that glass fibers tend to form localized clusters in specific regions, resulting in variations in local fiber density. Moreover, loosely bonded fibers appeared prone to slippage over one another, contributing to disordered orientation within the matrix. The fiber distribution was largely random, promoting a pronounced microstructural anisotropy and leading to localized stress concentrations at the fiber–matrix interfaces. This heterogeneity is considered a potential weakness mechanism, as it may facilitate early crack initiation and limit the overall mechanical performance of the composite system. The morphological diversity observed in the images of Figure 8 exhibits a highly heterogeneous distribution when the RVC fillers are classified based on their shape factor and degree of dispersion. Long fiber bundles with high shape factors tend to form large agglomerates within the matrix, whereas medium-sized, partially dispersed fiber segments are more uniformly distributed. Short fiber fragments and microfibers partially embedded in the matrix are predominantly observed in the background, exhibiting extensive interfacial contact areas but limited load-bearing capacity. Additionally, amorphous powder phases, resin residues, and irregular particles likely containing glass dust were detected within the microstructure. Although these phases contribute as viscosity modifiers and fillers, their high concentrations may adversely affect the mechanical performance.
As shown in Figure 10, optical micrographs of the VLC5 specimen reveal a pronounced heterogeneity in fiber orientation and spatial distribution, accompanied by the presence of multiple morphological fractions within the LDPE matrix. This microstructural irregularity represents a critical parameter affecting the composite’s mechanical performance and suggests that targeted optimization strategies—such as pre-sorting of filler morphology, surface modification, or controlled spatial placement—may be required depending on application-specific demands. In the context of matrix–filler distribution, analysis shows that thermoset-based filler phases exhibit diverse morphologies and irregular dispersion within the matrix. Furthermore, an increase in fillers content notably exacerbates microstructural heterogeneity. Up to a 30% RVC fillers concentration, the composite displayed relatively uniform particle dispersion and minimal clustering. Beyond this threshold, however, marked agglomeration of RVC fillers were observed, likely inducing structural discontinuities and weakening regions that may compromise the overall integrity of the composite.
Figure 11 illustrates the microstructure of a composite consisting of a high-density polyethylene (HDPE) matrix reinforced with 50 wt.% recycled vinyl ester-based glass fiber (VHC5). The observed morphological diversity indicates pronounced heterogeneity in fiber dimensions and orientation. Segregation within long fiber bundles has led to weak inter-fiber cohesion and the presence of localized gaps or discontinuities, which may limit stress transfer. Although partial matrix infiltration between fibers was observed in these regions, such zones may compromise structural continuity. Short fiber fragments and microfibers were randomly distributed throughout the matrix and were mostly partially embedded. Despite offering a large interfacial contact area, these fractions contribute limited load-bearing capacity. In addition, amorphous powder phases, resin residues, and irregular particles possibly containing glass dust were identified, all of which may promote void formation and interfacial discontinuities, ultimately weakening the structural integrity of the composite. These findings highlight the critical importance of proper filler pre-treatment and achieving microstructural homogeneity to ensure sustainable composite performance.

3.4.2. Scanning Electron Microscopy Analysis

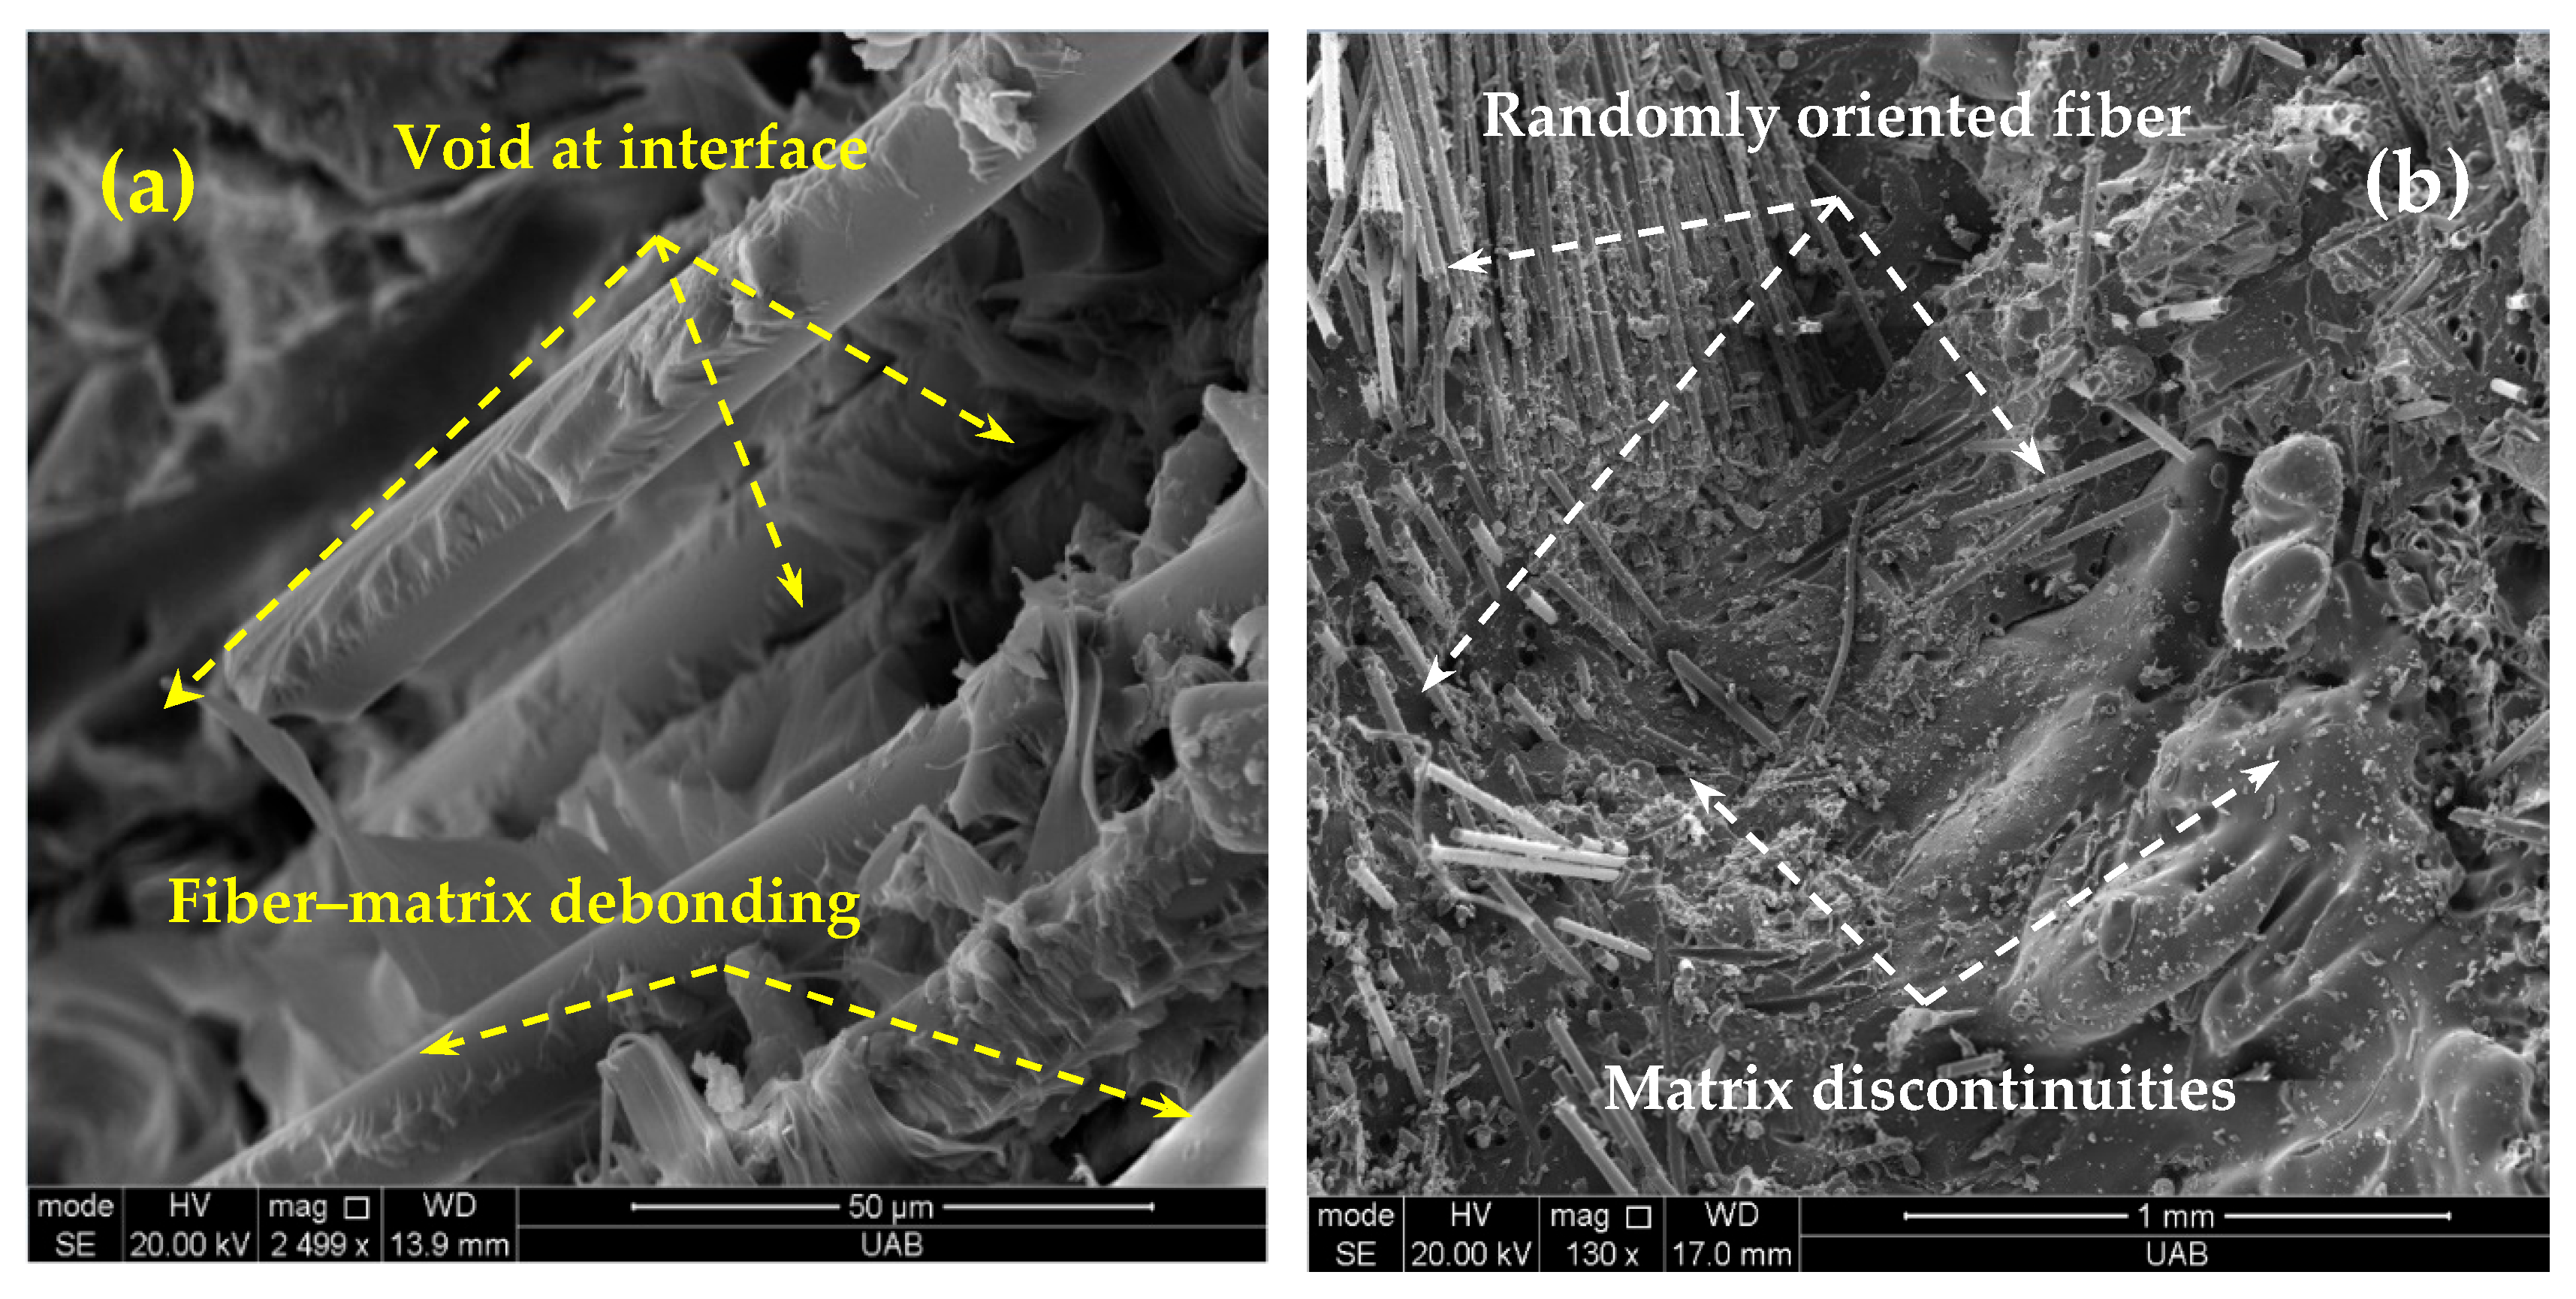
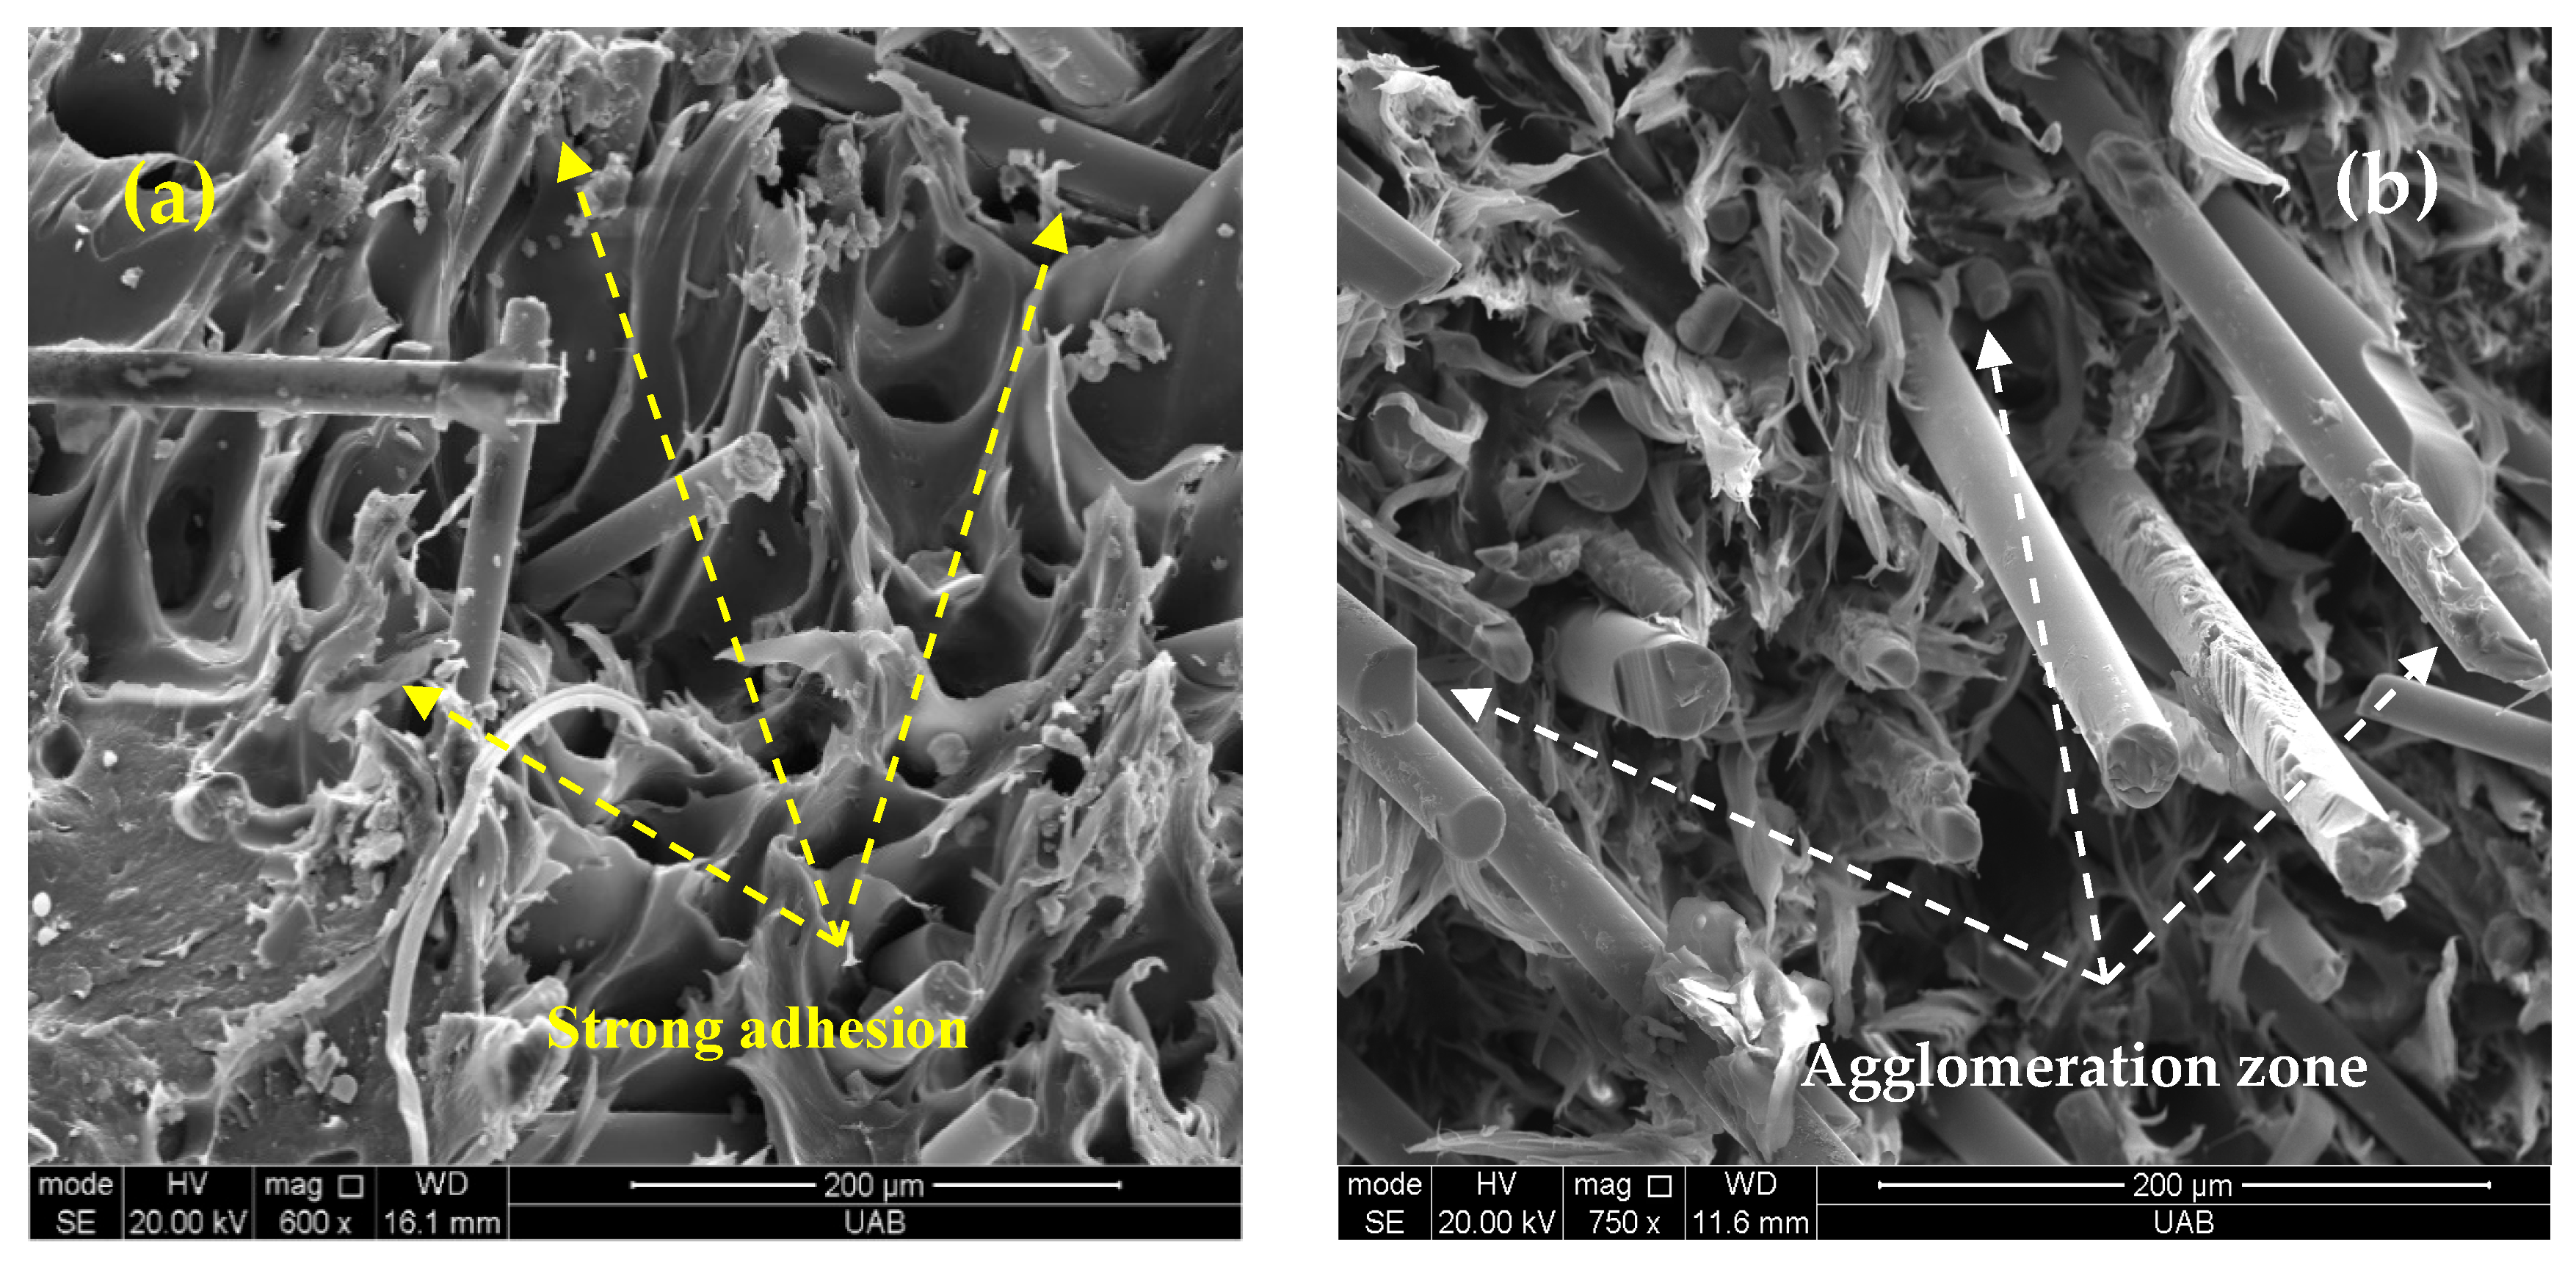
Figure 12 presents high-resolution SEM micrographs depicting the fracture morphologies observed on the tensile-tested surfaces of the thermoset-filled PE composites (VPC).
Figure 12a illustrates the fracture surface morphology of LDPE matrix composites containing RVC fillers, revealing their microstructural characteristics. The image shows a non-uniform dispersion of fiber fragments within the polymer matrix and the presence of distinct voids at the fiber–matrix interface. These voids indicate interfacial incompatibility, likely caused by inadequate wetting and limited mechanical interlocking between the matrix and the reinforcement phase. Necking traces observed on the LDPE matrix reflect the ductile deformation behavior of the polymer, whereas the fractured and irregularly oriented fiber ends suggest localized stress concentrations and crack initiation at these regions under mechanical loading. The sharpness of the interfacial transitions and the visible fiber–matrix debonding further imply that chemical interactions between the phases are minimal [48]. Additionally, dispersion deficiencies—likely stemming from suboptimal processing parameters—may introduce local heterogeneities in the mechanical properties of the composite material, posing a potential source of structural uncertainty [89,90]. The low-magnification SEM image presented in Figure 12b illustrates the overall distribution of the reinforcing phase and surface morphology within the HDPE matrix. The image reveals randomly oriented fiber-like structures alongside irregularly shaped particles, indicating insufficient alignment and inadequate dispersion during the manufacturing process. Notably, observed agglomerations of the reinforcing phase and matrix discontinuities highlight areas of structural weakness, reflecting morphological heterogeneities that may lead to localized reductions in mechanical performance. The detected undulated surface topography suggests weak interfacial bonding and limited mechanical interaction between the HDPE matrix and the reinforcement phase. These microstructural features are directly associated with critical processing parameters that significantly influence the composite system’s final mechanical properties [91,92].
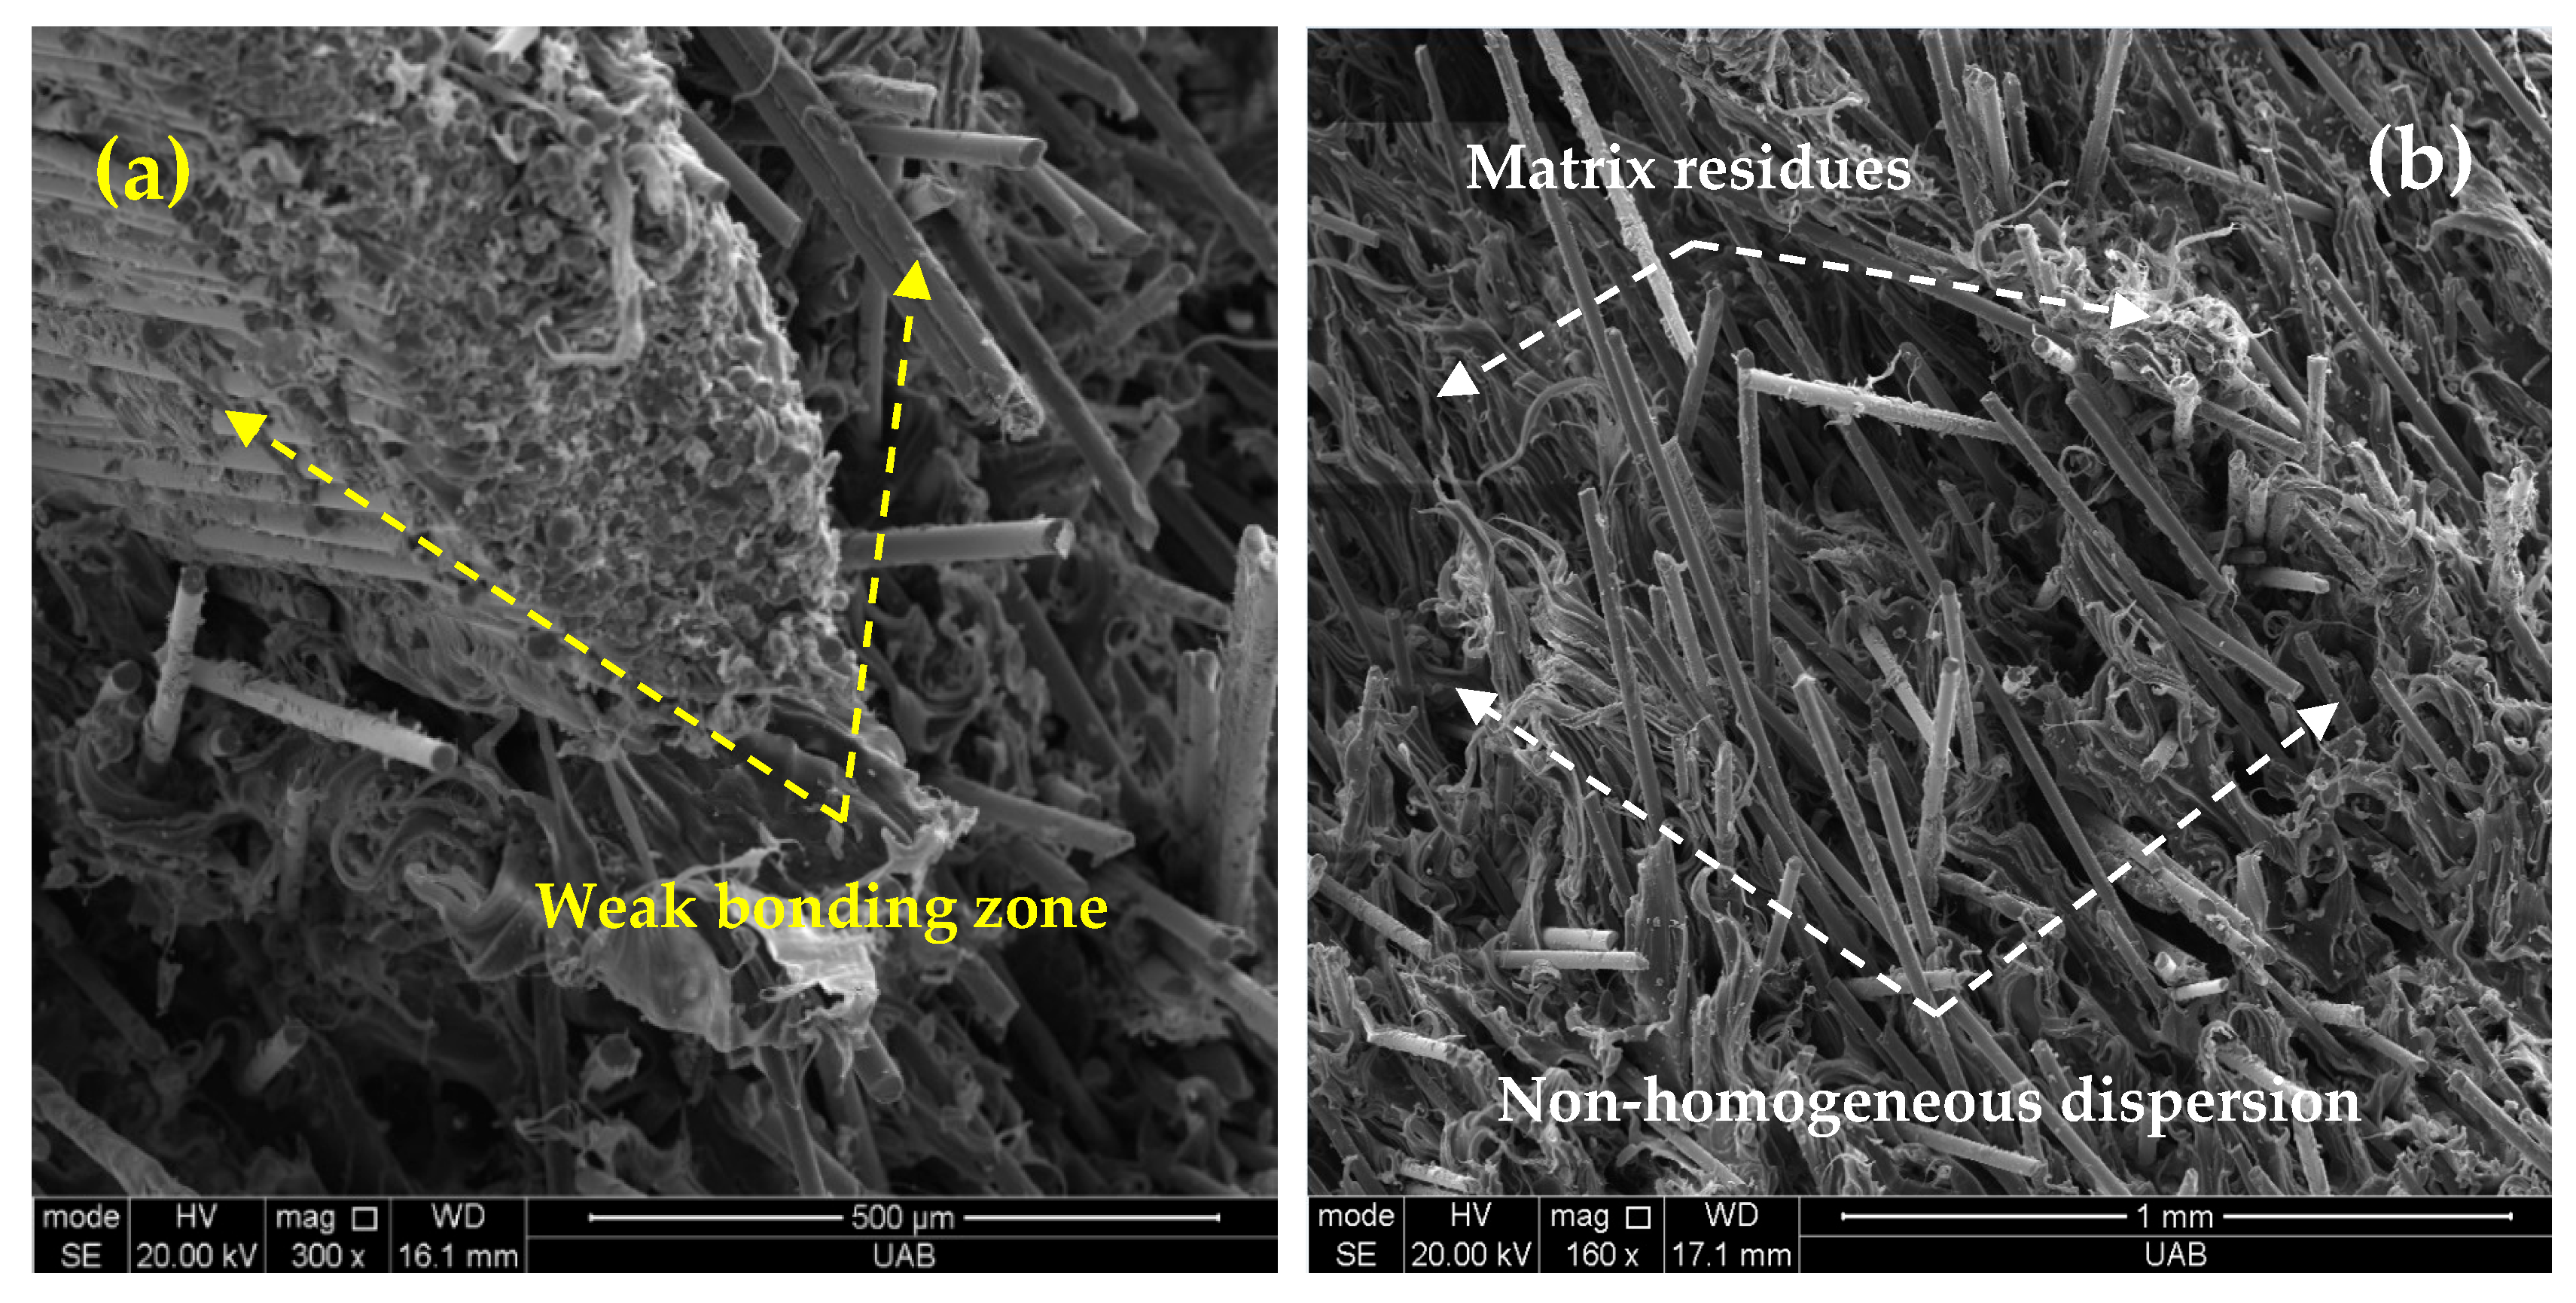
Figure 13a shows the SEM image of the composite containing 70 wt.% LDPE matrix and 30 wt.% RVC fillers. The image reveals randomly distributed fibers, irregular structures, and localized agglomerations within the matrix, indicating insufficient dispersion and orientation during processing. The ductile nature of the LDPE matrix is evident from the deformation traces. However, the sharp boundaries at the fiber–matrix interface suggest weak bonding and limited mechanical interlocking. Surface voids and irregularities may negatively affect the structural integrity of the composite. On the other hand, the presence of continuous contact zones between the matrix and fibers in certain regions indicates that limited mechanical load transfer has been achieved [77]. Figure 13b shows the low-magnification SEM image of the composite containing 70 wt.% HDPE matrix and 30 wt.% RVC fillers. Randomly distributed glass fiber fragments, irregular particle shapes, and localized agglomerations are observed. The ductile nature of the HDPE matrix is evident from deformation traces, contributing to energy absorption under mechanical load. Sharp transitions and void formations at the fiber–matrix interface indicate weak interfacial bonding and limited mechanical interlocking. These structural irregularities may represent zones of reduced local mechanical performance. In contrast, certain regions exhibit continuous contact between embedded fibers and the matrix, suggesting that limited load transfer can occur.
The fracture surfaces revealed distinct failure modes depending on the matrix type and filler loading. LDPE-based composites exhibited a combination of ductile fracture with matrix necking and partial fiber pull-out, indicating effective stress transfer and high energy absorption at 20–30 wt.% filler content. In contrast, HDPE-based composites predominantly showed brittle fracture, characterized by interfacial debonding, void propagation, and fiber breakage at higher filler loadings (≥40 wt.%). These morphological features closely correspond to the mechanical results: LDPE composites demonstrated greater strain tolerance and toughness, whereas HDPE composites achieved higher stiffness but reduced ductility. The observed correlation between microstructural integrity and mechanical response confirms that filler dispersion and interfacial bonding critically govern the fracture behavior and overall performance of thermoset-filled PE composites.

3.5. Comprehensive Analysis of Mechanical Behavior of VPCs

3.5.1. Mechanical Response Under Tensile Loading in VPCs

Fibers and fillers with diverse structures are widely used to enhance the mechanical properties of thermoplastic polymers. Glass, carbon, and natural fibers, along with inorganic fillers, directly influence the strength, stiffness, impact resistance, and thermal stability of composites. Ramesh et al. [93] aimed to investigate the effect of fillers on the mechanical and structural properties of polymer matrix composites. They focused on how surface treatments of natural fibers and the incorporation of nano-fillers can optimize composite performance in terms of strength, weight, and cost. The study also highlights the potential applications of filler-based composites in engineering fields. Liu et al. [94] aimed to provide a comprehensive overview of advanced microscopic and mechanical characterization techniques used to analyze the interface of carbon fiber reinforced polymer composites (CFRPs). Their goal was to highlight how the microstructure, chemical composition, and interfacial bonding strength affect the mechanical performance and failure behavior of CFRPs. The study also outlines recent developments in in situ testing methods and discusses future research trends in interface characterization. Kang et al. [95] evaluated the mechanical performance of recycled polypropylene composites reinforced with short and long glass fibers. Long fibers improved elongation at break and crack resistance, while fiber breakage during recycling and injection led to a ductile-to-brittle transition due to poor phase compatibility. These findings collectively emphasize the critical role of filler morphology, interfacial integrity, and processing conditions in shaping the tensile response of VPC systems.
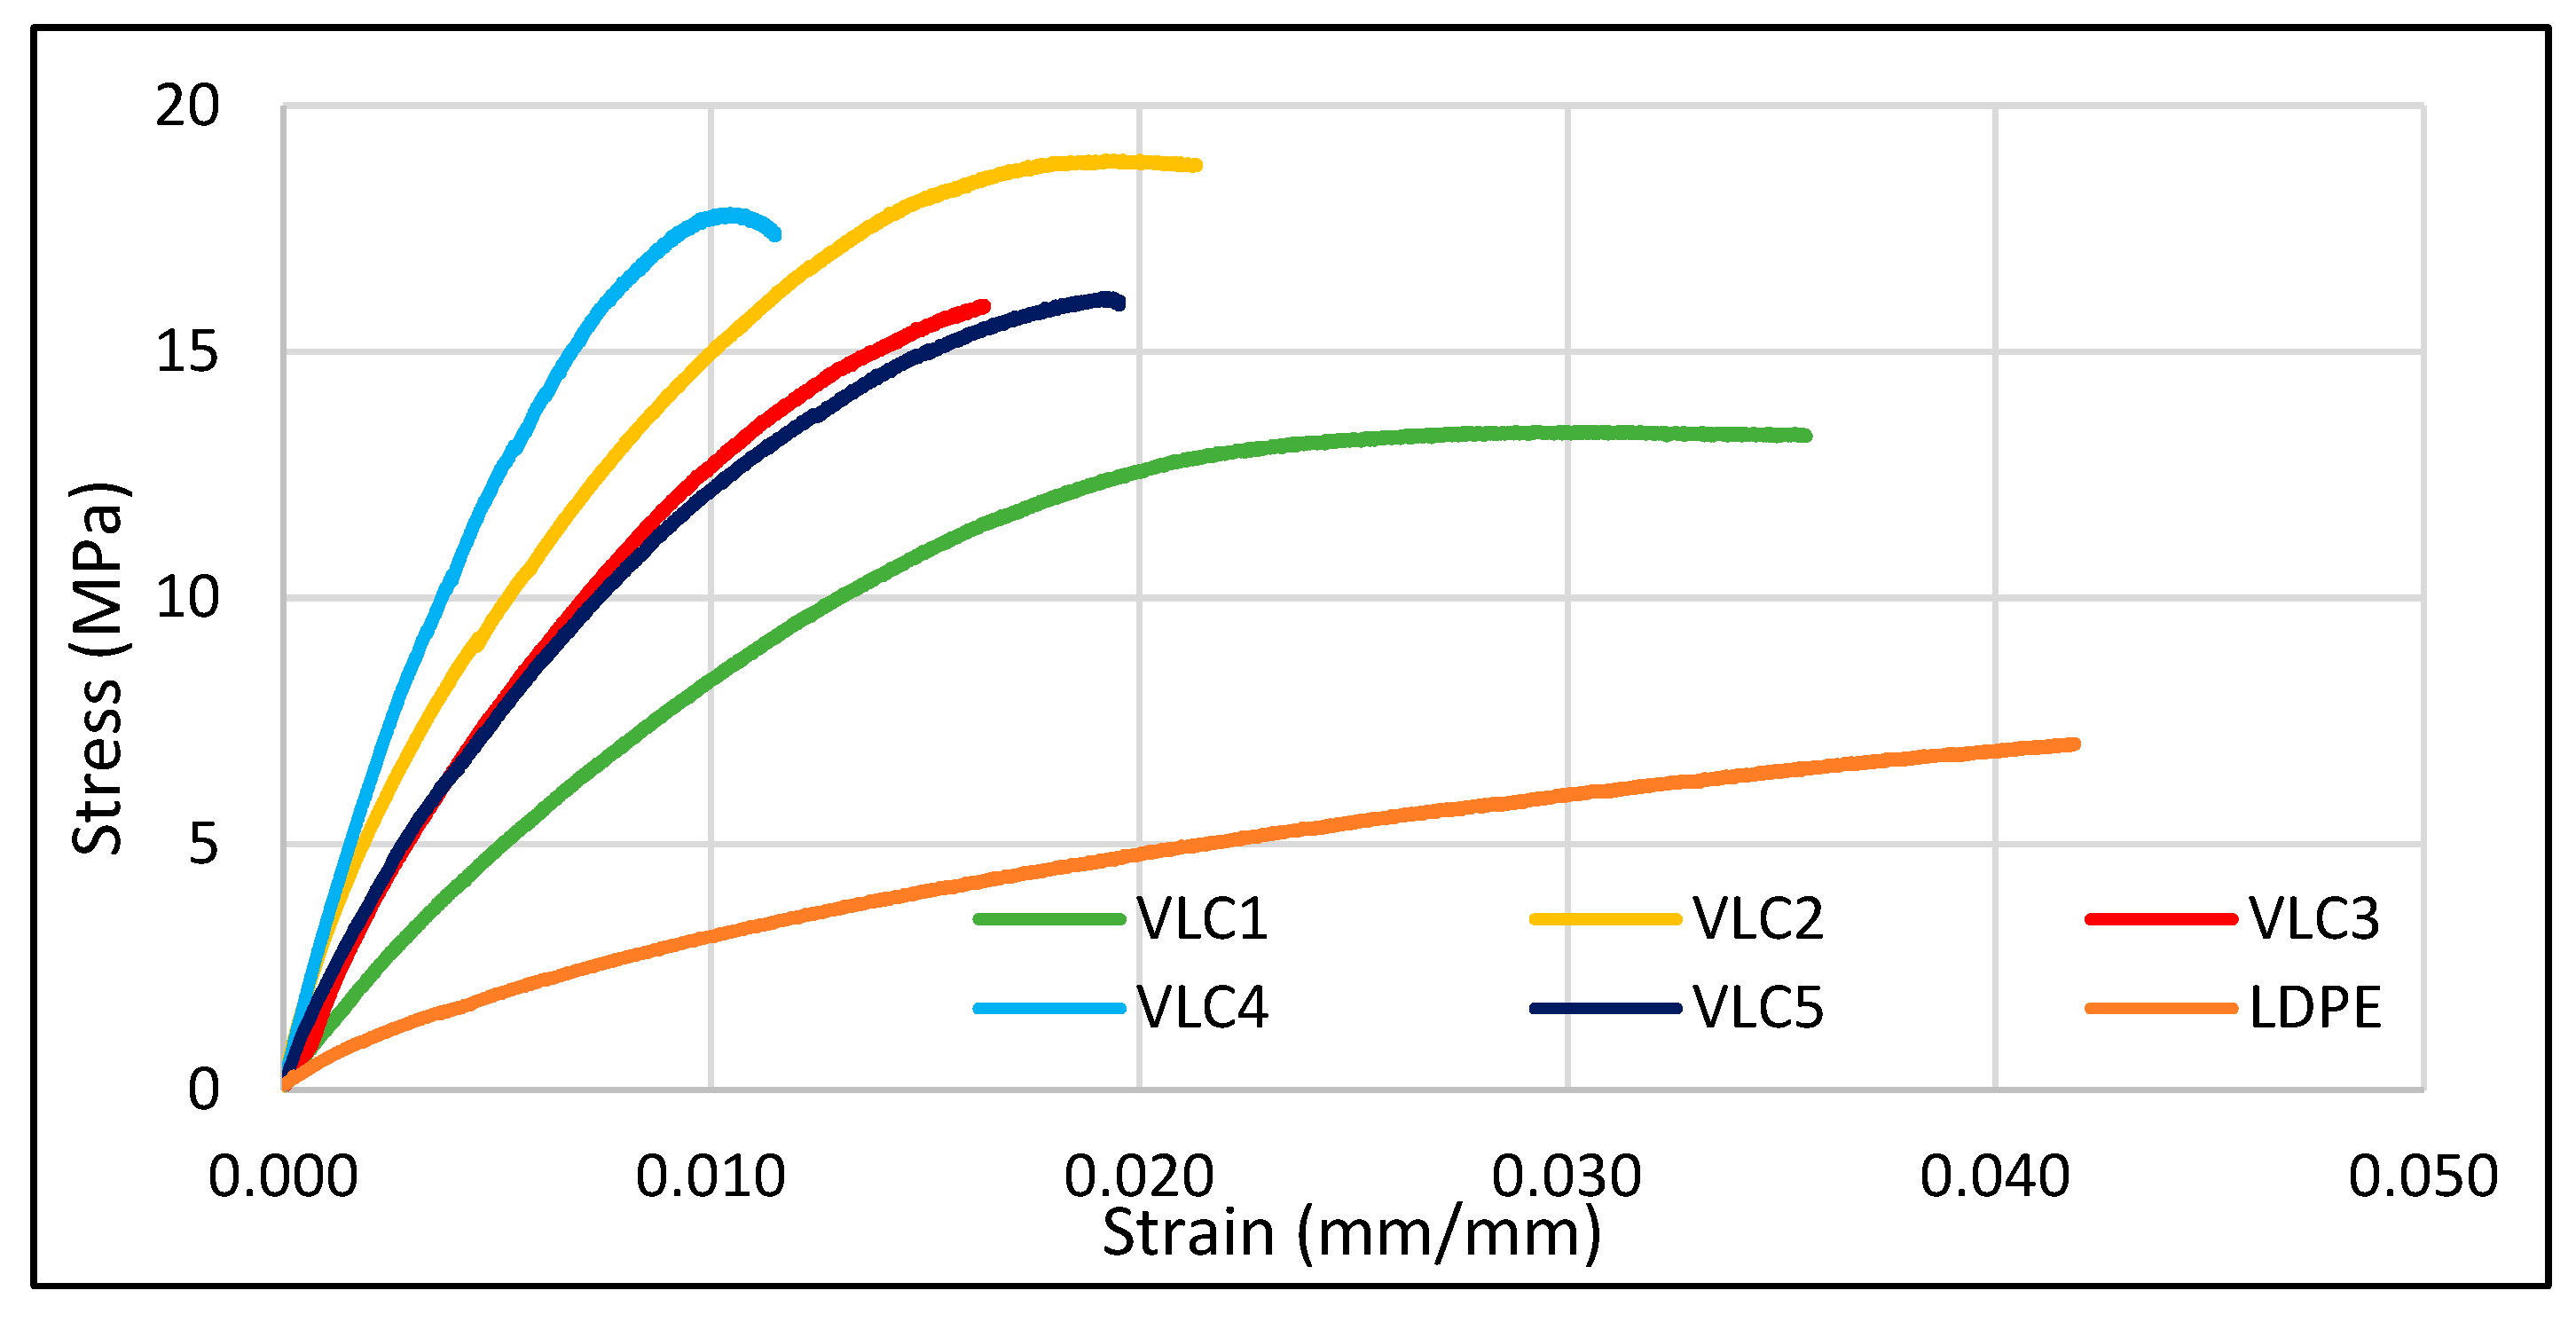
Figure 14 Stress–strain curves of LDPE-based composites reinforced with varying amounts of recycled vinyl ester glass fiber thermoset waste (VLC1–VLC5) are presented. These curves are analyzed to evaluate the mechanical influence of recycled thermoset fillers on LDPE matrix behavior. Neat LDPE exhibits typical thermoplastic characteristics, with high ductility (~0.04 mm/mm) and low tensile strength (~10 MPa), attributed to its semi-crystalline and amorphous phase structure. The absence of a distinct yield point and the smooth transition to plastic deformation indicate a ductile fracture mechanism [68]. Upon the addition of vinyl ester-based glass fiber fillers, significant changes are observed in elastic modulus, tensile strength, and deformation behavior. Particularly at 20–40 wt.% filler content (VLC2–VLC4), the slope of the elastic region increases, indicating enhanced stiffness. This improvement is attributed to effective load transfer and mechanical interlocking at the filler–matrix interface [96,97]. VLC2 (20 wt.%) demonstrates optimal mechanical performance, with increased tensile strength (~18 MPa) and acceptable ductility (~0.025 mm/mm), suggesting a critical threshold for filler efficiency. At higher filler loadings (VLC4–VLC5), stiffness continues to increase, while elongation at break decreases significantly. The brittle nature of the fracture is evident from the sharp drop in stress post-peak, indicating rapid and uncontrolled crack propagation [98,99]. These mechanical trends are corroborated by SEM analysis. SEM micrographs of low filler content samples (VLC1–VLC2) reveal homogeneously dispersed filler particles with minimal interfacial voids, promoting efficient stress distribution and delaying crack initiation [94]. In VLC2, the filler–matrix interaction appears optimal, with SEM images showing fiber pull-out replaced by fiber breakage, indicating strong interfacial bonding and high energy absorption capacity [95], as shown in Figure 15.
Conversely, high filler content samples (VLC4–VLC5) exhibit microstructural irregularities such as fiber agglomeration, interfacial debonding, and void formation. These defects act as stress concentrators, accelerating crack initiation and propagation, and leading to brittle fracture behavior [26]. Additionally, poor mechanical coupling in fiber–fiber contact zones disrupt load transfer, resulting in plateaued mechanical performance. In conclusion, a non-linear relationship exists between filler content and mechanical properties. An optimal filler level (~20 wt.%) offers a balanced combination of stiffness and ductility. SEM findings elucidate the microstructural basis of these mechanical behaviors, confirming the potential of recycled thermoset fillers for enhancing LDPE-based composite systems.
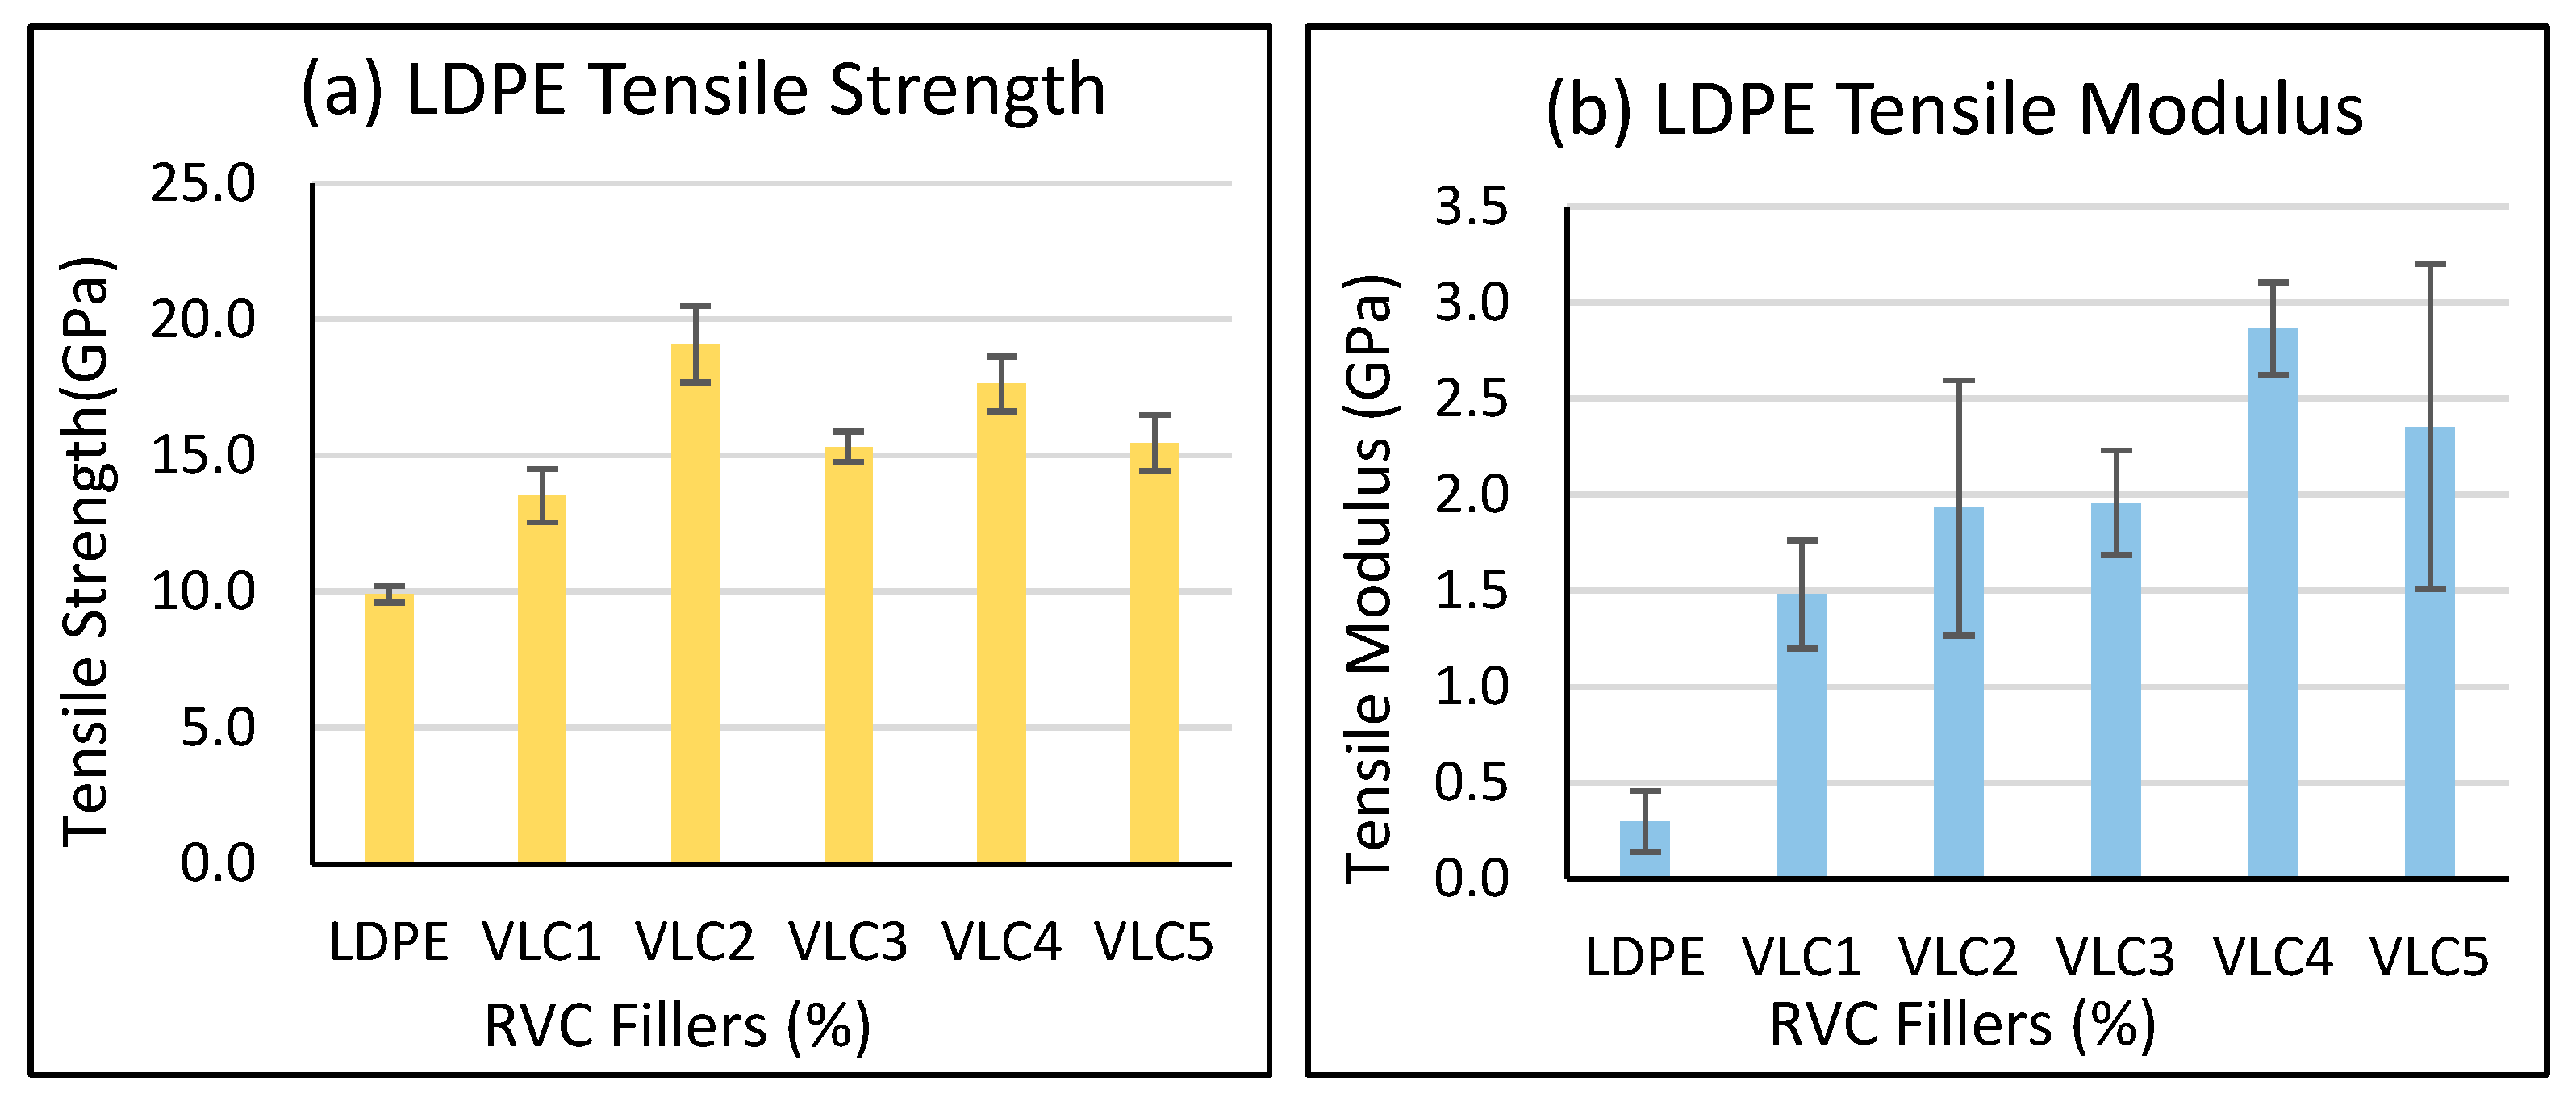
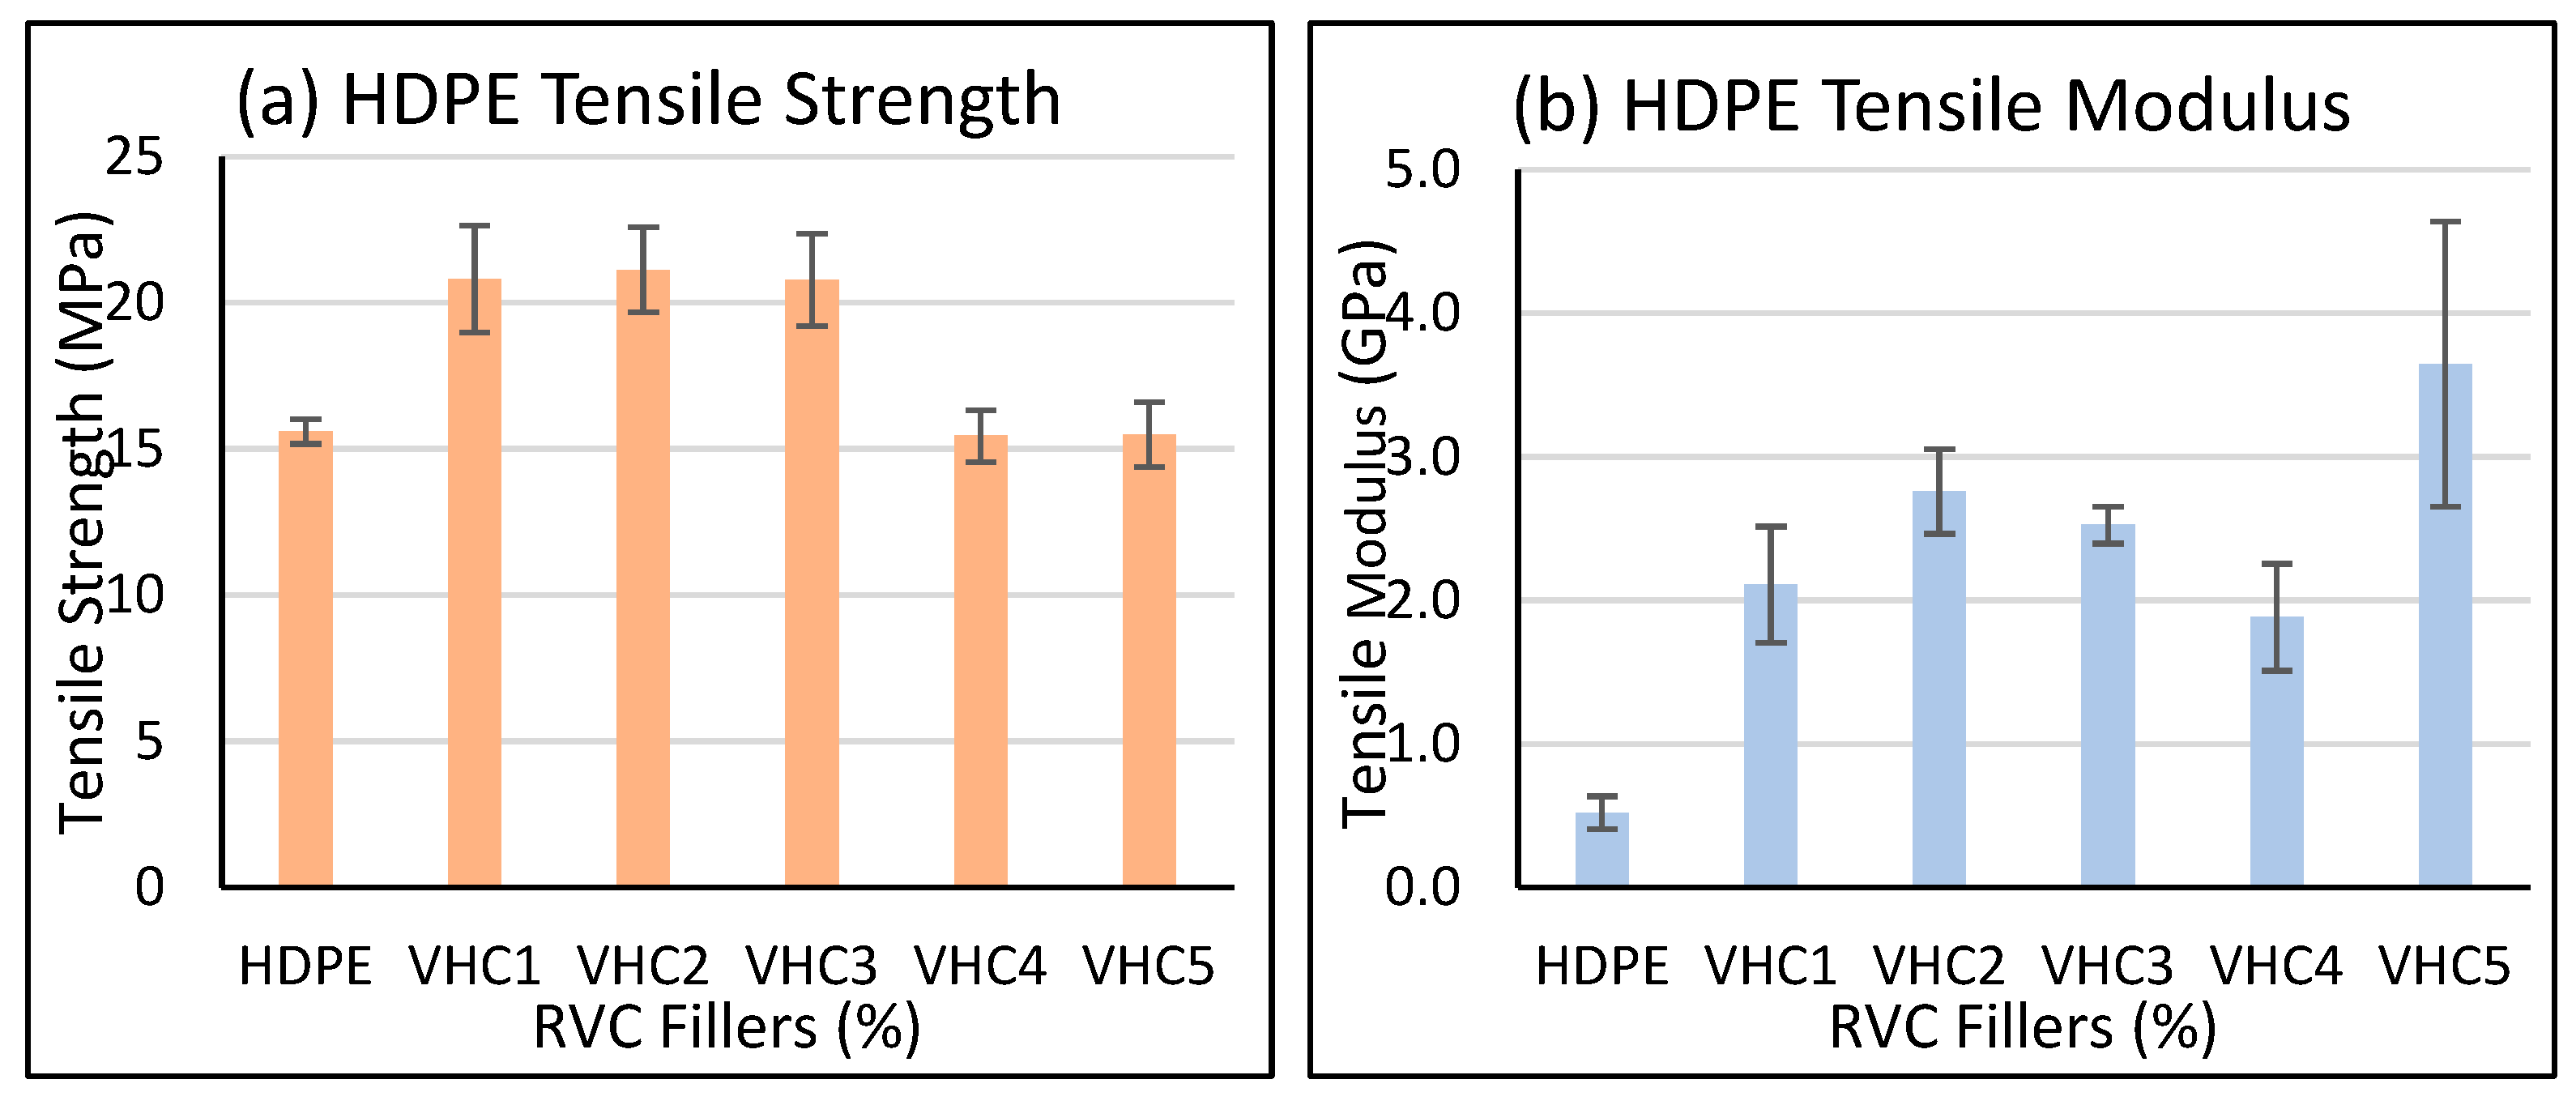
Figure 16 presents the tensile strength and modulus values of LDPE-based composites reinforced with recycled glass fiber–vinyl ester composite (RVC) fillers at varying contents (10–50 wt.%). Each composition was tested in five replicates, and the corresponding average and standard deviation values were calculated. The highest tensile strength was observed at 20 wt.% filler content (19.1 MPa, SD: 1.41), indicating optimal interfacial bonding and stress transfer efficiency at this level. Compared to neat LDPE (9.9 MPa, SD: 0.31), a significant improvement was achieved. However, beyond 20 wt.%, the strength values declined or fluctuated, suggesting that excessive filler may lead to poor dispersion and reduced matrix continuity.
Tensile modulus values generally increased with filler content, reaching a maximum at 40 wt.% (2.86 GPa, SD: 0.24), reflecting the stiffening effect of the glass fibers. At 50 wt.%, the modulus decreased (2.35 GPa) and showed the highest standard deviation (SD: 0.85 GPa), indicating pronounced structural irregularities and non-uniform filler dispersion likely introduced during processing. In summary, the 20–40 wt.% range provided the most favorable mechanical performance in terms of both strength and stiffness. Filler contents beyond this range resulted in diminished mechanical benefits and increased variability.
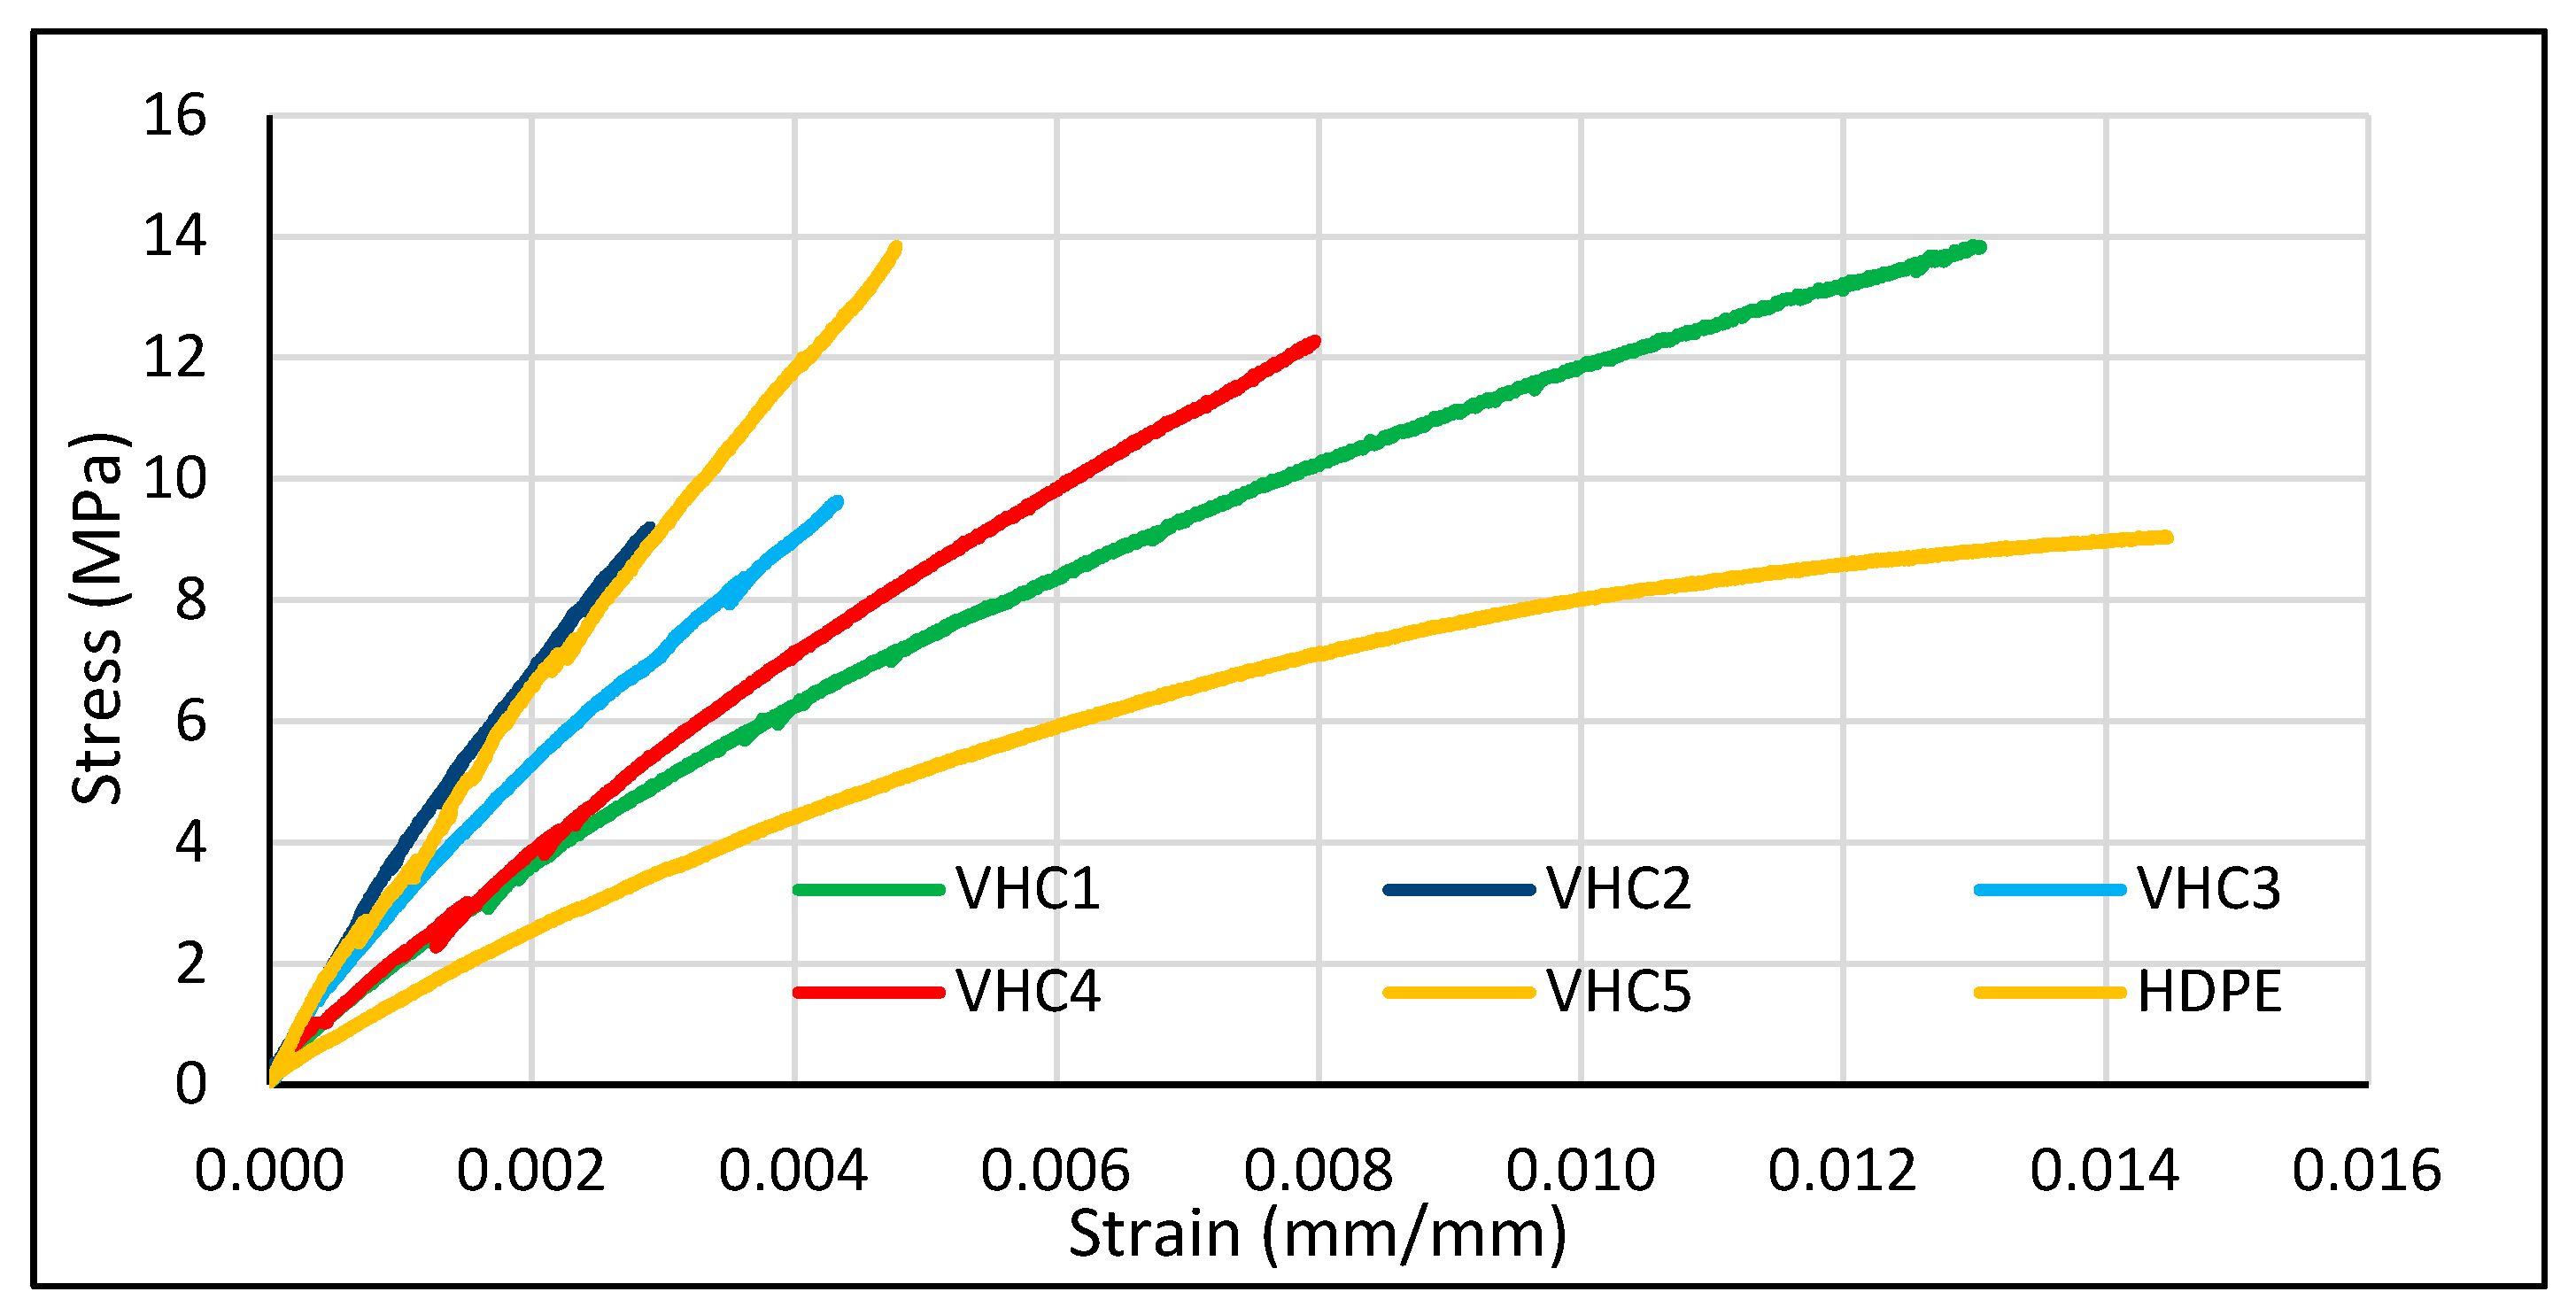
Figure 17 Stress–strain curves of HDPE-based composites reinforced with RVC (VHC1-VHC5) at varying filler loadings are presented. All samples exhibit the characteristic non-linear elastic–plastic deformation behavior of semi-crystalline HDPE matrices. VHC1, VHC2, and VHC3 show pronounced elastic regions followed by extended plastic deformation zones, indicating ductile behavior and high strain accommodation under tensile loading. VHC2, in particular, demonstrates optimal mechanical performance with the highest average tensile strength (21.1 MPa) and a broad strain profile, suggesting efficient stress transfer and strong interfacial bonding [100]. In contrast, VHC4 and VHC5 display shortened elastic regions followed by abrupt yielding and fracture, indicative of brittle behavior and reduced deformation capacity. The narrow and low-sloped curves of these samples reflect compromised matrix continuity and poor filler–matrix interaction at higher filler contents [48]. Average tensile strengths for VHC4 and VHC5 are significantly lower (15.4 MPa and 15.5 MPa, respectively), confirming the negative impact of excessive filler loading [101]. These mechanical trends are supported by SEM micrographs, which reveal distinct microstructural differences. VHC1–VHC3 samples exhibit well-dispersed fibers with adequate wetting and interfacial adhesion, while VHC4 and VHC5 show fiber agglomeration, interfacial gaps, and micro voids. Fractured fiber ends and poor matrix infiltration observed in high-filler samples correlate with the reduced tensile strength and limited strain capacity [102].
In conclusion, both stress and strain behaviors highlight the critical role of filler content in determining composite performance. Filler loadings in the range of 20–30 wt.% yield the most balanced mechanical response, combining strength and ductility. Microstructural homogeneity and interfacial integrity emerge as key factors governing the mechanical efficiency of the composite system [103].
Figure 18 presents the tensile strength and modulus values of HDPE-based composites reinforced with recycled glass fiber–vinyl ester composite (RVC) fillers at varying contents (10–50 wt.%). Each composition was tested in five replicates, and the corresponding average and standard deviation values were calculated. In addition to tensile strength, the mechanical behavior of HDPE composites reinforced with RVC fillers was evaluated in terms of statistical consistency and stiffness response. The standard deviation values for tensile strength remained relatively low across all formulations (ranging from ±0.89 to ±1.82 MPa), indicating a stable and reproducible mechanical response. This suggests that the processing conditions and filler incorporation were sufficiently controlled, even at higher filler loadings. Notably, the composite containing 30 wt.% filler demonstrated a balanced performance, with a tensile strength deviation of ±1.58 MPa and a modulus deviation of only ±0.13 GPa, reflecting effective filler dispersion and structural uniformity.
The tensile modulus values showed a clear upward trend with increasing filler content, confirming the reinforcing effect of recycled glass fibers. The composite with 50 wt.% filler achieved the highest average modulus of 3.65 GPa, representing a significant increase compared to the 10 wt.% group (2.11 GPa). This enhancement is attributed to the rigid nature of the glass fibers, which restrict polymer chain mobility and improve load transfer under elastic deformation. However, the elevated standard deviation observed in the 50 wt.% group (±0.99 GPa) may indicate heterogeneity in fiber distribution or localized stress concentrations, potentially compromising structural consistency. These findings highlight the trade-off between stiffness enhancement and microstructural homogeneity at higher filler levels. While increased fillers content contributes to improved elastic modulus, it may also introduce variability that affects long-term performance reliability. Therefore, filler optimization should be guided not only by average mechanical properties but also by statistical dispersion and morphological integrity. The load-bearing capacity of composite materials depends not only on fiber orientation but also on the quality of adhesion between fiber bundles and the matrix. In regions where fibers do not bond well with the matrix, weak interfacial connections may form, leading to localized stress concentrations and early deformation under load. Limited contact between fiber bundles and the matrix can alter the stress path, causing local shape distortions. Minor surface damage on the fibers can initiate microcracks, which promote fiber movement and interfacial debonding during mechanical loading. This process negatively affects the overall mechanical performance of the composite. In contrast, strong interfacial bonding, along with uniform fiber distribution and structural integrity, plays a key role in enhancing mechanical strength. This relationship is consistent with SEM observations and tensile test results, where performance degradation is more evident in samples with poor fiber dispersion and insufficient matrix interaction.
Statistical reliability of the tensile data was assessed using pairwise Student’s t-tests (two-tailed, p < 0.05) between consecutive filler-loading groups for both LDPE- and HDPE-based composites. Based on five replicate specimens per composition, the analysis revealed that all LDPE-based samples (VLC1–VLC5) exhibited statistically significant differences between successive loadings (p < 0.01). In contrast, within the HDPE series, only the transition from 30 wt.% (VHC3) to 40 wt.% (VHC4) showed a significant difference (p = 0.0005). These findings confirm the composition-dependent variability in tensile performance and underscore the influence of filler dispersion on data reproducibility.

3.5.2. Flexural Properties of VPCs

This section provides a detailed analysis of the flexural strength and modulus results, aiming to evaluate the mechanical performance of the composite systems described earlier.
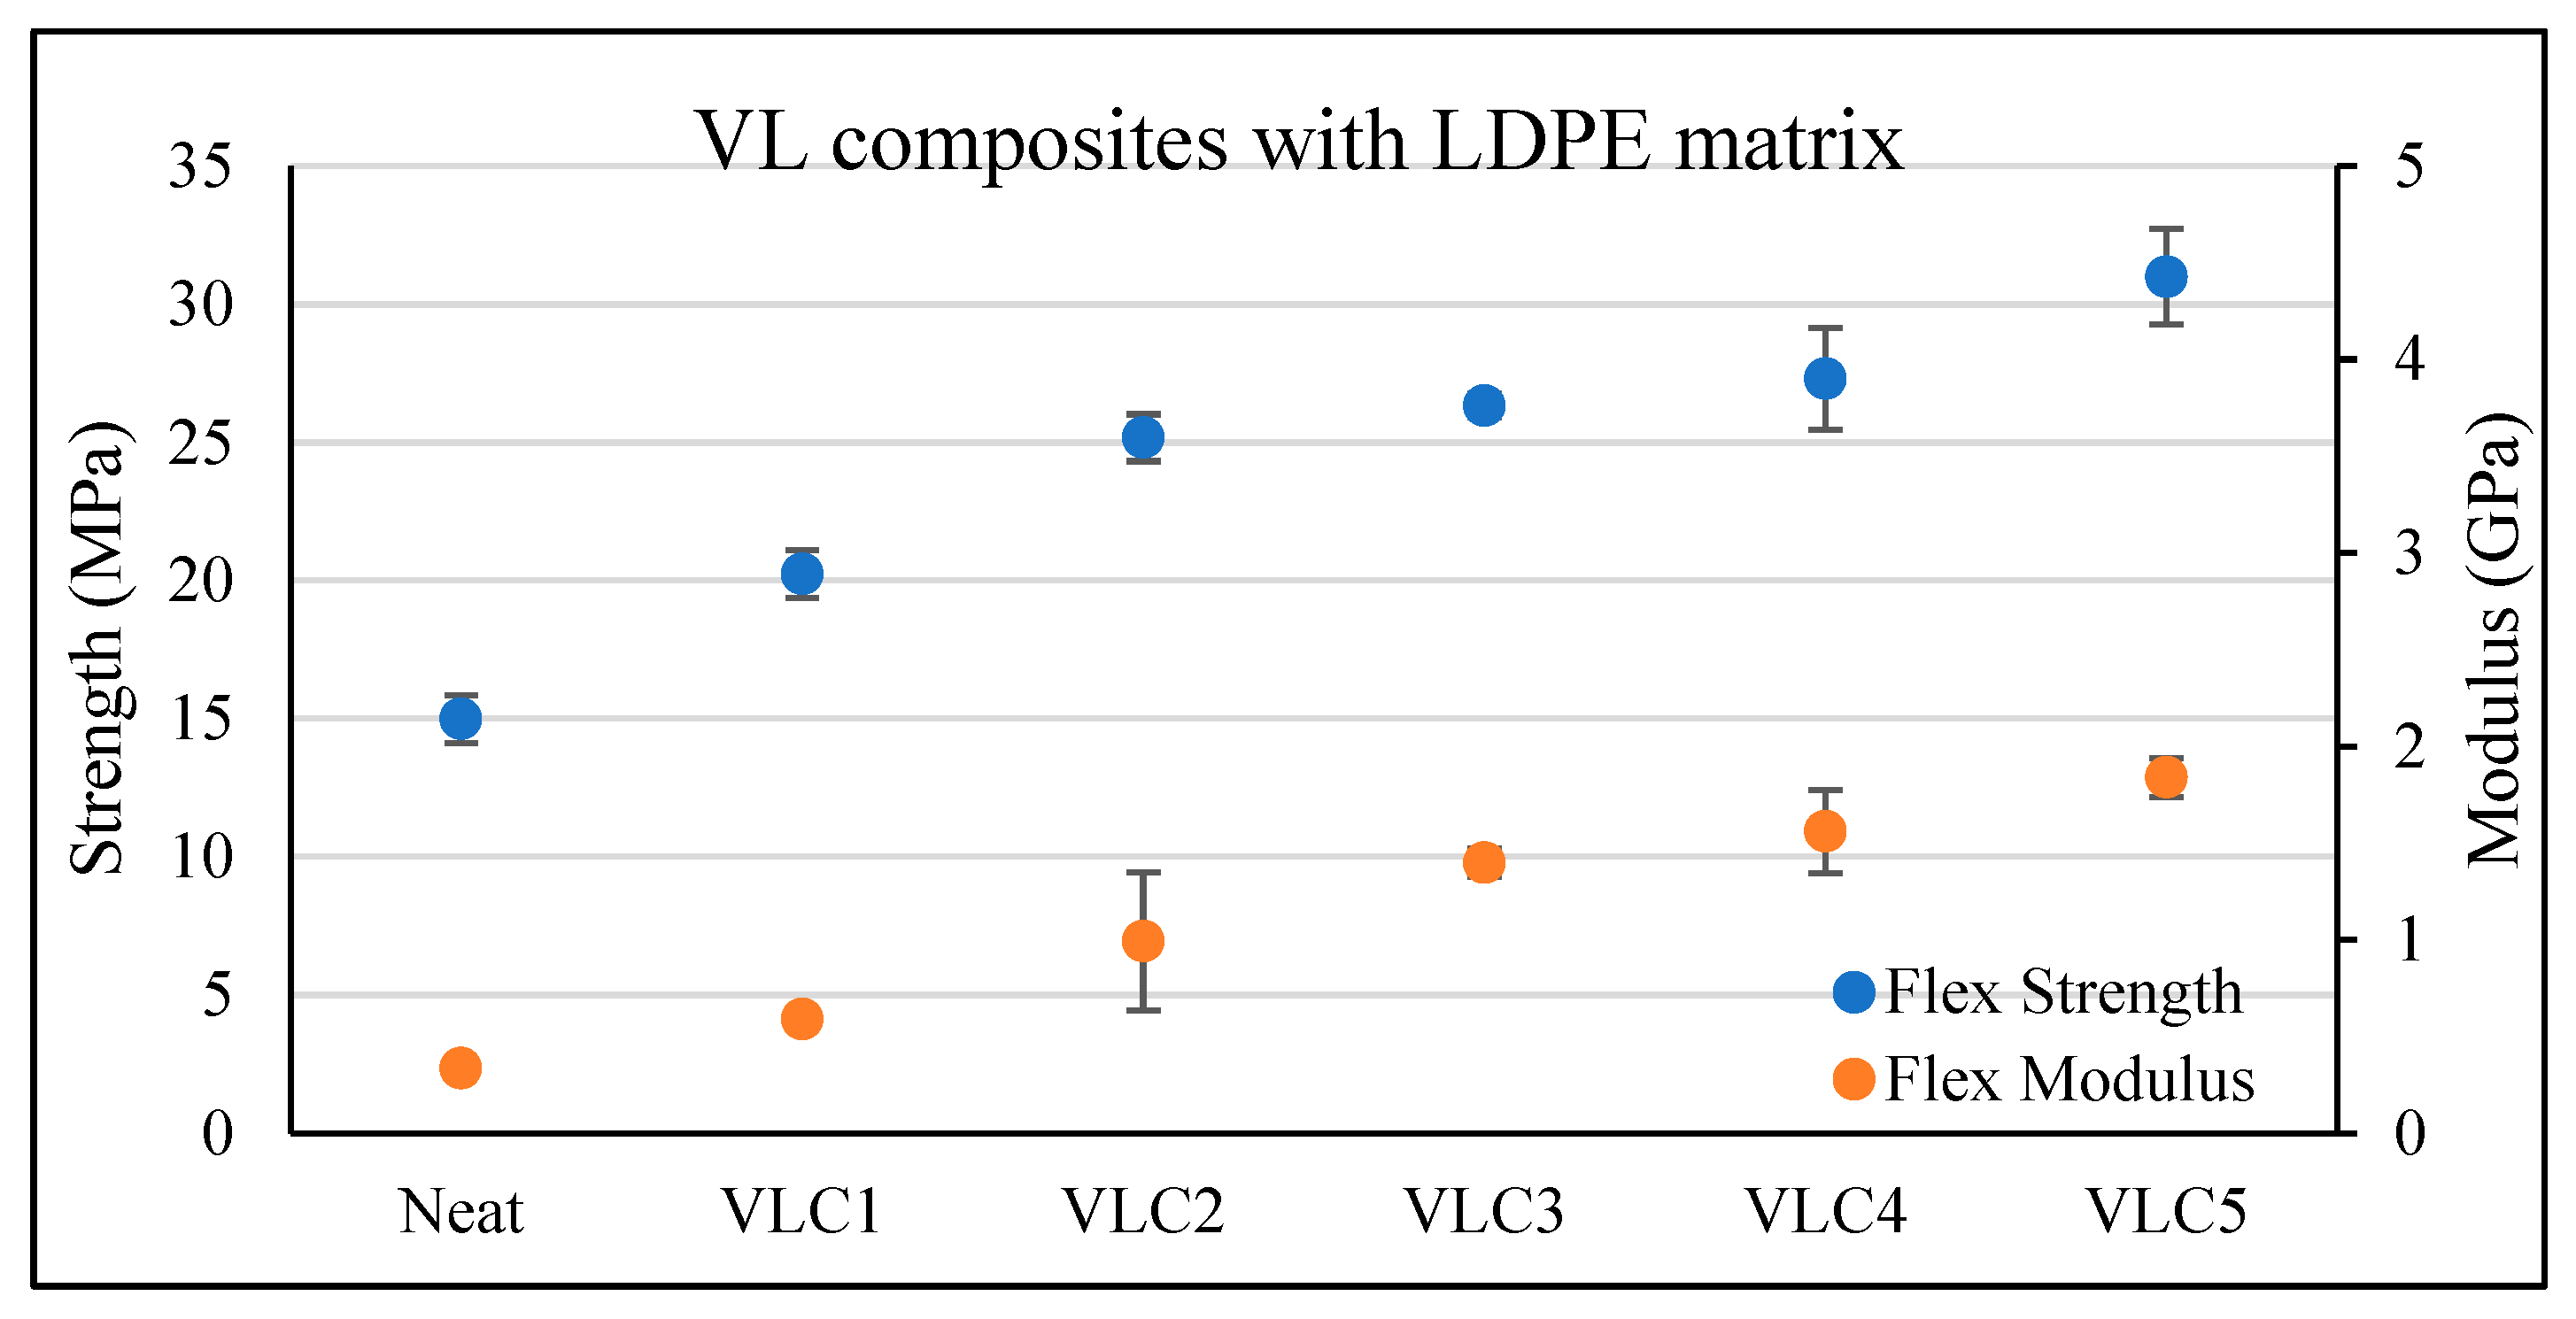
Figure 19 presents the flexural strength and modulus results of LDPE-based composites reinforced with varying amounts RVC fillers, revealing a significant enhancement in mechanical performance with increasing filler content. The neat LDPE sample exhibited a flexural strength of approximately 15.0 ± 0.9 MPa and a flexural modulus of 0.335 ± 0.025 GPa, while the VLC5 sample containing 50% filler reached 31.0 ± 1.7 MPa and 1.84 ± 0.1009 GPa, respectively. Notably, the VLC3 sample with 30% filler demonstrated an optimal balance, achieving 26.3 ± 0.4 MPa in strength and 1.3989 ± 0.0728 GPa in modulus, along with the lowest standard deviation values among all reinforced groups. These low deviations indicate high measurement consistency and suggest a homogeneous dispersion of filler within the matrix. In contrast, the higher standard deviations observed in VLC4 and VLC5 (±1.8 MPa, ±1.7 MPa for flexural strength and ±0.2146 GPa, ±0.1009 GPa for flexural modulus) may be attributed to filler agglomeration, interfacial incompatibility, or microstructural irregularities at elevated filler loadings [104]. This variability may reduce mechanical reliability and must be addressed during scale-up. Overall, the results confirm that recycled thermoset-based fillers significantly improve the flexural strength and stiffness of LDPE composites, offering promising potential for sustainable composite manufacturing and circular economy applications [105,106].
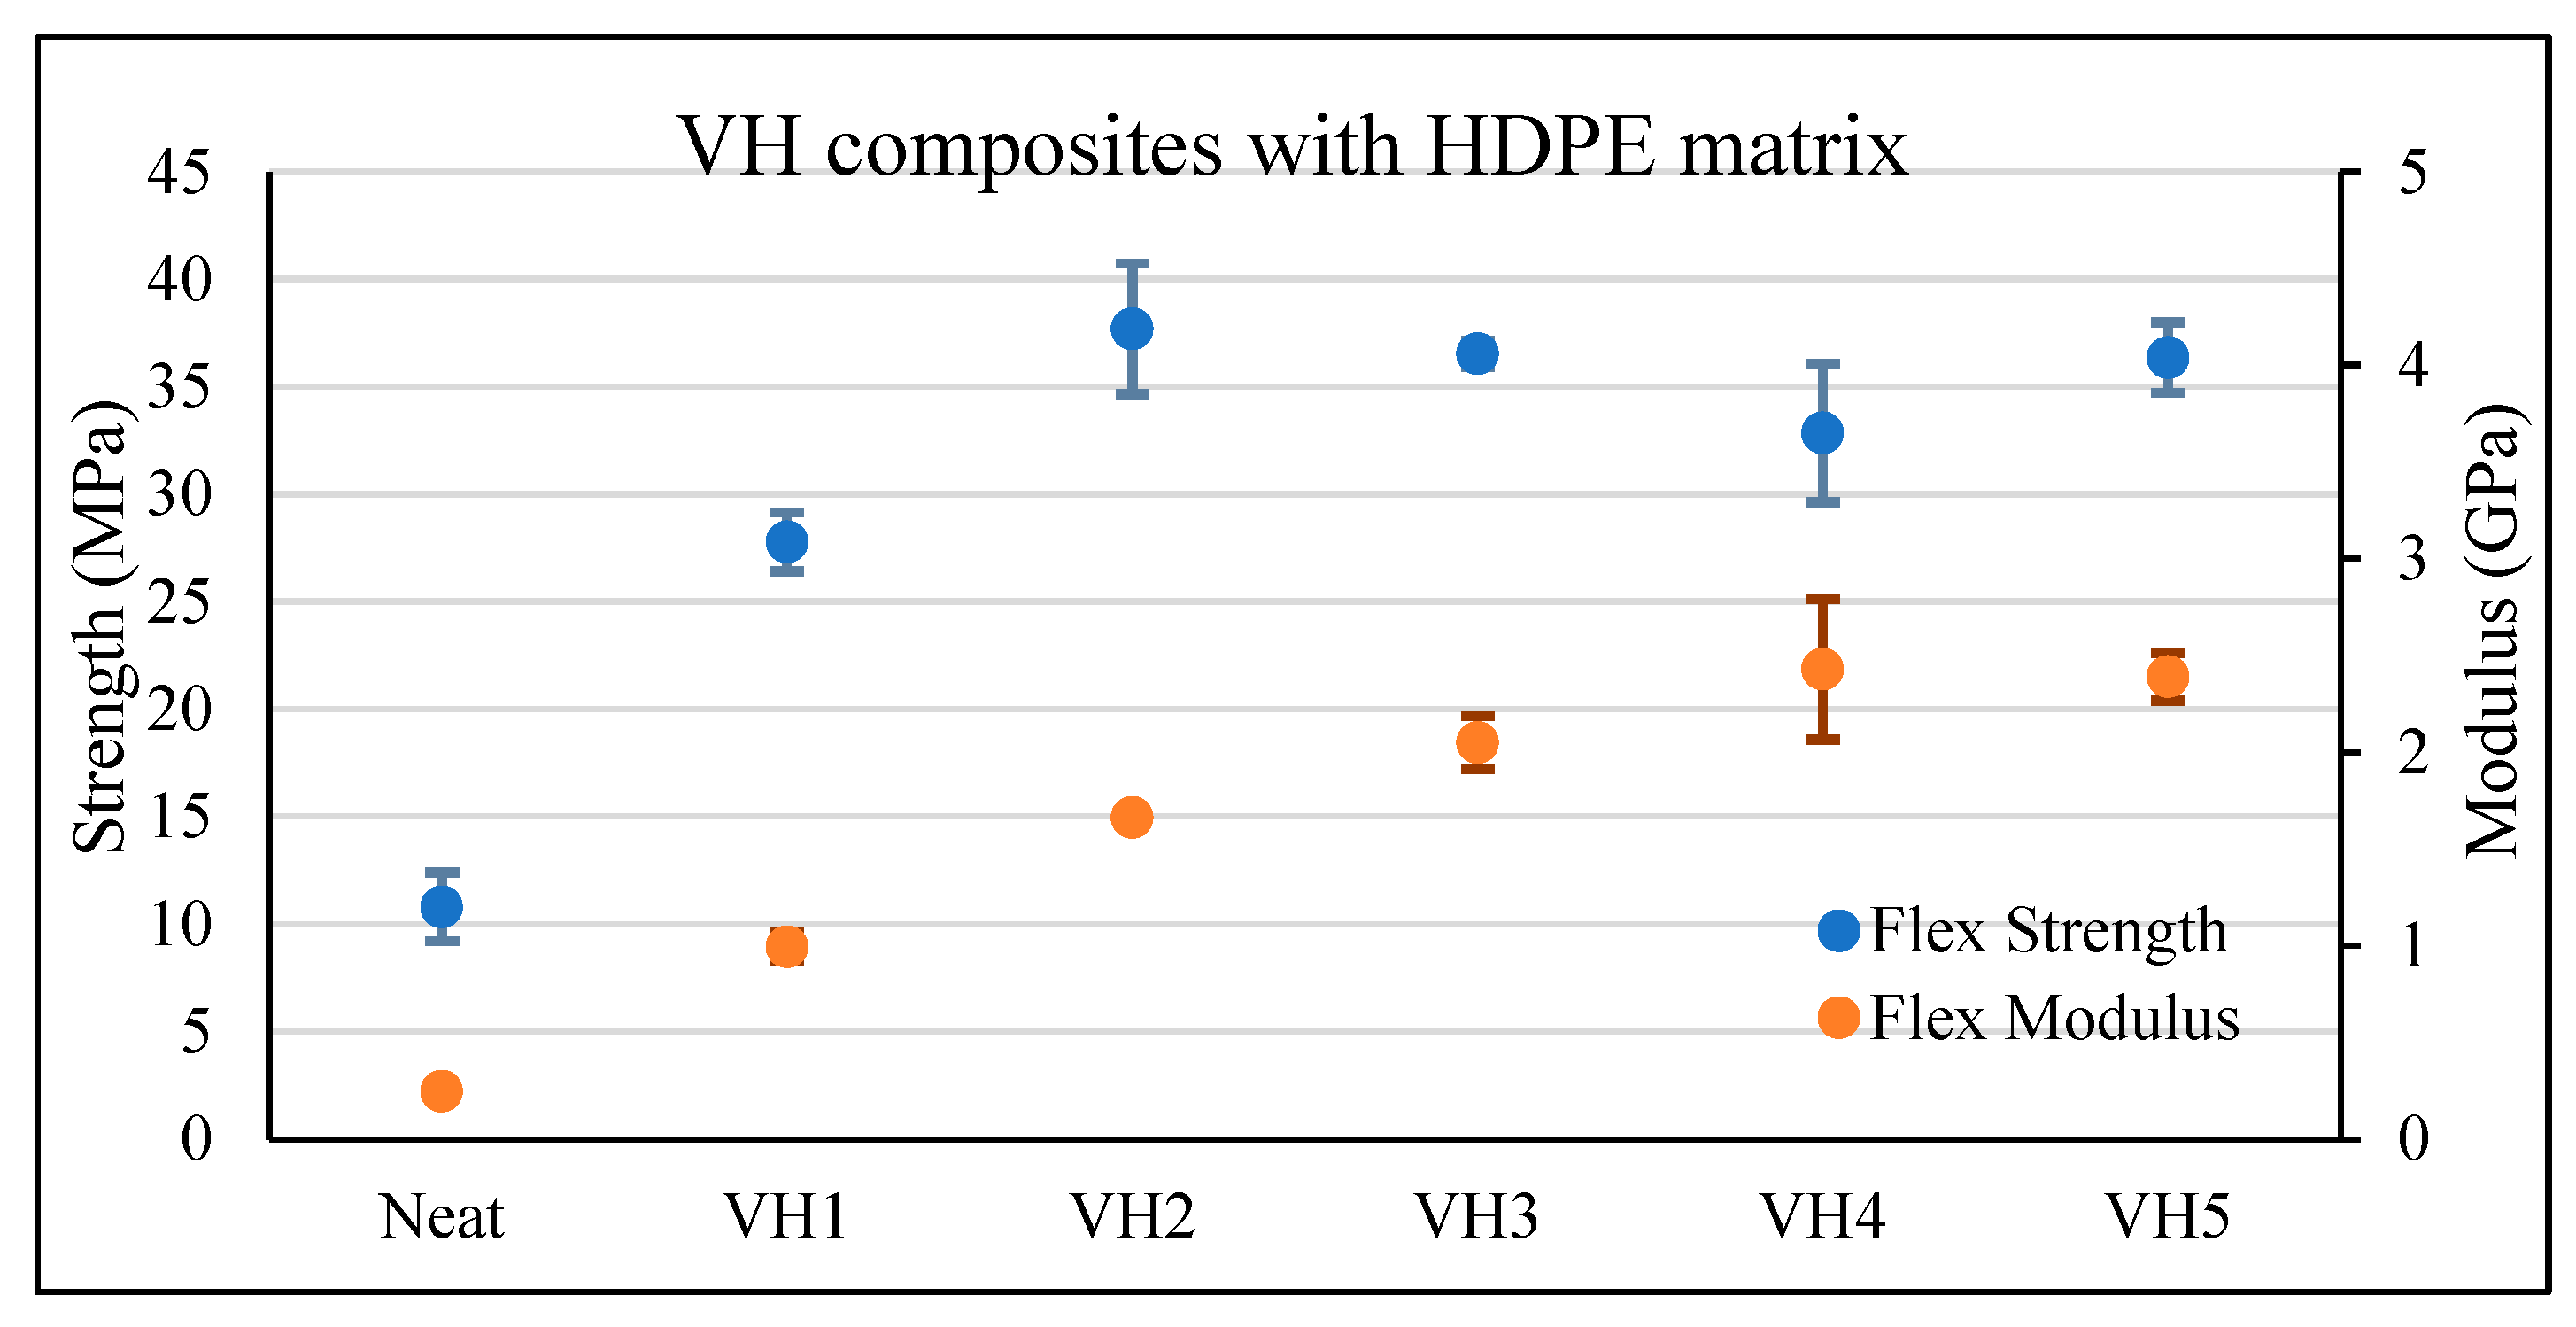
Figure 20 illustrates the flexural strength and modulus values of HDPE-based composites reinforced with varying proportions of RVC fillers. As the filler content increased from 0% (neat HDPE) to 50% (VHC5), a pronounced enhancement in mechanical performance was observed, particularly in flexural modulus.
The neat HDPE sample provided baseline reference values, with a flexural strength of 10.8 ± 1.6 MPa and a flexural modulus of 0.246 ± 0.025 GPa. Increasing the filler content led to significant improvements in mechanical properties. The VHC2 sample (20 wt.%) achieved the highest flexural strength of 37.7 ± 3.0 MPa, representing an approximate 250% increase compared to neat HDPE. Its flexural modulus was measured at 1.6616 ± 0.0436 GPa, indicating a marked improvement in stiffness. The VH3 sample (30 wt.%) exhibited a flexural strength of 36.5 ± 0.6 MPa and a modulus of 2.0479 ± 0.1376 GPa, combining high strength with low standard deviation. This low variation suggests homogeneous filler dispersion within the matrix and consistent structural integrity.
Conversely, samples with higher filler contents—VHC4 (40 wt.%) and VHC5 (50 wt.%)—showed increased standard deviations (±3.2 MPa, ±1.6 MPa for strength; ±0.3628 GPa, ±0.1228 GPa for modulus), which may be attributed to filler agglomeration, interfacial incompatibility, or microstructural irregularities. Such heterogeneities can adversely affect mechanical reliability and should be carefully addressed in industrial-scale production processes. The overall findings reveal that recycled vinyl ester-glass fiber thermoset waste can be effectively utilized as a reinforcing agent in HDPE matrices, yielding composites with enhanced mechanical properties. Notably, the VHC2 and VHC3 formulations demonstrated optimal performance and structural consistency, highlighting the potential of this recycled filler for sustainable composite manufacturing and its relevance to circular economy initiatives [107].

3.5.3. Izod Impact Properties of the VPCs

The results of Izod impact tests performed on VPCs are presented in Table 5. The Izod impact energy results of PE-based composites reinforced with varying RVC filler contents reveal a pronounced effect of matrix type and filler loading on fracture resistance. The specimens are categorized into two series: VLC (LDPE-based) and VHC (HDPE-based), each comprising five formulations with incrementally increased filler content.
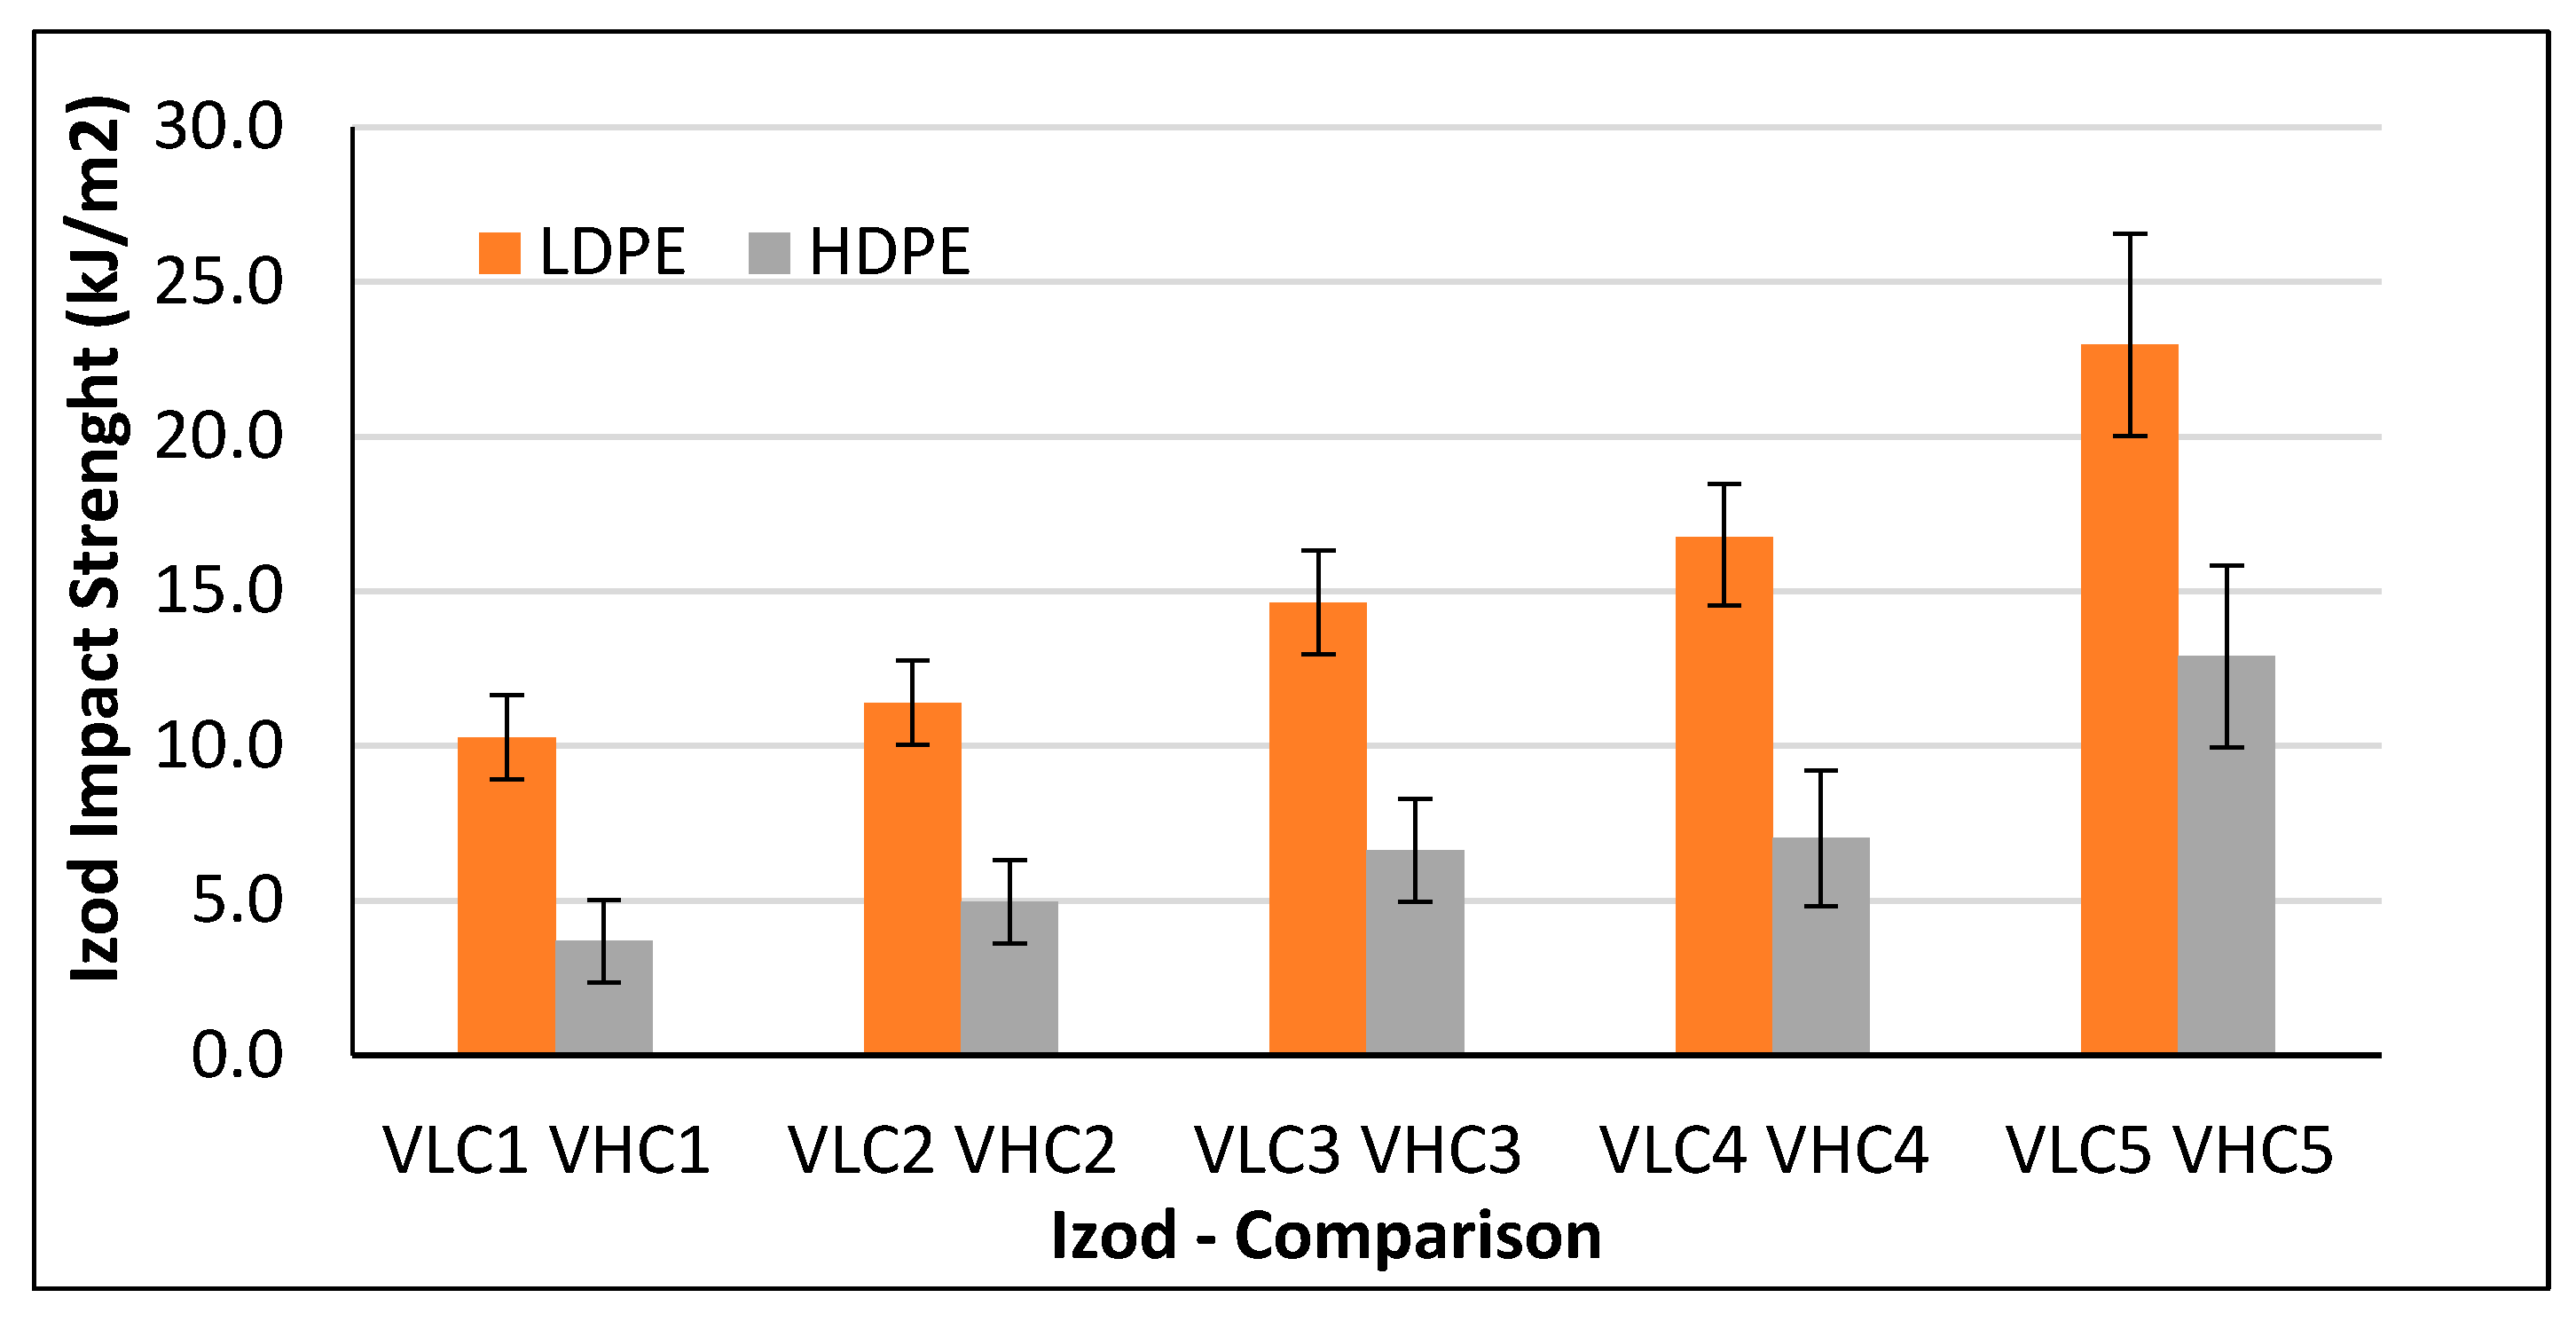
The VLC series, formulated with LDPE matrix, exhibits a progressive and well-defined enhancement in impact behavior as the proportion of recycled thermoset filler increases. Specifically, the break energy values improve from 0.49 J (VLC1) to 1.03 J (VLC5), while the corresponding Izod impact strength rises from 10.27 to 22.97 kJ/m2. This improvement is attributed to the intrinsic ductility of LDPE, which promotes efficient stress redistribution and facilitates the integration of rigid thermoset-based fragments within the polymer matrix, thereby improving fracture energy absorption [108]. The consistently low standard deviation values across the VLC samples further confirm the reproducibility of the measurements and the structural uniformity of the composite formulations.
Conversely, the VHC series, based on HDPE matrix, demonstrates comparatively lower impact resistance and a less coherent trend. Although break energy increases from 0.19 J (VHC1) to 0.48 J (VHC5), and Izod impact strength from 3.69 to 12.90 kJ/m2, the intermediate compositions (VHC2–VHC4) reveal non-monotonic variations. These inconsistencies are likely associated with the higher crystallinity and restricted chain mobility of HDPE, which may impede effective interfacial bonding with the thermoset filler and limit the activation of energy dissipation mechanisms during impact loading [109]. As a result, greater variability in fracture response is observed across the HDPE-based composites.
Figure 21 shows a gradual improvement in impact performance across the LDPE-based VLC series as filler content increases. This behavior is attributed to LDPE’s amorphous structure and high chain mobility, which facilitates the homogeneous distribution of thermoset glass fiber particles within the matrix. As a result, stress is distributed over a larger volume during impact loading, delaying crack initiation and increasing fracture energy absorption. In contrast, the HDPE-based VHC series exhibited limited and irregular changes in impact strength despite increasing filler content. HDPE’s crystalline structure and limited chain mobility weaken filler-matrix interface interactions, leading to localized stress concentrations and accelerated crack propagation. The fluctuating performance observed in samples VHC2–VHC4 can be attributed to inhomogeneous filler distribution and the inherently brittle nature of the HDPE matrix. Increasing the filler content from 10% to 50% resulted in a statistically significant improvement in the Izod impact strength of the composites. A comparative evaluation of the VLC and VHC series shows clear differences in impact performance with increasing filler content. The LDPE-based VLC series exhibited a steady improvement in Izod impact strength, with an overall increase of about 124%. In the HDPE-based VHC series, the increase was more pronounced—nearly 250%—but less consistent, especially in the intermediate samples (VHC2–VHC4). This irregularity likely stems from poor filler dispersion and weak interfacial bonding in the more crystalline HDPE matrix.
Comparable trends have been observed in recent studies on recycled thermoset and glass-filled polyolefin composites. For example, Austermann et al. [62] reported a 20–25% increase in flexural strength for recycled vinyl-ester SMC fillers, accompanied by a noticeable reduction in ductility. In contrast, the present LDPE-based VPC systems achieved a comparable stiffness gain (~28%) while maintaining higher strain tolerance. Similarly, Periasamy et al. [107] observed that thermoset–HDPE blends exhibited limited toughness recovery due to poor filler wetting and interfacial bonding, whereas in this study, improved dispersion and acid-conditioned RVC fillers enabled more effective stress transfer. These comparisons highlight that the developed VPCs combine the stiffness benefit of thermoset fillers with better ductility retention than similar recycled systems reported in the literature.
The observed enhancement in impact strength can be attributed to synergistic toughening mechanisms activated within polyethylene matrices by thermosetting fillers [110]. Under impact loading, rigid vinyl-ester–glass fragments serve as local stress concentrators, initiating matrix shear yielding and micro-cavitation in their vicinity [111,112]. In LDPE-based composites, the greater chain mobility and presence of amorphous regions facilitate plastic deformation and fibrillation around embedded fillers, enabling effective energy dissipation. In contrast, HDPE-based systems primarily rely on crack deflection and fiber-bridging mechanisms, as their higher crystallinity limits large-scale plastic flow. Additionally, partially debonded thermoset particles promote crack pinning and pull-out effects, contributing to further fracture-energy absorption. Collectively, these mechanisms account for the composition-dependent improvement in impact performance observed in both LDPE and HDPE matrices. Compatibilizers were intentionally excluded from the present study to evaluate the intrinsic reinforcement capability of mechanically recycled thermoset scraps.

4. Conclusions

This study presents a comprehensive investigation into the mechanical recycling and reuse of vinyl ester-based glass fiber reinforced scraps as functional fillers in polyethylene (PE) thermoplastic matrices. Through multi-scale characterization and mechanical performance evaluation, the following principal outcomes were identified:
-
Vinyl ester-based pultruded profiles were mechanically processed into heterogeneous filler fractions comprising fiber bundles, microfibers, and resin residues. The sieving and burn-off analyses revealed that coarse fiber clusters retained high shape factors and glass fiber content (>85%), making them suitable for structural reinforcement, while finer fractions exhibited diminished fiber integrity and were more appropriate for volumetric or rheological modification.
-
LDPE and HDPE matrices were compounded with varying filler loadings (10–50 wt.%) using a single-screw extrusion process. Optical and SEM analyses confirmed that filler dispersion was more uniform in LDPE-based composites due to its amorphous nature and higher chain mobility, while HDPE’s crystalline structure led to localized agglomeration and reduced wetting at high loadings.
-
Density increased proportionally with filler content, while water absorption remained below 0.25% after 60 days, confirming satisfactory hygrothermal stability.
-
Tensile and flexural tests showed that the 20–30 wt.% filler range provided the most balanced performance: tensile modulus improved up to ≈300%, flexural strength doubled, and impact energy absorption increased by 124% in LDPE and ≈250% in HDPE systems.
-
Izod impact tests revealed a steady and reproducible improvement in fracture energy absorption in the LDPE-based VLC series, with an overall increase of ~124% from VLC1 to VLC5. The HDPE-based VH series showed a more pronounced (~250%) but less consistent enhancement, with irregularities in intermediate compositions (VHC2–VHC4) attributed to inadequate filler dispersion and weak interfacial bonding.
-
These improvements originate from combined toughening mechanisms—matrix shear yielding, crack deflection, and partial fiber pull-out—activated by the rigid thermoset fragments within the polyolefin matrices.
The integration of recycled thermoset scraps (vinyl ester-based glass fiber) into thermoplastic matrices demonstrates strong potential for sustainable composite development. LDPE-based systems offer superior filler compatibility and mechanical uniformity, while HDPE-based systems provide higher stiffness but require optimized processing to mitigate dispersion challenges. These findings confirm that thermoset composite waste can be effectively upcycled into high-performance materials, supporting circular economy goals.
From both scientific and industrial perspectives, the proposed recycling method exhibits promising scalability. It relies solely on mechanical fragmentation and melt compounding—both compatible with standard thermoplastic processing lines—making it readily transferable to existing extrusion and compression molding operations. This approach eliminates the need for chemical reagents or compatibilizers, ensuring a straightforward and environmentally friendly process. Such scalability is particularly relevant for manufacturers handling large volumes of thermoset scrap from pultrusion or molding lines. Future studies will include moisture and thermal ageing experiments, fatigue testing, and subsequent mechanical evaluations to assess the long-term durability and service-life potential of VPCs. In parallel, a detailed life-cycle assessment comparing mechanical recycling with thermal and chemical routes will be conducted to quantify the environmental advantages of this approach.
The resulting recycled composite granulates can be directly utilized in secondary automotive, construction, and marine components—such as panels, housings, and structural inserts—offering tangible reductions in raw material costs and landfill waste. This establishes a direct and replicable pathway for thermoset composite valorization and closed-loop composite manufacturing, contributing meaningfully to industrial sustainability and resource efficiency.

Author Contributions

Conceptualization, H.K. and M.M.; methodology, H.K., M.M., S.P. and H.N.; validation, H.K., M.M., S.P. and H.N.; formal analysis, H.K., M.M., S.P. and H.N.; investigation, H.K.; resources, S.P. and H.N.; data curation, H.K. and M.M.; writing—original draft preparation, H.K.; writing—review and editing, H.K., M.M., S.P. and H.N.; visualization, H.K. and M.M.; supervision, S.P. and H.N.; project administration, H.K., S.P. and H.N.; funding acquisition, S.P. All authors have read and agreed to the published version of the manuscript.

Funding

This research received no external funding.

Data Availability Statement

The original contributions presented in this study are included in the article. Further inquiries can be directed to the corresponding author.

Acknowledgments

The authors gratefully thank the Scientific and Technological Re-search Council of Türkiye (Tubitak) for the support provided throughthe 2219-International Postdoctoral Research Fellowship Programme. Baris Engin is gratefully acknowledged for his valuable support andcontributions to the thermal and physical testing. Yongzhe Yan is gratefully acknowledged for his help with and support of the SEM analysis.

Conflicts of Interest

The authors declare no conflicts of interest.

Abbreviations

CFRPCarbon Fiber-Reinforced Polymer Composites
FLFiber Length
HDPEHigh-Density Polyethylene
LDPELow-Density Polyethylene
MPADMaterials Processing and Applications Development
PEPolyethylene
RVCRecycled Vinyl Ester Based Composite
VEVinyl Ester
VHCThermoset-filled HDPE Composites
VLCThermoset-filled LDPE Composites
VPCThermoset-filled PE Composites
SEMScanning Electron Microscopy

References

  1. Mallick, P.K. Thermoplastics and thermoplastic–matrix composites for lightweight automotive structures. In Materials, Design and Manufacturing for Lightweight Vehicles, 2nd ed.; Elsevier: Amsterdam, The Netherlands, 2020; pp. 187–228. [Google Scholar] [CrossRef]
  2. Thomason, J.; Xypolias, G. Hydrothermal Ageing of Glass Fibre Reinforced Vinyl Ester Composites: A Review. Polymers 2023, 15, 835. [Google Scholar] [CrossRef]
  3. Elen, M.; Kumar, V.; Fifield, L.S. Feasibility of Recovering and Recycling Polymer Composites from End-of-Life Marine Renewable Energy Structures: A Review. Sustainability 2024, 16, 10515. [Google Scholar] [CrossRef]
  4. Chen, H.; Qin, R.; Chow, C.L.; Lau, D. Recycling Thermoset Plastic Waste for Manufacturing Green Cement Mortar. Cem. Concr. Compos. 2023, 137, 104922. [Google Scholar] [CrossRef]
  5. Barnett, P.R.; Brackenridge, J.A.; Advincula, A.A.; Taussig, L.A.; Nepal, D. Reformable and Sustainable Thermosetting Carbon Fiber Composites from Epoxy Vitrimer. Compos. Part B Eng. 2024, 274, 111270. [Google Scholar] [CrossRef]
  6. Yildirir, E.; Miskolczi, N.; Onwudili, J.A.; Németh, K.E.; Williams, P.T.; Sója, J. Evaluating the Mechanical Properties of Reinforced LDPE Composites Made with Carbon Fibres Recovered via Solvothermal Processing. Compos. Part B Eng. 2015, 78, 393–400. [Google Scholar] [CrossRef]
  7. Bream, C.E.; Hornsby, P.R. Comminuted Thermoset Recyclate as a Reinforcing Filler for Thermoplastics: Part I Characterization of Recyclate Feedstocks. J. Mater. Sci. 2001, 36, 2965–2975. [Google Scholar] [CrossRef]
  8. Tapper, R.J.; Longana, M.L.; Yu, H.; Hamerton, I.; Potter, K.D. Development of a Closed-Loop Recycling Process for Discontinuous Carbon Fibre Polypropylene Composites. Compos. Part B Eng. 2018, 146, 222–231. [Google Scholar] [CrossRef]
  9. La Rosa, A.D.; Banatao, D.R.; Pastine, S.J.; Latteri, A.; Cicala, G. Recycling Treatment of Carbon Fibre/Epoxy Composites: Materials Recovery and Characterization and Environmental Impacts through Life Cycle Assessment. Compos. Part B Eng. 2016, 104, 17–25. [Google Scholar] [CrossRef]
  10. AlMaadeed, M.A.; Ouederni, M.; Noorunnisa Khanam, P. Effect of Chain Structure on the Properties of Glass Fibre/Polyethylene Composites. Mater. Des. 2013, 47, 725–730. [Google Scholar] [CrossRef]
  11. Ares-Elejoste, P.; Seoane-Rivero, R.; Gandarias, I.; Iturmendi, A.; Gondra, K. Sustainable Alternatives for the Development of Thermoset Composites with Low Environmental Impact. Polymers 2023, 15, 2939. [Google Scholar] [CrossRef] [PubMed]
  12. Fu, S.Y.; Lauke, B. Effects of Fiber Length and Fiber Orientation Distributions on the Tensile Strength of Short-Fiber-Reinforced Polymers. Compos. Sci. Technol. 1996, 56, 1179–1190. [Google Scholar] [CrossRef]
  13. Akil, H.M.; Cheng, L.W.; Affzan, M.H.; Bakar, A.A.; Ishak, Z.A.M. Water Absorption Study on Pultruded E-Glass Fibre Reinforced Unsaturated Polyester Composites. Adv. Compos. Lett. 2010, 19, 67–73. [Google Scholar] [CrossRef]
  14. Liu, Y.; Yu, Z.; Wang, B.; Li, P.; Zhu, J.; Ma, S. Closed-Loop Chemical Recycling of Thermosetting Polymers and Their Applications: A Review. Green Chem. 2022, 24, 5691–5708. [Google Scholar] [CrossRef]
  15. Podara, C.; Termine, S.; Modestou, M.; Semitekolos, D.; Tsirogiannis, C.; Karamitrou, M.; Trompeta, A.-F.; Milickovic, T.K.; Charitidis, C. Recent Trends of Recycling and Upcycling of Polymers and Composites: A Comprehensive Review. Recycling 2024, 9, 37. [Google Scholar] [CrossRef]
  16. Eselem Bungu, P.S.; Pasch, H. Comprehensive Analysis of Branched Polyethylene: The Multiple Preparative Fractionation Concept. Polym. Chem. 2017, 8, 4565–4575. [Google Scholar] [CrossRef]
  17. Agrawal, P.; Silva, M.H.A.; Cavalcanti, S.N.; Freitas, D.M.G.; Araújo, J.P.; Oliveira, A.D.B.; Mélo, T.J.A. Rheological Properties of High-Density Polyethylene/Linear Low-Density Polyethylene and High-Density Polyethylene/Low-Density Polyethylene Blends. Polym. Bull. 2022, 79, 2321–2343. [Google Scholar] [CrossRef]
  18. Felgel-Farnholz, A.; Schweighuber, A.; Klampfl, C.W.; Fischer, J. Comparative Study on the Degradation of HDPE, LLDPE and LDPE during Multiple Extrusions. Polym. Degrad. Stab. 2023, 216, 110486. [Google Scholar] [CrossRef]
  19. Wang, Y.; Feng, G.; Lin, N.; Lan, H.; Li, Q.; Yao, D.; Tang, J. A Review of Degradation and Life Prediction of Polyethylene. Appl. Sci. 2023, 13, 3045. [Google Scholar] [CrossRef]
  20. Alikhani, H.; Sharifzadeh, F.; Khoramishad, H. Mechanical and Physical Properties of Glass-Fiber Reinforced Polymer Rods Manufactured by Different Pultrusion Methods. Mech. Adv. Compos. Struct. 2021, 8, 99–107. [Google Scholar] [CrossRef]
  21. da Silva, L.V.; de Menezes, E.A.W.; Tarpani, J.R.; Amico, S.C. Accelerated Ageing Effects on Short-Beam Strength Behavior of Pultruded CFRP Rods. Appl. Compos. Mater. 2022, 29, 855–869. [Google Scholar] [CrossRef]
  22. Manca, F.; Giordano, S.; Palla, P.L.; Cleri, F. Stochastic Mechanical Degradation of Multi-Cracked Fiber Bundles with Elastic and Viscous Interactions. Eur. Phys. J. E 2015, 38, 44. [Google Scholar] [CrossRef]
  23. Zhao, Z.; Wu, H.; Zhang, M.; Fu, S.; Zhu, K. Fiber Orientation Reconstruction from SEM Images of Fiber-Reinforced Composites. Appl. Sci. 2023, 13, 3700. [Google Scholar] [CrossRef]
  24. Guay, D.; Sutherland, N.R.; Rantanen, W.; Malandri, N.; Stephens, A.; Mattingly, K.; Schneider, M. Comparison of Fiber Length Analyzers. In Proceedings of the 2005 TAPPI Practical Papermaking Conference, Atlanta, GA, USA, 22–26 May 2005; pp. 413–442. [Google Scholar]
  25. Wang, S.; Yatagawa, T.; Suzuki, H.; Ohtake, Y. Image Based Measurement of Individual Fiber Lengths for Randomly Oriented Short Fiber Composites. J. Nondestruct. Eval. 2022, 41, 45. [Google Scholar] [CrossRef]
  26. Pickering, S.J. Recycling Technologies for Thermoset Composite Materials—Current Status. Compos. Part A Appl. Sci. Manuf. 2006, 37, 1206–1215. [Google Scholar] [CrossRef]
  27. Slapnik, J.; Lucyshyn, T.; Pinter, G. Relationships between the Decomposition Behaviour of Renewable Fibres and Their Reinforcing Effect in Composites Processed at High Temperatures. Polymers 2021, 13, 4448. [Google Scholar] [CrossRef]
  28. Gonçalves, R.M.; Martinho, A.; Oliveira, J.P. Recycling of Reinforced Glass Fibers Waste: Current Status. Materials 2022, 15, 1596. [Google Scholar] [CrossRef]
  29. Karuppannan Gopalraj, S.; Kärki, T. A Review on the Recycling of Waste Carbon Fibre/Glass Fibre-Reinforced Composites: Fibre Recovery, Properties and Life-Cycle Analysis. SN Appl. Sci. 2020, 2, 2195. [Google Scholar] [CrossRef]
  30. Szatkowski, P.; Twaróg, R. Thermal Recycling Process of Carbon Fibers from Composite Scrap—Characterization of Pyrolysis Conditions and Determination of the Quality of Recovered Fibers. Fibers 2024, 12, 68. [Google Scholar] [CrossRef]
  31. Han, Z.; Jeong, S.; Noh, J.; Oh, D. Comparative Study of Glass Fiber Content Measurement Methods for Inspecting Fabrication Quality of Composite Ship Structures. Appl. Sci. 2020, 10, 5130. [Google Scholar] [CrossRef]
  32. Goldstein, J.I.; Newbury, D.E.; Michael, J.R.; Ritchie, N.W.M.; Scott, J.H.J.; Joy, D.C. Scanning Electron Microscopy and X-Ray Microanalysis; Springer: New York, NY, USA, 2017; pp. 1–550. [Google Scholar] [CrossRef]
  33. Swain, S.S.; Samal, S.K.; Mohanty, S.; Nayak, S.K. Investigation of Fibre Orientation Using SEM Micrograph and Prediction of Mechanical Properties through Micromechanical Modelling. Bull. Mater. Sci. 2016, 39, 837–846. [Google Scholar] [CrossRef]
  34. Krauklis, A.E.; Karl, C.W.; Gagani, A.I.; Jørgensen, J.K. Composite Material Recycling Technology—State-of-the-Art and Sustainable Development for the 2020s. J. Compos. Sci. 2021, 5, 28. [Google Scholar] [CrossRef]
  35. Liu, Z.; Lei, Y.; Zhang, X.; Kang, Z.; Zhang, J. Effect Mechanism and Simulation of Voids on Hygrothermal Performances of Composites. Polymers 2022, 14, 901. [Google Scholar] [CrossRef] [PubMed]
  36. Hamdan, M.H.M.; Siregar, J.P.; Cionita, T.; Jaafar, J.; Efriyohadi, A.; Junid, R.; Kholil, A. Water Absorption Behaviour on the Mechanical Properties of Woven Hybrid Reinforced Polyester Composites. Int. J. Adv. Manuf. Technol. 2019, 104, 1075–1086. [Google Scholar] [CrossRef]
  37. Al-darkazali, A.; Çolak, P.; Kadıoğlu, K.; Günaydın, E.; Inanç, I.; Demircan, Ö. Mechanical Properties of Thermoplastic and Thermoset Composites Reinforced with 3D Biaxial Warp-Knitted Fabrics. Appl. Compos. Mater. 2018, 25, 939–951. [Google Scholar] [CrossRef]
  38. Sarkar, F.; Akonda, M.; Shah, D.U. Mechanical Properties of Flax Tape-Reinforced Thermoset Composites. Materials 2020, 13, 5485. [Google Scholar] [CrossRef] [PubMed]
  39. Ghaffari, S.; Seon, G.; Makeev, A. Effect of Fiber–Matrix Interface Friction on Compressive Strength of High-Modulus Carbon Composites. Molecules 2023, 28, 2049. [Google Scholar] [CrossRef]
  40. Yang, Y.; Boom, R.; Irion, B.; van Heerden, D.J.; Kuiper, P.; de Wit, H. Recycling of Composite Materials. Chem. Eng. Process. 2012, 51, 53–68. [Google Scholar] [CrossRef]
  41. Cai, H.; Ye, J.; Wang, Y.; Shi, Y.; Saafi, M.; Ye, J. Microscopic Failure Characteristics and Critical Length of Short Glass Fiber Reinforced Composites. Compos. Part B Eng. 2023, 266, 110973. [Google Scholar] [CrossRef]
  42. Delli, E.; Giliopoulos, D.; Bikiaris, D.N.; Chrissafis, K. Fibre Length and Loading Impact on the Properties of Glass Fibre Reinforced Polypropylene Random Composites. Compos. Struct. 2021, 263, 113678. [Google Scholar] [CrossRef]
  43. Witik, R.A.; Teuscher, R.; Michaud, V.; Ludwig, C.; Månson, J.A.E. Carbon Fibre Reinforced Composite Waste: An Environmental Assessment of Recycling, Energy Recovery and Landfilling. Compos. Part A Appl. Sci. Manuf. 2013, 49, 89–99. [Google Scholar] [CrossRef]
  44. Zhang, S.; Gao, D.; Huang, L.; Ji, Y.; Yan, Y.; Zhu, H.; Tang, J. Investigation on the Utilization of Fiber Clusters Recycled from Waste HFRP Bars in Concrete. Constr. Build. Mater. 2024, 421, 135775. [Google Scholar] [CrossRef]
  45. Bernardeau, F.; Perrin, D.; Caro, A.S.; Benezet, J.C.; Ienny, P. Valorization of Waste Thermoset Material as a Filler in Thermoplastic: Mechanical Properties of Phenolic Molding Compound Waste-Filled PP Composites. J. Appl. Polym. Sci. 2018, 135, 45849. [Google Scholar] [CrossRef]
  46. Longana, M.L.; Tapper, R.J.; Blok, L.G.; Hamerton, I. Recycling of Fiber Reinforced Thermosetting Composites. In Fiber Reinforced Composites: Constituents, Compatibility, Perspectives, and Applications; Elsevier: Amsterdam, The Netherlands, 2021; pp. 561–595. [Google Scholar] [CrossRef]
  47. Sharan Chandran, M.; Padmanabhan, K. Microbond Fibre Bundle Pullout Technique to Evaluate the Interfacial Adhesion of Polyethylene and Polypropylene Self Reinforced Composites. Appl. Adhes. Sci. 2019, 7, 5. [Google Scholar] [CrossRef]
  48. Morici, E.; Dintcheva, N.T. Recycling of Thermoset Materials and Thermoset-Based Composites: Challenge and Opportunity. Polymers 2022, 14, 4153. [Google Scholar] [CrossRef]
  49. Piggott, M.R. The Effect of Aspect Ratio on Toughness in Composites. J. Mater. Sci. 1974, 9, 494–502. [Google Scholar] [CrossRef]
  50. Fu, S.Y.; Feng, X.Q.; Lauke, B.; Mai, Y.W. Effects of Particle Size, Particle/Matrix Interface Adhesion and Particle Loading on Mechanical Properties of Particulate-Polymer Composites. Compos. Part B Eng. 2008, 39, 933–961. [Google Scholar] [CrossRef]
  51. Rybak, A.; Gaska, K. Functional Composites with Core–Shell Fillers: I. Particle Synthesis and Thermal Conductivity Measurements. J. Mater. Sci. 2015, 50, 7779–7789. [Google Scholar] [CrossRef]
  52. Drzal, L.T.; Madhukar, M. Fibre-Matrix Adhesion and Its Relationship to Composite Mechanical Properties. J. Mater. Sci. 1993, 28, 569–610. [Google Scholar] [CrossRef]
  53. Zhang, S.; He, E.; Liang, H.; Yang, Z.; Wang, Y.; Yang, Z.; Gao, C.; Wang, G.; Wei, Y.; Ji, Y. Chemical Recycling of Epoxy Thermosets: From Sources to Wastes. Actuators 2024, 13, 449. [Google Scholar] [CrossRef]
  54. Haque, N.; Chang, H.C.; Chang, C.C.; Davis, C.S. Visualizing Fiber End Geometry Effects on Stress Distribution in Composites Using Mechanophores. Soft Matter 2025, 21, 573–584. [Google Scholar] [CrossRef]
  55. Guo, M.; Li, X.; Maia, J.M. Fiber Length Distribution in Twin-Screw Extrusion of Fiber-Reinforced Polymer Composites: A Comparison between Shear and Extensional Mixing. Int. Polym. Process. 2021, 36, 350–357. [Google Scholar] [CrossRef]
  56. Masubuchi, Y.; Terada, M.; Yamanaka, A.; Yamamoto, T.; Ishikawa, T. Distribution Function of Fiber Length in Thermoplastic Composites. Compos. Sci. Technol. 2016, 134, 43–48. [Google Scholar] [CrossRef]
  57. Teßmann, M.; Mohr, S.; Gayetskyy, S.; Haßler, U.; Hanke, R.; Greiner, G. Automatic Determination of Fiber-Length Distribution in Composite Material Using 3D CT Data. EURASIP J. Adv. Signal Process. 2010, 2010, 545030. [Google Scholar] [CrossRef]
  58. Benthien, J.T.; Bähnisch, C.; Heldner, S.; Ohlmeyer, M. Effect of Fiber Size Distribution on Medium-Density Fiberboard Properties Caused by Varied Steaming Time and Temperature of Defibration Process. Wood Fiber Sci. 2014, 46, 175–185. [Google Scholar]
  59. Pavlyuchkova, E.A.; Malkin, A.Y.; Kornev, Y.V.; Simonov-Emel’yanov, I.D. Distribution of Filler in Polymer Composites. Role of Particle Size and Concentration. Polym. Sci. Ser. A 2024, 66, 113–120. [Google Scholar] [CrossRef]
  60. Vincent, G.A.; de Bruijn, T.A.; Wijskamp, S.; Abdul Rasheed, M.I.; van Drongelen, M.; Akkerman, R. Shredding and Sieving Thermoplastic Composite Scrap: Method Development and Analyses of the Fibre Length Distributions. Compos. Part B Eng. 2019, 176, 107197. [Google Scholar] [CrossRef]
  61. Castro, J.; Ostoja-Starzewski, M. Particle Sieving in a Random Fiber Network. Appl. Math. Model. 2000, 24, 523–534. [Google Scholar] [CrossRef]
  62. Austermann, V.; Neuhaus, J.; Schneider, D.; Dahlmann, R.; Hopmann, C. Investigation of the Mechanical Properties of Vinylester-Based Sheet Moulding Compound (SMC) Subject to Particle Recycling. J. Compos. Sci. 2022, 6, 84. [Google Scholar] [CrossRef]
  63. Dai, Y.; Fang, H.; Lu, Z.; Yang, Z.; Wei, Y. Toughening of Vinylester Resins by Two-Dimensional MXene Nanosheets. Front. Chem. Sci. Eng. 2022, 16, 1651–1658. [Google Scholar] [CrossRef]
  64. Li, Y.Q.; Zhang, D.H. Correction to: Local Stress Distributions in Fiber-Reinforced Composites with Consideration of Thermal Stresses During the Curing Process. Mech. Compos. Mater. 2022, 58, 859. [Google Scholar] [CrossRef]
  65. Benkhelladi, A.; Laouici, H.; Bouchoucha, A. Tensile and Flexural Properties of Polymer Composites Reinforced by Flax, Jute and Sisal Fibres. Int. J. Adv. Manuf. Technol. 2020, 108, 895–916. [Google Scholar] [CrossRef]
  66. Gribniak, V.; Rimkus, A.; Plioplys, L.; Misiūnaitė, I.; Garnevičius, M.; Boris, R.; Šapalas, A. An Efficient Approach to Describe the Fiber Effect on Mechanical Performance of Pultruded GFRP Profiles. Front. Mater. 2021, 8, 746376. [Google Scholar] [CrossRef]
  67. He, W.; Li, X.; Li, P.; Fang, S.; Ding, A. Experimental Investigation on Hygroscopic Aging of Glass Fiber Reinforced Vinylester Resin Composites. Polymers 2022, 14, 3828. [Google Scholar] [CrossRef]
  68. Salakhov, I.I.; Shaidullin, N.M.; Chalykh, A.E.; Matsko, M.A.; Shapagin, A.V.; Batyrshin, A.Z.; Shandryuk, G.A.; Nifant’ev, I.E. Low-Temperature Mechanical Properties of High-Density and Low-Density Polyethylene and Their Blends. Polymers 2021, 13, 1821. [Google Scholar] [CrossRef]
  69. Nguyen, T.T.; Nguyen, V.K.; Pham, T.T.H.; Pham, T.T.; Nguyen, T.D. Effects of Surface Modification with Stearic Acid on the Dispersion of Some Inorganic Fillers in PE Matrix. J. Compos. Sci. 2021, 5, 270. [Google Scholar] [CrossRef]
  70. Zhang, D.; He, M.; Qin, S.; Yu, J. Effect of Fiber Length and Dispersion on Properties of Long Glass Fiber Reinforced Thermoplastic Composites Based on Poly(Butylene Terephthalate). RSC Adv. 2017, 7, 15439–15454. [Google Scholar] [CrossRef]
  71. Qiao, J.; Zhang, Q.; Wu, C.; Wu, G.; Li, L. Effects of Fiber Volume Fraction and Length on the Mechanical Properties of Milled Glass Fiber/Polyurea Composites. Polymers 2022, 14, 3080. [Google Scholar] [CrossRef] [PubMed]
  72. Rohde, M.; Ebel, A.; Wolff-Fabris, F.; Altstädt, V. Influence of Processing Parameters on the Fiber Length and Impact Properties of Injection Molded Long Glass Fiber Reinforced Polypropylene. Int. Polym. Process. 2011, 26, 292–303. [Google Scholar] [CrossRef]
  73. Ville, J.; Inceoglu, F.; Ghamri, N.; Pradel, J.L.; Durin, A.; Valette, R.; Vergnes, B. Influence of Extrusion Conditions on Fiber Breakage along the Screw Profile During Twin Screw Compounding of Glass Fiber-Reinforced PA. Int. Polym. Process. 2013, 28, 49–57. [Google Scholar] [CrossRef]
  74. Chang, T.C.; Senior, A.B.; Celik, H.; Brands, D.; Yanev, A.; Osswald, T. Validation of Fiber Breakage in Simple Shear Flow with Direct Fiber Simulation. J. Compos. Sci. 2020, 4, 134. [Google Scholar] [CrossRef]
  75. Zhu, G.W.; Ma, F.D.; Jia, Y.X.; Qu, P.; Guo, Y.L.; Sun, X.C. Resin Matrix Shear Band and Its Special Effect on Stress Concentration of Fiber Composites. Chin. J. Polym. Sci. 2014, 32, 703–710. [Google Scholar] [CrossRef]
  76. Liang, J.Z. Melt Strength and Drawability of HDPE, LDPE and HDPE/LDPE Blends. Polym. Test. 2019, 73, 433–438. [Google Scholar] [CrossRef]
  77. Mehdikhani, M.; Gorbatikh, L.; Verpoest, I.; Lomov, S.V. Voids in Fiber-Reinforced Polymer Composites: A Review on Their Formation, Characteristics, and Effects on Mechanical Performance. J. Compos. Mater. 2019, 53, 1579–1605. [Google Scholar] [CrossRef]
  78. Zhang, X.; Zhou, L.; Cai, X.; Zheng, X.; Liu, W.; Wang, G.; Dong, M. Heterogeneous Structures and Morphological Transitions of Composite Materials and Its Applications. Adv. Compos. Hybrid Mater. 2024, 7, 251. [Google Scholar] [CrossRef]
  79. Kayani, S.H.; Kim, B.-J. Microstructure and Mechanical Behavior of Structural Materials. Crystals 2024, 14, 1076. [Google Scholar] [CrossRef]
  80. Guo, G.; Finkenstadt, V.L.; Nimmagadda, Y. Mechanical Properties and Water Absorption Behavior of Injection-Molded Wood Fiber/Carbon Fiber High-Density Polyethylene Hybrid Composites. Adv. Compos. Hybrid Mater. 2019, 2, 690–700. [Google Scholar] [CrossRef]
  81. Hassanpour, B.; Karbhari, V.M. Characteristics and Models of Moisture Uptake in Fiber-Reinforced Composites: A Topical Review. Polymers 2024, 16, 2265. [Google Scholar] [CrossRef]
  82. Abdelmola, F.; Carlsson, L.A. Water Uptake in Epoxy Matrix with Voids: Experiments and Modeling. J. Compos. Mater. 2019, 53, 1049–1065. [Google Scholar] [CrossRef]
  83. Carlsson, L.A.; Du, E. Water Uptake in Polymer Composites with Voids. In Durability of Composites in a Marine Environment 2; Solid Mechanics and Its Applications; Springer: Berlin/Heidelberg, Germany, 2018; Volume 245, pp. 33–57. [Google Scholar] [CrossRef]
  84. Thomason, J.L. The interface region in glass fibre-reinforced epoxy resin composites: 2. Water absorption, voids and the interface. Composites 1995, 26, 477–485. [Google Scholar] [CrossRef]
  85. Awad, S.A. Mechanical and Thermal Characterisations of Low-Density Polyethylene/Nanoclay Composites. Polym. Polym. Compos. 2021, 29, 1325–1332. [Google Scholar] [CrossRef]
  86. Ramirez, F.A.; Carlsson, L.A.; Acha, B.A. Evaluation of Water Degradation of Vinylester and Epoxy Matrix Composites by Single Fiber and Composite Tests. J. Mater. Sci. 2008, 43, 5230–5242. [Google Scholar] [CrossRef]
  87. Yin, X.; Liu, Y.; Miao, Y.; Xian, G. Water Absorption, Hydrothermal Expansion, and Thermomechanical Properties of a Vinylester Resin for Fiber-Reinforced Polymer Composites Subjected to Water or Alkaline Solution Immersion. Polymers 2019, 11, 505. [Google Scholar] [CrossRef]
  88. Van Chau, D. A Study on Water Absorption and Its Effects on Strength of Nano Organoclay-Epoxy Composites. J. Appl. Sci. 2012, 12, 1939–1945. [Google Scholar] [CrossRef]
  89. Dhakal, H.N.; Dashatan, S.H. Influence of Fiber/Matrix Interface Properties on the Performance of Fiber Reinforced Polymer Composites. In Comprehensive Mechanics of Materials; Silberschmidt, V., Ed.; Elsevier: Amsterdam, The Netherlands, 2024; Volume 1–4, pp. 22–32. [Google Scholar] [CrossRef]
  90. Sarmah, A.; Sarikaya, S.; Thiem, J.; Upama, S.T.; Khalfaoui, A.N.; Dasari, S.S.; Green, M.J. Recycle and Reuse of Continuous Carbon Fibers from Thermoset Composites Using Joule Heating. ChemSusChem 2022, 15, e202200989. [Google Scholar] [CrossRef] [PubMed]
  91. Alshammari, B.A.; Alenad, A.M.; Al-Mubaddel, F.S.; Alharbi, A.G.; Al-shehri, A.S.; Albalwi, H.A.; Mourad, A.H.I. Impact of Hybrid Fillers on the Properties of High Density Polyethylene Based Composites. Polymers 2022, 14, 3427. [Google Scholar] [CrossRef] [PubMed]
  92. Pearson, A.; Liao, W.; Kazemi, Y.; Duncan, M.; Slingerland, E.; Kakroodi, A.; Naguib, H.E. Fiber-Matrix Adhesion Between High-Density Polyethylene and Carbon Fiber. Polym. Test. 2022, 105, 107423. [Google Scholar] [CrossRef]
  93. Ramesh, M.; Rajeshkumar, L.N.; Srinivasan, N.; Kumar, D.V.; Balaji, D. Influence of Filler Material on Properties of Fiber-Reinforced Polymer Composites: A Review. E-Polymers 2022, 22, 898–916. [Google Scholar] [CrossRef]
  94. Liu, L.; Du, M.; Liu, F. Recent Advances in Interface Microscopic Characterization of Carbon Fiber-Reinforced Polymer Composites. Front. Mater. 2023, 10, 1124338. [Google Scholar] [CrossRef]
  95. Kang, B.; Kim, D.; Sohn, J.S.; Park, N.; Kim, K.; Kim, H.J.; Choi, B.H. Observations of Short- and Long-Term Mechanical Properties of Glass Fiber Reinforced Polypropylenes with Post-Consumer Recycled Materials. Int. J. Precis. Eng. Manuf. Green Technol. 2024, 11, 523–535. [Google Scholar] [CrossRef]
  96. Fu, S.Y.; Lauke, B.; Mäder, E.; Yue, C.Y.; Hu, X. Tensile Properties of Short-Glass-Fiber- and Short-Carbon-Fiber-Reinforced Polypropylene Composites. Compos. Part A Appl. Sci. Manuf. 2000, 31, 1117–1125. [Google Scholar] [CrossRef]
  97. Thomason, J.L. The Influence of Fibre Length and Concentration on the Properties of Glass Fibre Reinforced Polypropylene: 5. Injection Moulded Long and Short Fibre PP. Compos. Part A Appl. Sci. Manuf. 2002, 33, 1641–1652. [Google Scholar] [CrossRef]
  98. Jawaid, M.; Abdul Khalil, H.P.S.; Abu Bakar, A. Mechanical Performance of Oil Palm Empty Fruit Bunches/Jute Fibres Reinforced Epoxy Hybrid Composites. Mater. Sci. Eng. A 2010, 527, 7944–7949. [Google Scholar] [CrossRef]
  99. George, J.; Sreekala, M.S.; Thomas, S. A Review on Interface Modification and Characterization of Natural Fiber Reinforced Plastic Composites. Polym. Eng. Sci. 2001, 41, 1471–1485. [Google Scholar] [CrossRef]
  100. Huang, R.; Xu, X.; Lee, S.; Zhang, Y.; Kim, B.J.; Wu, Q. High Density Polyethylene Composites Reinforced with Hybrid Inorganic Fillers: Morphology, Mechanical and Thermal Expansion Performance. Materials 2013, 6, 4122–4138. [Google Scholar] [CrossRef]
  101. Ribeiro, M.; Dinis, M. On the Recyclability of Glass Fiber Reinforced Thermoset Polymeric Composites Towards the Sustainability of Polymers’ Industry. Int. J. Waste Resour. 2016, 6, 250. [Google Scholar] [CrossRef]
  102. Jagadeesh, P.; Mavinkere Rangappa, S.; Siengchin, S.; Puttegowda, M.; Thiagamani, S.M.K.; Rajeshkumar, G.; Moure Cuadrado, M.M. Sustainable Recycling Technologies for Thermoplastic Polymers and Their Composites: A Review of the State of the Art. Polym. Compos. 2022, 43, 5095–5114. [Google Scholar] [CrossRef]
  103. Meira Castro, A.C.; Ribeiro, M.C.S.; Santos, J.; Meixedo, J.P.; Silva, F.J.G.; Fiúza, A.; Alvim, M.R. Sustainable Waste Recycling Solution for the Glass Fibre Reinforced Polymer Composite Materials Industry. Constr. Build. Mater. 2013, 45, 87–94. [Google Scholar] [CrossRef]
  104. Wang, B.; Wang, Y.; Du, S.; Zhu, J.; Ma, S. Upcycling of Thermosetting Polymers into High-Value Materials. Mater. Horiz. 2022, 9, 2952–2960. [Google Scholar] [CrossRef] [PubMed]
  105. Goodarz, M.; Behzadnia, A.; Dastan, T. Assessing the Flexural Properties of Interlayer Hybrid Thermoset–Thermoplastic Composites and Their Repairability. Compos. Mech. Comput. Appl. 2022, 13, 77–94. [Google Scholar] [CrossRef]
  106. Demircan, O.; Ibrahim, M.H.I. Enhanced Tensile and Flexural Properties in Carbon Nanotubes and Modified Carbon Nanotubes Added Carbon Fiber-Reinforced Epoxy Resin Thermoset Composites. J. Mater. Eng. Perform. 2025, 34, 1–12. [Google Scholar] [CrossRef]
  107. Periasamy, D.; Karuppiah, P.; Manoharan, B.; Arockiasamy, F.; Kannan, S.; Mohanavel, V.; Velmurugan, P.; Arumugam, N.; Almansour, A.; Sivakumar, S. Assessing the Recycling Potential of Thermosetting Polymer Waste in High-Density Polyethylene Composites for Safety Helmet Applications. E-Polymers 2024, 24, 20230080. [Google Scholar] [CrossRef]
  108. Scott, C.; Ishlda, H.; Maurer, F.H.J. Infrared Analysis and Izod Impact Testing of Multicomponent Polymer Composites: Polyethylene/EPDM/Filler Systems. J. Mater. Sci. 1987, 22, 3963–3973. [Google Scholar] [CrossRef]
  109. Tarani, E.; Arvanitidis, I.; Christofilos, D.; Bikiaris, D.N.; Chrissafis, K.; Vourlias, G. Calculation of the Degree of Crystallinity of HDPE/GNPs Nanocomposites by Using Various Experimental Techniques: A Comparative Study. J. Mater. Sci. 2023, 58, 1621–1639. [Google Scholar] [CrossRef]
  110. Ran, X.; Qin, J.; Wang, M.; Jiang, Q.; Zeng, Y.; Liu, W. Synergistic Toughening of Carbon Fiber/Vinyl Ester Resin Composites with Core–Shell Rubber Particles and Polyphenylene Sulfide Veils. Polym. Compos. 2024, 44, e29447. [Google Scholar] [CrossRef]
  111. Wang, Z.; Lai, Y.; Xu, P.; Ma, J.; Xu, Y.; Yang, X. Synergistic Effects of Liquid Rubber and Thermoplastic Particles for Toughening Epoxy Resin. Polymers 2024, 16, 2775. [Google Scholar] [CrossRef]
  112. Sun, J.; Li, Q.; Jiang, Y.; Jiang, J.; Yang, L.; Jia, C.; Chen, F.; Wang, X. Lightweight and High Impact Toughness PP/PET/POE Composite Foams Fabricated by In Situ Nanofibrillation and Microcellular Injection Molding. Polymers 2023, 15, 227. [Google Scholar] [CrossRef]
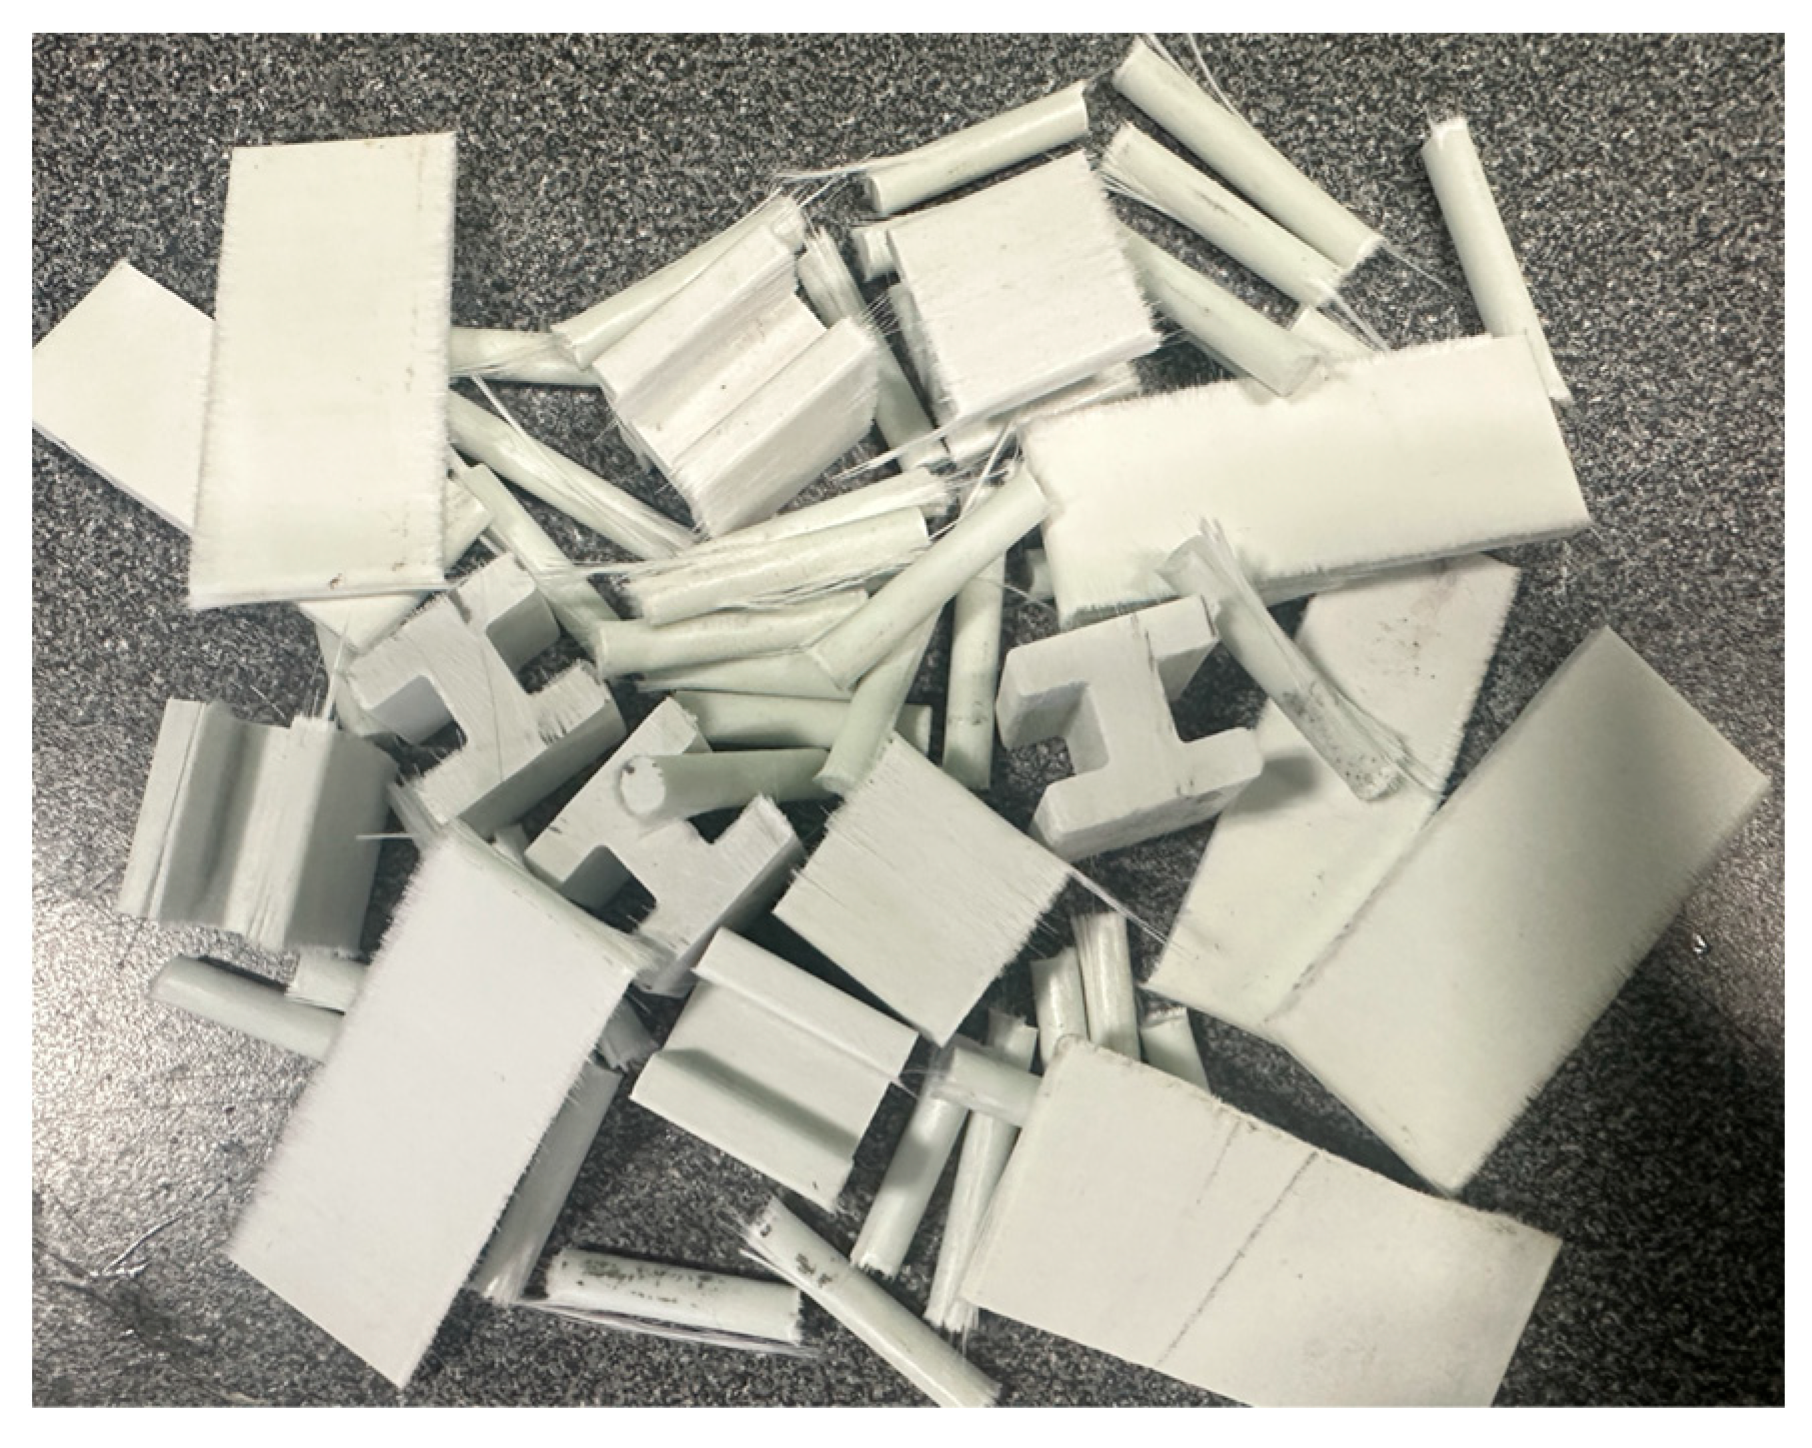
Figure 1. Vinyl ester resin glass fiber pultrusion bars.
Jcs 09 00641 g001
Figure 2. Process steps for obtaining RVC fillers from pultruded profiles.
Jcs 09 00641 g002
Figure 3. Process flow for the manufacturing of VPCs.
Jcs 09 00641 g003
Figure 4. Representative optical images of RVC fillers collected from different mesh sieve fractions.
Jcs 09 00641 g004
Figure 5. Histogram of fiber length distribution in screened recycled fractions.
Jcs 09 00641 g005
Figure 6. Size distribution histograms of width, thickness, and length in VE fibers.
Jcs 09 00641 g006
Figure 7. Distribution of glass fiber content across RVC fractions.
Jcs 09 00641 g007
Figure 8. Histogram of average glass fiber lengths in VPCs.
Jcs 09 00641 g008
Figure 9. Water absorption trends in VPCs: (a) LDPE-based composites; (b) HDPE-based composites.
Jcs 09 00641 g009
Figure 10. Fiber orientation and dispersion in VLC5 composite (200×).
Jcs 09 00641 g010
Figure 11. Microstructural heterogeneity in VHC5 composite (300×).
Jcs 09 00641 g011
Figure 12. Fracture surface morphology of VLC5 (a) and VHC5 (b) composites.
Jcs 09 00641 g012
Figure 13. Fracture surface morphology of VLC3 (a) and VHC3 (b) composites.
Jcs 09 00641 g013
Figure 14. Stress–strain curves of LDPE-based VPCs with varying RVC filler content.
Jcs 09 00641 g014
Figure 15. SEM images of fracture surfaces for VLC2 (a) and VHC4 (b) composites.
Jcs 09 00641 g015
Figure 16. (a) Tensile modulus and (b) tensile strength of LDPE-based VPCs with different RVC filler levels.
Jcs 09 00641 g016
Figure 17. Stress–strain curves of HDPE-based VPCs with varying RVC filler content.
Jcs 09 00641 g017
Figure 18. (a) Tensile modulus and (b) tensile strength of HDPE-based VPCs with different RVC filler levels.
Jcs 09 00641 g018
Figure 19. Flexural strength and modulus of LDPE-based VPCs.
Jcs 09 00641 g019
Figure 20. Flexural strength and modulus of HDPE-based VPCs.
Jcs 09 00641 g020
Figure 21. Izod impact strength of LDPE- and HDPE-based VPCs.
Jcs 09 00641 g021
Table 1. Formulations of the thermoset-filled PE composites.
Matrix TypeDefinition of VPCsThermoplastic Matrix (wt.%)RVC Fillers (wt.%)
LDPEVLC19010
VLC28020
VLC37030
VLC46040
VLC55050
HDPEVHC19010
VHC28020
VHC37030
VHC46040
VHC55050
Table 2. Morphological characteristics of RVC fractions by mesh size.
Mesh Range
(ASTM E 11)
Opening Sizes (µm)Morphological CharacteristicsFiber Structure
No. 4>4.75 mmElongated, coarse fiber bundles with a high shape factorPreserved orientation, entangled/separated fibers
No. 5>4 mm
No. 6>3.35 mmMedium-sized, partially separated fiber segmentsPartially separated, lower density bundles
No. 25>710 µmShort fiber fragments, partially matrix-coated microfibersFragmented structure, weak fiber-matrix separation
No. 30>600 µm
No. 40>425 µmAmorphous powdery particles, resin residues, microfiber fragmentsLost fiber structure
No. 140>106 µm
Under Sieve<106 µm
Table 3. Quantitative analysis of glass fiber content in recovered VPCs.
Definition of VPCsLoading FractionPost-Test Content
Matrix (wt.%)RVC Fillers (wt.%)Matrix (wt.%)Glass Fiber (wt.%)±SD
VLC1901091.378.630.26
VLC 2802084.2415.760.39
VLC 3703074.7725.230.66
VLC 4604066.6033.400.81
VLC 5505058.5241.481.15
VHC 1901091.238.770.47
VHC 2802084.2615.740.53
VHC 3703075.2424.770.92
VHC 4604066.4533.551.08
VHC 5505057.2642.741.43
Table 4. Effect of RVC fillers content on the density of VPCs.
Definition of VPCsLoading FractionPost-Test Content
Matrix (wt.%)RVC Fillers (wt.%)Density (g/cm3)±SD
VLC190100.980.014
VLC 280201.050.016
VLC 370301.110.018
VLC 460401.180.029
VLC 550501.200.031
VHC 190100.990.012
VHC 280201.040.023
VHC 370301.110.025
VHC 460401.200.033
VHC 550501.210.041
Table 5. Izod impact strength of VPCs with recycled filler content.
Definition of VPCsTest Results
Break Energy (J)±SD (*)Izod Impact Strength (kJ/m2)±SD (*)
VLC10.490.0610.271.38
VLC 20.640.0811.381.39
VLC 30.620.0814.631.69
VLC 40.780.0816.741.73
VLC 51.030.1622.973.59
VHC10.190.023.691.33
VHC 20.270.074.971.34
VHC 30.350.096.621.66
VHC 40.470.157.022.20
VHC 50.480.1112.92.93
(*) Standard deviation.
Disclaimer/Publisher’s Note: The statements, opinions and data contained in all publications are solely those of the individual author(s) and contributor(s) and not of MDPI and/or the editor(s). MDPI and/or the editor(s) disclaim responsibility for any injury to people or property resulting from any ideas, methods, instructions or products referred to in the content.