Abstract
The use of composites in the aerospace industry has been increasing exponentially. However, conventional epoxy resins, derived from petroleum sources, are not sustainable, making them non-degradable and environmentally harmful. In order to foster a sustainable environment, replacing conventional thermoset epoxies with bio-sourced carbon epoxies is imperative. With the enhancement in technology, it is possible to combine vegetable oils or bio-based copolymers with resins to make it recyclable in nature. Hence, it is necessary to study bio-based epoxies and carry out material characterization and see how they behave differently from conventional epoxies. This study examines the mechanical properties of different types of epoxy resins, which includes conventional, recyclable, and non-recyclable bio-epoxies. Tensile, bending, fracture toughness, and compression tests are performed in accordance with ASTM and ISO standards. The results show that the recyclable bio-epoxy exhibits comparable or superior properties when compared with conventional and non-recyclable bio-epoxies, particularly in terms of impact resistance. Recyclable epoxy, examined in the current study, shows a 73% higher strain energy release rate as compared to conventional epoxy. These results suggest that bio-epoxies could serve as a viable alternative to conventional epoxy.
1. Introduction
Composites play a vital role in various industries due to their remarkable high strength-to-weight ratio. In industries such as aerospace, aeronautical, automotive, marine, and construction, where reducing mass and ensuring robustness are critical imperatives, the utilization of composite materials like carbon-fiber-reinforced polymers (CFRPs), glass-fiber-reinforced polymers (GFRPs), and sandwich and laminate composites has experienced a remarkable surge in recent years [1,2,3,4,5]. Within a laminate structure, the fibers are held together by the matrix, with epoxy emerging as the predominant choice in various industries. A wide range of mechanisms can cause failure of this kind of material such as fiber or matrix tension/compression failure, intralaminar failure, interlaminar failure, matrix cracking, and fiber/matrix debonding [6]. Since the matrix is responsible for transferring loads between the fibers, it is important to study its properties. Conventional epoxies, composed of polymer-based thermosets, undergo a curing process to establish a three-dimensional network structure, making them non-recyclable upon reaching the end of their lifespan [7].
To analyze the mechanical properties of neat epoxies, various studies have been conducted employing different methods to investigate their deflection and strain rate response under different loading conditions [8,9,10,11,12,13,14]. Gilat et al. experimentally determined the correlation between tensile and shear loading response at different strain rates for two epoxies commonly used in aerospace applications [10]. From the stress–strain relationships developed, it was observed that under the shear loading, the ductility of non-toughened epoxy resins exhibited an inverse correlation with strain rate while toughened epoxies displayed localized deformations. Conversely, stress values directly demonstrated proportionality to the strain rate. Moreover, authors identified a significant influence of hydrostatic stress on the load–deformation relationship. Similar observations were reported by Masoud et al., who carried out a material characterization of epoxy resin E 863 through experimental tests, tensile, compressive, and flexural, as per the ASTM standards [15]. The digital image correlation (DIC) technique was employed to ascertain stress–strain curves.
Polymer-based epoxies exhibit a relatively low value of fracture toughness, giving them low resistance towards fracture. Since epoxies, as the matrix material, transfer the load to the fibers, their premature failure, in the form of cracks, can result in early failure of the composite laminate. Consequently, it is crucial to investigate the fracture toughness and failure modes of epoxies. Allaer et al. conducted experimental and numerical analysis on neat epoxy to determine the fracture toughness properties [16]. Digital image correlation coupled with the J-integral method was employed to understand the deformation behavior. This study revealed that epoxy samples demonstrated ductile behavior under tensile loading but exhibited brittle behavior during the single notched bend (SENB) test. Additionally, Lee et al. conducted a study aiming to understand the mechanical and thermal properties of modified epoxies using fracture toughness tests [17]. Rahmani et al. conducted experimental analysis using conventional LY5052 epoxy to study the behavior of an epoxy and carbon-fiber-laminated composite [18].
The focus of the aforementioned studies primarily revolves around polymer-based composites, which, due to their high carbon footprint and adverse environmental impact post usage, raise concerns regarding sustainability. With the increase in focus towards sustainability in numerous industries, there is a growing need to introduce recyclable or green epoxies that not only match but surpass the mechanical properties of current epoxies [19,20,21,22,23,24,25,26,27]. Hence, there is a pressing demand for further exploration into green composites or bio-based alternatives. Interest has shifted to replacing the non-degradable resins with greener thermoset resins sourced from natural origins such as sugars, proteins, and vegetable- and plant-based oils [28,29,30]. Johnson et al. carried out an experimental study to investigate the mechanical properties of bio-epoxy resin comprising 25% vegetable oil under 65% humidity conditions [31]. Their findings indicated that the bio-epoxy resin exhibited a higher stress tolerance under tensile loading compared to pure polyester and epoxy counterparts. Vinod et al. investigated the physical, mechanical, thermal, and viscoelastic properties of a bio-epoxy composite, comprising chemically treated Noni tree fibers and a green epoxy containing 50–58% plant-based carbon. This study highlighted that saline treatment enhanced ply adhesion, leading to increased energy storage in the composite at elevated temperatures [32]. Mattar et al. carried out similar studies on the bio-based epoxy-amine resins to examine creep and dynamic fatigue. The authors concluded that the fully bio-based epoxy resins demonstrated superior aging resistance compared to Di-glyidyl ether of bisphenol A (DGEBA) and exhibited high fatigue resistance [33]. Joseph et al. assessed commercial bio-based epoxy resin systems for FRP applications, emphasizing their bio-content and compatibility with vacuum-infused fiber composites. Comparative analysis with conventional bisphenol A epoxies underscores their potential for reducing the environmental impact in thermoset composite manufacturing with minimal process alteration [34].
Given the extensive use of composite materials in aerospace applications, it is crucial to initially characterize the matrix. Thus, the present study focuses on performing a mechanical characterization of recyclable and non-recyclable bio-based epoxy resins, comparing their results to those of conventional epoxy resin. In this work, recyclability means that the thermosets can be recovered and reused after undergoing specific chemical treatments that aid in separating the epoxy matrix and reinforcements at the end of the component’s life. Numerous experiments have been carried out to determine the tensile, bending, and compression properties of the bio-based epoxy resin systems. Toughness is especially investigated as it is one of the main required properties for aerospace application. The present study aims to establish a benchmark for subsequent studies, which will encompass the effect of moisture and the testing of composite laminates manufactured using recyclable epoxies. Initially, this paper outlines the different materials under investigation and the testing methods employed. Subsequently, it presents the experimental results and compares them with other bio-based epoxies reported in the literature.
2. Materials and Methods
2.1. Materials
This study investigated an epoxy resin system consisting of various epoxies, including a polymer-based conventional resin (Araldite LY 5052 from Huntsman, The Woodlands, TX, USA), alongside three bio-epoxy resins with different percentages of bio-based carbon content (the percentage of carbon in the epoxy resin that originates from the natural source). The bio-epoxy resins were sourced from Aditya Birla Chemicals (Thailand) Limited (Advanced Materials) (Bangkok, Thailand), while the conventional epoxy was provided by Huntsman (Table 1). The source material for the bio-based epoxies was derived from palm oil, which served as a partial replacement for the polymer and contributes to the bio-based carbon content. The manufacturing process adhered to manufacturer specifications, involving two steps: initially, the resin and hardener were combined using a dual asymmetric centrifugal mixer operating at 800 rpm for 5 min and degassed at 30 mbar. Subsequently, the mixture was poured into an aluminum mold for curing.

Table 1.
Properties of conventional and bio-epoxy resins.
2.2. Sample Preparation
Using the computer numerical control (CNC) machining process, coupons for tensile, bending, and fracture toughness tests were cut from a 4 mm thick, 150 × 150 mm² respective epoxy plate. The tests were carried out according to various standards accepted by the industry. For fracture toughness samples, a 2 mm notch was made, defining them as pre-cracked specimens. Compression tests were conducted using blocks of pure epoxy, with details provided in a later section. For validation and authentication of the results, each type of test was carried out on 4 coupons for each resin. In total, 64 coupons were used for conducting different tests. To prevent humidity interference, all samples were placed inside an oven at 100 °C for 24 h, considering the glass transition temperature for the epoxies
2.3. Experimental Techniques
2.3.1. Differential Scanning Calorimeter Tests
Prior to conducting mechanical tests, a thorough examination of various bio-epoxy samples was undertaken using a differential scanning calorimeter, employing the half-bearing method. Initially, a ramp heating process was implemented to ensure the resin’s complete polymerization, followed by a subsequent heating phase to measure the glass transition temperature. To eliminate any influence from the materials’ prior thermal history, the analysis was conducted with a heating rate of 20 K/min. The determination of the glass transition temperature adhered to the methodology outlined in the ISO 11357-2 standard [36].
2.3.2. Tensile Tests
The tensile tests were performed as per the ASTM D638 (type IV) standard. The coupons for the tensile tests were manufactured according to the specifications [37]. The dimensions of all the tensile samples were similar and are presented in Table 2. A total of 16 tensile tests were carried out on a 10 kN load cell with a loading speed of 5 mm/min. To measure the axial strain, an extensometer was used at the neck of the specimen. The extensometer was useful in accurately determining the strain of the sample during the tensile test. The gauge length for the samples with the extensometer was 12.5 mm.

Table 2.
Common parameters for the tests.
2.3.3. Bending Tests
The flexural properties of the resins were evaluated in accordance with ISO 178 [38]. The dimensions of the bending sample are provided in Table 2. To accommodate material constraints, the length of the sample was selected at 50 mm with a span length of 33 mm. However, all tests were conducted following standard procedures. Stress and strain during bending were calculated using classical beam theory (CBT), as described in Equations (1) and (2):
where l is the center-to-center distance between the supports; B is the thickness of the sample, i.e., 4 mm; P is the force applied on the coupon; W is its width; and s is the deflection. Here, the strain is presented in percentage (%) for clarity and ease of comprehension, where the actual value is divided by 100. For instance, 3% strain corresponds to a numerical value of 0.03. This is commonly found in many studies.
2.3.4. Fracture Toughness Tests
To understand the damage characteristics of the different epoxies, fracture toughness tests were carried out according to the ASTM D5045 standard [39]. The samples were fabricated according to the dimensions outlined in Table 2. Each specimen possessed an average crack length of 4 mm. Samples were sized and prepared as per the standards, with a width (W) equal to twice the thickness (B), and subjected to a loading speed of 1 mm/min. The length of the notch (a) was determined based on the constraint 0.45 < a/w < 0.55 [39]. Through this test, the fracture toughness value, i.e., the critical stress intensity factor KIC (MPa.m1/2), was calculated, reflecting the material’s resistance to fracture under the presence of a crack or notch.
Previous studies have employed the single notched bend test to calculate the mode I critical stress intensity factor KIC [16,40]. According to the ASTM standard D5045, for a single notched bend test, the value of KIC is calculated as follows Equation (3):
where PQ is the maximum load in kN; B is the thickness of the specimen, which is 4 mm; and W is the width (depth) of the specimen. The factor is defined as Equation (4):
where is the ratio between the crack length and the width of the coupon, i.e., where a is the crack length.
The associated critical strain energy release rate GIC (N/mm) which indicates the energy required to fracture can be found using Equation (5).
where is Poisson’s ratio (0.31) and E is Young’s modulus. When considering Young’s modulus (E) in the toughness test, there are two possibilities: it can be derived from either a tensile test or a bending test. Assuming the material behaves linearly elastically, the modulus of bending is considered in Equation (5), which is determined at a strain value of 0.2.
2.3.5. Compression Tests
To determine the compressive strength, compression tests as per the ASTM D695 standard were carried out for all the resins [41]. The samples were manufactured based on the dimensions specified in Table 2. A block of 25.4 × 12.7 × 12.7 mm3 was subjected to compressive loading. Tests on 3 coupons were carried out without an extensometer and the 4th coupon had an extensometer attached to it. The tests were carried out using a 100 kN load cell. The length of the specimen was 25.4 mm while the width and thickness were 12.7 mm. The engineering compressive stress (MPa) was calculated by dividing the force values (N) by the original cross-sectional area (mm2). To ensure accurate results, strain measurements were calibrated by adjusting the length of the samples in the calculation. Compressive strain (%) was calculated by dividing the displacement of the load cell by the adjusted length of the sample (when an extensometer was not used) or by the gauge length of 12.5 mm (when an extensometer was used).
3. Results and Discussion
3.1. Glass Transition Temperature
The values of the glass transition temperature (Tg) are obtained for all the bio-epoxy resins, which are well defined in Figure 1 and correspond to the range given in Table 3. For the conventional epoxy resin system, E Cla, authors found that the glass transition temperature was between 103 °C and 109 °C for a post-thermal curing cycle at 80 °C for 240 min [42].
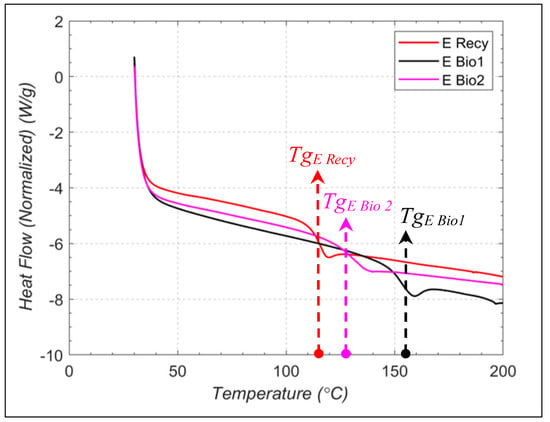
Figure 1.
Glass transition temperature for the three bio-epoxies.

Table 3.
Glass transition temperature of conventional and bio-epoxy resins.
3.2. Tensile Test
During tensile testing, some anomalies are observed across the four samples of an epoxy, possibly due to premature failure in the grip during the test or slight misalignment between the coupon and the testing machine axis. However, despite variations in ultimate tensile stress (UTS) values, all four coupons exhibit consistent behavior for each epoxy. It is evident that the tensile response of all epoxies shows brittle failure (Figure 2 and Figure 3a). Interestingly, the recyclable epoxy (E Recy) globally demonstrates the highest elongation before break as compared to the other epoxies. This is attributed to the small amount of plastic behavior exhibited by E Recy, leading to higher strains. Similar observations are made by Masoud for a pure epoxy sample subjected to a strain rate of 833 [15].
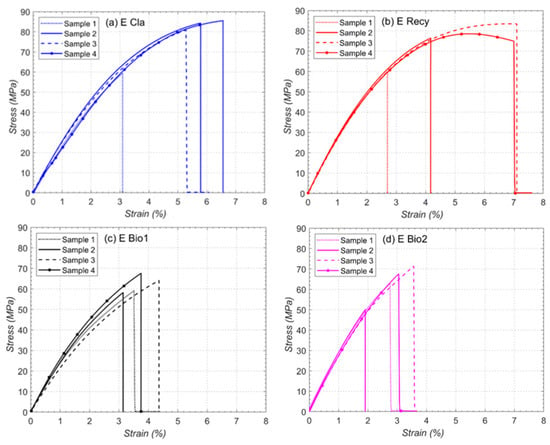
Figure 2.
Comparison of stress–strain under tensile loading for different samples for bio-epoxy resins: (a) E Cla; (b) E Recy; (c) E Bio1; (d) E Bio2.
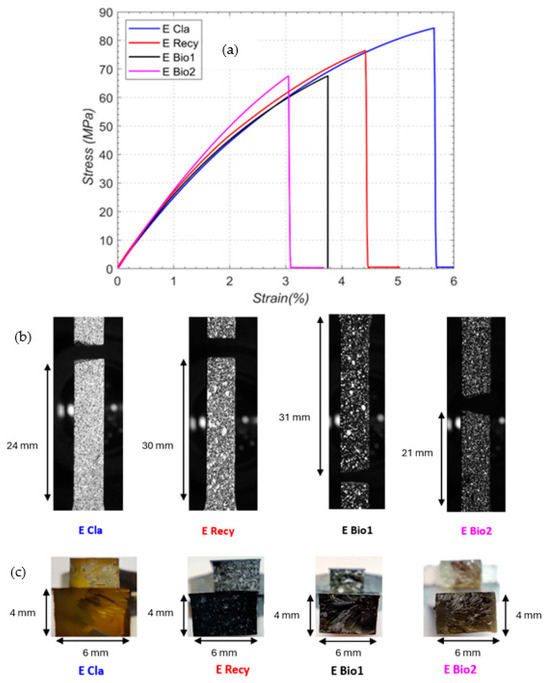
Figure 3.
(a) Mean stress–strain comparison; (b) detailed view of the tensile failure region front face and (c) at the failure surface.
The observed discrepancies in stress–strain curves among the four samples of identical epoxy systems represent a recurring phenomenon in experimental contexts due to fabrication and cutting defects, as previously documented [34,43]. To facilitate the comparison among different resin curves, a representative curve for each resin is selected. Extreme curves are excluded and an intermediate curve, reflecting the average of the tests, is chosen. The “average” stress–strain curves of each coupon are plotted in Figure 3a, illustrating the stress vs. strain variation for the four different resins. It is observed that the E Cla resin exhibits highest “average” ultimate tensile stress, followed by E Recy, E Bio2, and E Bio1 epoxy resins. From Figure 3a, the values of Young’s modulus are calculated at a strain of 0.2%; they are similar for the four resins (Figure 3a).
Figure 3b,c provide visual insights into the state of the samples following tensile failure in the epoxies. A notable distinction is evident between E Recy and the other three epoxies (Figure 3b). In E Recy epoxy, a smooth cross-section at the point of failure is observed, whereas the other three epoxies exhibit striations of failure. Additionally, the front view of the samples immediately after failure reveals varying failure locations in the samples, due to different stress concentrations and hence reflecting the differences in the stress–strain curves (Figure 3a).
3.3. Bending
Figure 4 illustrates the stress–strain relationships for E Cla, E Recy, E Bio1, and E Bio2. Similar to tensile tests, brittle behavior is observed in the flexural tests, with final failure occurring shortly after reaching maximum stress. In Figure 4b, E Recy exhibits a considerable amount of plastic deformation before the final failure, while the other epoxies do not show this behavior.
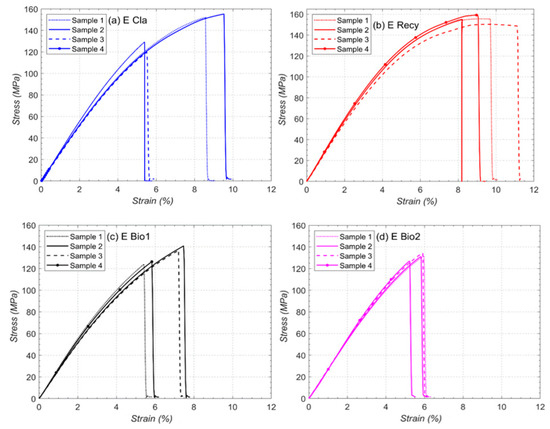
Figure 4.
Comparison of stress–strain subjected to bending for different samples for bio-epoxy resins: (a) E Cla; (b) E Recy; (c) E Bio1; (d) E Bio2.
Figure 5a shows the average variation in displacement along with the applied force for different epoxies. The trend remains consistent across the epoxies. Initially, all the epoxies show a linear behavior to force vs. displacement, but as the force increases, the behavior becomes non-linear. Compared to conventional E Cla resin, the bio-epoxy resins have higher force for the same displacement value until reaching 3.2 mm of displacement before which there is a failure of bio-resins E Bio1 and E Bio2. Another noteworthy observation is that the force value for E Recy epoxy remains constant for a few millimeters of displacement before failure, unlike other samples which fail immediately. This indicates that the E Recy bio-epoxy resin system sustains more bending deformation at a higher force value before failure as observed during the tests.
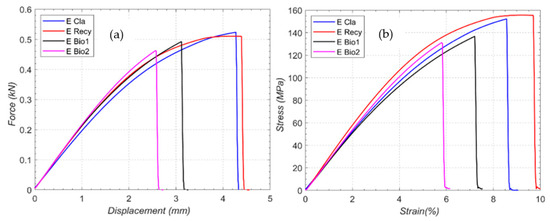
Figure 5.
Comparison of average (a) force–displacement and (b) stress–strain for different epoxies under bending.
The “average” stress–strain relationship is developed as seen in Figure 5b for different epoxies. Unlike the tensile stress–strain relationship, it can be seen that the bio-epoxy resin system E Recy has a higher ultimate bending strength compared to other bio-epoxies but is very close to the conventional E Cla epoxy. Moreover, the difference between the stress–strain curves among the epoxies is greater as compared to the force–displacement curves because of the variation in the cross-sectional area due to a slight difference in the thickness and width of the samples.
3.4. Fracture Toughness
Figure 6 shows the stress–strain curves for all the epoxy resin samples. It is observed that the recyclable epoxy E Recy has the highest stress values. This indicates that E Recy can withstand a much higher force in the presence of a crack (notch). At the start of the curves, a minute non-linear behavior (marked in Figure 6) is witnessed, which is more prominent for E Recy and E Bio2 epoxy resin systems, indicating that the stress does not change proportionally with the strain at lower force values and can be caused by material non-linearity, indicating the occurrence of initial matrix cracking. Sample 2 for E Cla (Figure 6a) and E Bio2 (Figure 6d) exhibits variation in comparison to the remaining samples. Dispersion has been observed as described in the literature [44]. However, it is important to remember that these bio-epoxies are investigated for a further composite used and, therefore, this dispersion will be decreased due to the fibers’ effect [45].
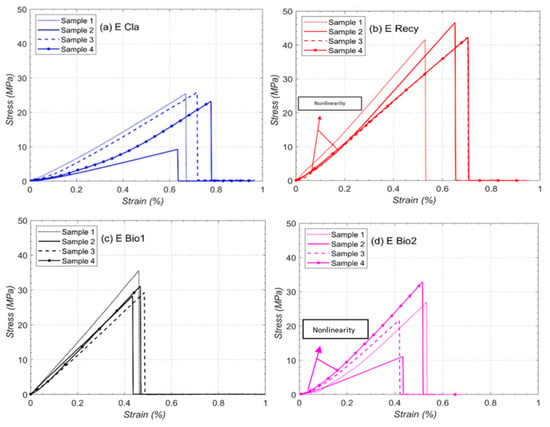
Figure 6.
Comparison of stress–strain subjected to fracture toughness tests for different samples for bio-epoxy resins: (a) E Cla; (b) E Recy; (c) E Bio1; (d) E Bio2.
A comparison of KIC and GIC values for different epoxies is depicted in Figure 7. The “average” toughness value for the recyclable epoxy E Recy is highest with the highest GIC, which indicates that 73% more energy as compared to E Cla is required to rupture the E Recy toughness sample. While bio-epoxies E Bio1 and E Bio2 show almost the same values, the conventional epoxy resin system E Cla shows the least fracture toughness and energy release values. Hence, it can be concluded that E Recy recyclable bio-epoxy resin should be more resistant to failure under impacts. It is essential to note that the obtained values are applicable only under specific test conditions in which tests have been performed and confirmed by other studies. Indeed, this type of test is known to be very sensitive to notch geometry.
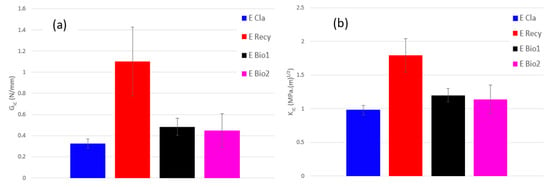
Figure 7.
Comparison of toughness properties of the epoxies: (a) GIC and (b) KIC.
3.5. Compression
Figure 8 shows a comparison of engineering stress–strain curves for all the epoxy resin systems. Unlike tensile, flexural, and fracture toughness tests, a clear plasticity is observed in all the epoxy resin systems. For E Cla epoxy (Figure 8a), it can be observed that after the ultimate compressive stress (peak), there is a constant stress flow observed for some strain percentage after which the strain hardening phenomenon occurs. Meanwhile, for E Recy (Figure 8b), after the peak, the strain softening phenomenon occurs, which is then followed by strain hardening, and similar behavior is observed for E Bio2 (Figure 8d). However, for E Bio1 (Figure 8c), directly after the peak, strain hardening occurs, indicating that E Bio1 can withstand higher loads before failure. Finally, a tiny dip can be observed around 5–6% of strain that is common and due to local deformation or a slight shift in specimens when force is applied through the load cell.
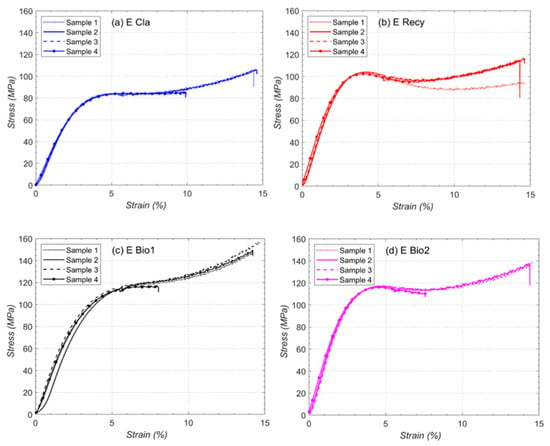
Figure 8.
Comparison of engineering stress–strain subjected to compressive loading for different samples for bio-epoxy resins: (a) E Cla; (b) E Recy; (c) E Bio1; (d) E Bio2.
Figure 9a shows the average stress–strain relation for different epoxies under compressive loading. It is noted that the neat epoxy, i.e., E Cla, has the lowest compressive strength while bio-epoxy resin systems E Bio1 and E Bio2 have nearly identical compressive strength values. Similar conclusions are drawn regarding non-linearity. Overall, all the resins display high non-linearity and high failure strain, which is relatively typical for compressive loading [11,12,14]. Nevertheless, the curves should be taken with caution due to the high deformation of the samples during the test (Figure 9), which calls into question the formulas used to determine the stress and strain values, particularly after the start of the non-linearity.
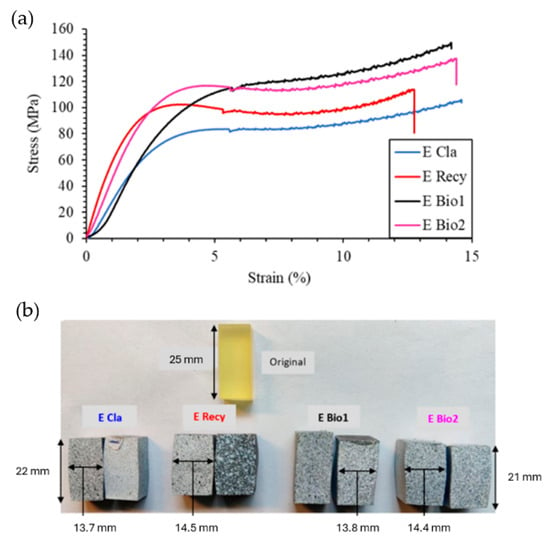
Figure 9.
Comparison of (a) average stress–strain curves and (b) samples after failure for different epoxies.
In the graphs obtained in Figure 9a, failure is identified when a noticeable amount of deformation in the coupons is observed. Figure 9b shows the samples of various epoxies after carrying out compression tests and comparing them with the original sample. It is observed that due to compressive loading, the height of the sample reduces to an average value of 21.5 mm irrespective of the type of epoxy. Due to the decrease in the height, some samples show a bulking phenomenon, i.e., the width of the sample increases at the middle from 12.7 mm to 14.5 mm in E Recy and E Bio2 and 13.8 mm in E Bio1. A few samples also show a shear phenomenon (E Bio1 sample 2). This can also be due to a minute misalignment between the axis of the sample and the loading axis.
For better understanding, bar charts have been plotted (Figure 10) which compare the Young’s modulus (MPa), ultimate tensile strength (MPa), and percentage of elongation obtained during the experimental analysis of the four epoxy–resin systems under tensile, bending, and compression loadings. While the modulus for E Bio2 is highest under tensile loading, that for E Recy is highest under the bending and compression (Figure 10a). It is noted that the compressive Young’s modulus of E Recy and E bio2 is significantly higher than those of the other two epoxies, while the tensile and bending moduli seem to not vary. Hence, E Recy epoxy can withstand higher bending forces which further indicate that it has a higher elongation at failure as seen in Figure 10c. Figure 10b indicates that under the tensile loading, conventional epoxy can withstand higher stress as compared to other epoxies, while E Bio1 and E Bio2 have similar maximum stress. Moreover, under the bending again, E Recy can withstand higher stress as compared to other epoxies and hence results in a higher percent elongation before break (Figure 10c).
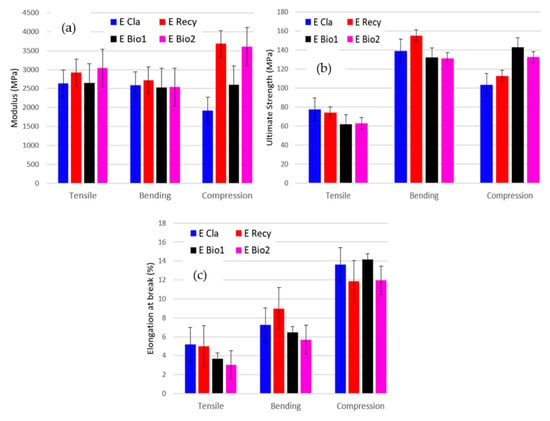
Figure 10.
Comparison of mechanical properties for different resins: (a) modulus; (b) maximum stress; (c) percent elongation at break.
Figure 11 displays a radar plot summarizing the mechanical properties of the epoxies. To adjust the scale, the values on the chart are multiplied by a factor indicated alongside each mechanical property. It is important to note that the radar plot directly compares the absolute values of these properties. When selecting the best material formulation, one should consider the application and its associated main required properties.
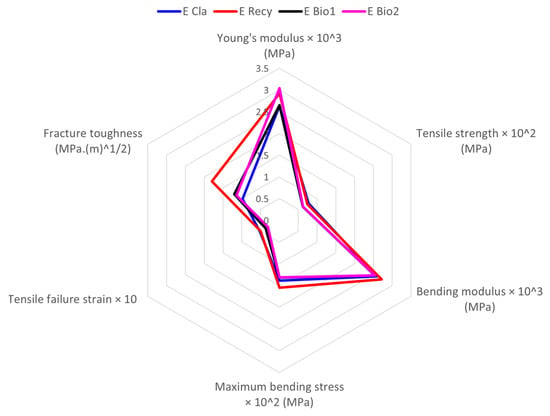
Figure 11.
Radar plot for mechanical behavior of the 4 epoxies.
When comparing the tensile strength, it is observed that the tensile strength for recyclable epoxy E Recy is around 4% less than that of E Cla epoxy. The elastic modulus for E Bio2 is clearly higher than those of the other epoxies. Even though the bending modulus for all the epoxies is close to each other, E Recy has a bending modulus 5% higher than those of the others, which is evident during the tests as well, so it can withstand higher bending stress. E Recy shows the highest percent elongation at break in bending and exhibits a plastic behavior before fracture. It also shows the highest bending maximum stress along with bending modulus. In the fracture toughness test, in the presence of a notch, E Recy epoxy shows promising results. It shows the highest values for the critical stress intensity factor (KIC) and the strain energy release rate (GIC). GIC for E Recy is significantly higher (73%) than that of the E Cla conventional epoxy. These values are important because they determine the behavior of the laminate under impacts and, looking at the values obtained, it can be said that E Recy shows a higher resistance towards impact. Meanwhile, E Bio1 and E Bio2 have comparable values which indicates that the value does not change with respect to the bio-content. For compressive tests, E Bio1 shows the highest maximum stress with the highest percent of elongation before break; the remaining epoxies exhibit plastic behavior under compressive loading as visible from the samples as well as the graphs.
The obtained mechanical results are compared with data of commercially available bio-based epoxy systems experimentally tested from [36] (Table 4). The comparison presented in this table is based on important mechanical parameters like the glass transition temperature, Young’s modulus in tension, tensile strength, and the critical stress intensity factor. It can be observed that the new bio-recyclable epoxy E Recy (5544) and bio-epoxy E Bio1 and E Bio2 (5551 and 5561) proposed by Aditya Birla present a higher glass transition temperature than the others, enabling it to be used in more applications. Young modulus and tensile strength are comparable to the other bio-epoxies, while the fracture toughness is greater than the commercially available bio-epoxies. This presents a significant advantage and increases the scope of application of recyclable bio-epoxies in other domains. A comparison with other bio-based epoxies with the same bio-content can be performed. It can be shown that the studied bio-based epoxy presents better properties as mentioned by previous studies.

Table 4.
Mechanical properties of bio-based epoxy systems compared with commercially available systems [34].
4. Conclusions
Aerospace manufacturers are exploring bio-based alternatives to petroleum-derived epoxies due to growing environmental apprehensions regarding fiber composites. Consequently, a detailed parametric study is carried out on bio-epoxy resin systems to determine their mechanical properties and compare them with a conventional epoxy. In total, four different epoxy resin systems are used for mechanical characterization: one conventional, one recyclable bio-epoxy, and two non-recyclable bio-epoxies with varying bio-content. To ensure the reliability of the mechanical characterization results, at least four coupons are used for each test and each type of epoxy. All tests (tension, compression, bending, and toughness) are performed according to standards. Prior to experimentation, the specimens are placed in an oven at 100 °C for 24 h to eliminate any moisture content.
Based on all the tests performed and compared with commercially available bio-epoxies, it can be concluded that the recyclable bio-epoxy 5544 (E Recy), which contains 27% bio-content, provides promising results. Finally, this study marks the initial step towards material characterization of bio-epoxy resins, both recyclable and non-recyclable, within the aerospace domain. By establishing fundamental properties and behaviors, this study lays the groundwork for further investigations. Future research will extend beyond characterization to include in-depth moisture studies, crucial for aerospace applications, as well as comprehensive testing of composite laminates fabricated using recyclable epoxies. With superior mechanical properties, especially in fracture toughness, studies can be performed on the damage tolerance of the composite laminate. This holistic approach will contribute to advancing our understanding and utilization of sustainable materials in aerospace engineering. As composites are inherently brittle materials, the impact strength, especially the loss of strength in compression, poses a critical dimensioning concern for aerostructures. Therefore, studies can be conducted to assess the damage tolerance of composite laminates. This can be achieved through low-velocity impact tests and compression-after-impact (CAI) tests, specifically utilizing the 5544 recyclable epoxy resin. These tests will provide valuable insights into the performance and durability of composite materials under real-world loading conditions, aiding in the design and optimization of aerospace structures for enhanced safety and reliability.
Author Contributions
Conceptualization, L.M., C.B. and K.W.; methodology, L.M., C.B. and K.W.; validation, L.M., P.G., C.B. and K.W.; formal analysis, P.G. and C.B.; investigation, P.G. and C.B.; resources, C.B. and K.W.; data curation, L.M., P.G., C.B. and K.W.; writing—original draft preparation, L.M. and P.G.; writing—review and editing, L.M., P.G., C.B. and K.W.; visualization, P.G. and C.B.; supervision, L.M. and C.B.; project administration, L.M. and K.W. All authors have read and agreed to the published version of the manuscript.
Funding
This research received no external funding.
Data Availability Statement
Additional data are unavailable due to privacy restrictions.
Acknowledgments
The authors would like to acknowledge the contributions made by Aditya Birla Chemicals (Thailand) Limited (Advanced Materials) and for providing bio-epoxy resin systems to carry out the study towards sustainable aviation.
Conflicts of Interest
The authors declare no conflicts of interest.
References
- Argon, A.S.; Cohen, R.E.; Mower, T.M. Mechanisms of Toughening Brittle Polymers. Mater. Sci. Eng. A 1994, 176, 79–90. [Google Scholar] [CrossRef]
- Domun, N.; Hadavinia, H.; Zhang, T.; Sainsbury, T.; Liaghat, G.H.; Vahid, S. Improving the Fracture Toughness and The Strength of Epoxy Using Nanomaterials—A Review of The Current Status. Nanoscale 2015, 7, 10294–10329. [Google Scholar] [CrossRef] [PubMed]
- Gojny, F.H.; Wichmann, M.H.G.; Fiedler, B.; Schulte, K. Influence of Different Carbon Nanotubes on The Mechanical Properties of Epoxy Matrix Composites—A Comparative Study. Compos. Sci. Technol. 2005, 65, 2300–2313. [Google Scholar] [CrossRef]
- Rosso, P.; Ye, L.; Friedrich, K.; Sprenger, S. A Toughened Epoxy Resin by Silica Nanoparticle Reinforcement. J. Appl. Polym. Sci. 2006, 100, 1849–1855. [Google Scholar] [CrossRef]
- Kamar, N.T.; Drzal, L.T.; Lee, A.; Askeland, P. Nanoscale Toughening of Carbon Fiber Reinforced/Epoxy Polymer Composites (CFRPs) Using A Triblock Copolymer. Polymer 2017, 111, 36–47. [Google Scholar] [CrossRef]
- Hull, D. A Unified Approach to Progressive Crushing of Fibre-Reinforced Composite Tubes. Compos. Sci. Technol. 1991, 40, 377–421. [Google Scholar] [CrossRef]
- Di Mauro, C.; Tran, T.-N.; Graillot, A.; Mija, A. Enhancing the Recyclability of a Vegetable Oil-Based Epoxy Thermoset Through Initiator Influence. ACS Sustain. Chem. Eng. 2020, 8, 7690–7700. [Google Scholar] [CrossRef]
- Walley, S.M.; Field, J.E. Strain Rate Sensitivity of Polymers in Compression from Low to High Rates. DYMAT J. 1994, 1, 211–227. [Google Scholar]
- Yekani Fard, M.; Liu, Y.; Chattopadhyay, A. A Simplified Approach for Flexural Behavior of Epoxy Resin Materials. J. Strain Anal. Eng. Des. 2012, 47, 18–31. [Google Scholar] [CrossRef]
- Gilat, A.; Goldberg, R.K.; Roberts, G.D. Strain Rate Sensitivity of Epoxy Resin in Tensile and Shear Loading. J. Aerosp. Eng. 2007, 20, 75–89. [Google Scholar] [CrossRef]
- Littell, J.D.; Ruggeri, C.R.; Goldberg, R.K.; Roberts, G.D.; Arnold, W.A.; Binienda, W.K. Measurement of Epoxy Resin Tension, Compression, and Shear Stress–Strain Curves over a Wide Range of Strain Rates Using Small Test Specimens. J. Aerosp. Eng. 2008, 21, 162–173. [Google Scholar] [CrossRef]
- Jordan, J.L.; Foley, J.R.; Siviour, C.R. Mechanical Properties of Epon 826/DEA Epoxy. Mech. Time-Depend. Mater. 2008, 12, 249–272. [Google Scholar] [CrossRef]
- Abdellaoui, H.; Raji, M.; Bouhfid, R.; el kacem Qaiss, A. Investigation of The Deformation Behavior of Epoxy-Based Composite Materials. In Failure Analysis in Biocomposites, Fibre-Reinforced Composites and Hybrid Composites; Woodhead Publishing: Sawston, UK, 2019; pp. 29–49. [Google Scholar] [CrossRef]
- Chen, W.; Lu, F.; Cheng, M. Tension And Compression Tests of Two Polymers Under Quasi-Static and Dynamic Loading. Polym. Test. 2002, 21, 113–121. [Google Scholar] [CrossRef]
- Fard, M.Y.; Liu, Y.; Chattopadhyay, A. Analytical Solution for Flexural Response of Epoxy Resin Materials. J. Aerosp. Eng. 2012, 25, 395–408. [Google Scholar] [CrossRef]
- Allaer, K.; De Baere, I.; Van Paepegem, W.; Degrieck, J. Direct Fracture Toughness Determination of a Ductile Epoxy Polymer from Digital Image Correlation Measurements on a Single Edge Notched Bending Sample. Polym. Test. 2015, 42, 199–207. [Google Scholar] [CrossRef]
- Shirodkar, N.; Cheng, S.; Seidel, G.D. Enhancement of Mode I Fracture Toughness Properties of Epoxy Reinforced with Graphene Nanoplatelets and Carbon Nanotubes. Compos. Part B 2021, 224, 109177. [Google Scholar] [CrossRef]
- Rahmani, H.; Najafi, S.H.M.; Ashori, A. Mechanical Performance of Epoxy/Carbon Fiber Laminated Composites. J. Reinf. Plast. Compos. 2014, 33, 733–740. [Google Scholar] [CrossRef]
- Liu, T.; Hao, C.; Wang, L.; Li, Y.; Liu, W.; Xin, J.; Zhang, J. A Self-Healable High Glass Transition Temperature Bioepoxy Material Based on Vitrimer Chemistry. Macromolecules 2018, 51, 5577–5585. [Google Scholar] [CrossRef]
- Yu, K.; Taynton, P.; Zhang, W.; Dunn, M.L.; Qi, H.J. Reprocessing and Recycling of Thermosetting Polymers Based on Bond Exchange Reactions. RSC Adv. 2014, 4, 10108–10117. [Google Scholar] [CrossRef]
- Baruah, R.; Kumar, A.; Ujjwal, R.R.; Kedia, S.; Ranjan, A.; Ojha, U. Recyclable Thermosets Based on Dynamic Amidation and Aza-Michael Addition Chemistry. Macromolecules 2016, 49, 7814–7824. [Google Scholar] [CrossRef]
- Lu, L.; Pan, J.; Li, G. Recyclable High Performance Epoxy Based on Transesterification Reaction. J. Mater. Chem. A 2017, 5, 21505–21513. [Google Scholar] [CrossRef]
- Azcune, I.; Odriozola, I. Aromatic Disulfide Crosslinks in Polymer Systems: Self-Healing, Reprocessability, Recyclability and More. Eur. Polym. J. 2016, 84, 147–160. [Google Scholar] [CrossRef]
- Cicala, G.; Pergolizzi, E.; Piscopo, F.; Carbone, D.; Recca, G. Hybrid Composites Manufactured by Resin Infusion with a Fully Recyclable Bioepoxy Resin. Compos. Part B 2018, 132, 69–76. [Google Scholar] [CrossRef]
- Ruiz de Luzuriaga, A.; Martin, R.; Markaide, N.; Rekondo, A.; Cabañero, G.; Rodríguez, J.; Odriozola, I. Epoxy resin with exchangeable disulfide crosslinks to obtain reprocessable, repairable and recyclable fiber-reinforced thermoset composites. Mater. Horiz. 2016, 3, 241–247. [Google Scholar] [CrossRef]
- Cicala, G.; Mannino, S.; La Rosa, A.D.; Banatao, D.R.; Pastine, S.J.; Kosinski, S.T.; Scarpa, F. Hybrid biobased recyclable epoxy composites for mass production. Polym. Compos. 2018, 39, E2217–E2225. [Google Scholar] [CrossRef]
- La Rosa, A.D.; Blanco, I.; Banatao, D.R.; Pastine, S.J.; Björklund, A.; Cicala, G. Innovative Chemical Process for Recycling Thermosets Cured with Recyclamines® by Converting Bio-Epoxy Composites in Reusable Thermoplastic—An LCA Study. Materials 2018, 11, 353. [Google Scholar] [CrossRef] [PubMed]
- Auvergne, R.; Caillol, S.; David, G.; Boutevin, B.; Pascault, J.-P. Biobased Thermosetting Epoxy: Present and Future. Chem. Rev. 2014, 114, 1082–1115. [Google Scholar] [CrossRef] [PubMed]
- Mashouf Roudsari, G.; Mohanty, A.K.; Misra, M. Green Approaches to Engineer Tough Biobased Epoxies: A Review. ACS Sustain. Chem. Eng. 2017, 5, 9528–9541. [Google Scholar] [CrossRef]
- Mustapha, R.; Rahmat, A.R.; Majid, R.A.; Mustapha, S.N.H. Vegetable Oil-Based Epoxy Resins and Their Composites with Bio-Based Hardener: A Short Review. Polym.-Plast. Technol. Mater. 2019, 58, 1311–1326. [Google Scholar] [CrossRef]
- Johnson, R.D.J.; Arumugaprabu, V.; Rajasekar, E.; Santhosh, G.; Saravanakumar, M. Mechanical Property Studies on Environmentally Friendly Bio Epoxy Resin. Mater. Today Proc. 2018, 5, 6815–6820. [Google Scholar] [CrossRef]
- Vinod, A.; Sanjay, M.R.; Siengchin, S. Fatigue and Thermo-Mechanical Properties of Chemically Treated Morinda Citrifolia Fiber-Reinforced Bio-Epoxy Composite: A Sustainable Green Material for Cleaner Production. J. Clean. Prod. 2021, 326, 129411. [Google Scholar] [CrossRef]
- Mattar, N.; Hübner, F.; Demleitner, M.; Brückner, A.; Langlois, V.; Renard, E.; Ruckdäschel, H.; Anda, A.R. Multiscale Characterization of Creep and Fatigue Crack Propagation Resistance of Fully Bio-Based Epoxy-Amine Resins. ACS Appl. Polym. Mater. 2021, 3, 5134–5144. [Google Scholar] [CrossRef]
- Terry, J.S.; Taylor, A.C. The Properties and Suitability of Commercial Bio-Based Epoxies for Use in Fiber-Reinforced Composites. J. Appl. Polym. Sci. 2021, 138, 50417. [Google Scholar] [CrossRef]
- ASTM D6866; Standard Test Methods for Determining the Biobased Content of Solid, Liquid, and Gaseous Samples Using Radiocarbon Analysis. ASTM International: West Conshohocken, PA, USA, 2024.
- ISO 11357-2; Plastics—Differential Scanning Calorimetry (DSC)—Part 2: Determination of Glass Transition Temperature and Step Height. International Organization for Standardization: Geneva, Switzerland, 2020.
- ASTM D638-14; Standard Test Method for Tensile Properties of Plastics. ASTM International: West Conshohocken, PA, USA, 2014. [CrossRef]
- ISO 178; Plastics—Determination of Flexural Properties. Bristish Standards Institution (BSI): London, UK, 2019.
- ASTM D5045-14; Standard Test Methods for Plane-Strain Fracture Toughness and Strain Energy Release Rate of Plastic Materials. ASTM International: West Conshohocken, PA, USA, 2014. [CrossRef]
- Mishra, K.; Brassart, L.; Singh, A. Rate Dependent Fracture Behavior of Highly Cross-Linked Epoxy Resin. Eng. Fail. Anal. 2022, 140, 106558. [Google Scholar] [CrossRef]
- ASTM D695-15; Standard Test Method for Compressive Properties of Rigid Plastics. ASTM International: West Conshohocken, PA, USA, 2015. [CrossRef]
- Raponi, O.; Raponi, R.; Barbana, G.; DiBenedetto, R.; Junior, A. Development of a Simple Dielectric Analysis Module for Online Cure Monitoring of a Commercial Epoxy Resin Formulation. Mater. Res. 2017, 20, 291–297. [Google Scholar] [CrossRef][Green Version]
- Ciardiello, R.; Benelli, A.; Paolino, D.S. Static and Impact Properties of Flax-Reinforced Polymers Prepared with Conventional Epoxy and Sustainable Resins. Polymers 2024, 16, 190. [Google Scholar] [CrossRef]
- Yukun, L.; Kai, H.; Hongjun, Y.; Liulei, H.; Licheng, G. Experimentally Validated Phase-Field Fracture Modeling of Epoxy Resins. Compos. Struct. 2022, 279, 114806. [Google Scholar] [CrossRef]
- Goldberg, O.; Greenfeld, I.; Wagner, D. Efficient Toughening of Short-Fiber Composites Using Weak Magnetic Fields. Materials 2020, 13, 2415. [Google Scholar] [CrossRef]
Disclaimer/Publisher’s Note: The statements, opinions and data contained in all publications are solely those of the individual author(s) and contributor(s) and not of MDPI and/or the editor(s). MDPI and/or the editor(s) disclaim responsibility for any injury to people or property resulting from any ideas, methods, instructions or products referred to in the content. |
© 2024 by the authors. Licensee MDPI, Basel, Switzerland. This article is an open access article distributed under the terms and conditions of the Creative Commons Attribution (CC BY) license (https://creativecommons.org/licenses/by/4.0/).