Article

Chemical and Thermal Analysis of Fly Ash-Reinforced Aluminum Matrix Composites (AMCs)

by
Siti Syazwani Nordin
,
Ervina Efzan Mhd Noor
* and
Palanisamy Chockalingam
Faculty of Engineering and Technology, Multimedia University, Ayer Keroh, Malacca 75450, Malaysia
*
Author to whom correspondence should be addressed.
J. Compos. Sci. 2024, 8(5), 170; https://doi.org/10.3390/jcs8050170
Submission received: 20 November 2023 / Revised: 9 December 2023 / Accepted: 28 December 2023 / Published: 2 May 2024
(This article belongs to the Section Composites Manufacturing and Processing)

Abstract

:
Fly ash has been utilized as a reinforcing material in the production of aluminum matrix composites, and in this investigation, Al-Si (LM6) fly ash composites were fabricated using the compocasting method. Various compositions of fly ash were incorporated into the samples (4, 5 and 6 wt%), and the preparation temperature ranged from 560 to 800 °C. This study investigated the thermal (CTE and DTA) and chemical properties (XRD) of fly ash reinforcement and the aluminum melt in the composites. The results revealed that composites with 5 wt% of fly ash exhibited the lowest CTE value compared to those with 4 and 6 wt%. This observation was corroborated by XRD analysis, indicating a reaction between the fly ash particles and the aluminum melt. However, the DTA analysis did not find a significant impact of the addition of fly ash on the melting temperature of the prepared composites. In contrast, this study identified and investigated the existence of reaction effects between the fly ash particles and the aluminum melt.

1. Introduction

Fly ash, a by-product of coal combustion, is considered an environmental pollutant when not appropriately disposed of [1]. This waste material is abundant and poses a risk of environmental pollution if not handled properly. Instead of contributing to pollution through disposal, extensive research has been conducted to repurpose this waste into valuable materials. Various studies have explored the chemical composition of fly ash particles and their potential applications in industries such as construction, automotive, and other heavy-duty applications. Fly ash mainly contains SiO2, Al2O3, Fe2O3 and oxides such as Mg, Ca and P, including lesser amounts of particles such as crystalline-phase quartz, mullite and hematite [2,3]. Recently, fly ash particles have been used as a reinforcement material in the fabrication of aluminum matrix composites due to their chemical composition [4], light weight [1,5,6] and low cost [1]. The usage of fly ash particles is reasonable and economical for replacing the conventional ceramic material (Al2O3, SiC, TiC, etc.) reinforcement. Multiple studies confirm that the incorporation of fly ash reinforcement enhances the strength, stiffness, damping capacity, wear resistance and thermal resistance, simultaneously reducing the density of the aluminum composite [2,7,8].
Researchers have employed various methods, including powder metallurgy, in their efforts to manufacture aluminum fly ash composites [4,9], liquid casting [1,4,10], hot pressing [6], pressure infiltration [5] and others. According to [4], the mechanical, thermal, physical and chemical behavior of the aluminum composites were influenced by their processing method. The successful incorporation of reinforcement particles into the aluminum matrix [11,12] and obtaining good bonding among the reinforcement particles and matrix [12,13,14] are required in the enhancement of aluminum matrix composites. Thus, a suitable fabrication method is essential to achieve the requirement. Because of its simplicity, ease of adoption and suitability for mass production, the liquid casting method is preferred over other methods. In this study, an effort is made to produce an Al-Si (LM6) alloy reinforced with fly ash particles using the compocasting method. The investigation focuses on the chemical reactions between fly ash reinforcement and matrix material, examining their impact on the thermal properties of the composites.

2. Methodology

The matrix material employed is an aluminum alloy (LM6) sourced from Foundry Equipment Supply, Selangor, Malaysia, while reinforcement material consists of fly ash particles obtained from Jimah Power Plant in Port Dickson, Negeri Sembilan, Malaysia. Fly ash particles are sieved to 45 µm to obtain smaller particle sizes. Aravindan et al. [15] stated that a smaller particle size of the reinforcement leads to improved properties of the composite. Subsequently, the fly ash used in this research undergoes both particle size analysis and chemical composition (XRF) analysis to verify the average particle size (<45 µm) and the chemical compounds present in the utilized fly ash. The chemical compositions of LM6 and fly ash are detailed in Table 1 and Table 2. Figure 1 illustrates the phase analysis of fly ash particles conducted through XRD analysis. Prior to its incorporation into the aluminum slurry, the fly ash undergoes pre-heating at 600 °C for 3 h to eliminate impurities and moisture content. The proportions of fly ash utilized by weight are 4%, 5% and 6%.
LM6 ingots were kept in a graphite crucible and subjected to heating in an electric furnace at 800 °C over a period of 2 h. Subsequently, the temperature of the aluminum slurry was decreased and sustained at 600 °C, reaching a semi-solid state. A measured quantity of fly ash particles was then introduced into the semi-solid aluminum matrix. The semi-solid mixture underwent simultaneous stirring using a mechanical stirrer powered by an electric motor operating at 300 rpm (Figure 2). Stirring persisted until complete integration of all fly ash particles into the semi-solid aluminum matrix. This mechanical stirring process was employed to ensure a uniform distribution of fly ash particles within the aluminum matrix. Subsequently, the semi-solid aluminum composite was poured into a pre-heated mold at room temperature. The mold had been pre-heated in advance to prevent temperature shock to the aluminum composite during the pouring process. The pouring temperature was maintained slightly higher than the casting temperature to improve the fluidity of the slurry.
Samples for coefficient of thermal expansion (CTE), differential thermal analysis (DTA) and phase analysis (XRD) characterization were derived from the castings. These samples underwent mechanical grinding and polishing using standard metallographic techniques to attain a cylindrical shape (10 mm × 15 mm) (length × diameter) for CTE analysis. The alteration in dimension of the sample before and after exposure to heat is shown in Figure 3. Additionally, other samples were subjected to mechanical polishing and etching (Keller’s Reagent) for XRD analysis.
T is the change in temperature, l o is the original length of sample before exposure to heat, d o is the original diameter of the sample before exposure to heat, l f is the final length of sample during exposure to heat, d f is the final diameter of the sample during exposure to heat, and T is the change in temperature ( T o T f ) . The change in length with temperature for a solid material is stated as follows:
l f l 0 l 0 = α 1 T f T 0 l f l 0 l 0 = α 1 T f T 0 α 1 = 1 l ( d l d T )
where l0 and lf are the original and final lengths with the temperature change from T0 to Tf, respectively. The parameter α1 CTE has units of reciprocal temperature (K − 1) such as μm/m·K or 10–6/K.

3. Results and Discussion

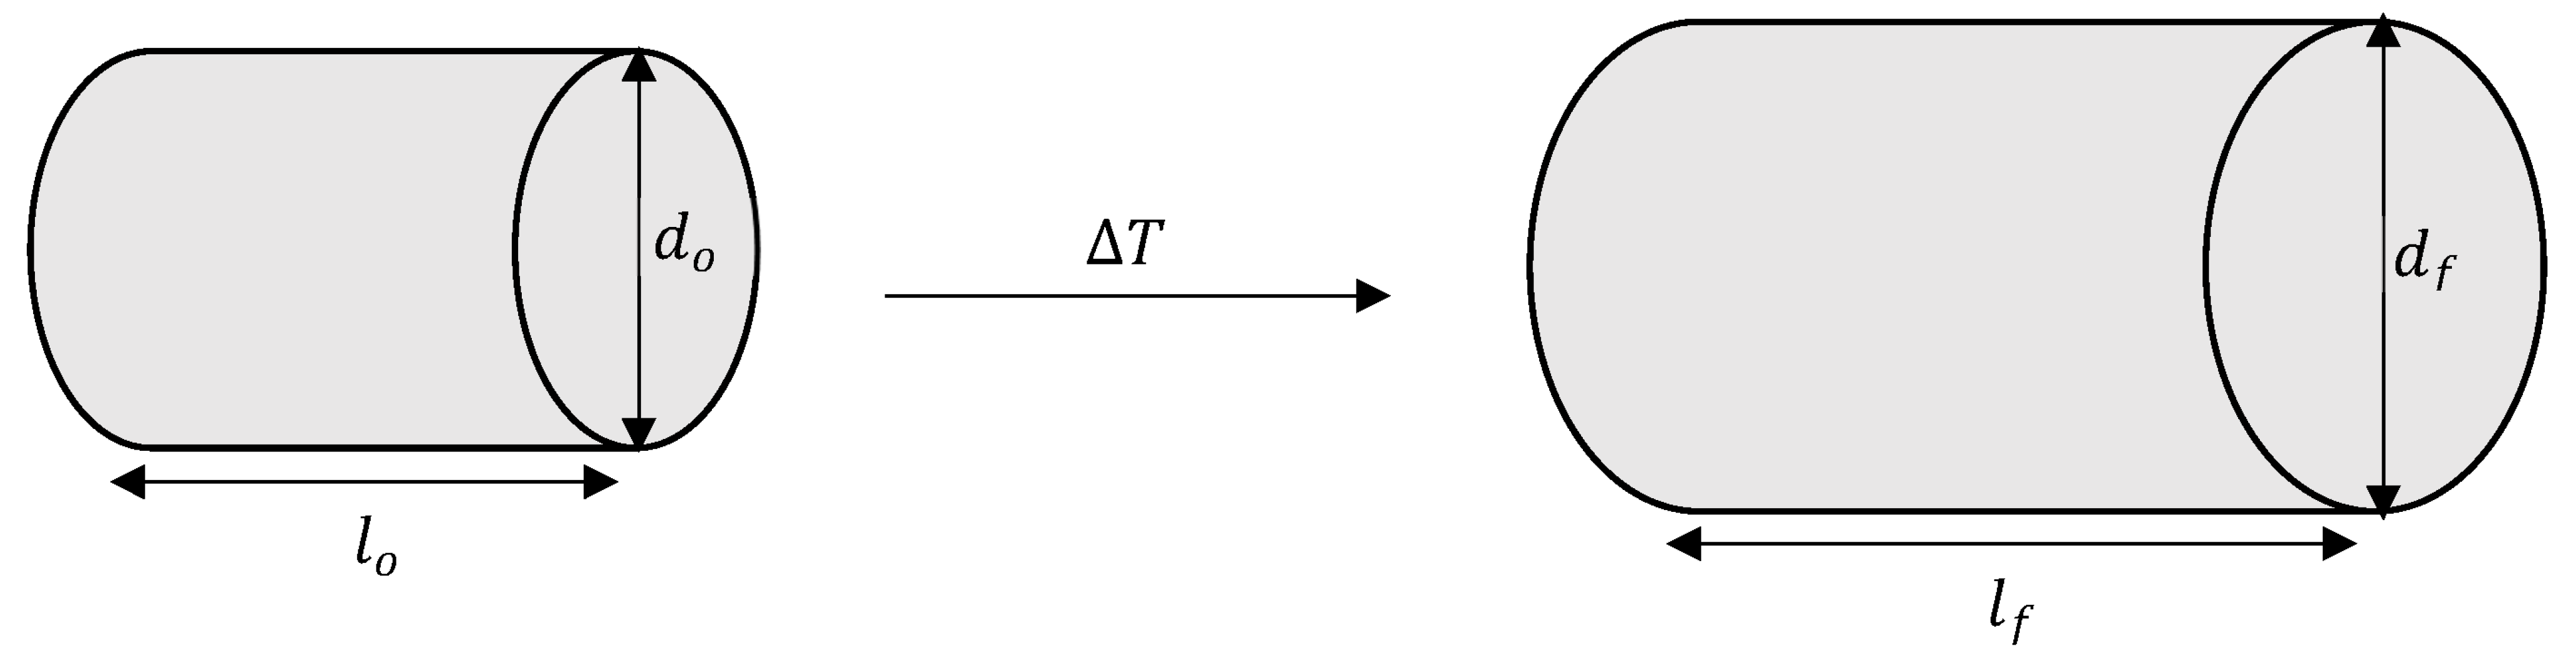
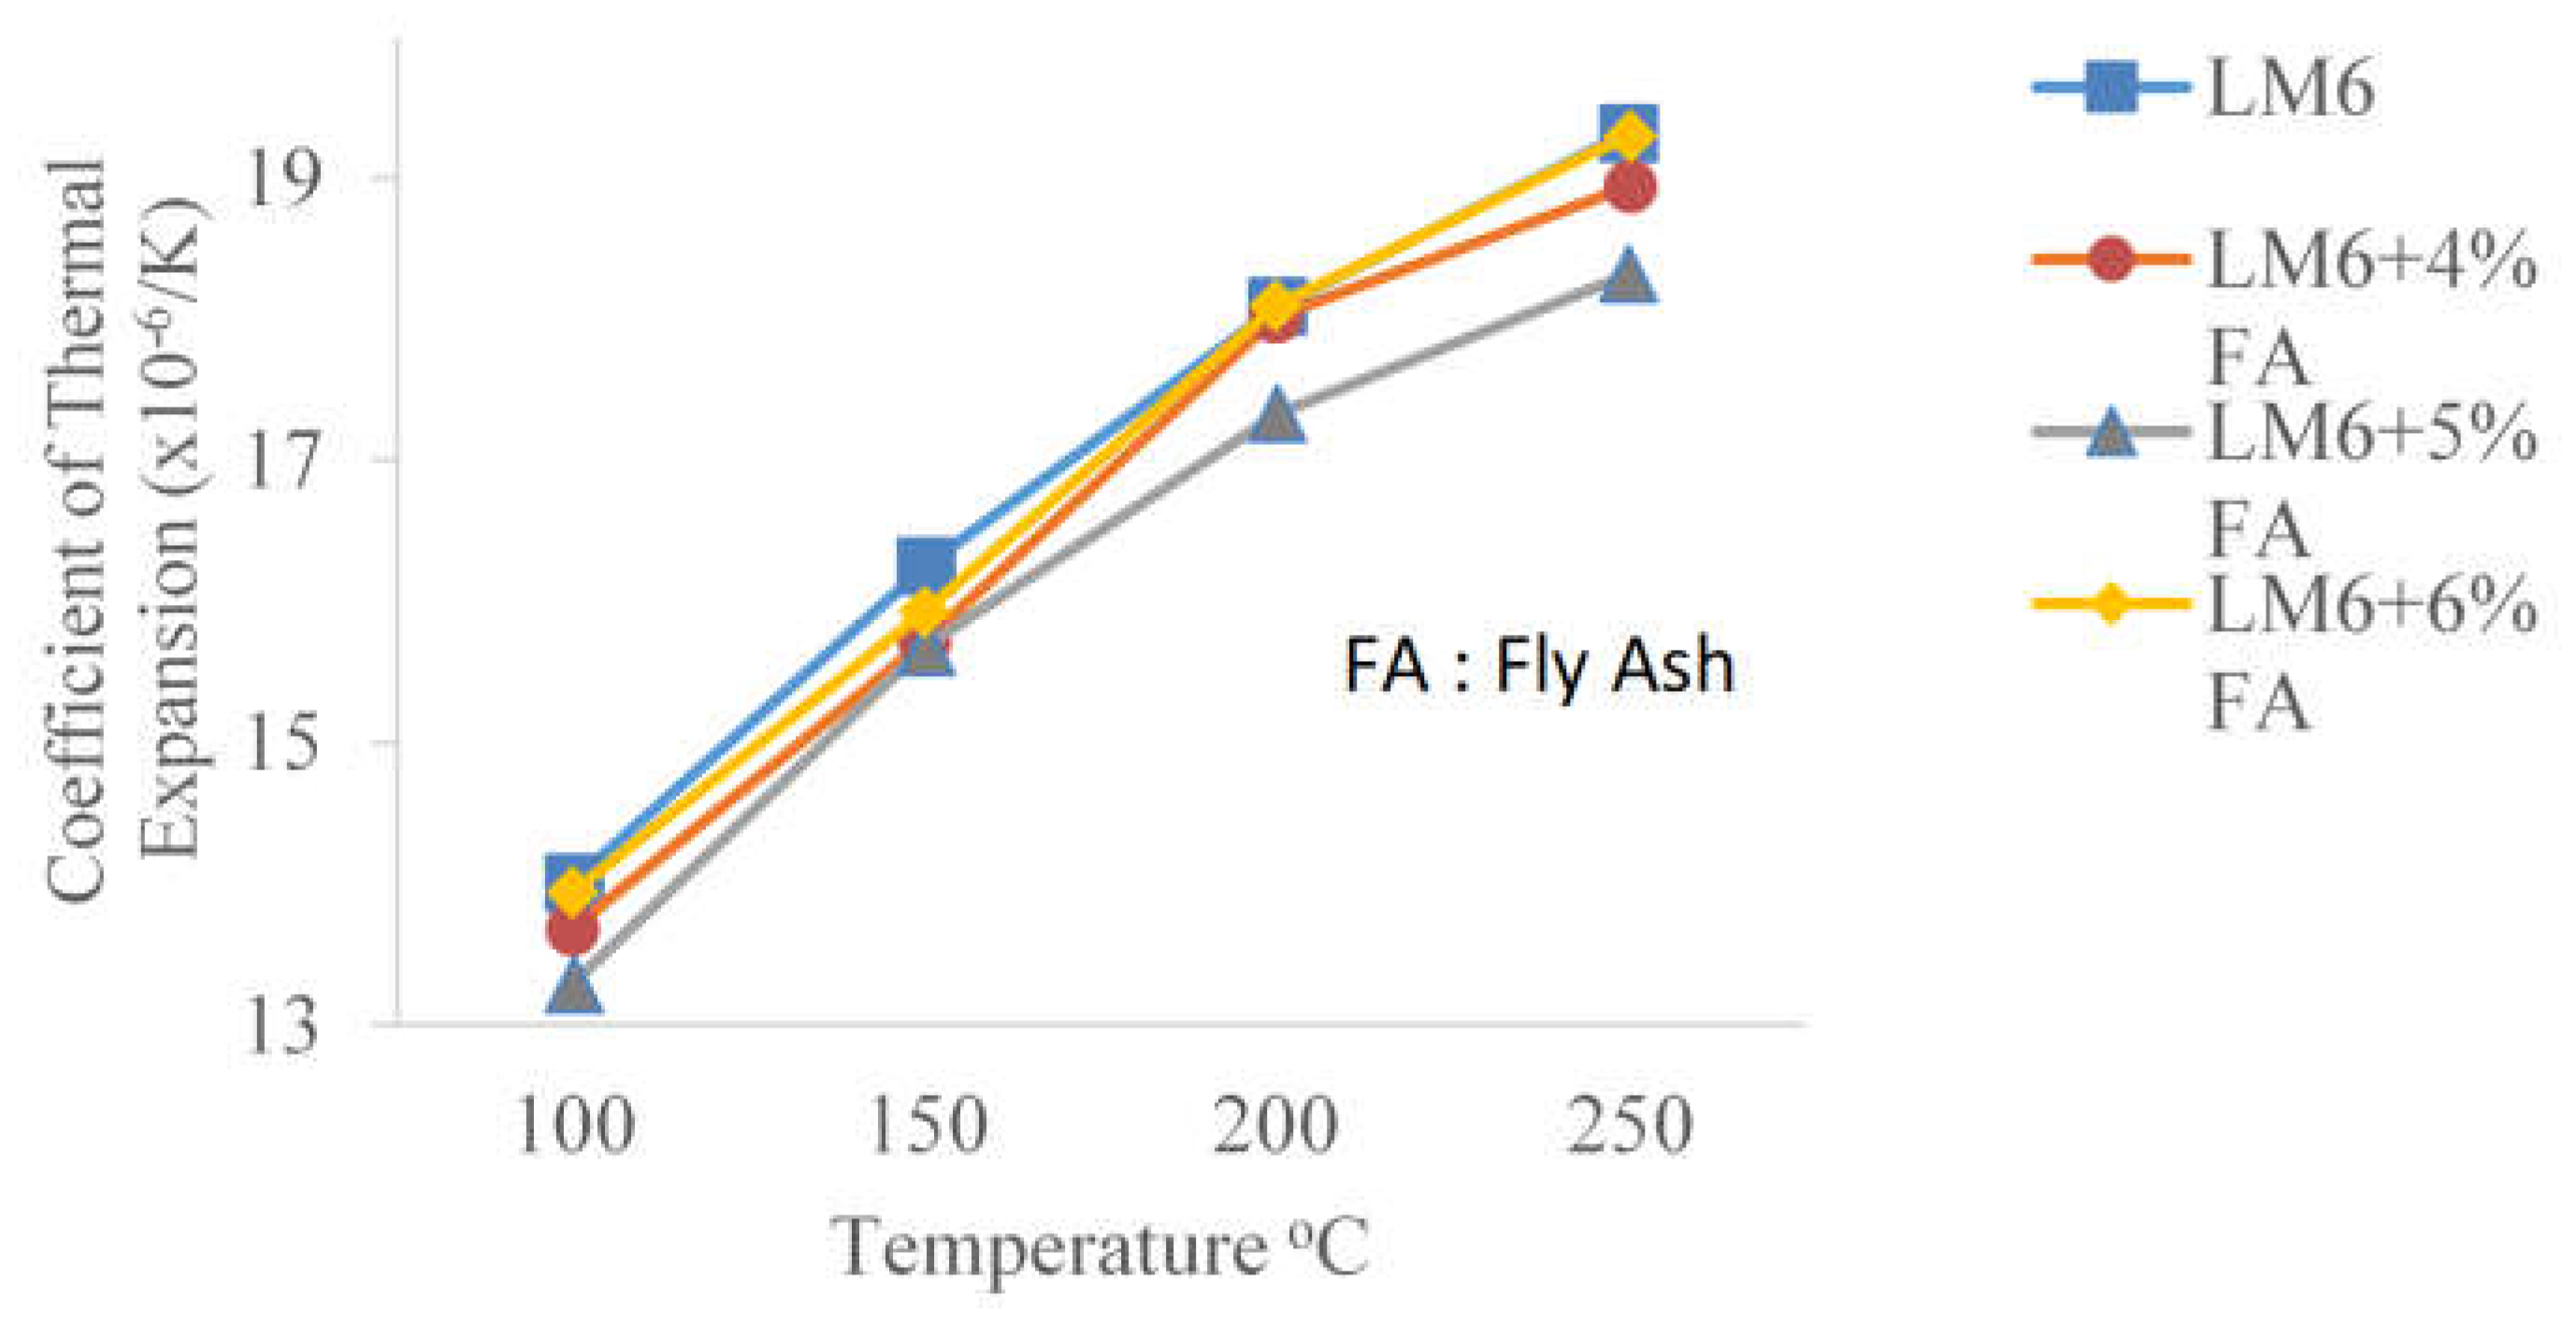
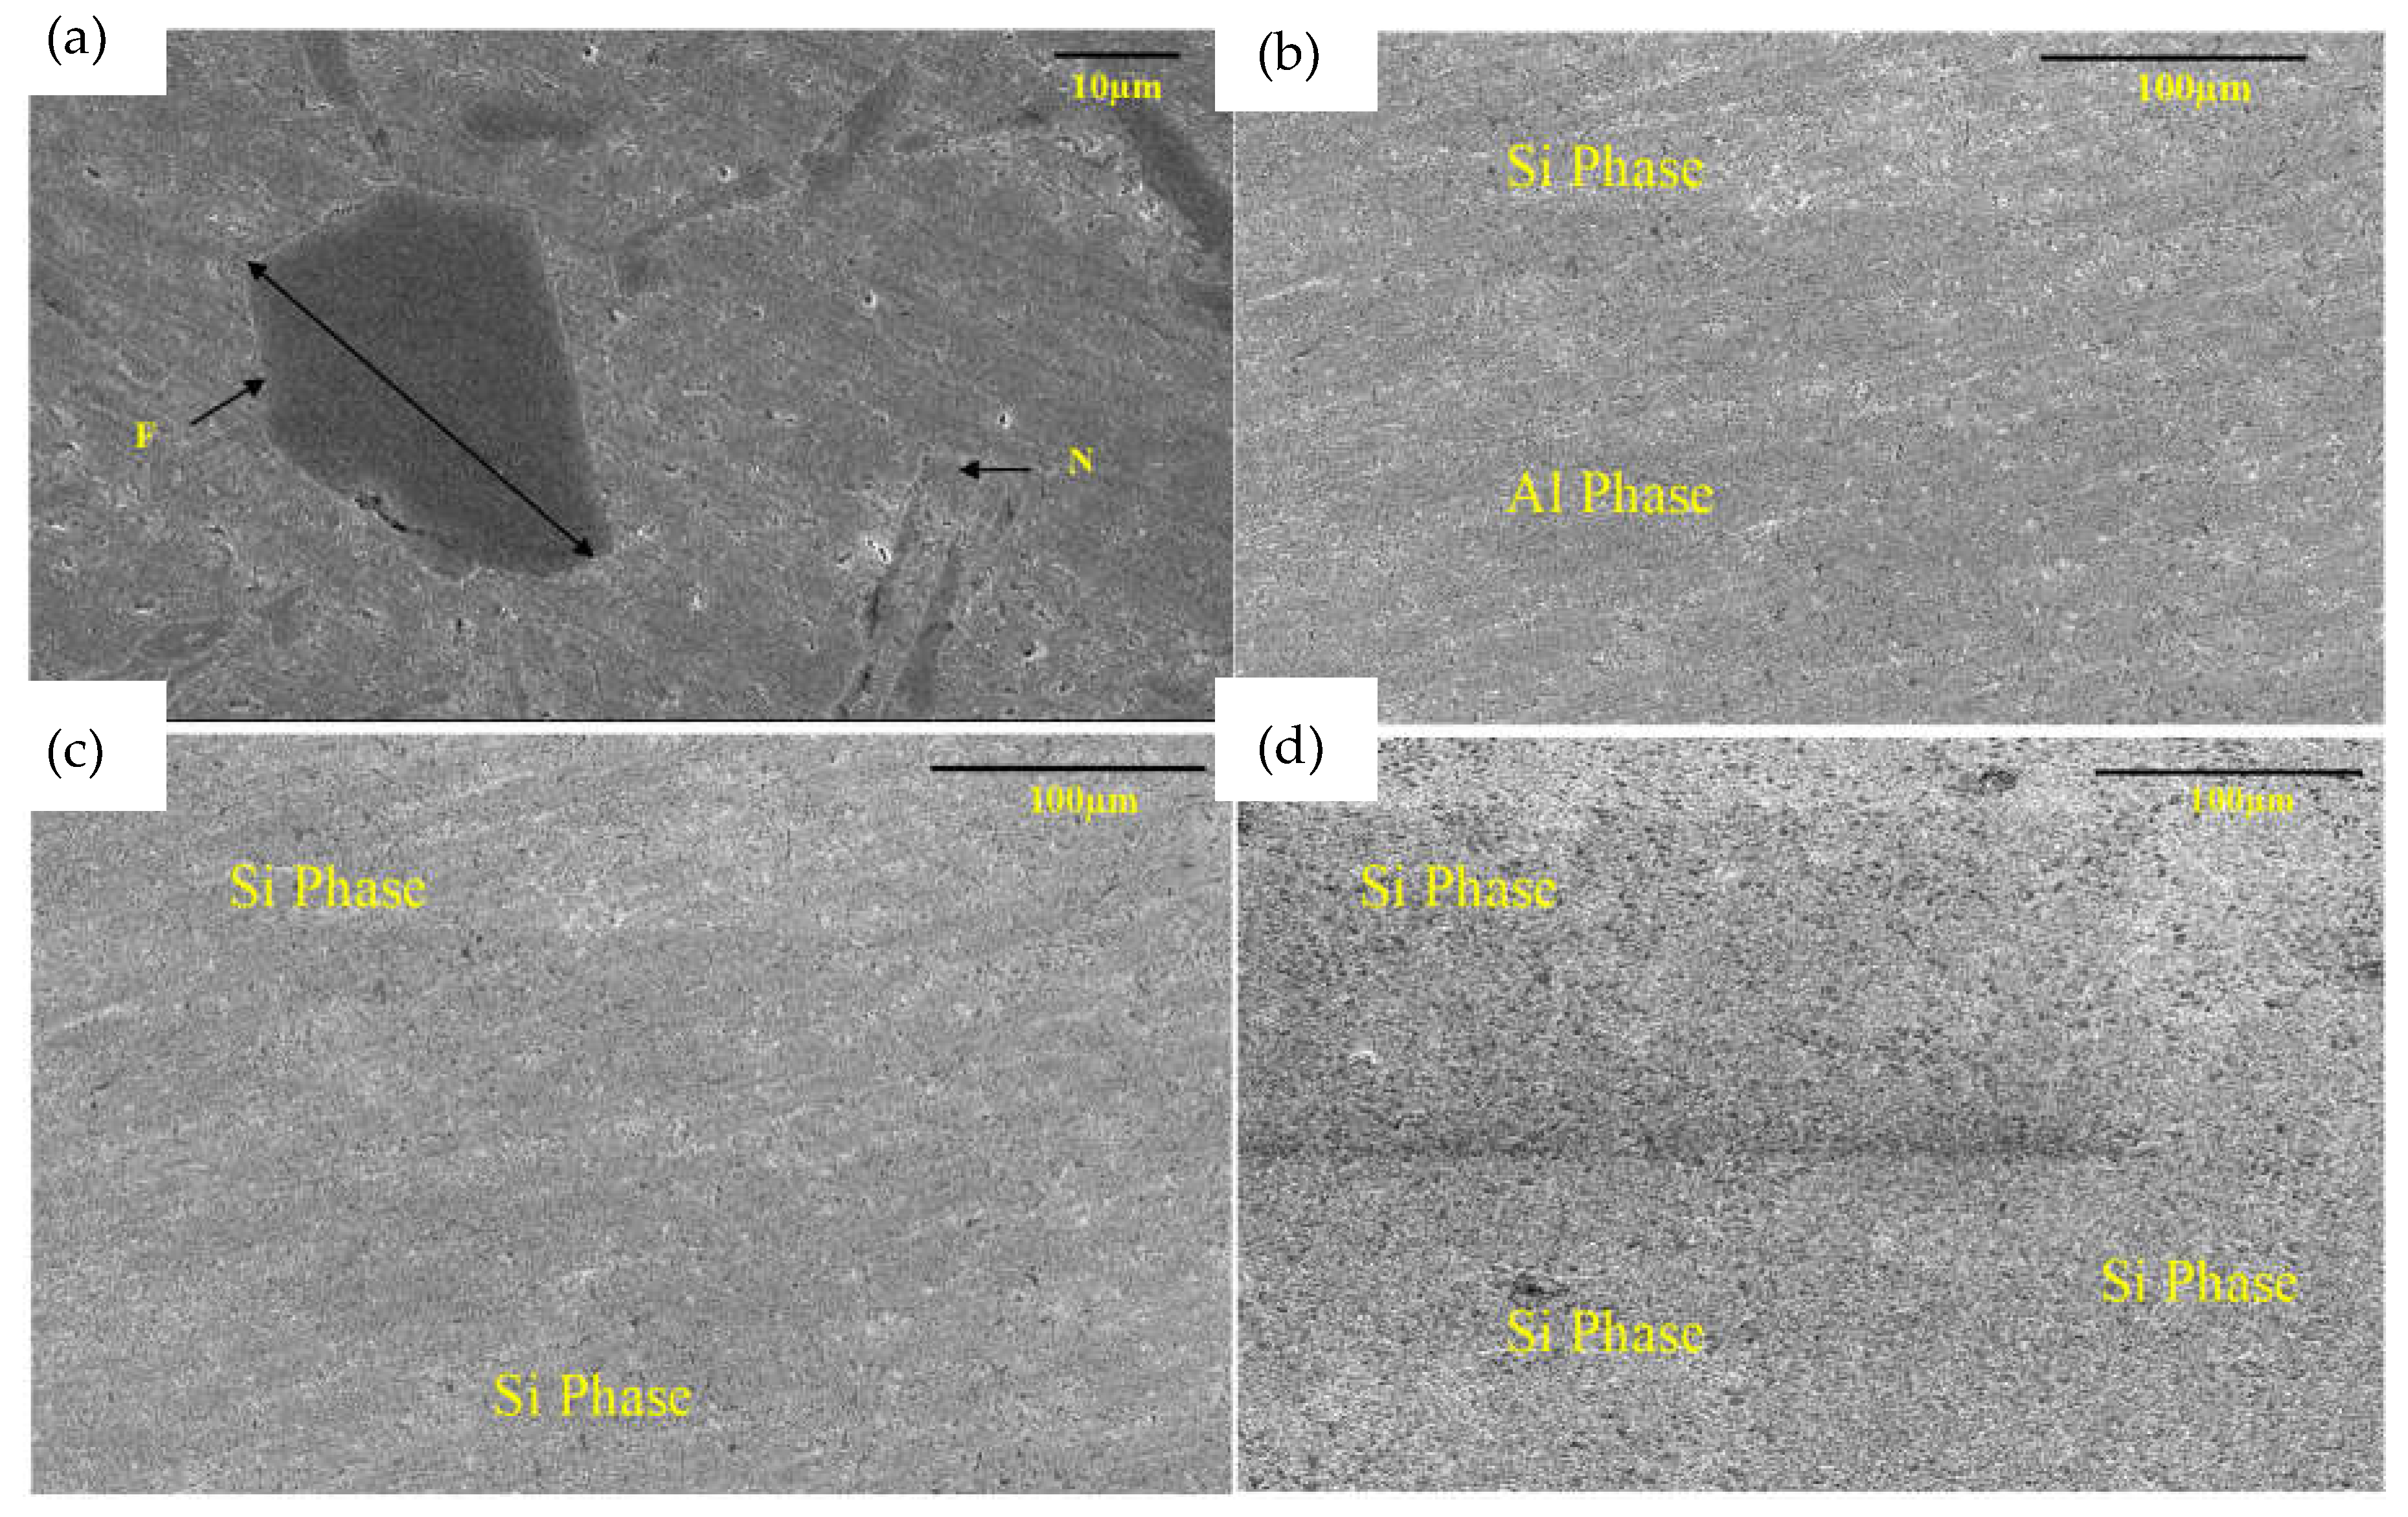
3.1. Thermal Analysis of Pure LM6 and Fabricated Aluminum Matrix Composites (AMCs) Using the Coefficient of Thermal Expansion

The coefficient of thermal expansion (CTE) is a key material property, especially when a composite structure works in a temperature-changing environment. Figure 4 presents the analyzed results of CTE of LM6 and AMCs performed in the temperature range between 25 and 250 °C.
Based on Figure 4, the CTEs of LM6 and AMCs decreased as the amount of fly ash particles reinforced increased from 4 to 6 wt%. This indicates that introducing a high amount of fly ash particles to the Al-Si-based AMCs is beneficial to dimensional stability. This is due to the presence of ceramic compounds (SiO2, Al2O3, etc.) in fly ash particles, which led to a reduction in the temperature sensitivity of the fabricated AMCs, hence improving their dimensional stability. This finding aligns with [15] conclusion that the temperature sensitivity of aluminum diminishes when micro- and nano-sized ceramic reinforcements are present. This is attributed to the fact that, at a constant volume percent, the reduced distance between micro- and nano-sized ceramic particles contributes to this effect.
In accordance with thermodynamic principles, SiO2 and Fe2O3 in fly ash particles have the potential to react with molten Al, yielding Al2O3. Al2O3 possesses elevated mechanical and thermal properties, thereby enhancing the overall characteristics of the manufactured aluminum fly ash composites. Moreover, it also benefits the dimensional stability of the composites, which results in a lower CTE being obtained. Fly ash particles decompose progressively and release Si and Fe into the Al melt during the reaction. Meanwhile, the Si and Fe elements were able to form intermetallic compounds with the Al and appear as the second-phase precipitates in the castings during the solidifications that occurred. These results were found by [16]. The reactions are shown in Equation (2) and (3) below:
2 A l ( l ) + 3 2 S i O 2 ( s ) 3 2 S i ( s ) + A l 2 O 3 ( s )
2 A l ( l ) + 2 F e 2 O 3 ( s ) 2 F e ( s ) + A l 2 O 3 ( s )
Based on Figure 4, the CTE of LM6 at 100, 150, 200 and 250 °C were 14.01, 16.25, 18.09 and 19.32 × 10⁻⁶/K, respectively. However, the CTEs of pure aluminum and Al-Si alloys at 20 to 202 °C are 25.3 and 24.3 × 10⁻⁶/K, which is higher than the measured CTE. Upon the addition of Si as the alloying element of Al-Si alloy, the CTE of the alloy has decreased by about 29% compared to pure aluminum. In this research, the LM6 was reinforced with fly ash particles as the reinforcement. Based on the chemical composition of fly ash (Table 2 and Figure 1), the fly ash particles contained a high composition of SiO2 and other oxide elements. The decreases in the CTE value of fabricated AMCs might have happened due to the existence of the oxide content in fly ash particles. According to [17], the thermal expansion coefficient of aluminum depended strongly on the oxide content and decreased almost linearly with the increase in oxide content. Moreover, it was shown that the Si and SiO2 were able to reduce the CTE of the AMCs. The ability of Si to reduce the density and CTE and to improve the ambient temperature mechanical properties such as tensile and hardness properties of aluminum had been catalytic in engineering considerable interest in the materials science community to explore the possible application of Al-Si alloys for heavy-duty industries [18]. The AMCs can obtain excellent physical and mechanical properties resulting from the combination of good properties of matrix and reinforcement materials. The properties have made AMCs able to withstand the extreme conditions often encountered in changing high-temperature environments [19].
Generally, the CTE of AMCs can be controlled by adjusting the volume fraction of reinforcement. On the other hand, this is limited by the low ductility and thermal conductivity of the composite with a high volume fraction of reinforcement. Thus, their ductility and formability decrease greatly as the reinforcement volume fraction increases, despite smaller CTEs being obtained [20]. Upon the addition of 4 wt% of fly ash particles, the CTEs at 100, 150, 200 and 250 °C decreased with a marginal reduction from 14.01, 16.25, 18.09 and 19.32 × 10⁻⁶/K to 13.68, 15.72, 18.02 and 18.94 × 10⁻⁶/K, respectively. It is also shown that the CTE of AMCs increased with the increase in temperature. However, the measured thermal expansion value of the AMCs was lower (1.97%) than the pure LM6 (19.32 × 10⁻⁶/K). As the amount of fly ash particles reinforced increased to 5 wt%, the CTE of AMCs measured decreased again to 13.29, 15.68, 17.33 and 18.32 × 10⁻⁶/K at 100, 150, 200 and 250 °C. Based on Figure 4, AMCs with 5 wt% of fly ash particles obtained the lowest CTE value. This is due to the fact that the fly ash particle reinforcement was increased to 6 wt%, and the CTE values of AMCs increased to 13.94, 15.93, 18.10 and 19.30 × 10⁻⁶/K at the same temperatures. This result tallies with the XRD analysis obtained (Figure 5). As the 6 wt% of fly ash particles was added, the intensity peaks of the SiO2 were distinctly increased. The intensity peaks depend on the orientation of crystallites and the phases of the compounds [21]. Based on the XRD analysis, the SiO2 existed in the quartz structure in the AMCs with 6 wt% of fly ash. On the contrary, the SiO2 existed as a tridymite structure in the AMCs with 5 wt% of fly ash. According to [22], tridymite structures resulted in lower CTE values compared to quartz structures. This variation of structures exists due to the temperature variations that occurred during the fabrication process. Thus, it might be the main factor that affects the CTE value of prepared AMCs.
The lower CTE value of fly ash compared to the Al-Si matrix alloy and the ability of the reinforcements to effectively constrain the expansion of the matrix might be the main reason for the reduction in CTE values of AMCs. It is reported that fly ash has a CTE of about 6.1 × 10⁻⁶/°C in the temperature range of 20 to 202 °C [23]. Thus, upon the addition of fly ash particles, the CTE value of AMCs was decreased. The higher amount of fly ash particles added a lower CTE value of AMCs than the pure LM6.
Table 3 shows the dimensions of the LM6 and AMC samples before and after the CTE test. It is shown that the dimensions (length and diameter) of LM6 increased to 0.15% in length and 0.27% in diameter after the CTE test. Upon the addition 4 wt% of fly ash, the increase in length after the CTE test was reduced from 0.15% to 0.08%. Besides that, the diameter of the sample also decreased from 0.41% to 0.27%. Meanwhile, the addition of 5 wt% of fly ash shows some increase in the dimension of the sample after the CTE test. The length of the AMC samples with 5 wt% fly ash had a marginal increase of 0.08% from 12.09 to 12.10. Meanwhile, the diameter of the sample increased by 0.17% from 6.35 to 6.36 mm. The addition of 6 wt% of fly ash shows no differences in the length of the AMC samples after CTE. This is due to the AMC samples returning to their original length after the CTE test, while the diameter of the AMC samples increased by 0.15% from their original diameter. This result shows that the incorporation of fly ash particles as reinforcement in LM6 alloy is able to reduce the CTE value of the AMCs.
According to [24], the CTE of particle-reinforced MMCs is affected by various factors, such as interfacial reactions and plasticity. This is due to the fact there is a CTE mismatch between the particle and matrix during heating or cooling, as well as residual stresses [24]. The incorporation of ceramic reinforcements in metallic matrices of MMCs generates residual stresses during cooling from the material processing temperature due to the large difference between the CTE of the reinforcement and matrix [25]. In general, the CTE of the LM6 matrix was much larger than that of the reinforcing particulate. Thus, internal stress rose in the composites as the temperature changed. The changes in the internal stresses caused the dimensional of the AMC samples to change. Similar results are also found by Kikuchi in his research on CTE of aluminum magnesia composites [22].

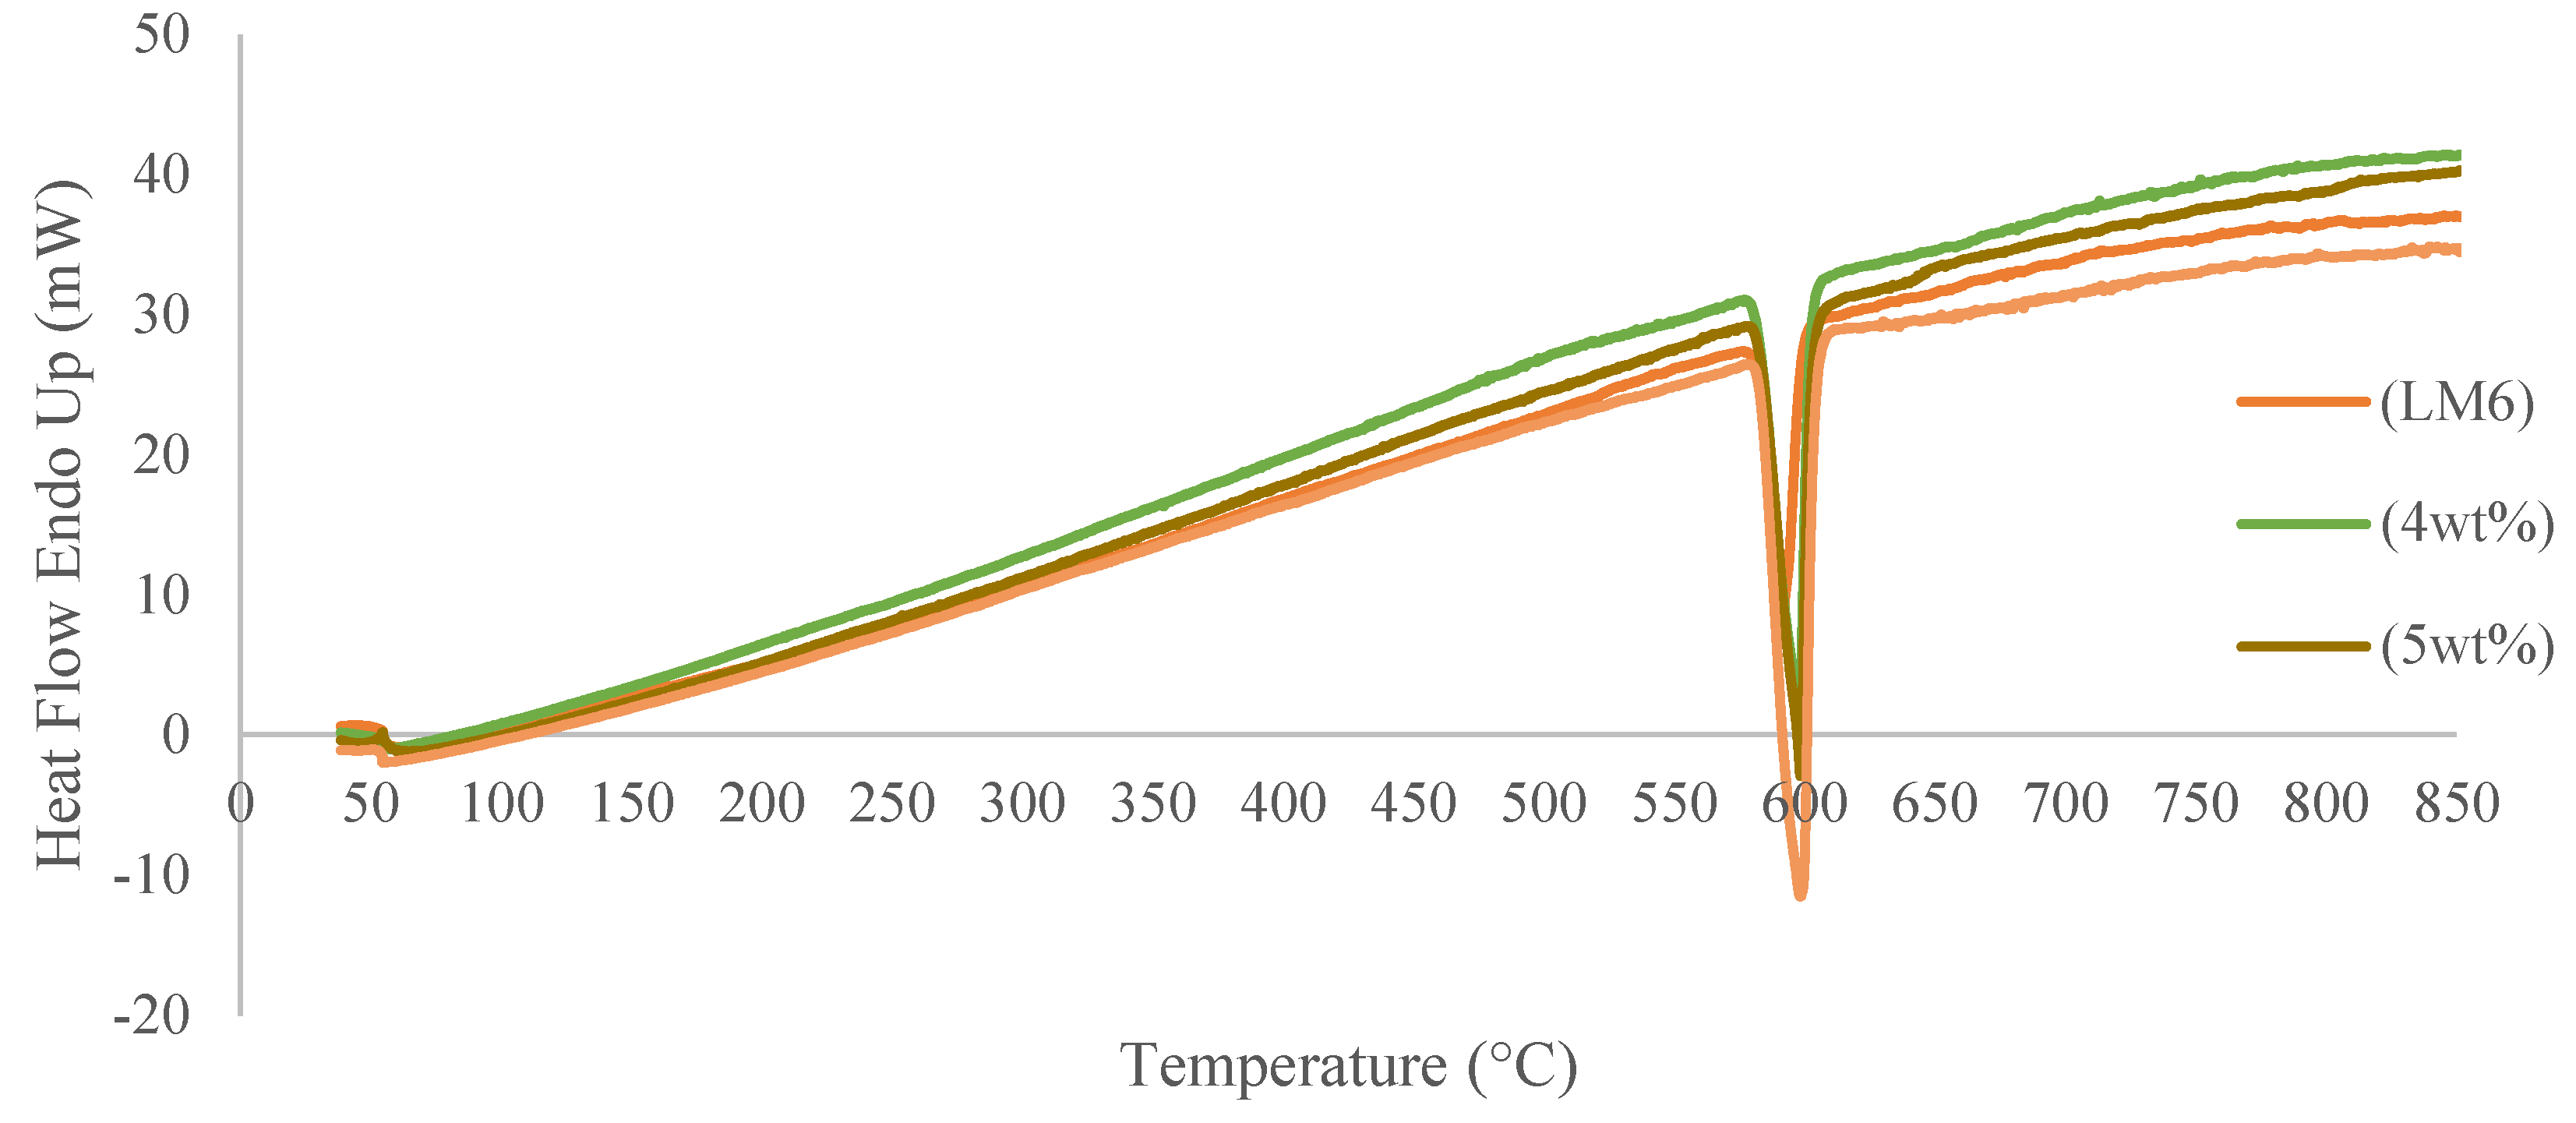
3.2. Thermal Analysis of Pure LM6 and Fabricated Aluminum Matrix Composites (AMCs) Using Differential Thermal Analysis (DTA)

Differential thermal analysis (DTA) was performed on pure LM6 and aluminum matrix composites (AMCs) to determine the reaction temperature between LM6 and fly ash particles. It involves the measuring of the relative temperature (ΔT) between the sample and reference material. Both materials are placed at the same temperature (room temperature). During DTA, all LM6 and AMC sample analyses were carried out over a temperature range of 30 to 900 °C at a constant heating rate of 5 °C/min. The furnace chamber is then filled with flowing argon at 20 m L / m i n . In this research, thermal analysis by differential thermal analysis (DTA) was carried out in order to determine the effect of fly ash reinforcement on the melting temperature of casted AMCs. Based on Figure 6, the addition of fly ash particles did not produce a significant difference in the DTA results of fabricated AMCs. The highest melting temperature was achieved by AMCs with 5 and 6 wt% of fly ash at 600 °C.
Figure 6 shows the DTA curves of pure LM6 and fabricated AMCs with different compositions (4, 5 and 6 wt%) of fly ash particles. The DTA curve of each sample shows endothermic peaks at different temperatures. These results are due to distinct reinforcement compositions (4, 5 and 6 wt% of fly ash reinforcement). As can be seen, there is a single endothermic and broad exothermic peak existing in the curve of the LM6 sample. This result was also found by [26] in their research regarding the crystalline structure of a metal impregnation. The endothermic peak indicates the melting point of the sample [15]. The endothermic peak of pure LM6 was observed in the range of 580.61 to 600.19 °C. It was shown that the pure LM6 starts to melt at 580.61 °C (liquid and solid) and becomes fully liquid at 595 °C (Tm). Meanwhile, the crystallization temperature (Tc) was indicated at 580.61 °C. The broad exothermic peak in the curve of the LM6 sample existed at the range of 600 to 900 °C. According to Balaraman et.al [27], the exothermic peak at around 800 °C indicates the oxidation of aluminum in the alloy (Equations (4)–(6)). However, upon the addition of fly ash reinforcement (4, 5 and 6 wt%), there is a single endothermic peak, and a few weak exothermic peaks also exist. Generally, exothermic peaks in DTA exist due to oxidative decomposition. Based on the chemical composition of fly ash (Table 2 and Figure 1), the main composition of fly ash was in the form of oxide. Thus, the existence of a few weak exothermic peaks in the fabricated AMCs might be due to the oxidative decomposition that has occurred among the oxide element contained in fly ash particles. In another finding by Zagorka et al. [28] the temperature interval from 100 to 450 °C hydration water was altogether lost [28].
4 A l 3 + + 12 e 4 A l
6 O 2 12 e 3 O 2
4 A l ( l ) + 3 O 2 ( g ) 2 A l 2 O 3 ( s )
Upon the addition of fly ash particles, the endothermic peak of AMCs increased in the range of 588.59 to 604.81 °C at 4 wt%, 597.87 to 606.66 °C at 5 wt%, and 595.44 to 606.67 °C at 6 wt% of fly ash reinforcement, as shown in Figure 7b–d. The crystallization temperature (Tc) of AMCs with 4 wt% of fly ash reinforcement increased by 1.4% from 580.61 °C (pure LM6) to 588.59 °C (Figure 7b), while the melting temperature (Tm) AMCs with 4 wt% of fly ash increased by 0.51% from 595 °C (pure LM6) to 598 °C (Figure 7b). As the amount of fly ash reinforcement increased to 5 wt%, the crystallization temperature (Tc) of the AMCs also increased by 2.97% to 597.87 °C from the melting temperature of pure LM6. The melting temperature of AMCs with 5 wt% of fly ash increased correspondingly by 0.83% from 595 °C (LM6) to 600 °C (Figure 7c). Meanwhile, the crystallization temperature of (Tc) AMCs with 6 wt% fly ash reinforcement was increased to 595.44 °C (2.55%) from the crystallization temperature (Tc) of pure LM6. However, the melting temperature of AMCs with 6 wt% of fly ash reinforcement is similar to the melting temperature of AMCs with 5 wt% of fly ash, which is 600 °C.
Based on Figure 7b, a single and broad exothermic phase existed as 4 wt% of fly ash reinforcement was added. A broad exothermic peak existed at the temperature range of 663.14 to 824.17 °C. According to Balaraman et al. [27], the broad exothermic at around 800 °C indicates the oxidation of aluminum [28]. The broad nature of this curve arises from the fact that the Al2O3 that existed in the fly ash reinforcement maintained a gas-impermeable layer over the liquid aluminum, and the thermal expansion mismatch between the layer and liquid resulted in cracking the Al2O3 layer and thus led to continuous oxidation. Moreover, according to Figure 7c, two small exothermic peaks existed as 5 wt% of fly ash reinforcement was incorporated. The first exothermic peak lies in the temperature range of 640.19 to 664.35 °C, while the second exothermic peak lies in the temperature range of 772.27 to 831.84 °C. According to Terzic et al. [29], the exothermic peak around 500 to 700 °C corresponds to the transformation of organic matter present in the fly ash compositions that are incorporated into AMCs and to the decomposition of CaCO3 (Equation (7)) (composition of fly ash in Table 2) and the burning of residual coal present in the fly ash, whereas the second small exothermic peak at a temperature range of 772.27 to 831.84 °C might be due to the oxidation of aluminum in the AMCs [28]. On the other hand, a weak exothermic peak also existed in AMCs with 6 wt% of fly ash at temperatures in the range of 714.29 to 828.68 °C. Other than the oxidation of aluminum in AMCs, the weak exothermic peak in the range of 600 to 1000 °C might be attributed to the reaction of MgO and TiO2 that existed in fly ash reinforcement. According to Klancnik et al. [30], the TiO2 starts to react, which causes the phases’ irreversible conversion to the equilibrium phase upon heating above temperatures in the range 600–800 °C [30]. Conversely, according to Ropp, MgO will produce light-burned magnesia (MgO) upon heating to 700 to 1000 °C (Ropp Elsevier). Due to this reason, the exothermic peak that existed in AMCs might be attributed to the reaction of the compound that existed in fly ash reinforcement that occurred in AMCs.
C a C O 3 C a O + C O 2
In the fabrication process, typically at 800 °C, the molten LM6 has an opportunity to engage in a reaction with the fly ash. Elements like SiO2 present in the fly ash reinforcement undergo reduction from their oxides and can diffuse within the molten LM6 in the composite. With an increase in the soaking time of the aluminum–fly ash composite, substantial amounts of SiO2 and Al2O3 are reduced from the fly ash particles, releasing Si and Al, which then integrate into the aluminum matrix [15] as shown in Figure 8. Upon melting the LM6 alloy with fly ash particles, a reaction occurs in the subsequent sequence, facilitated by the presence of various compounds, notably Al2O3 and SiO2, within the fly ash particles. Given that chemical reactions ignite upon contact between molten aluminum and fly ash particles, SiO2 and Al2O3 were reduced by the molten aluminum and subsequently diffused into the fly ash-free spaces in the aluminum matrix [15].
The rise in melting temperature (evident through an endothermic peak) may be attributed to the presence of various compounds in the fly ash reinforcement with higher melting temperatures than pure LM6. Notably, compounds such as Al2O3 (2072 °C) and SiO2 (1600 °C) [15,31] are involved. These compounds are recognized for their favorable properties, including high melting temperatures and superior mechanical and physical characteristics compared to pure LM6, contributing to the production of enhanced aluminum matrix composites (AMCs).

4. Conclusions

The Al-Si (LM6) fly ash composites were fabricated using the compocasting method. This study delved into the investigation of chemical reactions occurring between the fly ash particles and the aluminum melt. From the obtained results, the following key conclusions can be drawn:
(1)
The CTE values of Al-Si (LM6) fly ash composites decreased with the addition of fly ash particles. The lowest CTE value achieved by Al-Si (LM6) fly ash composites with 5 wt% of fly ash (18.32 × 10⁻⁶/K) is 5.18% lower than the CTE value of pure LM6.
(2)
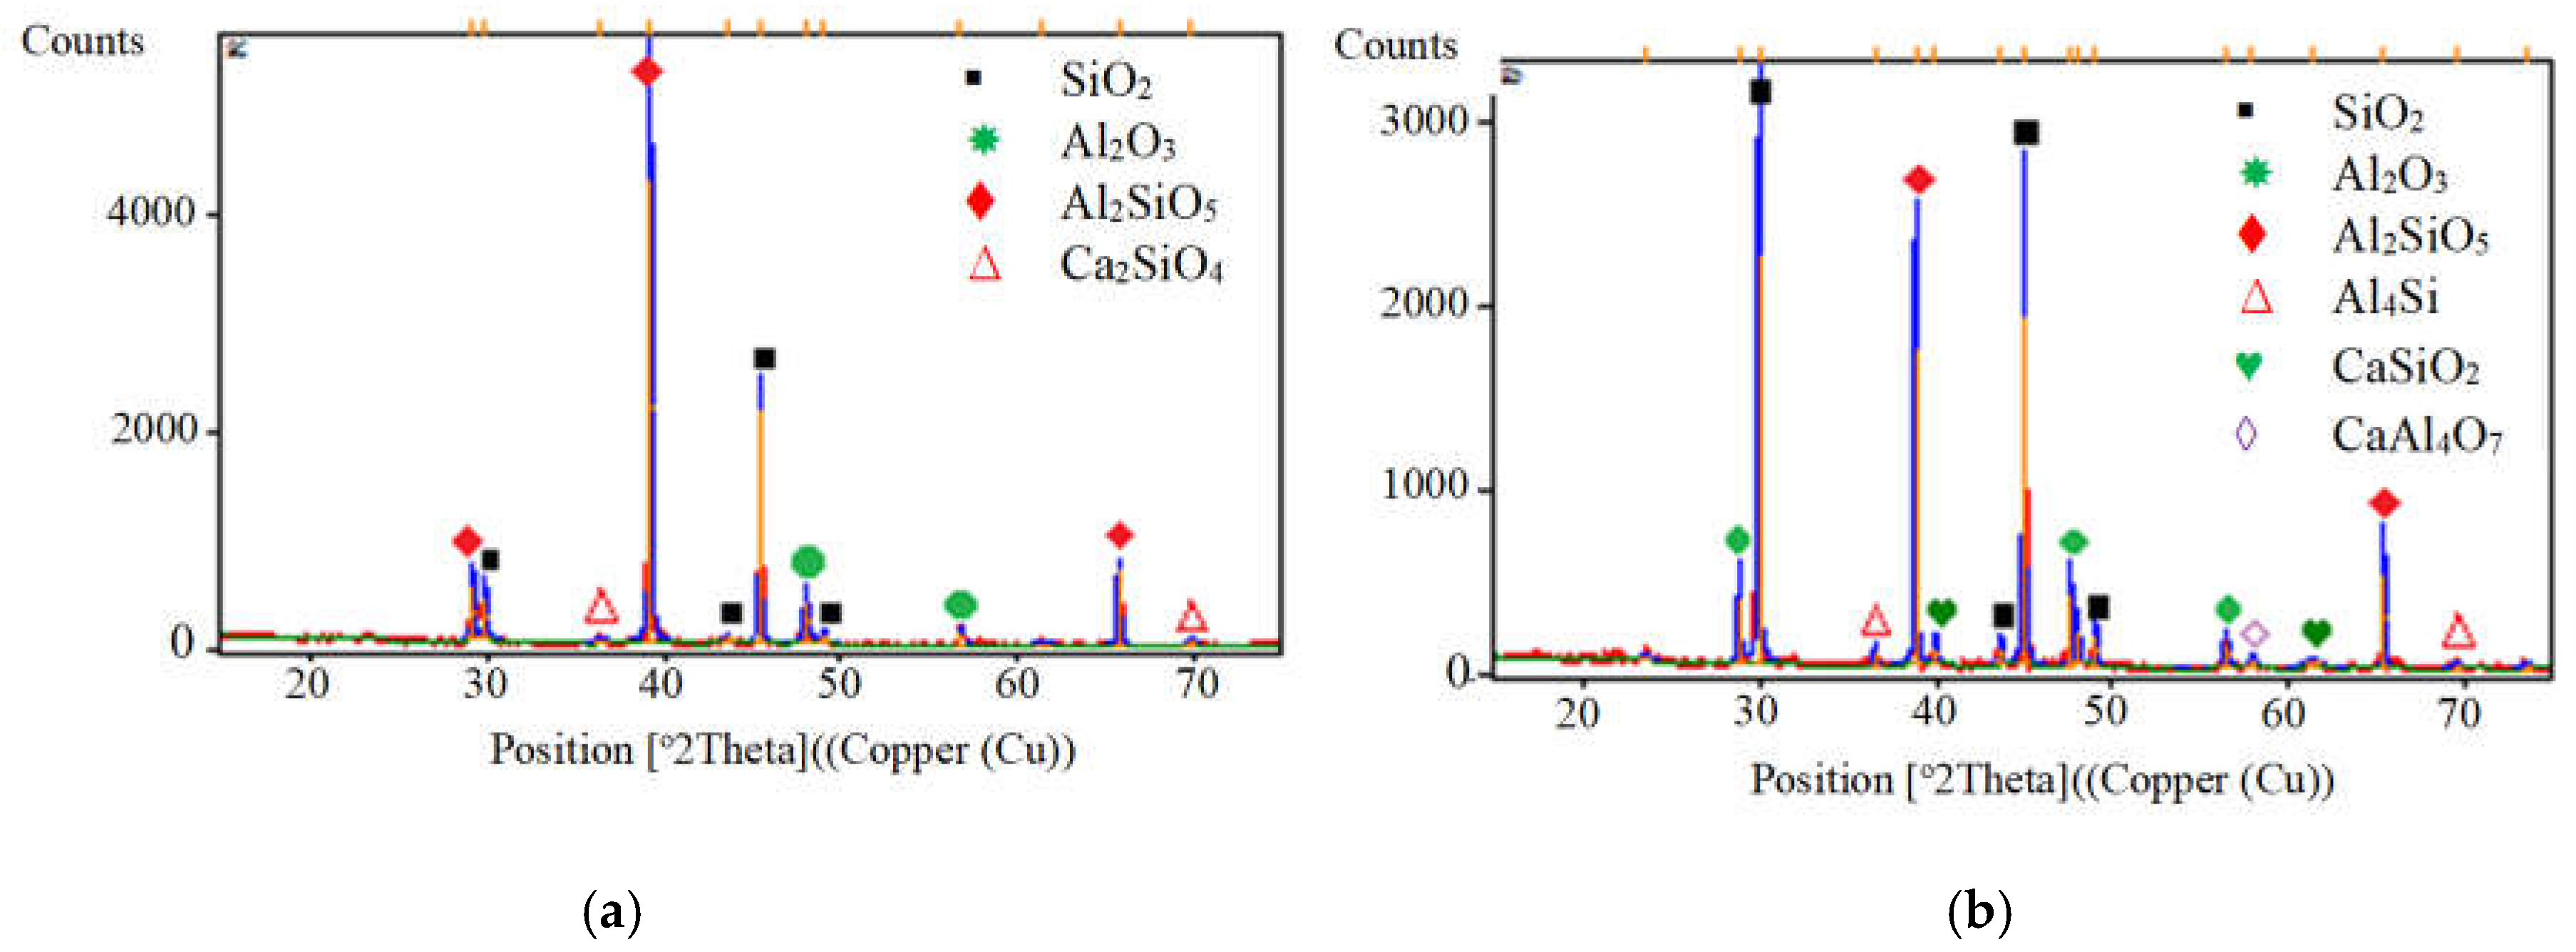
The values of CTE obtained were parallel with the chemical reaction obtained in XRD analysis.
(3)
Based on DTA analysis, fly ash particles have no significant effect on the melting temperature of Al-Si (LM6) fly ash composites. However, the reaction that occurred among the particles was detected in the DTA graph.

Author Contributions

Conceptual, E.E.M.N. and P.C.; Methodology: S.S.N.; Validation: E.E.M.N.; formal analysis, S.S.N.; investigation, S.S.N.; resources, E.E.M.N.; data curation, S.S.N.; writing—original draft preparation, S.S.N.; writing—review and editing, E.E.M.N.; visualization, S.S.N. and E.E.M.N.; supervision, E.E.M.N. and P.C.; project administration, E.E.M.N.; funding acquisition, E.E.M.N. All authors have read and agreed to the published version of the manuscript.

Funding

This research was funded by Program Rakan Penyelidikan Universiti Malaya/CG061-2013.

Data Availability Statement

Data are contained within the article.

Conflicts of Interest

The authors declare no conflict of interest.

References

  1. Jianbin, Z.; Hong, Y. Fabrication of an A356/fly-ash-mullite Interpenetration Composites and its Wear Properties. Ceram. Int. 2017, 43, 12996–13003. [Google Scholar]
  2. Liang, J.F.; Shueiwan, H.J. Reaction Effect of Fly Ash with Al-3Mg Melt on the Microstructure and Hardness of Aluminium Matrix Composites. Mater. Des. 2016, 89, 941–949. [Google Scholar]
  3. Blisset, R.S.; Rowson, N.A. A Review of the Multi-component Utilisation of Coal Fly Ash. Fuel 2012, 97, 1–23. [Google Scholar] [CrossRef]
  4. David, J.R.S.; Smart, D.S.R.; Dinaharan, I. Microstructure and Some Mechanical Properties of Fly Ash Particulate Reinforced AA6061 Aluminium Alloy Composites Prepared by Compocasting. Mater. Des. 2013, 49, 28–34. [Google Scholar] [CrossRef]
  5. Rohatgi, P.K. Low-cost, Fly Ash-containing Aluminium Matrix Composites. JOM 1994, 46, 55–59. [Google Scholar] [CrossRef]
  6. Shivananda, K.V.M.; Girish, D.P.; Keshavamurthy, R.; Varol, T.; Koppad, P.G. Mechanical and Thermal Properties of AA7075/TiO2/Fly Ash Hybrid Composites Obtained by Hot Forging. Prog. Nat. Sci. Mater. Int. 2017, 27, 474–481. [Google Scholar] [CrossRef]
  7. Wu, G.H.; Dou, Z.Y.; Jiang, L.T.; Cao, J.H. Damping Properties of Aluminium Matrix-Fly Ash Composites. Mater. Lett. 2006, 60, 2945–2948. [Google Scholar] [CrossRef]
  8. Kulkarni, S.G.; Meghnani, J.V.; Lal, A. Effect of Fly Ash Hybrid Reinforcement on Mechanical Property and Density of Aluminium 356 Alloy. Procedia Mater. Sci. 2014, 5, 746–754. [Google Scholar] [CrossRef]
  9. Rahimian, M.; Ehsani, N.; Parvin, N.; Baharvandi, H.R. The Effect of Particle Size, Sintering Temperature and Sintering Time on the Properties of Al-Al2O3 Composites, Made by Powder Metallurgy. J. Mater. Process Technol. 2009, 518, 100–107. [Google Scholar] [CrossRef]
  10. Siddarth, P.; Rana, R.S.; Singh, S.K. Study on Mechanical Properties of Environment Friendly Aluminium E-Waste Composite with Fly Ash and E-Glass Fiber. Mater. Today Proc. 2017, 4, 3441–3450. [Google Scholar]
  11. Kingsly, J.A.G.; Sheriff, N.M.; Dinaharan, I.; Selvam, J.D. Production and Characterization of Rich Husk Ash Particulate Reinforced AA6061 Aluminium Alloy Composites by Compocasting. Trans. Nonferrous Met. Soc. China 2015, 25, 683–691. [Google Scholar]
  12. Jaswinder, S.; Amit, C. Characterization of Hybrid Aluminum Matrix Composites for Advanced Application-A Review. J. Mater. Res. Technol. 2016, 5, 159–169. [Google Scholar]
  13. Alaneme, K.K.; Sanusi, K.O. Microstructural Characteristics, Mechanical and Wear Behaviour of Aluminum Matrix Hybrid Composites Reinforced with Alumina, Rice husk Ash and Graphite. Eng. Sci. Technol. Int. J. 2015, 18, 416–422. [Google Scholar]
  14. Uju, W.A.; Oguocha, I.N.A. A Study of Thermal Expansion of Al-Mg Alloy Composites Containing Fly Ash. Mater. Des. 2012, 33, 503–509. [Google Scholar] [CrossRef]
  15. Aravindan, S.; Rao, P.V.; Ponappa, K. Evaluation of physical and mechanical properties of AZ91D/SiC composites by two step stir casting process. J. Magnes. Alloys 2015, 3, 52–62. [Google Scholar] [CrossRef]
  16. Guo, R.O.; Rohatgi, P.K. Chemical Reactions between Aluminium and Fly Ash during Synthesis and Reheating of Al-Fly Ash Composite. Metall. Mater. Trans. B 1998, 29, 519–525. [Google Scholar] [CrossRef]
  17. Zebarjad, S.M.; Sajjadi, S.A.; Karimi, E.Z.V. Influence of Nanosize Silicon Carbide on Dimensional Stability of Al/SiC Nanocomposite. Mater. Sci. 2008, 2008, 835746. [Google Scholar]
  18. Gupta, M.; Ling, S. Microstructure and Mechanical Properties of Hypo/Hyper-eutectic Al-Si Alloys Synthesized using a Near-net Shape Forming Technique. J. Alloys Compd. 1999, 287, 284–294. [Google Scholar] [CrossRef]
  19. Mohanavel, V.; Ravichandran, M.; Anandakrishnan, V.; Pramanik, A.; Meignanamoorthy, M.; Karthick, A.; Muhibbullah, M. Mechanical Properties of Titanium Diboride Particles Reinforced Aluminum Alloy Matrix Composites: A Comprehensive Review. Adv. Mater. Sci. Eng. 2021, 2021, 7602160. [Google Scholar] [CrossRef]
  20. Zhao, P.T.; Wang, L.D.; Du, Z.M.; Xu, S.C.; Jin, P.P.; Fei, W.D. Thermal Expansion Behaviour of Aluminium Matrix Composite Reinforced by SnO2-coated Al18B4O33 Whisker. Mater. Chem. Phys. 2013, 138, 856–861. [Google Scholar] [CrossRef]
  21. Wright, A.F.; Fitch, A.N.; Wright, A.C. The Preparation and Structure of the α- and β-Quartz Polymorphs of Beryllium Fluoride. J. Solid State Chem. 1988, 73, 298–304. [Google Scholar] [CrossRef]
  22. Kikuchi, Y.; Sudo, H.; Kuzuu, N. Thermal Expansion of Vitreous Silica: Correspondence between Dilatation Curve and Phase Transitions in Crystalline Silica. J. Appl. Phys. 1997, 82, 4121–4123. [Google Scholar] [CrossRef]
  23. Guo, R.Q.; Venugopalan, D.; Rohatgi, P.K. Differential Thermal Analysis to Establish the Stability of Aluminum-Fly Ash Composites during Synthesis and Reheating. Mater. Sci. Eng. A 1998, 241, 1840190. [Google Scholar] [CrossRef]
  24. Singla, M.; Dwivedi, D.D.; Singh, L.; Chawla, V. Development of Aluminium Based Silicon Carbide Particulate Metal Matrix Composite. J. Miner. Mater. Charact. Eng. 2009, 8, 455–467. [Google Scholar] [CrossRef]
  25. Wu, S.Q.; Wei, Z.S.; Tjong, S.C. The mechanical and Thermal Expansion Behaviour of An Al-Si Alloy Composite Reinforced with Potassium Titanate Whisker. Compos. Sci. Technol. 2000, 60, 2873–2880. [Google Scholar] [CrossRef]
  26. Maria, L.A.G.; Vieira, M.D.; Mota, D.A.P.; Cerqueira, W.V.; Teixeira, A.M.R.F. Differential thermal analysis of a zeolite Y crystalline structure in a catalyst. J. Therm. Anal. Calorim. 2010, 101, 965–971. [Google Scholar]
  27. Balaraman, S.; Baskaran, I.; Sivakumar, K. Phase Transition Behavior of Nanocrystalline Al2O3 Powders. Soft Nanosci. Lett. 2013, 3, 69–74. [Google Scholar]
  28. Pavlovic, Z.A.; Terzic, A.; Milicic, L.; Radojevic, Z.; Pavlovic, L. Sustainable Solutions for Managing Environmentally Hazardous Waste Materials: Reapplication of Fly Ash. In Proceedings of the 2nd International Symposium on Environmental and Material Flow Management, Zenica, Bosnia and Herzegovina, 7–9 June 2012. [Google Scholar]
  29. Terzic, A.; Pavlovic, L.j.; Obradovic, N.; Pavlovic, V.; Stojanovic, J.; Milicic, L.j.; Radojevic, Z.; Ristic, M.M. Synthesis and sintering of high-temperature composites based on mechanically activated fly ash. Sci. Sinter. 2012, 44, 135–146. [Google Scholar] [CrossRef]
  30. Klancnik, G.; Medved, J.; Mrvar, P. Differential Thermal Analysis (DTA) and Differential Scanning Calorimetry (DSC) as a Method of Material Investigation. Mater. Geoenvironment 2010, 57, 127–142. [Google Scholar]
  31. Ropp, R.C. Encyclopedia of the Alkaline Earth Compounds; Elsevier: Amsterdam, The Netherlands, 2012; p. 109. ISBN 9780444595508. [Google Scholar]
Figure 1. XRD analysis of fly ash particles.
Jcs 08 00170 g001
Figure 2. Schematic diagram of casting process.
Jcs 08 00170 g002
Figure 3. Dimension of CTE sample before and after exposure to heat.
Jcs 08 00170 g003
Figure 4. Coefficient of thermal expansion (CTE) of pure LM6 and LM6/fly ash composites.
Jcs 08 00170 g004
Figure 5. XRD analysis of (a) AMCs with 5 and (b) 6 wt% fly ash.
Jcs 08 00170 g005
Figure 6. DTA curves of pure LM6 and fabricated AMCs with (4, 5 and 6 wt%) of fly ash reinforcement.
Jcs 08 00170 g006
Figure 7. (a) DTA curve of pure LM6. (b) DTA curve of fabricated AMCs with 4 wt% of fly ash reinforcement. (c) DTA curve of fabricated AMCs with 5 wt% of fly ash reinforcement. (d) DTA curve of fabricated AMCs with 6 wt% of fly ash reinforcement.
Jcs 08 00170 g007
Figure 8. SEM micrograph of (a) LM6, (b) LM6 with 4 wt% of fly ash, (c) LM6 with 5 wt% of fly ash and (d) Lm6 with 6 wt% of fly ash at 1 kx magnification. [F: flake-like; N: needle-like].
Jcs 08 00170 g008
Table 1. Chemical composition of LM6 used.
ElementCuFeMgMnNiPbSiAl
Percentage (%)0.100.600.100.500.100.1010.00–1300Remainder
Table 2. Chemical composition of fly ash used.
CompoundNa2OMgOAl2O3SiO2CaOK2OFe2O3TiO2LOI
Percentage (%)0.4811.10215.93965.612.0980.6844.5170.8131.87
Table 3. Dimension of pure LM6 and AMCs before and after coefficient of thermal expansion (CTE) test.
SampleBeforeAfterPercentage of Difference (%) (Length)Percentage of Difference (%) (Diameter)
Length (mm)Diameter (mm)Length (mm)Diameter (mm)
LM613.297.3413.317.370.150.41
LM6 + 4%FA11.907.3111.917.330.080.27
LM6 + 5%FA12.096.3512.106.360.080.17
LM6 + 6%FA10.416.4610.416.4700.15
Disclaimer/Publisher’s Note: The statements, opinions and data contained in all publications are solely those of the individual author(s) and contributor(s) and not of MDPI and/or the editor(s). MDPI and/or the editor(s) disclaim responsibility for any injury to people or property resulting from any ideas, methods, instructions or products referred to in the content.

