Article

Deterioration of Cementitious Materials in Wastewater Treatment Plants’ Pumping Stations and Sand-Trap Structures

1
Lithosphere Fluid Research Lab, Eötvös Loránd University, Pázmány P. s. 1/C, 1117 Budapest, Hungary
2
Department of Microbiology, Eötvös Loránd University, Pázmány P. s. 1/C, 1117 Budapest, Hungary
3
Doctoral School of Environmental Sciences, Eötvös Loránd University, Pázmány P. s. 1/C, 1117 Budapest, Hungary
4
Cement Industry Research & Development Ltd. (CEMKUT Ltd.), Bécsi út 122-124, 1034 Budapest, Hungary
5
Transdanubian Regional Waterworks Ltd., Szabolcsi u. 40, 2481 Velence, Hungary
6
Institute of Earth Physics and Space Science, Eötvös Loránd Research Network, 9400 Sopron, Hungary
*
Authors to whom correspondence should be addressed.
J. Compos. Sci. 2024, 8(2), 60; https://doi.org/10.3390/jcs8020060
Submission received: 30 November 2023 / Revised: 27 December 2023 / Accepted: 19 January 2024 / Published: 5 February 2024
(This article belongs to the Special Issue Composites for Construction Industry)

Abstract

:
Wastewater treatment plants (WWTPs) are critical infrastructures for wastewater management, and their durability is crucial. Due to their excellent water tightness and strength, cementitious materials are used to build WWTPs. However, the performance of these materials is affected by aggressive environments. There are few in situ experiments in the literature regarding the deterioration of cementitious materials in WWTPs. This paper investigates their deterioration mechanisms in a sewage pumping station and a sand-trap structure of a WWTP. In situ experiment was conducted by exposing cement specimens in both locations for 1, 2, 3 and 7 months. The physical and morphological changes of the specimens were examined using stereo microscopy and scanning electron microscopy, whereas the mineralogical/solid phase changes were examined using X-ray diffraction. The results showed that the specimens from the pumping station formed colored surface products, which were confirmed to be secondary minerals (i.e., gypsum and ettringite), whereas there were no colored surface products in the sand-trap structure. The results demonstrated that cementitious materials subjected to wastewater vapors (in a pumping station) had higher deterioration effects than those subjected to wastewater liquid (in a sand-trap structure), suggesting that the wastewater vapors are more aggressive toward cementitious materials than wastewater liquids.

Graphical Abstract

1. Introduction

The 17 United Nations Sustainable Development Goals include available and sustainable water and sanitation management [1]. Well-managed and durable wastewater treatment plants (WWTPs) are crucial targets for achieving these vital goals. However, one of the significant challenges facing WWTPs is the need for frequent maintenance, which causes high operation costs [2]. In the literature, it is reported that the frequent maintenance of WWTPs is caused by the deterioration of cementitious materials in concrete.
Cementitious materials are widely used as binders worldwide in constructing most engineering infrastructures, including WWTPs, in which concrete composites are primarily applicable. These materials are favored due to their low cost, high strength and excellent water tightness compared to other materials. However, due to the corrosive nature of wastewater, the use of cementitious materials in WWTP systems is hindered by the deterioration process. The deterioration of cementitious materials is caused by different chemicals (e.g., sulfates), as reported by [3], most of which are present in wastewater from domestic and industrial applications. The effects of the deterioration of cementitious materials in concrete-built sewage systems include the failure of the WWTP infrastructure before its designed service life [4].
WWTPs consist of several treatment units with deterioration mechanisms that differ from each other, as reported in [5]. The concretes in some of these treatment structures are submerged within wastewater liquid, whereas others are exposed to wastewater vapors (above wastewater level). One of the aspects of material deterioration is the change in terms of physical and chemical properties caused by chemical decomposition and the evolution of new mineral phases, as reported in [6]. However, in WWTPs, the mechanisms leading to the formation of these new mineral phases (also known as secondary phases) are still debated. Although some attempts to understand various factors involved in concrete deterioration in sewers were mentioned in [7], it is still not clear if a similar mechanism can be assumed in WWTPs as they consist of different treatment units, each with its own sewage conditions and perhaps exhibiting a different deterioration potential.
Various deterioration mechanisms of cementitious materials were discussed in [8], including (a) chemical-induced mechanisms, (b) microbe-induced mechanisms, (c) freezing and thawing processes, (d) alkali–silica reaction (ASR) and (e) physical damage. However, many authors, including those of [9,10,11], have demonstrated that the first two are the main deterioration mechanisms of concern in sewage concrete, and their effects cannot be easily separated in actual sewage conditions [9]. These chemical- and microbe-induced deteriorations involve common variables, mainly SO42−, CO2 and H2S, which are all present in sewage environments. The interaction of concrete and sewage results in the penetration of chemical substances into the cement matrix, thereby initiating the deterioration reactions with main cement chemical constituents [12]. In chemical-induced mechanisms, these chemicals dissolve directly into the porewater of hydrated cement, whereas in microbe-induced deterioration, the process involves the reactions between biochemical products such as H2S and cement chemical components (i.e., portlandite), leading to an alteration in cement chemistry. The presence of either chemical or biogenic deleterious eventually weakens the performance of cement-based materials by reacting with main cement hydration products as reported in the literature (e.g., [13,14,15,16].
The main objective of this study is to evaluate and compare the deterioration effects in terms of physical and mineralogical changes on cementitious materials exposed to wastewater vapors (e.g., in pumping stations) and wastewater liquids (e.g., sand-trap structure) in wastewater treatment plants. Two cement formulations were used, i.e., cement mortars and paste made from ordinary Portland cement (OPC). The purpose of studying both cement formulations was to compare the deterioration behavior of pure cement (i.e., paste) with that of the mortar composite (i.e., cement paste plus sand) typically used in concrete and coatings in WWTP infrastructures.

2. Materials and Methods

2.1. Study Location

The in situ experiment was conducted in the pumping station and sand-trap structures of a wastewater treatment plant (WWTP) site near Velence Lake in Hungary. The system comprises a sewage pumping station; sand-trap structures; and other treatment units such as activated sludge processes, primary clarifiers and biological treatment units. The pumping station and a sand-trap structure were selected to understand the deterioration processes that occur when concrete is below and above sewage. In the former location, cement specimens were exposed above the sewage line, interacting with aggressive sewage gases. In contrast, specimens were exposed below the sewage line in the latter location, interacting directly with sewage liquid.

2.2. Preparation of Cement Specimens

The mortar and paste cement specimens used in the study were made of ordinary Portland cement (CEM I 52.5 N according to the European Standard EN 197-1) [17], with the former being rectangular prisms (160 mm × 40 mm × 40 mm) and the latter in cylindrical molds (29 mm diameter by 30 mm height). Sixteen specimens were prepared at CEMKUT LTD (a cement research and development company in Budapest, Hungary). The mortar and paste specimens were prepared according to the EN 196-1 [18] and EN 196-3 [19] standards, respectively. In the case of mortar specimens, cement powder (450 g) was mixed with standard sand (1350 g) and deionized water (225 g) to reach a workable state (at a water/cement ratio of 0.5); in paste specimens, however, cement powder was mixed with deionized water to attain standard consistency. The chemical composition and the clinker phases of the used raw cement for the specimens is shown in Table 1 and Table 2 respectively. The prepared specimens were cured and stored in water at 20 °C for 28 days.

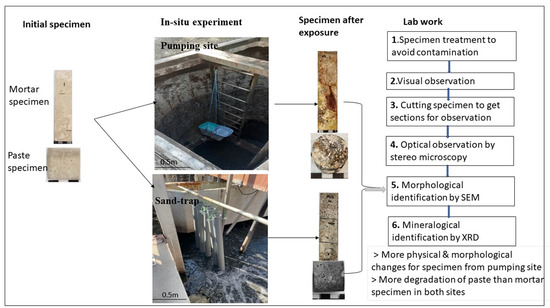
2.3. In Situ Experiment

The prepared (16) specimens were introduced to the selected sites: the pumping station and sand-trap structure. Eight mortar and paste specimens were put at each site. The experiment was conducted between July 2022 and March 2023. As a control, one reference sample from each specimen category was kept in ambient laboratory conditions for comparison with the exposed specimens.
In the pumping station, specimens were exposed using plastic container holders, which were uniformly perforated on all sides and bottoms to allow total exposure and avoid the build-up of condensed water at their bottoms. The specimen holders were hung at 2.5 m from the top and above the wastewater line with the help of rope (Figure 1a). Mortar and paste specimens were placed in separate holders to avoid interaction with each other during exposure.
In the sand trap, specimens were placed into a perforated 2 m PVC pipe holder with a diameter of 110 mm. About 0.75 m of the pipe containing specimens was submerged below sewage liquid, and the remaining 1.25 m portion was left above the sewage and fixed at the top (Figure 1b) to prevent it from being washed away by flowing sewage. Like in the pumping location, mortar and paste specimens were placed in separate holders to avoid interactions during exposure. The bottom of each holder was drilled to make small holes allowing the free passage of sewage and preventing the accumulation of sludge.

2.4. Specimen Removal and Preparation for Analysis

Exposed specimens were removed from the sites after the 1st, 2nd, 3rd and 7th months of exposure. Each time, specimens were photographed, carefully washed with demineralized water, and packed in light-density polyethene (LDPE) plastic bags in three layers to avoid any changes before analysis. In the laboratory, all specimens were autoclaved at 121 °C and 1.1 bar for 20 minutes for sterilization against bacterial contamination of analytical instruments. Then, they were air-dried in a desiccator containing silica gel at laboratory ambient temperature for a week. After drying, 2 cm × 2cm sample sections were cut from large specimens using a diamond saw for microscopic and SEM observation. For microstructure studies using stereo microscopy, cut sections were dry-polished using silicon carbide griding powder 1000 µm after impregnation with a fast-bonding adhesive liquid (loctite glue, universal).

2.5. Visual Observation of the Specimens

Visual inspection was conducted for all specimens retrieved from the sewage to identify any visible physical changes, including surface color and damage. Specimens were then photographed on all sides using an iPhone camera. Images of each specimen were documented for comparison. Specific areas of interest were marked for microscopic observation.

2.6. Stereo Microscopy

Stereo microscopy imaging (Nikon’s SMZ 1000 model) coupled with a digital camera was used to obtain images of cut sections of the specimens. Imaging software (Digicam and irfanview64 version 4.25 [23]) integrated into the microscope was used to generate images of the area of interest. The uncut section was used to examine the surface deterioration, the cut section was used to observe the change in microstructure. The instrument was installed at the LRG lab and operated by Eötvös Loránd University, Budapest Hungary.

2.7. Scanning Electron Microscopy

Scanning electron microscopy (SEM) (Hitachi TM 4000 plus model, operated at KKIC, ELTE) was used to obtain morphological information on the specimen’ surface. SEM images were obtained using a secondary electron detector (SEM-SE) operated at 15kV at a low vacuum due to the porous nature of cement samples. Sample sections were prepared as explained in Section 2.4. SEM imaging was performed on exposed (unpolished) surfaces of the samples to avoid losing the deterioration products of interest. SEM analyses were performed at the KKIC, Eötvös Loránd University, Budapest Hungary.

2.8. X-ray Diffraction analysis

X-ray Diffraction analysis (XRD) was performed to identify and quantify the mineralogical compositions of the studied specimens. Before the analysis, a cut section used in the SEM analysis was manually ground into powder of less than 63 µm using a mortar and pestle. The powder was then analyzed using a Bruker D2 phaser XRD powder diffractometer (configured with CuKα radiation, 30 Kv, 10 mA) with a solid-state 1D LynxEye detector in Bragg–Brentano geometry in Theta/Theta vertical goniometer alignment. Step-scan mode measurements were run with a 0.006° (2θ) step size and 0.15 s per step in the 5° (2θ) to 70° (2θ) region. The evaluation of the diffraction results was performed in the DIFFRAC.EVA V6.0 (Bruker2021) module of the Bruker DiffracPlus data handling software package. The mineral phases were identified using the search/match procedure based on the Crystallographic Open Database (COD). Quantitative analysis was performed using Rietveld refinement in TOPAS V6.0 software (Bruker, 2018). All XRD measurements were performed at the Directorate of Geology, Supervisory Authority for Regulatory Affairs, Budapest Hungary.

3. Results

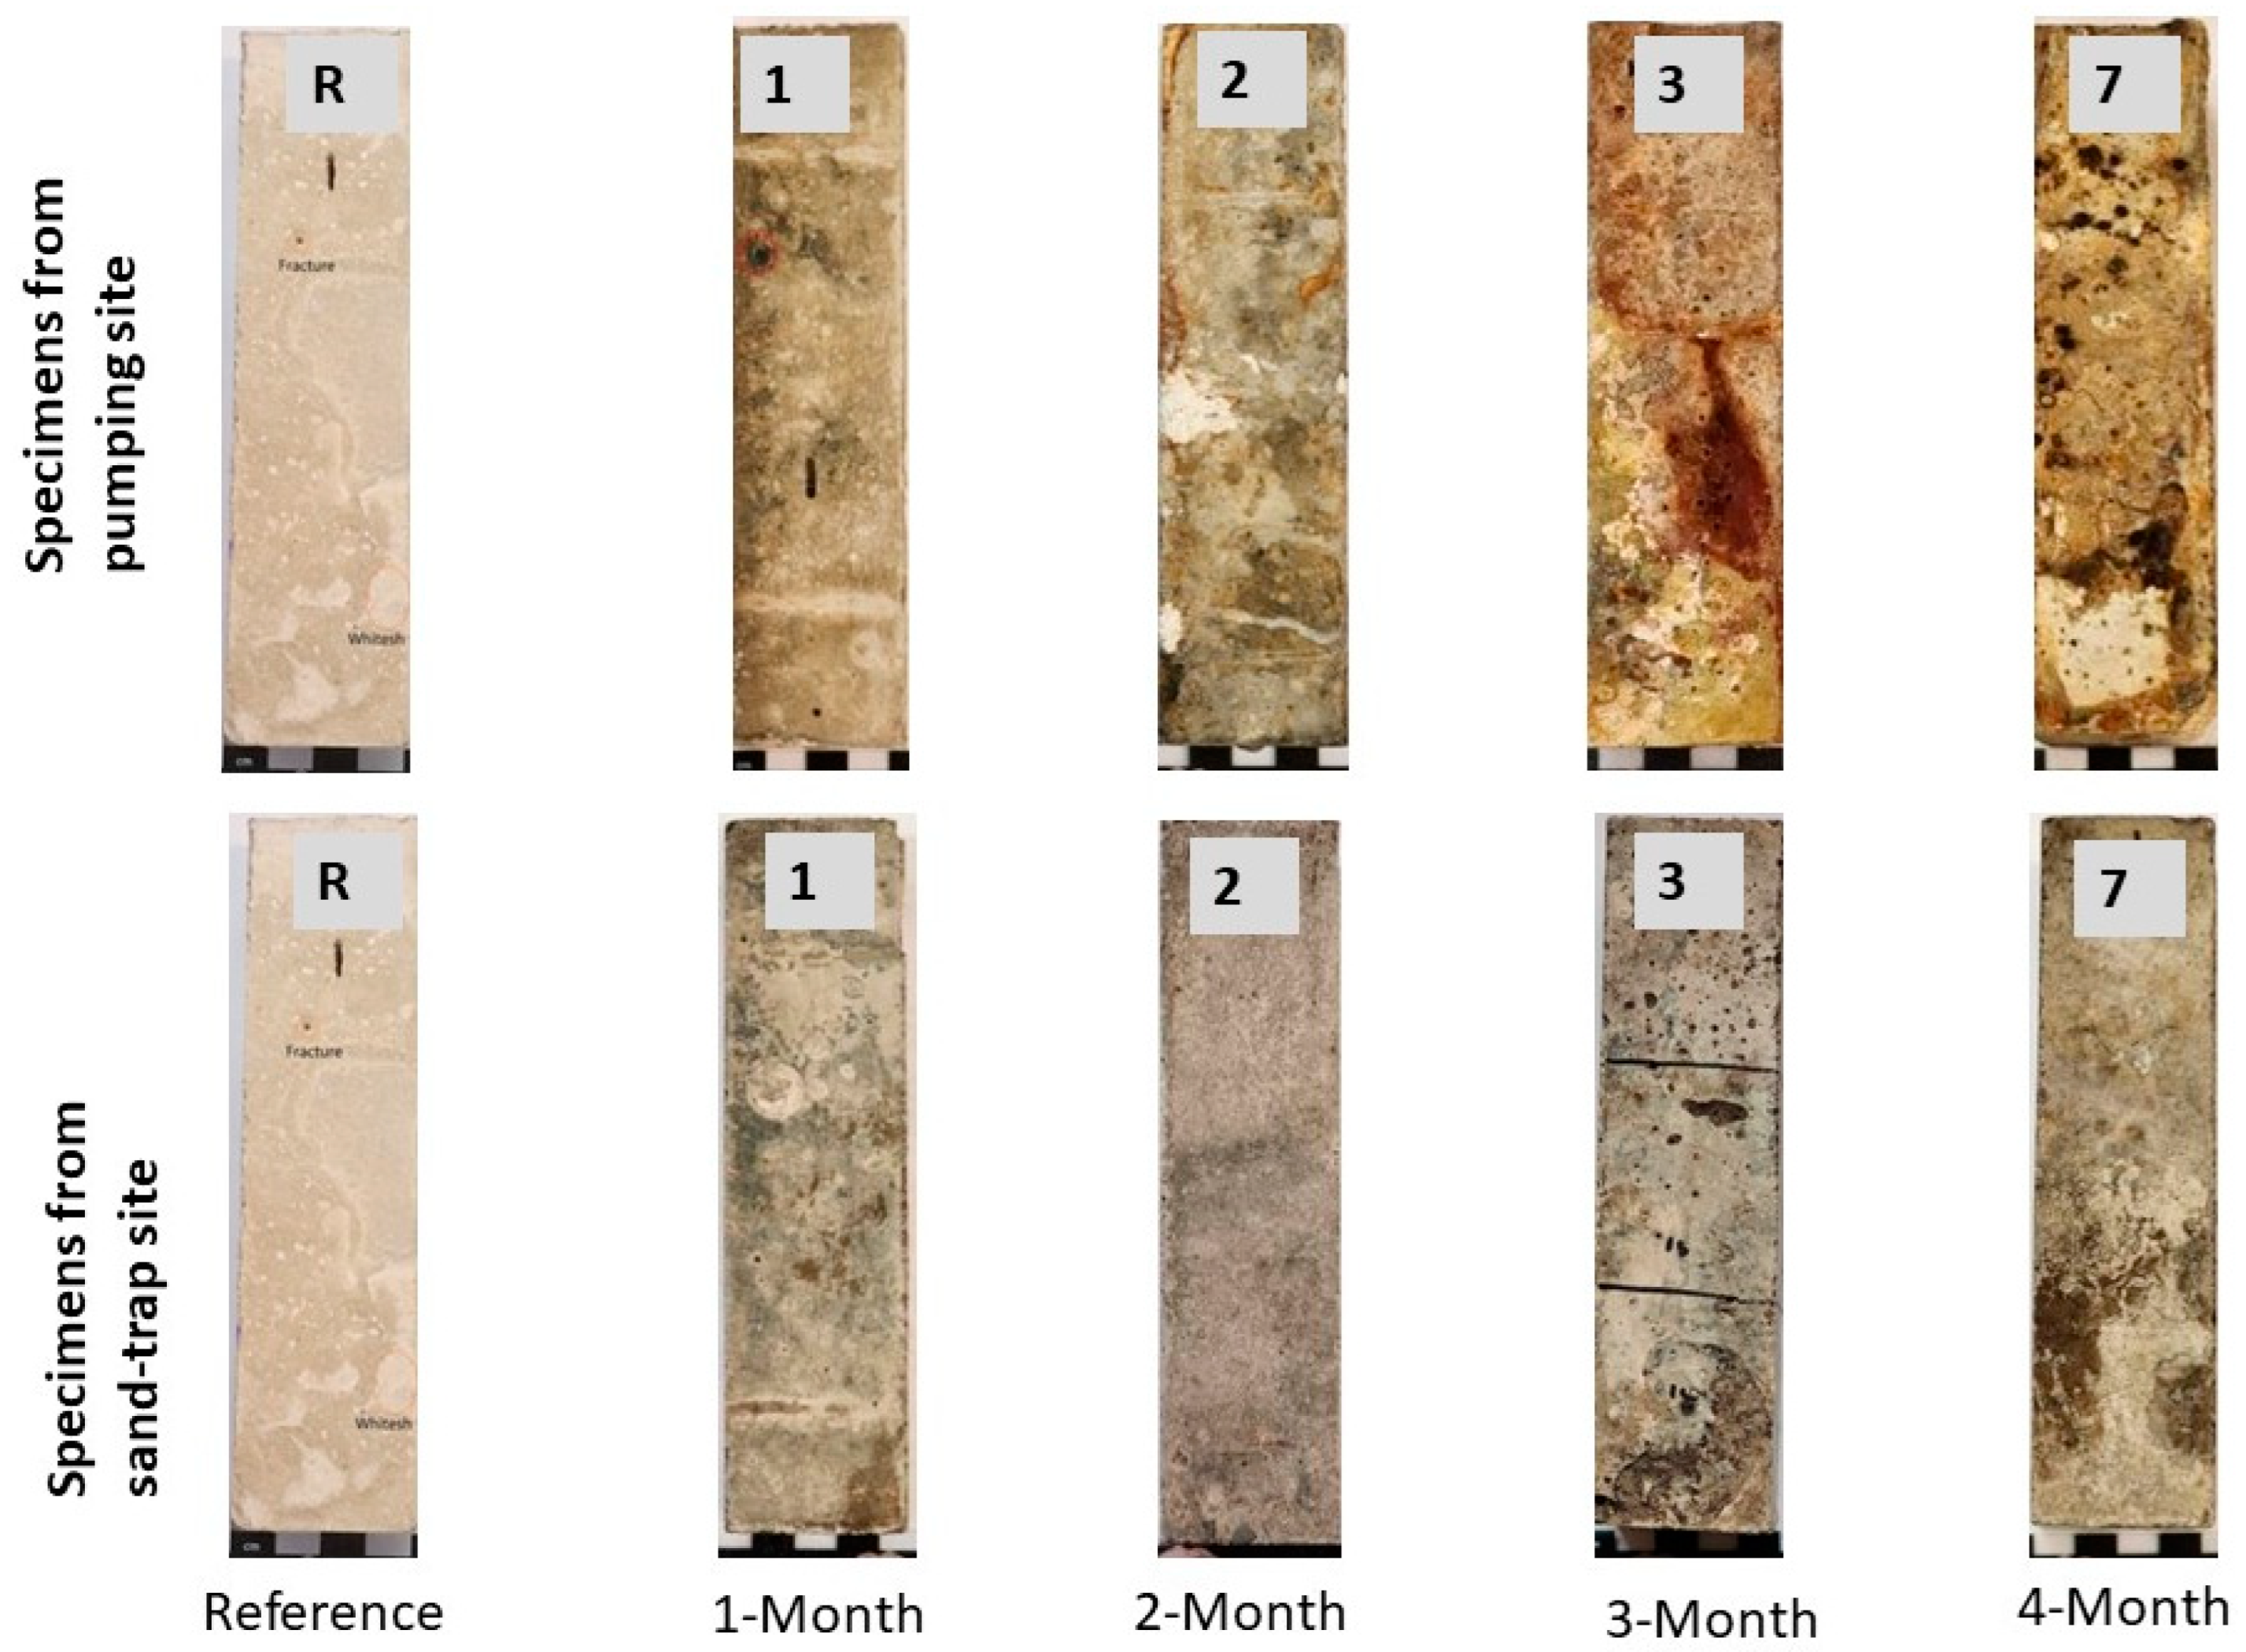
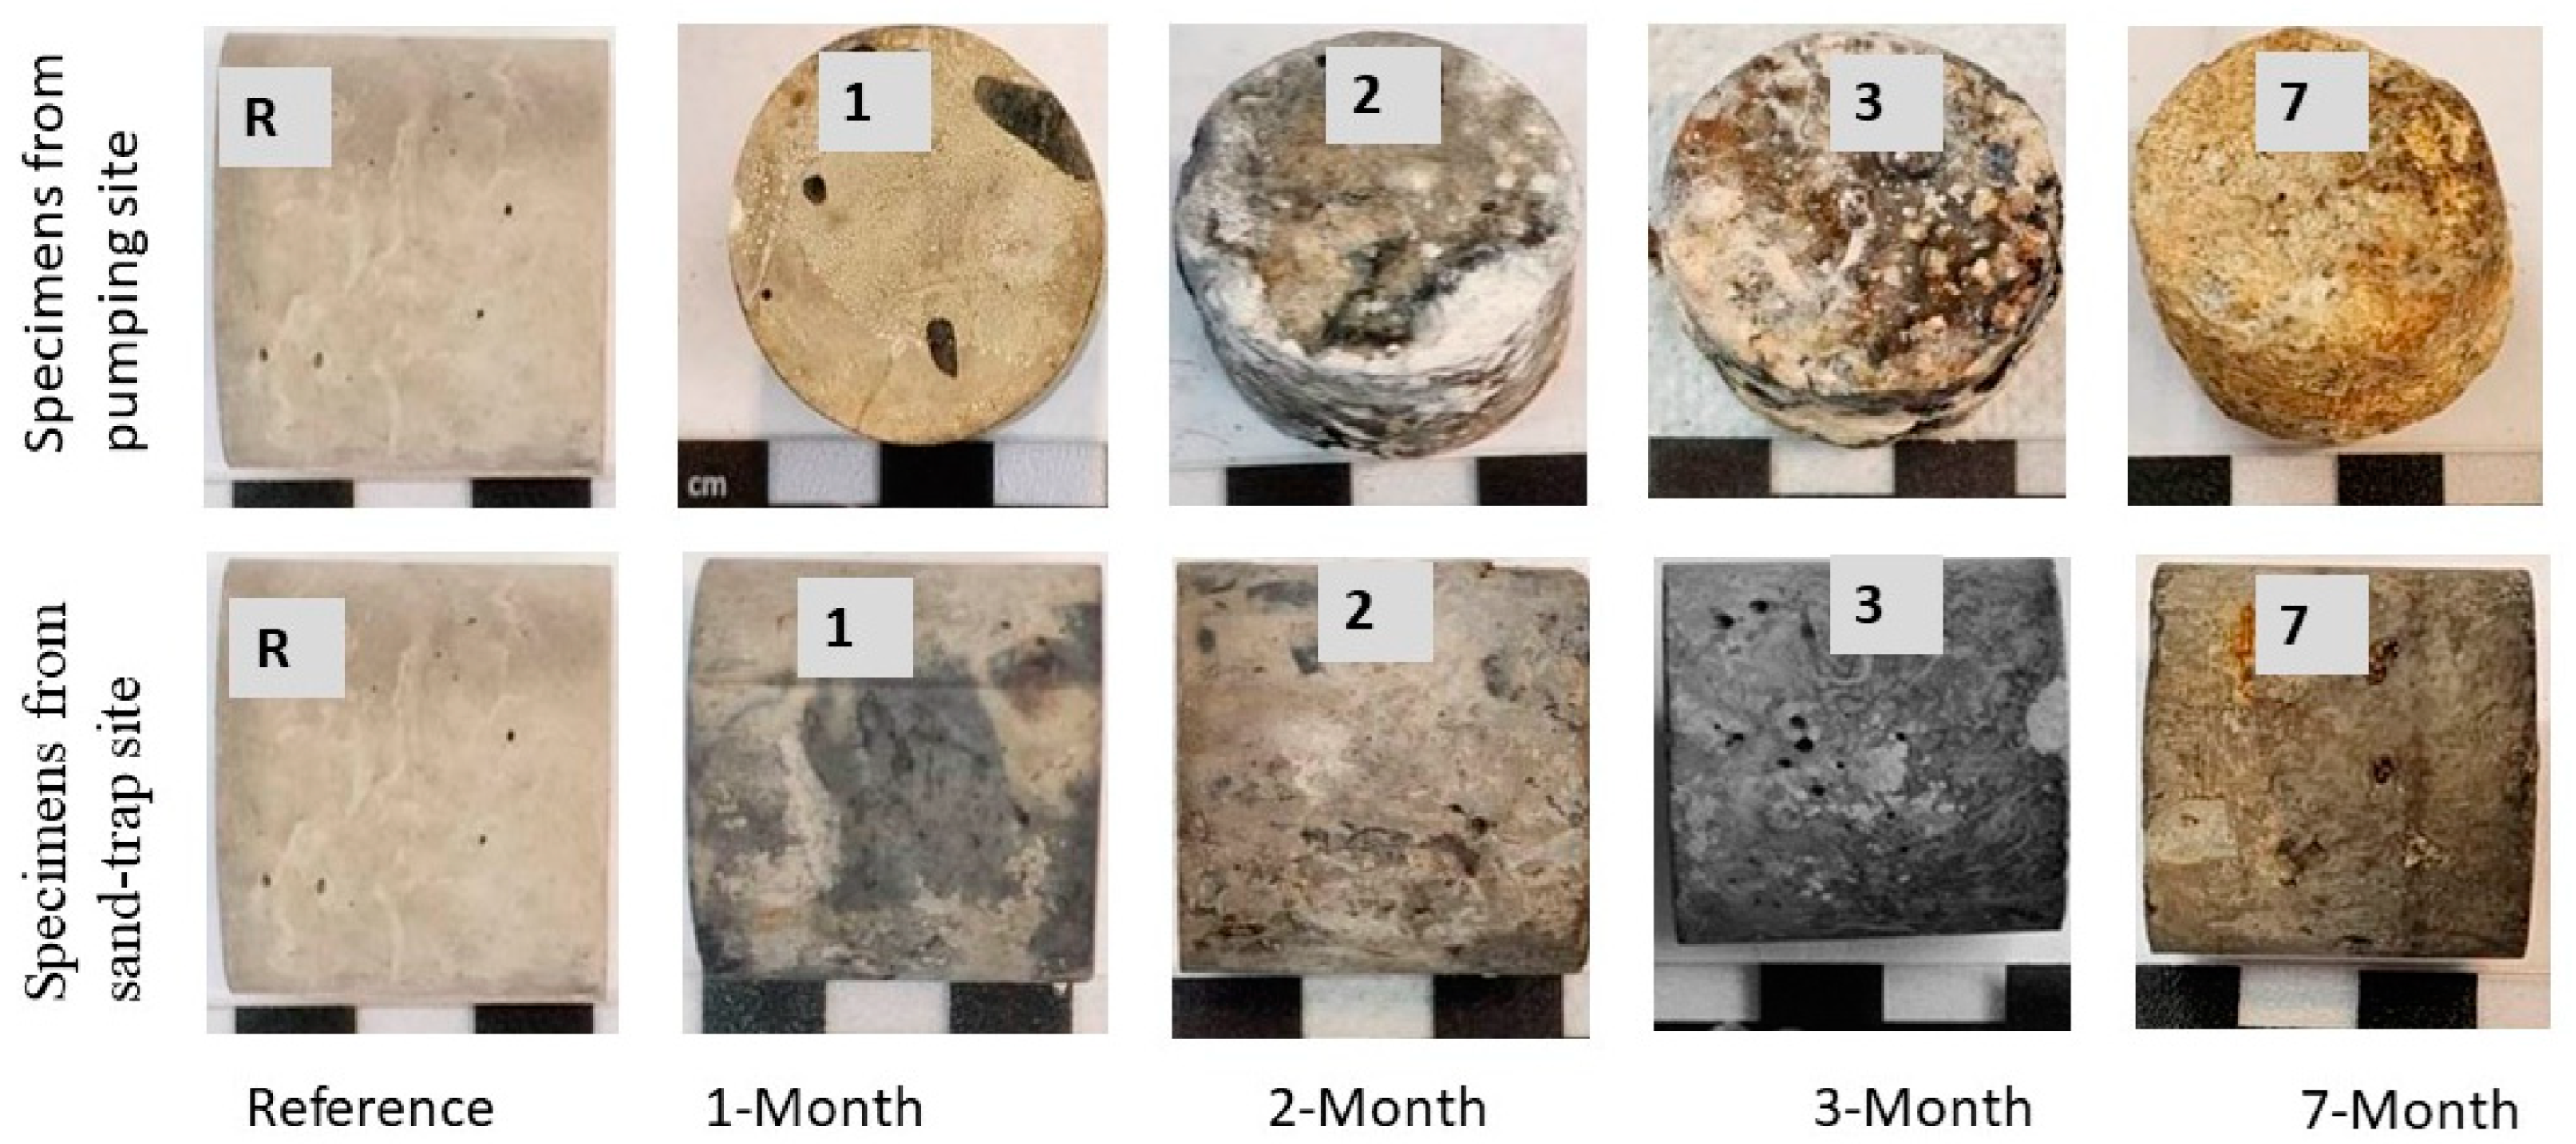
3.1. Visual Appearance

After two months of exposure to the pumping station, the specimens showed physical changes, including a change in color from grey to various colors (i.e., brown, white, yellow, red and dark grey) (Figure 2a and Figure 3a). In the sand-trap structure, specimens maintained their original grey color (Figure 2b and Figure 3b). After seven months of exposure, the surface of paste specimens in the pumping station developed massive white, soft and mushy by-products, which were easily detached. In contrast, the specimens in the sand trap did not form such products (Figure S2). Moreover, the edges of specimens from the pumping station showed more physical damage (Figure S1a,c), whereas there was less physical damage in the sand trap (Figure S1b,d).

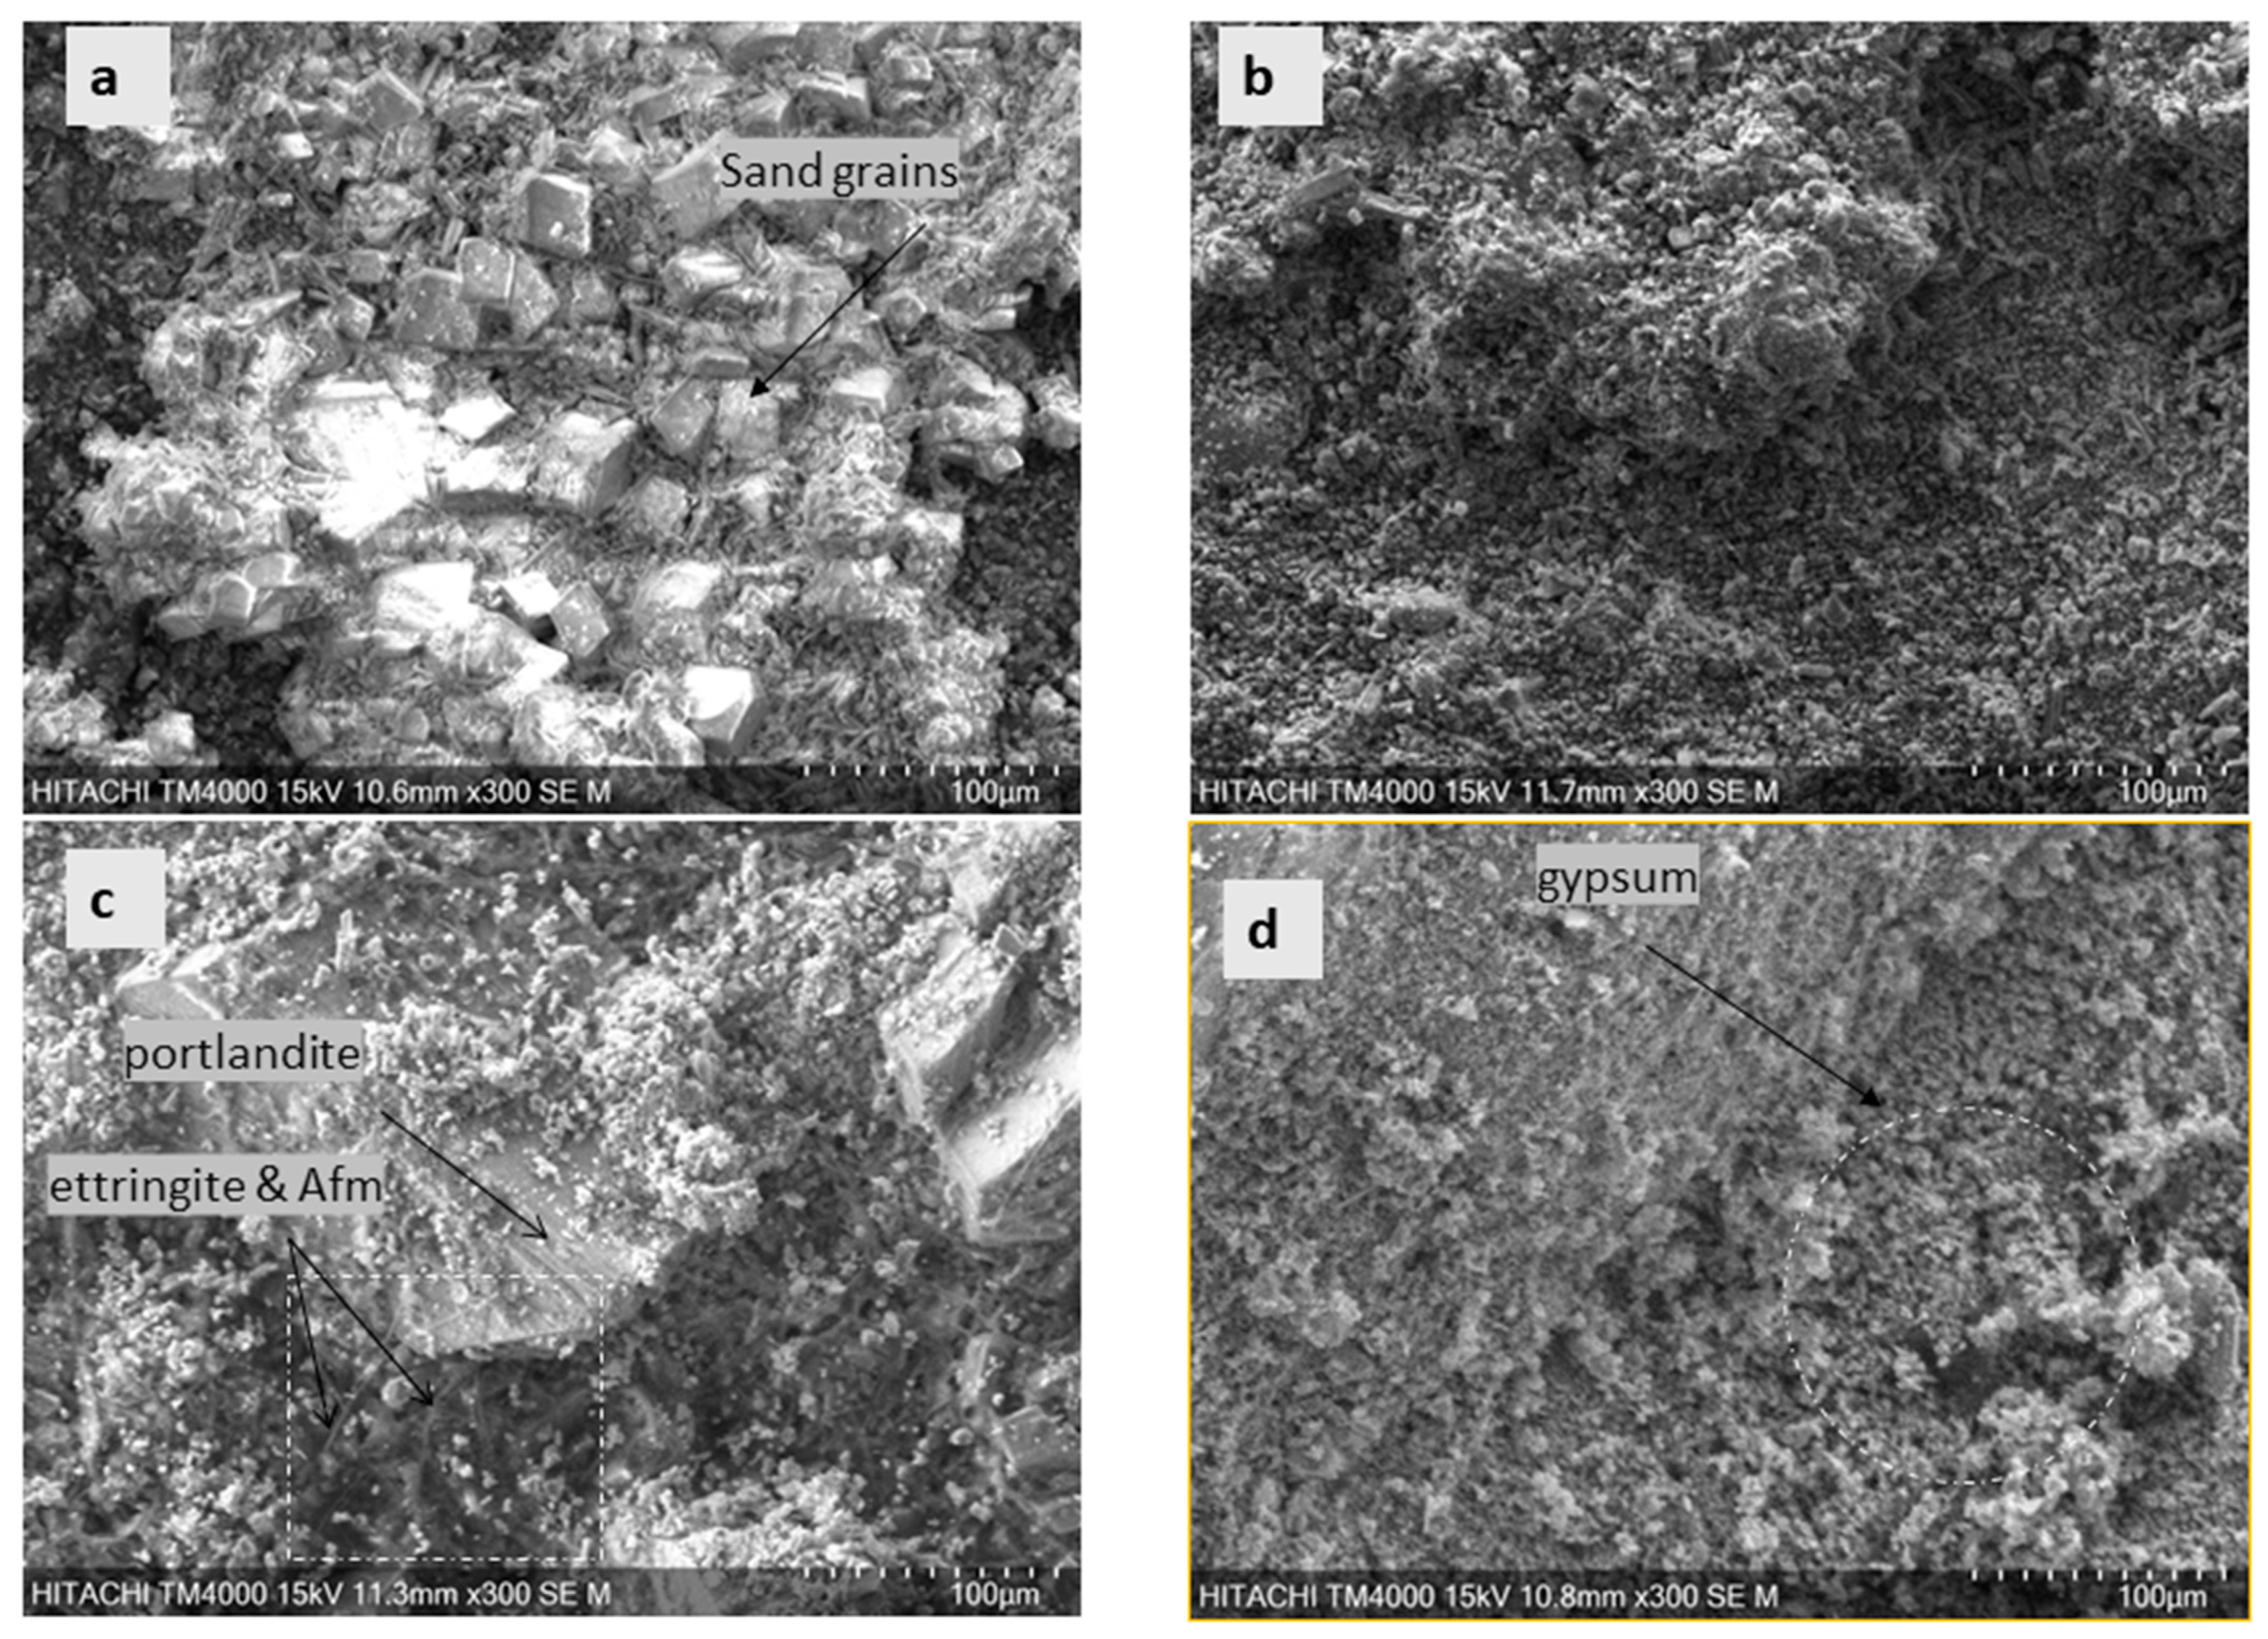
3.2. SEM Observations

Figure 4 shows different SEM images of an uncut section of specimens exposed to the pumping station. After two months of exposure in a pumping station, the microscopic observation of specimens revealed the development of massive crystals. The morphology of crystals includes sheet-like crystals, spongy-like crystals and prismatic needle-like crystals, which were later confirmed using XRD as portlandite (Ca(OH)2), gypsum (CaSO4.2H2O) and ettringite (Ca6Al2(SO4)3 (OH)12. 26H2O). This observation applied to mortars (Figure 4) and cement pastes (Figure S3b,c). During the 2-month exposure, the sheet-like crystals dominated the specimen, but over time, the surface was over-dominated by spongy-like crystals. In the sand-trap case, the specimens’ SEM images did not reveal any defined crystals (Figure S3d,e). Despite their difference in the formation of surface morphologies, the microstructure images of the cut sections of mortar samples did not show significant variations, as shown in Table S4.

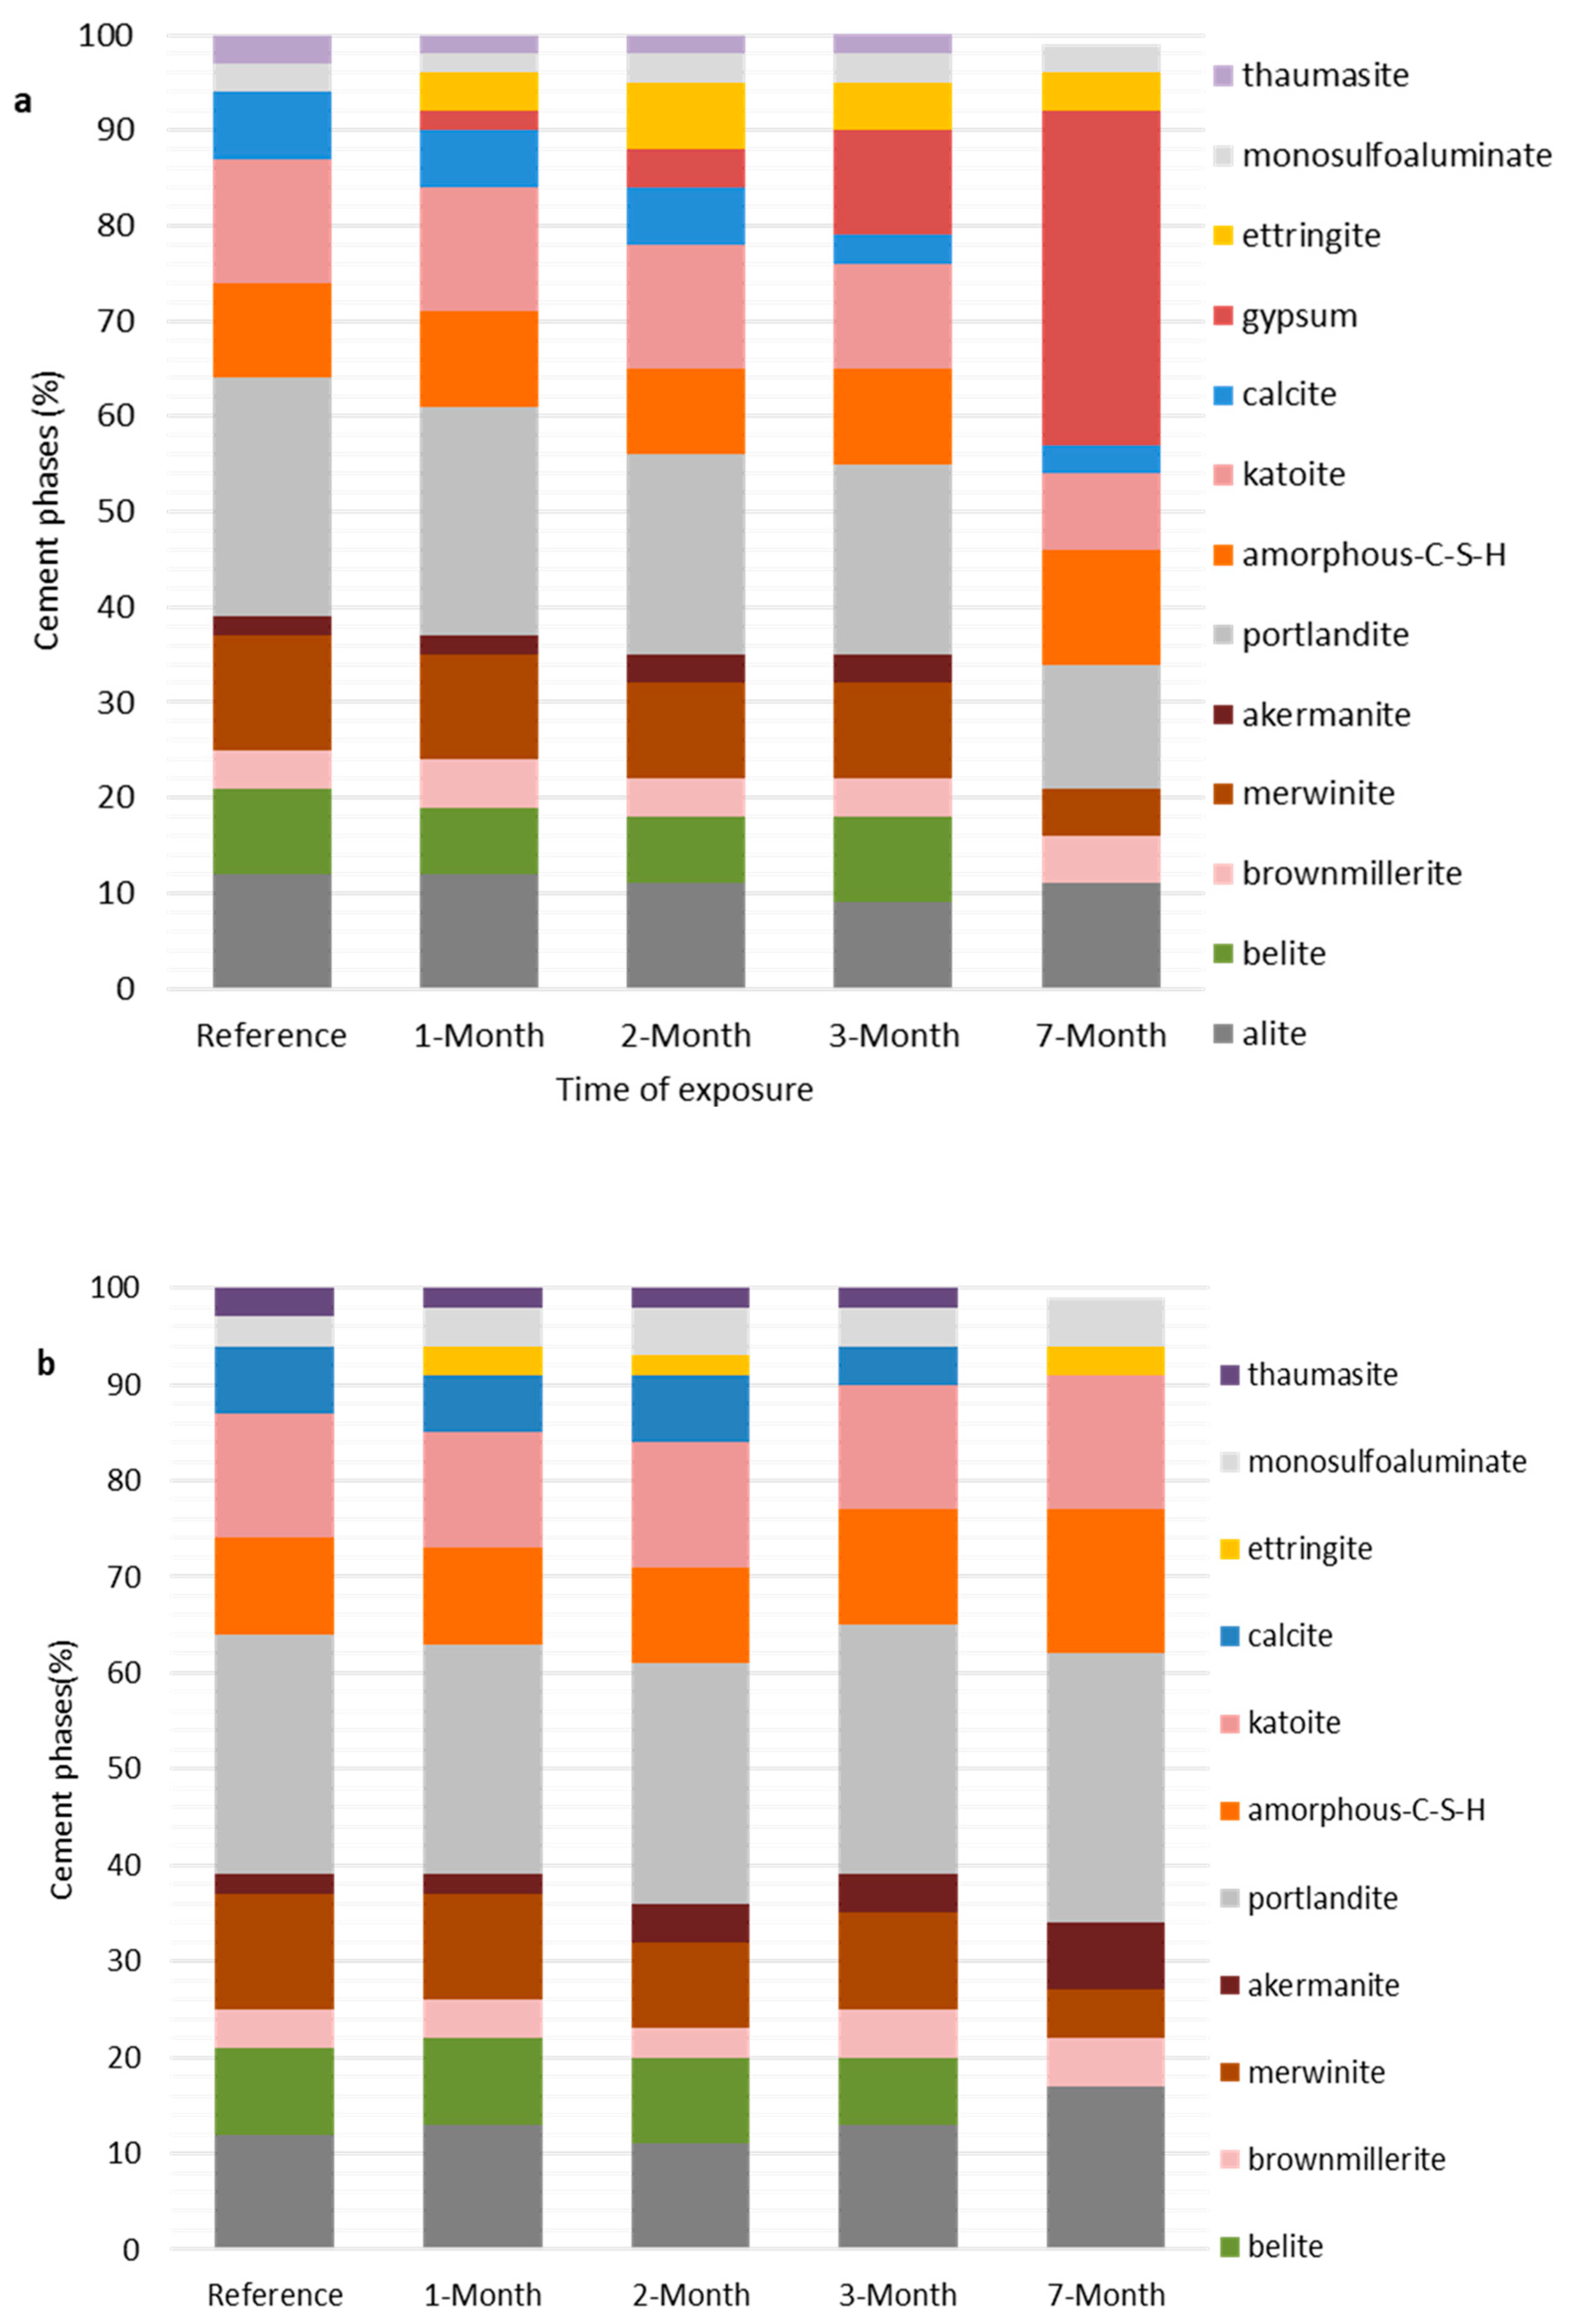
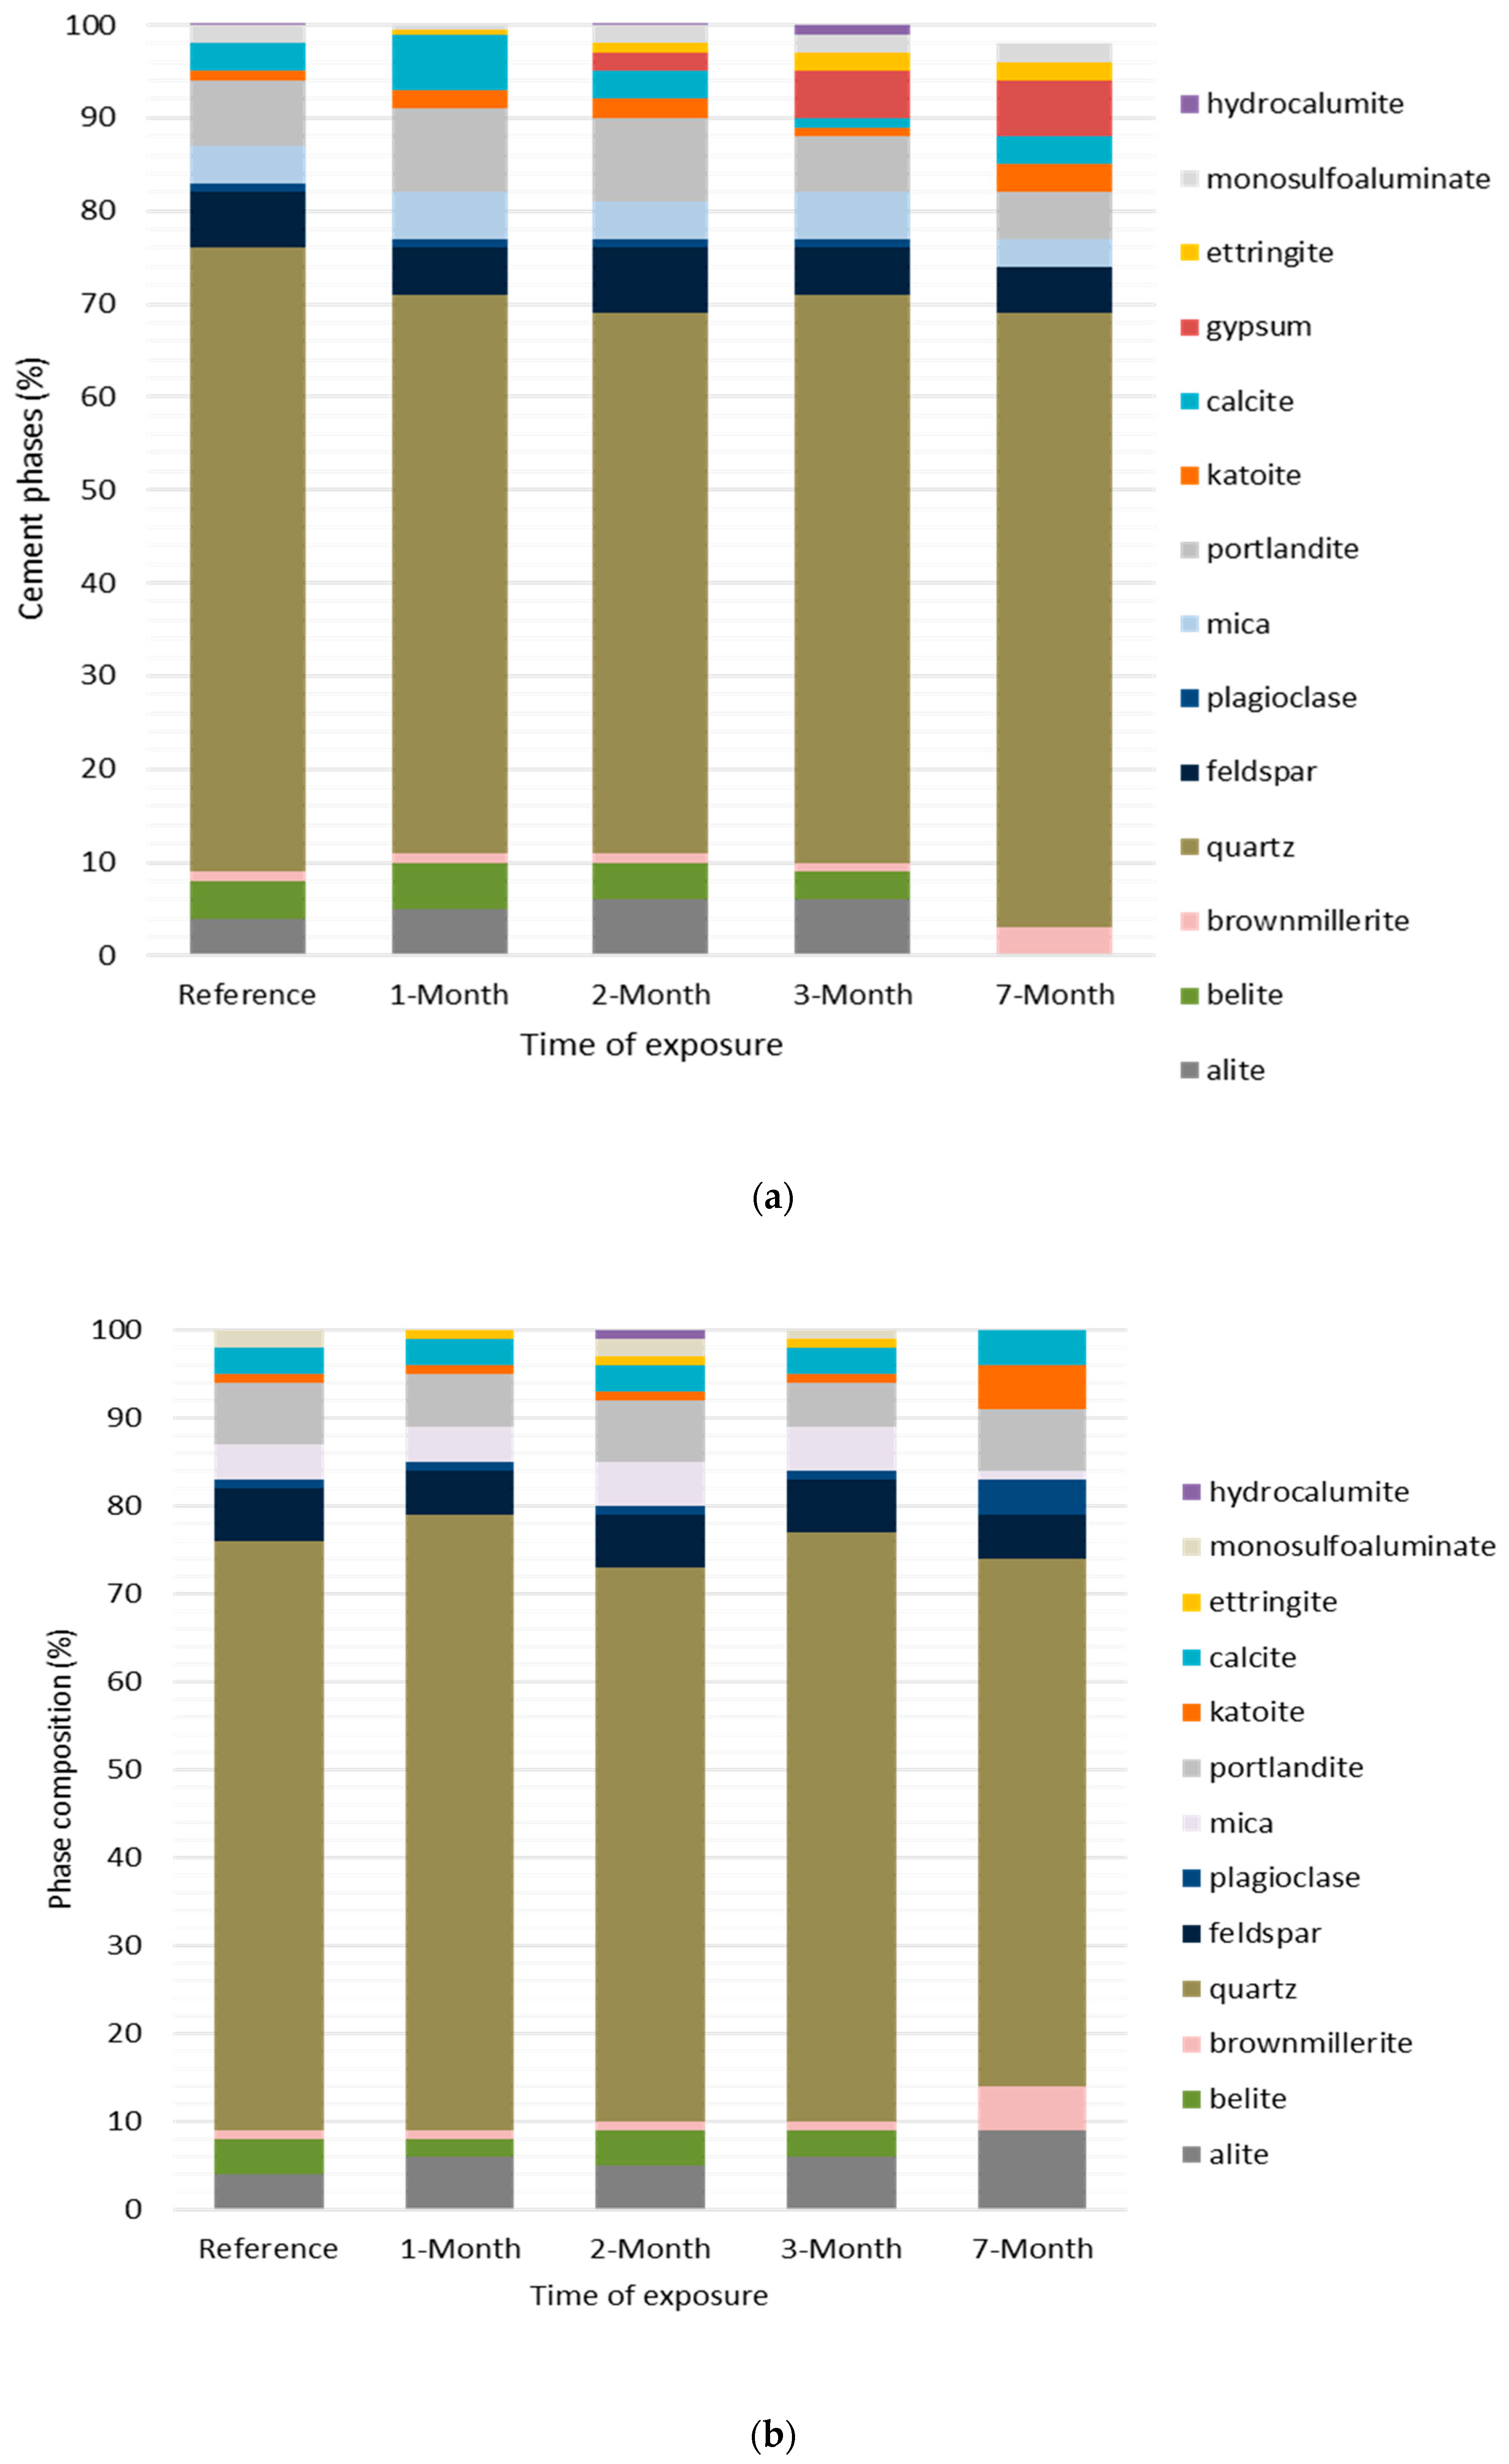
3.3. X-ray Diffraction Analysis

3.3.1. Cement Pastes

Table 3 and Table 4 show the phase composition of cement pastes from the pumping station and sand trap, respectively. The analysis of reference cement pastes shows the presence of clinkers, hydration phases and secondary phases, except gypsum and ettringite. However, after exposure to wastewater vapors in the pumping station, the following changes occurred: firstly, the amount of some phases (e.g., alite, portlandite and calcite) was slightly decreasing whereas others were increasing (e.g., brownmillerite and amorphous C-S-H); secondly, there was the appearance of new phases (e.g., gypsum and ettringite) but others were disappearing (e.g., akermanite and thaumasite). In the case of pastes from the sand trap, there was a slight increase in main clinker (i.e., alite), an increase in hydration phases (i.e., portlandite, amorphous C-S-H), the absence of gypsum and the disappearance of calcite and thaumasite during the last month of exposure. After the seventh month of exposure, the sum of phases in the cement pastes showed the following order:
  • Pumping station: secondary phases (45%) > hydration phases (33%) > clinker phases (21%).
  • Sand trap: secondary phases (8%) ˂ clinker phases (32%) ˂ hydration phases (57%).
  • After the seventh month of exposure, the total amount of secondary phases for cement pastes from the pumping station was 5.6 times higher than that in the sand-trap structure.

3.3.2. Cement Mortars

Table 5 and Table 6 show the phase composition of cement mortars exposed to the pumping station and sand trap, respectively. The phase assemblage of reference mortars shows a large amount of quartz (67%) and a small amount of other phases (i.e., clinkers, hydration, and secondary phases). As in the reference cement paste, gypsum and ettringite phases were absent from the reference mortar. Interestingly, the main binding phase (i.e., amorphous C-S-H) was also absent from the reference mortar. After a few months of exposure to the pumping station, there were slight changes in the amounts of phases, with some showing an increase whereas others showed a decrease. Notably, there was a minimal amount of gypsum appearance compared to cement pastes, with the disappearance of phases (e.g., alite, belite) and thaumasite. The amount of quartz remained large for reference and exposed mortars even after the seventh month of exposure. In the case of mortars from sand-trap structures, the phase assemblage was almost like those from the pumping station except for the absence of gypsum. After the seventh month of exposure, the sum of phases in the cement mortars was in the following order:
  • Pumping station: quartz (66%) > secondary phases (13%) > clinker phases (11%) >hydration phases (8%).
  • Sand trap: quartz (60%) > secondary phases (8%) ˂ clinker phases ˂ (32%) hydration phases (57%). After the seventh month of exposure, the total amounts of secondary phases in mortars from both sites were equal, showing no phase difference between the two systems.

4. Discussion

This paper discusses the physical and phase changes in the exposed cement specimens in the pumping station and sand-trap locations.

4.1. Physical Changes of Deteriorated Cement Specimens

(a) Pumping station
The appearance of new colors, such as white, yellow and brown, for specimens from the pumping station (Figure 2a and Figure 3a) suggests that there was the formation of deterioration products that were not present in the reference sample and in the initial months of exposure. The formation of whitish products is associated with the presence of gypsum caused by the adsorption of H2S [24], which was also demonstrated by the presence of a significant amount of gypsum and ettringite in our study (Table 2 and Table 3). The studied cement pastes from the pumping station had massive precipitation on their surface as compared to mortars (Figure S1a,c). This suggests that cement pastes were more vulnerable than mortars in the presence of aggressive wastewater gases. Also, the better performance of mortars compared to pastes is perhaps due to the added sand grains. In [25], it was suggested that the material changes associated with massive pop-ups of whitish and yellowish corrosion products resulted from an acidic attack caused by H2S, as demonstrated in this study (Table S1).
(b) Sand-trap structure
In the case of specimens from the sand-trap structure, there were few changes in the surfaces of exposed specimens, and they kept the grey color (Figure 2b and Figure 3b), suggesting that wastewater liquid (in this site) had less deterioration effect compared to wastewater gases (in the pumping station). This was also confirmed by the absence of secondary minerals linked to corrosion products such as gypsum and ettringite (Figure S3d,e).

4.2. Phase Change Due to Cement-Wastewater Interaction

The phase changes in specimens from both sites, as shown in Figure 5a,b and Figure 6a,b, are discussed in the following section. In both cases, a comparison is made between cement pastes and mortars.

4.2.1. Clinker Phases

(a) Cement paste
After the seventh month (210 days) of exposure to the pumping station, cement paste specimens had fewer clinker phases than the reference specimen (Figure 5a), suggesting that the hydration process was still taking place. The hydration process in cement lowers the amount of clinker phases, such as alite (Ca3SiO5) and belite (Ca2SiO4), by forming hydration products such as portlandite (portlandite—CH) and amorphous calcium silicate hydrate (C-S-H) [26]. Even though the cement used in the experiment initially had aluminate (Ca3Al2O6) and gypsum (Table 2), their disappearance in reference pastes suggests that they reacted entirely during the early hydration reactions in the curing stage to form monosulfoaluminates [8]. In the hydration reaction, the proposed order of disappearance of clinkers is as follows: aluminate (C3A) > alite (C3S) > brownmillerite (C4AF) > belite (C2S) [27], indicating that aluminate is highly reactive and belite is the least reactive phase. However, the results of the present study did not agree with the proposed disappearance order, as belite disappeared before alite. Presence of brownmillerite in this circumstances were not understood.
In the case of specimens from the sand trap, the higher amount of alite (17%) as compared to the reference (12%), as shown in Figure 5b, suggests that there was precipitation of alite instead of dissolution. A higher amount of alite is perhaps due to the diffusion of alkalis (i.e., Ca2+) and silicate from soil particles carried in wastewater. The diffusion of Ca2+ also tends to retard the hydration of cement, as explained in the literature [27]. Moreover, this phenomenon can be caused by the diffusion of other ions, such as Cl- and SO42- which also causes the retarding of cement hydration. An increasing tendency was observed in brownmillerite (Ca4Al2Fe2O10) and akermanite (Ca2Mg(Si2O7)) in pastes from sand-trap structures.
(b) Mortar specimens
The phase assemblage of reference and exposed mortar specimens from both locations was dominated by a large amount of quartz (>60%) (Figure 6a,b). This was due to the presence of sand grains added during the preparation of mortar [28]. The disappearance of alite from the last mortar after the seventh month of exposure suggests that mortar specimens have a higher hydration rate than cement pastes. This is due to the high porosity of the mortar matrix caused by the presence of sand, as explained in [29]. In the case of mortars from a sand trap, the reason for the slight increase in alite from 4% (in the reference specimen) to 9% (in the last specimen) is similar to that for cement pastes in the same location. Furthermore, the presence of feldspar, plagioclase and mica in mortars is associated with clay particles that might have been adsorbed by sand, and their increase in the sand-trap structure is likely caused by penetration of tiny amounts of soil particles along with sewage into the mortar matrix.

4.2.2. Hydration Phases

Portlandite (CH) and calcium silicate hydrate (C-S-H) are the main products of ordinary Portland cement hydration reactions (Equations (1) and (2)) [30]. These phases control the durability of hydrated cement by maintaining its alkalinity and mechanical properties, respectively [8]. In other words, the attack of these phases initiates the deterioration of hydrated cement due to loss of its alkalinity and mechanical strength.
In the pumping station, where specimens were exposed to wastewater vapors above wastewater liquid, the decrease in portlandite (as shown in Figure 5a) from 25% (in the reference specimen) to 13% (after the seventh month) suggests that it was being consumed by aggressive substances, perhaps H2S and CO2, to form secondary phases (i.e., gypsum and calcite). It was suggested in [31,32] that this portlandite reduction in hydrated cement occurs during acidic attacks, which decreases the pH, thereby causing its dissolution and subsequent decalcification. In the case of the sand-trap structure, the increase in portlandite (Figure 5b) suggests that specimens from this site were not subjected to acidic attacks as their counterparts from the pumping station were. The observed slight increase in portlandite is likely due to the diffusion of alkali (e.g., Ca2+) from wastewater liquids. The effects of ion diffusion in cement hydration were described in [27]. These alkalis increase the OH- in porewater by raising its pH, but also may react with available Ca2+ in porewater to form more portlandite. At a high pH (>12), the hydration phases (i.e., portlandite, C-S-H) become more stable and resist dissolution, while at a lower pH (˂12), they become unstable and undergo dissolution and decalcification. In both exposure locations, C-S-H slightly increased, suggesting that the deterioration reactions initially affect portlandite and proceed to C-S-H in the later stages. In the case of mortars, the behaviors of hydration products (i.e., portlandite and katoite (C3AH6)) were similar to those of cement paste. The presence of small amount of portlandite and the disappearance of C-S-H (Figure 6a,b) were likely due to the alkali–silica reaction (ASR) between the alkaline phases (portlandite and C-S-H) and the reactive silica from the sand forming crystalline quartz (SiO2). This was confirmed by the presence of a more significant amount of quartz, which formed a larger proportion of the phase assemblage of cement mortars (60–70%) (Figure 6a,b).
C3S+5.3H → C1.7SH4+1.3CH
C2S+4.3H → C1.7SH4+0.3CH

4.2.3. Formation of Secondary Phases

Calcite Formation

The mechanisms of calcite formation in cementitious materials were explained in, e.g.,[3,27,33] and the reaction of calcite formation is presented in Equations (3) and (4). Calcite formation is caused by carbonation, a deterioration process induced by CO2 diffusion [12,34]. In the literature, it is unclear which concrete parts, between those exposed below wastewater liquid and those above wastewater liquids (i.e., in wastewater vapors), are highly affected by the carbonation process. Some authors, e.g., [10], indicate that CO2 volatilizes into the system atmosphere after production in the sewage system, making upper parts (those above the wastewater level) more affected than those below. However, in this study, cement specimens from both sites show the presence of calcite. This suggests that wastewater liquids (in sand traps) and vapors (in pumping stations) can cause concrete carbonation. Similar results were also reported in [35], where the XRD peaks of calcite were identified in specimens exposed to entrance channels, primary sedimentation tanks and aeration tanks of an aged wastewater treatment plant. The CO2 in wastewater vapor and wastewater liquid is classified as free CO2 gas and aggressive aqueous CO2 [36]. The former is the source of the calcite in wastewater vapors (e.g., pumping station), whereas the latter is responsible for calcite formation in the wastewater liquid (e.g., sand trap). The presence of calcite in hydrated cement at the initial stages is helpful for the performance of concrete as it helps to reduce porosity and increases stiffness, thereby improving compressive strength. However, it can reduce surface pH in later stages and render the material susceptible to microbial corrosion [36].
Moreover, the disappearance of calcite in the seventh month for specimens exposed to wastewater liquid in a sand trap is linked to the increase in portlandite stability caused by high pH caused by the diffusion of wastewater alkalis. Also, the literature indicates that calcite dissolves at high pH, unlike portlandite, resulting in the release of Ca2+ and HCO3 ions.
CO2 + H2O → H2CO3
H2CO3 + Ca(OH)2 → CaCO3

Gypsum Formation

The formation of gypsum as a secondary phase in the hydrated cement is caused by actions of sulfur-related compounds (i.e., H2S and SO42−) present in wastewater [37,38]. Although it is initially added as an additive during cement grinding to control cement setting [8], its reappearance in hydrated cement as a secondary phase is not beneficial, as it causes expansion, cracking and the reduction of concrete lime. The literature suggests that gypsum precipitates in low-pH conditions, and its presence in hydrated cement indicates the aftermath of acidic corrosion by H2SO4. The phase analysis results revealed that specimens exposed to wastewater vapors in the pumping station had a significantly large amount of gypsum, and its increase was related to the decrease in portlandite (Figure 5a and Figure 6a), suggesting that in wastewater vapors, gypsum was formed at the expense of portlandite. Similar effects of acidic attack on cement portlandite were also explained in a review paper [39], as summarized in Equations (5) and (6). The deterioration process involves sulfide oxidation to sulfuric acid, which eventually reacts with portlandite to form gypsum. Further effects of acidic attack on hydrated cement were reported in [4,31,39], including dissolution and decalcification of alkaline phases (i.e., portlandite and C-S-H). This was the likely reason for the loss of physical integrity of specimens from the pumping station accompanied by surface corrosion products, as shown in Figures S1a,c and S2.
However, in the case of wastewater liquid (in the sand trap), the disappearance of gypsum from all samples throughout the exposure periods, as shown in Figure 5b and Figure 6b, suggests that the specimens were not subjected to acidic corrosion, unlike the case of wastewater vapors (in pumping station). The possible reason is due to the diffusion of alkalis (e.g., Ca2+, Na+), which increases the OH- of the porewater, thereby raising its pH. According to the literature, the dissolution of alkaline phases (such as portlandite and C-S-H) decreases at high pH. Therefore, as more wastewater was absorbed into porewater, more alkalis were also absorbed, resulting in high pH and the stability of alkaline phases. This was also confirmed by the continuous increase in portlandite and C-S-H, indicating that the wastewater specimens (in the sand trap) were not affected by the acidic attack, unlike the case of wastewater vapors (in the pumping station). Other effects caused by the diffusion of ions (e.g., Ca2+) into concrete’ porewater were described in [27,40], including retardation of hydration of cement as explained in Section 4.2.2.
Gypsum formation in H2S phase is as follows:
H2S + 2O2 → H2SO4
Ca(OH)2 + H2SO4 → CaSO4.2H2O (gypsum)

Ettringite and Monosulfoaluminate Formation

Similarly to gypsum, the formation of ettringite minerals in hydrating cement plays a significant role in the early stages, as it helps shrinkage compensation during drying [26]. However, its formation as a secondary phase causes durability challenges. It causes more considerable volume expansion, leading to severe cracking of concrete parts [8,27]. Secondary ettringite formation (also known as delayed ettringite formation in the literature) is caused by an external sulfate source from the exposure solution. Wastewater contains sulfate content (30–60 mg/L) [41], which may significantly cause ettringite formation. Ettringite formation depends on the availability of gypsum, which reacts with aluminate in porewater according to Equation (7) [30,42]. This was demonstrated by the presence of ettringite along with a high amount of gypsum in the specimens from the pumping station, as shown in Figure 5a,c. In other words, the literature states that ettringite cannot be formed without gypsum. However, its appearance in specimens from sand-trap structures in the current study suggests that ettringite can still be formed by different mechanisms, including the direct reaction of SO42− with a group of ions such as Ca2+, Al(OH)4 and OH- present in porewater as shown in Equation (8) [8]. In both mechanisms (illustrated in Equations (7) and (8)), in the event of exhaustion of either gypsum or sulfate ions, ettringite may react with aluminate to form a monosulfoaluminate phase (Afm) according to Equation (9) [30], which some studies claim is metastable phase under all conditions, and its OH may be replaced partially or totally by other anions (e.g., CO32−, SO42−, Cl) to form different deterioration phases (e.g., hydrocalumite) as reported in the current phase analysis (Figure 5b and Figure 6b).
Ettringite and Afm formation by gypsum–C3A reaction is as follows:
CaSO4.2H2O + 3CaO.Al2O3 + 26H2O → Ca6Al2(SO4)3 (OH)12. 26H2O (ettringite)
Ettringite and Afm formation by direct SO42−–ion reactions is as follows:
3Ca2+ + 2Al(OH)4 + 2OH- + 3SO42− + 2H2O→ Ca6Al2(SO4)3 (OH)12. 26H2O (ettringite)
2(Ca3.Al2O6)+ Ca6Al2(SO4)3 (OH)12. 26H2O +4H2O→ 3(Ca4Al2(SO4).12H2O) (Afm)
(c) Monosulfoaluminate formation
In a thermodynamic modeling study [43], it was reported that monosulfoaluminate (AFm) precipitation can only occur in the absence of carbonate. However, this was not the case in the actual conditions of the present study, as monosulfoaluminate was present regardless of the absence or presence of calcite in the system. This suggests that modeling or laboratory-based experiments need to be complemented by real-site experiments to better understand the chemical characterization of cement-based materials and their performances in various environments.

Thaumasite Formation

According to [27], thaumasite (Ca3Si(OH)6CO3SO4.12H2O) is formed in the presence of both carbonation and sulfate attacks in hydrated cement, as shown in Equation (10) [27], and is responsible for the severe weakening of concrete. Apart from the presence of CO2 and SO42−, its formation requires additional conditions such as the availability of calcium silicate hydrates, low temperature (˂15 °C) and high humidity [15]. Unlike calcite, which is formed after the carbonation of portlandite, resulting in a reduction in concrete alkalinity, thaumasite causes severe problems in concretes, including softening, spalling and, ultimately, the loss of structural integrity and mechanical strength. This is due to the loss of C-S-H, the main hydration product responsible for the mechanical properties of hydrated cement.
The present study noted that thaumasite formation only occurred in cement pastes, suggesting that the mortar had better resistance to thaumasite formation. The disappearance of thaumasite in cement mortars (Figure 6a,b) was caused by the absence of calcium silicate hydrate (C-S-H), which is a leading nucleating agent for thaumasite formation as indicated in Equation (10). According to [44], mortars and concrete have superior resistance against thaumasite formation because of low Ca/Si caused by sand admixture. In other words, low Ca/Si causes the instability and dissolution of C-S-H, making it hard for thaumasite to form. Other studies suggest that reactive silica in sand reacts with C-S-H together with portlandite to form quartz (SiO2), thus increasing the quantity of Si in solution against the Ca, which, lowers Ca/Si. This phenomenon was confirmed by a large quantity of quartz (60–70%) in mortars from both exposure locations.
In cement pastes, thaumasite was observed in many specimens except for reference and 7th-month specimens from both locations. In the reference specimen (stored in ambient laboratory conditions), the presence of thaumasite despite the absence of gypsum was likely due to the presence of monosulfoaluminate. Despite the presence of all conditions, the disappearance of thaumasite in the last cement paste from the pumping station was not apparent. Moreover, its disappearance in the last paste specimen from the sand-trap structure, as shown in Figure 5b, was due to the disappearance of calcite and the absence of gypsum from the hydrated cement. The disappearance of gypsum in specimens from sand traps was explained in the “Gypsum Formation” section.
3CaO.2SiO2.3H2O + 2CaSO4.2H2O + 2CaCO3 + 24H2O → 2(Ca3Si(OH)6CO3SO4.12H2O)+Ca(OH)2

5. Conclusions

In this work, the deterioration of cementitious materials subjected to wastewater vapors (in a pumping station) and wastewater liquid (in a sand trap) was evaluated and compared regarding physical and cement mineralogical changes as follows:
  • The visual and morphological analysis results indicate that the chemical conditions in the pumping station caused more deterioration in cementitious materials than those in the sand-trap structure. The deterioration signs included the formation of surface corrosion products covering the sample surface and the color and physical change of sample edges.
  • The XRD results indicate that specimens from the pumping station showed more significant cement mineralogical changes than those from sand-trap structures. The significant mineralogical change of specimens from the pumping station was due to the formation of gypsum, which is 35% of the mass of the exposed specimens. The gypsum formation resulted from biogenic sulfuric acid attack caused by the oxidation of H2S in wastewater vapors. On the other hand, specimens from sand-trap structure showed no presence of gypsum but increase in portlandite can be observed. The increase in portlandite in the sand trap means that the wastewater liquid was less likely to cause acidic corrosion of the exposed cement. Instead, it contributed to the diffusion of ions such as Ca2+ into the cement matrix, thereby increasing its stability towards wastewater exposure. The overall amount of secondary mineral phases (e.g., gypsum) in the pumping station was up to 5.6 times higher than the amount in the sand-trap structure.
  • In each exposure location, cement mortar specimens had little change compared to pastes, suggesting that the addition of sand improves the cement mortar’ resistance to deterioration.

Supplementary Materials

Supporting information can be downloaded at https://www.mdpi.com/article/10.3390/jcs8020060/s1; Figure S1: A 3D view of exposed mortars (a,b) and paste (c,d) after the seventh month of exposure; Figure S2: Surface corrosion on mortars (left) and paste (right) after the seventh month of exposure in the pumping station; Figure S3: SEM images of uncut sections showing morphologies for the reference specimen (labeled a and d) and 2- and 3-month-old specimens in pumping station (labeled b and c) and sand-trap (labeled d and e); Figure S4: Microstructure of cut sections of mortars: (a) reference, (b) 7-month-old mortar from the pumping station, and (c) 7-month-old mortar from sand trap; Table S1: Environmental characteristics of the exposure sites.

Author Contributions

Conceptualization, N.T.K. and C.S.; funding acquisition, Z.S.-K. and E.T., investigation, all authors; methodology, N.T.K., E.T., Z.S.-K. and C.S.; formal analysis, N.T.K.; writing—original draft preparation, N.T.K.; writing—review and editing, E.T., Z.S.-K., C.S.,V.G., M.K.; supervision, E.T., Z.S.-K., C.S. and V.G.; project administration, C.S., K.G., M.K and K.A. All authors have read and agreed to the published version of the manuscript.

Funding

This work received no external funding whereas the APC was covered by the Doctoral School of Environmental Sciences at Eötvös Loránd University (Budapest, Hungary) and partially by the first author.

Data Availability Statement

All the data is published in the paper.

Acknowledgments

This work was made possible with the help of staff from the material laboratory at CEMKUT in donating cement, specimen preparation and testing. The authors also express their gratitude for the help provided by the administration of Transdanubian Regional Waterworks Ltd for giving access to the wastewater treatment plant used in the in-situ experiment. The first author acknowledges the Stipendium Hungaricum Scholarship program (Hungary) for sponsoring his PhD studies.

Conflicts of Interest

The authors declare no conflict of interest. Viktória Gável and Miklós Kürthy are employees of CEMKUT Ltd (Hungary) and Transdanubian Regional Waterworks Ltd (Hungary) respectively. The paper reflects the views of the scientists and not the company.

References

  1. Bartram, J.; Brocklehurst, C.; Bradley, D.; Muller, M.; Evans, B. Policy review of the means of implementation targets and indicators for the sustainable development goal for water and sanitation. Npj Clean Water 2018, 1, 3. [Google Scholar] [CrossRef]
  2. O’Connell, M.; McNally, C.; Richardson, M.G. Biochemical attack on concrete in wastewater applications: A state of the art review. Cem. Concr. Compos. 2010, 32, 479–485. [Google Scholar] [CrossRef]
  3. Jedidi, M.; Benjeddou, O. Chemical causes of concrete degradation. MOJ Civ. Eng. 2018, 4, 40–46. [Google Scholar] [CrossRef]
  4. Grengg, C.; Ukrainczyk, N.; Koraimann, G.; Mueller, B.; Dietzel, M.; Mittermayr, F. Long-term in situ performance of geopolymer, calcium aluminate and Portland cement-based materials exposed to microbially induced acid corrosion. Cem. Concr. Res. 2020, 131, 106034. [Google Scholar] [CrossRef]
  5. Drugă, B.; Ukrainczyk, N.; Weise, K.; Koenders, E.; Lackner, S. Interaction between wastewater microorganisms and geopolymer or ce-mentitious materials: Biofilm characterization and deterioration characteristics of mortars. Int. Biodeterior. Biodegrad. 2010, 134, 58–67. [Google Scholar] [CrossRef]
  6. Metalssi, O.O.; Touhami, R.R.; Barberon, F.; d’Espinose de Lacaillerie, J.; Roussel, N.; Divet, L.; Torrenti, J. Understanding the degradation mechanisms of cement-based systems in combined chloride-sulfate attack. Cem. Concr. Res. 2023, 164, 107065. [Google Scholar] [CrossRef]
  7. Wells, T.; Melchers, R.E.; Bond, P. Factors involved in the long-term corrosion of concrete sewers. In Proceedings of the 49th Annual Conference of the Australasian Corrosion Association 2009: Corrosion and Prevention 2009, Coffs Harbour, Australia, 15–18 November 2009; Australasian Corrosion Association Inc.: Preston, Australia, 2009; pp. 345–356. Available online: https://www.researchgate.net/publication/43527972 (accessed on 19 April 2023).
  8. Taylor, H.F.W. Cement Chemistry, 2nd ed.; Academic Press: London, UK, 1990; pp. 383–401. [Google Scholar]
  9. Cwalina, B. Biodeterioration of Concrete, Brick and Other Mineral-Based Building Materials; Woodhead Publishing Limited: Cambridge, UK, 2014; pp. 281–312. [Google Scholar] [CrossRef]
  10. Grengg, C.; Mittermayr, F.; Ukrainczyk, N.; Koraimann, G.; Kienesberger, S.; Dietzel, M. Advances in concrete materials for sewer sys-tems affected by microbial induced concrete corrosion: A review. Water Res. 2018, 134, 341–352. [Google Scholar] [CrossRef]
  11. Kong, L.; Han, M.; Yang, X. Evaluation on relationship between accelerated carbonation and deterioration of concrete subjected to a high-concentrated sewage environment. Constr. Build. Mater. 2020, 237, 117650. [Google Scholar] [CrossRef]
  12. Noeiaghaei, T.; Mukherjee, A.; Dhami, N.; Chae, S.R. Biogenic deterioration of concrete and its mitigation technologies. Constr. Build. Mater. 2017, 149, 575–586. [Google Scholar] [CrossRef]
  13. Estokova, A.; Harbulakova, V.O.; Luptakova, A.; Kovalcikova, M. Analyzing the relationship between chemical and biological-based deg-radation of concrete with sulfate-resisting cement. Polish J. Environ. Stud. 2019, 28, 2121–2129. [Google Scholar] [CrossRef]
  14. Grandclerc, A.; Dangla, P.; Gueguen-Minerbe, M.; Chaussadent, T. Modelling of the sulfuric acid attack on different types of cementitious materials. Cem. Concr. Res. 2018, 105, 126–133. [Google Scholar] [CrossRef]
  15. Rahman, M.M.; Bassuoni, M.T. Thaumasite sulfate attack on concrete: Mechanisms, influential factors and mitigation. Constr. Build. Mater. 2014, 73, 652–662. [Google Scholar] [CrossRef]
  16. Stanaszek-Tomal, E.; Fiertak, M. Biological Corrosion in The Sewage System and The Sewage Treatment Plant. Procedia Eng. 2016, 161, 116–120. [Google Scholar] [CrossRef]
  17. BS EN 197-1; Cement composition, specifications and conformity criteria for common cements. European Standards Institution: Brussels, Belgium, 2011.
  18. BS EN 196-1; Methods of Testing Cement—Determination of Strength. European Standards Institution: Brussels, Belgium, 2016.
  19. BS EN 196-3; Methods of Testing Cement-Determination of Setting Time and Soundness. European Standards Institution: Brussels, Belgium, 2016.
  20. BS EN 196-2; Methods of Testing Cement—Method of Testing Cement—Chemical Analysis of Cement. European Standards Institution: Brussels, Belgium, 2013.
  21. MSZ 525-12; Chemical Analysis of Cements—Determination of Free Lime Content. Hungarian Standards Organization: Budapest, Hungary, 2014.
  22. Stutzman, P.; Heckert, A.; Tebbe, A.; Leigh, S. Uncertainty in Bogue-calculated phase composition of hydraulic cements. Cem. Concr. Res. 2014, 61–62, 40–48. [Google Scholar] [CrossRef]
  23. Skiljan, I. Irfanview 64 Software (Online). Available online: https://www.irfanview.com (accessed on 12 December 2022).
  24. Wang, Y.; Su, F.; Li, P.; Wang, W.; Yang, H.; Wang, L. Microbiologically induced concrete corrosion in the cracked sewer pipe under sus-tained load. Constr. Build. Mater. 2023, 369, 130521. [Google Scholar] [CrossRef]
  25. Madraszewski, S.; Sielaff, A.M.; Stephan, D. Acid attack on concrete—Damage zones of concrete and kinetics of damage in a simulating laboratory test method for wastewater systems. Constr. Build. Mater. 2023, 366, 130121. [Google Scholar] [CrossRef]
  26. Odler, I. Hydration, Setting and Hardening of Portland Cement. In Lea ’s Chemistry of Cement and Concrete, 4th ed.; Hewlett, P.C.T., Ed.; Elservier-Butterworth-Heinemann: Oxford, UK, 2004; pp. 241–289. [Google Scholar]
  27. Bensted, J. Chemical degradation of concrete. In Durability of Concrete and Cement Composites, 1st ed.; Page, C.L., Page, M.M., Eds.; Elsevier Ltd-Woodhead Publishing Limited: Cambridge, UK, 2007; pp. 86–135. [Google Scholar]
  28. Parasuraman, R.K.; Ramanathan, S.; Santhanam, M.; Gettu, R. Micro-Analytical Characterisation of Concrete Deterioration due to Acid Attack in a Sewage Treatment Plant. In Proceedings of the International Conference on Advances in Construction Materials and Systems (ICACMS 2017), Chennai, India, 3–8 September 2017; Available online: https://www.researchgate.net/publication/321120687 (accessed on 15 July 2023).
  29. Bu, J.; Tian, Z.; Zheng, S.; Tang, Z. Effect of sand content on strength and pore structure of cement mortar. J. Wuhan Univ. Technol. Mater. Sci. Ed. 2017, 32, 382–390. [Google Scholar] [CrossRef]
  30. Scrivener, K.L.; Snellings, R. The Rise of Portland Cements. Elements 2022, 18, 308–313. [Google Scholar] [CrossRef]
  31. Bihua, X.; Bin, Y.; Yongqing, W. Anti-corrosion cement for sour gas (H2S-CO2) storage and production of HTHP deep wells. Appl. Geo-chem. 2018, 96, 155–163. [Google Scholar] [CrossRef]
  32. Wang, A.; Zheng, Y.; Zhang, Z.; Liu, K.; Li, Y.; Shi, L.; Sun, D. The Durability of Alkali-Activated Materials in Comparison with Ordinary Portland Cements and Concretes: A Review. Engineering 2020, 6, 695–706. [Google Scholar] [CrossRef]
  33. Šavija, B.; Luković, M. Carbonation of cement paste: Understanding, challenges, and opportunities. Constr. Build. Mater. 2016, 117, 285–301. [Google Scholar] [CrossRef]
  34. Dyer, T. Biodeterioration of Concrete, 1st ed.; CRC Press, Taylor& Francis Group: Boca Raton, FL, USA, 2017; pp. 1–287. [Google Scholar] [CrossRef]
  35. Moradian, M.; Shekarchi, M.; Pargar, F.; Bonakdar, A.; Valipour, M. Deterioration of Concrete Caused by Complex Attack in Sewage Treatment Plant Environment. J. Perform. Constr. Facil. 2012, 26, 124–134. [Google Scholar] [CrossRef]
  36. Szmigiera, E.; Adamczewski, G.; Chilmon, P.; Woyciechowski, K.; Łukowski, P.; Spodzieja, S. Concrete corrosion in a wastewater treat-ment plant—Acomprehensive case study. Constr. Build. Mater. 2021, 303, 124388. [Google Scholar] [CrossRef]
  37. Grengg, C.; Kiliswa, M.W.; Mittermayr, F.; Alexander, M.G. Microbially-induced Concrete Corrosion—A worldwide problem. In Proceedings of the International RILEM Symposium on the Microorganisms—Cementitious materials Interaction (TC253-MCI), Delft, The Netherlands, 3 June 2016; Available online: https://www.researchgate.net/publication/308698497 (accessed on 25 September 2023).
  38. Krysiak, Ł.; Falaciński, P.; Szarek, Ł. Identification of Biogenic Sulphate Corrosion of Concrete in Sewage Treatment Plant Settling Tank Walls. Civ. Environ. Eng. Rep. 2020, 30, 253–264. [Google Scholar] [CrossRef]
  39. Wu, M.; Wang, T.; Wu, K.; Kan, L. Microbiologically induced corrosion of concrete in sewer structures: A review of the mechanisms and phenomena. Constr. Build. Mater. 2020, 239, 117813. [Google Scholar] [CrossRef]
  40. Nilsson, L. Durability concept; pore structure and transport processes. In Advanced Concrete Technology-Concrete Properties, 1st ed.; Newman, J., Choo, B.S., Eds.; Elservier-Butterworth-Heinemann: Oxford, UK, 2003; pp. 190–213. [Google Scholar]
  41. Davis, M. Water and Wastewater Engineering; McGraw-Hill Professional: New York, NY, USA, 2010; p. 806. [Google Scholar]
  42. Song, H.; Yao, J.; Luo, Y.; Gui, F. A chemical-mechanics model for the mechanics deterioration of pervious concrete subjected to sulfate attack. Constr. Build. Mater. 2021, 312, 125383. [Google Scholar] [CrossRef]
  43. Lothenbach, B.; Winnefeld, F. Thermodynamic modelling of the hydration of Portland cement. Cem. Concr. Res. 2006, 36, 209–226. [Google Scholar] [CrossRef]
  44. Zhou, Y.; Ma, B.; Huang, J.; Li, X.; Tan, H.; Lv, Z. Influence of Ca/Si ratio of concrete pore solution on thaumasite formation. Constr. Build. Mater. 2017, 153, 261–267. [Google Scholar] [CrossRef]
Figure 1. The in situ experiment set-up shows specimens exposed to the pumping station (a) and to sand-trap structure (b). In the pumping station, sample holders were fixed above the wastewater line, and the system was always closed except during sample removal. In contrast, in the sand-trap structure, sample holders were submerged in wastewater liquid and fixed on a metal bar.
Jcs 08 00060 g001
Figure 2. Physical changes of cement paste specimens after different periods of exposure (R indicates the reference specimen, and the numbers on specimens indicate the periods of exposure in months). The specimens from the pumping station after 2, 3, and 7 months of exposure show the development of surface deterioration products, whilst their counterparts from sand-trap structures show no surface deterioration products.
Jcs 08 00060 g002
Figure 3. Physical change of cement mortar specimens after different periods of exposure (R indicates the reference specimen, and numbers on specimens indicate the periods of exposure in months). The specimens from the pumping station after 2, 3 and 7 months of exposure show more considerable surface changes than their counterparts from sand-trap structures.
Jcs 08 00060 g003
Figure 4. SEM images of specimens from the pumping station indicating the morphologies on their surfaces: (a) reference; (b) 1-month-old specimen; (c) 2-month-old specimen; (d) 3-month-old specimen; Afm—monosulfoaluminate.
Jcs 08 00060 g004
Figure 5. (a) Phase composition of cement pastes exposed to the pumping station. Phases between alite and akermanite from the bottom are unreacted clinkers, whereas those from portlandite to katoite are hydration products, and the remaining phases between calcite and thaumasite are secondary phases formed from deterioration reactions. (b) Phase composition of cement pastes exposed to the sand-trap structure. Phases between alite and akermanite from the bottom are unreacted clinkers, but those from portlandite to katoite are hydration products, and the rest are secondary phases.
Jcs 08 00060 g005
Figure 6. (a) Phase composition of cement mortars exposed to the pumping station. Phases between alite and brownmillerite from the bottom are clinker phases; those from quartz to mica are natural minerals from sand, whereas those between portlandite and katoite are hydration products, and the remaining are secondary phases. (b) Phase composition of cement mortars exposed to the sand-trap structure. Phases between alite and brownmillerite from the bottom are the unreacted clinker phases; however, those from quartz to mica are natural minerals from sand, those between portlandite and katoite are hydration products, and the remaining are secondary phases.
Jcs 08 00060 g006
Table 1. Chemical composition of cement used for specimens.
ComponentsSiO2Al2O3Fe2O3CaOMgOK2ONa2OSO3Cl-TiO2
(m/m%)19.215.833.6265.752.400.260.023.430.0160.4
Chemical composition was determined by wet chemistry according to EN 196-2 [20]and MSZ 525-5 (for TiO2) [21].
Table 2. Calculated clinker phases of the used cement.
Clinker PhaseAlite (C3S)Belite (C2S)Aluminate (C3A)Aluminoferrite
(C4AF)
GypsumFree CaOInsoluble Residue
(m/m%)57.4511.789.3011.025.832.50.36
The theoretical clinker phase compositions were calculated using Bogue formulae [22]. Free CaO and insoluble residue were determined according to MSZ 525-12 [21]and EN 196-2 [20]standards, respectively.
Table 3. Phase composition (%) in paste specimens from pumping site.
SampleClinker PhasesMinor Clinker PhasesHydration PhasesSecondary Phases
AliteBeliteBrownmilleriteMerwiniteAkermanitePortlanditeAmorphous C-S-HKatoiteCalciteGypsumEttringiteMonosulfoaluminateThaumasite
Reference12941222510137ndnd33
1-Month127511224101362422
2-Month11741032191364732
3-Month994103201011311533
7-Month11nd55nd1312833543nd
nd—not detected.
Table 4. Phase composition (%) in paste specimens from sand trap.
SamplesClinker PhasesMinor ClinkersHydration PhasesSecondary Phases
AliteBeliteBrownmilleriteMerwiniteAkermanitePortlanditeAmorphous C-S-HKatoiteCalciteGypsumEttringiteMonosulfoaluminateThaumasite
Reference12941222510137ndnd33
1-Month13941122410126nd342
2-Month1193942510137nd252
3-Month13751042612134ndnd42
7-Month17nd557281514ndnd35nd
nd—not detected.
Table 5. Phase composition (%) in mortar specimens from pumping site.
SpecimensClinker PhasesNatural Minerals Hydration PhasesSecondary Phases
AliteBeliteBrownmilleriteQuartzFeldsparPlagioclaseMicaPortlanditeKatoiteAmorphous C-S-HCalciteGypsumEttringiteMonosulfoaluminateThaumasite
Reference4416761471nd3ndnd2nd
1-Month55160514.592nd6nd0.51nd
2-Month6415871492nd3212nd
3-Month6316151561nd1522nd
7-Monthndnd3665nd353nd3622nd
nd—not detected.
Table 6. Phase composition (%) in mortar specimens from sand trap.
SpecimensClinker PhasesNatural MineralsHydration PhasesSecondary Phases
AliteBeliteBrownmilleriteQuartzFeldsparPlagioclaseMicaPortlanditeAmorphous C-S-HKatoiteCalciteGypsumEttringiteMonosulfoaluminateHydrocalumiteThaumasite
Reference441675.5147nd13ndnd20.5nd
1-Month621705146nd13nd121nd
2-Month541636157nd13nd121nd
3-Month631676155nd13nd121nd
7-Month9nd5605417nd59nd13ndnd
nd—not detected.
Disclaimer/Publisher’s Note: The statements, opinions and data contained in all publications are solely those of the individual author(s) and contributor(s) and not of MDPI and/or the editor(s). MDPI and/or the editor(s) disclaim responsibility for any injury to people or property resulting from any ideas, methods, instructions or products referred to in the content.

