Article

The Influence of the Amount of Technological Waste on the Performance Properties of Fibrous Polymer Composites

1
Faculty of Manufacturing Technologies with a Seat in Prešov, Technical University of Kosice, Sturova 31, 080 01 Presov, Slovakia
2
Faculty of Mechanical Engineering, University of West Bohemia Pilsen, Univerzitní 8, 306 14 Plzeň, Czech Republic
*
Author to whom correspondence should be addressed.
J. Compos. Sci. 2024, 8(11), 470; https://doi.org/10.3390/jcs8110470
Submission received: 10 September 2024 / Revised: 30 October 2024 / Accepted: 6 November 2024 / Published: 13 November 2024
(This article belongs to the Special Issue Polymer Composites and Fibers, 3rd Edition)

Abstract

:
The objective of the experimental analysis was to assess the impact of the reuse of technological waste (recyclate) on the selected performance properties of the fibrous polymer composite used to produce components for the automotive industry by injection molding technology. Polyphthalamide (PPA), which belongs to a group of high-tech polymers, was chosen as the analyzed material. In accordance with the set goals, the rheological, mechanical, and structural properties of the material were evaluated using ANOVA analysis in the experimental part of the work, depending on the mass ratio of the recycled material added to the virgin material. The influence of the proportion of recycled material on the lifetime of moldings by the method of their exposure at an elevated temperature for a defined time was also assessed. During the research, it was found that at a concentration of up to 40 wt. % of recyclate, its mechanical properties do not change significantly. At a concentration of 50 wt. %, there is a rapid decrease in mechanical properties. In the long term, it can also be said that the addition of recyclate significantly affects the service life of the components. No significant changes in morphology were observed during the analysis of structural properties.

1. Introduction

A fiber-reinforced polymer consists of a matrix and a reinforcement, which are the decisive factors in the mechanical properties [1]. Polymer matrix composites offer a rigid and lightweight substitute for conventional engineering materials like steel and aluminum [2]. Fiber orientation depends on material parameters such as fiber diameter and length and interaction between fibers (which is interpreted as fiber content) and forming factors [3]. The pressing parameters, including forming speed, applied pressure, and forming temperature, influence the orientation of the material, leading to inhomogeneous and anisotropic properties in the final product, which has a notable impact on its mechanical performance [4].
Glass fiber-reinforced polymer composites are produced by various manufacturing technologies and are widely used for various applications [5]. Additionally, although glass fibers exhibit excellent properties, including high strength, flexibility, stiffness, and resistance to chemical damage, the composite is often produced with a thermosetting polymer matrix, which experiences significant deterioration in mechanical performance when exposed to elevated temperatures [6]. In recent decades, there has been increasing interest in the use of composite materials for structural applications, including in the aerospace, automotive, and marine industries. The specific properties of each type of glass fiber make them suitable for various applications, particularly when integrated into polymer composites [7]. The filler in the form of glass fibers affects the mechanical, tribological, thermal, absorption, and vibration properties of various polymer composites [8].
The rising production and consumption of fiber-reinforced polymers (FRPs) have resulted in a growing volume of FRP waste, raising significant concerns regarding its recyclability. Glass fiber-reinforced polymer (GFRP) waste is generated at various stages of production and at the end of its lifecycle, posing a major challenge for the composite industry [9]. Currently, incineration and landfill disposal remain the most common management strategies for FRP waste, contributing to negative environmental impacts [10]. The primary challenge in recycling fiber-reinforced polymers lies in the non-reversible curing process, which prevents the cured solid from returning to its original liquid state, unlike thermoplastics. Although various waste disposal methods exist, they generally offer limited value and often lead to additional costs for producers [11].
In one study, composite waste was ground into three different grain sizes and used as a filler in the production of new glass fiber-reinforced composites [12]. To compensate for the relatively low Young’s modulus of certain plastic materials, a sandwich structure combining a plastic skin with a foam core is often employed to achieve the necessary stiffness. The resulting composites were analyzed for their rheological, thermal, mechanical, dynamic–mechanical, and morphological properties to assess their performance [13]. To ensure a strong and reliable bond between constituent materials, which is essential for maintaining composite performance, numerical simulations are often employed to verify the correlation between the properties of these materials [14]. Despite a tolerable reduction in mechanical properties, the larger grain size of waste particles led to an increase in the glass transition temperature, due to the limited mobility of polymer chains [15].
Further research dealt with the influence of the use of technological waste and the simulation of material lifetime on the impact strength of two different polymer composites. Based on evaluations, it can be concluded that the concentration of recycled material in virgin composites significantly impacts the un-notched impact strength only when the recycled content reaches at least 50 wt. % [16]. However, recycling has a considerable effect on impact strength and high-strain properties, including strain at break, with multiple studies reporting reductions in both the ductility and impact properties of polypropylene (PP) [17]. The results of the un-notched impact strength of the test specimens exposed to an elevated temperature make it evident that the addition of recycled material to the virgin material significantly reduces the components’ service lives [18,19].
In practical applications, consideration of both environmental and economic aspects is highly required in the development of fiber-reinforced polymer (FRP) end-of-life recycling. In their research, the authors present a sustainable, low-cost, and efficient approach to recycle glass fibers (GFs) from GF epoxy polymer (GFRP)-reinforced waste, based on a microwave-assisted chemical oxidation method [20]. It was found that a hydrogen peroxide mixture can be used to decompose the epoxy matrix of waste GFRP in a one-step process using microwave irradiation [21,22]. The use of short microwave irradiation times in conjunction with environmentally friendly and sustainable recycling solvents presents a significantly low-energy approach for the end-of-life recycling of glass fiber-reinforced polymers (GFRPs) [23]. As interest in low-density fiber-reinforced composites continues to grow and leads to their broader application, the challenges associated with end-of-life recyclability and the increasing volume of composite materials requiring recycling will become even more pronounced [24,25].
Based on the conclusions of the previous authors, the aim of the research was to assess the impact of the reuse of technological waste (recycled) on the selected performance properties of the fibrous polymer composite used to produce components for the automotive industry by injection molding technology. In accordance with the set objectives, the experimental part of the work evaluates the rheological, mechanical, and structural properties of the material depending on the mass ratio of the recycled material added to the original material. The effect of the proportion of recycled material on the lifetime of the moldings by exposing them to an elevated temperature for a defined time was also evaluated. Understanding the behavior of fiber-reinforced plastics using process waste is essential to predict their properties in safe, durable, and reliable industrial components. The main idea is to reduce the ecological burden and, last but not least, the financial side of the impact of the price of the input material.

2. Experiment Preparation

2.1. Material Selection and Preparation of the Test Samples

A composite material with the trade name ZYTEL, which belongs to a group of high-tech polymers, was chosen for the experiment. The composite consists of a polymer matrix of polyphthalamide (PPA) and fibrous glass filler (30 wt. %). The material contains flame retardant, lubricants, and separating agents. When processing the material, it is important to ensure that it is not in the injection unit for a long time, because it can degrade. The material was chosen due to the high purchase price, where the recycling of the material has its justification. The material is used in the production of automotive components and processed by overmolding technology. An overview of the basic material properties of the composite is presented in Table 1.
The recycled material was obtained from technological waste, which was created after its initial processing into finished products in the production plant. The obtained recyclate (technological waste) was subsequently mixed into the original purchased virgin material in proportions of 0, 10, 20, 30, 40, 50, 60, 80, and 100 wt. %. The batches of material produced in this way were used to produce test samples. The test samples were produced using the injection technique on a Demag D 60-182 injection machine (Sumitomo Demag Plastics Machinery, Schwaig, Germany).
Before processing, the material was dried at a temperature of 100 °C for 6 to 8 h to achieve a moisture content of 0.10% during processing. The injection process parameters were as follows: processing temperature—320–325 °C; injection mold temperature—85–90 °C; injection pressure—30 MPa; injection speed—45 mm/s; and injection cycle time—45 s. Before testing, the test samples were conditioned under standard laboratory conditions 23/50. To simulate the evaluation of the life of the products, half of the test bodies were exposed to an elevated temperature of 230 °C in an oven with forced air circulation for 500 h.

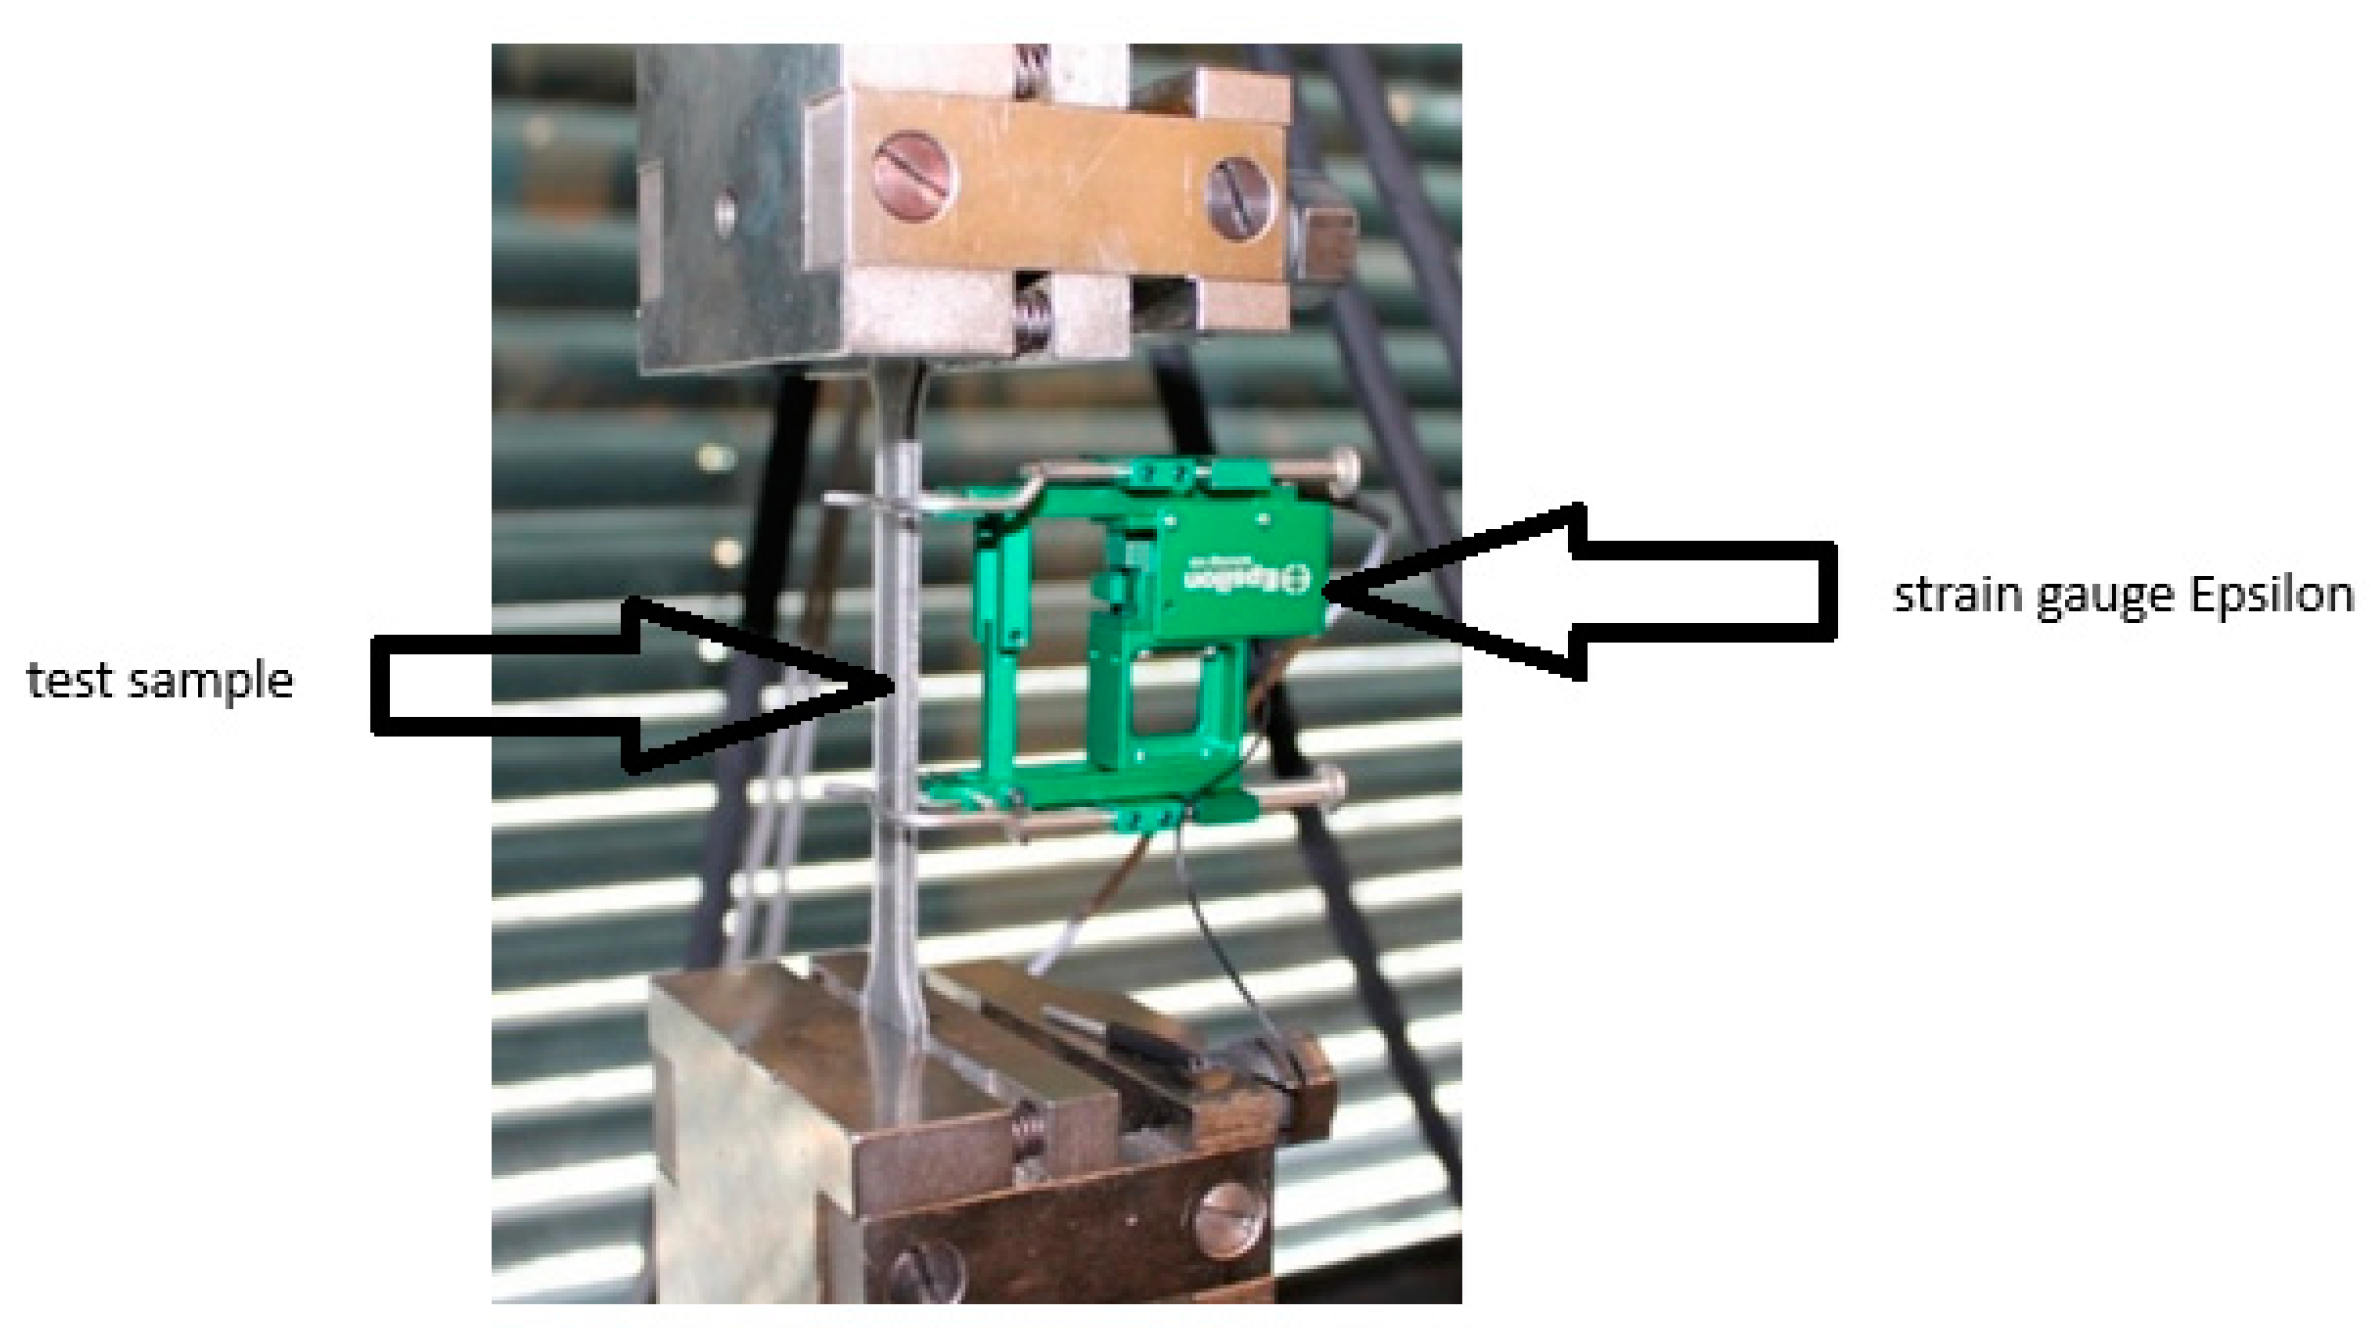
2.2. Uniaxial Tensile Testing

To determine the tensile properties of the test samples, a Tiratest 2300 device (TIRA, Schalkau, Germany) equipped with an Epsilon strain gauge—model 3542-010M-025-ST—was used (Figure 1). The tensile properties were measured according to ISO 527-1 [26] and ISO 527-2 standards [27]. The length of the test sample was 80 mm. The test specimens were stressed at a test speed of 5 mm/min. The modulus of elasticity in tension was determined at a reduced test speed of 1 mm/min. The tensile strength was calculated from the dependences of stress and strain. Each experiment was repeated 10 times at an ambient temperature of 23 °C.
The tensile modulus was calculated according to Equation (1) from the values of the stresses measured at the given elongation:
E t = σ 2 σ 1 ε 2 ε 1   100
where Et is the tensile modulus (MPa), σ1 is the tensile stress (MPa) corresponding to the relative elongation ε1 = 0.0005, and σ2 is the tensile stress (MPa) corresponding to the relative elongation ε2 = 0.0025.

2.3. Scanning Electron Microscopy

Scanning electron microscopy (SEM) was used to determine the fracture surfaces of the test samples. The fracture surfaces were taken on the fractured portions of the test specimens as obtained during uniaxial tensile testing. The test samples were sputtered with carbon to improve the conductivity of the sample. The thickness of the sputtered layer was 5 nm. SEM images were captured using a Tescan Mira 3 FE scanning electron microscope (TESCAN, Brno, Czech Republic) equipped with an integrated EDX analyzer from Oxford Instruments (ThermoFisher Scientific, Waltham, MA, USA). The device enables the observation of the microstructure of the material and the performance of elemental analysis of the material. Secondary electron (SE) mode and an accelerating voltage of 20 kV were used for scanning fracture surfaces. The distance between the sample and the detector was 15 mm and the field of view was 185 μm.

2.4. Flexural Testing

Hounsfield H10KT devices were used to determine the flexural properties of the test samples. The test samples were measured according to the ISO 178 standard [28]; tested samples had dimensions of 80 × 10 × 4 mm. The samples were supported on two supports and loaded at a constant speed of 2 mm/min (Figure 2). Each experiment was repeated 10 times, and mean values and standard errors were calculated.
During the test, flexural strength and flexural stress limit values were recorded at the given values of deformation under bending, from which the flexural module was subsequently determined according to Equation (2):
E f = σ f 2 σ f 1 ε f 2 ε f 1   100
where Ef is the flexural modulus (MPa), σf1 is the flexural stress (MPa) at flexural deformation εf1 = 0.0005, and σf2 is the flexural stress (MPa) at flexural deformation εf2 = 0.0025.

2.5. Establishing Rheological Properties

The melt flow index (MFI) is a standardized technological test of thermoplastic materials that serves to evaluate the flow properties. The melt volume-flow rate (MVR) was chosen for testing. The MVR was determined using a Thermo Haake Meltflow MT rheometer (TA Instruments, New Castle, DE, USA) (Figure 3) according to the ISO 1133 standard [29]; the following conditions were used: temperature—340 °C; load—2.16 kg.

3. Results and Discussion

3.1. Flexural Properties

3.1.1. Flexural Strength

The graphical depiction of the impact of both the quantity of recycled content within the material and the condition of the material on the alteration of the flexural strength value (σfM) is illustrated in Figure 4. The condition of the material exerts a statistically significant influence on the variation of the observed parameter (σfM) (p < 0.000), accounting for 63.990% of the variability. Conversely, the quantity of recycled content in the material contributes to a change in σfM of 29.660% (p < 0.000). Furthermore, the interaction effect between the material condition and the quantity of recycled content in the material was not statistically significant (p = 0.063). Figure 4 distinctly indicates that the mean value of σfM is significantly greater (p < 0.000) for the pre-aged material (170.554 ± 3.318 MPa) compared to that of the post-aged material (138.913 ± 2.673 MPa). In both scenarios, an increase in the quantity of recycled content within the material leads to a reduction in the conditional value of σfM.
For the material prior to aging, the flexural strength value (σfM) decreases from 187.186 ± 5.866 MPa (0% recycled content) to 153.386 ± 3.898 MPa (100% recycled content). An increase in the proportion of recycled content by 1% in the pre-aged material results in a decline in σfM by 0.338%. In contrast, for the post-aged material, the flexural strength value (σfM) decreases from 155.757 ± 6.454 MPa (0% recycled content) to 126.171 ± 6.103 MPa (100% recycled content). The reduction in σfM associated with increasing recycled content is less pronounced for the post-aged material. Specifically, a 1% increase in recycled content in the post-aged material corresponds to a reduction in the average σfM value of 0.296%. From Figure 4, it is observed that the difference in σfM values between the pre-aged and post-aged materials, as a function of recycled content, remains nearly constant. The average difference in σfM between the pre-aged and post-aged materials is 31.641 ± 1.777 MPa, with the maximum value of the difference being observed at 30% recycled content in the material (39.200 ± 3.752 MPa) and the minimum difference occurring at 100% recycled content (27.214 ± 4.529 MPa).
The relationship between σfM, the material condition, and the amount of recycled content within the material is, however, more complex. The application of decision trees, a fundamental method in data mining, using the CART algorithm [30], reveals that the material condition is the key factor influencing the change in σfM. This conclusion confirms the results of previous analyses. For pre-aged materials, two distinct groups are observed based on σfM values. The first group includes samples with 0% to 30% recycled content (183.314 ± 5.420 MPa), while the second group consists of samples with 40% to 100% recycled content (160.346 ± 7.049 MPa). Within the first group, the material can be further divided into samples with 0% to 10% recycled content (185.564 ± 5.666 MPa) and those with 20% to 30% recycled content (181.064 ± 4.019 MPa). However, the difference between these two subgroups is not as pronounced. In the case of samples with 40% to 100% recycled content, two distinct subgroups are again evident. The first subgroup comprises samples with 40% to 60% recycled content (163.605 ± 5.987 MPa), while the second subgroup consists of samples with 80% to 100% recycled content (155.457 ± 5.531 MPa). For post-aged materials, the samples can again be divided into two main groups based on σfM values as a function of recycled content. The first group includes material with 0% to 20% recycled content (151.110 ± 6.304 MPa), while the second group comprises material with 30% to 100% recycled content (132.814 ± 8.990 MPa). Based on Figure 4, it can be concluded that the decrease in σfM is caused by the increasing percentage of recycled content in the material.
The influence of recycled content in the material and the material condition on the change in σfM values is shown in Figure 5. For strain ε = 0.05% in Figure 5a and for strain ε = 0.25% in Figure 5b, the interaction between the recycled content and material condition significantly affects the change in σfM at ε = 0.05% (Figure 5a). This interaction accounts for 13.880% of the variance (p = 0.019). The individual effect of recycled content (p = 0.196) and the individual effect of material condition (p = 0.286) were not confirmed. Based on the amount of recycled content and the average σfM value at ε = 0.05%, two distinct groups can be identified. The first group consists of samples with 20%, 80%, and 100% recycled content (5.526 ± 0.066 MPa), while the second group includes samples with 0%, 10%, 30%, 40%, 50%, and 60% recycled content (5.696 ± 0.038 MPa). However, the difference in σfM values at ε = 0.05% is minimal. This behavior agreed with data observed by authors Vojvodic et al. [31] and Gawdzinska et al. [32].
At ε = 0.25%, σfM is predominantly influenced by the interaction between the recycled content and the material condition. The recycled content contributes 11.980% to the variance (p = 0.031), while the material condition, as the main effect, accounts for 4.640% (p = 0.010). The independent effect of recycled content was not confirmed (p = 0.051). A more detailed analysis using decision trees reveals that based on the average σfM value at ε = 0.25% (23.780 ± 0.220 MPa), two distinct groups can be formed. The first group includes samples with 20%, 40%, 60%, 80%, and 100% recycled content (23.462 ± 0.754 MPa), while the second group consists of virgin material (0%) and samples with 10%, 30%, and 50% recycled content (24.179 ± 0.789 MPa). The first group can further be divided into two subgroups, whereby the first subgroup includes samples with 20%, 40%, and 60% recycled content (23.631 ± 0.624 MPa) and the second subgroup comprises samples with 80% and 100% recycled content (23.208 ± 0.602 MPa). Within the group of samples with 80% and 100% recycled content, the σfM values at ε = 0.25% are higher in the post-aging condition (23.417 ± 0.936 MPa) compared to the pre-aging condition (22.999 ± 0.632 MPa). For samples with 20%, 40%, and 60% recycled content, higher response values (σε = 0.25%) are achieved in the pre-aging condition (23.727 ± 0.624 MPa) compared to the post-aging condition (23.534 ± 0.633 MPa). The differences in the response values (σε = 0.25%) between the compared groups are minimal but statistically significant at the chosen significance level of α = 0.05. In the second main group of samples (0%, 10%, 30%, and 50%), the material condition is the key factor influencing the change in σfM values at ε = 0.25%. In this group, higher σε = 0.25% values are achieved in the post-aging condition (24.749 ± 0.501 MPa) compared to the pre-aging condition (23.609 ± 0.537 MPa). The results also confirm the conclusion of Tyagi et al. [33] and Singh et al. [34].

3.1.2. Flexural Modulus

The most significant factor influencing the change in flexural modulus (Ef) values (Figure 6) is the amount of recycled content in the material, accounting for 75.930% of the variation (p < 0.000). The material condition contributes to 6.180% of the variation (p < 0.000), while the interaction between recycled content and material condition accounts for 2.560% (p = 0.029). Figure 6 clearly illustrates that increasing the amount of recycled content in the material results in a decrease in Ef. The average Ef value in the pre-aging condition (9155.397 ± 108.578 MPa) is significantly higher (p < 0.000) compared to the post-aging condition (8954.365 ± 89.339 MPa). In pre-aging conditions, the maximum Ef value is observed in virgin material (9657.143 ± 186.023 MPa), with a gradual decrease in Ef as the amount of recycled content increases. A significant difference in Ef can be observed between virgin material and material with 50% recycled content (9146.429 ± 60.571 MPa, p = 0.032) and with 60% recycled content (8748.571 ± 177.390 MPa, p < 0.000). The maximum Ef value in the post-aging condition is also achieved in virgin material (9334.286 ± 162.143 MPa). Like the pre-aging condition, statistically significant differences in the average Ef value of the virgin materials (0% recycled content) are evident only when the recycled content exceeds 50%.
Based on the findings, two main groups can be identified concerning the amount of recycled content in the material. The first group consists of materials with recycled content <50% (9345.071 ± 114.541 MPa), while the second group comprises materials with recycled content ≥50% (8692.143 ± 127.103 MPa). Within the first group (<50% recycled content), material condition is a secondary important factor. The average Ef value in the pre-aging condition is 9459.714 ± 121.368 MPa. Two distinct subgroups can be identified—materials with 0–20% recycled content (9574.294 ± 99.157 MPa) and materials with 30–40% recycled content (9287.867 ± 93.573 MPa). In the post-aging condition (9230.438 ± 72.591 MPa), no further relevant subgroups can be identified. Within the second group of samples (≥50% recycled content), it is necessary to first differentiate materials with 50% recycled content (8936.429 ± 152.666 MPa) from those with ≥60% recycled content (8610.716 ± 93.453 MPa). The key criterion for Ef variation in samples with 50% recycled content is the material condition. In the pre-aging condition (9146.429 ± 60.571 MPa), Ef values are significantly higher than in the post-aging condition (8726.429 ± 194.634 MPa). For samples with ≥60% recycled content, the amount of recycled content again becomes a crucial criterion for differentiating average Ef values. This group of samples can be further divided into two subgroups—samples with 60–80% recycled content (8673.758 ± 91.167 MPa) and those made from 100% recycled material (8484.642 ± 80.154 MPa). The results also confirm the conclusion of Mohyedin et al. [35], Barzegari et al. [36], and Zhuge et al. [37].

3.2. Tensile Properties

3.2.1. Tensile Strength

The most significant factor affecting the change in tensile strength (σm) values (Figure 7) is the amount of recycled content in the material, contributing 92.210% to the variation (p < 0.000). The material condition influences the change in the response value σm by 3.290% (p < 0.000), while the interaction between recycled content and material condition accounts for 1.330% (p < 0.000). As illustrated in Figure 7, an increase in the amount of recycled content in the material leads to a decrease in σm. Concurrently, higher tensile strength values are observed in the pre-aging material condition. The pattern of change in tensile strength values is similar for both material conditions. The maximum tensile strength value for the pre-aged material is 91.621 ± 2.515 MPa, while for the post-aged material, it is 101.870 ± 0.437 MPa.
Figure 7 shows that increasing the recycled content in the material within the range of 10–40% in the pre-aging condition results in an average decrease in the maximum tensile strength by 0.601%. The total change in σm between virgin material and material with 40% recycled content (99.440 ± 0.933 MPa) is 2.385%. The first significant change (p = 0.046) in maximum tensile strength is observed when the recycled content reaches 50% (94.370 ± 1.428 MPa), with a 5.099% decrease compared to 40% recycled content. The most pronounced and significant drop (p < 0.000) in σm occurs when the recycled content increases from 50% to 60% (79.510 ± 2.660 MPa), representing a 15.747% decrease. Further increasing the recycled content to 80% (76.090 ± 1.878 MPa) results in a non-significant reduction in σm by 4.301% (p = 0.716). For 100% recycled material, the σm value reaches 70.980 ± 2.600 MPa, with a significant reduction of 6.716% compared to 80% recycled content (p = 0.041). In the post-aging condition, increasing the recycled content does not lead to a significant drop in σm until the recycled content reaches 50% (87.860 ± 1.656 MPa), with a total decrease of 9.841%. The average reduction between two recycled content levels is 2.038%. The first significant and statistically meaningful drop (12.827%, p < 0.000) in σm is observed when the recycled content reaches 60% (76.590 ± 1.096 MPa), which corresponds to the change observed in the pre-aged material. Increasing the recycled content to 80% results in a minimal decrease in σm by 0.509%. The second significant change in σm occurs at 100% recycled material (70.470 ± 1.652 MPa), with a reduction of 7.915%. Focusing on the differences in average σm values for specific recycled content levels between the pre- and post-aging conditions, significantly higher values are observed for materials with 30% (5.250 ± 1.057 MPa), 40% (8.660 ± 0.972 MPa), and 50% (6.510 ± 1.514 MPa) recycled content. This behavior agreed with data observed by authors Ma et al. [38], Pragasam et al. [39], and Kartikeya et al. [40].
A comprehensive analysis of the change in σm using decision trees confirms the conclusions of the initial analysis. The key factor influencing the change in σm is the amount of recycled content in the material. Based on the recycled content, two main groups can be identified in terms of σm values. The first group, with a higher average tensile strength (96.893 ± 2.234 MPa), consists of materials with 0–50% recycled content. In this group, the material condition is the second key factor. In the post-aging condition, lower σm values are observed for materials with 40% and 50% recycled content (89.320 ± 1.181 MPa). In the pre-aging condition, a lower tensile strength is observed for materials with 50% recycled content (94.370 ± 0.947 MPa) compared to materials with 0–40% recycled content (100.728 ± 0.818 MPa). The second group consists of materials with 60–100% recycled content. Within this second distinct group, the material condition influences σm only for materials with 60% recycled content. In the pre-aging condition (79.510 ± 1.515 MPa), σm values are higher compared to in the post-aging condition (76.590 ± 0.728 MPa). This behavior agreed with data observed by authors de Morais [41], Wang et al. [42], and Rusinko et al. [43].

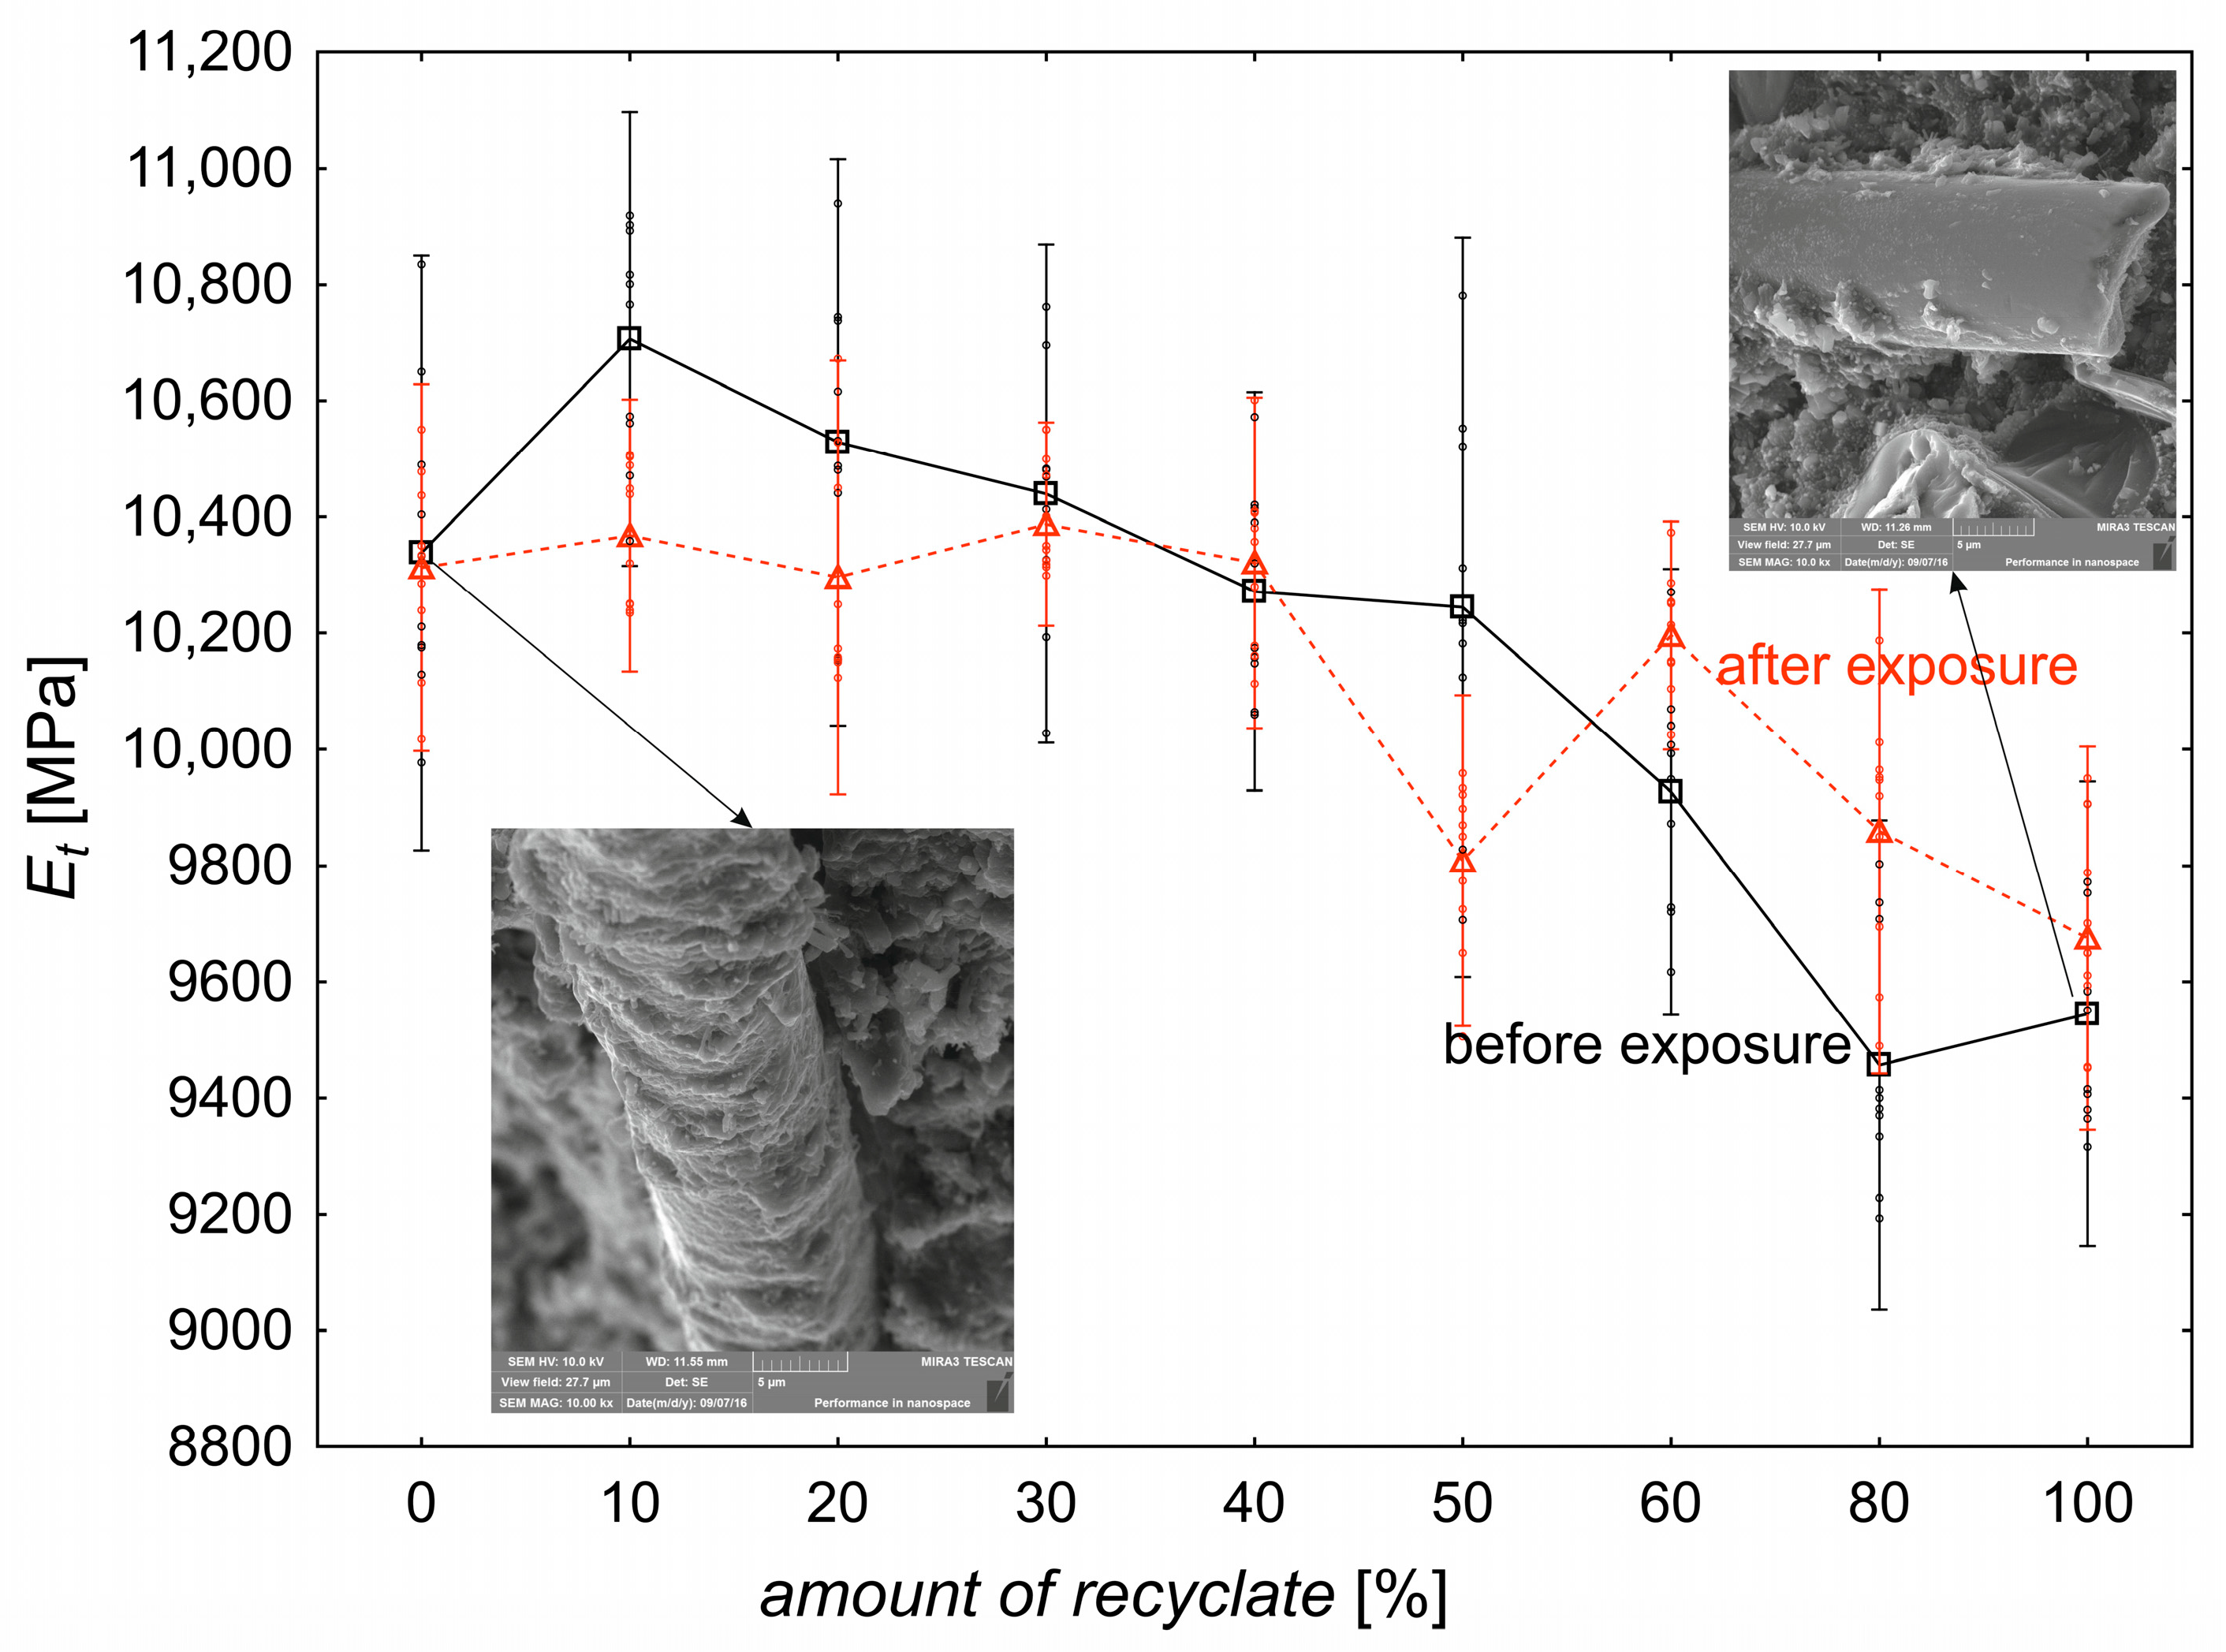
3.2.2. Tensile Modulus

The change in the tensile modulus (Et) (Figure 8) is significantly influenced (p < 0.000) primarily by the amount of recycled content in the material, accounting for 65.910% of the variation. Concurrently, the analysis indicates that material condition does not have a significant effect on the change in Et values (p = 0.375), with the material condition contributing only 0.110% to the change in the observed response.
The average difference in Et values between the pre-aging (10,162.044 ± 97.331 MPa) and post-aging (10,136.078 ± 62.649 MPa) conditions is not statistically significant. The interaction between the amount of recycled content and the material condition shows a significant influence (p < 0.000) on the change in Et values, accounting for 11.190% of the observed variation. From Figure 8, for the pre-aging material condition, the addition of 10% recycled content increases the Et value from the initial value to 10,706.000 ± 142.524 MPa. However, this 3.557% increase is not statistically significant (p = 0.419). Further additions of recycled content led to a gradual decrease in the conditional Et value in the pre-aged material, reaching 10,244.500 ± 231.991 MPa at 50% recycled content. The total decrease in Et between 10% and 50% recycled content is 4.311%. The first statistically significant change (p < 0.000) in Et was observed when the recycled content increased from 60% (9926.800 ± 139.952 MPa) to 80% (9456.900 ± 153.773 MPa), with a decrease of 4.734%. In material with 100% recycled content, the Et value increases to 9545.100 ± 145.820 MPa. This increase compared to material with 80% recycled content is not significant (p = 1.000).
In the post-aging condition, the average Et value and the observed response oscillate around an average of 10,337.080 ± 108.628 MPa in the range of 0% to 40% recycled content. The first significant change (p = 0.013) in Et occurs when the recycled content reaches 50% (9808.700 ± 103.758 MPa), with a 4.966% decrease in Et between materials containing 40% and 50% recycled content. Increasing the recycled content to 60% raises the Et value to 10,195.800 ± 71.578 MPa (p = 0.311). Further increases in recycled content cause the conditional Et value to drop to 9675.600 ± 120.065 MPa. However, the differences in Et values between individual levels of recycled content (60%, 80%, 100%) are not statistically significant.
From the perspective of the average Et value in the pre-aging material condition, two distinct groups can be identified based on the amount of recycled content. The first group consists of materials with less than 60% recycled content (9642.933 ± 112.638 MPa), while the second distinct group comprises materials with 60% or more recycled content (10,421.600 ± 98.753 MPa). In the post-aging condition, the first group includes materials with less than 50% recycled content (9781.167 ± 131.952 MPa), and the second distinct group includes materials with 50% or more recycled content (10,313.533 ± 102.547 MPa). The results also confirm the conclusion of Kumpenza et al. [44] and Zare et al. [45].

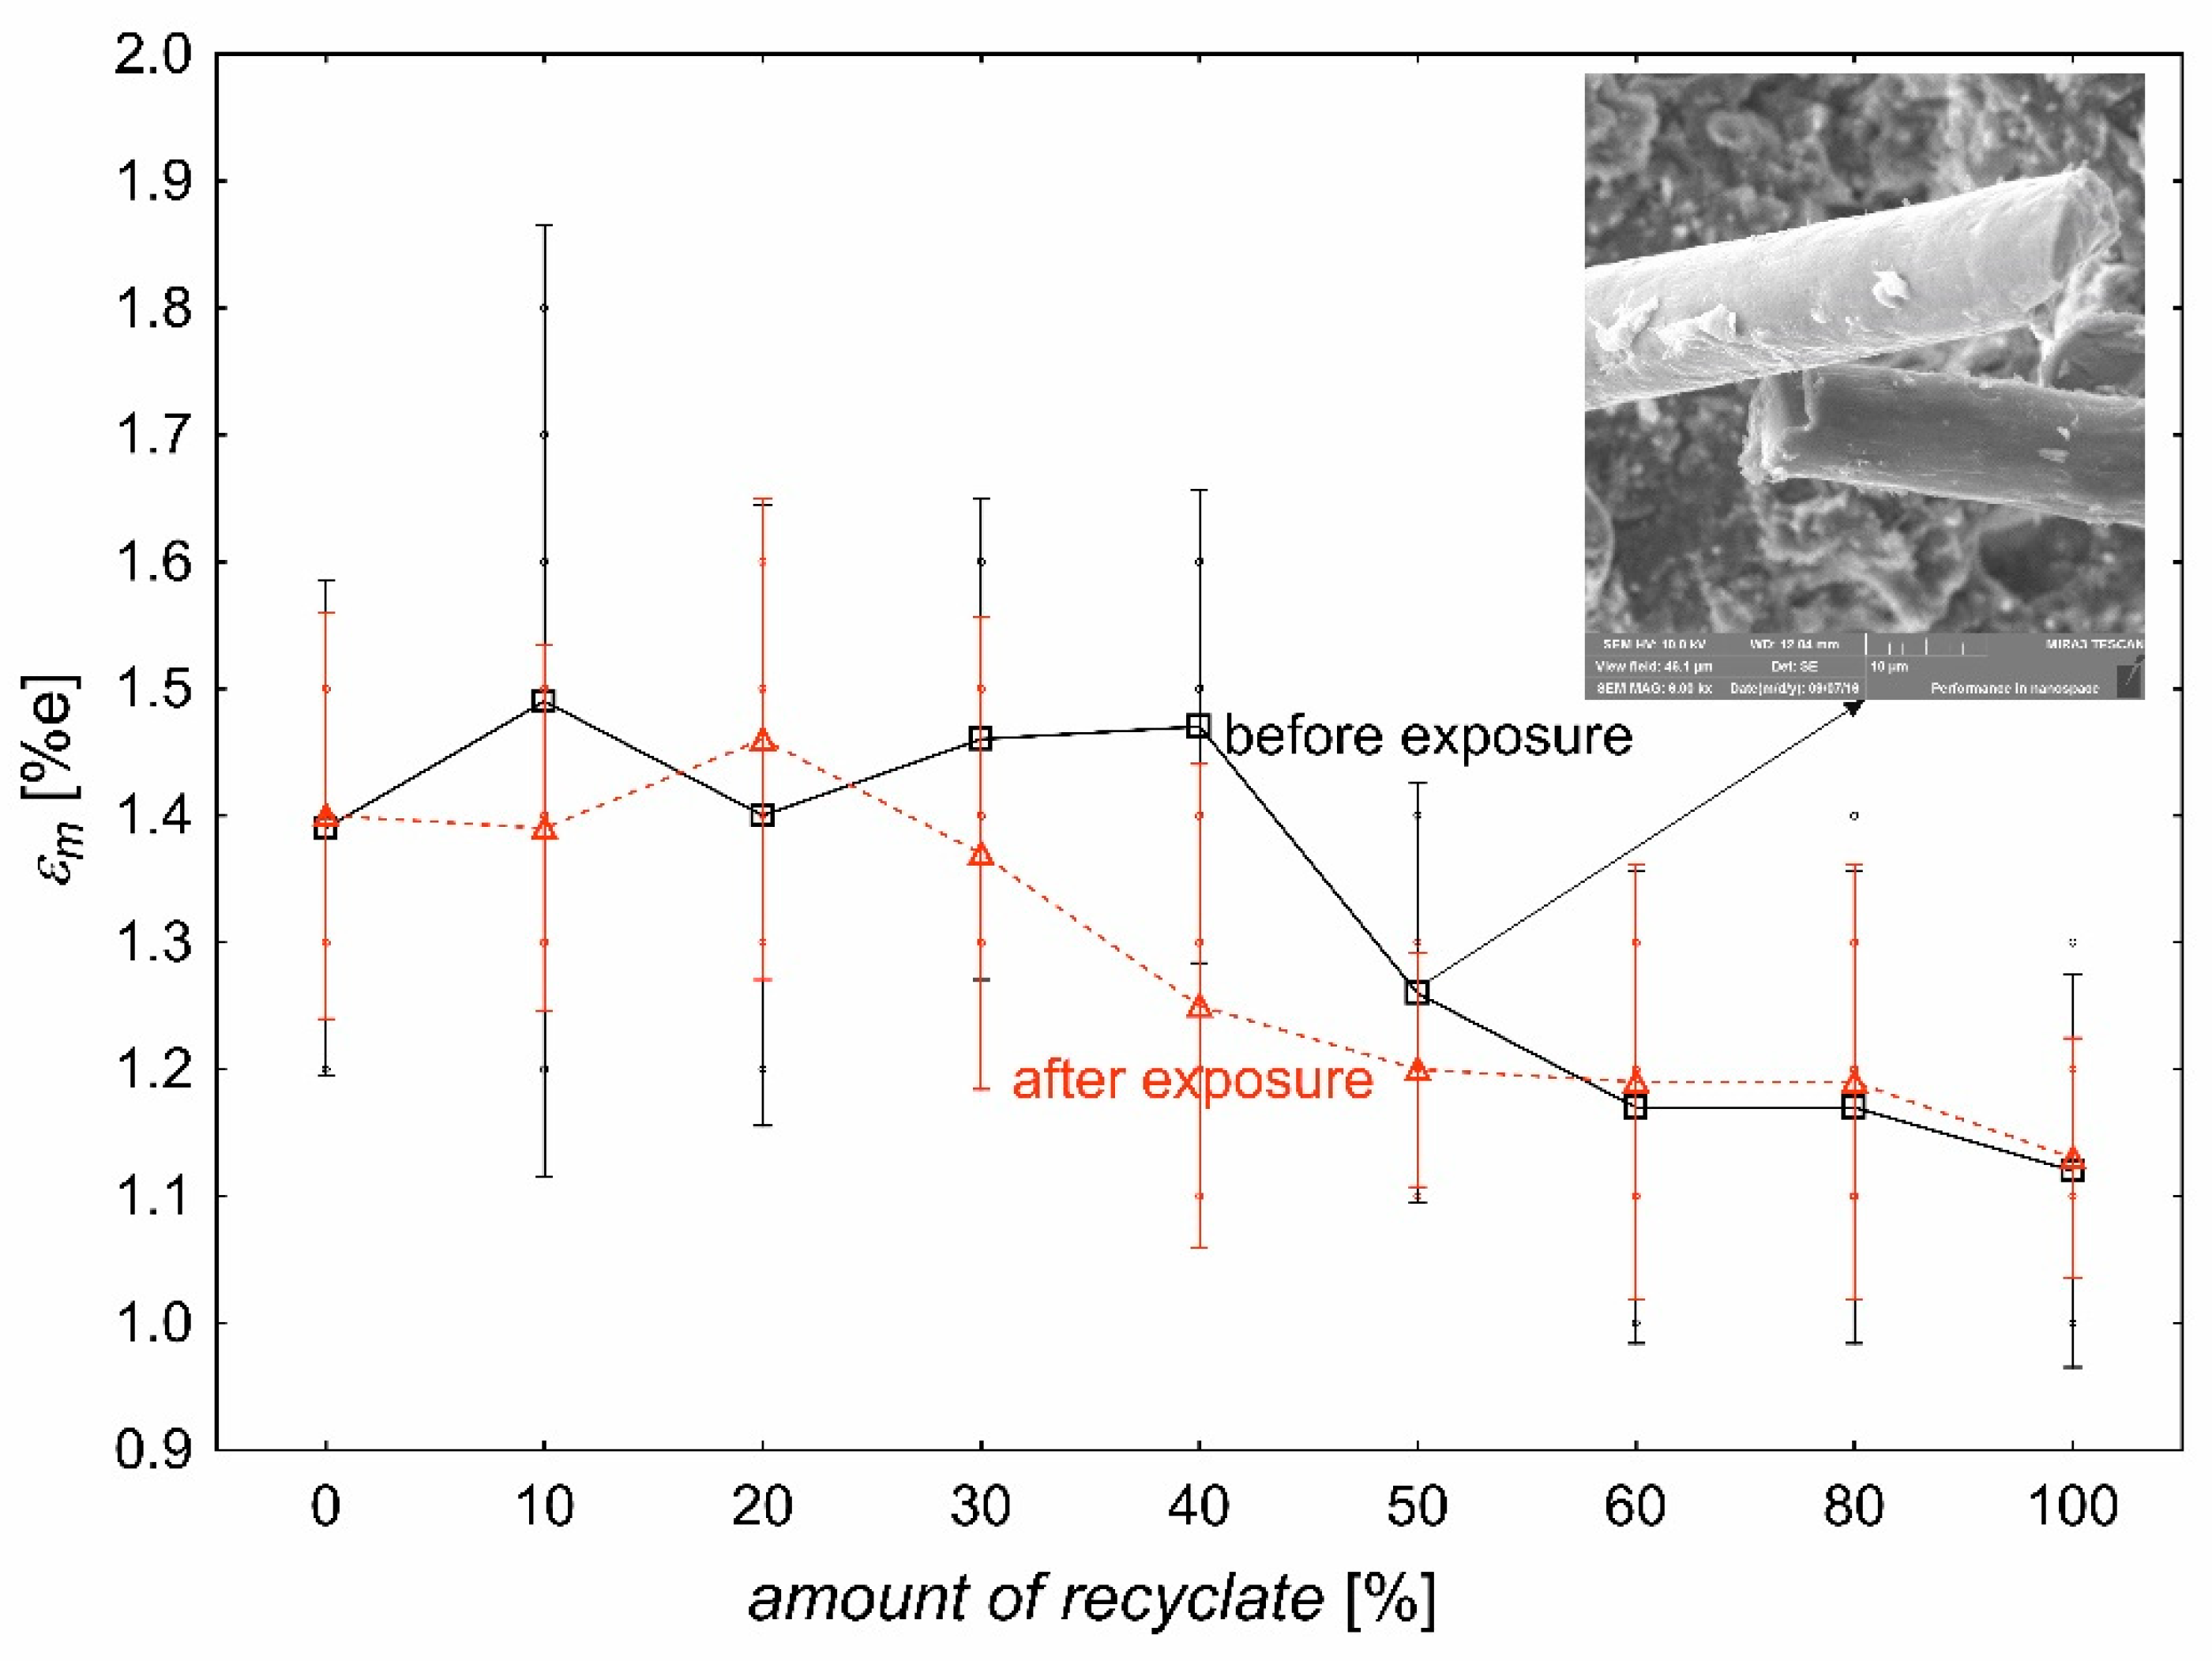
3.2.3. Tensile Strain at Strength

The overall change in the tensile strain at strength value (εm) (Figure 9) is primarily influenced by the amount of recycled content in the material (56.800%). This influence is significant (p < 0.000) at the selected significance level of α = 0.05. The effect of material condition on the change in εm accounts for 1.530% (p = 0.008). Additionally, a statistically significant effect (p < 0.000) is observed in the change of εm due to the interaction between the amount of recycled content and material condition (6.870%).
Focusing first on the material condition, the average εm value (regardless of the amount of recycled content) for the pre-aging condition is 1.326 ± 0.037%. The average εm value for the post-aging condition is 1.287 ± 0.029%. The total difference in εm between these material conditions, amounting to 0.039 ± 0.029%, is statistically significant according to Fisher’s LSD test (p = 0.008). For the pre-aging condition, it is evident that εm fluctuates between 1.390 ± 0.071% for pure material (0% recycled content) and 1.470 ± 0.068% for 40% recycled content. In this range, increasing the amount of recycled content does not result in a significant change in εm. A significant change in εm, as shown in Figure 9, occurs when the recycled content increases from 40% to 50%. This increase results in a significant decrease in εm (p < 0.000) to 1.260 ± 0.060%, representing a 14.286% reduction. A further increase in recycled content to 60% leads to another significant decrease in εm (p = 0.041), with a 7.143% reduction between 50% and 60% recycled content. Increasing the recycled content (80% and 100%) does not cause significant changes in εm. In the post-aging condition, the quasi-stationary region of non-significant changes in εm due to increasing recycled content is limited to the 0% to 20% range, compared to the pre-aging condition. In this range, εm values vary from 1.400 ± 0.058% (pure material) to 1.460 ± 0.069% (20% recycled content). The first statistically significant decrease in εm (p = 0.041) occurs when the recycled content increases from 20% to 30% (1.370 ± 0.068%), resulting in a 6.146% decrease. A further increase in recycled content to 40% causes a reduction in εm to 1.250 ± 0.070%, representing an 8.759% decrease. Increasing the recycled content to 50% leads to an additional 4.000% decrease in εm (1.200 ± 0.034%). Further increases in recycled content (60% to 100%) do not result in significant changes in εm, with εm values ranging from 1.190 ± 0.063% (60% recycled content) to 1.130 ± 0.035% (100% recycled content), representing a total change of 5.042% in this range. The results also confirm the conclusion of Furmanski et al. [46] and Dang et al. [47].
A comprehensive analysis of the change in εm, considering the simultaneous influence of recycled content and material condition, was performed using machine learning with decision trees. Utilizing the CART algorithm [30], it was concluded that the key factor influencing εm is the amount of recycled content in the material. This finding aligns with the conducted analysis. It can be stated that if the material contains more than 50% recycled content, the εm value will be significantly lower (1.179 ± 0.007%) compared to materials with 0% to 40% recycled content (1.480 ± 0.015%). For materials with more than 50% recycled content, the effect of material condition on εm becomes apparent primarily in materials with 100% recycled content. In the post-aging condition, the elongation at break is 1.130 ± 0.002%, while in the pre-aging condition, it is 1.120 ± 0.006%. Similar minimal changes in εm within this group of materials (≥50% recycled content) are also observed for 60% recycled content. In the post-aging condition, the εm value is 1.190%, while in the pre-aging condition, it is 1.170%. The same pattern is observed for 80% recycled content (pre-aging—1.260%; post-aging—1.200%). In the second defined group of materials, based on recycled content (0% to 40%), the effect of material condition manifests without further influence from recycled content. In this group, εm is significantly higher in the pre-aging condition (1.442 ± 0.016%) compared to the post-aging condition (1.374 ± 0.012%).

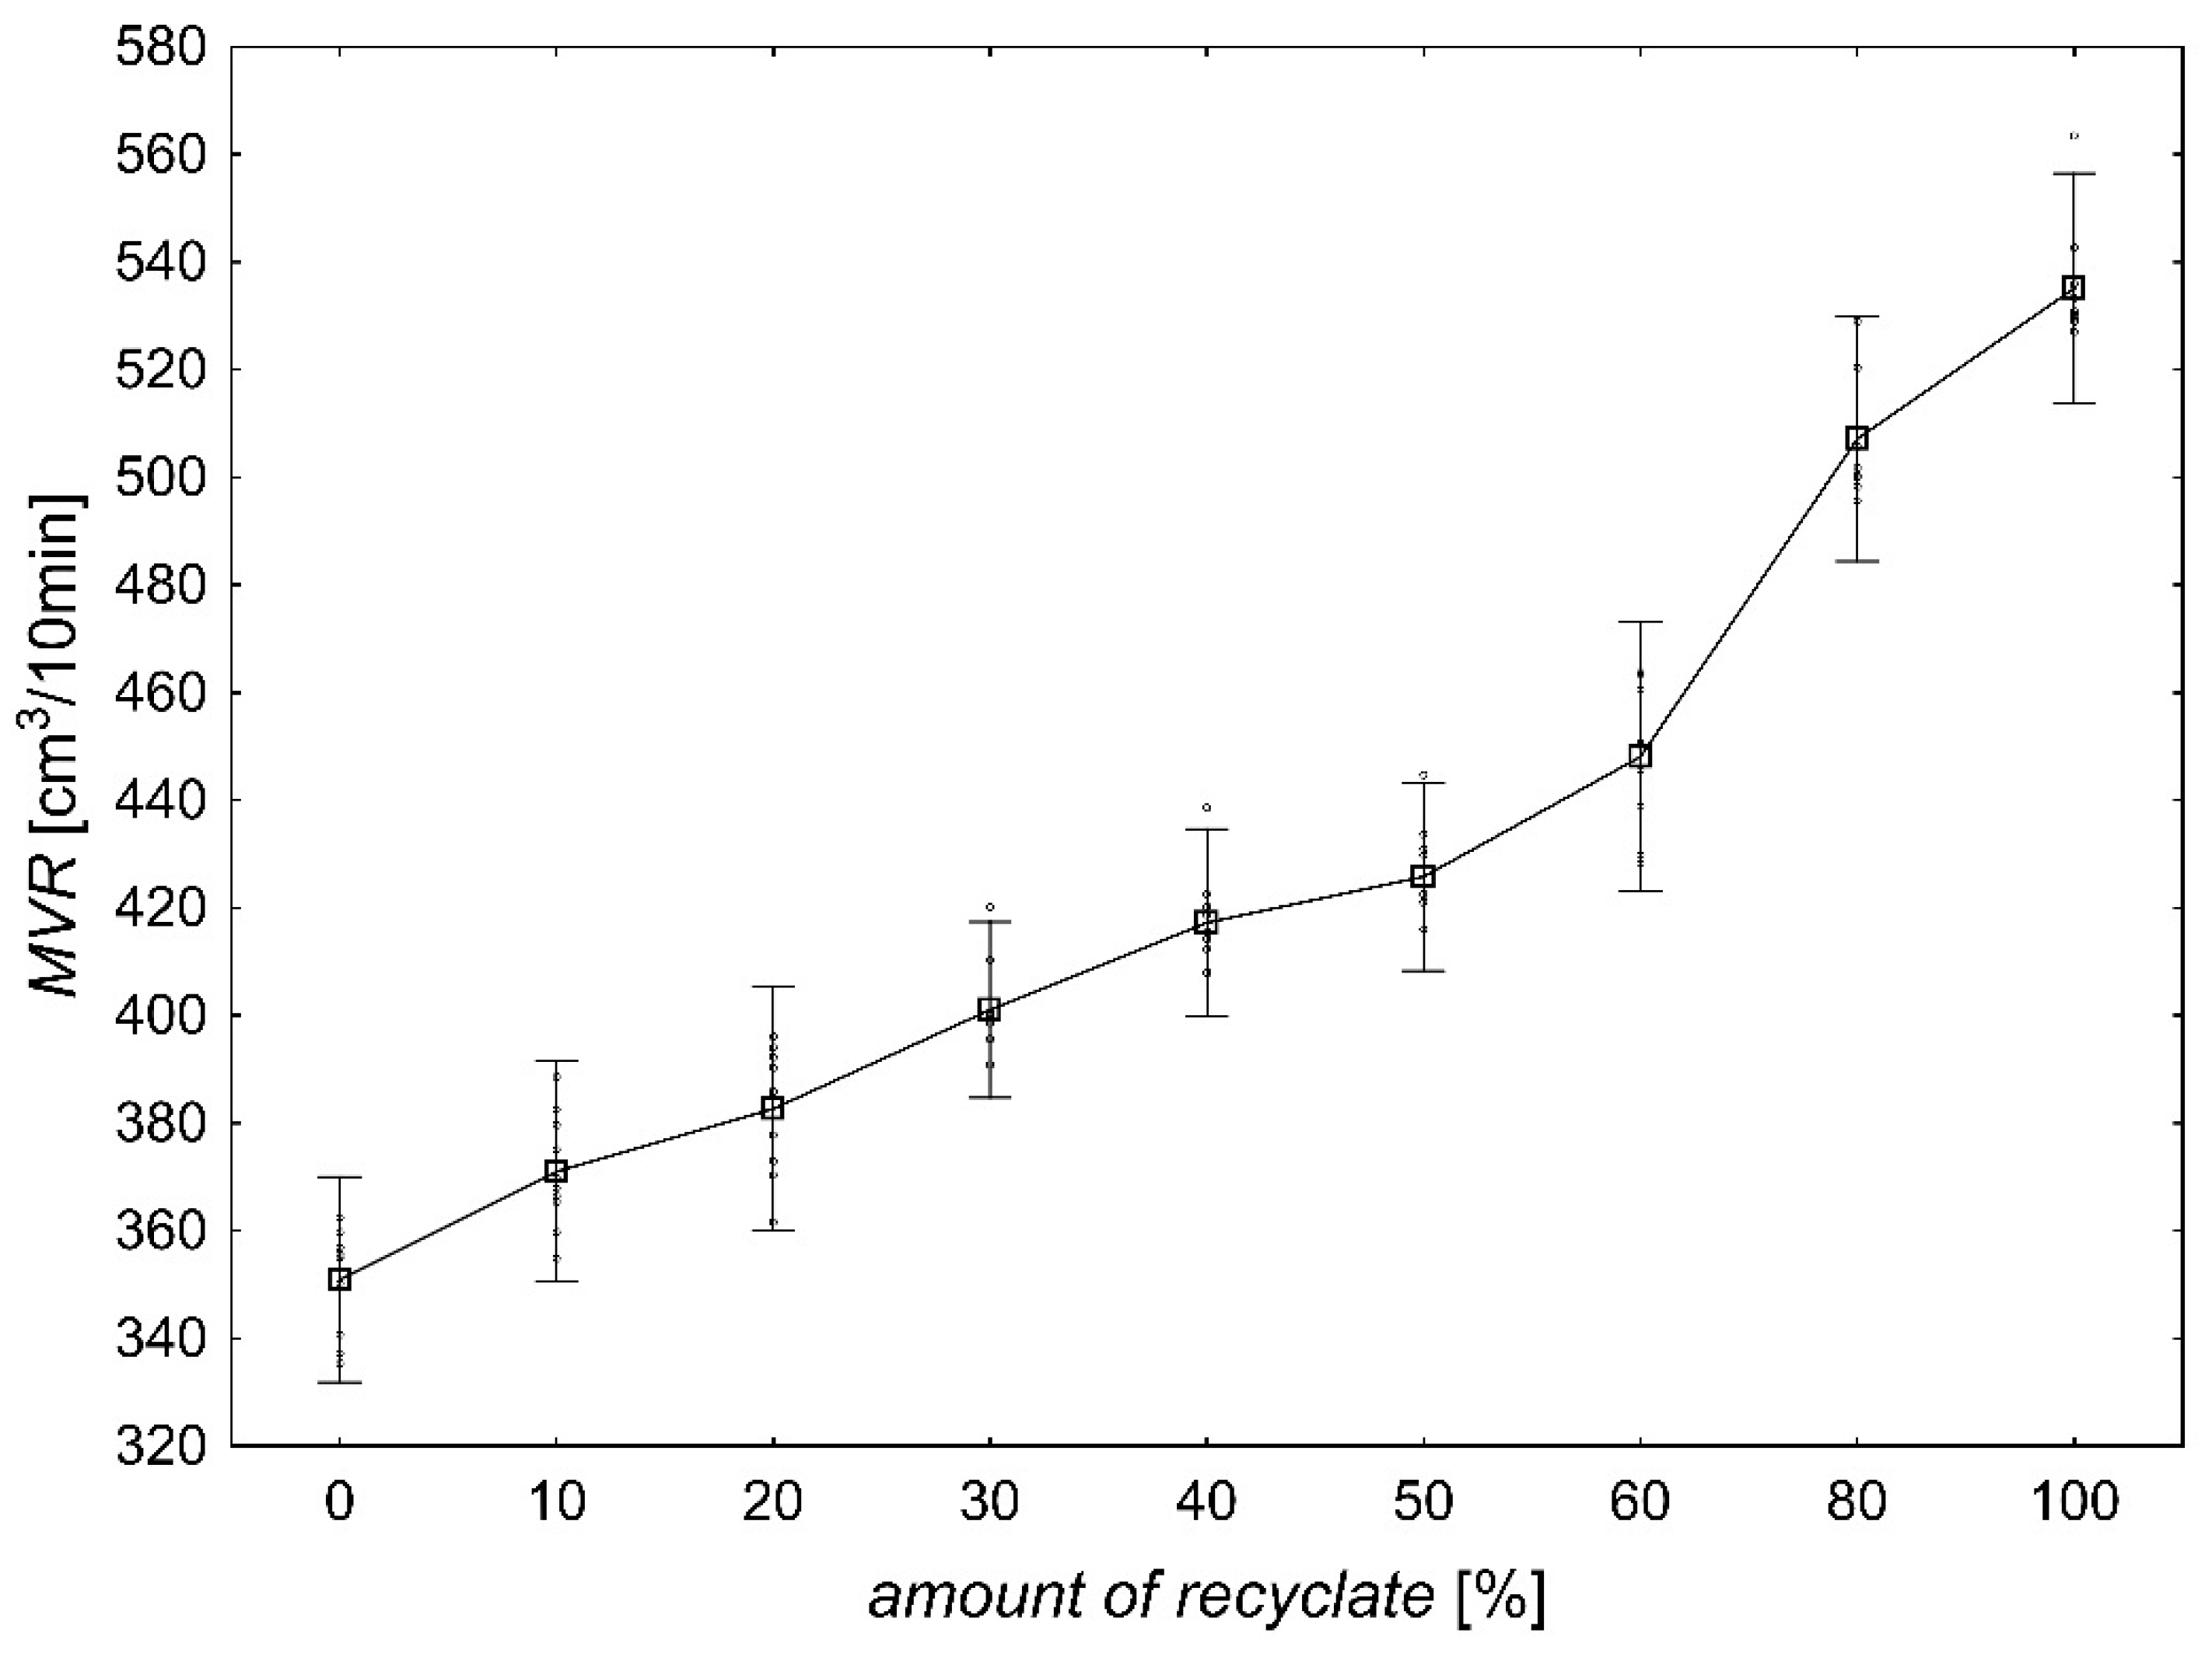
3.3. Rheological Properties

The primary dependent variable evaluated in this case is the melt volume-flow rate (MVR). Its variation was analyzed in relation to the amount of recycled content in the material (Figure 10). It is immediately apparent that increasing the recycled content in the material results in a significant increase in MVR (p < 0.000), with the variation in recycled content accounting for 97.160% of the change in the observed response (MVR). The average MVR value is 426.558 ± 12.379 cm3/10 min.
The MVR value for pure material (0% recycled content) is considered as the baseline. In this case, it reaches 350.951 ± 6.968 cm3/10 min. Increasing the recycled content to 10% raises the MVR to 370.996 ± 4.428 cm3/10 min (p < 0.000), representing a 5.712% change in MVR. A further increase in recycled content to 20% leads to an additional MVR increase of 3.150% (382.684 ± 8.241 cm3/10 min), and this rise in MVR is also statistically significant (p = 0.014). With 30% recycled content, the MVR increase (compared to 20% recycled content) is 4.797% (401.040 ± 5.970 cm3/10 min). Subsequently, increasing the recycled content to 40% results in a further conditional MVR increase of 4.035% (417.222 ± 6.359 cm3/10 min). Raising the recycled content to 50% causes an additional conditional increase in MVR of 2.055% (425.796 ± 6.383 cm3/10 min). However, this change in MVR is not statistically significant (p = 0.071). A significant increase in MVR occurs when the recycled content is raised from 60% (448.103 ± 9.148 cm3/10 min) to 80% (507.128 ± 8.302 cm3/10 min). The total change in the observed response in this case amounts to 13.172% (p < 0.000). For material with 100% recycled content, the MVR is at 535.100 ± 7.797 cm3/10 min, resulting in a 5.516% change in MVR (p < 0.000). The total change in the observed response between pure material and material made from 100% recycled content is 52.471%. This means that with a 10% increase in recycled content, the conditional melt volume-flow rate increases by 5.247%. In Figure 10, two primary regions of MVR change can be identified. The first is in the range of 0% to 60% recycled content, where the average change in the observed response is 4.165%. The second region is in the range of 80% to 100% recycled content, where the average MVR change is 9.344%. The results also confirm the conclusion of Ovsik et al. [48] and Demirbay et al. [49].

4. Discussion

A certain correlation between selected analyzed mechanical properties of the studied material in its pre-aging state can be observed in connection with its rheological properties (MVR). When analyzing the relationship between σm and MVR (Figure 11a), it is evident that as the MVR value increases, the σm value decreases. If this relationship is analyzed using Pearson’s correlation coefficient, its value is −0.912 (p < 0.000), indicating a very strong, inverse relationship. However, when considering the influence of the recycled content in the material, as shown in Figure 11a, the partial correlation coefficient between σm and MVR reaches −0.176. Despite this, the relationship is not statistically significant (p = 0.098). Furthermore, in Figure 11b, a significant inverse relationship (−0.819) (p < 0.000) can be confirmed between MVR and Et. It is clear here that as MVR increases, the Et value conditionally decreases. When accounting for the recycled content in the melt, the partial correlation coefficient between the observed variables is statistically significant (p = 0.003) and reaches −0.309. The conclusion from this finding is that the amount of recycled content significantly affects the mutual change between MVR and Et. As the recycled content in the melt increases, the mutual dependence between the observed variables decreases.
When examining the flexural properties of the studied material in its pre-aging state (Figure 12), it is clear that with an increase in MVR, the σfm value conditionally decreases (Figure 12a). The correlation coefficient between the observed variables is −0.834 (p < 0.000). If, as in the previous case, we also consider the amount of recycled content in the material, the partial correlation coefficient reaches −0.194. However, the relationship, with the inclusion of the third variable, is not statistically significant (p = 0.131). A similar trend is observed in the relationship between Ef and MVR (Figure 12b). The correlation coefficient between the observed variables is −0.804 (p < 0.000). However, when considering the amount of recycled content in the material as an additional variable, the observed relationship is no longer statistically significant (p = 0.918) and reaches −0.013. The results also confirm the conclusion of Mishra et al. [50] and Behalek et al. [51].

5. Conclusions

Based on the achieved results of experimental research using ANOVA analysis, we can make the following conclusions:
  • The condition of the material has a considerable influence on the flexural strength value, where it is at the level of 64%. The amount of recycled material affects this value at the level of 30%. The mutual interaction of the material condition and the amount of technological waste in the material was not significant.
  • The amount of technological waste in the material at the level of 76% has a significant effect on the change in the value of the flexural modulus. The state of the material contributes only 6% to the change in the value of the flexural modulus. The mutual interaction of the amount of technological waste in the material and the condition of the material is at the level of 2.5%.
  • The amount of technological waste in the material at the level of 92% has the greatest effect on the change in the tensile strength value. The influence of the material condition on the change in the observed response value is low at the level of 3%. The influence of the mutual interaction of the amount of technological waste in the material and the condition of the material is also at a negligible level of 1%.
  • The change in the value of the tensile modulus is significantly influenced primarily by the amount of technological waste in the material at the level of 65%. At the same time, the analysis points to the fact that the state of the material does not significantly affect the change in the value of the tensile modulus.
  • The total change in the value of the tensile strain at strength is to the greatest extent influenced by the amount of technological waste in the material at the level of 57%. The influence of the state of the material on the change in the value of the tensile strain at strength represents only 1%. At the same time, a statistically significant effect of the mutual interaction of the amount of technological waste in the material and the condition of the material is observed, which is at the level of 7%.
  • Increasing the amount of technological waste in the material results in a significant increase in rheological properties at the level of 97%.
  • A certain connection between the selected analyzed mechanical properties of the investigated material in the state before aging can be found in connection with its rheological properties.
The service life of the parts was monitored only with regard to degradation at elevated temperature. The experiment will continue by evaluating other influences, such as cyclic tests, UV radiation, etc. The novelty of the research lies in the detailed analysis of the influence of the amount of technological waste on the selected useful properties of the polymer composite. Each composite material is unique and adding recycled material can affect its properties differently. The presented procedure is applicable to all types of polymer composite materials. The results can help material processors in the application of technological waste.

Author Contributions

J.D. conceived and designed the experiments and wrote the paper; M.G. and P.F. analyzed and evaluated the data, processed the data, and performed the experiments and measurements. All authors have read and agreed to the published version of the manuscript.

Funding

This research received no external funding.

Data Availability Statement

The original contributions presented in this study are included in the article. Further inquiries can be directed to the corresponding author.

Acknowledgments

This research has been elaborated in the framework of the projects VEGA no. 1/0453/24 and KEGA 009TUKE-4/2024, which were granted by the Ministry of Education, Science, Research and Sport of the Slovak Republic. This publication is the result of the Project implementation: Development of excellent research capacities in the field of additive technologies for the Industry of the 21st century, ITMS: 313011BWN5, supported by the Operational Program Integrated Infrastructure funded by the ERDF.

Conflicts of Interest

The authors declare no conflicts of interest. The founding sponsors had no role in the design of the study; in the collection, analyses, or interpretation of the data; in the writing of the manuscript; or in the decision to publish the results.

References

  1. Kim, J.W.; Kim, H.S. Study on fibre orientation and fibre content of glass fibre reinforced polymer. Mater. Res. Innov. 2014, 18, 482–487. [Google Scholar] [CrossRef]
  2. Kim, D.; Kim, Y.H.; Gururaja, S.; Ramulu, M. Processing and fiber content effects on the machinability of compression moulded random direction short GFRP composites. Int. J. Automot. Technol. 2010, 11, 849–855. [Google Scholar] [CrossRef]
  3. Kim, J.V.; Kim, H.S.; Lee, D.G. Study on fibre orientation of weld line parts during injection moulding of fibre reinforced plastic by image processing. Mater. Res. Innov. 2011, 15, S303–S306. [Google Scholar] [CrossRef]
  4. Post, W.; Jeoffroy, E.; Garcia, S.J.; van der Zwaag, S. Self-healing glass fiber reinforced polymer composites based on montmorillonite reinforced compartmented alginate fibers. Polym. Compos. 2019, 40, 471–480. [Google Scholar] [CrossRef]
  5. Sathishkumar, M.P.; Satheeshkumar, S.; Naveen, J. Glass fiber-reinforced polymer composites—A review. J. Reinf. Plast. Compos. 2014, 33, 1258–1275. [Google Scholar] [CrossRef]
  6. Abbasi, A.; Hogg, P.J. Temperature and environmental effects on glass fibre rebar: Modulus, strength and interfacial bond strength with concrete. Compos. Part B-Eng. 2005, 36, 394–404. [Google Scholar] [CrossRef]
  7. Aktas, M.; Atas, C.; Icten, B.M.; Karakuzu, R. An experimental investigation of the impact response of composite laminates. Compos. Struct. 2009, 87, 307–313. [Google Scholar] [CrossRef]
  8. Conroy, A.; Halliwell, S.; Reynolds, T. Composite recycling in the construction industry. Compos. Part A-Appl. Sci. Manuf. 2006, 37, 1216–1222. [Google Scholar] [CrossRef]
  9. Huang, Z.; Ge, H.; Zhao, Y.Y.; Liu, F.G.; Yin, J.J. Reuse FRP waste as filler replacement for sisal fiber reinforced sheet molding compound. Polym. Compos. 2018, 39, 1896–1904. [Google Scholar] [CrossRef]
  10. Chen, J.; Teng, Z.Y.; Wu, J.J. Recycling of waste FRP and corn straw in wood plastic composite. Polym. Compos. 2017, 38, 2140–2145. [Google Scholar] [CrossRef]
  11. Shima, H.; Takahashi, H.; Mizuguchi, J. Recovery of glass fibers from fiber reinforced plastics. Mater. Trans. 2011, 52, 1327–1329. [Google Scholar] [CrossRef]
  12. Yildiz, S.; Karaagac, B.; Guzelis, S.G. Utilization of glass fiber reinforced polymer wastes. Polym. Compos. 2021, 42, 412–423. [Google Scholar] [CrossRef]
  13. Ianakiev, A.; Cheah, H. Glass fibre reinforced composites from recycled polymers. Key Eng. Mater. 2014, 572, 28–31. [Google Scholar] [CrossRef]
  14. Czechowski, L.; Gralewski, J.; Kubiak, T. Failure of polymer beams reinforced with glass fibers. Mech. Compos. Mater. 2020, 56, 195–206. [Google Scholar] [CrossRef]
  15. Douthe, C.; Caron, J.F.; Baverel, O. Gridshell structures in glass fibre reinforced polymers. Constr. Build. Mater. 2010, 24, 1580–1589. [Google Scholar] [CrossRef]
  16. Dobránsky, J.; Gombár, M.; Stejskal, T. The influence of the use of technological waste and the simulation of material lifetime on the unnotched impact strength of two different polymer composites. Materials 2022, 15, 8516. [Google Scholar] [CrossRef]
  17. Ajorloo, M.; Ghodrat, M.; Kang, W.H. Incorporation of recycled polypropylene and fly ash in polypropylene-based composites for automotive applications. J. Polym. Environ. 2020, 29, 1298–1309. [Google Scholar] [CrossRef]
  18. Jiun, Y.L.; Tze, C.T.; Moosa, U.; Tawawneh, M.A. Effects of recycling cycle on used thermoplastic polymer and thermoplastic elastomer polymer. Polym. Polym. Compos. 2016, 24, 735–739. [Google Scholar] [CrossRef]
  19. Liu, F.; Li, T.D.; Xu, F.Y.; Li, J.Q.; Jiang, S.F. Microstructure, tensile property, and surface quality of glass fiber-reinforced polypropylene parts molded by rapid heat cycle molding. Adv. Polym. Technol. 2020, 2020, 3161068. [Google Scholar] [CrossRef]
  20. Zabihi, O.; Ahmadi, M.; Liu, C.; Mahmoodi, R.; Li, Q.X.; Ferdowsi, M.R.G.; Naebe, M. A sustainable approach to the low-cost recycling of waste glass fibres composites towards circular economy. Sustainability 2020, 12, 641. [Google Scholar] [CrossRef]
  21. Castro, A.C.M.; Ribeiro, M.C.S.; Santos, J.; Meixedo, J.P.; Silva, F.J.G.; Fiúza, A.; Dinis, M.L.; Alvim, M.R. Sustainable waste recycling solution for the glass fibre reinforced polymer composite materials industry. Constr. Build. Mater. 2013, 45, 87–94. [Google Scholar] [CrossRef]
  22. Das, M.; Chacko, R.; Varughese, S. An efficient method of recycling of CFRP waste using peracetic acid. ACS Sustain. Chem. Eng. 2018, 6, 1564–1571. [Google Scholar] [CrossRef]
  23. Hagnell, M.K.; Akermo, M. The economic and mechanical potential of closed loop material usage and recycling of fibre-reinforced composite materials. J. Clean. Prod. 2019, 223, 957–968. [Google Scholar] [CrossRef]
  24. Naqvi, S.R.; Prabhakara, H.M.; Bramer, E.A.; Dierkes, W.; Akkerman, R.; Brem, G. A critical review on recycling of end-of-life carbon fibre/glass fibre reinforced composites waste using pyrolysis towards a circular economy. Resour. Conserv. Recycl. 2018, 136, 118–129. [Google Scholar] [CrossRef]
  25. Oliveux, G.; Dandy, L.O.; Leeke, G.A. Current status of recycling of fibre reinforced polymers: Review of technologies, reuse and resulting properties. Prog. Mater. Sci. 2015, 72, 61–99. [Google Scholar] [CrossRef]
  26. ISO 527-1:2019; Plastics–Determination of Tensile Properties. Part 1: General Principles. ISO: Geneva, Switzerland, 2019.
  27. ISO 527-2:2012; Plastics–Determination of Tensile Properties. Part 2: Test Conditions for Moulding and Extrusion Plastics. ISO: Geneva, Switzerland, 2012.
  28. ISO 178:2019; Plastics–Determination of Flexural Properties. ISO: Geneva, Switzerland, 2019.
  29. ISO 1133-1:2022; Plastics–Determination of the Melt Mass-Flow Rate (MFR) and Melt Volume-Flow Rate (MVR) of Thermoplastics. ISO: Geneva, Switzerland, 2022.
  30. Breinan, L.; Friedman, J.H.; Olshen, R.A.; Stone, C.J. Classification and Regression Trees; Wadsworth and Brooks/Cole Advanced Books and Software: Monterey, CA, USA, 1984. [Google Scholar]
  31. Vojvodic, D.; Matejicek, F.; Loncar, A.; Zabarovic, D.; Komar, D.; Mehulic, K. Comparison of flexural strength between fiber-reinforced polymer and high-impact strength resin. Mil. Med. 2008, 173, 1023–1030. [Google Scholar] [CrossRef]
  32. Gawdzinska, K.; Nabialek, M.; Bryll, K.; Szymanski, P.; Sandu, A.V. Flexural strength of single polymer polyester composites as a measure of material degradation. Mater. Plast. 2017, 54, 539–542. [Google Scholar] [CrossRef]
  33. Tyagi, B.; Sahai, A.; Sharma, R.S. Augmenting the flexural strength of polymer composites for stronger and more durable prosthetic sockets. Polym. Compos. 2023, 44, 5656–5674. [Google Scholar] [CrossRef]
  34. Singh, K.K.; Chaudhary, S.K.; Venugopal, R. Enhancement of flexural strength of glass fiber reinforced polymer laminates using multiwall carbon nanotubes. Polym. Eng. Sci. 2019, 59, E248–E261. [Google Scholar] [CrossRef]
  35. Mohyeddin, A. Theoretical evaluation of tensile and flexural moduli of structural polymer foams. J. Cell. Plast. 2014, 50, 221–239. [Google Scholar] [CrossRef]
  36. Barzegari, M.R.; Kabamba, E.T.; Rodrigue, D. Flexural modulus prediction of symmetric structural polymer foams with complex density profiles. J. Porous Mater. 2011, 18, 715–721. [Google Scholar] [CrossRef]
  37. Zhuge, J.F.; Gou, J.H.; Chen, R.H.; Kapat, J. Finite element modeling of post-fire flexural modulus of fiber reinforced polymer composites under constant heat flux. Compos. Part A-Appl. Sci. Manuf. 2012, 43, 665–674. [Google Scholar] [CrossRef]
  38. Ma, K.; Liu, J.; Jiang, C.H.; Ma, X.F.; Huang, L.H.; He, C.Z.; Qi, C.Q. Compressive and tensile strength of polymer-based fiber composite sand. J. Cent. South Univ. 2022, 29, 528–545. [Google Scholar] [CrossRef]
  39. Pragasam, V.; Reddy, D.M. Investigation on tensile strength of cellulose microfibril reinforced polymer composites. Cellul. Chem. Technol. 2020, 54, 531–544. [Google Scholar] [CrossRef]
  40. Kartikeya, K.; Chouhan, H.; Ahmed, A.; Bhatnagar, N. Determination of tensile strength of UHMWPE fiber-reinforced polymer composites. Polym. Test. 2020, 82, 106293. [Google Scholar] [CrossRef]
  41. de Morais, A.B. Prediction of the longitudinal tensile strength of polymer matrix composites. Compos. Sci. Technol. 2006, 66, 2990–2996. [Google Scholar] [CrossRef]
  42. Wang, W.J.; Mo, Z.L.; Chouw, N.; Jayaraman, K. Strain rate effect on tensile strength of glass fiber-reinforced polymers. Int. J. Mod. Phys. B 2022, 36, 2240069. [Google Scholar] [CrossRef]
  43. Rusinko, J.; Baron, P.; Panda, A.; Kocisko, M. Research of mold cooling process optimization for production of expanded polystyrene with the application of experimental measurements on the test form. Adv. Mech. Eng. 2021, 13, 41012. [Google Scholar] [CrossRef]
  44. Kumpenza, C.; Pramreiter, M.; Nenning, T.J.; Bliem, P.; Reiteter, R.; Konnerth, J.; Müller, U. Temperature-related tensile modulus of polymer-based adhesive films. J. Adhes. 2023, 99, 259–276. [Google Scholar] [CrossRef]
  45. Zare, Y.; Rhee, K.Y. Role of critical interfacial shear modulus between polymer matrix and carbon nanotubes in the tensile modulus of polymer nanocomposites. Mech. Mater. 2020, 141, 103269. [Google Scholar] [CrossRef]
  46. Furmanski, J.; Trujilo, C.P.; Martinez, D.T.; Gray, G.T.; Brown, E.N. Dynamic-Tensile-Extrusion for investigating large strain and high strain rate behavior of polymers. Polym. Test. 2012, 31, 1031–1037. [Google Scholar] [CrossRef]
  47. Dang, Z.M.; Yao, S.H.; Xu, H.P. Effect of tensile strain on morphology and dielectric property in nanotube/polymer nanocomposites. Appl. Phys. Lett. 2007, 90, 12907. [Google Scholar] [CrossRef]
  48. Ovsik, M.; Stanek, M.; Dockal, A.; Fluxa, P.; Chalupa, V. The influence of surface quality on flow length and micro-mechanical properties of polycarbonate. Materials 2021, 14, 5910. [Google Scholar] [CrossRef] [PubMed]
  49. Demirbay, B.; Kara, D.B.; Ugur, S. Multivariate regression (MVR) and different artificial neural network (ANN) models developed for optical transparency of conductive polymer nanocomposite films. Expert Syst. Appl. 2022, 207, 17937. [Google Scholar] [CrossRef]
  50. Mishra, R.; Behera, B.K.; Muller, M.; Petru, M. Finite element modeling based thermodynamic simulation of aerogel embedded nonwoven thermal insulation material. Int. J. Therm. Sci. 2021, 164, 106898. [Google Scholar] [CrossRef]
  51. Behalek, L.; Novak, J.; Brdlik, P.; Boruvka, M.; Habr, J.; Lenfeld, P. Physical Properties and Non-Isothermal Crystallisation Kinetics of Primary Mechanically Recycled Poly(l-lactic acid) and Poly(3-hydroxybutyrate-co-3-hydroxyvalerate). Polymers 2021, 13, 3396. [Google Scholar] [CrossRef]
Figure 1. The strain gauge was placed on the test sample.
Jcs 08 00470 g001
Figure 2. Three-point loading test.
Jcs 08 00470 g002
Figure 3. Rheometer Meltflow Haake MT.
Jcs 08 00470 g003
Figure 4. Influence of recycled content proportion and material condition on the variation in flexural strength value (σfM).
Jcs 08 00470 g004
Figure 5. The influence of the amount of recyclate in the materials and the state of the material on the change in the value of flexural strength (a) with a proportional elongation of ε = 0.05% and (b) with a proportional elongation of ε = 0.25%.
Jcs 08 00470 g005
Figure 6. The influence of the amount of recyclate in the materials and the condition of the material on the change in the value of the flexural modulus.
Jcs 08 00470 g006
Figure 7. Change in tensile strength value (σm) depending on the amount of recyclate in the materials and the condition of the material.
Jcs 08 00470 g007
Figure 8. Change in the value of the tensile modulus (Et) depending on the amount of recyclate in the materials and the condition of the material.
Jcs 08 00470 g008
Figure 9. Change in the value of the tensile strain at strength (εm) depending on the amount of recyclate in the material and the condition of the material.
Jcs 08 00470 g009
Figure 10. Dependence of the change in the melt volume-flow rate on the amount of recyclate in the materials.
Jcs 08 00470 g010
Figure 11. Relationship between MVR and selected mechanical properties during the tensile test depending on the amount of recyclate in the materials. (a) Tensile strength (σm); (b) tensile modulus (Et).
Jcs 08 00470 g011
Figure 12. Relationship between MVR and selected mechanical properties during the tensile test depending on the amount of recyclate in the materials. (a) Flexural strength (σfm); (b) flexural modulus (Ef).
Jcs 08 00470 g012
Table 1. Typical properties of ZYTEL® HTN FR52G30NH NC010.
PropertiesValueUnit
Density1.44g/cm3
Tensile modulus10,500MPa
Tensile stress at break150MPa
Tensile strain at break2.2%
Flexural modulus9000MPa
Flexural stress230MPa
Charpy un-notched impact strength (+23 °C)45kJ/m2
Charpy un-notched impact strength (−30 °C)40kJ/m2
Disclaimer/Publisher’s Note: The statements, opinions and data contained in all publications are solely those of the individual author(s) and contributor(s) and not of MDPI and/or the editor(s). MDPI and/or the editor(s) disclaim responsibility for any injury to people or property resulting from any ideas, methods, instructions or products referred to in the content.

