Article

Effect of Hydrogels Containing Nanosilica on the Properties of Cement Pastes

by
Babak Vafaei
1,
Khashayar Farzanian
2 and
Ali Ghahremaninezhad
1,*
1
Department of Civil, Architectural and Environmental Engineering, University of Miami, Coral Gables, FL 33146, USA
2
School of Medicine, Yale University, New Haven, CT 06510, USA
*
Author to whom correspondence should be addressed.
J. Compos. Sci. 2021, 5(4), 105; https://doi.org/10.3390/jcs5040105
Submission received: 29 December 2020 / Revised: 27 March 2021 / Accepted: 31 March 2021 / Published: 12 April 2021
(This article belongs to the Special Issue Progress in Si-based Ceramic and Composites)

Abstract

:
The effect of hydrogels containing nanosilica (NSi) on the autogenous shrinkage, mechanical strength, and electrical resistivity of cement pastes was studied. The interaction between the hydrogels and the surrounding cementitious matrix was examined using thermogravimetric analysis (TGA), Fourier transform infrared spectroscopy (FTIR), and scanning electron microscopy (SEM). The addition of hydrogels decreased autogenous shrinkage in the cement pastes and this reduction showed a dependence on the concentration of NSi in the hydrogels. Compressive strength and electrical resistivity were reduced in the cement pastes with hydrogels and this reduction was decreased with increased concentration of NSi in the hydrogel. A change in the phase composition of the cement paste in the region close to the hydrogel was noted, compared to the region away from the hydrogel. In a lime solution with increased pH and temperature, Ca(OH)2 and CaCO3 were found to form within the hydrogels; evidence of calcium-silicate-hydrate (C-S-H) formation in the hydrogels with NSi was obtained, indicating the possible pozzolanic potential of the hydrogels with NSi.

1. Introduction

A major challenge related to high-performance concrete (HPC) is the durability issues arising from the autogenous shrinkage cracking in this material system [1]. This is caused by a low water-to-cement ratio used in the formulation of HPC [2]. A reduction in relative humidity due to self-desiccation creates capillary forces in the material microstructure, which leads to the development of tensile stresses and cracking in the material [3,4]. Once cracks form in the material, the rate of transport of deleterious substances into the material is significantly increased, causing chemical and physical degradation [5].
To remedy autogenous shrinkage-induced cracking, and ensuing durability issues, the use of internal curing agents, including saturated lightweight aggregates, superabsorbent hydrogels, expanded clay and pumice, has been attempted in the past [6]. Superabsorbent hydrogels have been shown to be effective to reduce autogenous shrinkage [4,7,8,9], reduce crack propagation [10,11] and improve the freeze–thaw resistance [12,13]. The self-healing potential of hydrogels has also been documented in previous studies [14,15]. However, a drawback of using hydrogels in cementitious materials is the reduced mechanical strength due to the presence of large voids left inside the material by the hydrogels [8,9,16]. Factors including the mixed design of cementitious materials and the physical and chemical characteristics of hydrogels are key in how hydrogels influence the properties of cementitious materials [7,8,17,18,19].
The hydrogels that are utilized in the cementitious mixtures are mainly comprised of a crosslinked polymer of an acrylic acid salt or a copolymer of an acrylic acid salt and acrylamide [19,20,21,22]. The polymer networks of these hydrogels are ionizable and, as a result, the behavior of the hydrogels is sensitive to the pH and ionic strength of the solution [8,15,23,24,25,26]. This property of hydrogels can be exploited to adapt them to the specific chemistry of cementitious materials to yield the desired effect.
Pozzolanic additives, such as fly ash, metakaolin, silica fume, and nanosilica (NSi) are utilized in the formulation of HPC to improve its durability and increase its service life [27,28,29,30]. Prior investigations examined the influence of hydrogels on the performance of cement blended with, silica fume [7], fly ash [27,31], ground granulated blast furnace slag [7,27,32], and ground glass [33]. Amorphous NSi, in particular, due to its high specific surface area, has shown increased pozzolanic reactivity compared to other pozzolans [34,35]. Prior studies examined the use of materials with a combination of pozzolanicity and internal curing in cementitious materials. In those studies, the internal curing material consisted of a porous material with high amorphous silica content [36,37]. The use of hydrogels containing rice husk ash [38] in oil recovery, and fly ash [39] in soil conditioning applications, were also attempted in the past. NSi has also been used in other composite systems in oil recovery applications [40,41,42].
The use of hydrogels containing NSi, where NSi is actually within the hydrogels, in cementitious materials, has not received attention in the past, except for a recent paper [43]. Their paper focused on the effect of hydrogels containing NSi on the microstructure of cement paste and showed the formation of Ca(OH)2 and calcium-silicate-hydrate (C-S-H) in the voids occupied by the hydrogel particles. It was concluded in the above-mentioned paper that the use of hydrogels containing NSi could aid in replenishing the hydrogel void space in cementitious materials.
However, due to the scarcity of studies on the hydrogels containing materials with desired properties, such as pozzolanicity, there is a lack of understanding regarding the influence of such composite hydrogels on cementitious materials. Thus, to address this research need, the objectives of this paper are to study the behavior of polyacrylamide hydrogels containing varying concentrations of NSi, on the autogenous shrinkage, compressive strength, and the electrical resistivity of cement pastes. The interaction between the hydrogels and the cementitious materials, and the pozzolanic reactivity of the hydrogels containing NSi were evaluated using FTIR, TGA, and SEM.

2. Materials and Methods

2.1. Materials

2.1.1. Hydrogels

Hydrogels used in this paper were crosslinked polyacrylamide, synthesized using free radical polymerization, as described in our previous works [24,26,44]. Acrylamide monomers (AM) were added to distilled water containing NSi to achieve varying compositions of NSi/AM = 0%, 10%, 20% 25%, and 50%. Table 1 shows the chemical compositions of the hydrogels synthetized in this study. The crosslinker, N,N′-methylenebisacrylamide (MBA), and the initiator, ammonium persulfate, were added to the solution and stirred vigorously. The solution was poured into a beaker and allowed for gelation for three hours in an oven at a temperature of 60 °C. The hydrogels were removed from the beakers and immersed in distilled water for one day to remove unreacted monomers. Then, the hydrogels were dried at a temperature of 80 °C. After drying, the hydrogels were ground in a coffee grinder and sieved to obtain a powder in the size range of 75–425 μm. Scanning electron images at different magnifications of the hydrogel powders with NSi/AM = 50% are shown in Figure 1. It is seen that the hydrogel particles have an angular morphology, as seen in Figure 1a. The hydrogel powders with NSi appeared more opaque than those without NSi and this opaqueness increased with increased concentration of NSi in the hydrogels (not shown here). It is expected that NSi is physically bonded and retained within the polymer networks of the hydrogels. A schematic showing NSi confined within the polymer networks of the hydrogel is provided in Krafcik et al. [43]. There was no visible evidence of NSi escaping the hydrogels during synthesis, washing, or absorption measurement using the teabag test.

2.1.2. Cement Pastes

Type I/II Portland cement was used in the preparation of the cement pastes. The chemical composition of the cement is given in Table 2. The mix designs of the cement pastes cast in the experiments are listed in Table 3. The water/cement ratio of the cement paste without hydrogels was 0.3 and with hydrogels was 0.35 to mitigate autogenous shrinkage [4]. In order to increase workability, a superplasticizer, WRDA 60, W. R. Grace and Co.-Conn., at a concentration of 0.5% per cement mass, was added to all mixtures. The amount of hydrogel powders to be added to the mixtures was determined using the flow test. In this test, it is assumed that the water absorption in the hydrogel is equal to the additional water needed to obtain the same flow value for the cement paste with and without hydrogel addition. Dry hydrogel powder was dry-mixed in the cement using a mixer for five minutes. The cement and water containing the superplasticizer were mixed for 2.5 min. After initial contact of the cement and water for 30 s, the mixture was mixed at a slow speed for another 30 s. Then, the unmixed cement on the sides of the container was scraped using a spoon for 30 s, followed by mixing at a high speed for 60 s. Cement pastes were poured into a stainless-steel cone (height: 50 mm, bottom diameter: 100 mm, top diameter: 70 mm) and placed on a table for 10 min. Then, the cone was removed and the table was dropped 25 times over a time period of 15 s. The average of the two perpendicular diameters of the bottom diameter of the paste was measured as the flow value. The target flow value was 20 cm. The addition percentage of the hydrogels per cement mass was determined to be 0.3, 0.4, 0.7, for H-0, H-10, and H-50, respectively.
Paste cubes were prepared by casting paste into cubic molds of dimensions 50 × 50 × 50 mm in two layers and tamping, in accordance with ASTM C 109. The molds were wrapped with a pre-stretch plastic wrap and sealed in double-layer polypropylene bags in order to protect them against evaporation. After 24 h, the cubes were demolded, sealed and stored in the double-layer bags at 23 °C until testing.

2.2. Experimental Methods

2.2.1. Absorption Test

Hydrogel absorption in distilled water (DW) and in a synthetic pore solution was measured using the teabag test [17]. The synthetic pore solution was prepared following the composition detailed in [45]. It was prepared using 0.1062 M KOH, 0.0489 M Na2SO4, 0.037 M K2SO4, and 0.0212 M Ca(OH)2. In this test, approximately 0.1 g of hydrogel powder was poured into a teabag and submerged in the solution. Teabags containing hydrogels were removed from the solutions at certain time intervals, gently surface dried using Kimwipes, and their mass was immediately measured using an analytical balance with a resolution of 0.0001 g. There is a likelihood that solution would be trapped between hydrogel particles; however, careful attention was paid to avoid damaging the hydrogels by not exerting pressure on the hydrogels to remove the entrapped solution between the hydrogel particles. After measuring their mass, the teabags were immediately returned to the solution. Solutions were then sealed using parafilm to minimize exposure to the air until the next measurement. The amount of the solution absorbed by empty teabags was measured by submerging five empty teabags in the solution and the average wet mass was measured. The hydrogel absorption was obtained using Equation (1). Three replicates were used, and the average was reported
Q   =   M 1 M 2 M 3 M 3
where M1, M2 and M3 are the mass of the wet teabag containing hydrogels, wet empty teabag, and dry hydrogel, respectively.

2.2.2. Compressive Strength Test

The compressive strength test was conducted on the cement paste cubes at three different ages (3, 7 and 28 days) in accordance with ASTM C109 [46]. The test was conducted using a SATEC machine. Five replicates were utilized in this test and the average value is reported.

2.2.3. Electrical Resistivity Test (EIS)

The electrical resistivity of the cement paste cubes was measured using a Gamry 600 Potentiostat/Galvanosat with a 250 mV AC signal and a frequency range of 106 to 10 Hz. The electrical resistivity measurement was conducted at three different ages of 4, 7, and 28 days. The surface of the cement paste cubes was first dried using Kimwipes. Two pieces of foam presoaked in a 1 M sodium chloride solution were placed between the electrode and the cube surface. The electrical resistivity 𝜌 (Ω·m) was obtained using Equation (2) as follows
ρ = RS / a
where R (Ω) is the measured resistance corrected for the resistance of the two pieces of wetted foam, a is the cube thickness (m), and S is the cube surface area in contact with the electrode (m2). The test was conducted with five replicates and averaged. It should be noted that the electrical resistivity of the cement paste cubes is dependent on the morphological characteristics of pores and the chemistry of pore fluid in cement paste. Thus, this test provides information about the microstructure and transport characteristics of cementitious materials [47,48].

2.2.4. Autogenous Shrinkage Test

The linear autogenous shrinkage of the cement pastes was evaluated in accordance with the ASTM C1698-09 [49]. The temporal change in the length of corrugated plastic tubes filled with cement pastes with a length and outer diameter of approximately 420 mm and 29 mm, respectively, was measured in room temperature (23 °C and 60 ± 5% RH). Three replicates of each mixture were used and averaged. In order to avoid damaging the specimens, all samples were horizontally placed on corrugated plastic sheets. The measurements were continuously performed every 12 h in the first seven days and continued once a day for 30 days.

2.2.5. TGA

The Ca(OH)2 and CaCO3 content of the cement paste was measured using the TGA analysis. Hardened cement pastes were ground into powder and sieved. The powder was passed through the sieve #60 and vacuum-dried at 50 °C for 24 h. TGA analysis was performed on approximately 30–40 mg of the sample using the TA Instruments TGA55. The temperature was ramped at 20°C/min from 23°C to 1000°C in an inert nitrogen atmosphere. The mass loss in cement paste in a temperature range of 400–500 °C is attributed to the Ca(OH)2 decomposition and in the range of 600–750 °C attributed to the CaCO3 decomposition. The amount of Ca(OH)2 and CaCO3 normalized with respect to the cement paste mass was determined as follows
Ca ( OH ) 2 = 74.1 18.0 M ¯ M
CaCO 3 = 100.1 44 M ¯ M
where M ¯ (mg) is the mass change corresponding to Ca(OH)2 or CaCO3 decomposition and M (mg) is the initial sample mass.

2.2.6. Interaction between Hydrogels and Cement Paste Matrix

The interaction between the hydrogels and the surrounding cementitious matrix was studied using narrow hydrogel rods embedded in cement paste. H-0, H-20 and H-50 were synthesized in glass pipettes of 5 mm in diameter. They were demolded after 3 h and dried in the oven at 60 °C. The dry diameter of the hydrogel rods was about 3.1 mm. In order to longitudinally place the dried rod hydrogels inside the cement paste, a longitudinal slit was made on polypropylene tubes of length 300 mm and diameter 50 mm to allow for pouring paste in tubes. The water/cement for this paste was 0.4. After filling the lower half of the tube with cement paste, the hydrogel rods were placed over the cement paste. The hydrogel rods were allowed to absorb the pore solution and change in dimensions for 5–10 min. Then, the upper half of the tube was filled with the cement paste, and the tubes were sealed in double-layer bags. The cement paste tubes were sawed perpendicular to the longitudinal direction at certain ages. In order to avoid damaging the hydrogels during sawing, careful attention was paid to not saw the hydrogel embedded in the cement paste. To this end, samples were sawed starting from the circumference of the tubes until close to the hydrogel’s location in the center, and then broken into two cross-sections by hand. The hydrogels were taken out of each cross section of the cement pastes. The cross-section of the cement paste was divided into three zones, namely, Z1, Z2, and Z3, radially located from the hydrogels. Z3 corresponds to the immediate boundary of cement matrix in contact with the hydrogel; Z2 corresponds to the cement matrix close to the hydrogel that appeared darker than the rest of the cross-section due to a higher moisture level as a result of the gradual water release from the hydrogel; and Z1 is a zone far away from the hydrogel. The schematic of these zones in the cross-section of the cement pastes is shown in Figure 2. Samples were taken from each zone and analyzed using TGA.

2.2.7. Pozzolanic Potential of the Hydrogels

In this test, the interaction between the cement pore solution and the hydrogels and potential pozzolanic reactivity of the hydrogels containing NSi were examined. In order to accelerate the potential pozzolanic reactivity of the hydrogels, the hydrogels were submerged in a saturated lime solution at increased pH and an increased temperature of 50 °C. The saturated lime solution was prepared by adding 25 g of Ca(OH)2 into 300 g of distilled water and stirring it for 30 min using a magnetic stirrer. Sodium hydroxide was then gradually added to the solution until a pH value of 13.1 was obtained. Teabags containing 2 g of the hydrogel powders as well as teabags containing 2 g of NSi were submerged separately in plastic containers filled with the saturated lime solution. The teabags were hung inside the container to avoid direct contact of the teabags and the Ca(OH)2 sediments in the bottom of the containers. The containers were sealed and placed in the oven at 50 °C. The hydrogels and NSi teabags were only taken out of the sealed containers after 14 days and immediately placed in a vacuum oven at 50 °C to dry. Samples for SEM imaging were taken from the dried hydrogels and NSi. Dried hydrogels were then ground into a powder using a bladed coffee grinder, passed through the sieve #60, and analyzed using TGA and Fourier transform infrared spectroscopy (FTIR). FTIR was conducted using the PerkinElmer Paragon 1000 FTIR and the transmission scans between 600 and 4000 cm−1 of the samples were obtained.

3. Results and Discussion
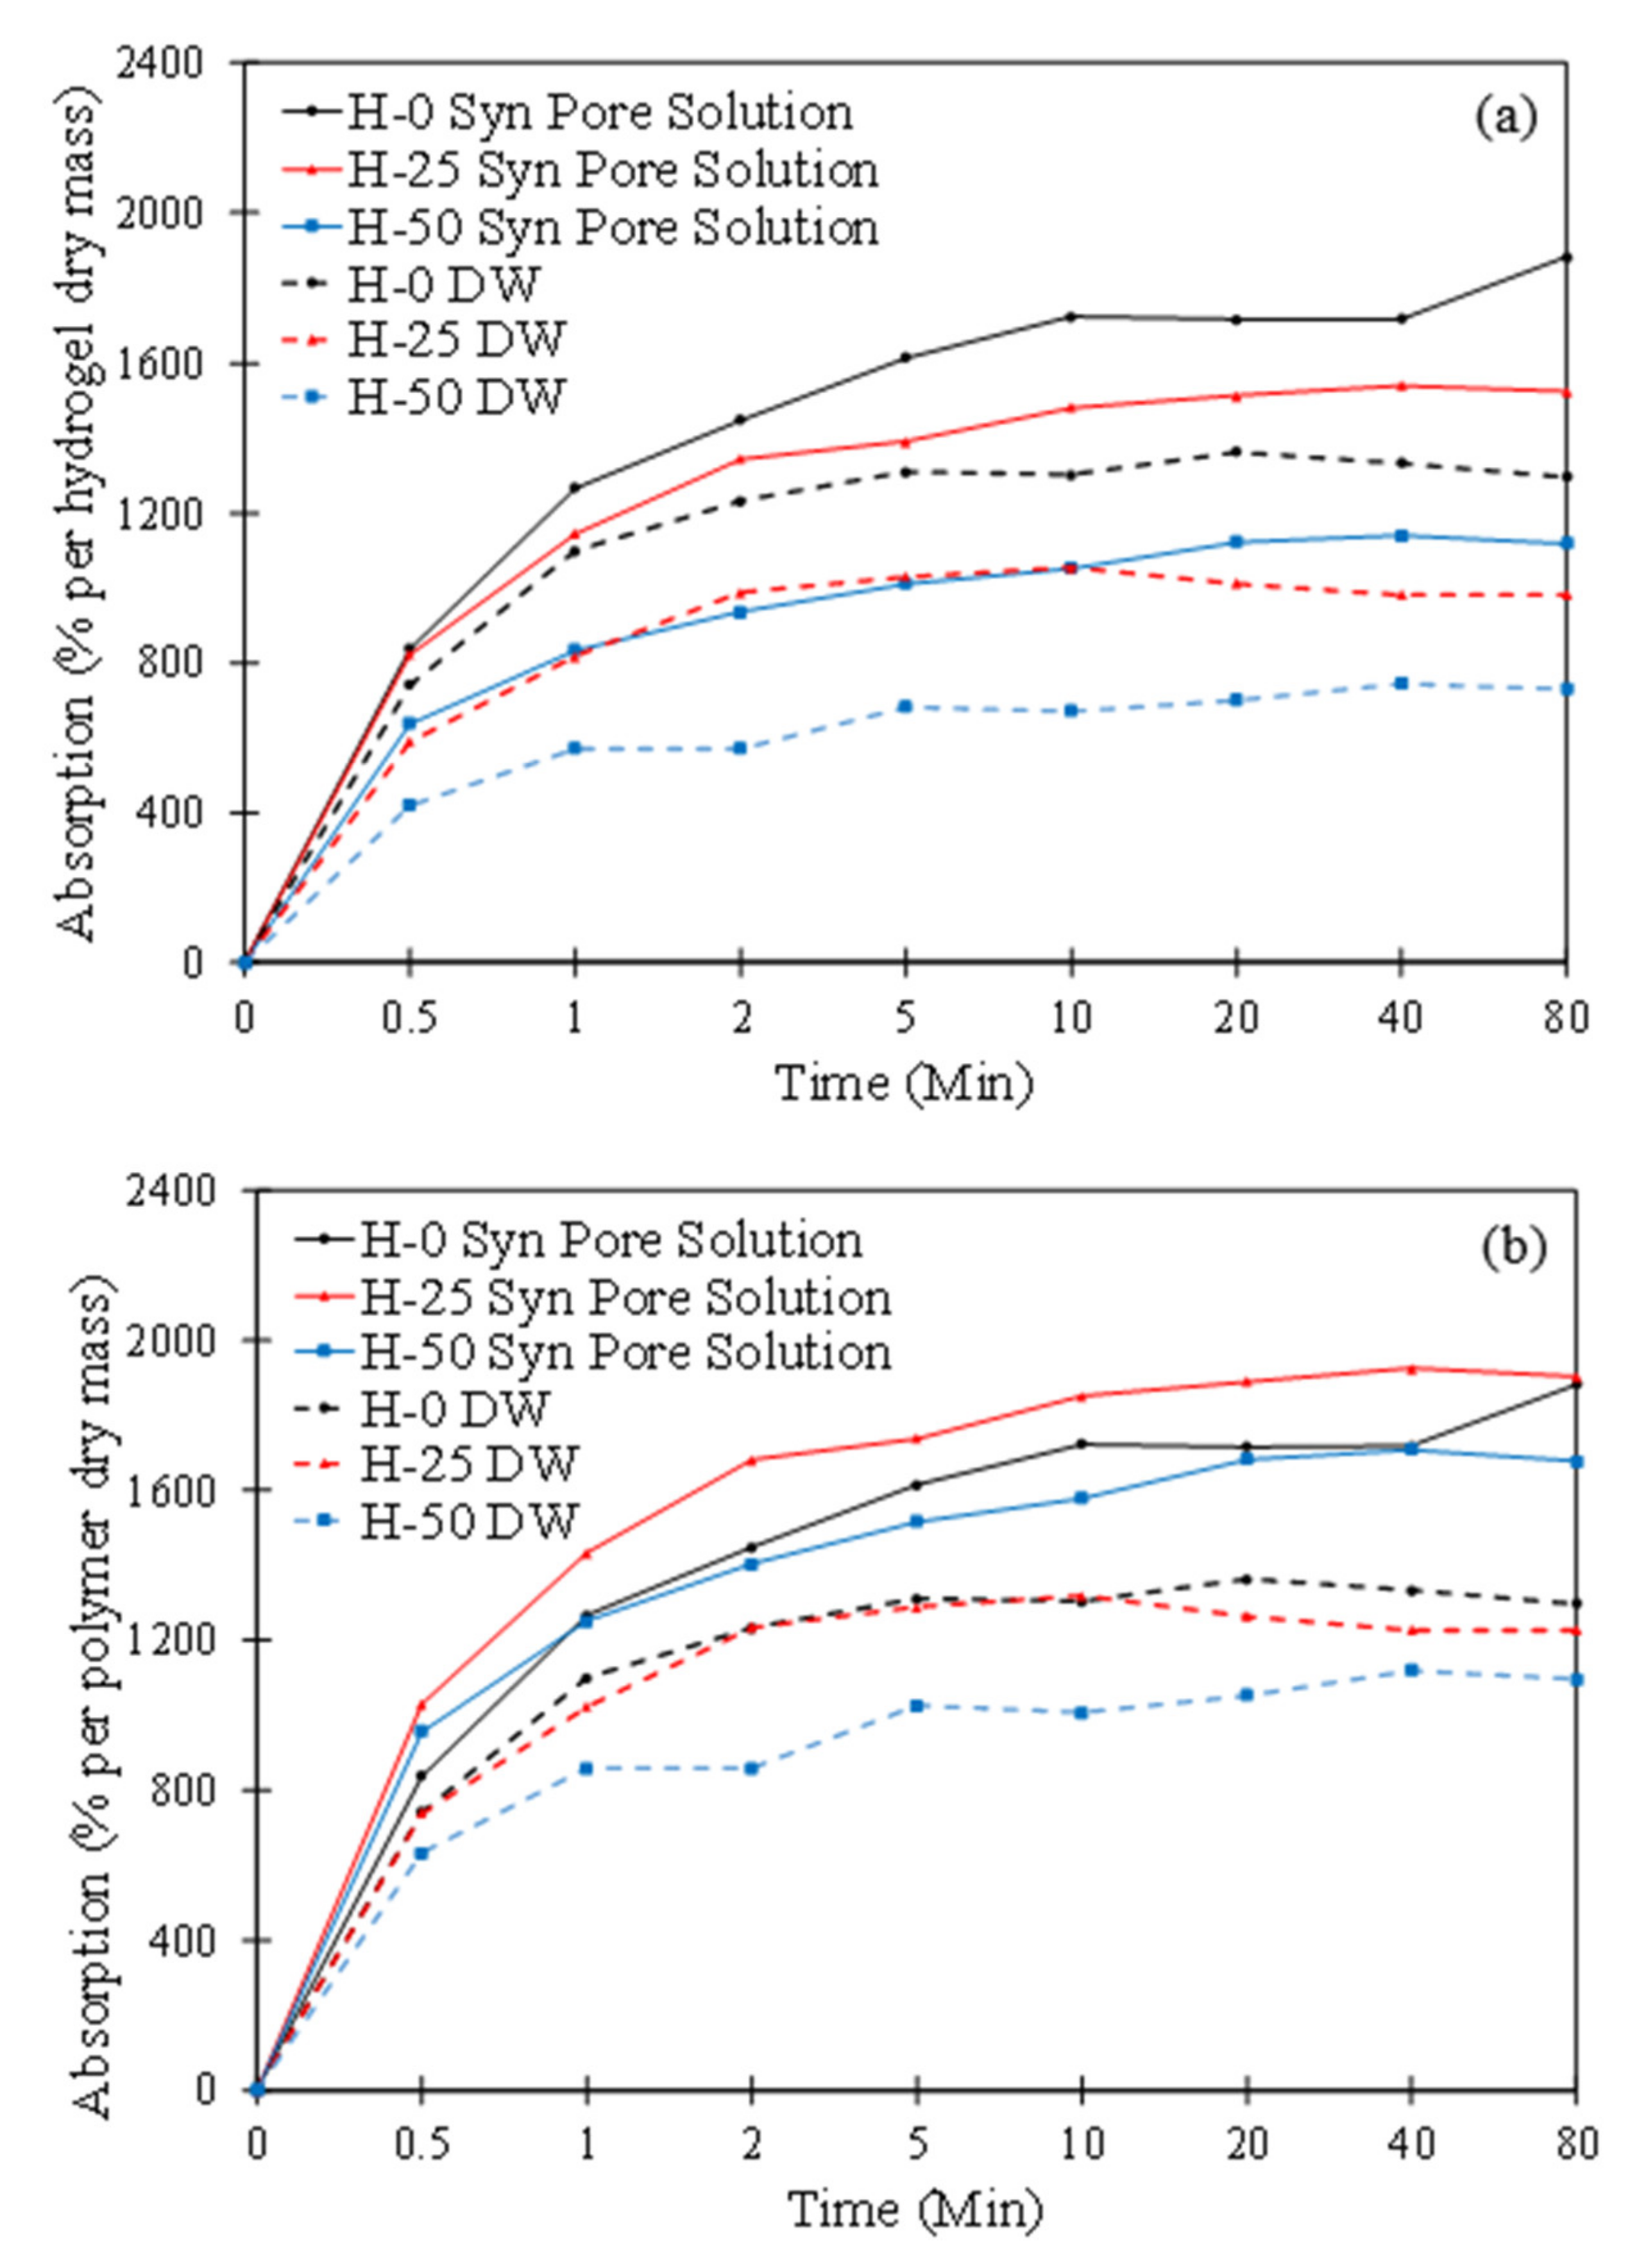
3.1. Absorption

The absorption calculated per dry mass of polymer and NSi and the dry mass of polymer only is shown in Figure 3a,b. It can be seen that the absorption of the hydrogels is higher in the synthetic pore solution than in DW. The increase in absorption in the synthetic pore solution could be attributed to the high pH of the synthetic pore solution, compared to distilled water. At high pH, the hydrolysis of amide groups to negatively charged carboxylate groups provides more repulsive forces in the hydrogel networks leading to increased swelling of the hydrogels [15]. It is interesting to note that the effect of cations including Na+, K+, and Ca2+ in the synthetic pore solution, which reduce absorption through the screening effect and complex formation [8,15,23], did not appear to overcome the absorption increase due to pH increase. It can be seen in Figure 1a that the hydrogels with NSi showed a lower absorption than the hydrogel without NSi. This is to be expected, as the NSi in the hydrogel does not absorb solution and a lesser amount of polymer that can absorb solution is present in the hydrogels. The absorption results shown in Figure 1a are in general agreement with the absorption trend determined using the flow test discussed previously. It is noted from Figure 1b that in distilled water, H-50, showed a lower absorption compared to other hydrogels. A possible reason for this behavior could be the electrostatic association of negatively charged NSi and partially positively charge amide groups in the hydrogel network constraining the swelling of the hydrogels [43]. In the synthetic pore solution, H-25 showed a slightly larger absorption than the other hydrogels in the early part of the absorption.

3.2. Compressive Strength

The compressive strength of the control cement paste, C, and the cement pastes containing hydrogels, C H-0, C H-10, and C H-50, is shown in Figure 4. It is seen that the cement paste with hydrogels exhibited a lower compressive strength compared to the control cement paste. This reduction was also observed in prior works and is attributed to the presence of macrovoids in the microstructure when hydrogels are introduced into the cement paste [8,9,16,17,50]. An increase in compressive strength with increased concentration of NSi in the hydrogels can be noted. The reason for this could be a lower absorption of hydrogels with increased concentration of NSi, as demonstrated in Figure 1a and the flow results, as discussed previously. The macrovoid size is directly related to the absorption of the hydrogels. Thus, the pastes with a higher hydrogel absorption experienced a higher reduction in compressive strength. There could be a possibility of the pozzolanic reaction between NSi in the hydrogel and Ca(OH)2 generating further hydration product within the hydrogels in the macrovoids. The possibility of the pozzolanic reaction was shown and discussed in a work by Krafcik et al. [43]. In addition, as discussed later in this paper, the formation of C-S-H as a result of pozzolanic reaction between hydrogels containing NSi and Ca(OH)2 was demonstrated. More investigations are required to quantitatively determine the amount of C-S-H within the macrovoids and its contribution to the compressive strength of the pastes.

3.3. Electrical Resistivity

The electrical resistivity of the pastes is shown in Figure 5. The electrical resistivity of cementitious materials depends on microstructure; thus, the electrical resistivity measurement provides a reliable and fast method to gain insight into the microstructure and transport property of cementitious materials. Electrical resistivity increased with age in all pastes, as more hydration product is generated with age and the microstructure becomes densified. It is noted that all pastes with hydrogels demonstrated a lower electrical resistivity than the control cement paste. This can be related to a higher overall w/c ratio in the pastes with hydrogels, compared to the control cement paste. Due to a large variability in the electrical resistivity of the cement pastes with hydrogels, especially at later stages, a definite pattern could not be observed. Since the overall w/c in the pastes with hydrogels is the same, the observed behavior is certainly related to the absorption/desorption response of the hydrogels and its effect on the macrovoid size and the capillary pore structure of the cement matrix.

3.4. Autogenous Shrinkage

The autogenous shrinkage of the control cement paste and pastes with different hydrogels is shown in Figure 6. It is seen that the pastes with hydrogels showed a decrease in autogenous shrinkage compared to the control cement paste. The effect of hydrogels on the reduction in autogenous shrinkage was different. Their effect followed, as C H-0 > C H-10 > C H-50. All pastes containing hydrogels showed an expansion after the setting time, and this expansion was the highest in C H-0, followed by C H-10 and C H-50. Such an expansion after setting, resulting from the addition of hydrogels in cementitious materials, has been previously documented in the prior investigations and was attributed to Ca(OH)2 crystallization pressure [8,27]. After the initial expansion, all pastes containing hydrogels demonstrated a gradual shrinkage and this shrinkage was more pronounced in C H-50 and C H-10 than C H-0. The autogenous shrinkage of C H-0 remained relatively unchanged after the initial expansion. The absorption and desorption behaviors of the hydrogels appeared to play key roles in the effect of hydrogels on the autogenous shrinkage of the cement pastes.

3.5. TGA

The Ca(OH)2 content of the control cement paste and the pastes with different hydrogels is demonstrated in Figure 7. It is seen that the Ca(OH)2 content of the paste with hydrogels was slightly higher than that of the control cement paste at 3 days, and this is due to increased hydration as a result of additional water provided by the hydrogels into the cement paste. However, at 28 days, the difference in the Ca(OH)2 content was not significant, as seen in Figure 7. It is also noted that the Ca(OH)2 content of the pastes did not seem to show an observable dependence on the concentration of NSi in the hydrogels. It could be stipulated that, in this study, the overall hydration of the pastes at the late age of 28 days was dependent on the overall w/c ratio and did not show sensitivity on the distribution of the water reservoirs in the paste.

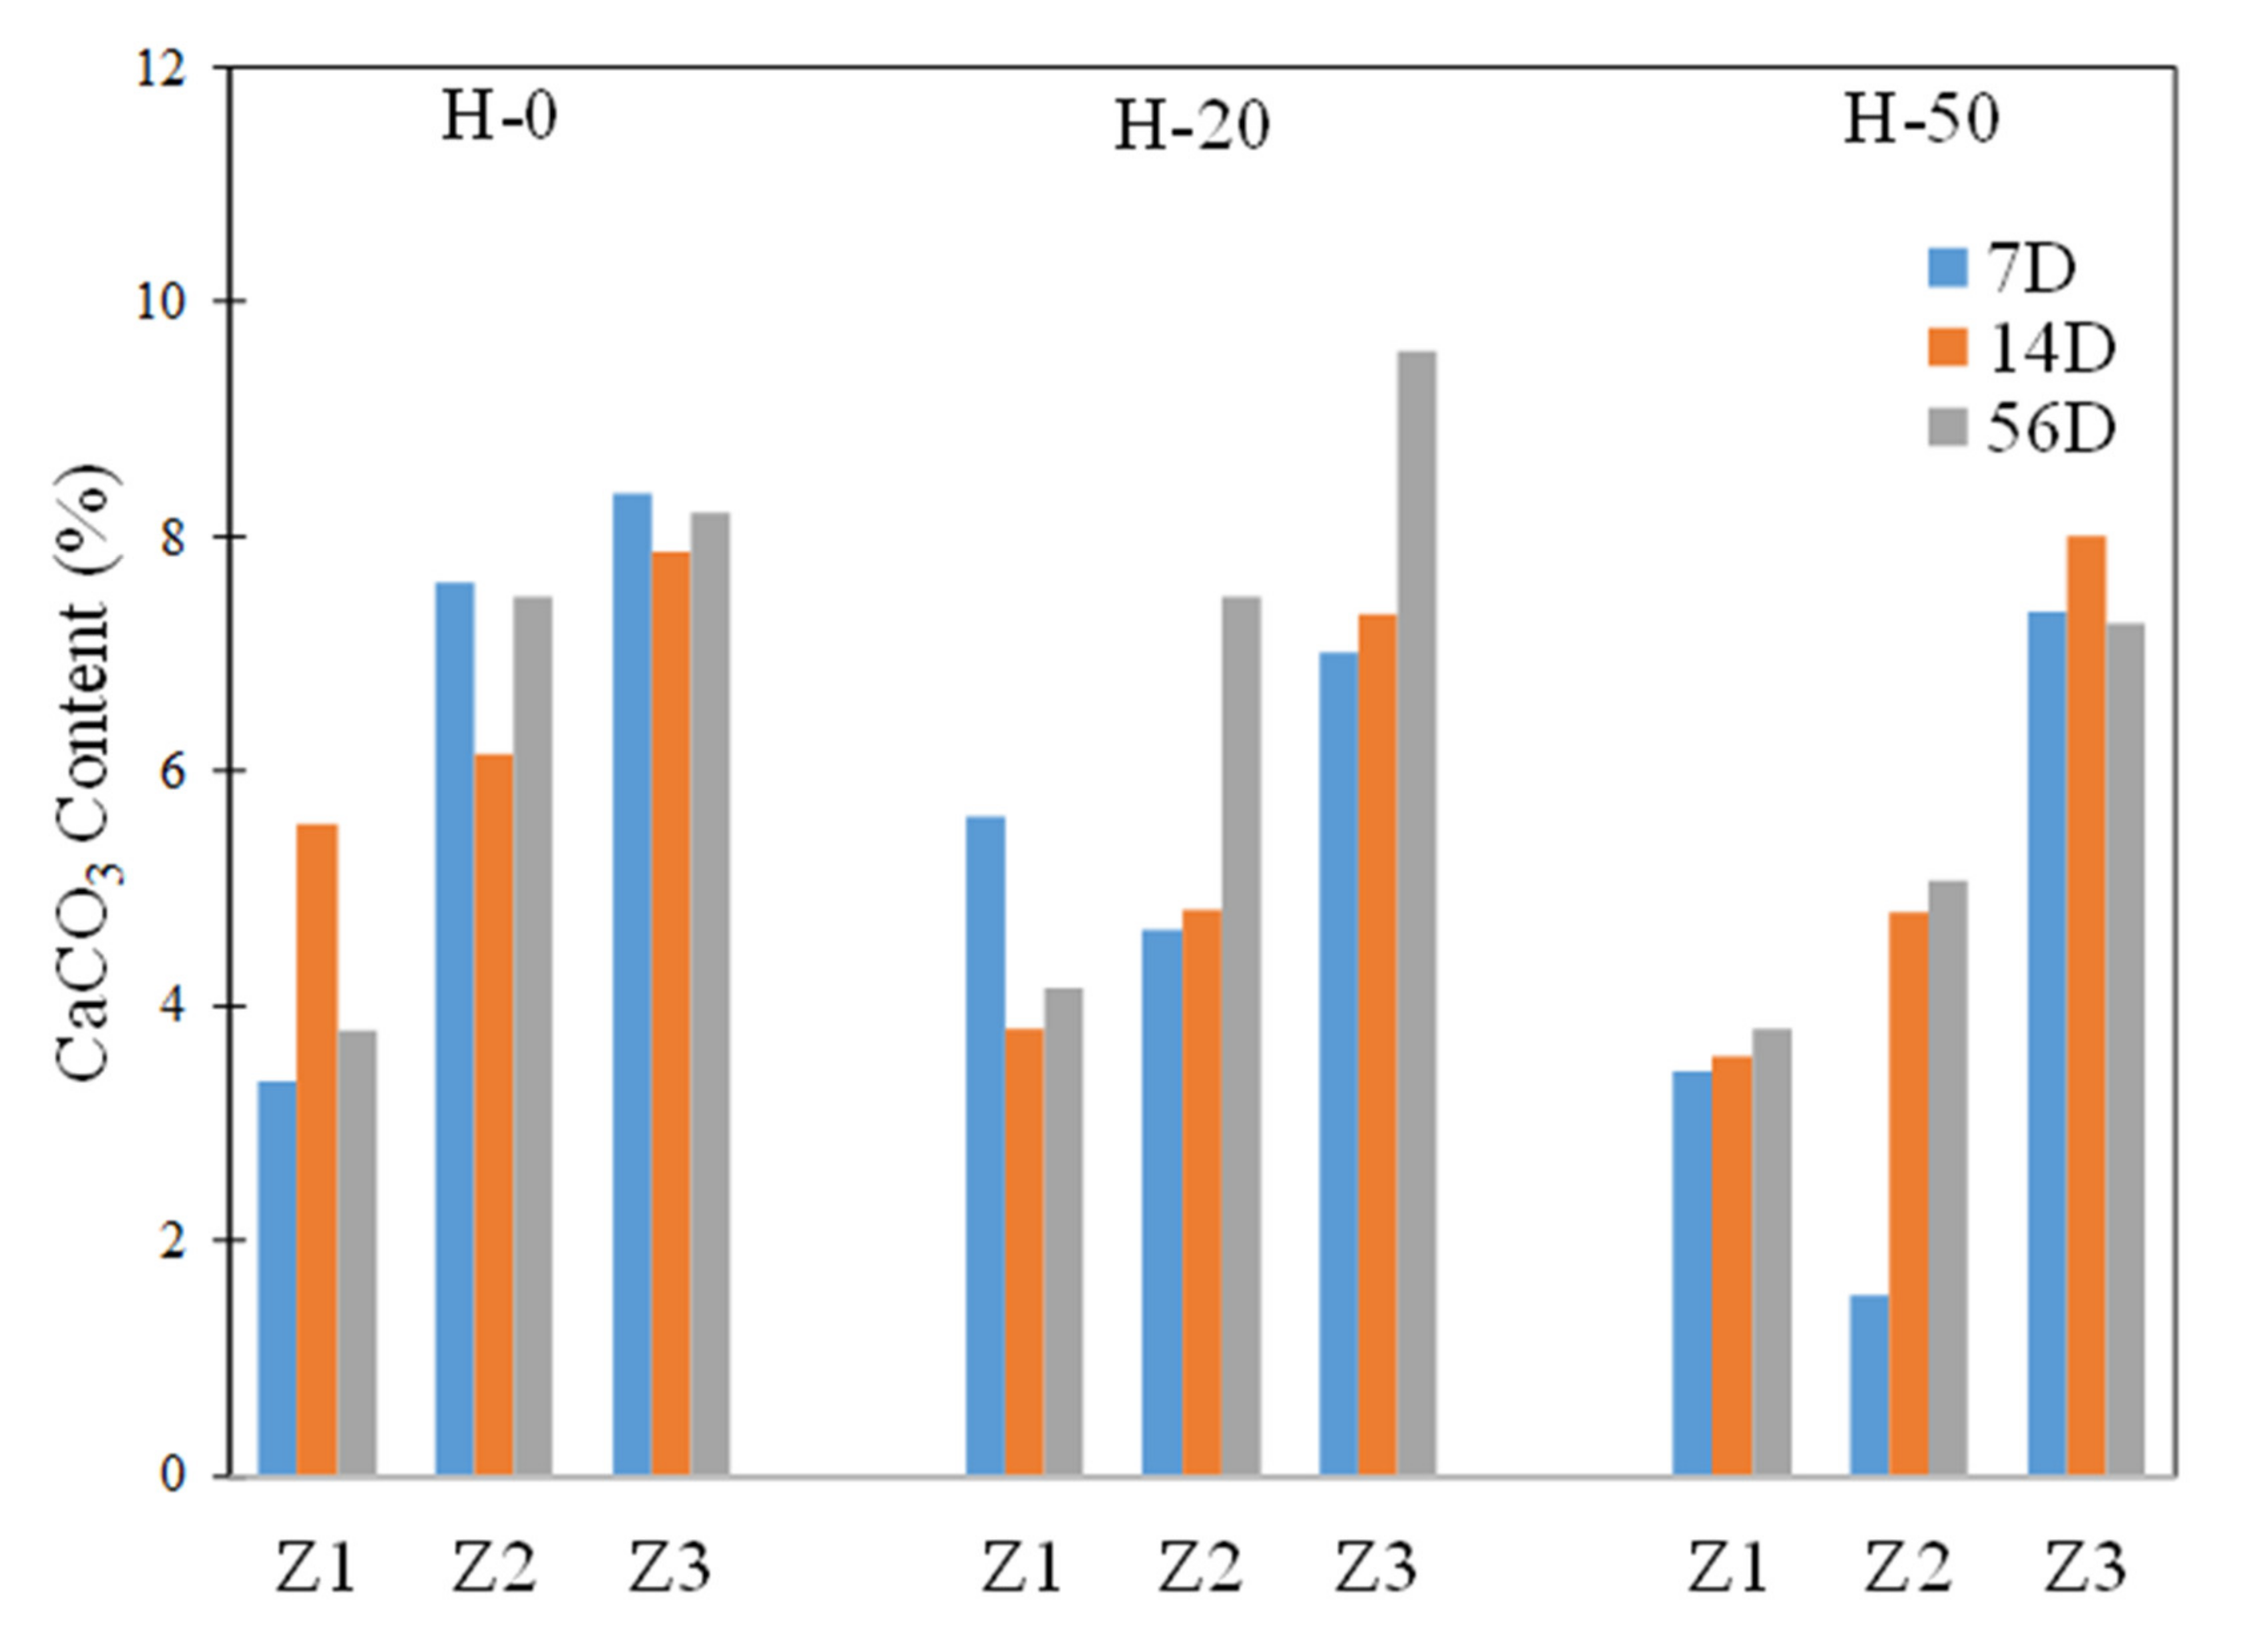
3.6. Interaction between Hydrogel Rod and Cement Paste

In this section, the interaction between the hydrogels and surrounding cement matrix was studied in detail. The effect of the hydrogels on the hydration product in the three zones, denoted as Z1, Z2, and Z3, and radially located from the hydrogels, was examined.
A schematic showing these different zones is given in Figure 2. Z3 corresponds to the immediate boundary of cement matrix in contact with the hydrogel. The Ca(OH)2 and CaCO3 contents obtained from TGA in these three zones are shown in Figure 8 and Figure 9. It is observed that the Ca(OH)2 content follows as Z1 > Z2 > Z3 for all hydrogels, indicating a decrease in Ca(OH)2 in the zone near the hydrogels. It is interesting to see a reversed trend for CaCO3 content; the CaCO3 content increases near the hydrogel compared to the zone away from the hydrogel. The increased formation of CaCO3 near the hydrogel is interesting, despite cement paste specimens being sealed to minimize exposure to air and carbonation. It is noted that the difference in Ca(OH)2 content between different zones is larger than the difference in CaCO3 between these zones. It is also noted that the Ca(OH)2 content in Z3 appeared to be lower in the case of H-0 than in H-10 and H-50. This could be related to the higher absorption of H-0 than H-10 and H-50. It is stipulated that the provision of water by the hydrogel and availability of CO2 and Ca2+, as a result of Ca(OH)2 dissolution, promotes the formation of CaCO3 in the zones adjacent to and near the hydrogel.
It should be noted that hydrogels uptake a large amount of Ca2+ during absorption early on that could affect the ionic composition in the regions near the hydrogel. Elemental analysis performed using energy dispersive spectroscopy (EDS) confirmed a large amount of Ca in the hydrogel (Figure 10). Such an uptake of Ca2+ could contribute to the different phase compositions observed in the three zones, as shown in Figure 8 and Figure 9. However, more detailed investigations are needed to study such an effect.

3.7. Pozzolanic Potential of Hydrogels
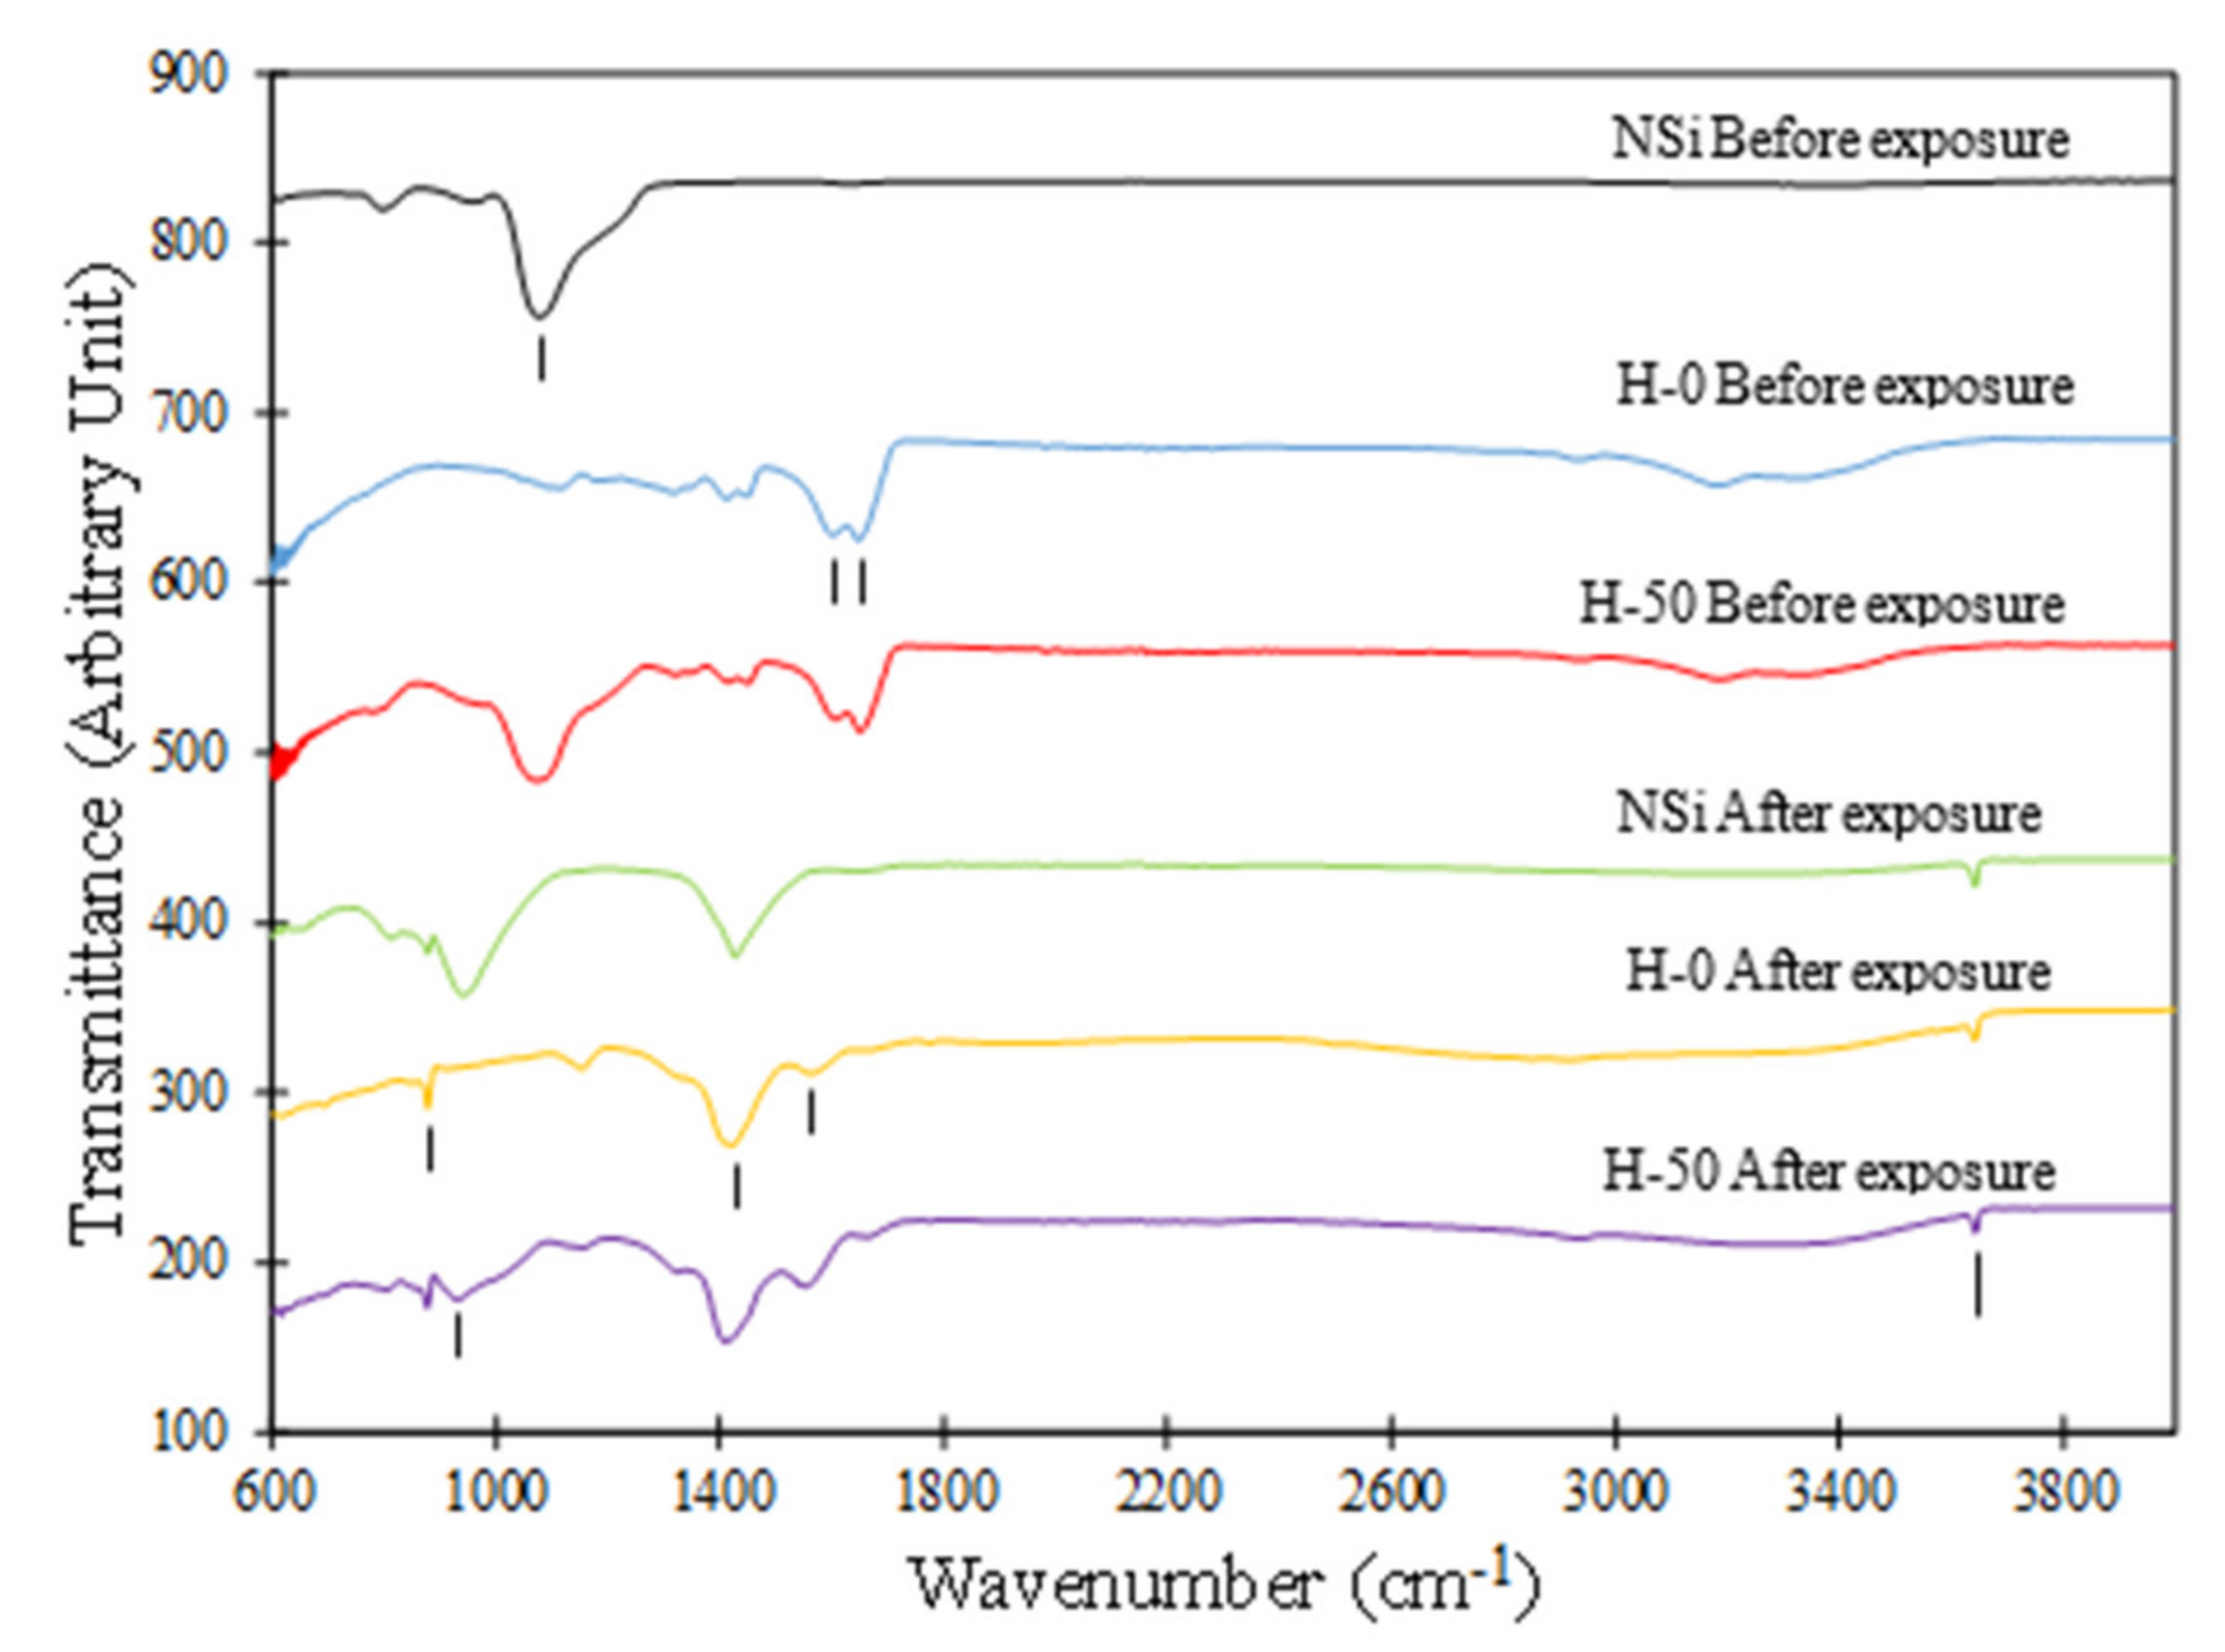
3.7.1. FTIR

The FTIR spectra of NSi, H-0 and H-50, before and after being exposed to the lime solution, is shown in Figure 11. FTIR was used to examine the chemical structure of the hydrogels after being exposed to the solution. The peaks at 874 cm−1 and 1420 cm−1 seen in the spectra of H-0 and H-50 after exposure to the solution are attributed to the out-of-plane bending of CO 3 2 [33,51] and the asymmetric stretching of CO 3 2 [52,53], which points to the formation of CaCO3 in H-0 and H-50 after exposure to the solution.
The peak around 3641 cm−1 can be seen in the spectra of H-0 and H-50 after being exposed to the solution. This peak is related to the hydroxyl (O-H) stretching group, indicative of the presence of Ca(OH)2 in the hydrogels [54,55,56]. It should be noted that the spectra of H-0 and H-50 before exposure to the solution did not show any peaks related to CaCO3 or Ca(OH)2. In addition, small peaks corresponding to CaCO3 and Ca(OH)2 are noted in the spectra of NSi after exposure, which are believed to be due to a small amount of these phases being adsorbed on to the surface of or entrapped in between NSi particles. The peaks at 1650 cm−1 and 1600 cm−1 in the spectra of H-0 and H-50 before exposure correspond to C=O stretching from acrylamide [15,33,57,58] and to the bending deformation of the primary amide group [59], respectively. The peak at 1560 cm−1 observed in the spectra of H-0 and H-50 after exposure can be attributed to the stretching of the carboxylate group [25,33,59,60]. As seen in Figure 11, the disappearance of the peaks corresponding to acrylamide in H-0 and H-50 before the exposure and appearance of the peaks attributed to the carboxylate groups in these hydrogels after exposure indicate the hydrolysis of the amide groups and the conversion of them to the carboxylate groups at high pH [59].
The FTIR spectra of NSi and H-50 before exposure showed a main peak at approximately 1084 cm−1, corresponding to the stretching vibration of Si-O bonds [54,55]. A shift in this peak to 945 and 936 cm−1 in the spectra of NSi and H-50, respectively, after exposure, is noticed and can be attributed to the Si-O stretching vibrations in C-S-H gel [54,61]. Thus, this provides some qualitative evidence for the pozzolanic potential of the hydrogels containing NSi when used in cementitious materials.

3.7.2. TGA

The TGA and derivative TG (DTG) curves of H-0 and H-50 before and after exposure to the lime solution are shown in Figure 12a,b. The TGA curves of H-0 and H-50 before exposure showed a significant reduction in mass between room temperature and 500 °C. Mass loss taking place in the range of 25–200 °C is mainly due to the water evaporation. Two minor peaks can be observed in the DTG curves of H-0 and H-50 before exposure. The mass loss in the range of 220–335 °C, is mainly attributed to the decomposition of the amide monomers in the hydrogels [62]. The second mass loss, which was larger than the first mass loss, occurred in the temperature range of 350–460 °C. This mass loss is attributed to the breakage of the polymer backbone and the imides formed in the first decomposition [62]. It is seen that the mass loss in this temperature range is larger in H-0 than H-50; this is because H-50 is comprised of 66.7% by mass polymer and 33.3% by mass NSi, while H-0 consists of 100% polymer.
The TGA curves of the hydrogels after exposure showed distinct differences from those of the hydrogels before exposure. The DTG curve in H-0 after exposure showed a double peak in the temperature range of 335–530 °C, and that of H-50 showed a peak in the temperature range of 400–530 °C. This peak can have contributions from the decomposition of the hydrogel or calcium–hydrogel complexes, as well as Ca(OH)2. The Ca(OH)2 decomposition takes place in the temperature range of 350–460 °C [63]. The presence of calcium hydroxide in the hydrogels after exposure to the lime solution was supported by the FTIR results, as discussed previously. The overlapping decomposition temperature ranges of calcium hydroxide and hydrogel makes it difficult to accurately quantify the composition of these compounds in the hydrogels. It is interesting to note the presence of a peak in the temperature range of 650–900 °C in the DTG curves of the hydrogels after exposure to the lime solution. This peak was absent in the case of the hydrogels before exposure. This peak is attributed to the decomposition of carbonates, primarily consisting of calcium carbonate. A portion of the observed CaCO3 can be an intermediate product of heating the hydrogel samples in the TGA test. The formation of carbonate compounds as an intermediate product in the TGA test of acrylate-based polymer salts has been reported in the literature [64]. It should be noted that, in the high pH solution in which the hydrogels were exposed, the amide groups are converted to the negatively charged carboxylate groups, which leads to the formation of calcium complexes [59]. It was shown from the FTIR results that CaCO3 was present in the hydrogel after exposure to the lime solution. A distinction between the amount of calcium carbonate as a by-product of the TGA test and calcium carbonate present before the TGA test cannot be made in this study. However, since the samples were kept in a sealed condition, it is likely that the majority of the calcium carbonate decomposition shown in the TGA curves is attributed to the by-product of the TGA test.
It is interesting to note the difference in remaining mass of H-0 and H-50 before and after exposure to lime solution, which is estimated to be about 20%. The difference in the remaining mass before exposure is due to the higher concentration of the polymer in H-0 compared to H-50, which decomposes during the TGA test; however, this difference diminished after exposure to the lime solution, which indicates the higher absorption of Ca2+ and formation of Ca-rich compounds in H-0 compared to H-50.

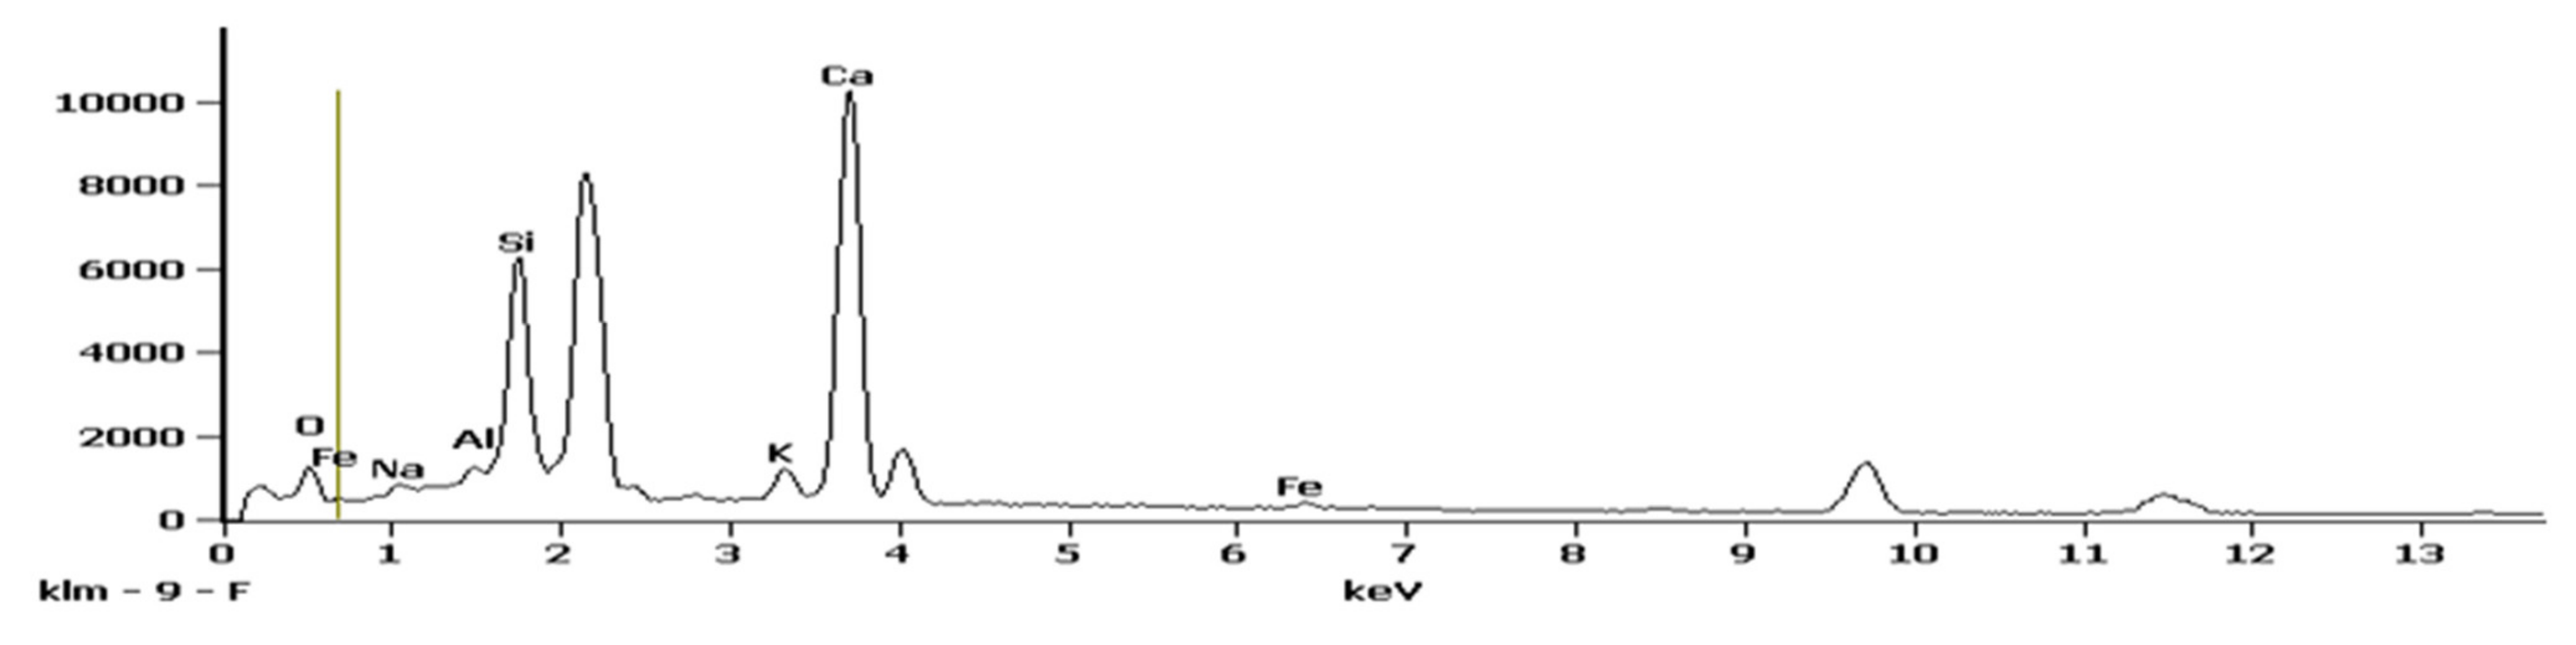
3.7.3. SEM Examination

The SEM images of NSi, H-0, and H-50 after exposure to the lime solution are shown in Figure 13. It is seen in Figure 13a that NSi exhibited an agglomeration of globular-shape gel-like structures, with a size in the range of 500 nm, which resembles C-S-H, as demonstrated in previous studies, but with smaller sizes [65]. This is in agreement with the FTIR result that indicated the presence of C-S-H in NSi after exposure to the lime solution. It should be noted that C-S-H can take on different morphologies depending on the synthesis method or reaction time [66]. The morphology of H-0 presented a highly heterogeneous structure as seen in Figure 13b. A region consisting of an aggregation of hexagonal plate-like crystals attributed to Ca(OH)2 is evident in the microstructure of H-0 (Figure 13c). The planar size of the plate-like crystals is in the range of a few tens of micrometers. A continuous region without any distinct features, at least at the imaging resolution captured in this study, is seen, which could be the polymeric portion of the hydrogel. This region is marked with X in Figure 13b. In addition, there are sporadic rhombohedral calcite crystals, as seen in Figure 13d. Figure 13e,f shows the microstructure of H-50 at different magnifications after exposure to the lime solution. Large flake-like features are seen in the microstructure of H-50, which could be related to the polymeric portion of the hydrogel or a polymer-NSi compound. Of particular interest in the microstructure of H-50, are globular-shape gel-like features that showed resemblance to the C-S-H in NSi, as shown in Figure 13a. Overall, the SEM observations seemed to be in relative agreement with the results obtained from FTIR.

4. Conclusions

The absorption characteristics of hydrogels containing NSi in cementitious materials and their influence on the autogenous shrinkage, compressive strength, and electrical resistivity of cement pastes were investigated. The interaction between the hydrogels and surrounding cementitious matrix was also studied. It was shown that the hydrogels with NSi demonstrated a lower absorption in distilled water and synthetic pore solution than hydrogels without NSi. A general reduction in compressive strength in the pastes with hydrogels was noticed and this reduction was decreased with an increased concentration of NSi in the hydrogels. This is primarily due to the presence of smaller macrovoids associated with a lower absorption of the hydrogels as NSi concentration in the hydrogels was increased. All pastes with hydrogels showed a lower electrical resistivity compared to the control cement paste. It was demonstrated that the addition of hydrogels decreased the autogenous shrinkage of the cement paste and the reduction in autogenous shrinkage decreased with increased concentration of NSi in the hydrogels. A change in the phase composition of the cement paste surrounding the hydrogels was noted. A decrease in Ca(OH)2 and an increase in CaCO3 in the zones close to the hydrogels, compared to the zones away from the hydrogels, were evident. The effect of the lime solution with increased pH on the hydrogels was examined using FTIR, TGA, and SEM. The results indicated the formation of Ca(OH)2 and CaCO3 within the hydrogels; more importantly, the formation of C-S-H in the hydrogels with NSi was evidenced, which provided support for the pozzolanic potential of the hydrogels with NSi. However, quantitative analyses are required to determine the extent of such pozzolanic reactivity.

Author Contributions

K.F., A.G. and B.V. conceived of and designed the experiments. B.V. performed the experiments. A.G. and B.V. analyzed the data. A.G. wrote the paper. All authors have read and agreed to the published version of the manuscript.

Funding

This study was supported by the National Science Foundation under CAREER award number 1846984.

Conflicts of Interest

The authors declare no conflict of interest.

References

  1. Weber, S.; Reinhardt, H.W. A New Generation of High Performance Concrete: Concrete with Autogenous Curing. Adv. Cem. Based Mater. 1997, 6, 59–68. [Google Scholar] [CrossRef]
  2. Walraven, J. High Performance Concrete: A Material with a Large Potential. J. Adv. Concr. Technol. 2009, 7, 145–156. [Google Scholar] [CrossRef] [Green Version]
  3. Lura, P.; Jensen, O.M.; van Breugel, K. Autogenous shrinkage in high-performance cement paste: An evaluation of basic mechanisms. Cem. Concr. Res. 2003, 33, 223–232. [Google Scholar] [CrossRef]
  4. Jensen, O.M.; Hansen, P.F. Water-entrained cement-based materials I. Principles and theoretical background. Cem. Concr. Res. 2001, 31, 647–654. [Google Scholar] [CrossRef]
  5. Wang, K.; Jansen, D.C.; Shah, S.P.; Karr, A.F. Permeability study of cracked concrete. Cem. Concr. Res. 1997, 27, 381–393. [Google Scholar] [CrossRef] [Green Version]
  6. Jensen, O.M.; Lura, P. Techniques and materials for internal water curing of concrete. Mater. Struct. Constr. 2006, 39, 817–825. [Google Scholar] [CrossRef]
  7. Beushausen, H.; Gillmer, M.; Alexander, M. The influence of superabsorbent polymers on strength and durability properties of blended cement mortars. Cem. Concr. Compos. 2014, 52, 73–80. [Google Scholar] [CrossRef]
  8. Schröfl, C.; Mechtcherine, V.; Gorges, M. Relation between the molecular structure and the efficiency of superabsorbent polymers (SAP) as concrete admixture to mitigate autogenous shrinkage. Cem. Concr. Res. 2012, 42, 865–873. [Google Scholar] [CrossRef]
  9. Snoeck, D.; Schaubroeck, D.; Dubruel, P.; De Belie, N. Effect of high amounts of superabsorbent polymers and additional water on the workability, microstructure and strength of mortars with a water-to-cement ratio of 0.50. Constr. Build. Mater. 2014, 72, 148–157. [Google Scholar] [CrossRef]
  10. Mignon, A.; Snoeck, D.; Dubruel, P.; Van Vlierberghe, S.; De Belie, N. Crack mitigation in concrete: Superabsorbent polymers as key to success? Materials 2017, 10, 237. [Google Scholar] [CrossRef] [Green Version]
  11. Shen, D.; Jiang, J.; Zhang, M.; Yao, P.; Jiang, G. Tensile creep and cracking potential of high performance concrete internally cured with super absorbent polymers at early age. Constr. Build. Mater. 2018, 165, 451–461. [Google Scholar] [CrossRef]
  12. Liu, J.; Shi, C.; Ma, X.; Khayat, K.H.; Zhang, J.; Wang, D. An overview on the effect of internal curing on shrinkage of high performance cement-based materials. Constr. Build. Mater. 2017, 146, 702–712. [Google Scholar] [CrossRef] [Green Version]
  13. Reinhardt, H.; Assmann, A.; Mönnig, S. Superabsorbent polymers (SAPs)—An admixture to increase the durability of concrete. In International Conference on Microstructure Related Durability of Cementitious Composites; Sun, W., van Breugel, K., Miao, C., Ye, G., Eds.; RILEM Publications: Paris, France, 2008; pp. 313–322. ISBN 978-2-35158-084-4. [Google Scholar]
  14. Snoeck, D.; Steuperaert, S.; Van Tittelboom, K.; Dubruel, P.; De Belie, N. Visualization of water penetration in cementitious materials with superabsorbent polymers by means of neutron radiography. Cem. Concr. Res. 2012, 42, 1113–1121. [Google Scholar] [CrossRef]
  15. Mignon, A.; Graulus, G.J.; Snoeck, D.; Martins, J.; De Belie, N.; Dubruel, P.; Van Vlierberghe, S. pH-sensitive superabsorbent polymers: A potential candidate material for self-healing concrete. J. Mater. Sci. 2015, 50, 970–979. [Google Scholar] [CrossRef]
  16. Pourjavadi, A.; Fakoorpoor, S.M.; Hosseini, P.; Khaloo, A. Interactions between superabsorbent polymers and cement-based composites incorporating colloidal silica nanoparticles. Cem. Concr. Compos. 2013, 37, 196–204. [Google Scholar] [CrossRef]
  17. Farzanian, K.; Pimenta Teixeira, K.; Perdiago Rocha, I.; De Sa Carneiro, L.; Ghahremaninezhad, A. The mechanical strength, degree of hydration, and electrical resistivity of cement pastes modified with superabsorbent polymers. Constr. Build. Mater. 2016, 109, 156–165. [Google Scholar] [CrossRef]
  18. Mechtcherine, V.; Gorges, M.; Schroefl, C.; Assmann, A. Effect of internal curing by using superabsorbent polymers ( SAP ) on autogenous shrinkage and other properties of a high-performance fine-grained concrete: Results of a RILEM round-robin test. Mater. Struct. 2014, 47, 541–562. [Google Scholar] [CrossRef]
  19. Mechtcherine, V.; Secrieru, E.; Schröfl, C. Effect of superabsorbent polymers (SAPs) on rheological properties of fresh cement-based mortars—Development of yield stress and plastic viscosity over time. Cem. Concr. Res. 2015, 67, 52–65. [Google Scholar] [CrossRef]
  20. Jensen, O.M.; Hansen, P.F. Water-entrained cement-based materials II. Experimental observations. Cem. Concr. Res. 2002, 32, 973–978. [Google Scholar] [CrossRef]
  21. Mechtcherine, V.; Reinhardt, H.-W. Application of Super Absorbent Polymers (SAP) in Concrete Construction: State-of-the-Art Report Prepared by Technical Committee 225-SAP; Springer Science & Business Media: Berlin, Germany, 2012; Volume 2, ISBN 9400727321. [Google Scholar]
  22. Esteves, L.P. Superabsorbent polymers: On their interaction with water and pore fluid. Cem. Concr. Compos. 2011, 33, 717–724. [Google Scholar] [CrossRef]
  23. Zhu, Q.; Barney, C.W.; Erk, K.A. Effect of ionic crosslinking on the swelling and mechanical response of model superabsorbent polymer hydrogels for internally cured concrete. Mater. Struct. 2015, 48, 2261–2276. [Google Scholar] [CrossRef]
  24. Farzanian, K.; Ghahremaninezhad, A. On the effect of chemical composition on the desorption of superabsorbent hydrogels in contact with a porous cementitious material. Gels 2018, 4, 70. [Google Scholar] [CrossRef] [Green Version]
  25. Vafaei, B.; Farzanian, K.; Ghahremaninezhad, A. The influence of superabsorbent polymer on the properties of alkali-activated slag pastes. Constr. Build. Mater. 2020, 236, 117525. [Google Scholar] [CrossRef]
  26. Farzanian, K.; Ghahremaninezhad, A. Desorption of superabsorbent hydrogels with varied chemical compositions in cementitious materials. Mater. Struct. 2018, 51, 3. [Google Scholar] [CrossRef]
  27. Snoeck, D.; Jensen, O.M.; De Belie, N. The influence of superabsorbent polymers on the autogenous shrinkage properties of cement pastes with supplementary cementitious materials. Cem. Concr. Res. 2015, 74, 59–67. [Google Scholar] [CrossRef]
  28. Hou, P.K.; Kawashima, S.; Wang, K.J.; Corr, D.J.; Qian, J.S.; Shah, S.P. Effects of colloidal nanosilica on rheological and mechanical properties of fly ash-cement mortar. Cem. Concr. Compos. 2013, 35, 12–22. [Google Scholar] [CrossRef] [Green Version]
  29. Mazloom, M.; Ramezanianpour, A.A.; Brooks, J.J. Effect of silica fume on mechanical properties of high-strength concrete. Cem. Concr. Compos. 2004, 26, 347–357. [Google Scholar] [CrossRef]
  30. Baloch, H.; Usman, M.; Rizwan, S.A.; Hanif, A. Properties enhancement of super absorbent polymer (SAP) incorporated self-compacting cement pastes modified by nano silica (NS) addition. Constr. Build. Mater. 2019, 203, 18–26. [Google Scholar] [CrossRef]
  31. Sikora, K.S.; Klemm, A.J. Effect of Superabsorbent Polymers on Workability and Hydration Process in Fly Ash Cementitious Composites. J. Mater. Civ. Eng. 2015, 27, 04014170. [Google Scholar] [CrossRef]
  32. Almeida, F.C.R.; Klemm, A.J. Efficiency of internal curing by superabsorbent polymers (SAP) in PC-GGBS mortars. Cem. Concr. Compos. 2018, 88, 41–51. [Google Scholar] [CrossRef]
  33. Farzanian, K.; Vafaei, B.; Ghahremaninezhad, A. The behavior of superabsorbent polymers (SAPs) in cement mixtures with glass powders as supplementary cementitious materials. Materials 2019, 12, 3597. [Google Scholar] [CrossRef] [PubMed] [Green Version]
  34. Yu, R.; Spiesz, P.; Brouwers, H.J.H. Effect of nano-silica on the hydration and microstructure development of Ultra-High Performance Concrete (UHPC) with a low binder amount. Constr. Build. Mater. 2014, 65, 140–150. [Google Scholar] [CrossRef] [Green Version]
  35. Björnström, J.; Martinelli, A.; Matic, A.; Börjesson, L.; Panas, I. Accelerating effects of colloidal nano-silica for beneficial calcium-silicate-hydrate formation in cement. Chem. Phys. Lett. 2004, 392, 242–248. [Google Scholar] [CrossRef]
  36. Van, V.T.A.; Rößler, C.; Bui, D.D.; Ludwig, H.M. Rice husk ash as both pozzolanic admixture and internal curing agent in ultra-high performance concrete. Cem. Concr. Compos. 2014, 53, 270–278. [Google Scholar] [CrossRef]
  37. Nie, S.; Hu, S.; Wang, F.; Hu, C.; Li, X.; Zhu, Y. Pozzolanic reaction of lightweight fine aggregate and its influence on the hydration of cement. Constr. Build. Mater. 2017, 153, 165–173. [Google Scholar] [CrossRef]
  38. Cândido, J.D.S.; Pereira, A.G.B.; Fajardo, A.R.; Ricardo, N.M.P.S.; Feitosa, J.P.A.; Muniz, E.C.; Rodrigues, F.H.A. Poly(acrylamide-co-acrylate)/rice husk ash hydrogel composites. II. Temperature effect on rice husk ash obtention. Compos. Part B Eng. 2013, 51, 246–253. [Google Scholar] [CrossRef]
  39. Adewunmi, A.A.; Ismail, S.; Owolabi, T.O.; Sultan, A.S.; Olatunji, S.O.; Ahmad, Z. Modeling the thermal behavior of coal fly ash based polymer gel system for water reduction in oil and gas wells. J. Pet. Sci. Eng. 2017, 157, 430–440. [Google Scholar] [CrossRef]
  40. Cheraghian, G.; Wu, Q.; Mosto, M.; Li, M.; Afrand, M.; Sangwai, J.S. Effect of a novel clay / silica nanocomposite on water-based drilling fl uids: Improvements in rheological and fi ltration properties. Colloids Surf. A J. 2018, 555, 339–350. [Google Scholar] [CrossRef]
  41. Cheraghian, G. Application of nano-fumed silica in heavy oil recovery. Pet. Sci. Technol. 2016, 34, 12–18. [Google Scholar] [CrossRef]
  42. Cheraghian, G. Evaluation of Clay and Fumed Silica Nanoparticles on Adsorption of Surfactant Polymer during Enhanced Oil Recovery. J. Japan Pet. Inst. 2017, 60, 85–94. [Google Scholar] [CrossRef] [Green Version]
  43. Krafcik, M.J.; Bose, B.; Erk, K.A. Synthesis and Characterization of Polymer-Silica Composite Hydrogel Particles and Influence of Hydrogel Composition on Cement Paste Microstructure. Adv. Civ. Eng. Mater. 2018, 7, 590–613. [Google Scholar] [CrossRef]
  44. Farzanian, K.; Ghahremaninezhad, A. On the effect of the capillary forces on the desorption of hydrogels in contact with a porous cementitious material. Mater. Struct. Constr. 2017, 50, 216. [Google Scholar] [CrossRef]
  45. Tunstall, L.E.; Scherer, G.W.; Prud’homme, R.K. Studying AEA interaction in cement systems using tensiometry. Cem. Concr. Res. 2017, 92, 29–36. [Google Scholar] [CrossRef]
  46. Cabinets, M.; Rooms, M.; Statements, B.; Mass, D. Standard Test Method for Compressive Strength of Hydraulic Cement Mortars (Using 2-in or [50 mm] Cube Specimens); ASTM International: West Conshohocken, PA, USA, 2020; Volume 4, pp. 1–12. [Google Scholar]
  47. Neithalath, N.; Weiss, J.; Olek, J. Predicting the Permeability of Pervious Concrete (Enhanced Porosity Concrete) from Non-Destructive Electrical Measurements; United States Purdue University: West Lafayette, IN, USA, 2006. [Google Scholar]
  48. Snyder, K.A.; Ferraris, C.; Martys, N.S.; Garboczi, E.J. Using impedance spectroscopy to assess the viability of the rapid chloride test for determining concrete conductivity. J. Res. Natl. Inst. Stand. Technol. 2000, 105, 497. [Google Scholar] [CrossRef]
  49. Mass, D.; Cements, W.; Ag, C.; Mortar, H.; Test, C.C. Standard Test Method for Autogenous Strain of Cement Paste and Mortar; ASTM International: West Conshohocken, PA, USA, 2020; pp. 1–8. [Google Scholar]
  50. Wehbe, Y.; Ghahremaninezhad, A. Combined effect of shrinkage reducing admixtures (SRA) and superabsorbent polymers (SAP) on the autogenous shrinkage and properties of cementitious materials. Constr. Build. Mater. 2017, 138, 151–162. [Google Scholar] [CrossRef]
  51. Xia, M.; Yao, Z.; Ge, L.; Chen, T.; Li, H. A potential bio-filler: The substitution effect of furfural modified clam shell for carbonate calcium in polypropylene. J. Compos. Mater. 2015, 49, 807–816. [Google Scholar] [CrossRef]
  52. Fernández-Carrasco, L.; Torrens-Martín, D.; Morales, L.M.; Martínez-Ramírez, S. Infrared spectroscopy in the analysis of building and construction materials. In Infrared Spectroscopy—Materials Science, Engineering and Technology; InTech: Rijeka, Croatia, 2012; pp. 369–382. [Google Scholar]
  53. Chu, D.H.; Vinoba, M.; Bhagiyalakshmi, M.; Baek, I.H.; Nam, S.C.; Yoon, Y.; Kim, S.H.; Jeong, S.K. CO2 mineralization into different polymorphs of CaCO3 using an aqueous-CO2 system. RSC Adv. 2013, 3, 21722–21729. [Google Scholar] [CrossRef]
  54. Yu, P.; Kirkpatrick, R.J.; Poe, B.; McMillan, P.F.; Cong, X. Structure of calcium silicate hydrate (C-S-H): Near-, Mid-, and Far-infrared spectroscopy. J. Am. Ceram. Soc. 1999, 82, 742–748. [Google Scholar] [CrossRef]
  55. Huang, H.; Ye, G.; Damidot, D. Characterization and quantification of self-healing behaviors of microcracks due to further hydration in cement paste. Cem. Concr. Res. 2013, 52, 71–81. [Google Scholar] [CrossRef]
  56. Delgado, A.H.; Paroli, R.M.; Beaudoin, J.J. Comparison of IR techniques for the characterization of construction cement minerals and hydrated products. Appl. Spectrosc. 1996, 50, 970–976. [Google Scholar] [CrossRef]
  57. Chavda, H.V.; Patel, R.D.; Modhia, I.P.; Patel, C.N. Preparation and characterization of superporous hydrogel based on different polymers. Int. J. Pharm. Investig. 2012, 2, 134. [Google Scholar] [CrossRef] [PubMed] [Green Version]
  58. Magalhães, A.S.G.; Neto, M.P.A. Application of Ftir in the Determination of Acrylate Content in Poly(Sodium Acrylate-Co-Acrylamide) Superabsorbent Hydrogels. Quim. Nov. 2012, 35, 1464–1467. [Google Scholar] [CrossRef]
  59. Mignon, A.; Snoeck, D.; Schaubroeck, D.; Luickx, N.; Dubruel, P.; Van Vlierberghe, S.; De Belie, N. pH-responsive superabsorbent polymers: A pathway to self-healing of mortar. React. Funct. Polym. 2015, 93, 68–76. [Google Scholar] [CrossRef]
  60. Mahdavinia, G.R.; Pourjavadi, A.; Hosseinzadeh, H.; Zohuriaan, M.J. Modified chitosan 4. Superabsorbent hydrogels from poly (acrylic acid-co-acrylamide) grafted chitosan with salt-and pH-responsiveness properties. Eur. Polym. J. 2004, 40, 1399–1407. [Google Scholar] [CrossRef]
  61. Ghosh, S.N.; Handoo, S.K. Infrared and Raman spectral studies in cement and concrete. Cem. Concr. Res. 1980, 10, 771–782. [Google Scholar] [CrossRef]
  62. Leung, W.M.; Axelson, D.E.; Van Dyke, J.D. Thermal degradation of polyacrylamide and poly(acrylamide-co-acrylate). J. Polym. Sci. Part A Polym. Chem. 1987, 25, 1825–1846. [Google Scholar] [CrossRef]
  63. Vance, K.; Falzone, G.; Pignatelli, I.; Bauchy, M.; Balonis, M.; Sant, G. Direct Carbonation of Ca(OH)2 Using Liquid and Supercritical CO2: Implications for Carbon-Neutral Cementation. Ind. Eng. Chem. Res. 2015, 54, 8908–8918. [Google Scholar] [CrossRef]
  64. Balcerowiak, W.; Hetper, J. Study of the Thermal Behaviours of some metal acrylates. J. Therm. Anal. 1977, 11, 101–107. [Google Scholar] [CrossRef]
  65. Mondal, P.; Shah, S.; Marks, L. Nanoscale Characterization of Cementitious Materials. ACI Mater. J. 2008, 105, 174–179. [Google Scholar]
  66. Shahsavari, R.; Hoon Hwang, S. Morphogenesis of Cement Hydrate: From Natural C-S-H to Synthetic C-S-H. In Materials; Rahman, R.O.A., Saleh, H.E.-D.M., Eds.; IntechOpen: Rijeka, Croatia, 2018; pp. 79–90. [Google Scholar]
Figure 1. (a) and (b) Scanning electron images at different magnifications of the hydrogel with NSi (H-50).
Jcs 05 00105 g001
Figure 2. Schematic showing the hydrogel rod and three different zones, Z1, Z2, and Z3, in the cross-section of the cement paste samples.
Jcs 05 00105 g002
Figure 3. Hydrogel absorption calculated (a) per dry mass of polymer and nanosilica and (b) per dry mass of polymer only in distilled water (DW) and in the synthetic pore solution.
Jcs 05 00105 g003
Figure 4. Compressive strength of the control cement paste and the pastes containing hydrogels at different ages.
Jcs 05 00105 g004
Figure 5. Electrical resistivity of the control cement paste and the pastes containing hydrogels at different ages.
Jcs 05 00105 g005
Figure 6. Autogenous shrinkage of the control cement paste and the pastes containing hydrogels at different ages.
Jcs 05 00105 g006
Figure 7. CH content of the control cement paste and pastes containing hydrogels at different ages.
Jcs 05 00105 g007
Figure 8. Ca(OH)2 content in zones, Z1, Z2, and Z3, surrounding the hydrogels.
Jcs 05 00105 g008
Figure 9. CaCO3 content in zones, Z1, Z2, and Z3, surrounding the hydrogels.
Jcs 05 00105 g009
Figure 10. EDS analysis of H-20 indicating a large amount of Ca in the hydrogel.
Jcs 05 00105 g010
Figure 11. FTIR spectra of NSi, H-0, and H-50 before and after exposure to the lime solution with increased pH.
Jcs 05 00105 g011
Figure 12. (a) TG and (b) DTG curves of H-0 and H-50 before and after exposure to the lime solution with increased pH.
Jcs 05 00105 g012
Figure 13. SEM images of (a) NSi, (bd) H-0, and (e,f) H-50 after exposure to the lime solution.
Jcs 05 00105 g013
Table 1. Compositions of the hydrogels.
HydrogelDistilled Water (g) AM (g)MBA (g)APS (g)NSi (g)
H-0100200.050.640
H-10100200.050.642
H-20100200.050.644
H-25100200.050.645
H-50100200.050.6410
Table 2. Chemical composition of cement.
Composition %
SiO220.6
Al2O34.8
Fe2O33.5
CaO64
MgO0.9
Na2O0.1
K2O0.3
SO33.4
Table 3. Mix designs and the flow value of the cement pastes.
DesignationHydrogelW/CSuperplasticizer (% per cement)Hydrogel (% per cement)Flow (cm)
C-0.30.5-20
C H-0H-00.350.50.320
C H-10H-100.350.50.420
C H-50H-500.350.50.720
Publisher’s Note: MDPI stays neutral with regard to jurisdictional claims in published maps and institutional affiliations.

