Article

Isosteric Enthalpy Behavior of CO2 Adsorption on Micro-Mesoporous Materials: Carbon Microfibers (CMFs), SBA-15, and Amine-Functionalized SBA-15

by
Reyna Ojeda-López
1,2,
Armando Domínguez-Ortiz
2,
Carlos Felipe
3,
A. Cervantes-Uribe
4,
Isaac J. Pérez-Hermosillo
2 and
J. Marcos Esparza-Schulz
2,*
1
Laboratório de Pesquisa em Adsorção e Captura de CO2 (LPACO2), Departamento de Engenharia Química, Universidade Federal do Ceará (UFC), Fortaleza 60455-760, Brazil
2
Laboratorio de Fisicoquímica de Superficies, Departamento de Química, Universidad Autónoma Metropolitana-Iztapalapa (UAM-I), Mexico City, CDMX 09340, Mexico
3
Centro Interdisciplinario de Investigaciones y Estudios Sobre Medio Ambiente y Desarrollo (CIIEMAD), Departamento de Biociencias e Ingeniería, Instituto Politécnico Nacional (IPN), Mexico City, CDMX 07340, Mexico
4
Centro de Investigación de Ciencia y Tecnología Aplicada de Tabasco (CICTAT), Laboratorio de Nanomateriales Catalíticos Aplicados al Desarrollo de Fuentes de Energía, Universidad Juárez Autónoma de Tabasco (UJAT), Tabasco 86690, Mexico
*
Author to whom correspondence should be addressed.
J. Compos. Sci. 2021, 5(4), 102; https://doi.org/10.3390/jcs5040102
Submission received: 11 March 2021 / Revised: 27 March 2021 / Accepted: 4 April 2021 / Published: 8 April 2021

Abstract

:
The isosteric enthalpy of adsorption ( Δ a d s h ˙ ) of CO2 in three different micro and mesoporous materials was evaluated in this work. These materials were a microporous material with functional groups of nitrogen and oxygen (CMFs, carbon microfibers), a mesoporous material with silanol groups (SBA-15, Santa Barbara Amorphous), and a mesoporous material with amine groups (SBA-15_APTES, SBA-15 amine-functionalized with (3-Aminopropyl)-triethoxysilane). The temperature interval explored was between 263 K and 303 K, with a separation of 5 K between each one, so a total of nine CO2 isotherms were obtained. Using the nine isotherms and the Clausius–Clapeyron equation, the reference value for Δ a d s h ˙ was found. The reference value was compared with those Δ a d s h ˙ obtained, considering some arrangement of three or five CO2 isotherms. Finally, it was found that at 298 K and 1 bar, the total amount of CO2 adsorbed is 2.32, 0.53, and 1.37 mmol g−1 for CMF, SBA-15, and SBA-15_APTES, respectively. However, at a coverage of 0.38 mmol g−1, Δ a d s h ˙ is worth 38, 30, and 29 KJ mol−1 for SBA-15_APTES, CMFs, and SBA-15, respectively. So, physisorption predominates in the case of CMF and SBA-15 materials, and the Δ a d s h ˙ values significantly coincide regardless of whether the isotherms arrangement used was three or five. Meanwhile, in SBA-15_APTES, chemisorption predominates as a consequence of the arrangements used to obtain Δ a d s h ˙ . This happens in such a way that the use of low temperatures (263–283 K) tends to produce higher Δ a d s h ˙ values, while the use of high temperatures (283–303 K) decreases the Δ a d s h ˙ values.

1. Introduction

In recent years, various materials, both micro and mesoporous, have been studied for CO2 capture, given the importance of removal and recovery from gas emissions. Many solid sorbents have been studied, such as activated carbon [1], polymers [2], molecular sieves [3], zeolites [4], Metal-Organic Frameworks (MOFs) [5], carbon nanofibers [6], carbon nanotubes [7], graphene [8], mesoporous silica [9], and functionalized silica oxides [10]. It is necessary for these solids to have a high adsorption capacity, accompanied with a low energy interaction in order to perform an efficient adsorbent. For this reason, understanding the adsorption process is essential to determine the interaction between the adsorbent and the adsorbate. Furthermore, the adsorption process can be either physical (physisorption) or chemical (chemisorption): (i) Physisorption occurs whenever an adsorbable gas (the adsorptive) is brought into contact with the surface of a solid (the adsorbent), and (ii) chemisorption occurs where the intermolecular forces involved lead to the formation of chemical bonds [11]. Physisorption is accompanied by the low heat of adsorptions, with no violent or disruptive structural changes occurring to the surface during the adsorption measurement, which may lead to surface coverage by more than one layer of adsorbate [12], in the which the van der Waals interactions are involved [13]. Chemisorption, also called irreversible adsorption, is mainly characterized by large interaction potentials, which lead to the high heat of adsorption, often approaching the value of chemical bonds. As chemisorption occurs through chemical bonding, it is often found to occur at temperatures above the critical temperature of the adsorbate. Furthermore, chemisorption is necessarily restricted to, at most, a single layer of chemically bound adsorbate on the surface [12]. Then, a parameter that allows to distinguish between physisorption or chemisorption is the heat of adsorption.
The heat of adsorption is the thermodynamic property that describes the interactions between an adsorbent and an adsorbate [13,14,15,16,17]. The value of the heat of adsorption can be deduced from the adsorption isotherms obtained from at least two different temperatures. The energetic physisorption can be assessed directly by adsorption calorimetry: The curve obtained of differential energies of adsorption Δ a d s u ˙ or differential enthalpies of adsorption Δ a d s h ˙ (i.e., Δ a d s u ˙ —RT for an ideal gas) vs. the amount adsorbed (na) allows one to study the energetics of surface coverage or micropore filling. However, the use of the term “heat of adsorption” is discouraged since it does not correspond to any well-defined thermodynamic change of state. The energetic data can also be assessed indirectly from adsorption isotherms obtained at different temperatures (i.e., the “isosteric” method, based on the use of the Clausius–Clapeyron equation) and this leads, for a given amount adsorbed, to the so-called “isosteric heat” (qst). Strictly, this quantity is more meaningful than a simple “heat” since it is equal, with opposite sign, to Δ a d s h ˙ . For this reason, the term “isosteric heat” is preferably replaced by the term isosteric enthalpy of adsorption. For both experimental and theoretical reasons, the calorimetric method is considered more reliable than the isosteric method, mainly if one studies micropore filling or the adsorbate’s phase behavior” [11].
This work explores the measurement of isosteric enthalpy of adsorption as a measure of the surface affinity toward a specific gas (CO2), reflecting the strength of interaction with the solid (carbon microfibers (CMFs), SBA-15, and SBA-15_APTES); it was calculated using the Clausius–Clapeyron equation [13,14,15,16,17]:
Δ a d s h ˙ = R   I n   p   1 / T θ
where Δ a d s h ˙ is the isosteric enthalpy of adsorption, R is the ideal gas constant (8.314 J mol−1 K−1), and θ is the gas (CO2) surface coverage at a pressure p and temperature T.
By solving Equation (1), Equation (2) is obtained, where a plot of ln p versus 1/T gives a straight line with a slope of Δ a d s h ˙ R 1 .
ln p = Δ a d s h ˙ R 1 T
Using Equation (2) and the CO2 adsorption isotherms, different temperature combinations have been selected to evaluate the behavior of the isosteric enthalpy of adsorption on micro and mesoporous materials. The reference Δ a d s h ˙ value is calculated using a total of nine isotherms at 263, 268, 273, 278, 283, 288, 293, 298, and 303 K. Then, different combinations are chosen within this temperature group, selecting only three or five isotherms. Depending on the interaction energy, the predominant process will be determined, either physisorption or chemisorption. The materials evaluated in this work have different porosity, morphology, and chemical composition. The results obtained will be compared with results reported in other works on materials similar to those studied here.

2. Materials and Methods

2.1. Materials

Tetraethyl orthosilicate (TEOS, 98%), surfactant poly (ethylene glycol)-block-poly-(propylene glycol)-block-poly (ethylene glycol) (P123), (3-aminopropyl) triethoxysilane (APTES, 99%), hydrochloric acid (36.5–38%), absolute ethanol (EtOH, 99.9%), polyacrylonitrile (PAN), and anhydrous N,N-dimethylformamide (DMF, 99.8%) were supplied by Sigma-Aldrich (Aldrich, St. Louis, MO, USA), and these were used as received without additional purification.

2.2. SBA-15 and SBA-15_APTES Synthesis

First, SBA-15 was prepared using the method reported by Zhao et al. [18]. Four grams of triblock copolymer Pluronic P-123 was dissolved in a solution of 120 g of deionized water and 24 g of 36.5–38.0% HCl under stirring until complete dissolution. Afterwards, 8.5 g of TEOS was added dropwise. The mixture was stirred at 313 K for 20 h and then was aged at 363 K for two days without mixing. The sample was recovered by filtration, washed with 150 mL of ethanol, and air-dried at 373 K for 24 h. The organic template was removed by calcination in air at 623 K in a tube furnace for 4 h [19].
Second, the functionalization of SBA-15 materials with APTES was performed with a ratio of 1:0.75, that is, 1 g of SBA-15 calcined at 623 K and 0.75 g of APTES. The SBA-15 sample was outgassed under vacuum at 373 K for 12 h to remove residual water, and then 100 mL of ethanol and the APTES were added with vigorous stirring. This process happens at 298 K and under a nitrogen atmosphere for 20 h [20].

2.3. Carbon Microfiber Synthesis

First, polyacrylonitrile microfibers (PANMFs) were synthesized using polyacrylonitrile (PAN) and N,N-Dimethylmethanamide (DMF) in a ratio of 0.1:0.9, a polymer concentration of 10%. The electrospinning apparatus was set at (i) flow rate of 1.0 mL/h, (ii) voltage of 15 kV and (iii) distance between the tip of the syringe and the collector of 10 cm. Then, the carbon microfibers were obtained by a calcination process that involved two phases: (i) Stabilization at 553 K (air atmosphere) for 30 min and (ii) carbonized at 1223 K (nitrogen atmosphere) for 90 min [21].

2.4. Characterization Techniques

2.4.1. Scanning Electron Microscopy (SEM) and Transmission Electron Microscopy (TEM)

SEM analysis was performed on a LEO 1450 VP electron microscope (Corbeil-Essonnes, Paris, France), operated at an acceleration voltage of 15 kV. Furthermore, TEM analysis was done on a High-resolution Transmission Electron Microscopy, HRTEM Jeol 2100F (Peabody, MA, USA), using a light source a field emitter and 200 kV acceleration. To measure microfiber diameters (CMF) and pore diameters (SBA-15 and SBA-15_APTES), the Comptage de particules-volume 2 software was used.

2.4.2. X-ray Diffraction (XRD)

Powder XRD patterns were recorded on a Bruker D8 Advance (Bruker, Billerica, MA, USA), using monochromatic CuKα radiation with a wavelength of 0.154 nm in (i) 0.6° to 5.0° in the 2θ scale (the low angle region) for SBA-15 and (ii) 5.0° to 70.0° for CMF.
In SBA-15 and SBA-15_APTES, it is possible to measure the pores thickness using Bragg’s Law and consider the pore diameter obtained by nitrogen adsorption isotherms. Bragg’s Law is giving by the following expression [22]:
n λ = 2   d h k l   s i n   θ
where λ is the X-ray wavelength, dhkl is the spacing of the crystal layers (path difference), θ is the incident angle (the angle between the incident ray and the scattering plane), and n is an integer, in this case, n = 1.
From Equation (3) and using the incident angle, dhkl it is obtained, and this value is used for calculating another parameter, a0, the distance between contiguous pore centers, which is important for determining the pore thickness. The equation is:
a 0 = 2 d h k l 3
Finally, knowing the value of a0 and the average pore diameter (obtaining by nitrogen adsorption), with Equation (5) it is finding the average pore wall thickness.
t p o r e = a 0 D p o r e

2.4.3. Nitrogen Adsorption/Desorption (77 K)

The measurements were performed with a Micromeritics ASAP 2020 system (Micromeritics, Norcross, GA 30093, USA) at liquid nitrogen temperature (77 K). Before measurement, the samples were degassed at (i) 373.15 K for 12 h (SBA-15 and SBA-15_APTES) and (ii) 473.15 K for 12 h (CMF). The specific surface area was calculated by the multiple-point Brunauer–Emmett–Teller (BET) method. For mesoporous materials, the relative pressure interval using was 0.05 to 0.25 [11,23], and for microporous materials, the interval used was 0.005 to 0.1 [24]. Pore size distribution curves were computed by using the non-local density functional theory (NLDFT) method. Outgassing temperature was selected based on thermogravimetric analysis, and the SBA-15 and SBA-15_APTES materials were limited to a temperature of 373.15 K, sufficient to remove the physisorbed water but not to remove the organic matter from the amino groups in the SBA-15_APTES material (Figure S1); while for CMF, 473.15 K was selected, due to the high microporous nature and also the thermogram shows that it is thermally stable up to temperatures of 673.15 K (Figure S1).

2.4.4. Nuclear Magnetic Resonance (NMR)

Nuclear magnetic resonance (NMR) was performed in a Bruker Advance II300 spectrometer (NMR, Praha 6-Dejvice, Prague, Chequia Republic) operating at 59.62 MHz for 29Si. The 29Si was recorded by magic angle spinning (MAS) at 5 kHz. The 29Si NMR spectra were referenced to tetramethylsilane.

2.4.5. X-ray Photoelectron Spectrometry (XPS)

X-ray photoelectron spectroscopy (XPS) was performed with a Thermo Scientific K-alpha spectrometer (XPS, Waltham, MA, USA) using monochromatic radiation AlKα source (1487 eV). The instrument base pressure was 1 × 10⁻⁹ mbar. The quantitative analysis was carried out using average spectra collected from different sample regions. The data were analyzed using the Thermo Avantage v5.932.

2.4.6. CO2 Adsorption Measurement (263–303 K)

CO2 adsorption isotherms were measured using a Quantachrome, Autosorb 1 (Autosorb, Boynton Beach, FL, USA). The presence of water in these materials was eliminated by heating to 473.15 K, at a rate of 1 K/min under vacuum (5 × 10⁻³ mmHg) overnight using the degassing system of Autosorb 1. The adsorption temperature was maintained (±0.1 K) by circulating water/etilenglicol from a constant temperature bath MX07R-20 Model (PolyScience, Niles, Illinois, USA). The adsorbate gas (CO2) was injected into the set up at volumes required to achieve a targeted group of pressures ranging from 0.001 to 1 bar with an equilibration time of 10 min at each point.

3. Results and Discussion

SEM images for materials micro-mesoporous can be observed in Figure 1. First, Figure 1(A1) shows an agglomerate of fibers, which are more perceptible in Figure 1(A2), and Figure 1(A3) shows one microfiber, where the average diameter for carbon microfibers oscillates between 200 and 400 nm. While SBA-15 and SBA-15_APTES do not show a significatively change, they confirm the typical image of SBA-15 materials, and the important here is that the absence of agglomerates can be perceived in Figure 1C, which could be an indication that the APTES molecule only remains on the surface of the material and not inside the pores, after amine-functionalization. In order to show more significant changes in these materials, the TEM images will be presented.
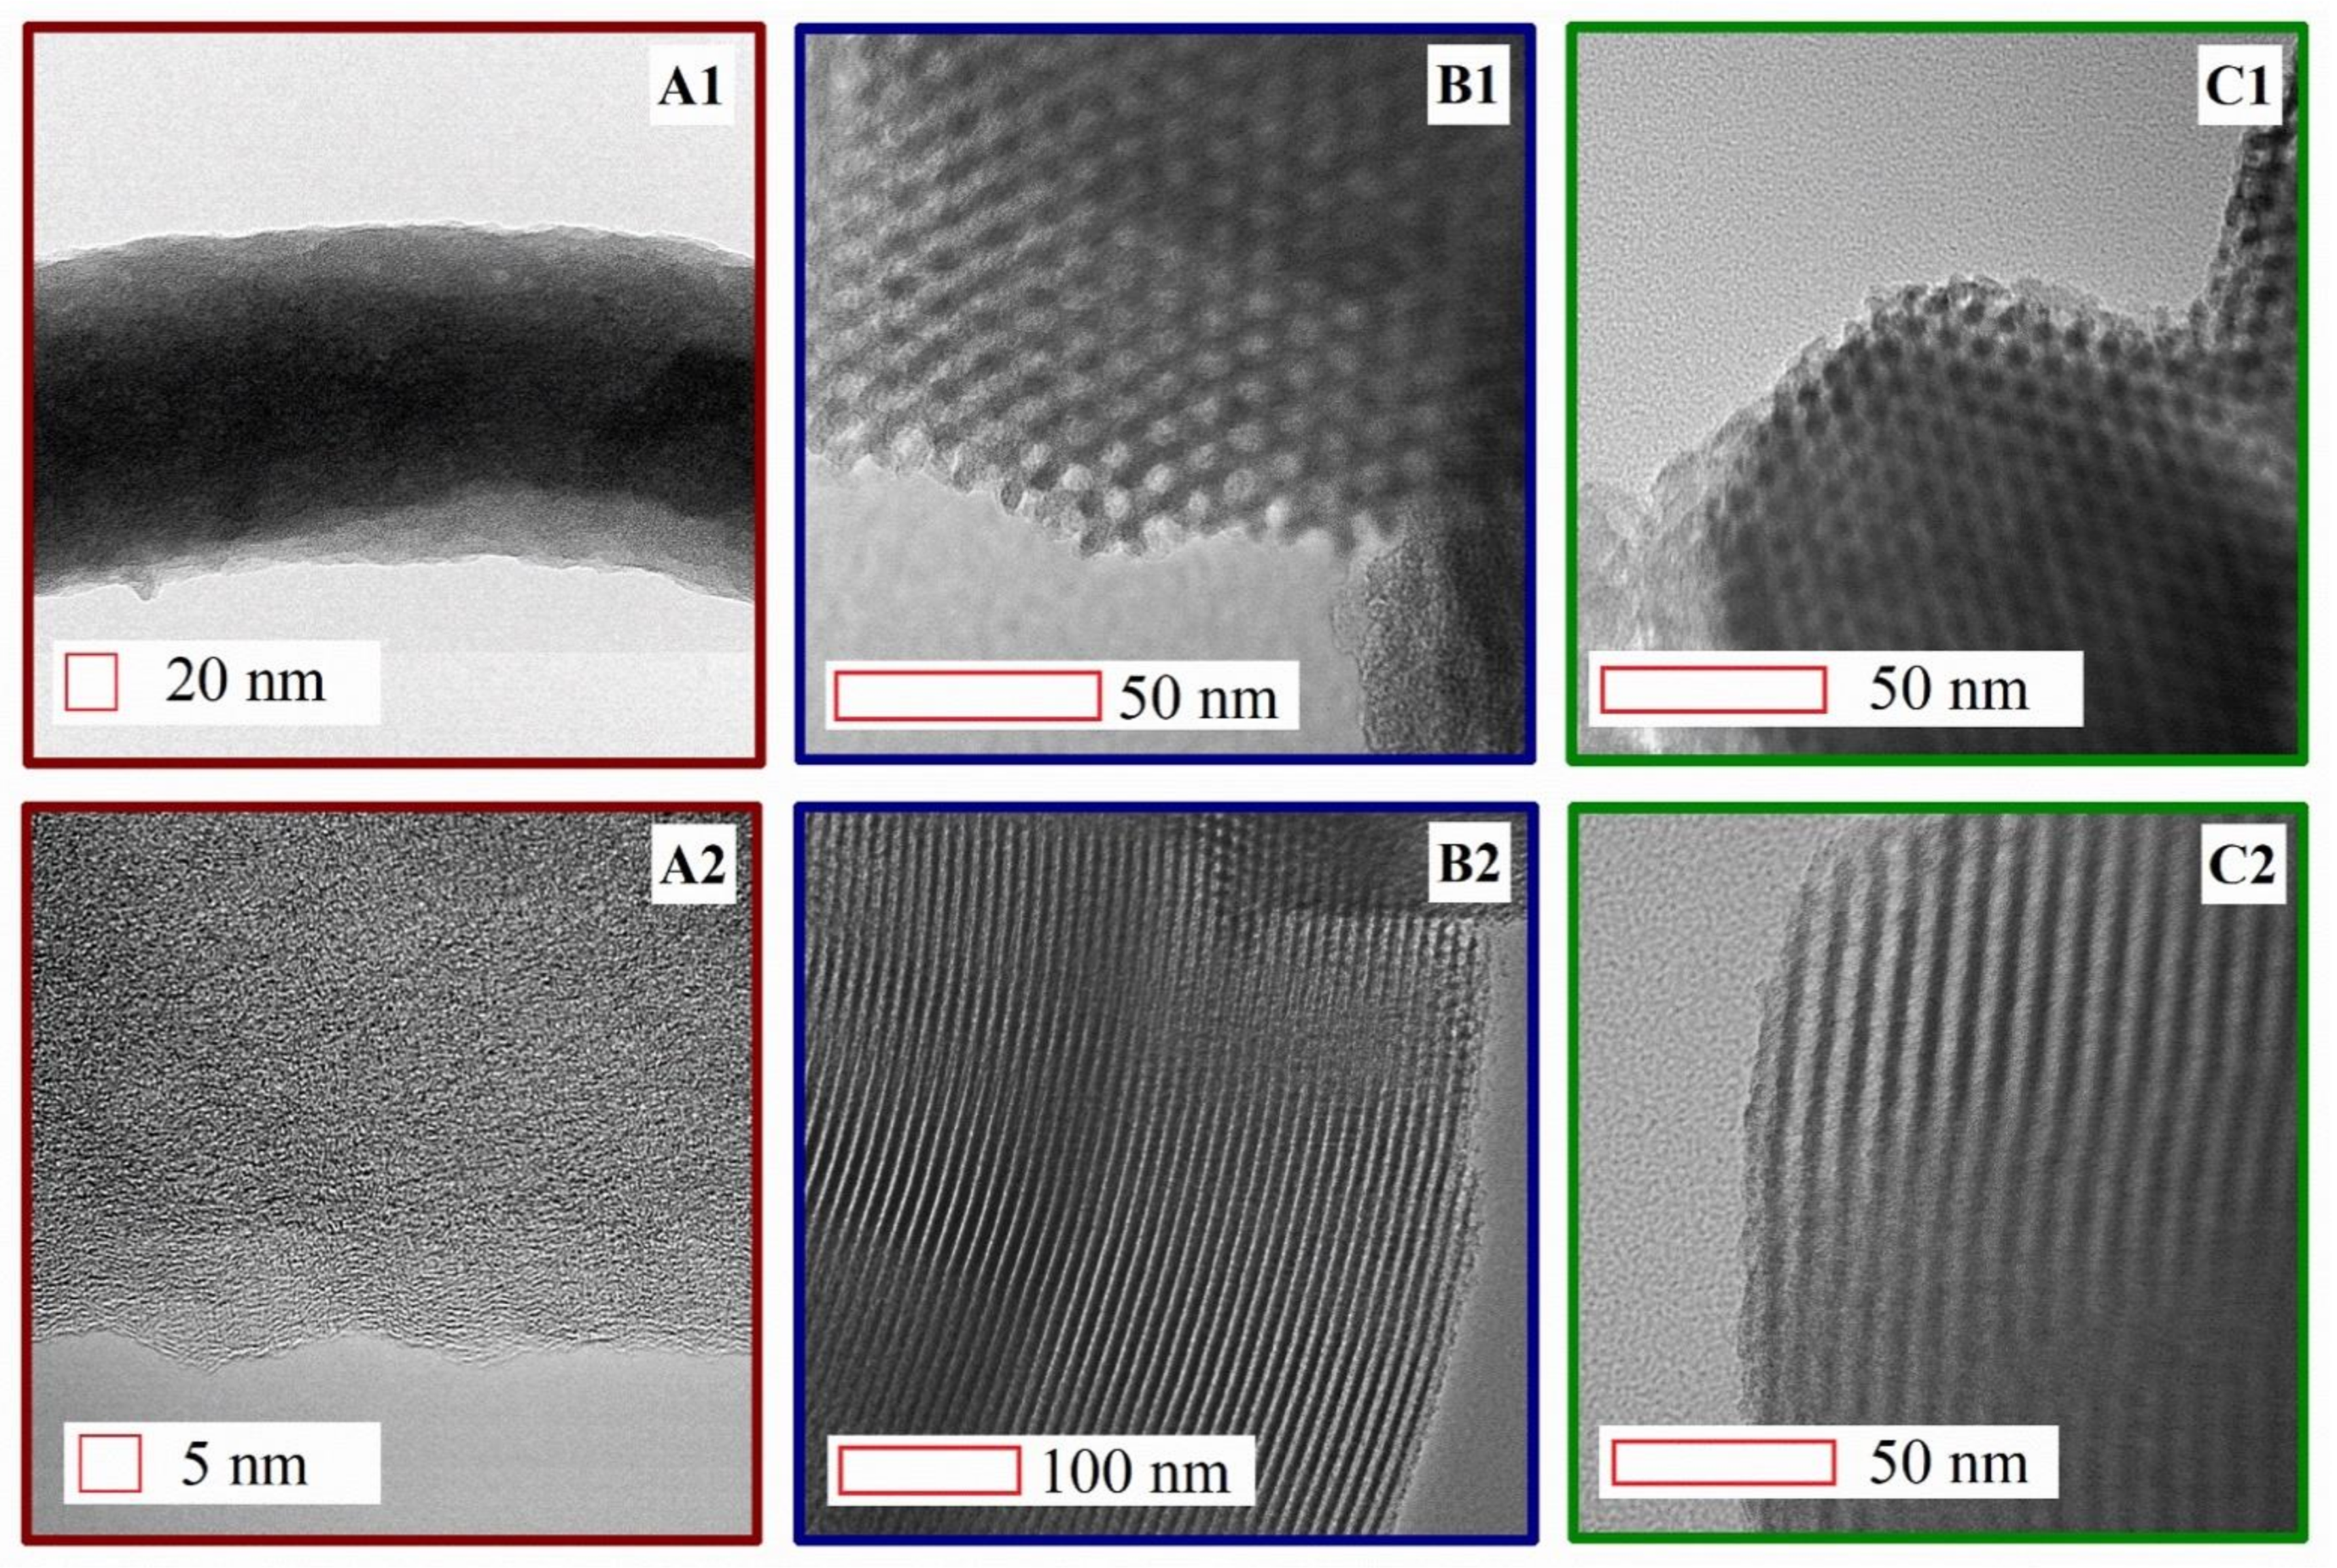
Figure 2 show TEM images of micro-mesoporous materials. The pores’ morphology can be observed in them. In the case of CMFs, they have a pore arrangement of “shift pore” (Figure 2A); however, due to the temperature used for the calcination of CMFs, this material presents an amorphous arrangement, and it is necessary to use temperatures above 3000 K for these sheets to show a defined arrangement. Although it is difficult to make a precise measurement of the distance between each sheet, it can be confirmed that they are pores with less than 2.0 nm, which classifies it within the microporous materials, and the nitrogen adsorption can confirm this at 77 K and CO2 adsorption at 273 K. SBA-15 and SBA-15_APTES have a hexagonal honeycomb arrangement (Figure 2B,C). The average pore diameters were obtained using the Comptage de particules-volume 2 software. The average diameter for SBA-15 fluctuates between 5.0 and 7.0 nm, while its thickness is between 3.0 and 5.0 nm. For SBA-15_APTES, the diameter varies from 4.0 to 5.0 nm and the thickness between 4.0 and 6.0 nm. Comparing these two materials, the pore diameter decreases when the material is amine-functionalized with APTES, while the thickness increases. The above could indicate that a portion of the APTES molecule is efficiently fixed inside the pores of SBA-15.
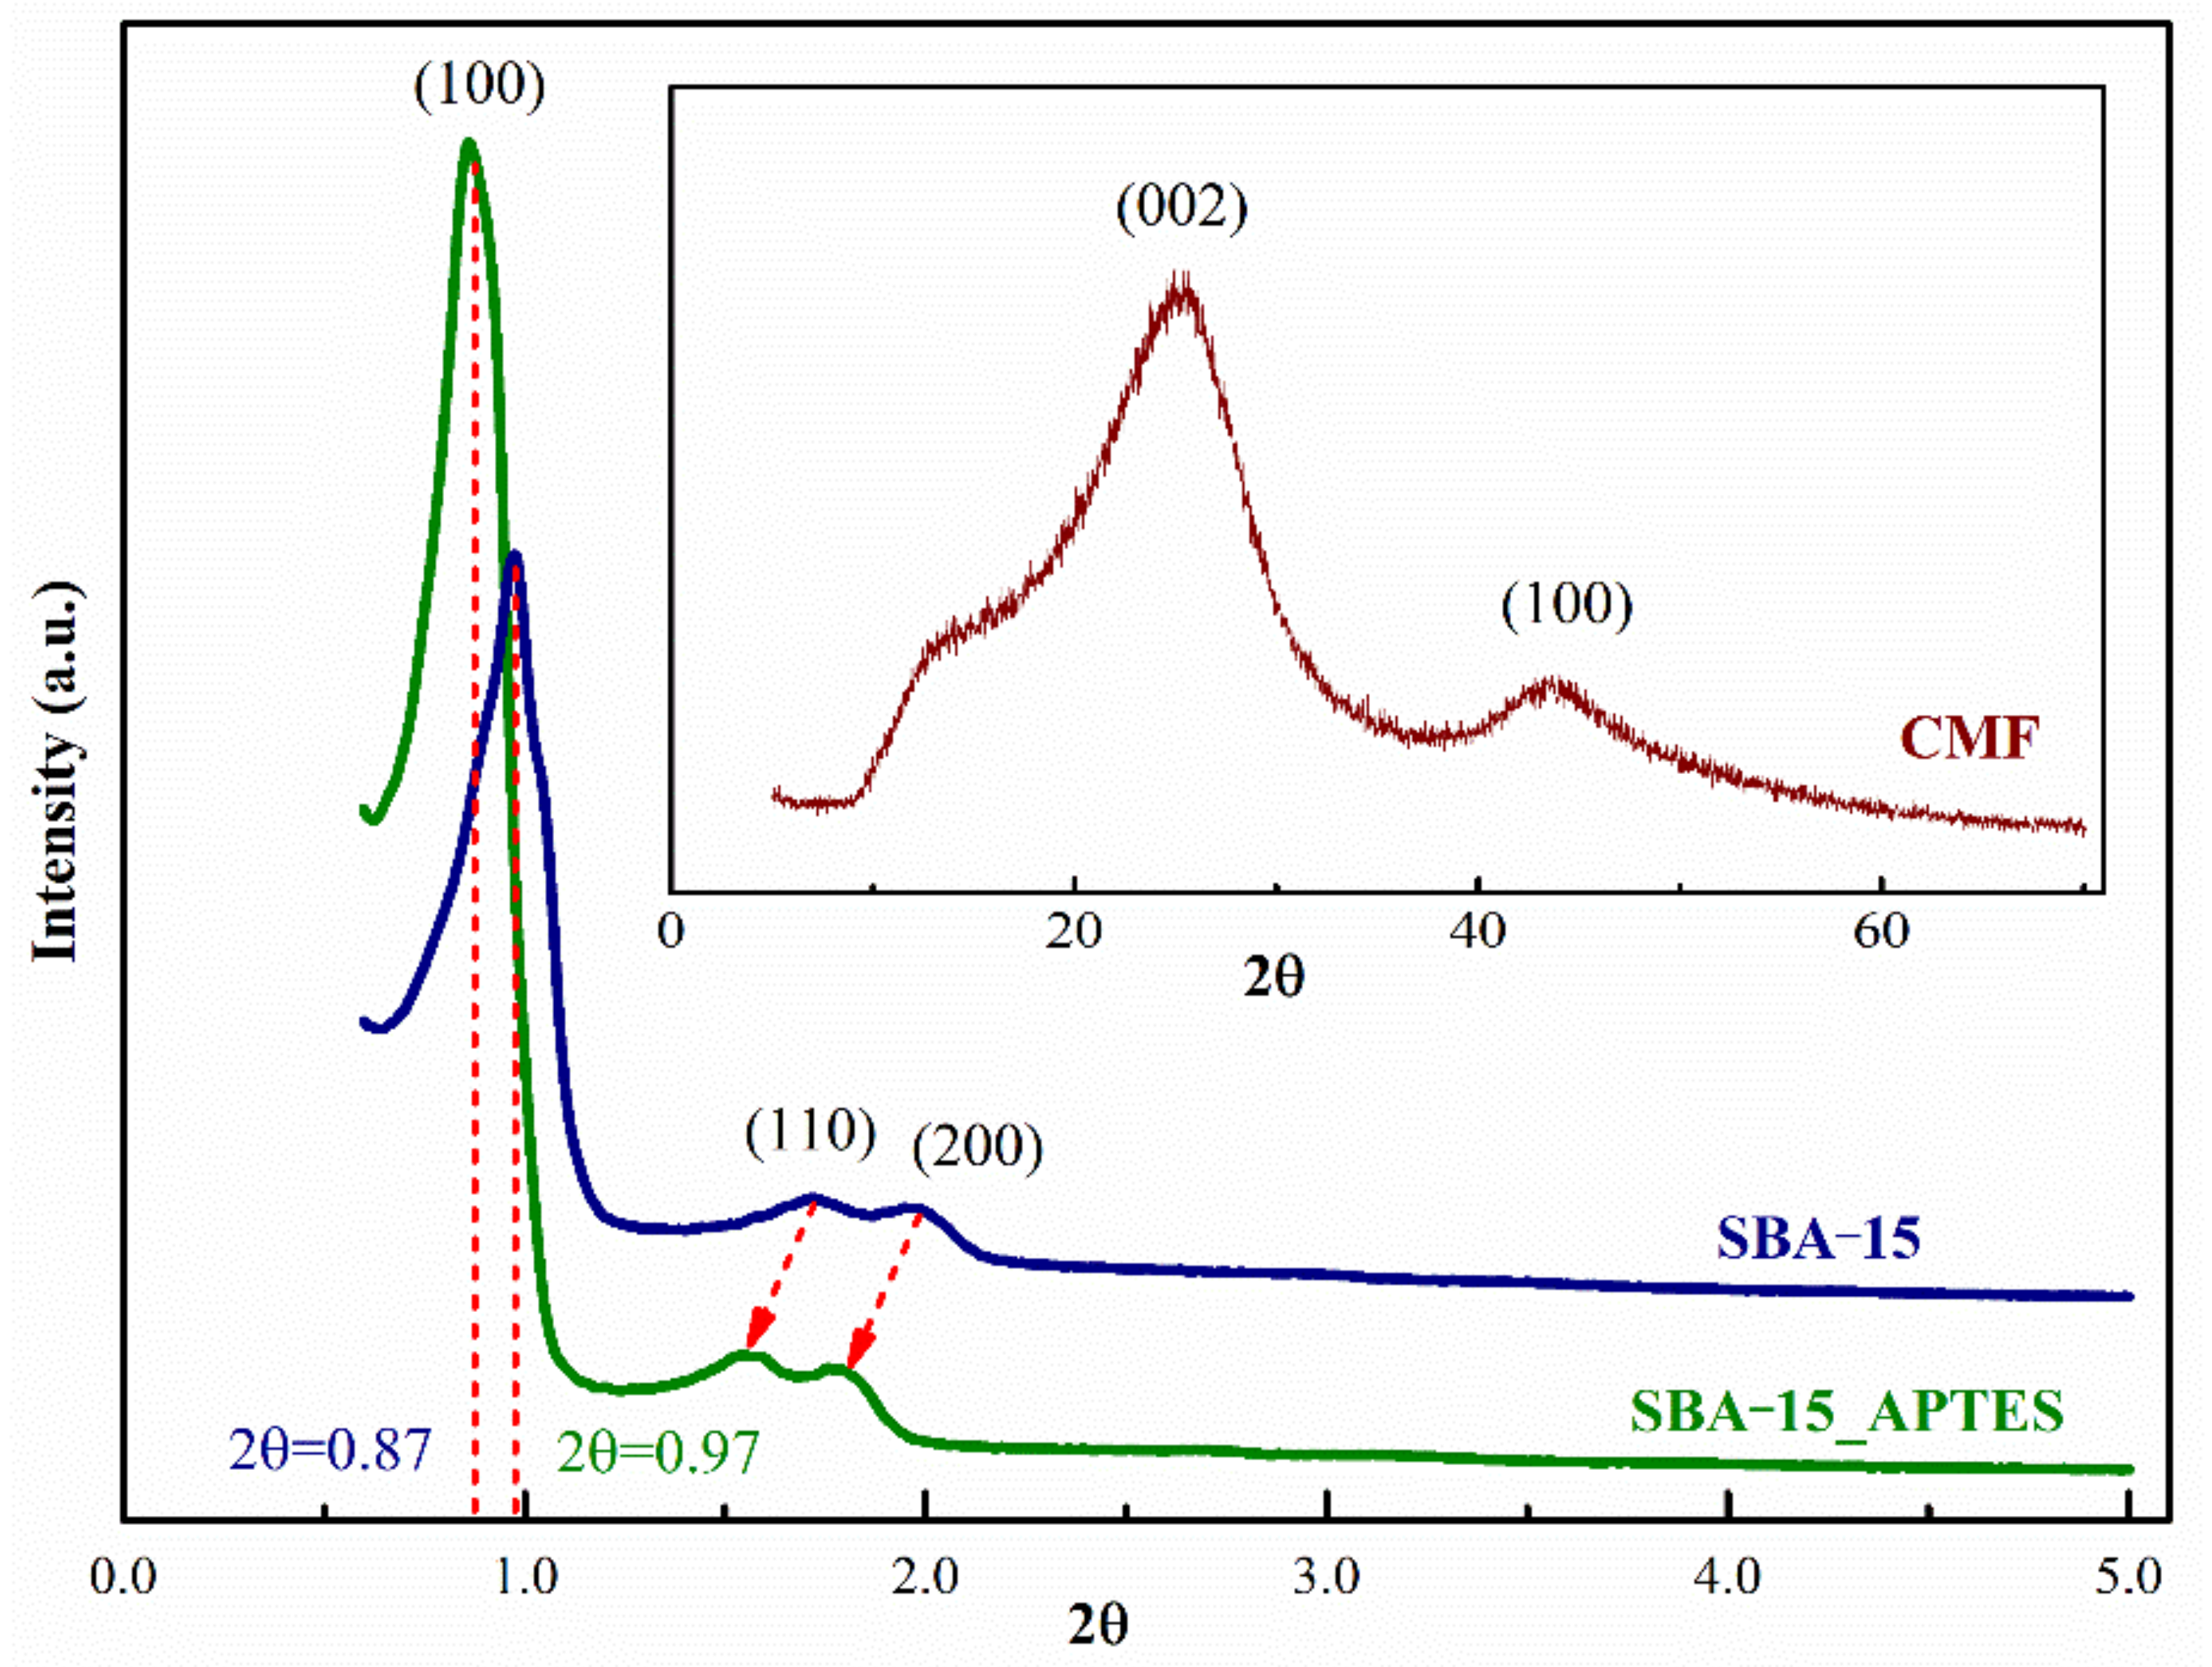
Figure 3 shows the diffractograms of the CMFs and SBA-15 materials. To CMFs, the signal at 25° in 2θ corresponds to the graphitic (002) planes [25,26,27], the high amplitude of the peak between 5° and 35° in 2θ indicates a high degree of amorphic on the graphene sheets. When the materials are calcinated at temperatures above 1223 K, the graphitization is promoted and it will be observed in the signal in (100), attributed to the lateral extent of graphitic domains. Remembering that SBA-15 materials have a defined arrangement, for XRD, it is necessary to work at a low angle, on a scale of 0.5° to 5°. Both materials have similar XRD diffraction patterns, they have three peaks associated with refraction planes (100), (110), and (200). These peaks indicate a hexagonal arrangement of cylindrical mesopores, the characteristic structure of SBA-15 materials; however, it is possible to note that SBA-15_APTES has shifted to the left. The geometric parameters of the mesopore hexagonal arrangement in the plane (100) are calculated following Kruk et al. [28,29], and they are presented in Table 1. From angle 2θ in Figure 3, d100 (the spacing of the crystal layers) and a0 (distance between contiguous pore centers) were calculated. These two parameters, and using the average diameter calculated from the nitrogen isotherms, allow the pore thickness to be calculated, obtaining 3.5 nm and 5.8 nm for SBA-15 and SBA-15_APTES, respectively. These values present the same tendency as the values observed with TEM images; the pore wall thickness decreases when the SBA-15 is amine-functionalized.
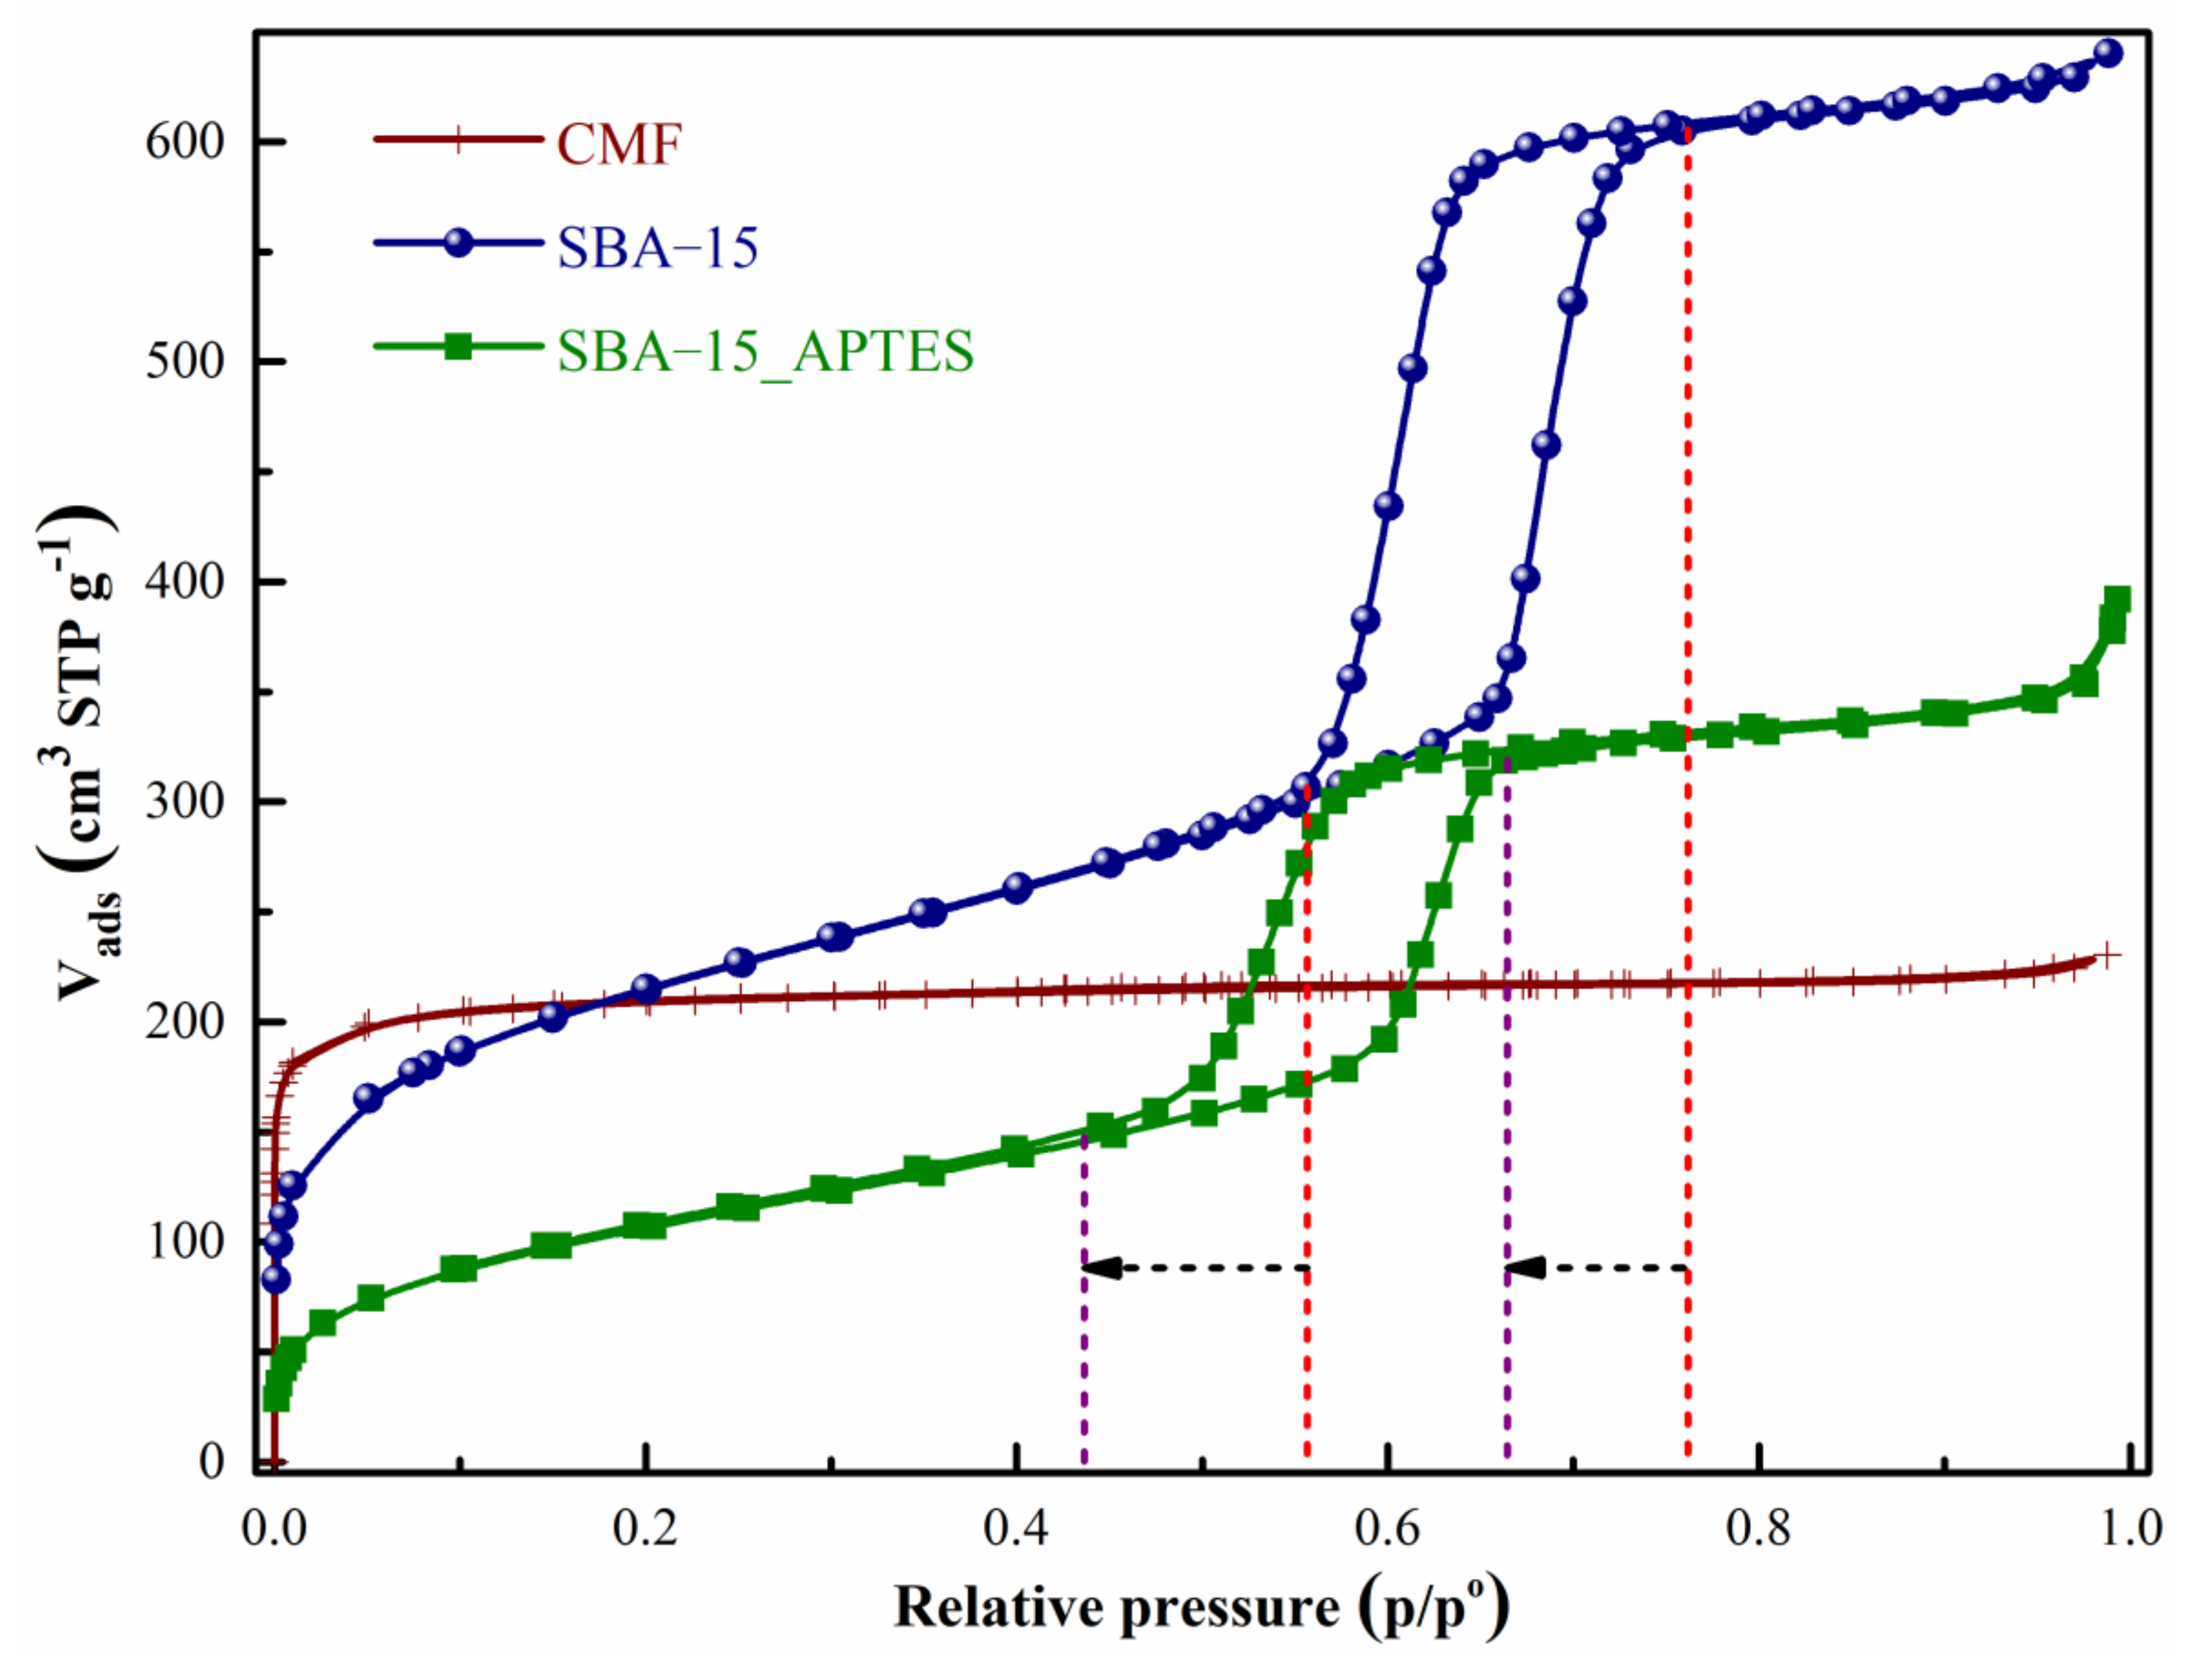
The textural properties were calculated by nitrogen adsorption at 77 K. Figure 4 shows the isotherms obtained. CMFs present a combined isotherm between Type I(A) (microporous) and Type IV (mesopores), with a narrow hysteresis loop H1, which is typical of slit-like larger pores in activated carbons [11]. In general, the adsorbed volume at a relative pressure of less than 0.1 indicates that the material is mostly microporous, i.e., at least 80% corresponds to microporous. In contrast, SBA-15 and SBA-15_APTES show an isotherm type IV with a hysteresis loop, H1, characterized by mesoporous materials. In both materials, the left shift of the hysteresis cycle of the SBA-15_APTES is very noticeable with respect to the SBA-15. This shift indicates a diminution in the average pore diameter, and it will be observed with the pore size distribution (PSD) in Figure 5. In addition, it is possible to note that the amount adsorbed decrease, which can be for two reasons: (i) An efficient amine-functionalization with APTES, or (ii) a pore blockage. The latter is more likely to occur in micropores due to the kinetics of the APTES molecule.
The pore size distribution (PSD) shown in Figure 5 is calculated by non-local density functional theory (NLDFT) using the nitrogen isotherms of Figure 4. The PSD for CMFs confirms its microporosity, with an average pore diameter between 0.7 and 2.0 nm, predominantly pores of 0.8 nm. However, following the recent research recommendations for carbon materials, in CO2 adsorption isotherms at 273 K, the diffusion is much faster and pores as small as 0.4 nm can be accessed [11]. So, in the upper part of Figure 5, it shows the PSD calculated by the CO2 isotherm at 273 K. Here, it can be observed that the average pore diameter for CMFs oscillates between 0.4 and 0.8 nm, and the CO2 isotherm allows the identification of pores smaller than the N2 isotherm. The PSD for SBA-15 and SBA-15_APTES is shown the interval of mesoporous, with SBA-15 from 6.0 nm to 8.0 nm and SBA-15_APTES between 5.0 nm and 7.0 nm. Considering the pore width mode, 7.0 nm for SBA-15 and 5.9 nm for SBA-15_APTES, there is a diminution of ~1.1 nm; this could be due to the APTES molecules anchored on the surface of the SBA-15 pores, and if this is the case, CO2 adsorption corroborates this observation. Although it is a very small amount, the SBA1-15 sample shows the presence of micropores, which have been completely blocked when the sample is functionalized (SBA-15_APTES).
The textural properties calculated by XRD and N2 adsorption are described in Table 1. By XRD, a diminution of thickness is observed for SBA-15 and SBA-15_APTES materials. The specific surface area for CMFs is a value close to SBA-15, 805 m2 g−1 and 735 m2 g−1, respectively, the first a microporous material and the second a mesoporous material. The surface area for SBA-15_APTES decreases up to 389 m2 g−1, approximately 47% with respect to SBA-15. From the micropores volume and total volume, the percentage of microporosity is calculated, 88% for CMFs and 10% for SBA-15; in SBA-15_APTES, there are no presence of micropores, as they were probably blocked by the APTES molecule.
In general terms, the chemical composition of these three materials can be evaluated by XPS (CMF) or 29Si RMN (SBA-15 and SBA-15_APTES). CMFs are composed of 91% carbon, 5% nitrogen, and 4% oxygen (Figure 6). Then, CMFs are a microporous material with functional groups of nitrogen and oxygen; these groups can allow a better interaction between CO2 molecules and CMFs. Some of these species are pyrrolic-N/pyridine, quaternary-N or graphitic-N, pyridine-N-oxide, carbonyl (C=O), and C-O bonds; it is suggested that these groups help to increase the adsorption of CO2 [27].
Silicon materials were evaluated by 29Si RMN. SBA-15 is characterized by the presence of silanol groups (Si-OH bonds) and siloxanes (Si-O-Si bonds), which are labelled as “Q” in NMR. When SBA-15 is amine-functionalized, they also present “T” sites, the R-Si bonds (where R represents an organic residue) present in APTES molecules (top of Figure 6); the presence of these groups indicates a good impregnation of APTES on SBA-15. Q2 (geminal silanols), Q3 (free and vicinal silanols), and Q4 (siloxane) sites are assigned at chemical displacements δ = −93, −103, and −112 ppm, respectively [19,20,30,31,32]. SBA-15_APTES present: (i) A decrease in Q2 and Q3 signals, which are associated with the loss of silanol groups, and (ii) an increment in Q4, related to the condensation of silanol groups to form siloxane groups. In addition to these changes, in the graph for SBA-15_APTES, two signals can be perceived, corresponding to T2 (SiR(OSi)2(OH) groups) and T3 (SiR(OSi)3 groups) bands, assigned at δ = −60 y −68 ppm, respectively [19,20,30,31,32]. It could be proposed that these signals are indicating a good impregnation of APTES molecules. However, it is also possible the interaction is between APTES molecules [20]. Then, the results regarding CO2 adsorption could give a better idea, especially concerning the isosteric enthalpy of adsorption, which will determine the interaction energy between the solid and the CO2 molecule, resulting in physisorption or chemisorption.
By means of different characterization techniques, the textural, structural, and chemical properties have been studied for the three materials: CMFs, SBA-15, and SBA-15_APTES. Now, we present the analysis of the variation in the value for Δ a d s h ˙ using different combinations of the temperature for the CO2 isotherms. The point of reference will be the curve obtained for Δ a d s h ˙ when nine isotherms were considered. Table 2 shows the selected arrangements, considering intervals of 5 K, 10 K, or 20 K, selecting towards lower or higher temperatures, within the studied interval (263 K to 303 K). The effect of the microporosity and chemical composition will be reflected in the results shown below.
The calculation procedure for the isosteric enthalpy of adsorption is described below. Nine isotherms were obtained at 263, 268, 273, 278, 283, 288, 293, 298, and 303 K. Figure 7 shows the nine isotherms of CO2 at different temperatures for a microporous material (CMF). Here, diverse cuts are made at constant volume. When using Equation (2), there are two restrictions for these cuts: (i) At low pressures and (ii) at high pressures. The isotherm will define the smallest value that will be considered for the volume at the lowest temperature (263 K) because this is the temperature at which the largest amount of CO2 is adsorbed (zoom Figure 7, the box on the bottom right). Besides, the largest value will be determined by the isotherm of the highest temperature (303 K), which adsorbed the minimum amount of CO2 (Figure 7). Considering this interval, different cuts are realized; a segment provides a slope and a slope value of the Δ a d s h ˙ for each selected volume. The greater the number of slices made, the more defined the result, usually at low coverages.
In addition to allowing the calculation of the isosteric enthalpy of adsorption, the isotherms in Figure 7 show the CO2 adsorption capacity on CMFs. At 298 K and 1 bar, CMFs adsorbed 2.32 mmol g−1, and this is comparable with other studies that synthesized carbon microfibers using PAN as a precursor and the electrospinning method. For example, Chiang et al. synthetized carbon nanofibers (CNF) with a specific surface area of 306 m2 g−1 and an adsorption of 2.52 mmol CO2 g−1 [33]. Heo et al. explored CNF with and without activation, CNF and ACNF, respectively; CNF presented a small area (12 m2 g−1) and small adsorption (0.55 mmol CO2 g−1), while ACNF with area of 925 m2 g−1 had an adsorption of 2.21 mmol CO2 g−1 [34]. Jeong et al., prepared CNFs added melamine, but the material without melamine named MACNF-0 with a specific surface area of 412 m2 g−1, at 273 K and 1 bar adsorbed 1.61 mmol CO2 g−1 compared with 3.22 mmol CO2 g−1 for CMF (synthesized in this work) at the same conditions [35]; an enhanced adsorption in this case may be due to the presence of nitrogen and oxygen functional groups.
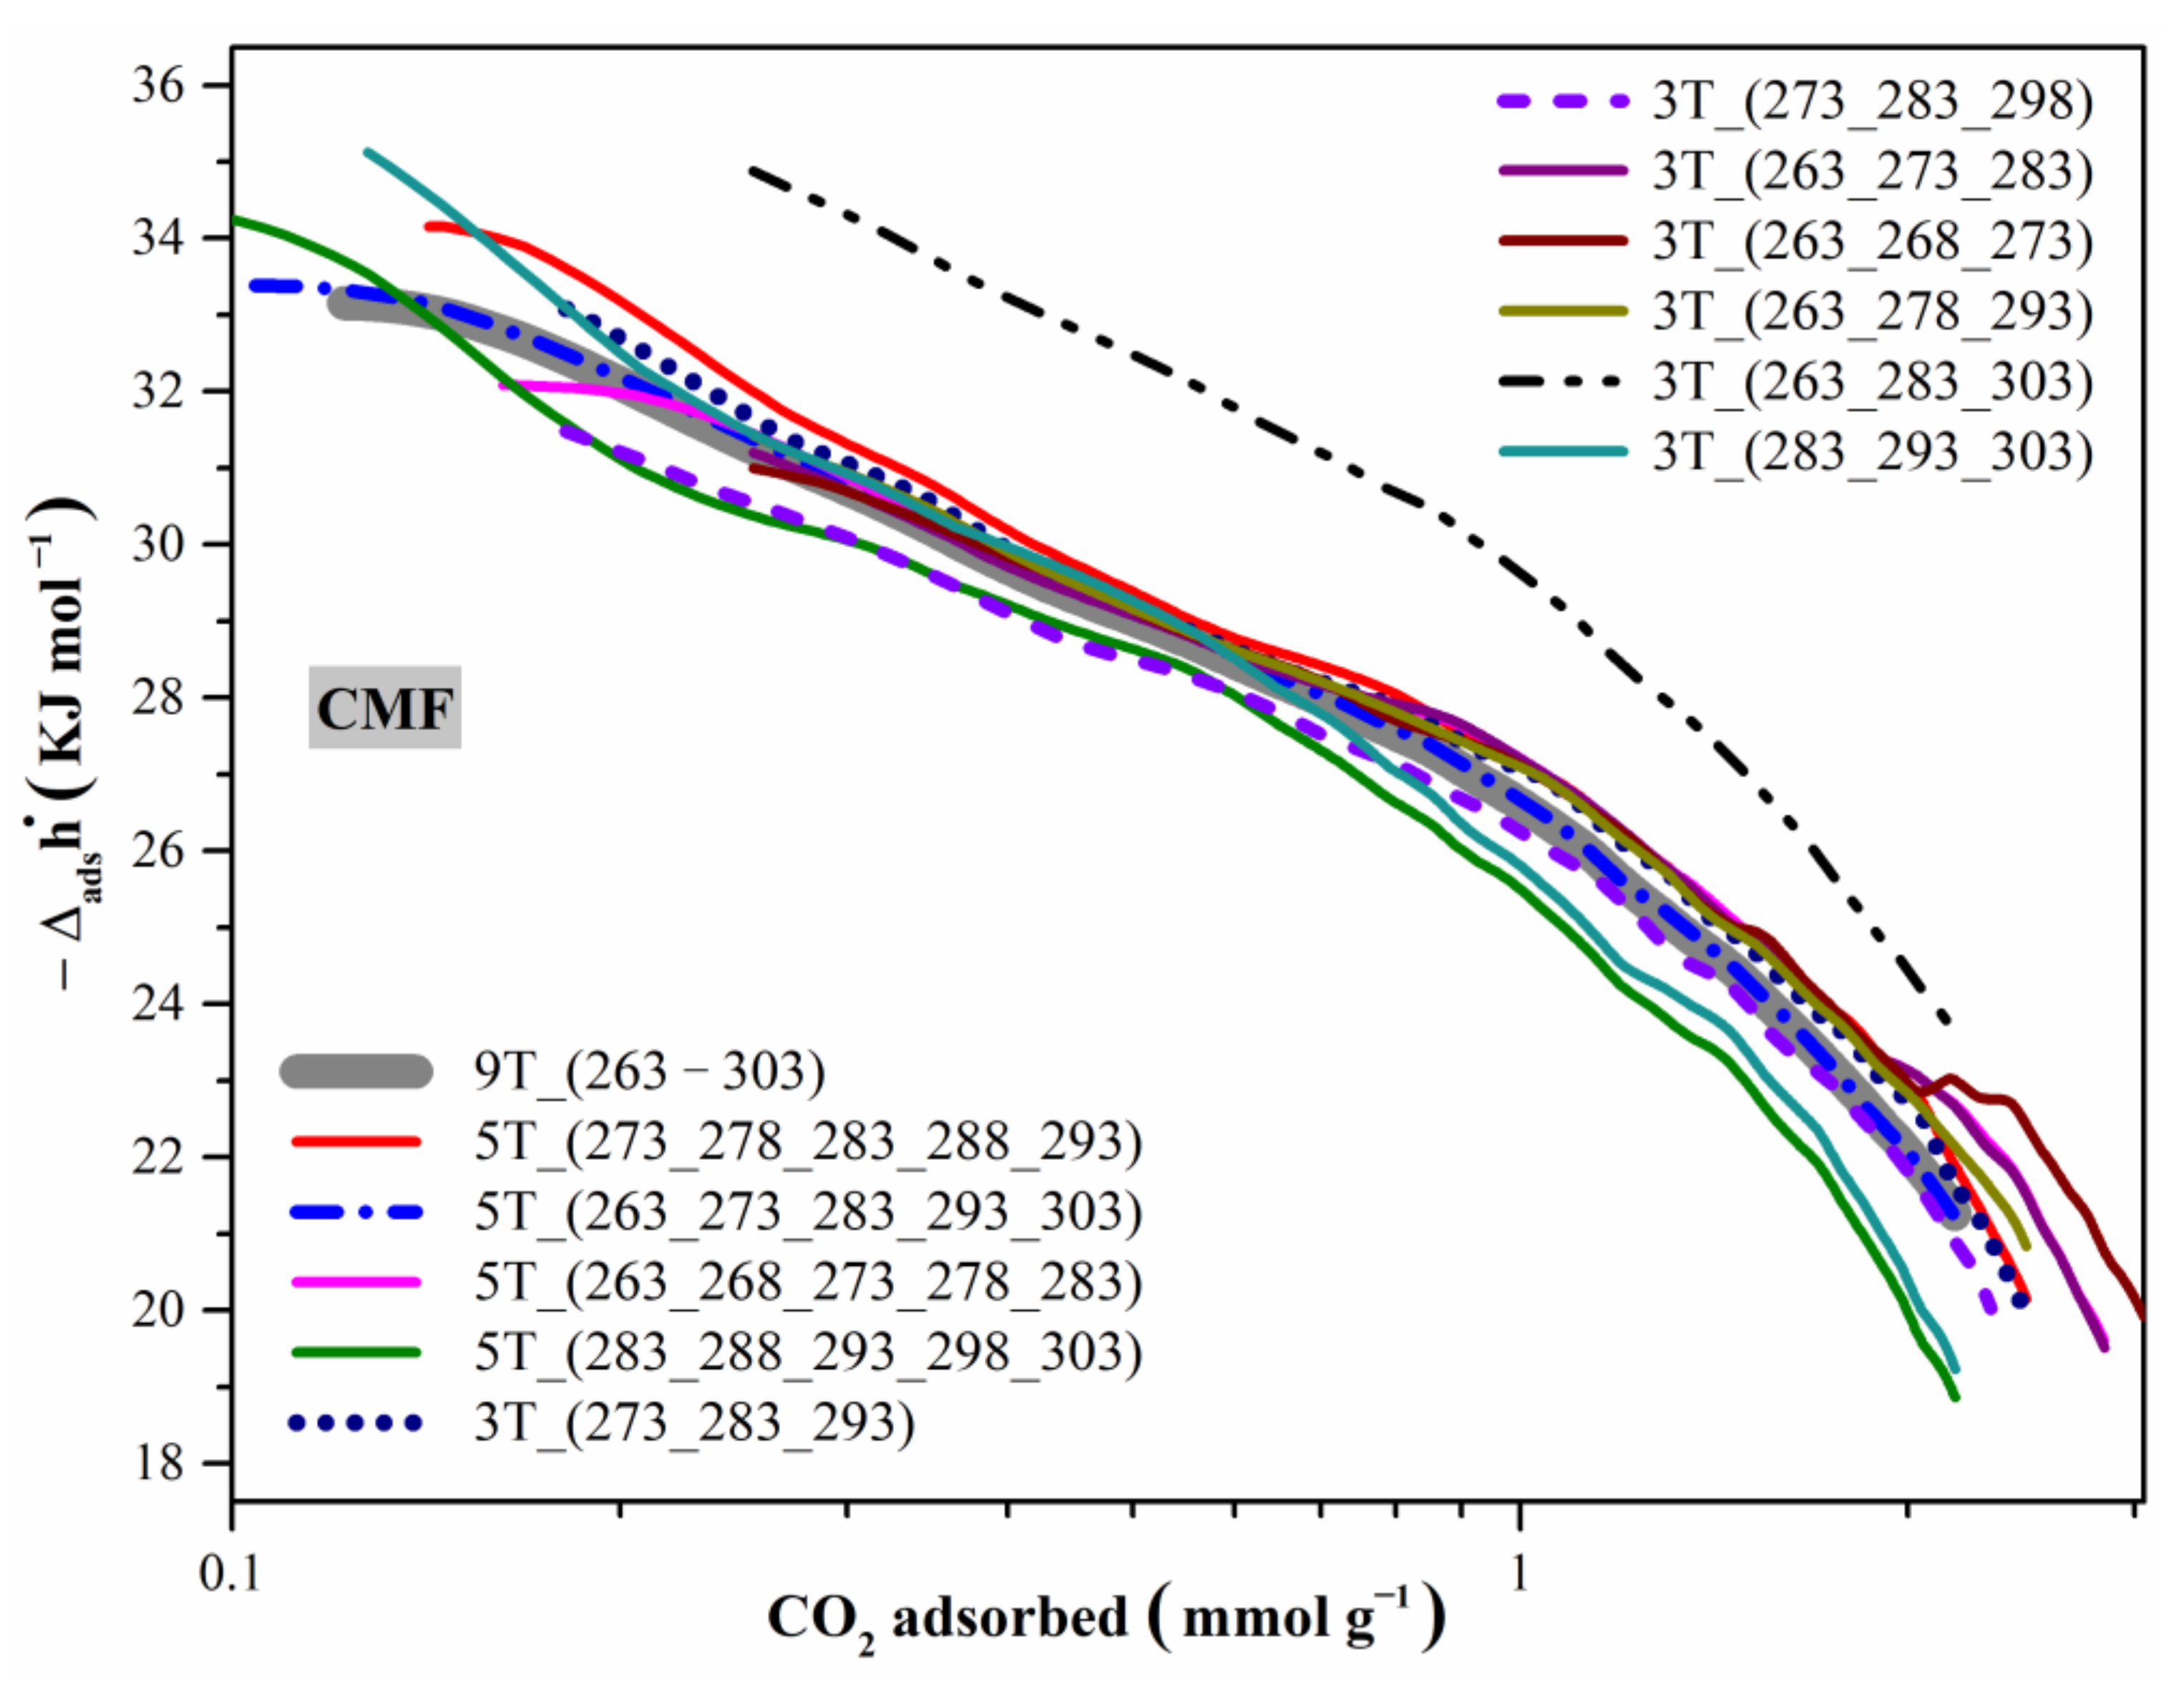
Using the procedure explained above, Figure 8 shows the CO2 isosteric enthalpy of adsorption (− Δ a d s h ˙ ) is in the interval of 35 and 20 kJ mol−1 at various CO2 adsorbed loadings. These values are slightly higher than those reported for carbon materials (~25 kJ mol−1) that do not contain nitrogen and oxygen functional groups [36]: This implies a strong interaction between nitrogen and oxygen species with CO2 molecules, demonstrating the surface heterogeneity and developed surface chemistry of the synthesized adsorbents, in addition to the presence of microporous [37,38]. It is essential to mention that these values are within the range for physical adsorption, which allows for easy regeneration of the materials [12,39]. Chiang et al. explored different carbonization temperatures for carbon nanofibers (CNF) and a tendency is observed in the isosteric enthalpy of adsorption, where the materials with a higher Δ a d s h ˙   value are those that were carbonized at lower temperatures. Moreover, based on their XPS results, these materials present a higher amount of nitrogen and oxygen, which means that the presence of these groups allows a higher surface affinity between the adsorbate and the adsorbent [33].
Independently of the selected arrangement, the trend in the ( Δ a d s h ˙ ) values does not present significant changes (Figure 8), except for arrangement 3T (263, 283, 303), where the temperature difference between each isotherm is 20 K. The above means that the more significant the temperature difference between the isotherms used, the greater the reference values’ deviation. Two arrangements perform best and can be recommended when it is not possible to obtain nine isotherms: (i) Five isotherms (if it is possible to obtain five measurements, then it is recommended to use 263, 273, 283, 293, and 303 K) and (ii) three isotherms (if it is only possible obtain three isotherms, then it is recommended to use 273, 283, and 293 K.
Figure 9 shows the CO2 isotherms of SBA-15. Note that the amount adsorbed at 263 K is ~1.1 mmol g−1, a value three times smaller than the value for CMFs, 3.5 mmol g−1 at 263 K. Ribeiro et al. reported 0.59 mmol g−1 at 303 K and 1 bar against a value of 0.47 mmol g−1 for the material synthesized here [40]. The isotherms in Figure 9 show a decrement in the amount of CO2 adsorbed with an increase of temperature and at 298 K SBA-15 adsorb ~ 0.53 mmol g−1, a quantity too small to be considered a material of interest for CO2 capture. However, in addition to its thermal and mechanical stability and its high surface area, it has silanol groups that allow interaction with other molecules that are more akin to the CO2 molecule. For this reason, the addition of an amine-functionalized material is vital in this study.
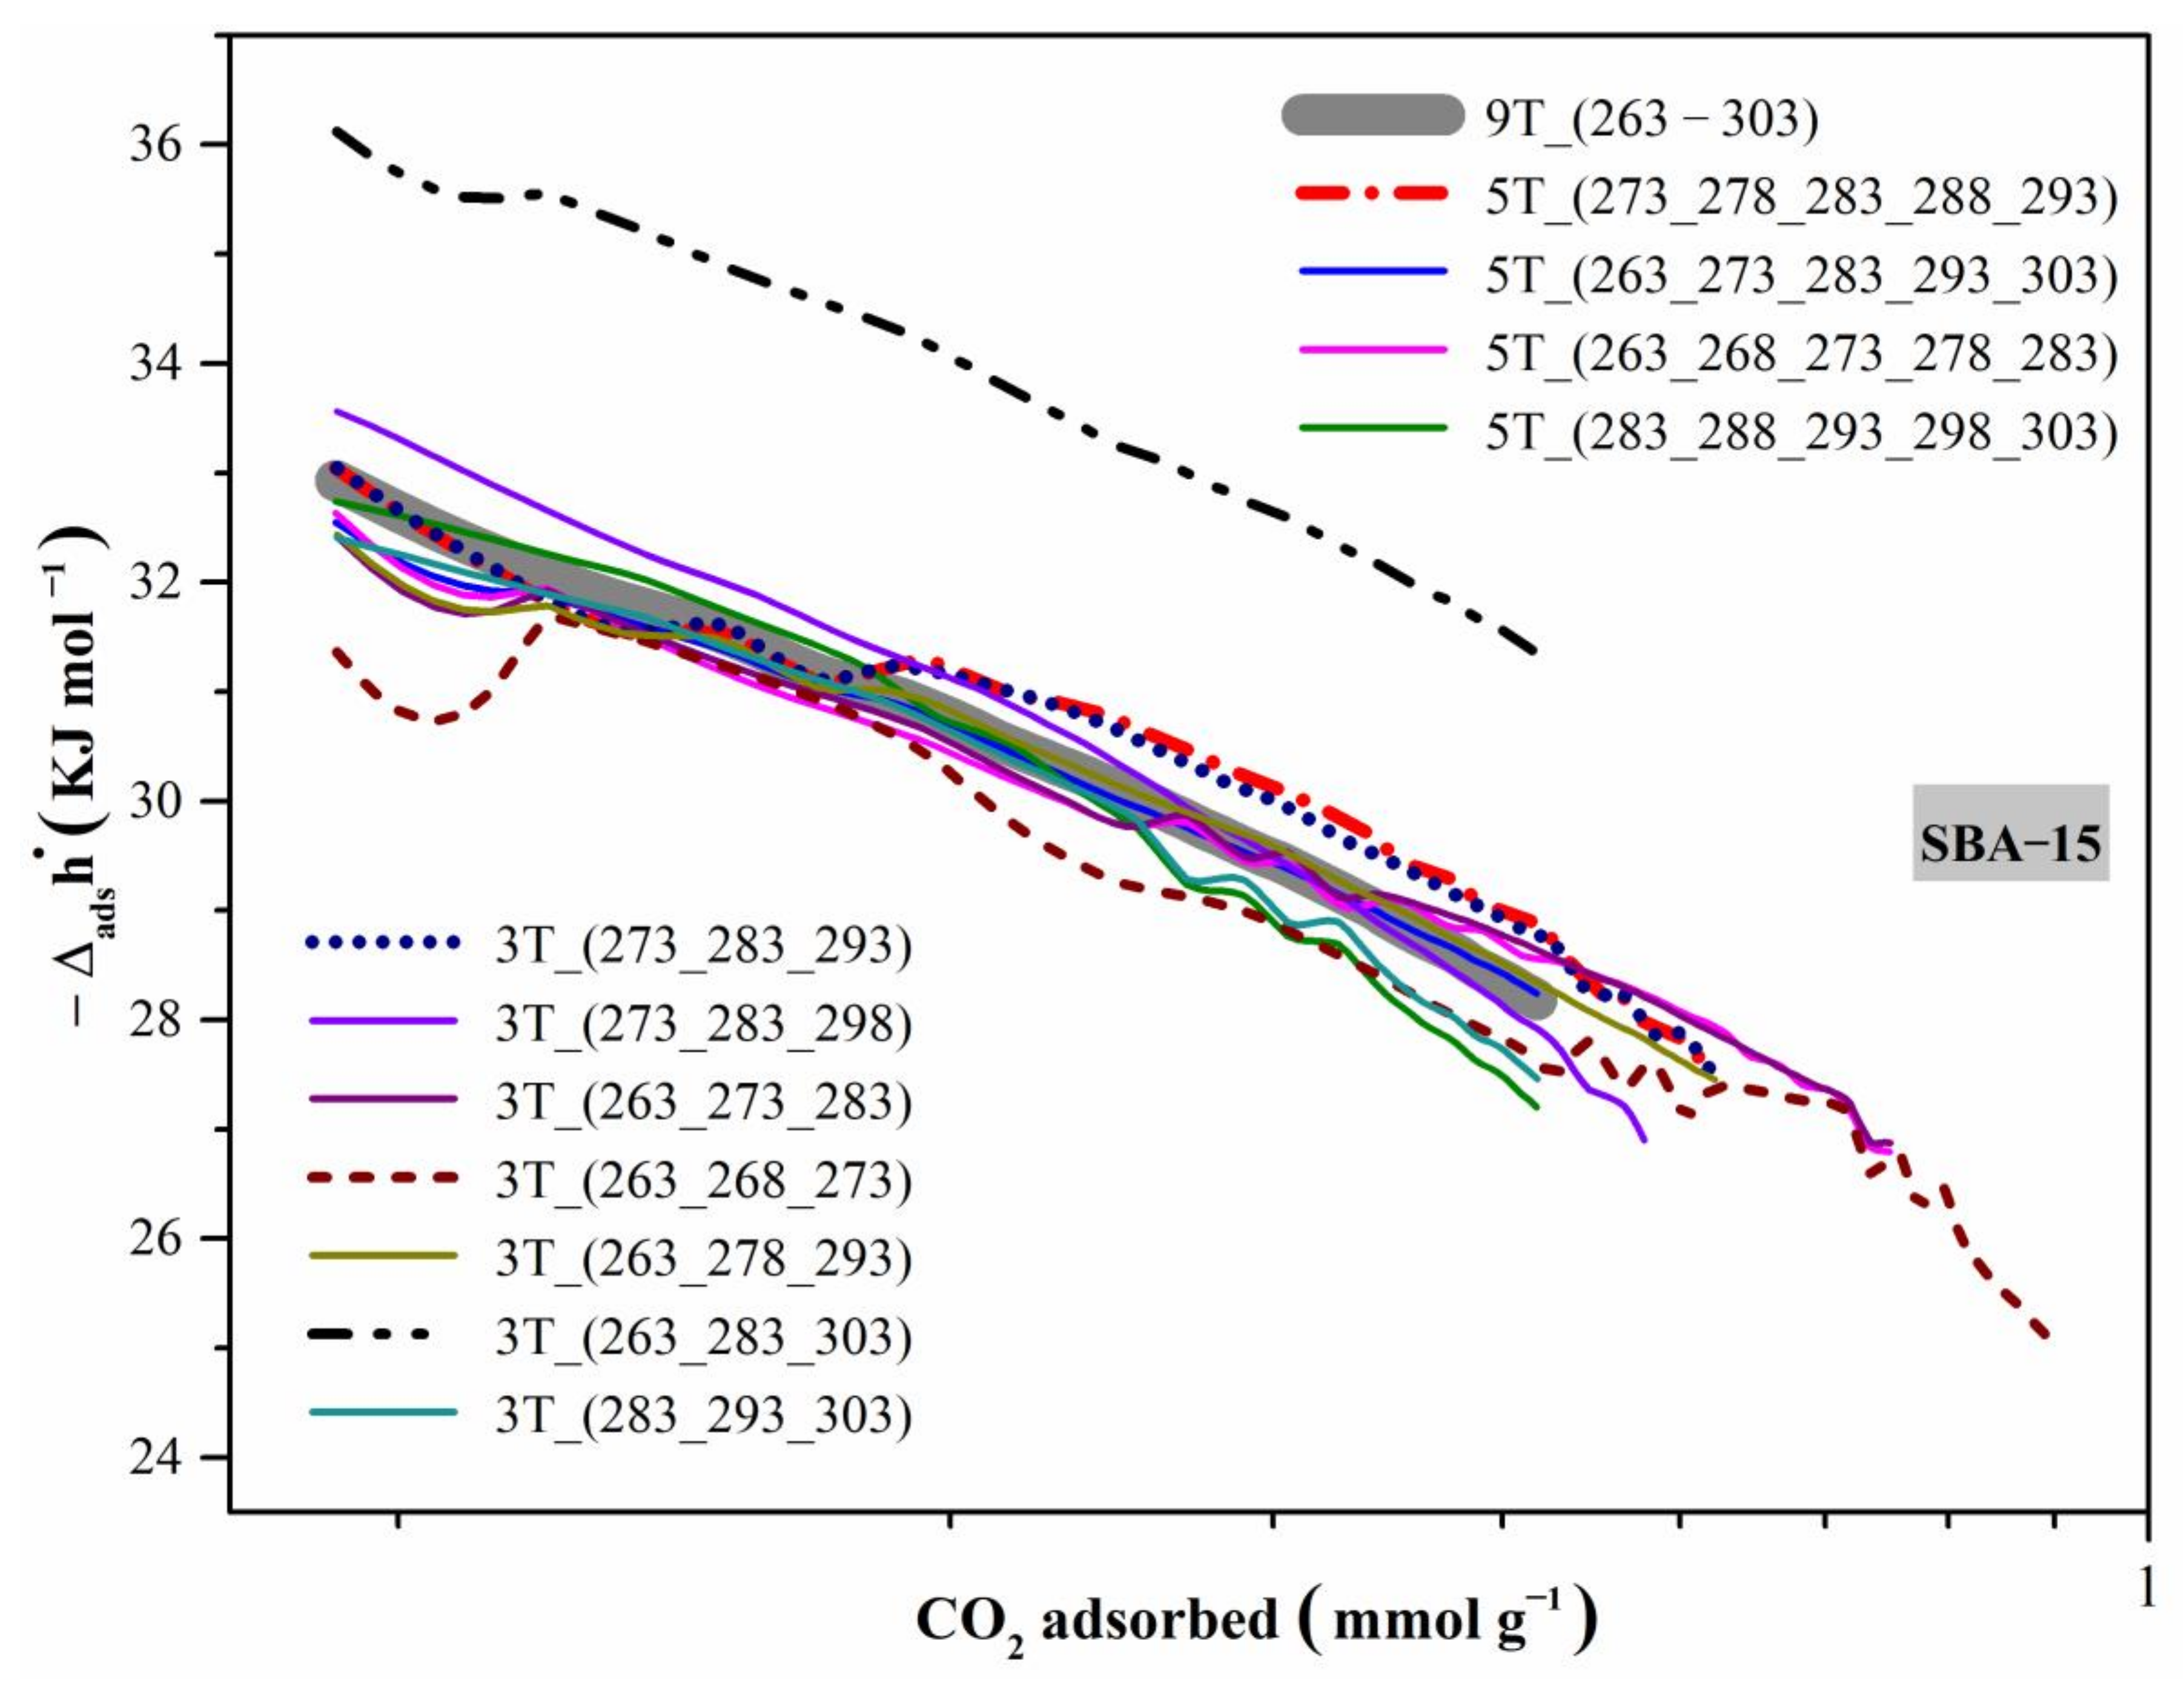
The isosteric enthalpy of adsorption presents a similar value at low coverages (Figure 10) with respect to CMF. For SBA-15, the isosteric enthalpy of adsorption of CO2 decreased with the coverage increased, meaning this is a material with heterogeneity in the adsorption sites. Furthermore, considering that as the pressure increases, a multilayer begins to form, in that case, adsorbate–adsorbate interactions are weaker, leading to a decrease in the Δ a d s h ˙ value. The highest value occurs at low pressures, where the interaction is adsorbate–adsorbent, and it is here where the strongest interaction is found. As with CMFs, the Δ a d s h ˙ values are within the physisorption interval. Most of the selected arrangements show similar behavior with the reference value, except again for the arrangement with a difference of 20 K between each chosen temperature (263 K, 283 K, and 303 K). Three arrangements exhibit atypical behavior. This is the case when choosing either the upper end of temperatures or only the lower end. Here, it is crucial to select an interval that includes low and high temperatures. Even so, the deviation does not exceed 5%.
Finally, the behavior of the modified material will be analyzed in Figure 11. The amount of CO2 adsorbed has increased, and the difference between each of the isotherms is smaller than the isotherms of the SBA-15 material. At 298 K, the amount adsorbed is 1.37 mmol g−1, increasing 150% more than its source material, SBA-15 (0.53 mmol g−1). This increase may be because the silanol groups (surface chemical of SBA-15) interacted with the APTES molecule, forming amine groups that are more affine to CO2; at low pressures, a higher adsorbed quantity can be perceived. Table 3 presents a comparative analysis between the results obtained in this work and other studies reporting SBA-15 functionalized with amine groups. Although the same agent is used for functionalization, there may be some variations, which depend on the amount of APTES used, but especially on the solvent used, which also has a strong influence during the impregnation process. However, in general, the values range very close to the results obtained here.
Figure 12 show the isosteric enthalpy of adsorption of CO2 for SBA-15_APTES. We can observe two trends: (i) The Δ a d s h ˙ begins at values greater than 40 KJ mol−1, which implied a chemisorption process, and (ii) the arrangements show very significant differences. First, what is the reason for high values? One assumption is that there are enough amine groups at low coverages to interact with CO2 and adsorb it, but there are only enough for a first layer. When all these sites are occupied, the interaction is only adsorbate-adsorbate; consequently, isosteric enthalpy of adsorption decreases. Unlike CMFs and SBA-15, where the 3T (263_283_303) arrangement deviated more from the reference value, here it is one of the arrangements that is recommended, along with the five-temperature arrangement that covers the full range of study in this work (5T_(263_273_283_293_303)). The three arrangements that show a big deviation of the reference value included the lowest temperatures, which is normal considering that obtaining Δ a d s h ˙ depends on the isotherm that presents the least amount of adsorption at low pressures. When considering the 3T_(263_238_263) > 3T_(263_273_283) arrangements, the isotherms adsorb considerably more CO2 compared to the arrangements that include higher temperature isotherms; this causes the Δ a d s h ˙ values to be larger. On the contrary, when working with arrangements such as 3T_(283_293_303), with higher temperatures, the Δ a d s h ˙ values decrease based on the reference value; in this case, at low pressures, these temperatures adsorb a lower amount of CO2. Here it is very important to consider choosing temperatures that include a greater interval between low and high temperatures. Δ a d s h ˙ deviates towards very high values if low temperatures are chosen, and if very high temperatures are chosen, Δ a d s h ˙ deviates towards very small values.
The three materials were compared, considering the CO2 isotherms and the Δ a d s h ˙ in Figure 13. One can see that at 298 K, CMFs with a specific surface area of 805 m2 g−1 adsorb 2.3 mmol g−1 and SBA-15 with 735 m2 g−1 of area adsorbs 0.53 mmol g−1; both materials have a comparable specific surface area, and the specific surface area is not the determining factor for better CO2 adsorption. There are two differences between these materials: CMFs are microporous with nitrogen and oxygen functional groups, while SBA-15 is mesoporous with OH functional groups. The chemical composition plays the most essential role in this process, but does microporosity also play a role? Some carbon materials with similar textural characteristics but without nitrogen and oxygen functional groups or a smaller quantity of these materials adsorb lower amounts of CO2 [44]; therefore, the influence of micropores could be excluded. Now, SBA-15_APTES has a specific surface area of 389 m2 g−1 (practically half of the other materials), and it adsorbs less than CMFs but much more than SBA-15 (Figure 13A). The increase concerning its source material (SBA-15) is logical due to the addition of the amino groups that interact with the CO2 molecule. The lower amount adsorbed by CMFs may be due to a lower specific surface area. However, this material presents something remarkable with respect to CMFs and SBA-15. At low pressures, it adsorbs a more significant amount of CO2 (Figure 13A), which directly causes different behavior in Δ a d s h ˙ (Figure 13B). CMFs and SBA-15 have very similar values for Δ a d s h ˙ ; the only difference is that CMFs presents values towards higher coverages because they adsorb a higher amount of CO2, but both materials are in the interval of a physisorption process. In the case of the curve corresponding to SBA-15_APTES, the values begin at higher coverages because, at low pressures, it is adsorbing a greater amount of CO2; in addition to that, the values are already at the limit between a physisorption and chemisorption process. Therefore, although CMFs adsorbs more CO2 than SBA-15_APTES, it has lower interaction energy between adsorbate and adsorbent, making the material easier to regenerate. In SBA-15_APTES, where the interactions are stronger, perhaps some bonds will be more difficult to rupture. In conclusion, the values are at the limit between one and the other process. So, this does not rule out the use of SBA-15 amine-functionalized in industrial processes.

4. Conclusions

Calculating the isosteric enthalpy of adsorption of CO2 using the CO2 isotherms and the Clausius–Clapeyron equation allowed the identification of a physical or chemical process in the material studied, considering the effect of microporosity, mesoporosity, or surface chemistry. Some results worth emphasizing are:
(a)
CMF is a microporous material with a specific surface area of 805 m2 g−1 and a chemical surface with nitrogen and oxygen functional groups, at 298 K and 1 bar; this material adsorbed 2.32 mmol CO2 g−1 with a Δ a d s h ˙ value of -30 KJ mol−1 (a predominant process of physisorption).
(b)
SBA-15, a mesoporous material with a specific surface area of 735 m2 g−1 and silanol groups in its surface, adsorbed 0.53 mmol CO2 g−1 (at 298 K and 1 bar), about 25% of the total amount adsorbed by CMF, both materials have very similar specific surface areas, this difference could be due to the presence of micropores in CMFs. However, surface chemistry may play a more important role; different nitrogen and oxygen functional groups may have a higher affinity for the CO2 molecule than the silanol groups. The Δ a d s h ˙ was −29 KJ mol−1, a value almost identical to that for CMFs, where a physisorption process is prevailing.
(c)
SBA-15_APTES, a mesoporous material, decreased the specific surface area from 735 m2 g−1 to 389 m2 g−1, which is due to the addition of amine groups by the (3-Aminopropyl)triethoxysilane (APTES) precursor improving CO2 adsorption, rising from 0.53 mmol CO2 g−1 to 1.37 mmol CO2 g−1 (at 298 K and 1 bar); besides, this material has a Δ a d s h ˙ of −38 KJ mol−1, which means that the surface affinity of SBA-15_APTES with CO2 molecule is stronger compared to CMF and SBA-15. This surface affinity makes it a preferential chemisorption process, resulting in the production of different behaviors.
Then, in the case of CMFs and SBA-15 materials, the dominant process is physisorption. In both cases, regardless of the arrangement selected to calculate the isosteric enthalpy of adsorption, the behavior is very similar when using various combinations of isotherms in the range analyzed in this work. However, in materials where chemisorption is present (SBA-15_APTES), the behavior of this state function is affected by the temperature range implemented to obtain it. Considering the interval studied here (263 K to 303 K), if the isotherms at low temperatures (263 K to 283 K) are used to obtain Δ a d s h ˙ , the values are shifted towards higher values based on the reference values; if the isotherms at high temperatures (283 K to 303 K) are used, the values are shifted towards smaller values.

Supplementary Materials

The following are available online at https://www.mdpi.com/article/10.3390/jcs5040102/s1, Figure S1. Thermogravimetric analysis of CMF, SBA-15, and SBA-15_APTES.

Author Contributions

Writing—original draft preparation, methodology, and investigation, R.O.-L.; resources, conceptualization, A.D.-O. and J.M.E.-S.; supervision, C.F.; writing—review and editing, I.J.P.-H. and A.C.-U. All authors have read and agreed to the published version of the manuscript.

Funding

This research was funded by the Consejo Nacional de Ciencia y Tecnología (CONACyT) and the project SIP-IPN 20211384 “Procesos Capilares en Materiales Nanoporosos: un Estudio Experimental y de Simulación”. ROL thanks CONACyT for the financial support, CVU: 442652.

Acknowledgments

To the network SEP-PROMEP “Diseno Nanoscópico y Textural de Materiales Avanzados”, with the Project “Síntesis y Fisicoquímica de Materiales Mesoporosos” (UAM-I CA-31 Fisicoquímica de Superficies). Our thanks to Laboratories of DRX (INFR-2011-1-163250), Resonancia Magnética Nuclear (M.C. Marco Antonio Vera Ramirez) and the Microscopia Electronica de Transmisión of the Universidad Autónoma Metropolitana-Iztapalapa.

Conflicts of Interest

The authors declare no conflict of interest.

References

  1. Przepiórski, J.; Skrodzewicz, M.; Morawski, A. High temperature ammonia treatment of activated carbon for enhancement of CO2 adsorption. Appl. Surf. Sci. 2004, 225, 235–242. [Google Scholar] [CrossRef]
  2. Douglas, A.; Carter, R.E.; Li, M.; Pint, C.L. Toward Small-Diameter Carbon Nanotubes Synthesized from Captured Carbon Dioxide: Critical Role of Catalyst Coarsening. ACS Appl. Mater. Interfaces 2018, 10, 19010–19018. [Google Scholar] [CrossRef]
  3. Zeleňák, V.; Badaničová, M.; Halamová, D.; Čejka, J.; Zukal, A.; Murafa, N.; Goerigk, G. Amine-modified ordered mesoporous silica: Effect of pore size on carbon dioxide capture. Chem. Eng. J. 2008, 144, 336–342. [Google Scholar] [CrossRef]
  4. Boycheva, S.; Zgureva, D.; Lazarova, K.; Babeva, T.; Popov, C.; Lazarova, H.; Popova, M. Progress in the Utilization of Coal Fly Ash by Conversion to Zeolites with Green Energy Applications. Materials 2020, 13, 2014. [Google Scholar] [CrossRef] [PubMed]
  5. Chaemchuen, S.; Alam Kabir, N.; Zhou, K.; Verpoort, F. Metal–organic frameworks for upgrading biogas via CO2 adsorption to biogas green energy. Chem. Soc. Rev. 2013, 42, 9304–9332. [Google Scholar] [CrossRef] [PubMed]
  6. Gan, Y.X.; Gan, J.B. Advances in Manufacturing Composite Carbon Nanofiber-Based Aerogels. J. Compos. Sci. 2020, 4, 73. [Google Scholar] [CrossRef]
  7. Babu, D.J.; Lange, M.; Cherkashinin, G.; Issanin, A.; Staudt, R.; Schneider, J.J. Gas adsorption studies of CO2 and N2 in spatially aligned double-walled carbon nanotube arrays. Carbon 2013, 61, 616–623. [Google Scholar] [CrossRef]
  8. Liou, T.-H.; Wang, P.-Y. Utilization of rice husk wastes in synthesis of graphene oxide-based carbonaceous nanocomposites. Waste Manag. 2020, 108, 51–61. [Google Scholar] [CrossRef]
  9. Yan, X.; Komarneni, S.; Yan, Z. CO2 adsorption on Santa Barbara Amorphous-15 (SBA-15) and amine-modified Santa Barbara Amorphous-15 (SBA-15) with and without controlled microporosity. J. Colloid Interface Sci. 2013, 390, 217–224. [Google Scholar] [CrossRef]
  10. Rao, N.; Wang, M.; Shang, Z.; Hou, Y.; Fan, G.; Li, J. CO2 Adsorption by Amine-Functionalized MCM-41: A Comparison between Impregnation and Grafting Modification Methods. Energy Fuels 2018, 32, 670–677. [Google Scholar] [CrossRef]
  11. Thommes, M.; Kaneko, K.; Neimark, A.V.; Olivier, J.P.; Rodriguez-Reinoso, F.; Rouquerol, J.; Sing, K.S. Physisorption of gases, with special reference to the evaluation of surface area and pore size distribution (IUPAC Technical Report). Pure Appl. Chem. 2015, 87, 1051–1069. [Google Scholar] [CrossRef] [Green Version]
  12. Lowell, S.; Shields, J.E.; Thomas, M.A.; Thommes, M. Characterization of Porous Solids and Powders: Surface Area, Pore Size and Density; Kluwer Academic Publishers: London, UK, 2004; ISBN 1-4020-2302-2. [Google Scholar]
  13. Rouquerol, F.; Rouquerol, J.; Sing, K.S.W.; Llewellyn, P.; Maurin, G. Adsorption by Powders and Porous Solids: Principles, Methodology and Aplications, 2nd ed.; Elsevier: New York, NY, USA, 2014; ISBN 9780080970356. [Google Scholar]
  14. Builes, S.; Sandler, S.I.; Xiong, R. Isosteric Heats of Gas and Liquid Adsorption. Langmuir 2013, 29, 10416–10422. [Google Scholar] [CrossRef] [PubMed]
  15. Nicholson, D.; Quirke, N. The role of isosteric enthalpy of adsorption in micropore characterisation: A simulation study. In Studies in Surface Science and Catalysis; Unger, K.K., Kreysa, G., Baselt, J.P., Eds.; Elsevier Science B.V.: Amsterdam, The Netherlands, 2000; Volume 128, pp. 11–20. ISBN 978-0-444-50259-9. [Google Scholar]
  16. Sircar, S.; Mohr, R.; Ristic, C.; Rao, M.B. Isosteric Heat of Adsorption: Theory and Experiment. J. Phys. Chem. B 1999, 103, 6539–6546. [Google Scholar] [CrossRef] [PubMed]
  17. Saha, D.; Grappe, H.A. Adsorption properties of activated carbon fibers. In Activated Carbon Fiber and Textiles; Chen, J.Y., Ed.; Elsevier Ltd.: Amsterdam, The Netherlands, 2017; pp. 143–165. ISBN 978-0-08-100660-3. [Google Scholar]
  18. Zhao, D.; Feng, J.; Huo, Q.; Melosh, N.; Fredrickson, G.H.; Chmelka, B.F.; Stucky, G.D. Triblock copolymer syntheses of mesoporous silica with seriodic 50 to 300 Angstrom pores. Science 1998, 279, 548–552. [Google Scholar] [CrossRef] [Green Version]
  19. Ojeda-López, R.; Pérez-Hermosillo, I.J.; Esparza-Schulz, J.M.; Cervantes-Uribe, A.; Domínguez-Ortiz, A. SBA-15 materials: Calcination temperature influence on textural properties and total silanol ratio. Adsorption 2015, 21, 659–669. [Google Scholar] [CrossRef]
  20. Munguía-Cortés, L.; Pérez-Hermosillo, I.; Ojeda-López, R.; Esparza-Schulz, J.M.; Felipe-Mendoza, C.; Cervantes-Uribe, A.; Domínguez-Ortiz, A. APTES-functionalization of SBA-15 using ethanol or toluene: Textural characterization and sorption performance of carbon dioxide. J. Mex. Chem. Soc. 2017, 61, 273–281. [Google Scholar] [CrossRef]
  21. Ojeda-López, R.; Esparza-Schulz, J.M.; Pérez-Hermosillo, I.J.; Hernández-Gordillo, A.; Domínguez-Ortiz, A. Improve in CO2 and CH4 Adsorption Capacity on Carbon Microfibers Synthesized by Electrospinning of PAN. Fibers 2019, 7, 81. [Google Scholar] [CrossRef] [Green Version]
  22. Ladd, M.; Palmer, R. Structure Determination by X-ray Crystallography: Analysis by X-rays and Neutrons, 5th ed.; Springer US: New York, NY, USA, 2013; Volume 35, ISBN 978-1-4614-3954-7. [Google Scholar]
  23. Brunauer, S.; Emmett, P.H.; Teller, E. Adsorption of Gases in Multimolecular Layers. J. Am. Chem. Soc. 1938, 60, 309–319. [Google Scholar] [CrossRef]
  24. Rouquerol, J.; Llewellyn, P.; Rouquerol, F. Is the BET equation applicable to microporous adsorbents? Stud. Surf. Sci. Catal. 2007, 160, 49–56. [Google Scholar]
  25. Kim, C.; Park, S.-H.; Cho, J.-I.; Lee, D.-Y.; Park, T.-J.; Lee, W.-J.; Yang, K.-S. Raman spectroscopic evaluation of polyacrylonitrile-based carbon nanofibers prepared by electrospinning. J. Raman Spectrosc. 2004, 35, 928–933. [Google Scholar] [CrossRef]
  26. Zussman, E.; Chen, X.; Ding, W.; Calabri, L.; Dikin, D.; Quintana, J.; Ruoff, R. Mechanical and structural characterization of electrospun PAN-derived carbon nanofibers. Carbon 2005, 43, 2175–2185. [Google Scholar] [CrossRef]
  27. Ojeda-López, R.; Ramos-Sánchez, G.; Esparza-Schulz, J.M.; Lartundo, L.; Domínguez-Ortiz, A. On site formation of N-doped carbon nanofibers, an efficient electrocatalyst for fuel cell applications. Int. J. Hydrogen Energy 2017, 42, 30339–30348. [Google Scholar] [CrossRef]
  28. Kruk, M.; Jaroniec, M.; Sayari, A. Relations between Pore Structure Parameters and Their Implications for Characterization of MCM-41 Using Gas Adsorption and X-ray Diffraction. Chem. Mater. 1999, 11, 492–500. [Google Scholar] [CrossRef]
  29. Kruk, M.; Jaroniec, M.; Joo, S.H.; Ryoo, R. Characterization of Regular and Plugged SBA-15 Silicas by Using Adsorption and Inverse Carbon Replication and Explanation of the Plug Formation Mechanism. J. Phys. Chem. B 2003, 107, 2205–2213. [Google Scholar] [CrossRef]
  30. Ide, M.; El-Roz, M.; De Canck, E.; Vicente, A.; Planckaert, T.; Bogaerts, T.; Van Driessche, I.; Lynen, F.; Van Speybroeck, V.; Thybault-Starzyk, F.; et al. Quantification of silanol sites for the most common mesoporous ordered silicas and organosilicas: Total versus accessible silanols. Phys. Chem. Chem. Phys. 2013, 15, 642–650. [Google Scholar] [CrossRef] [PubMed]
  31. Colilla, M.; Izquierdo-Barba, I.; Sánchez-Salcedo, S.; Fierro, J.L.G.; Hueso, J.L.; Vallet-Regí, M. Synthesis and Characterization of Zwitterionic SBA-15 Nanostructured Materials. Chem. Mater. 2010, 22, 6459–6466. [Google Scholar] [CrossRef]
  32. Rahman, I.; Jafarzadeh, M.; Sipaut, C. Synthesis of organo-functionalized nanosilica via a co-condensation modification using γ-aminopropyltriethoxysilane (APTES). Ceram. Int. 2009, 35, 1883–1888. [Google Scholar] [CrossRef]
  33. Chiang, Y.-C.; Lee, S.-T.; Leo, Y.-J.; Tseng, T.-L. Importance of Pore Structure and Surface Chemistry in Carbon Dioxide Adsorption on Electrospun Carbon Nanofibers. Sensors Mater. 2020, 32, 2277. [Google Scholar] [CrossRef]
  34. Heo, Y.-J.; Zhang, Y.; Rhee, K.Y.; Park, S.-J. Synthesis of PAN/PVDF nanofiber composites-based carbon adsorbents for CO2 capture. Compos. Part B Eng. 2019, 156, 95–99. [Google Scholar] [CrossRef]
  35. Jeong, D.; Jie, W.; Adelodun, A.A.; Kim, S.; Jo, Y. Electrospun melamine-blended activated carbon nanofibers for enhanced control of indoor CO. J. Appl. Polym. Sci. 2019, 136, 3–10. [Google Scholar] [CrossRef]
  36. Choma, J.; Stachurska, K.; Marszewski, M.; Jaroniec, M. Equilibrium isotherms and isosteric heat for CO2 adsorption on nanoporous carbons from polymers. Adsorption 2016, 22, 581–588. [Google Scholar] [CrossRef]
  37. Kamran, U.; Choi, J.R.; Park, S.-J. A Role of Activators for Efficient CO2 Affinity on Polyacrylonitrile-Based Porous Carbon Materials. Front. Chem. 2020, 8, 710–727. [Google Scholar] [CrossRef]
  38. Li, Y.; Zou, B.; Hu, C.; Cao, M. Nitrogen-doped porous carbon nanofiber webs for efficient CO2 capture and conversion. Carbon 2016, 99, 79–89. [Google Scholar] [CrossRef]
  39. Králik, M. Adsorption, chemisorption, and catalysis. Chem. Pap. 2014, 68, 1625–1638. [Google Scholar] [CrossRef]
  40. de Ribeiro, J.; Nunes, E.H.M.; Vasconcelos, D.C.L.; Vasconcelos, W.L.; Nascimento, J.F.; Grava, W.M.; Derks, P.W.J. Role of the type of grafting solvent and its removal process on APTES functionalization onto SBA-15 silica for CO2 adsorption. J. Porous Mater. 2019, 26, 1581–1591. [Google Scholar] [CrossRef]
  41. Vilarrasa-Garcia, E.; Moya, E.O.; Cecilia, J.; Cavalcante, C.; Jiménez-Jiménez, J.; Azevedo, D.; Rodríguez-Castellón, E. CO2 adsorption on amine modified mesoporous silicas: Effect of the progressive disorder of the honeycomb arrangement. Microporous Mesoporous Mater. 2015, 209, 172–183. [Google Scholar] [CrossRef]
  42. Cecilia, J.A.; Vilarrasa-García, E.; Morales-Ospino, R.; Bastos-Neto, M.; Azevedo, D.C.S.; Rodríguez-Castellón, E. Insights into CO2 adsorption in amino-functionalized SBA-15 synthesized at different aging temperature. Adsorption 2020, 26, 225–240. [Google Scholar] [CrossRef]
  43. Medina-Juárez, O.; García-Sánchez, M.Á.; Arellano-Sánchez, U.; Kornhauser-Straus, I.; Rojas-González, F. Optimal Surface Amino-Functionalization Following Thermo-Alkaline Treatment of Nanostructured Silica Adsorbents for Enhanced CO2 Adsorption. Materials 2016, 9, 898. [Google Scholar] [CrossRef] [Green Version]
  44. Ojeda-López, R.; Aguilar-Huerta, E.; Maia, D.A.S.; Azevedo, D.C.S.; Felipe, C.; Domíngez-Ortiz, A. Tailoring synthesis conditions of carbon microfibers to enhance the microporosity, CO2 and CH4 adsorption by using the response surface methodology. Microporous Mesoporous Mater. 2020, 305, 110333–110341. [Google Scholar] [CrossRef]
Figure 1. SEM images of (A) carbon microfibers, (B) SBA-15, and (C) SBA-15_APTES.
Jcs 05 00102 g001
Figure 2. TEM images of (A) carbon microfibes, (B) SBA-15, and (C) SBA-15_APTES.
Jcs 05 00102 g002
Figure 3. Powder XRD diffraction patterns of micro-mesoporous materials.
Jcs 05 00102 g003
Figure 4. Nitrogen adsorption/desorption of micro-mesoporous materials.
Jcs 05 00102 g004
Figure 5. Non-local density functional theory (NLDFT) model pore size distribution of micro-mesoporous materials.
Jcs 05 00102 g005
Figure 6. XPS for CMFs and 29Si NMR for SBA-15 and SBA-15_APTES materials.
Jcs 05 00102 g006
Figure 7. CO2 isotherms of carbon microfibers calcined at 1223 K.
Jcs 05 00102 g007
Figure 8. CO2 isosteric enthalpy of polyacrylonitrile microfibers (PANMF) carbonized at 1223 K.
Jcs 05 00102 g008
Figure 9. CO2 isotherms of SBA-15 calcinated at 623 K.
Jcs 05 00102 g009
Figure 10. CO2 isosteric enthalpy of SBA-15 calcinated at 623 K.
Jcs 05 00102 g010
Figure 11. CO2 isotherms of SBA-15 calcinated at 623 K and functionalized with (3-Aminopropyl)triethoxysilane (APTES).
Jcs 05 00102 g011
Figure 12. CO2 isosteric enthalpy of SBA-15 calcinated at 623 K and functionalized with APTES.
Jcs 05 00102 g012
Figure 13. (A) CO2 adsorption isotherms at 298 K. (B) Isosteric enthalpy of adsorption of CO2 considering the nine CO2 adsorption isotherms.
Jcs 05 00102 g013
Table 1. Textural properties of SBA-15, SBA-15_APTES, and carbon microfibers (CMFs).
NameCMFSBA-15SBA-15_APTES
d100 (nm)---9.09710.142
a0 (nm)---10.50411.711
tpore (nm) ---3.4745.830
SBET (m2/g)805735389
SMICRO (m2/g)753.2193.20
SEXT (m2/g)51.9541.8389
VT (cm3/g)0.34020.93360.5362
VMICRO (cm3/g)0.30070.094220
% M88100
DPORE_N2 (nm)0.787.035.88
DPORE_CO2 (nm)0.50------
d100 the spacing of the crystal layers; a0 distance between contiguous pore centers; tpore pore wall thickness; SBET surface specific area by BET equation; SMICRO microporous area by t-plot method; SEXT external surface area; VT total volume at 0.95 in relative pressure; VMICRO   microporous volume by t-plot method;% M % of microporosity using total volume and microporous volume; DPORE_N2 average pore diameter calculated using nitrogen isotherms at 77 K; DPORE_CO2 average pore diameter calculated using CO2 isotherms at 273 K.
Table 2. Arrangements selected in the range from 263 K to 303 K.
263 K268 K273 K278 K283 K288 K293 K298 K303 K
1xxxxxxxxx
2x x x x x
3xxxxx
4 xxxxx
5 xxxxx
6x x x
7x x x
8 x x x
9 x x x
10x x x
11xxx
12 x x x
Table 3. Comparation of the CO2 adsorbed between samples reported in this work and other studies.
AdsorbentFunctionalizing AgentSolventSBET (m2 g−1)Temperature (K)CO2 Adsorbed (mmol g−1)REF
SBA-15------7352980.53This work
SBA-15APTES 1Ethanol3892981.37This work
SBA-15------7353030.47This work
SBA-15APTESEthanol3893031.34This work
SBA-15------5723030.59[40]
SBA-15APTESEthanol2763030.84[40]
SBA-15APTESToluene503031.43[40]
SBA-15APTESToluene2162982.12[41]
SBA-15PEI 2Methanol 2672981.74[41]
SBA-15APTESToluene 1502981.33[42]
SBA-15PEIMethanol 492981.33[42]
SBA-15------6962931.1[43]
SBA-15APTESToluene3612981.1[43]
SBA-15------793298 0.91[20]
SBA-15APTESToluene223298 1.43[20]
SBA-15APTESEthanol 356298 1.40[20]
1 (3-Aminopropyl)-triethoxysilane (APTES); 2 Polyethylenimine-ethylenediamine (PEI).
Publisher’s Note: MDPI stays neutral with regard to jurisdictional claims in published maps and institutional affiliations.