Characterization of Mechanical Performance of Composites Fabricated Using Innovative Carbon Fiber Wet Laid Process


Abstract
1. Introduction
2. Materials and Methods
2.1. Sample Preparations and Experimental Setup
2.2. Halpin-Tsai Theory and Relevance
2.3. OOF Analysis Approach with Assumption of Composites Isotropy and Its Validation
3. Results and Discussion
3.1. OOF Analysis Results for Isotropy Validation
3.2. Experimental Results
4. Conclusions
Author Contributions
Funding
Acknowledgments
Conflicts of Interest
Disclaimer
References
- Pervaiz, M.; Panthapulakkal, S.; KC, B.; Sain, M.; Tjong, J. Emerging Trends in Automotive Lightweighting through Novel Composite Materials. Mater. Sci. Appl. 2016, 7, 26–38. [Google Scholar] [CrossRef]
- Knopp, A.; Scharr, G. Tensile Properties of Z-Pin Reinforced Laminates with Circumferentially Notched Z-Pins. J. Compos. Sci. 2020, 4, 78. [Google Scholar] [CrossRef]
- Chung, D.D.L. Review: Materials for vibration damping. J. Mater. Sci. 2001, 36, 5733–5737. [Google Scholar] [CrossRef]
- Akonda, M.H.; Lawrence, C.A.; Weager, B.M. Recycled carbon fibre-reinforced polypropylene thermoplastic composites. Compos. Part A Appl. Sci. Manuf. 2012, 43, 79–86. [Google Scholar] [CrossRef]
- Ghossein, H.; Hassen, A.A.; Paquit, V.; Love, L.J.; Vaidya, U.K. Innovative Method for Enhancing Carbon Fibers Dispersion in Wet-Laid Nonwovens. Mater. Today Commun. 2018, 17, 100–108. [Google Scholar] [CrossRef]
- Yeole, P.; Ning, H.; Hassen, A.A.; Vaidya, U.K. The Effect of Flocculent, Dispersants, and Binder on Wet-laid Process for Recycled Glass Fiber/PA6 Composite. Polym. Polym. Compos. 2018, 26(3), 259–269. [Google Scholar] [CrossRef]
- Lu, L.; Xing, D.; Xie, Y.; Teh, K.S.; Zhang, B.; Chen, S.M.; Tang, Y. Electrical conductivity investigation of a nonwoven fabric composed of carbon fibers and polypropylene/polyethylene core/sheath bicomponent fibers. Mater. Des. 2016, 112, 383–391. [Google Scholar] [CrossRef]
- Deng, Q.; Li, X.; Zuo, J.; Ling, A.; Logan, B.E. Power generation using an activated carbon fiber felt cathode in an upflow microbial fuel cell. J. Power Sources 2010, 195, 1130–1135. [Google Scholar] [CrossRef]
- Meng, C.; Liu, C.; Fan, S. Flexible carbon nanotube/polyaniline paper-like films and their enhanced electrochemical properties. Electrochem. Commun. 2009, 11, 186–189. [Google Scholar] [CrossRef]
- Shen, L.; Wang, J.; Xu, G.; Li, H.; Dou, H.; Zhanga, X. NiCo2S4 nanosheets grown on nitrogen-doped carbon foams as an advanced electrode for supercapacitors. Adv. Energy Mater. 2015, 5, 2–8. [Google Scholar] [CrossRef]
- Straumit, I.; Lomov, S.V.; Wevers, M. Quantification of the internal structure and automatic generation of voxel models of textile composites from X-ray computed tomography data. Compos. Part A Appl. Sci. Manuf. 2015, 69, 150–158. [Google Scholar] [CrossRef]
- Wan, Y.; Takahashi, J. Tensile and compressive properties of chopped carbon fiber tapes reinforced thermoplastics with different fiber lengths and molding pressures. Compos. Part A Appl. Sci. Manuf. 2016, 87, 271–281. [Google Scholar] [CrossRef]
- Wan, Y.; Straumit, I.; Takahashi, J.; Lomov, S.V. Micro-CT analysis of internal geometry of chopped carbon fiber tapes reinforced thermoplastics. Compos. Part A Appl. Sci. Manuf. 2016, 91, 211–221. [Google Scholar] [CrossRef]
- Tseng, H.; Chang, R.; Hsu, C. Numerical prediction of fiber orientation and mechanical performance for short/long glass and carbon fiber-reinforced composites. Compos. Sci. Technol. 2017, 144, 51–56. [Google Scholar] [CrossRef]
- Feraboli, P.; Kawakami, H.; Wade, B.; Gasco, F.; DeOto, L.; Masini, A. Recyclability and reutilization of carbon fiber fabric/epoxy composites. J. Compos. Mater. 2011, 46, 1459–1473. [Google Scholar] [CrossRef]
- Caba, A.C.; Loos, A.C.; Batra, R.C. Fiber-fiber interactions in carbon mat thermoplastics. Compos. Part A Appl. Sci. Manuf. 2007, 38, 469–483. [Google Scholar] [CrossRef]
- Evans, A.D.; Qian, C.C.; Turner, T.A.; Harper, L.; Warrior, N.A. Flow characteristics of carbon fibre moulding compounds. Compos. Part A Appl. Sci. Manuf. 2016, 90, 1–12. [Google Scholar] [CrossRef]
- Selezneva, M.; Lessard, L. Characterization of mechanical properties of randomly oriented strand thermoplastic composites. J. Compos. Mater. 2016, 50, 2833–2851. [Google Scholar] [CrossRef]
- Amaro, A.M.; Reis, P.N.B.; Santos, J.B.; Santos, M.J.; Neto, M.A. Effect of the electric current on the impact fatigue strength of CFRP composites. Compos. Struct. 2017, 182, 191–198. [Google Scholar] [CrossRef]
- Thomason, J.L. The influence of fibre length and concentration on the properties of glass fibre reinforced polypropylene: Injection moulded long and short fibre PP. Compos. Part A Appl. Sci. Manuf. 2002, 33, 1641–1652. [Google Scholar] [CrossRef]
- Langer, S.A.; Fuller, E.R.; Carter, W.C. OOF: An image-based finite-element analysis of material microstructures. Comput. Sci. Eng. 2001, 3, 15–23. [Google Scholar] [CrossRef]
- Reid, A.C.E.; Lua, R.C.; García, R.E.; Coffman, V.R.; Langer, S.A. Modelling Microstructures with OOF2. Int. J. Mater. Prod. Technol. 2009, 35, 361. [Google Scholar] [CrossRef]
- Dong, Y.; Bhattacharyya, D. Morphological-image analysis based numerical modelling of organoclay filled nanocomposites. Mech. Adv. Mater. Struct. 2010, 17, 534–541. [Google Scholar] [CrossRef]
- Dong, Y.; Bhattacharyya, D.; Hunter, P.J. Characterisation and Object-Oriented Finite Element Modelling of Polypropylene/Organoclay Nanocomposites. Key Eng. Mater. 2007, 334–335, 841–844. [Google Scholar] [CrossRef]
- Cannillo, V.; Esposito, L.; Pellicelli, G.; Sola, A.; Tucci, A. Steel particles–porcelain stoneware composite tiles: An advanced experimental–computational approach. J. Eur. Ceram. Soc. 2010, 30, 1775–1783. [Google Scholar] [CrossRef]
- Bakshi, S.R.; Patel, R.R.; Agarwal, A. Thermal conductivity of carbon nanotube reinforced aluminum composites: A multi-scale study using object oriented finite element method. Comput. Mater. Sci. 2010, 50, 419–428. [Google Scholar] [CrossRef]
- Coffman, V.R.; Reid, A.C.E.; Langer, S.A.; Dogan, G. OOF3D: An image-based finite element solver for materials science. Math. Comput. Simul. 2012, 82, 2951–2961. [Google Scholar] [CrossRef]
- Goel, A.; Chawla, K.K.; Vaidya, U.K.; Chawla, N.; Koopman, M. Two-dimensional microstructure based modelling of Young’s modulus of long fibre thermoplastic composite. Mater. Sci. Technol. 2008, 24, 864–869. [Google Scholar] [CrossRef]
- Affdl, J.C.H.; Kardos, J.L. The Halpin-Tsai equations: A review. Polym. Eng. Sci. 1976, 16, 344–352. [Google Scholar] [CrossRef]
- Shokrieh, M.M.; Moshrefzadeh-Sani, H. On the constant parameters of Halpin-Tsai equation. Polymer 2016, 106, 14–20. [Google Scholar] [CrossRef]
- Mallick, P.K. Fiber-Reinforced Composites: Materials, Manufacturing, and Design, 3rd ed.; CRC Taylor & Francis Group: Philadelphia, PA, USA, 2007. [Google Scholar]
- Hahn, H.T. On Approximations for Strength of Random Fiber Composites. J. Compos. Mater. 1975, 9, 316–326. [Google Scholar] [CrossRef]
- DOF. Composite Materials Handbook-MIL 17, 1st ed.; Taylor & Francis: New York, NY, USA, 1999. [Google Scholar] [CrossRef]


| Sample | Dir-X | Dir-Y | Ratio (x/y) | Sample | Dir-X | Dir-Y | Ratio (x/y) |
|---|---|---|---|---|---|---|---|
| M11 | 9.4 | 13.2 | 0.7 | M21 | 15.0 | 16.5 | 0.9 |
| M12 | 11.1 | 33.6 | 0.3 | M22 | 9.2 | 11.8 | 0.8 |
| M13 | 15.2 | 13.0 | 1.2 | M23 | 9.5 | 8.4 | 1.1 |
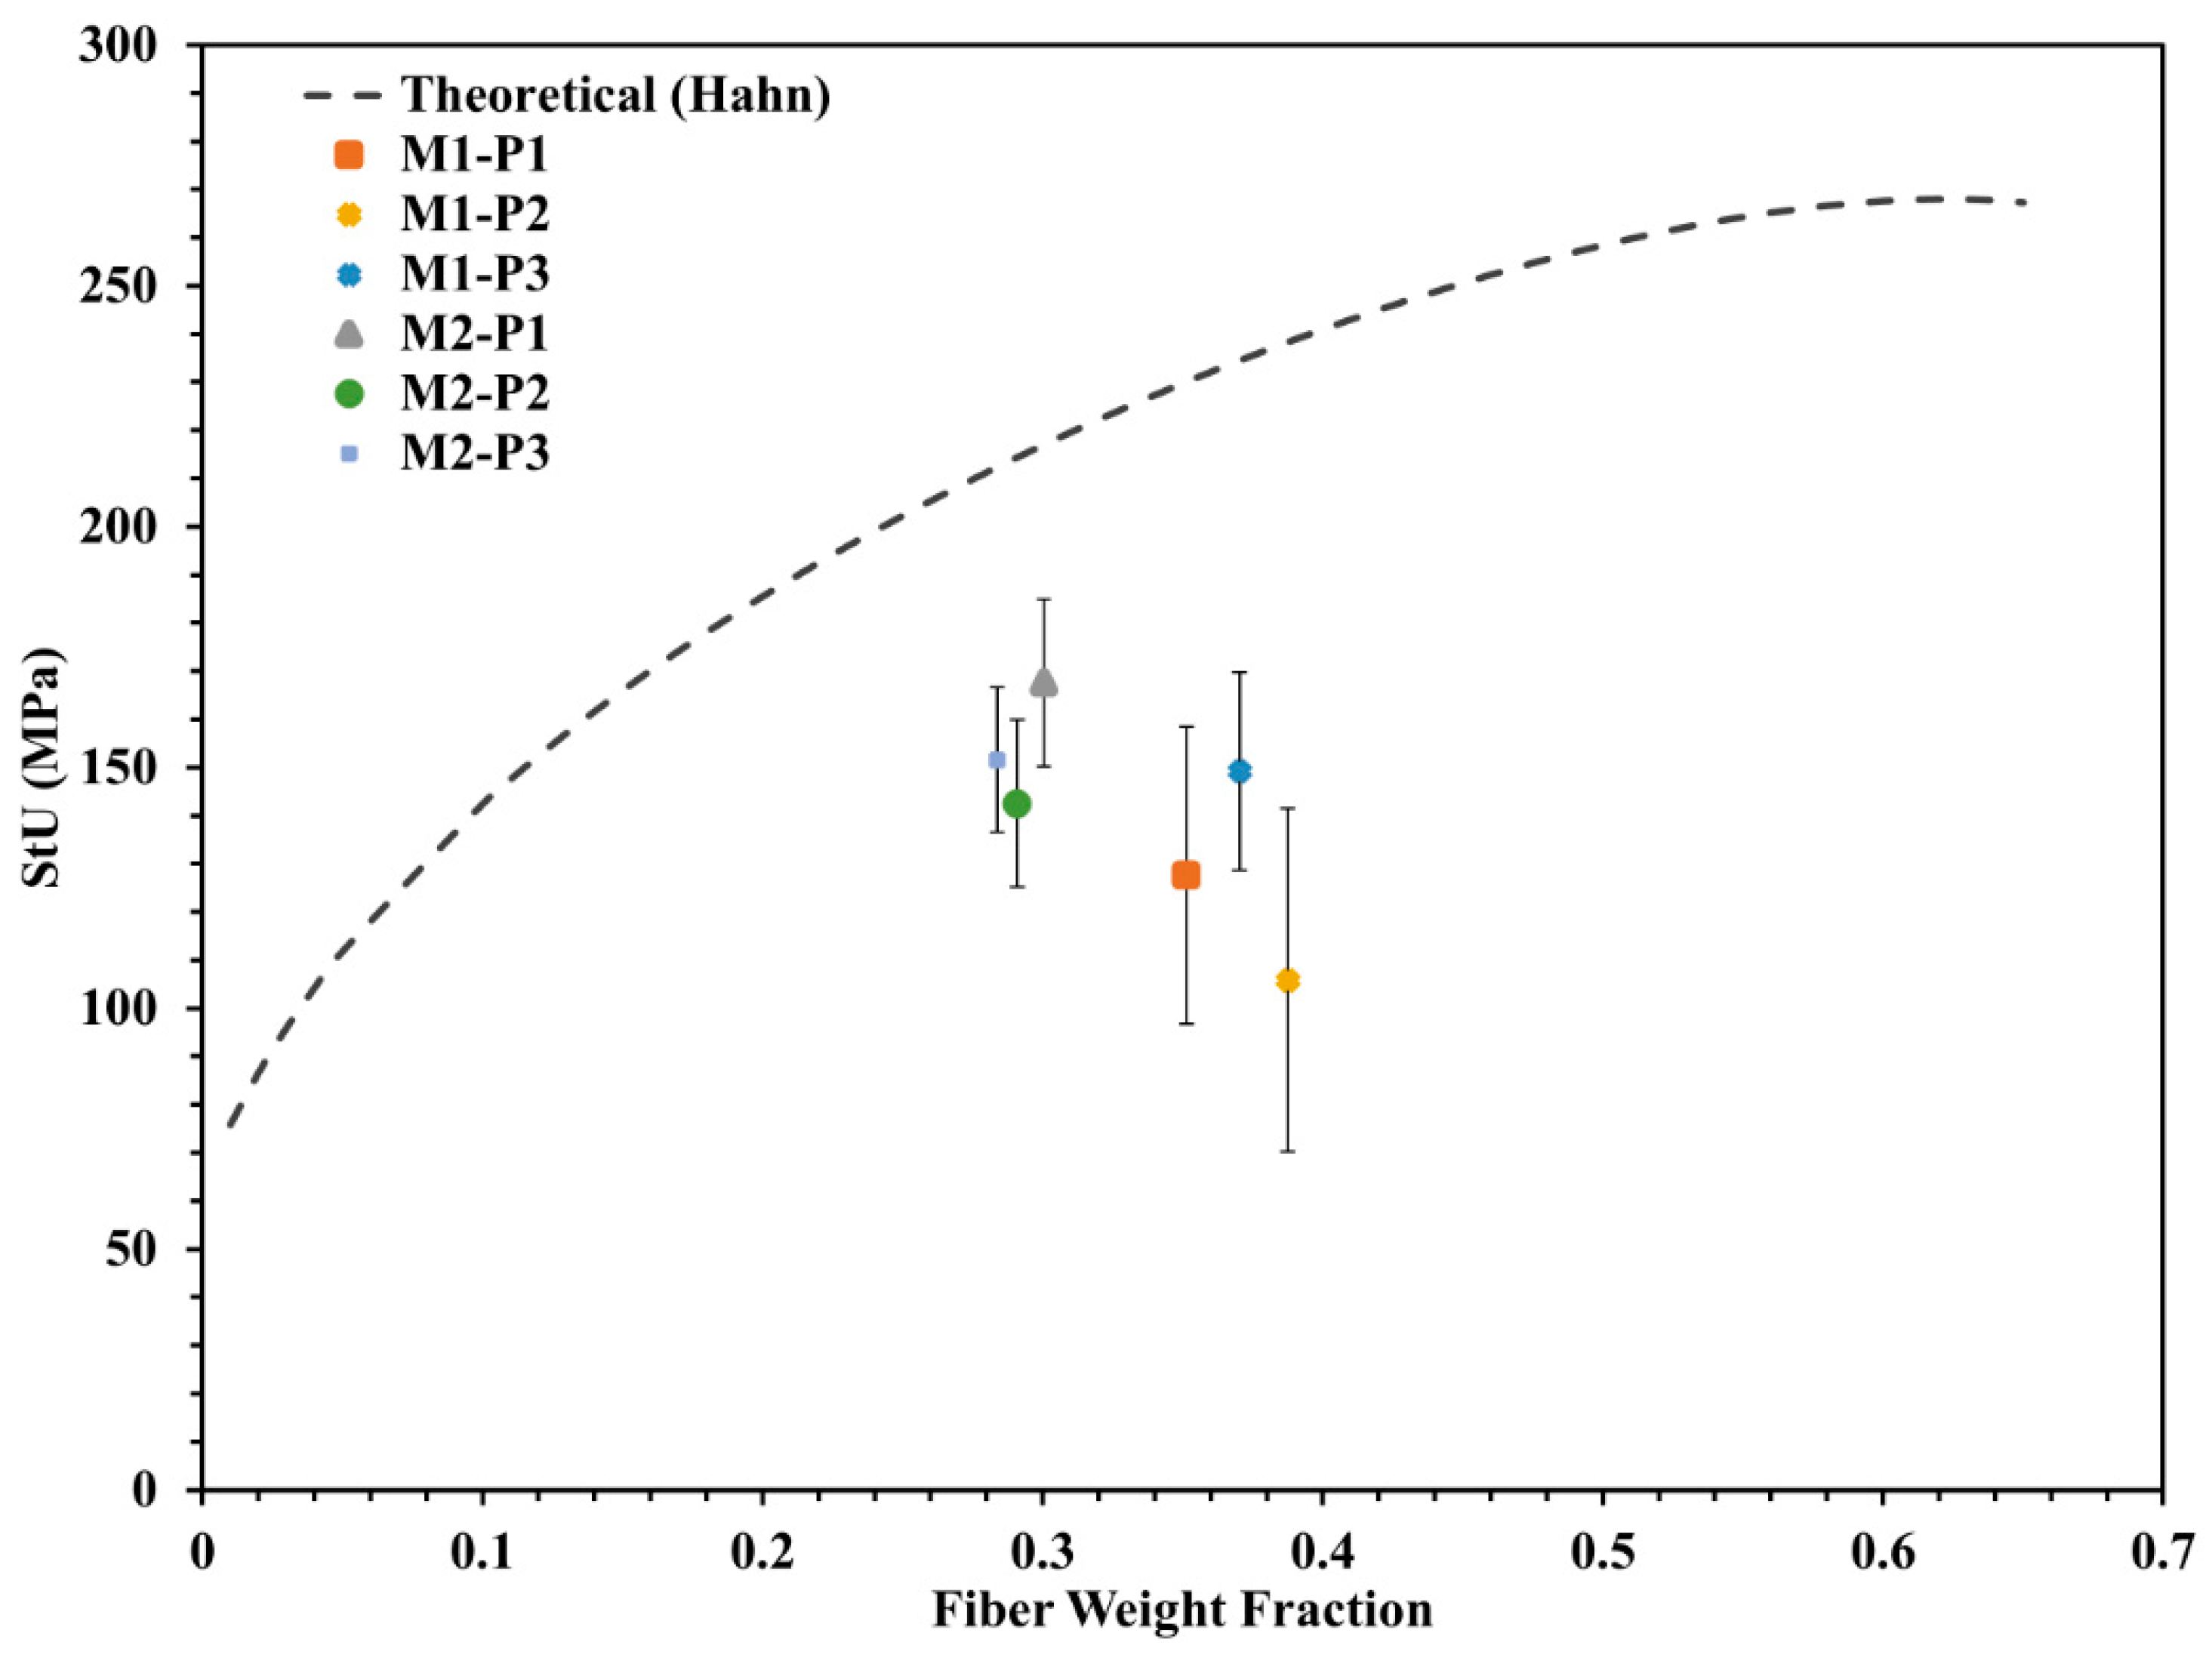
| Plate | Wf% | EExperimental (GPa) | STDE (GPa) | ETheoretical (GPa) | % Out of Theoretical | σExperimental (MPa) | STDE (MPa) | σTheoretical (MPa) | % Out of Theoretical |
|---|---|---|---|---|---|---|---|---|---|
| M1 P1 | 35 | 22 | 2 | 28 | 77 | 128 | 31 | 230 | 56 |
| M1 P2 | 39 | 20 | 3 | 32 | 64 | 106 | 21 | 239 | 44 |
| M1 P3 | 37 | 20 | 7 | 30 | 66 | 149 | 36 | 234 | 64 |
| M2 P1 | 30 | 19 | 3 | 24 | 79 | 168 | 17 | 217 | 77 |
| M2 P2 | 29 | 19 | 3 | 23 | 83 | 141 | 19 | 214 | 66 |
| M2 P3 | 28 | 20 | 2 | 23 | 88 | 152 | 15 | 211 | 72 |
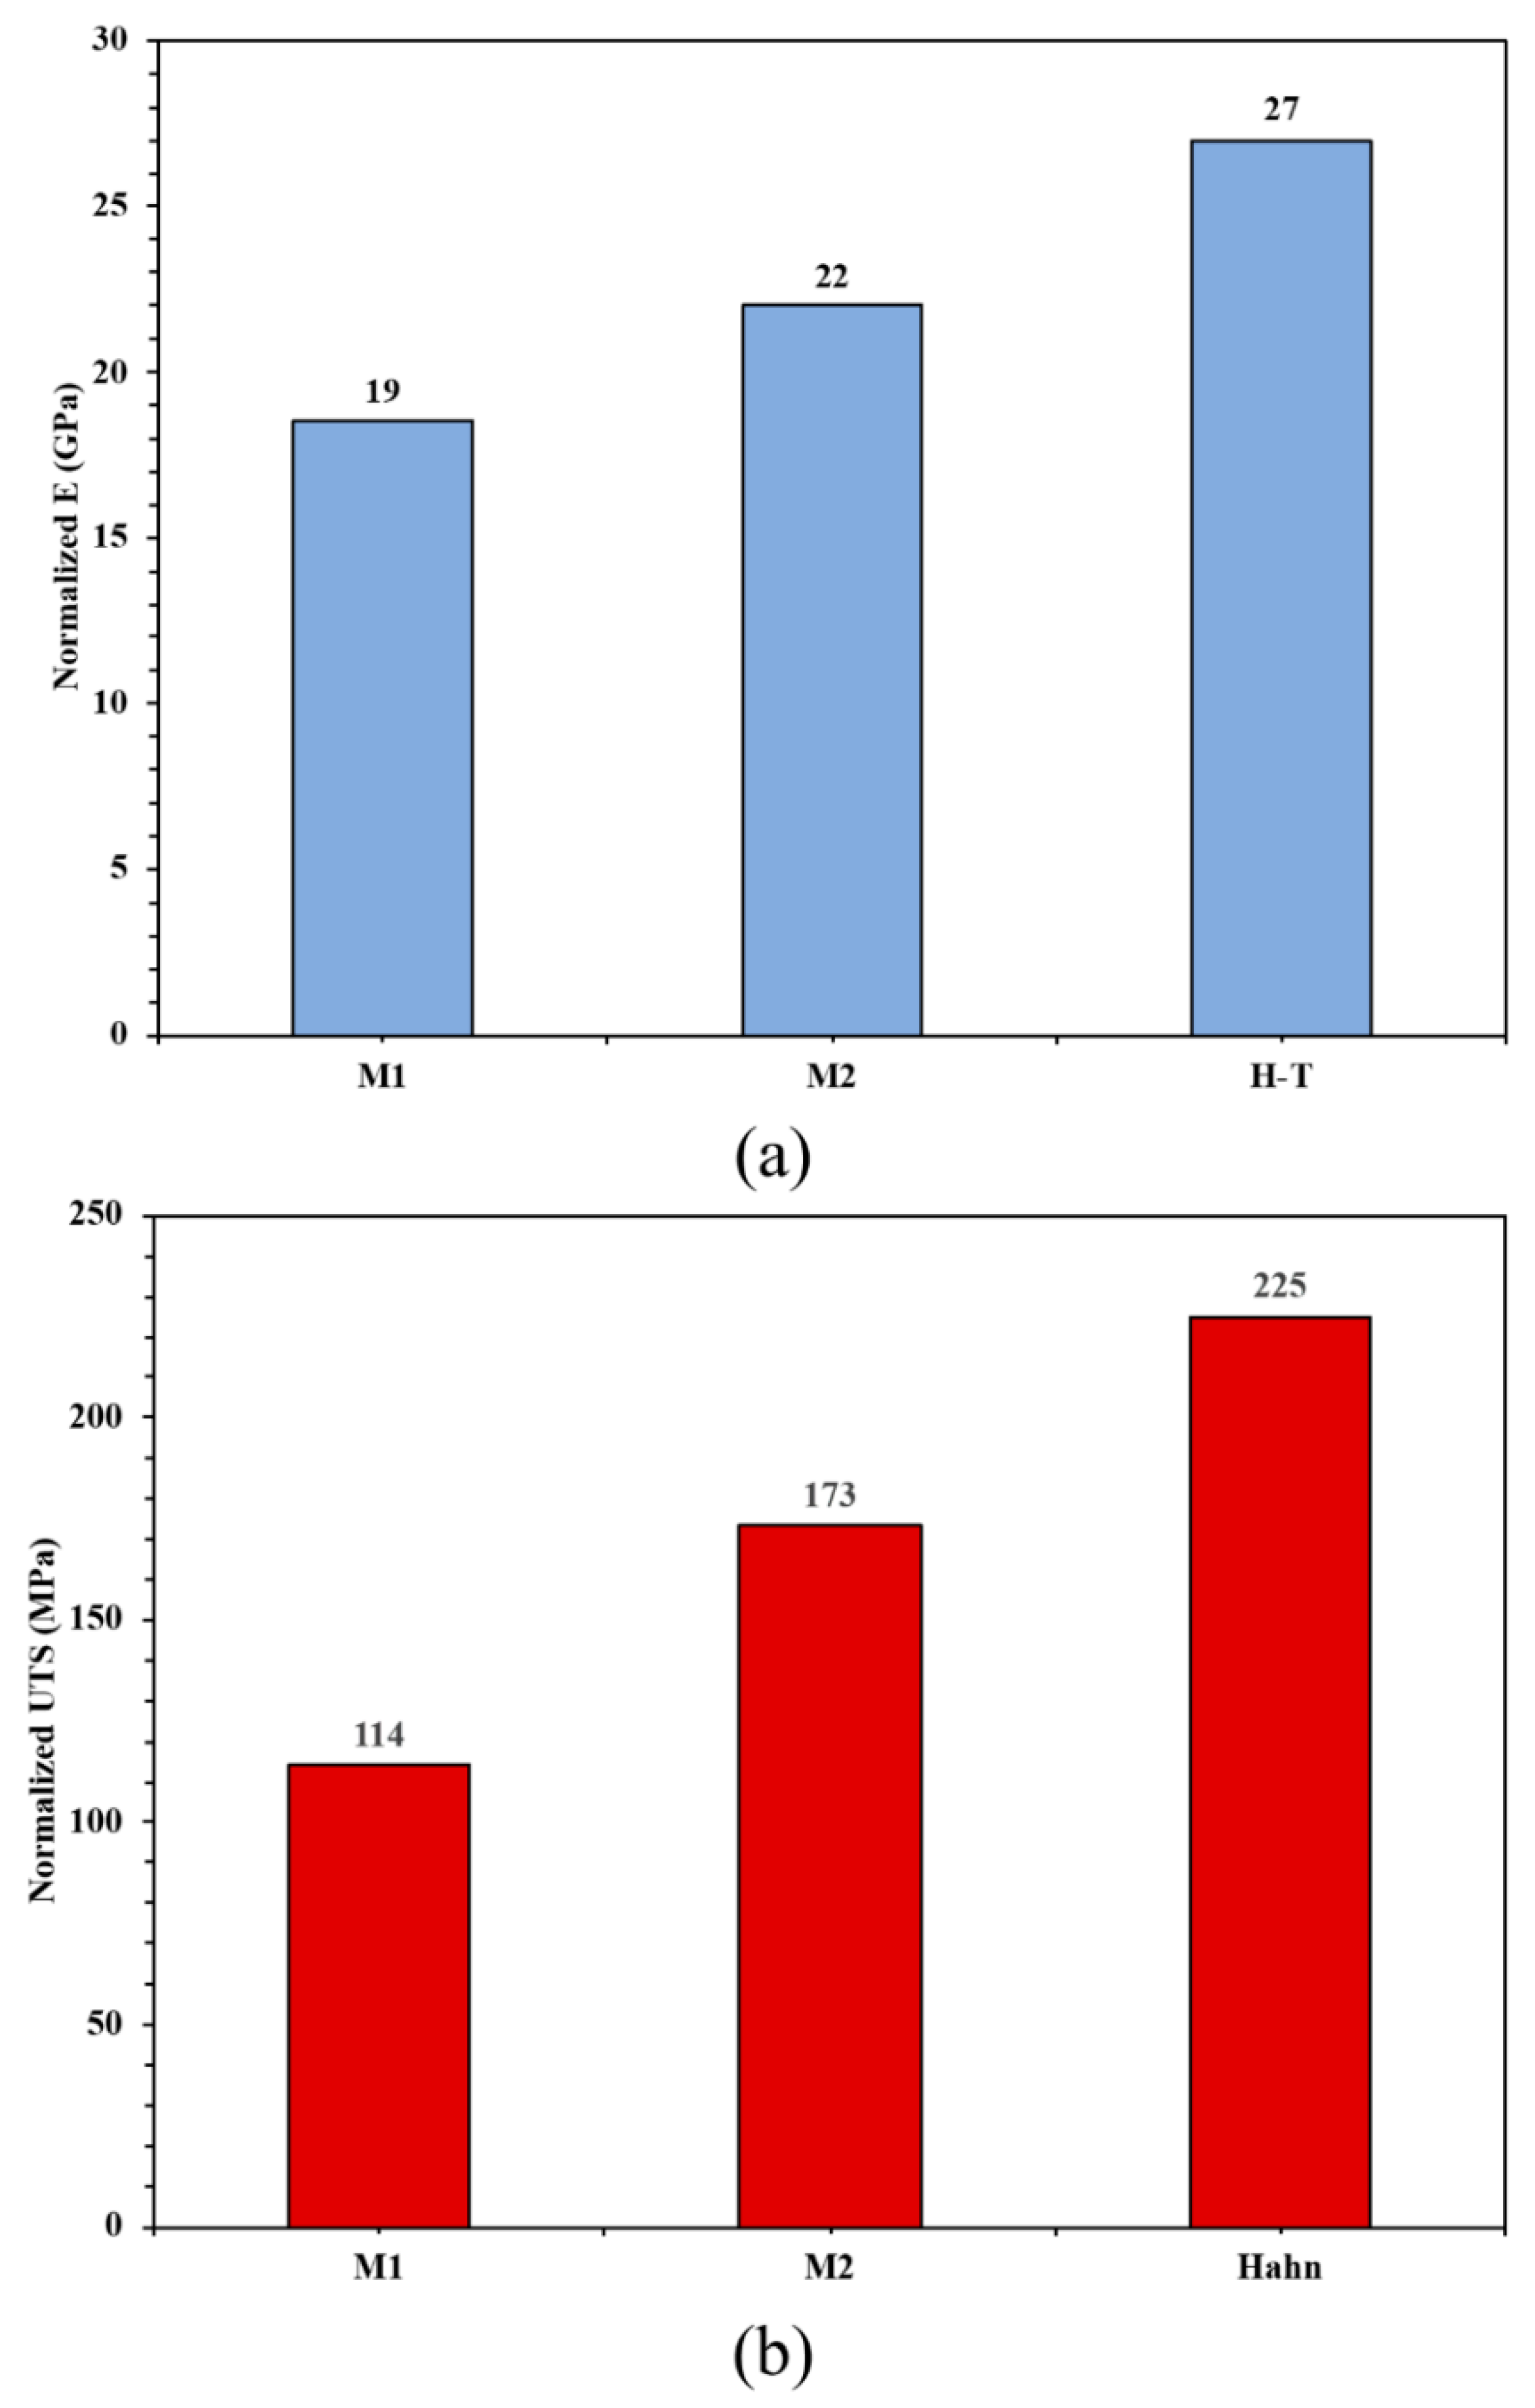
| Method | Wf% Average | EExperimental (GPa) | ETheoretical (GPa) | % Out of Theoretical | σExperimental (MPa) | σTheoretical (MPa) | % Out of Theoretical |
|---|---|---|---|---|---|---|---|
| M1 | 33 | 19 | 27 | 71 | 114 | 225 | 51 |
| M2 | 33 | 22 | 27 | 83 | 173 | 225 | 77 |
| Plate | Wf% | Flex Modulus (GPa) | STDE (GPa) | STDE (%) | Flex Strength (MPa) | STDE (MPa) | STDE (%) |
|---|---|---|---|---|---|---|---|
| M1 P1 | 35 | 14 | 6 | 46 | 252 | 85 | 34 |
| M1 P2 | 39 | 13 | 3 | 25 | 242 | 43 | 18 |
| M1 P3 | 37 | 13 | 3 | 22 | 241 | 43 | 18 |
| M2 P1 | 30 | 12 | 1 | 6 | 243 | 23 | 10 |
| M2 P2 | 29 | 12 | 2 | 17 | 239 | 38 | 16 |
| M2 P3 | 28 | 12 | 1 | 11 | 234 | 22 | 10 |
| Method | Wf% | Flex Modulus (GPa) | Flex Strength (MPa) |
|---|---|---|---|
| M1 | 33 | 12 | 219 |
| M2 | 33 | 14 | 270 |
| Plate | Wf% | ILSS (MPa) | STDE (MPa) | STDE% |
|---|---|---|---|---|
| M1-P1 | 35 | 16.44 | 5.62 | 34 |
| M1-P2 | 39 | 21.39 | 3.46 | 16 |
| M1-P3 | 37 | 23.24 | 5.63 | 24 |
| M2-P1 | 30 | 31.92 | 2.41 | 8 |
| M2-P2 | 29 | 30.87 | 2.05 | 7 |
| M2-P3 | 28 | 25.91 | 1.58 | 6 |
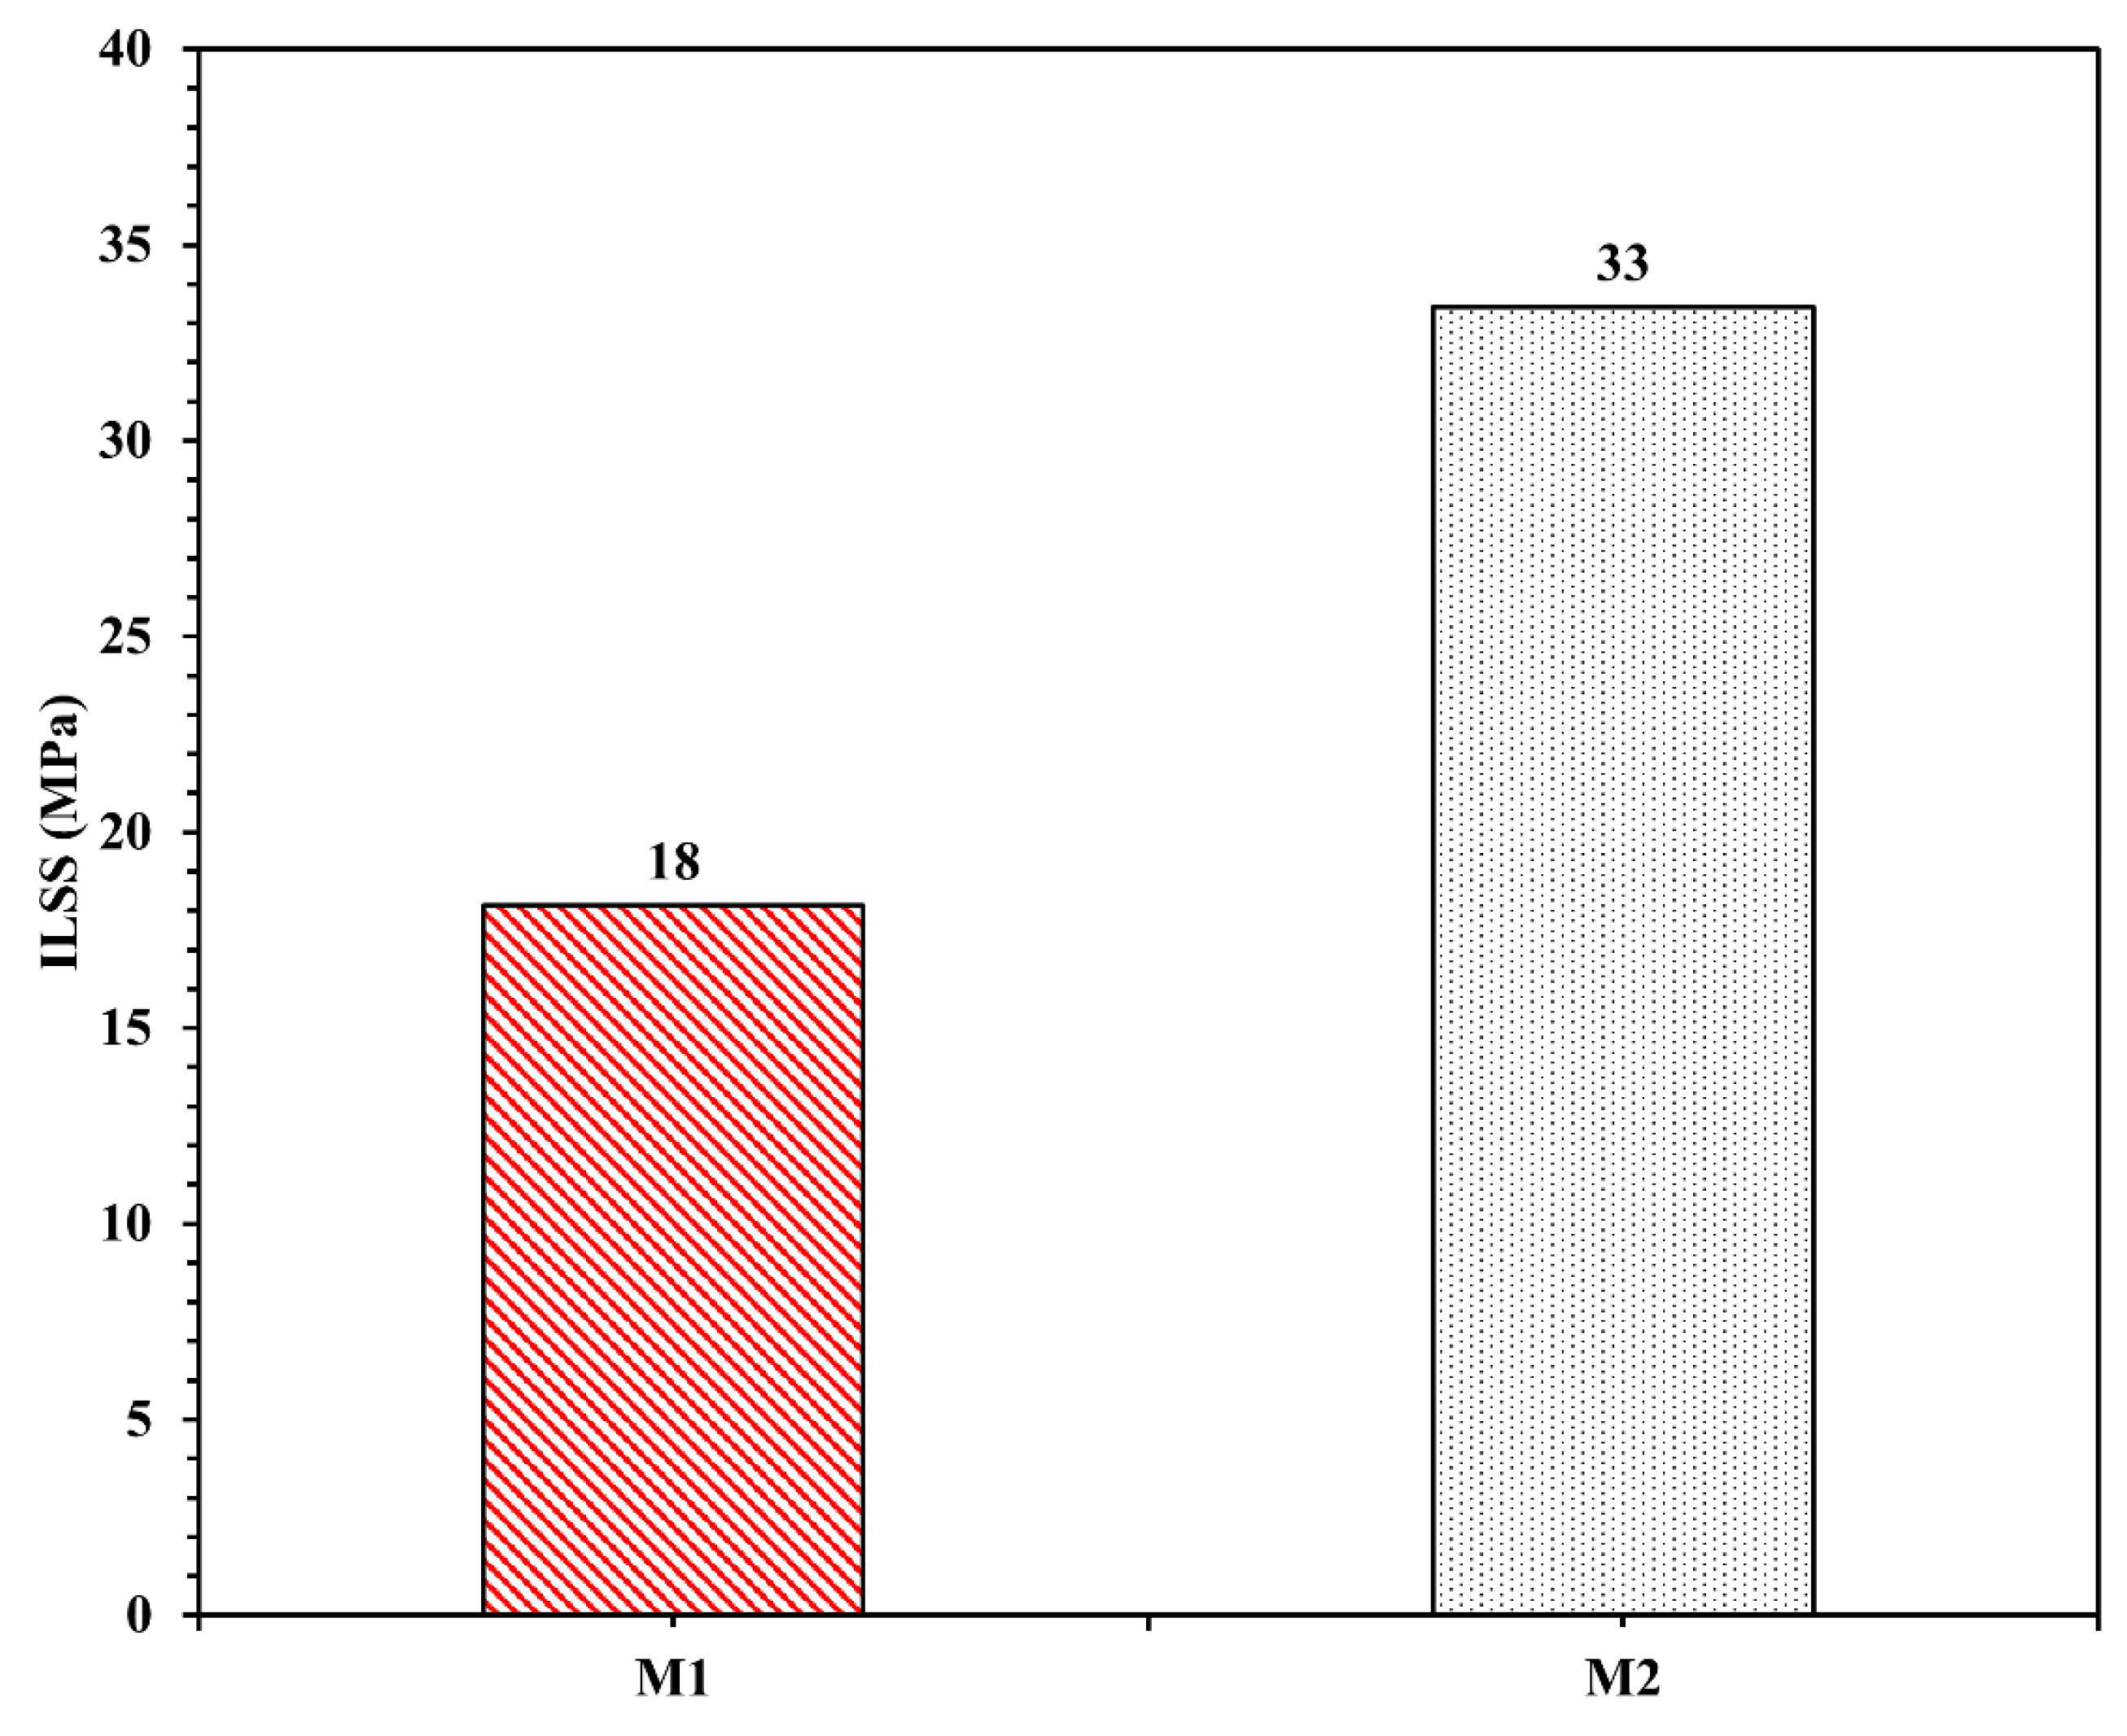
| Plates | Wf% | Normalized ILSS (MPa) |
|---|---|---|
| M1 | 33 | 18 |
| M2 | 33 | 33 |
© 2020 by the authors. Licensee MDPI, Basel, Switzerland. This article is an open access article distributed under the terms and conditions of the Creative Commons Attribution (CC BY) license (http://creativecommons.org/licenses/by/4.0/).
Share and Cite
Ghossein, H.; Hassen, A.A.; Kim, S.; Ault, J.; Vaidya, U.K. Characterization of Mechanical Performance of Composites Fabricated Using Innovative Carbon Fiber Wet Laid Process. J. Compos. Sci. 2020, 4, 124. https://doi.org/10.3390/jcs4030124
Ghossein H, Hassen AA, Kim S, Ault J, Vaidya UK. Characterization of Mechanical Performance of Composites Fabricated Using Innovative Carbon Fiber Wet Laid Process. Journal of Composites Science. 2020; 4(3):124. https://doi.org/10.3390/jcs4030124
Chicago/Turabian StyleGhossein, Hicham, Ahmed Arabi Hassen, Seokpum Kim, Jesse Ault, and Uday K. Vaidya. 2020. "Characterization of Mechanical Performance of Composites Fabricated Using Innovative Carbon Fiber Wet Laid Process" Journal of Composites Science 4, no. 3: 124. https://doi.org/10.3390/jcs4030124
APA StyleGhossein, H., Hassen, A. A., Kim, S., Ault, J., & Vaidya, U. K. (2020). Characterization of Mechanical Performance of Composites Fabricated Using Innovative Carbon Fiber Wet Laid Process. Journal of Composites Science, 4(3), 124. https://doi.org/10.3390/jcs4030124