Article

Highly Crystalline Ordered Cu-dopedTiO2Nanostructure by Paper Templated Method: Hydrogen Production and Dye Degradation under Natural Sunlight

1
Centre for Materials for Electronics Technology (C-MET), Ministry of Electronics and Information Technology (MeitY), Government of India, Panchawati off Pashan Road, Pune 411008, India
2
Department of Chemistry, BaburaojiGholap College, Sangavi, Pune 411027, India
*
Author to whom correspondence should be addressed.
J. Compos. Sci. 2020, 4(2), 48; https://doi.org/10.3390/jcs4020048
Submission received: 13 March 2020 / Revised: 6 April 2020 / Accepted: 9 April 2020 / Published: 4 May 2020
(This article belongs to the Special Issue Composite Nanostructures for Energy and Environment Applications)

Abstract

:
A highly crystalline ordered Cu-TiO2 nanostructure was synthesized using a simple paper template method using cupric nitrate and titanium isopropoxide as precursors. The structural study by XRD confirmed the formation of highly crystalline anatase phase of Cu-TiO2. The broad diffraction peaks of Cu-TiO2 exhibit the nanocrystalline nature of the product. The optical study by UV-DRS indicated the red shift in absorption wavelength with an increase in Cu doping, i.e., towards the visible region. The FE-SEM and FE-TEM study validated the formation of spherical shaped nanoparticles of Cu-TiO2 having sizes in the range of 20–30 nm. Considering the absorption in the visible region, the photocatalytic study was performed for water splitting and rhodamine-B (RhB) dye degradation under natural sunlight. The 2% Cu-doped TiO2 showed the highest photocatalytic hydrogen evolution, i.e., 1400 µmol·g−1·h−1 from water, among the prepared compositions. The photocatalytic performance of Cu-TiO2 conferred complete degradation of RhB dye within 40 min. The higher activity in both cases was attributed to the formation of highly crystalline ordered nanostructure of Cu-doped TiO2. This synthesis approach has potential to prepare other highly crystalline ordered nanostructured semiconductors for different applications.

Graphical Abstract

1. Introduction

Visible light heterogeneous photocatalysis over semiconductor nanostructures has received enormous attention in the last couple of decades. The major applications of this technique are inenergy generation and environmental remediation [1]. Photocatalytic H2 generation via water splitting under solar light can provide an alternative source for hydrocarbon fuel. Further, this technique is treated as an advanced oxidative process and has capability to degrade many organic as well as inorganic compounds [2,3]. The effluents from the textile industries are the main source of water pollution containing hazardous dye molecules [4].There is a need to develop cost effective techniques for the removal of these dyes from water. [5]. Hence, the development of semiconductor oxide catalysts for photocatalytic H2 production and dye degradation has importance.
The discovery of photoelectrochemical water splitting, using TiO2 as an anode, by Fujishima and Honda in 1972, opened a new path for research [6]. Since then, enormous efforts have been taken to enhance the photocatalytic efficacy of H2 generation via water splitting. Among all the studied semiconductor materials, titanium dioxide (TiO2) is widely used owing to its low cost, excellent chemical and biological stability and an environmentally sound nature. However, it has a wide band gap (3.0–3.2 eV) and is a UV active catalyst [7,8,9]. Hence bandgap tuning to the visible region is necessary. In view of this, researchers have triednoble metal loading [10], (viz., Pt [11], Pd [12], and Au [13],) on semiconductor oxides/sulfides as a co-catalyst to improve the hydrogen production [14].
Further, to utilize the visible spectrum of solar light, band gap tuning has also been carried out by doping different anions and cations in the existing semiconductors [15,16,17]. Anions such as B [18], C-N [19], P [20], S [21], and I [22] have been doped in the semiconductors. The effect of anion doping results in the narrowing of semiconductor band gap due to overlapping of 2p states of anion being slightly higher than the O2p states. This allows low energy photons to be absorbed and easily promotes the electrons from valence band (VB) to conduction band (CB) [23].
Furthermore, for improving catalytic activity, transition metal doping with Cr, Fe, Cu, Co, and Ni is inexpensive [24], effective, and thermally stable [25,26]. Transition metal doping is a simple and effective way for broadening of absorption spectra towards visible light. As compared to other metal cation doping, copper (Cu) is a promising dopant due to its availability with variable valence oxidation states (+1, +2), as shown in Equation (1) [27] resulting in higher photocatalytic H2 production.
CuO Cu 2 O Cu
Copper, being cheap, is considered to be a good selection for TiO2 band gap modification [28,29]. Researchers have reported the photocatalytic H2 generation via water splitting using Cu2O and CuO nanosystems [30]. Xi et al. reported that the presence of Cu2O is effective for photocatalytic productionof H2 [31]. It is also reported that the use of CuO is responsible for better separation of photogenerated electrons and holes [9]. Overall, researchers have found that the Cu-doped TiO2 system shows higher performance for photocatalytic hydrogen production [32,33]. Moreover, the structural, morphological, and chemical features of copper strongly affect the H2 generation by photocatalysis. Additionally, different doping methods such as sol-gel [19,32,34,35], hydrothermal [36], impregnation [9], and photodeposition [37] also affect the photoactivity of Cu-doped TiO2.
In this regard, we have reported a novel paper templated method for synthesis of Cu-doped TiO2 nanostructures and investigated its photocatalytic performance towards H2 generation via water splitting and rhodamine-B dye degradation [38]. The synthesized Cu-doped TiO2photocatalyst conferred higher photocatalytic H2 generation in natural solar light as compared to other reported Cu-TiO2 nanostructures.

2. Experimental Section

2.1. Materials

Chemicals and raw materials were used as received without further purification: titanium (IV) tetra isopropoxide (Ti (OCH(CH3)2)4) (ACROS Organics, Thermo Fisher Scientific, Waltham, MA, USA); cupric nitrate (Cu(NO3)2) (Fisher Scientific, Pittsburgh, PA, USA); isopropyl alcohol, (S. D.Fine Chemicals Ltd., Maharashtra, India); and Whatman filter paper 42.

2.2. Synthesis of TiO2 and Cu-TiO2

For the preparation of TiO2 and Cu-TiO2 nanostructures, the paper template method was used. For this purpose, titanium tetra isopropoxide (TTIP) and cupric nitrate (0, 1, 2, and 3 mol% of cupric nitrate with respect to TTIP) were dissolved in isopropyl alcohol separately. After obtaining the clear solution, cupric nitrate was added drop wise totitanium isopropoxide solution till aclear homogeneous mixture was obtained. While stirring, required nitric acid was added to maintain the acidic pH. The same solution was taken into apetri dish andpieces of Whatman filter paper were soaked in the solution. Further, these filter papers were annealed at 500 °C at the rate of 5 °C/min for 6 h. After annealing, the powder was collected and groundin a mortar-pestle. A similar procedure was followed for preparing other Cu-doped TiO2. The Cu-doped with 1, 2, and 3 mol% were labeled as G-1, G-2, G-3 and without Cu as G-0, respectively. Additionally, pure TiO2 and Cu-doped TiO2 were also synthesized without template under similar conditions. The synthesized Cu-TiO2 nanostructures were characterized by various characterization techniques such as XRD, UV-visible-DRS, XPS, FE-SEM, and FE-TEM. The photocatalytic water splitting, for H2 generation and dye degradation were performed using this catalyst.

2.3. Characterization

The properties of the TiO2 and Cu-TiO2 nanostructures were analyzed with X-ray powder diffractometer (XRD, Bruker Advanced D8 system, Karlsruhe, Germany) using Cu Kα radiation in the range of 20–80°. The crystallite size was calculated using Scherrer’sformula
Crystalline   size   ( D ) = 0.9 λ β cos θ
where λ is the incident wavelength, β is full width at half maxima (FWHM), and θ is the angle of reflection [38,39]. The UV-visible absorbance (for liquid) and diffuse reflectance (for solid sample) spectra were recorded using a UV-Visible-NIR spectrophotometer (Shimadzu, model UV-3600, Kyoto, Japan) over a spectral range of 200–800 nm. Photoluminescence (PL) spectroscopy was carried out with a Shimadzu spectrofluorophotometer (RF-5301 PC), with an excitation wavelength of 350 nm. The surface chemical composition along with oxidation states was studied with X-ray photoelectron spectroscopy (XPS, Thermo Fisher Scientific Co., Theta Probe, Waltham, MA, USA). The morphology and microstructure analyses of the prepared TiO2 and Cu-TiO2 nanostructures were studied using field emission scanning electron microscopy (FE-SEM, HITACHI, S-4800, Kyoto, Japan). The microstructural study was carried out using field emission transmission electron microscopy (FE-TEM by JEOL, FS 2200, Kyoto, Japan). Hydrogen evolution was determined using gas chromatography (Shimadzu GC-2014, Shimadzu, Kyoto, Japan).

2.4. PhotocatalyticActivity

2.4.1. Rhodamine B (RhB) Degradation

The photocatalytic performance of TiO2 and Cu-TiO2was investigated by observingthe degradation of rhodamine-B as a model dye. For this purpose, 100 mL of 10 ppm aqueous dye solution was taken in a 250 mL conical flask containing 100 mg of catalyst and stirred under solar light. In order to achieve the adsorption–desorption equilibrium between photocatalyst and dye, the suspension was stirred in dark for 30 min. After keeping the suspension under solar light an appropriate amount of sample was taken at fixed intervals of time and centrifuged, for removal of solid catalyst particles. The sample was analyzed with a UV-visible spectrophotometer. The absorbance value at 555 nm was considered for the calculation of percent RhB dye degradation with irradiation time. The % dye degradation was calculated using the following formula
Dye   degradation % = ( C 0   C t C 0 ) × 100
Where C0 is the initial concentration of the dye solution before the adsorption–desorption equilibrium and Ct is the concentration at time t. The rate constant of the reaction was calculated using the formula ln(C0/Ct) = kapp, where C0 is the initial concentration, Ct is the concentration after exposure to light at time t, and kapp is the apparent rate constant at time t. The slope of the graph of ln(C0/Ct) vs. irradiation time was used for calculating the rate constant (Kapp).

2.4.2. Photocatalytic H2Production

The photocatalytic activity of TiO2 and Cu-TiO2 was studied for H2generation via water splitting, containing methanol as a scavenger. The reaction was carried out in an airtight quartz reactor with water circulation for cooling purpose. For H2 generation reaction, a distilled water (DW) and methanol (CH3OH) solution were stirred; under natural solar light during the month of March-April between 10 am to 3 pm. Solar light intensity was measured by digital lux meter. For examination of photocatalytic activity, 15 mg of photocatalyst was suspended in 20 mL distilled water and5 mL of methanol and 1 wt% Pt was used as a co-catalystfor hydrogen generation.The reaction mixture in quartz reactor was sonicated for 5 min and then stirred for 30 min. The air tight reactor was then purged with N2 gas for 30 min. Before keeping the quartz vessel in natural sunlight, the gas inside the reactor was analyzed using GC. The reactor was kept under natural sun light with a continuous circulation of cold water through the jacket for maintaining a constant temperature. After a regular interval of time, activity of the catalyst was checked by taking a sample from the reactor using an airtight syringe. The sample was analyzed using GC to quantify the amount of H2 generated.

3. Results and Discussion

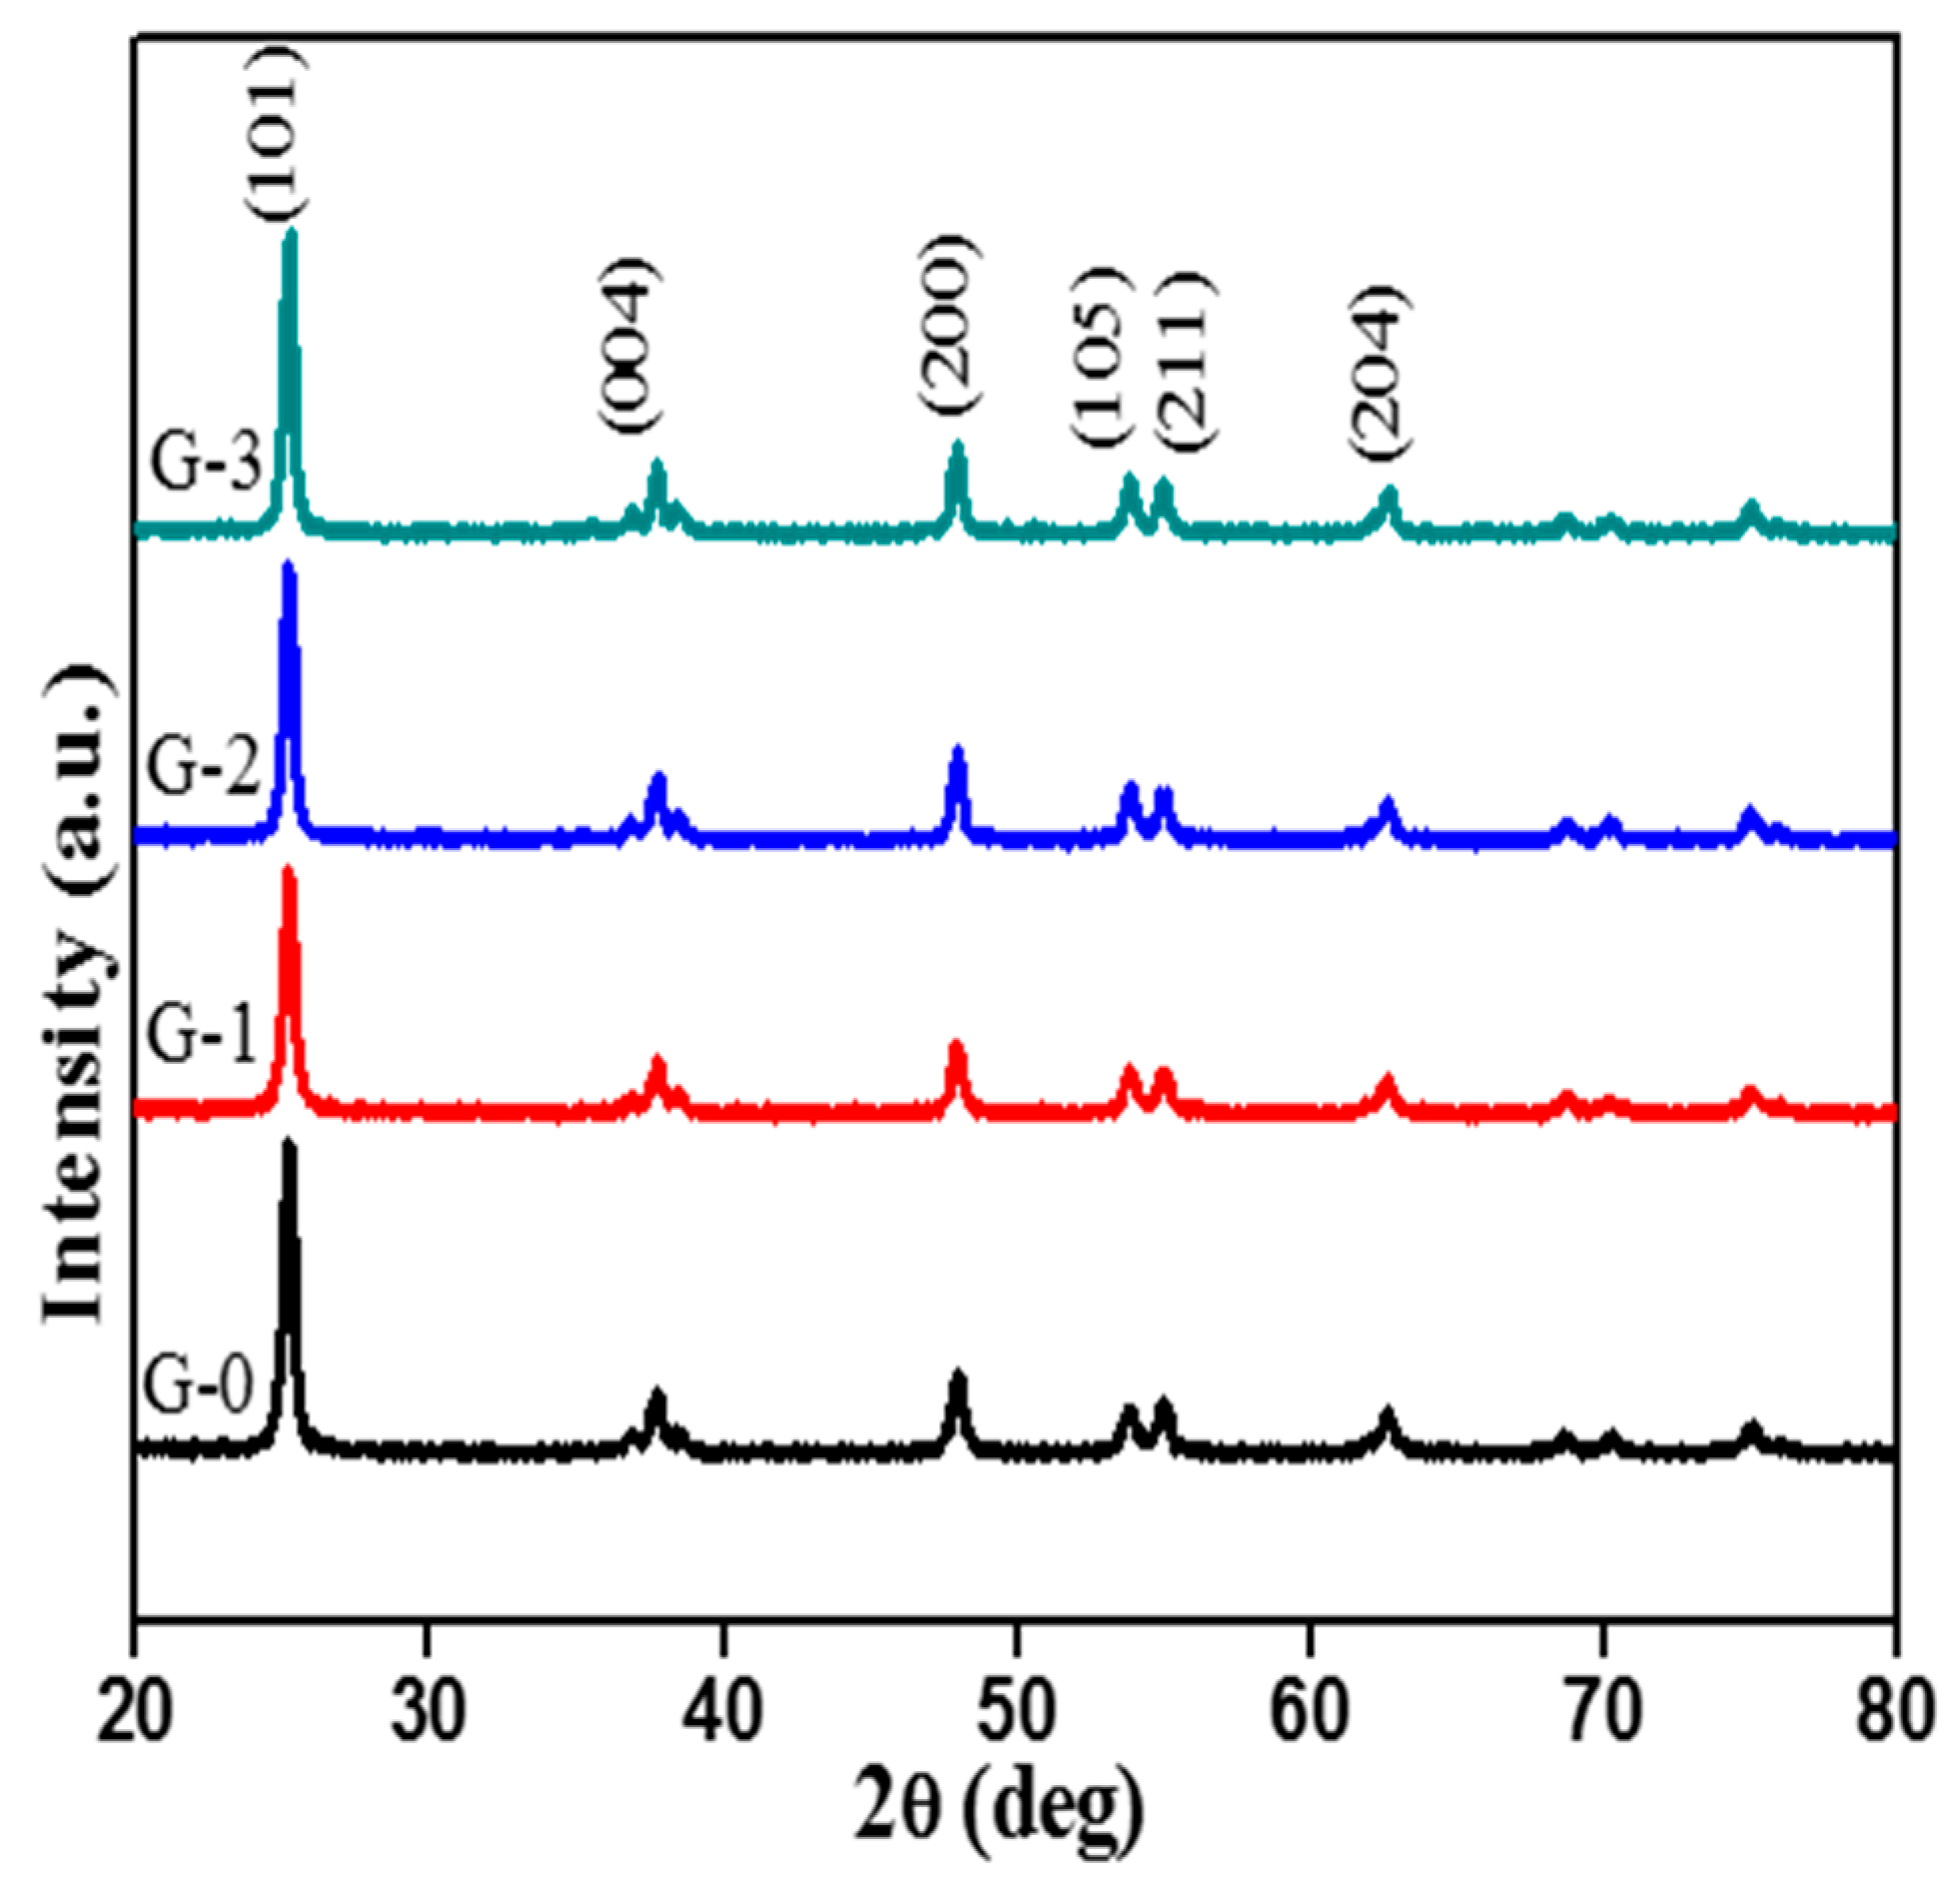
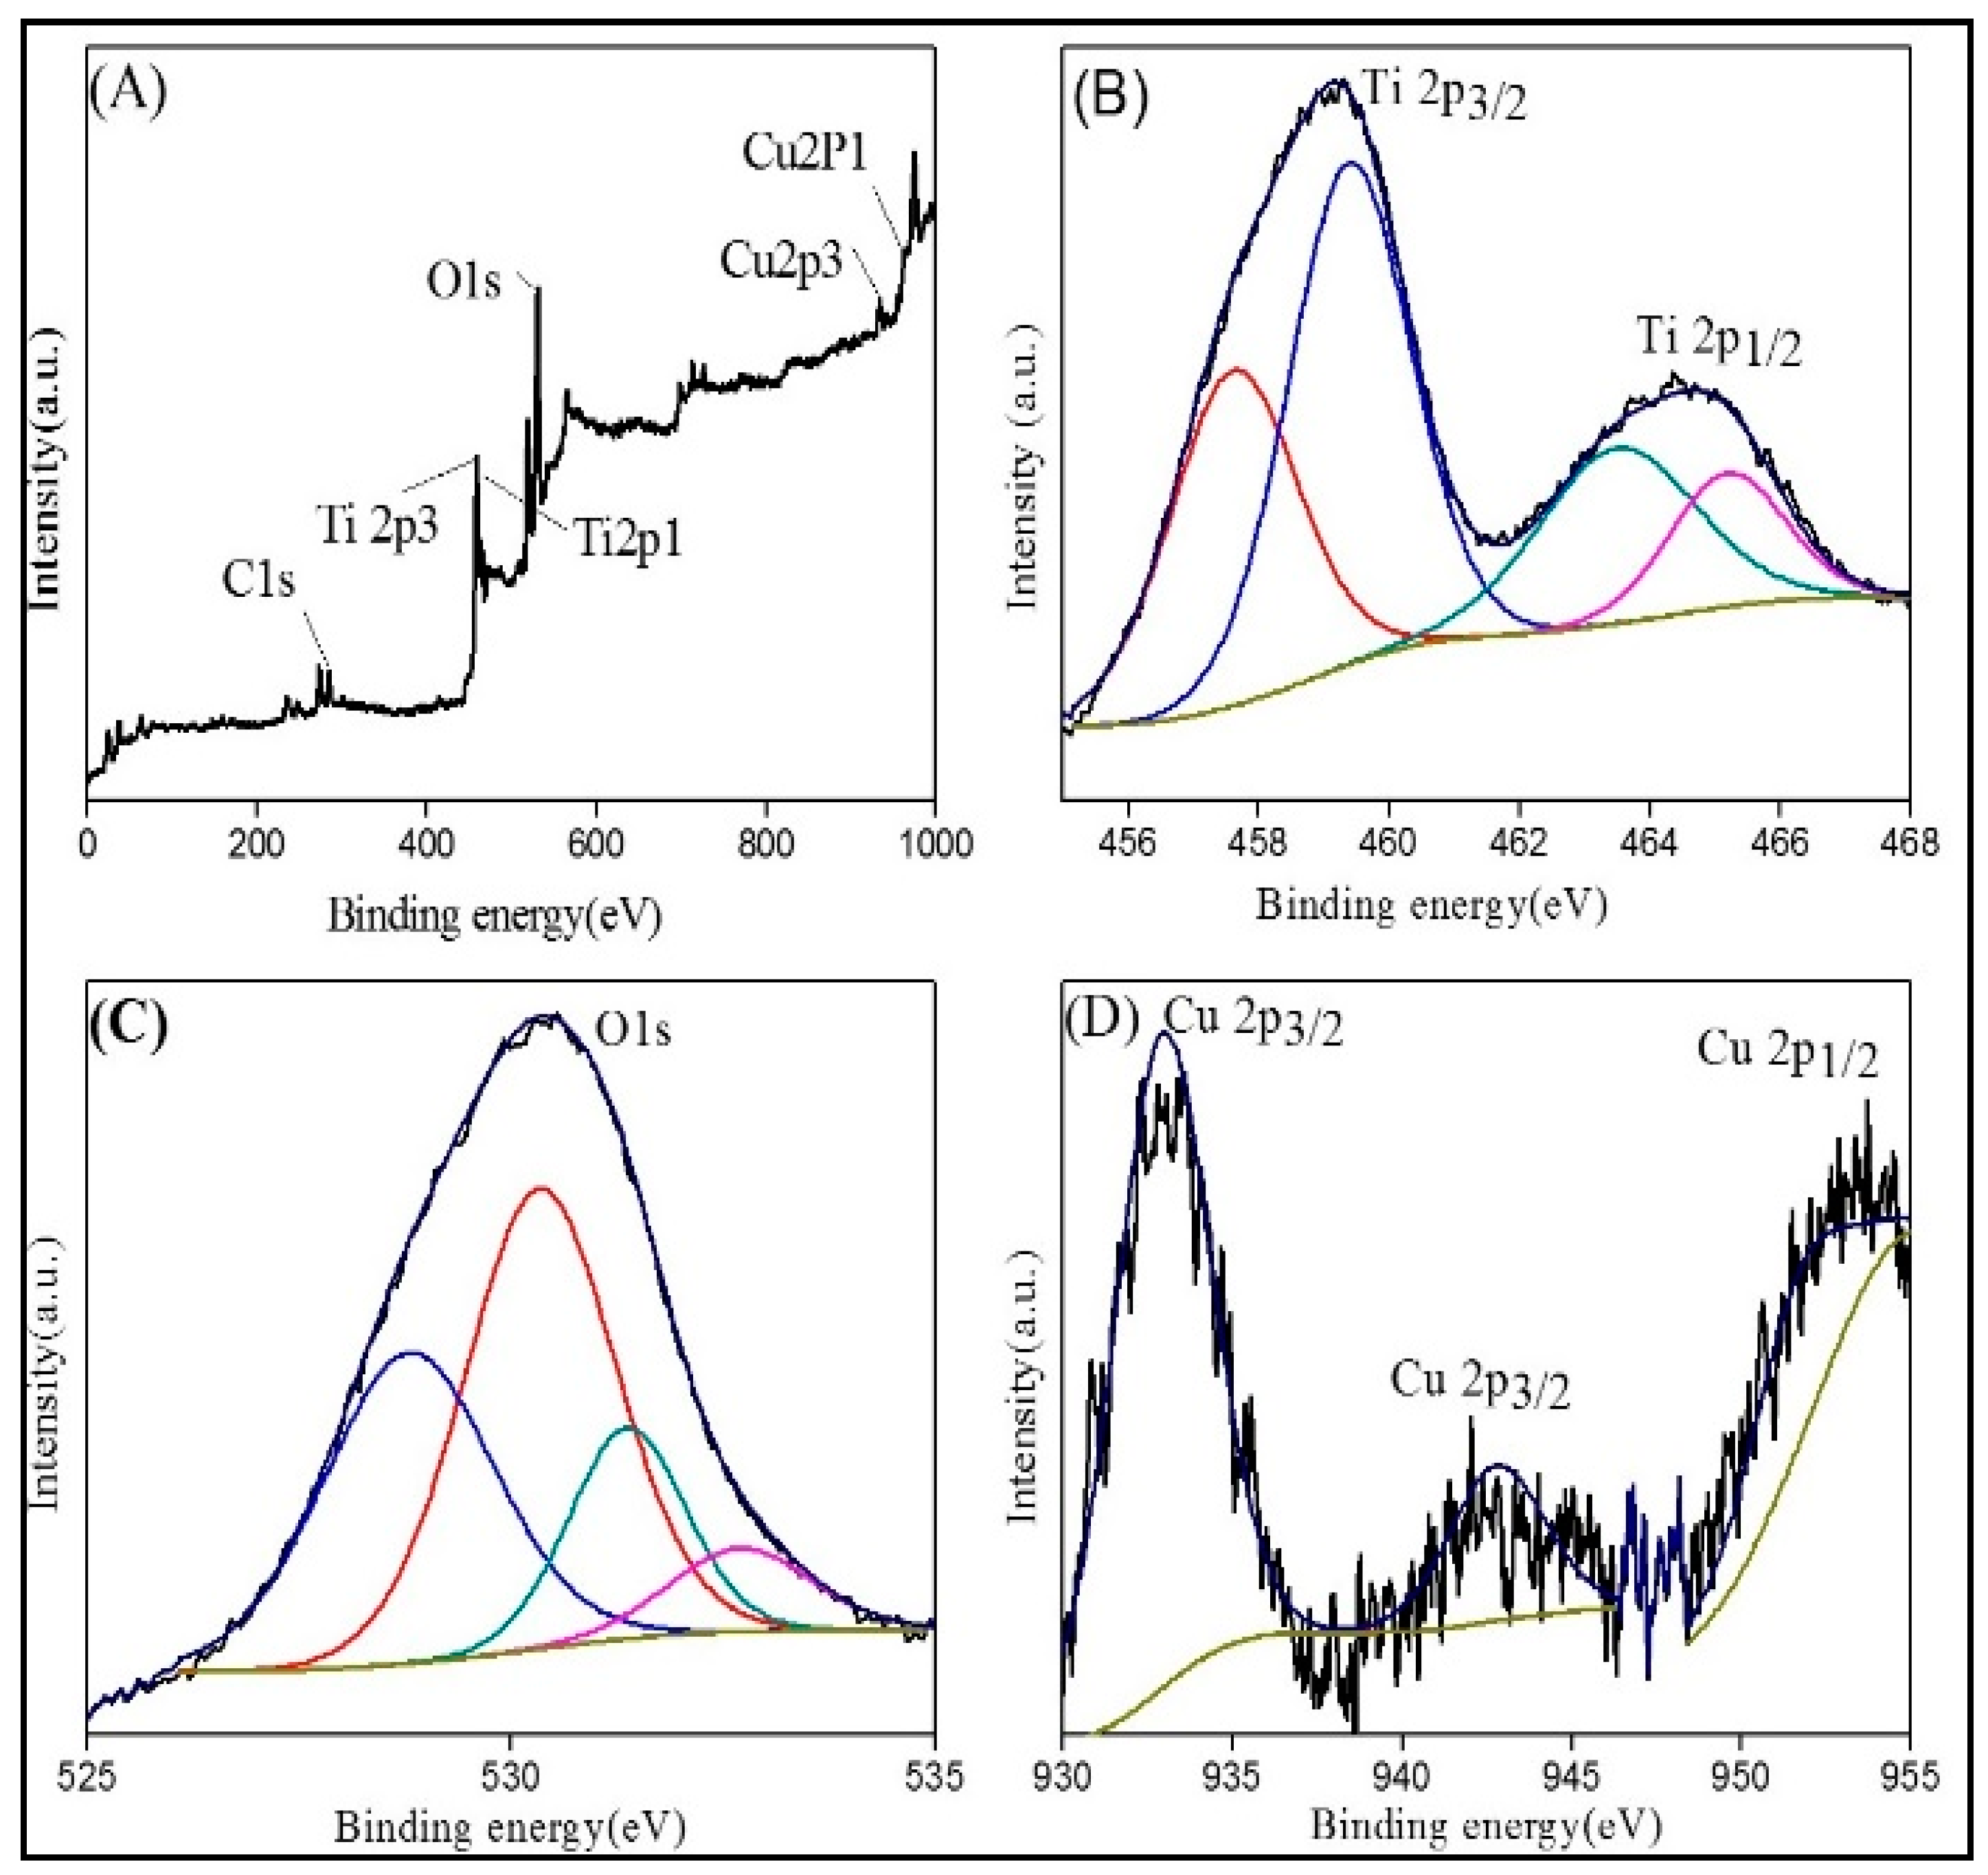
3.1. Structural Study
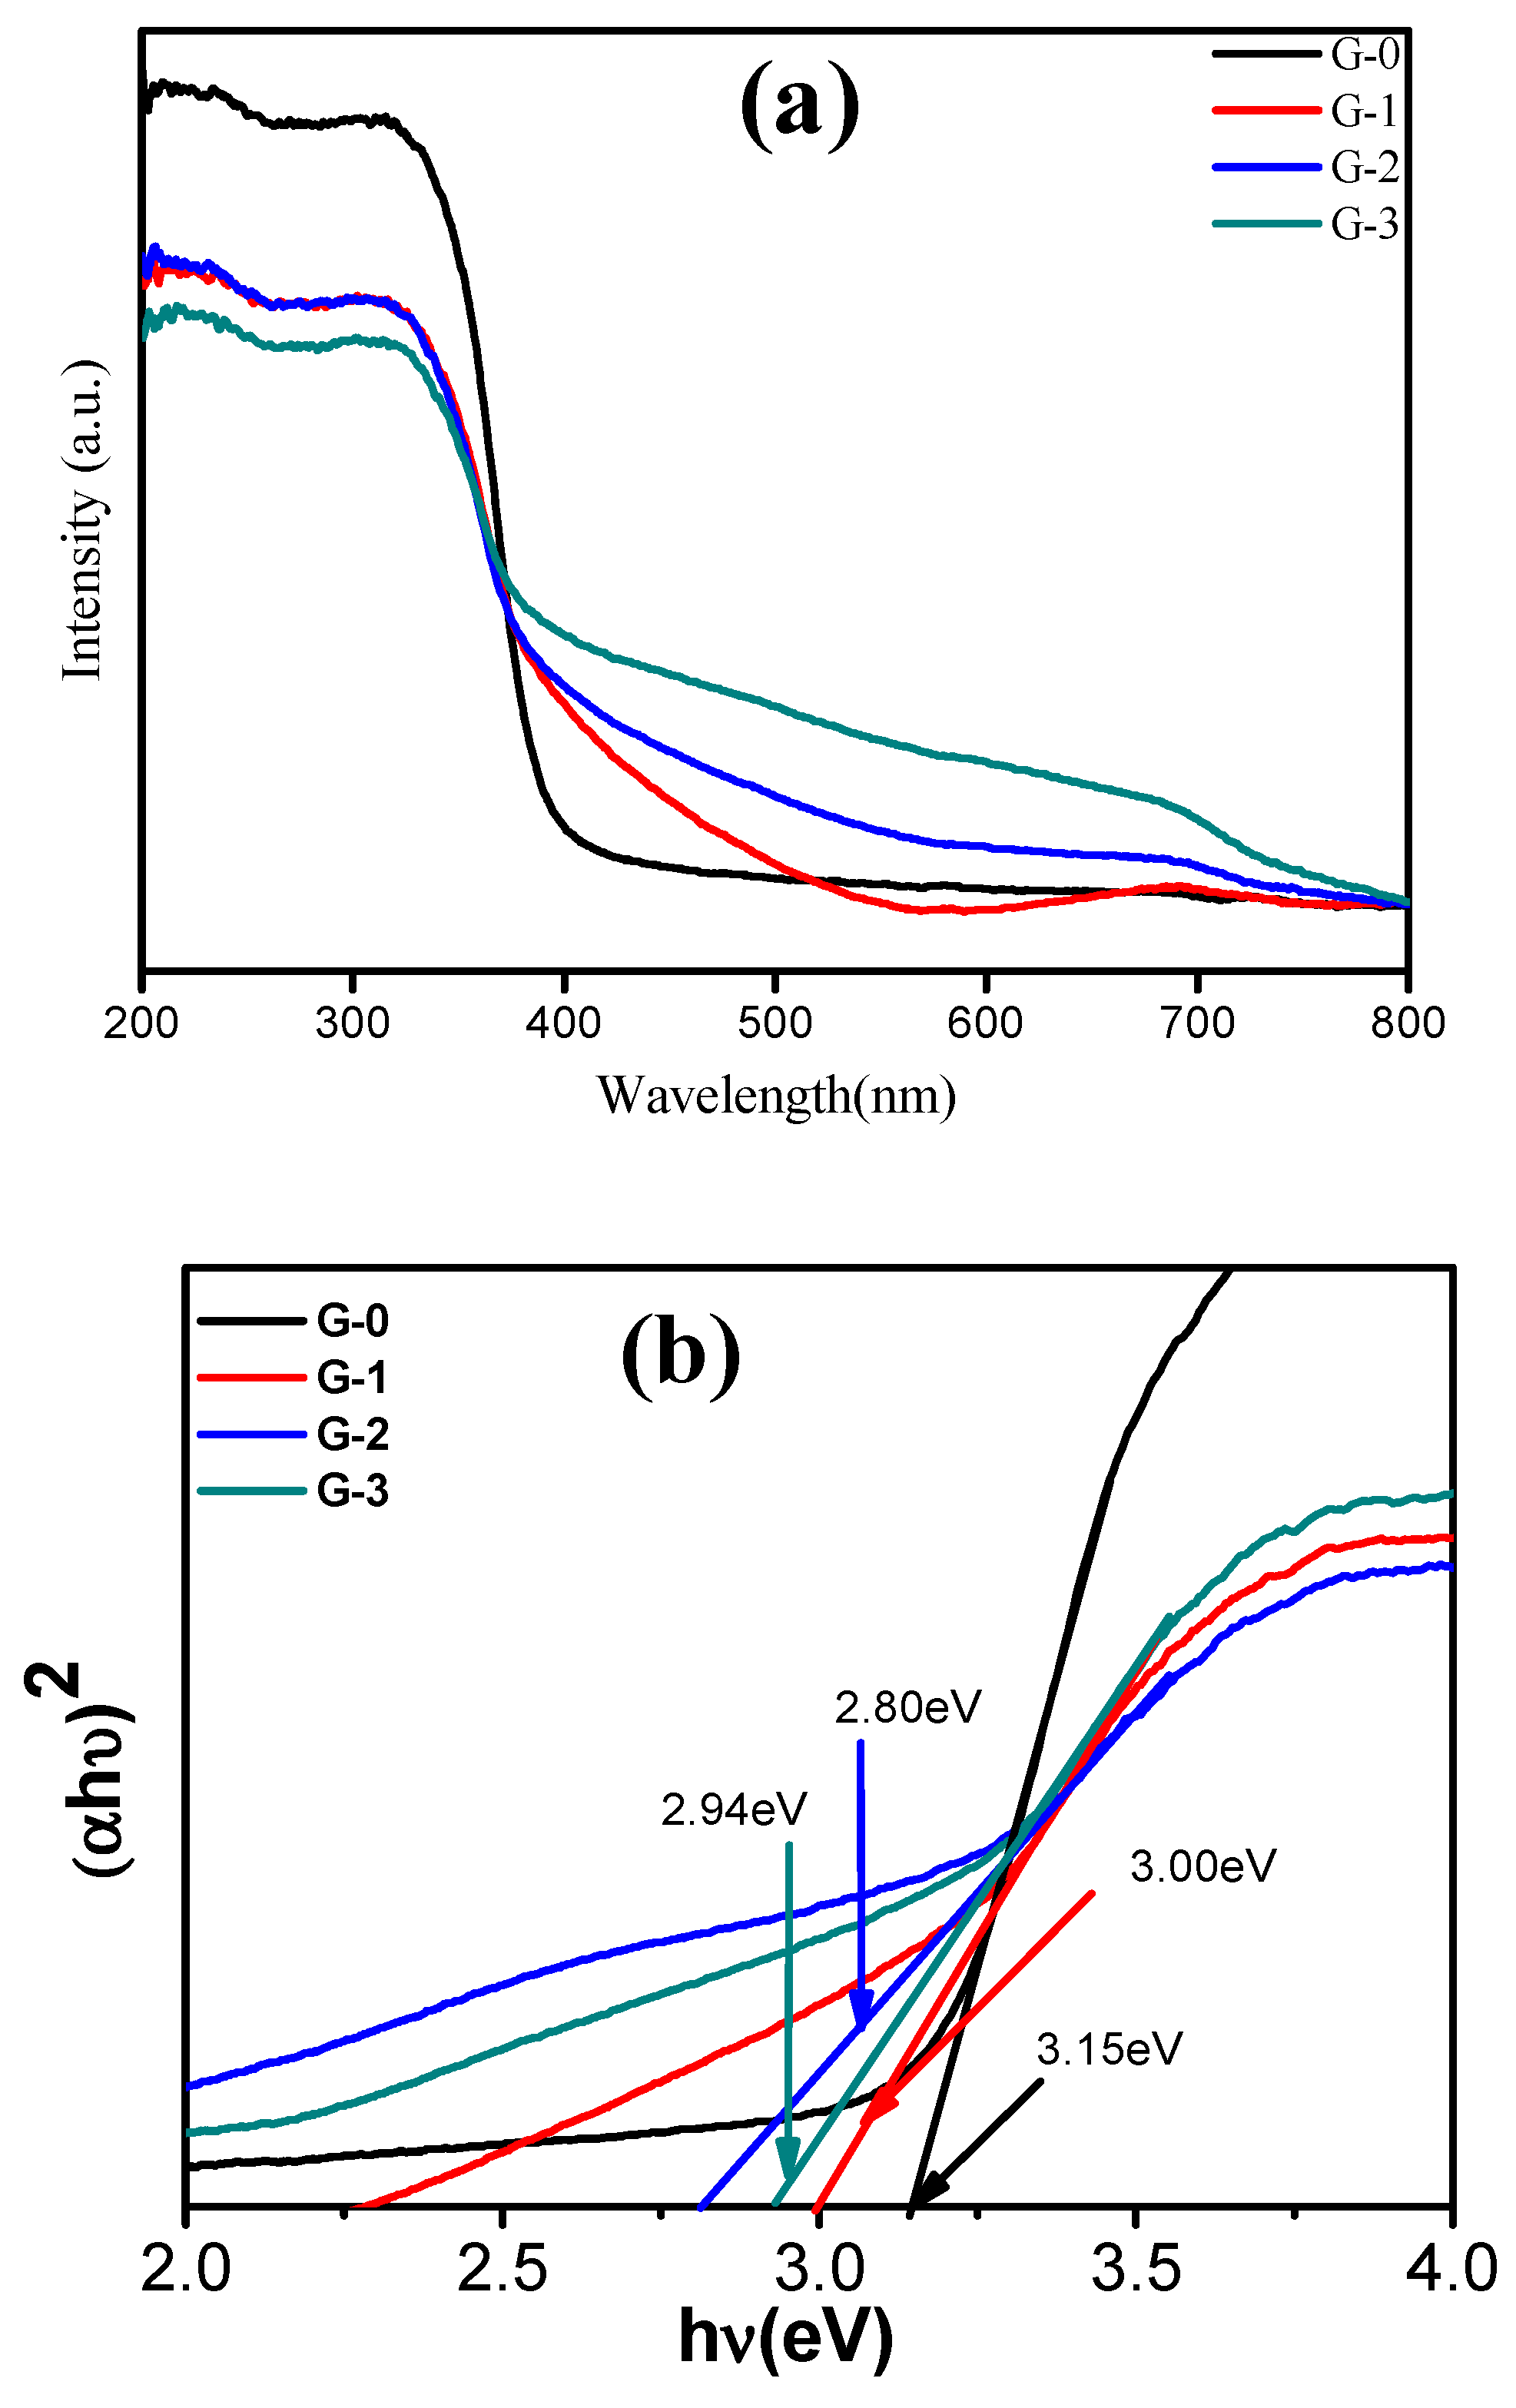
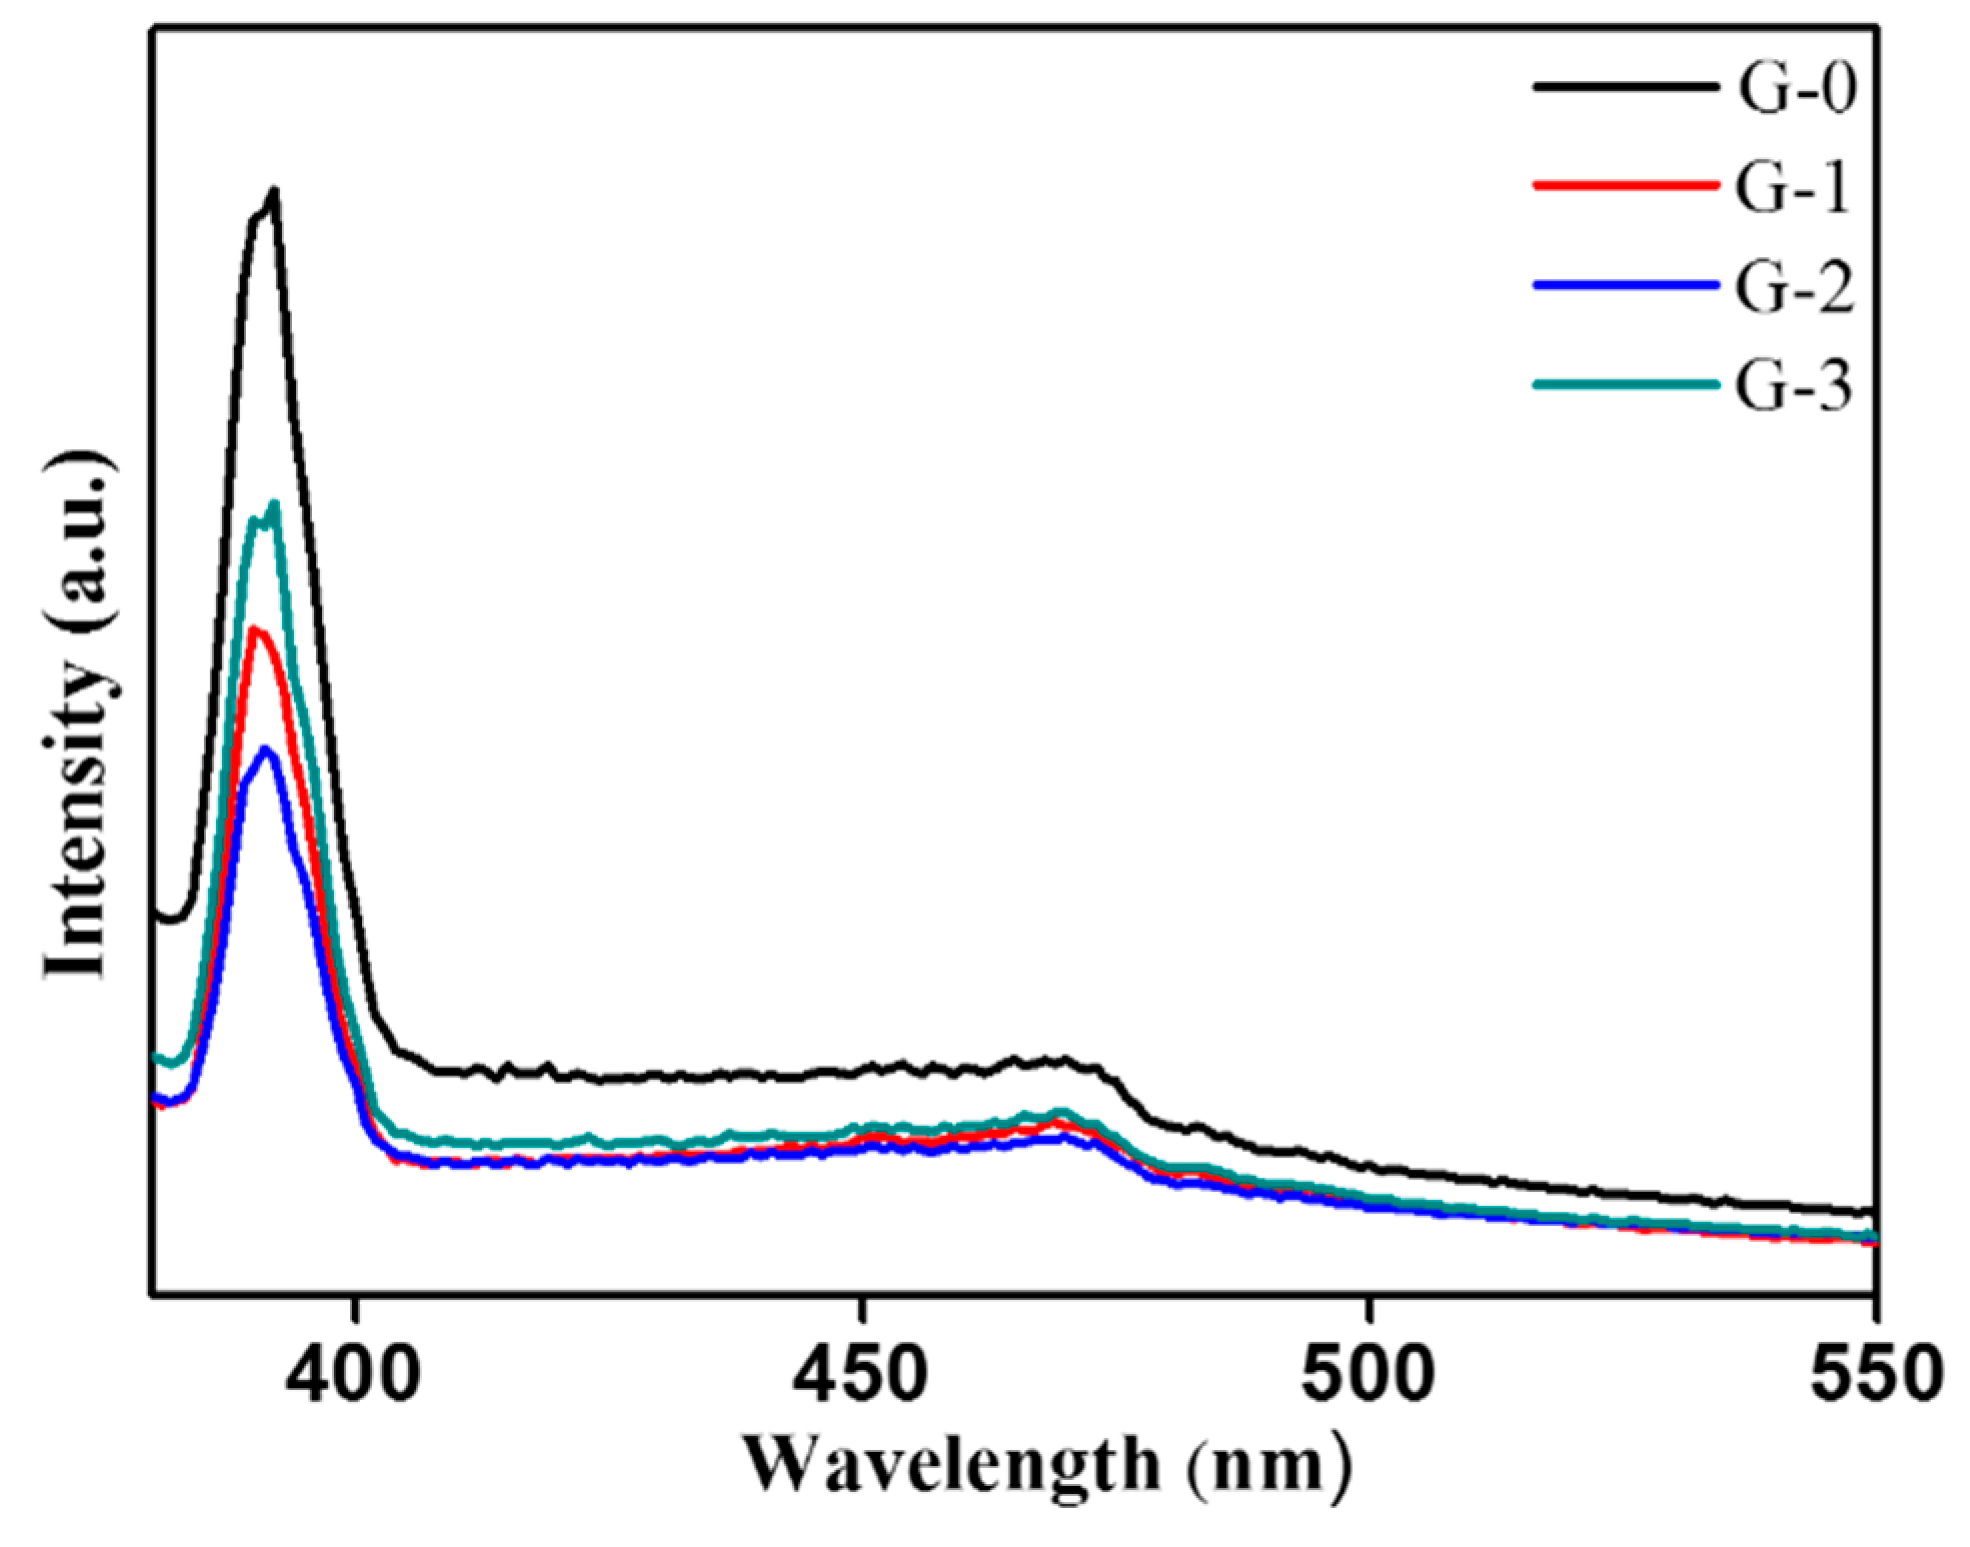
Phase formation and crystallite size were confirmed by X-ray analysis (Figure 1). The diffraction peaks for pure TiO2 and Cu-doped TiO2show the formation of a highly crystalline anatase phase (JCPDS No. 01-021-1272). The 2θ value at 25.27°, 37.69°, 47.98°, 53.76°, 54.99°, and 62.57°were indexed to (101), (004), (200), (105), (211), and (204) planes of anatase TiO2respectively. The diffraction peaks of copper (Cu) were not observed in XRD patterns, which might be due to low concentrations of Cu doping or Cuinducedin TiO2 lattice. The crystallite size was measured by Scherrer’s equation and was observed to be 21.6, 19.43, 22.35, and 23.98 nm, for G-0, G-1, G-2, and G-3 samples, respectively.

3.2. Optical Study

Diffuse reflectance spectra of TiO2 and Cu-doped TiO2are shown in Figure 2. The absorption edge for pure TiO2 (G-0) and Cu-TiO2 (G-1, G-2 and G-3) were observed around 393, 413, 442, and 426 nm, respectively. The band gap values calculated using the Kubelka–Munkfunction were found to be 3.15, 3.00, 2.80, and 2.94 eV, respectively [40]. Figure 2b depicts the Tauc’s plot for band gap calculations. It is observed that G-2 sample (2% Cu-TiO2) hasa band gap of 2.80 eV. Doping of Cu atom substitutes some of the Ti site in the TiO2lattice, which leads to a strong d–p coupling between Cu and O. This leads to an upward movement of O 2p orbital, resulting in reduction of the band gap. Further, Cu 3d orbital forms an impurity band above theTiO2 valence band and causes a reduction in the overall bandgap.
The prepared nanoparticles were analyzed using PL spectroscopy for identification of surface defects which may act as a recombination center for photogenerated electron–hole pairs shown in Figure 3. For PL measurements, 1 mg of sample was dispersed in 10 mL of double distilled water and excition wavelength used was350 nm. The prepared TiO2and Cu-TiO2 nanostructures show a strong emission peak at 391 nm corresponding to band edge emission. A single peak at 391 nm indicates that the material is free from impurities. With a further increase in Cu percentage, the recombination of charge carriers decreased, due to their trapping in the dopant sites [41]. The Cu-doped TiO2 with 2 mol% (G-2) shows the lowest peak intensity indicating a lower recombination rate. The optimum concentration of Cu in TiO2 exhibits the vacancy state and hence decreases the rate of recombination. At a higher concentration of Cu, the recombination rate is increased due to the formation of defect clusters [42].
The elemental chemical composition and electronic state of the elements in the samples were confirmed by X-ray photoelectron spectroscopic analysis. The XPS spectrum ofG-2 sample is shown in Figure 4. Figure 4A shows high-resolution survey spectra for elements C (1s), Ti (2p), O (1s) and Cu (2p). All the peaks are calibrated with carbon correction, i.e., 284.5 eV binding energy was used as a reference.
In Figure 4B, the two peaks observed for Ti2porbital at binding energy 458.4 and 464.4 eV indicate the presence of Ti2p3/2 and Ti2p1/2, respectively. Typically, FWHM of both Ti2p (1/2) and Ti2p (3/2) peaks calculated are nearly the same for each spin orbit component, i.e., 2.36eV. The Ti2p (1/2) orbit is broader than Ti2p (3/2) and therefore Ti2p (1/2) is shorter than Ti2p (3/2) [43].The binding energy at 458.4 eV indicates Ti present in Ti4+oxidation state [44,45].The binding energy peaks at 530.3 eV confirms the presence of O1s, binding energy at 530.3 eV corresponds to lattice oxygen in TiO2(OTi-O) [27,46]. The binding energy at 932.9 eV and 953.2 eV correspond to Cu2p3/2and Cu2p1/2suggests incorporation of copper in Cu+2 oxidation state into the titanium dioxide lattice matrix [47]. With doping of Cu in TiO2 the Ti4+ of TiO2 was substituted by Cu2+ ions, There is a formation of a Cu-TiO2 bond instead of O-Ti-O [48].

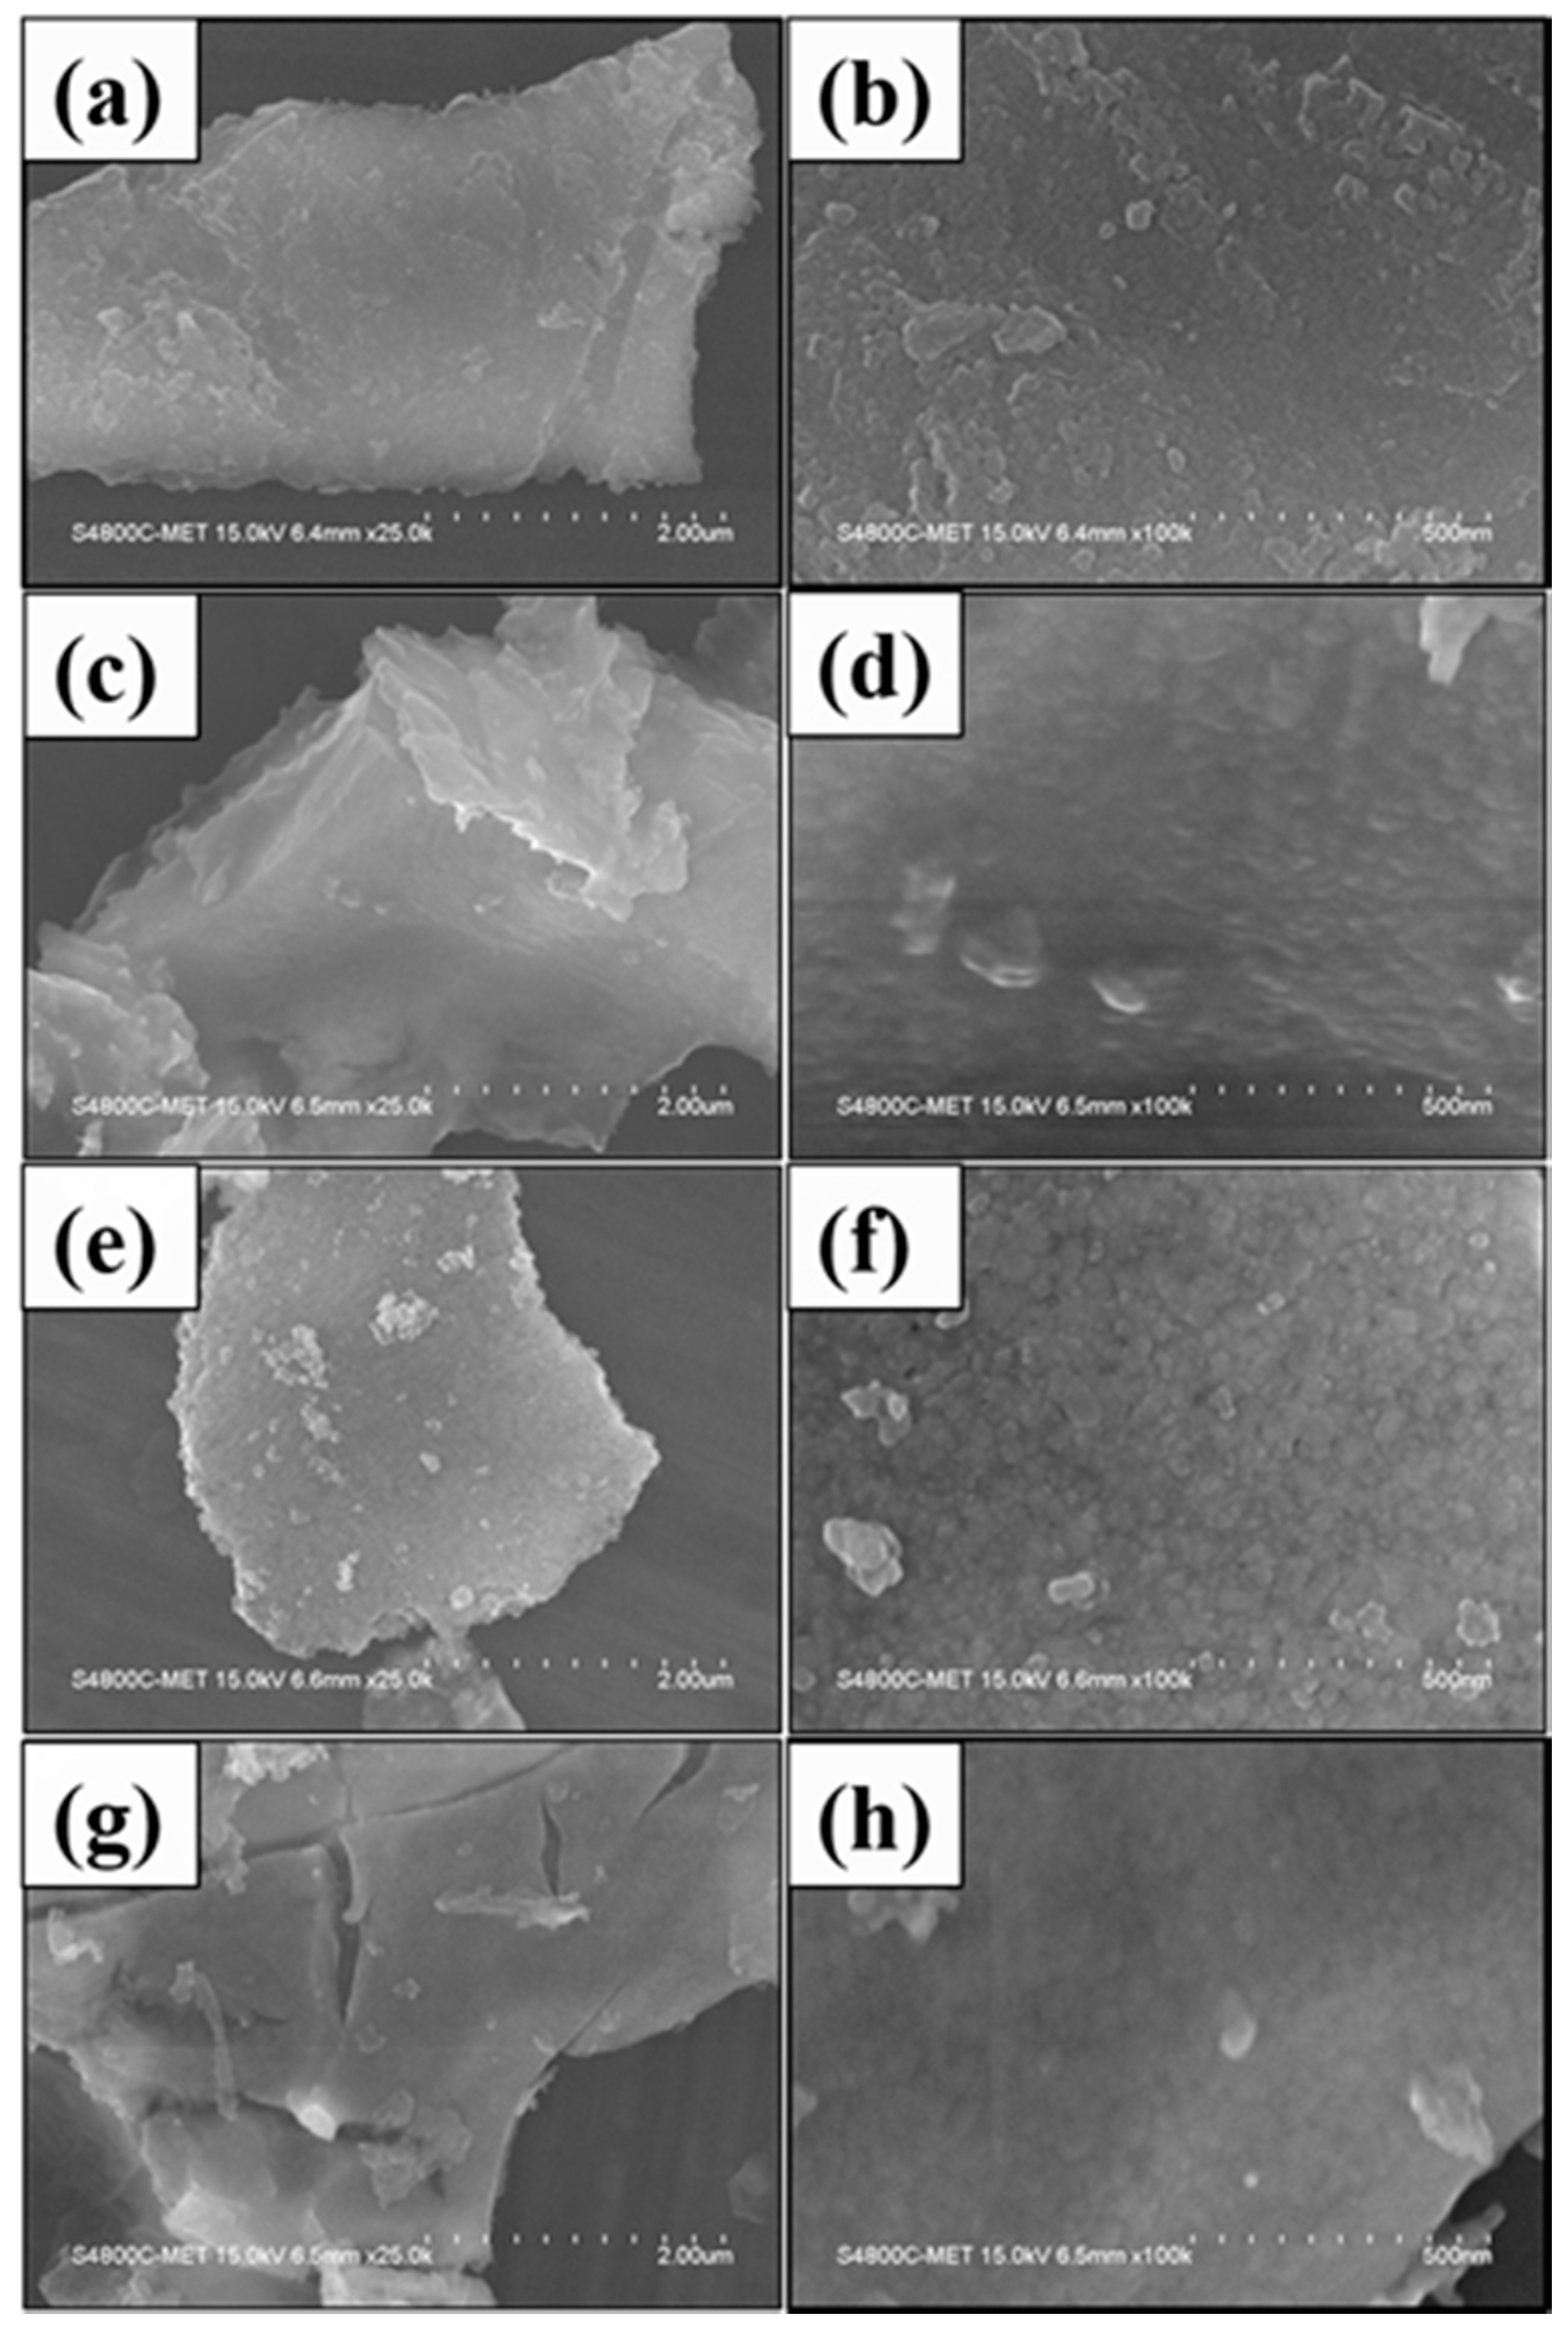
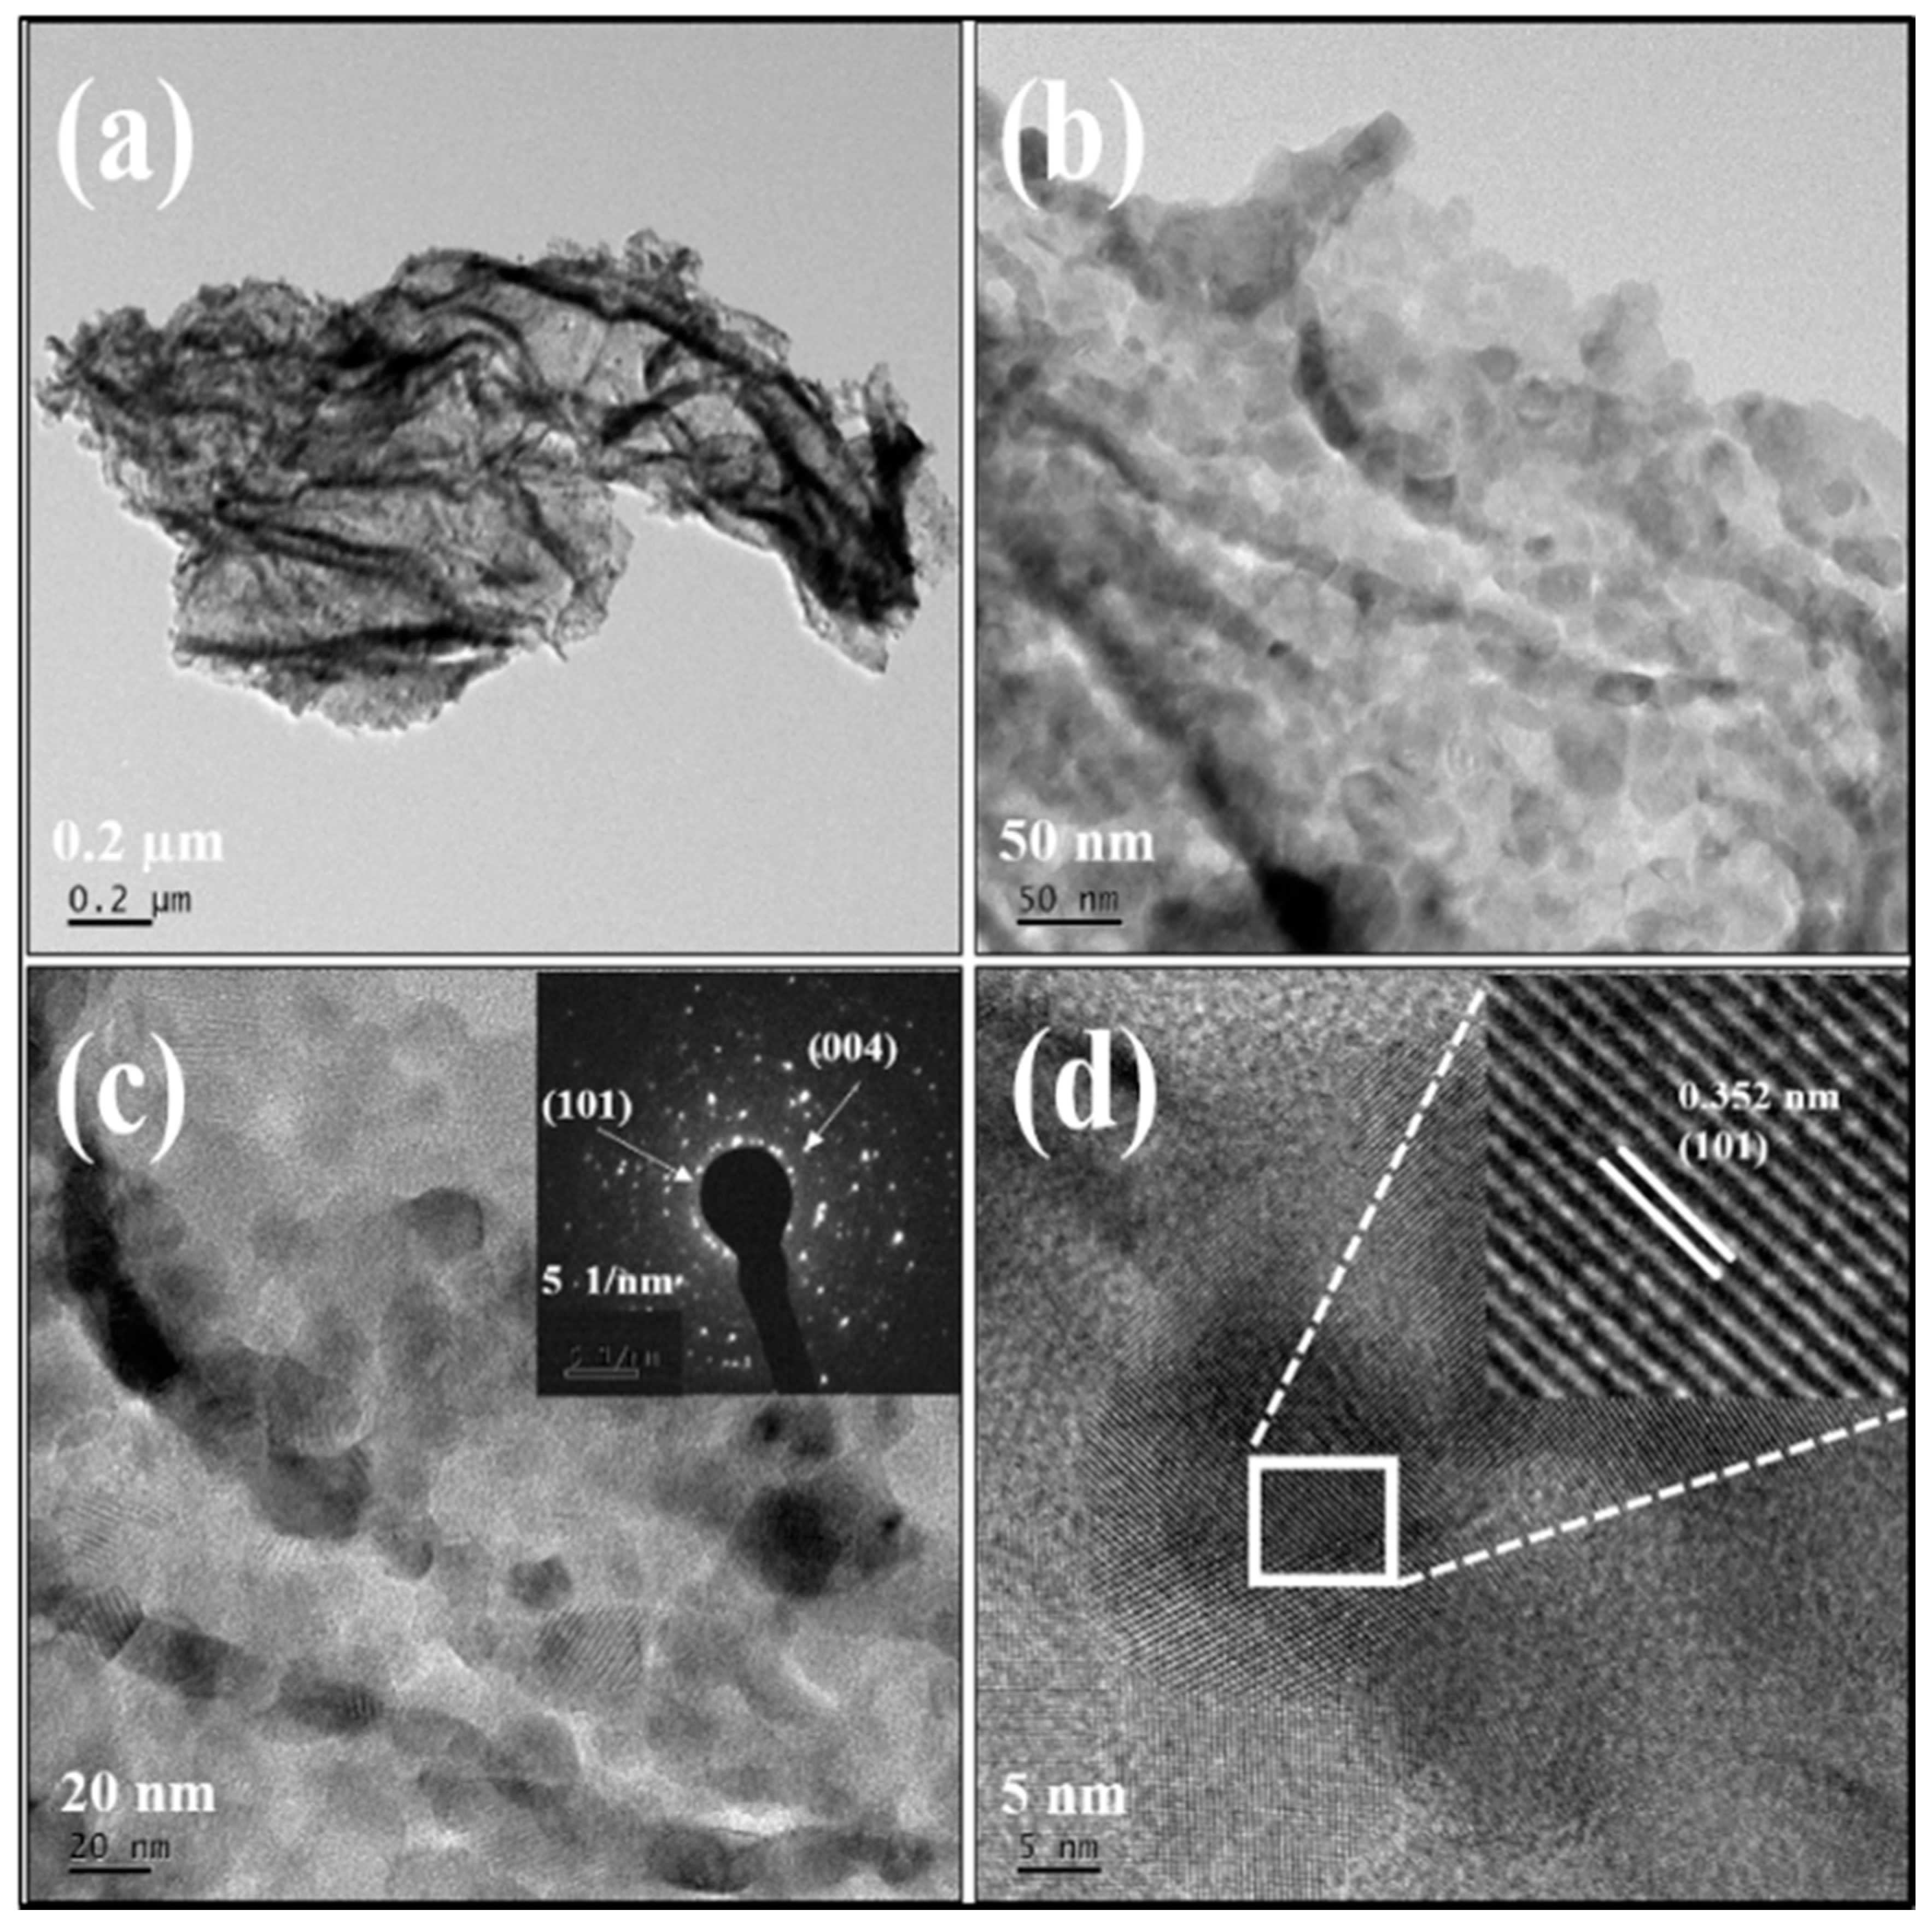
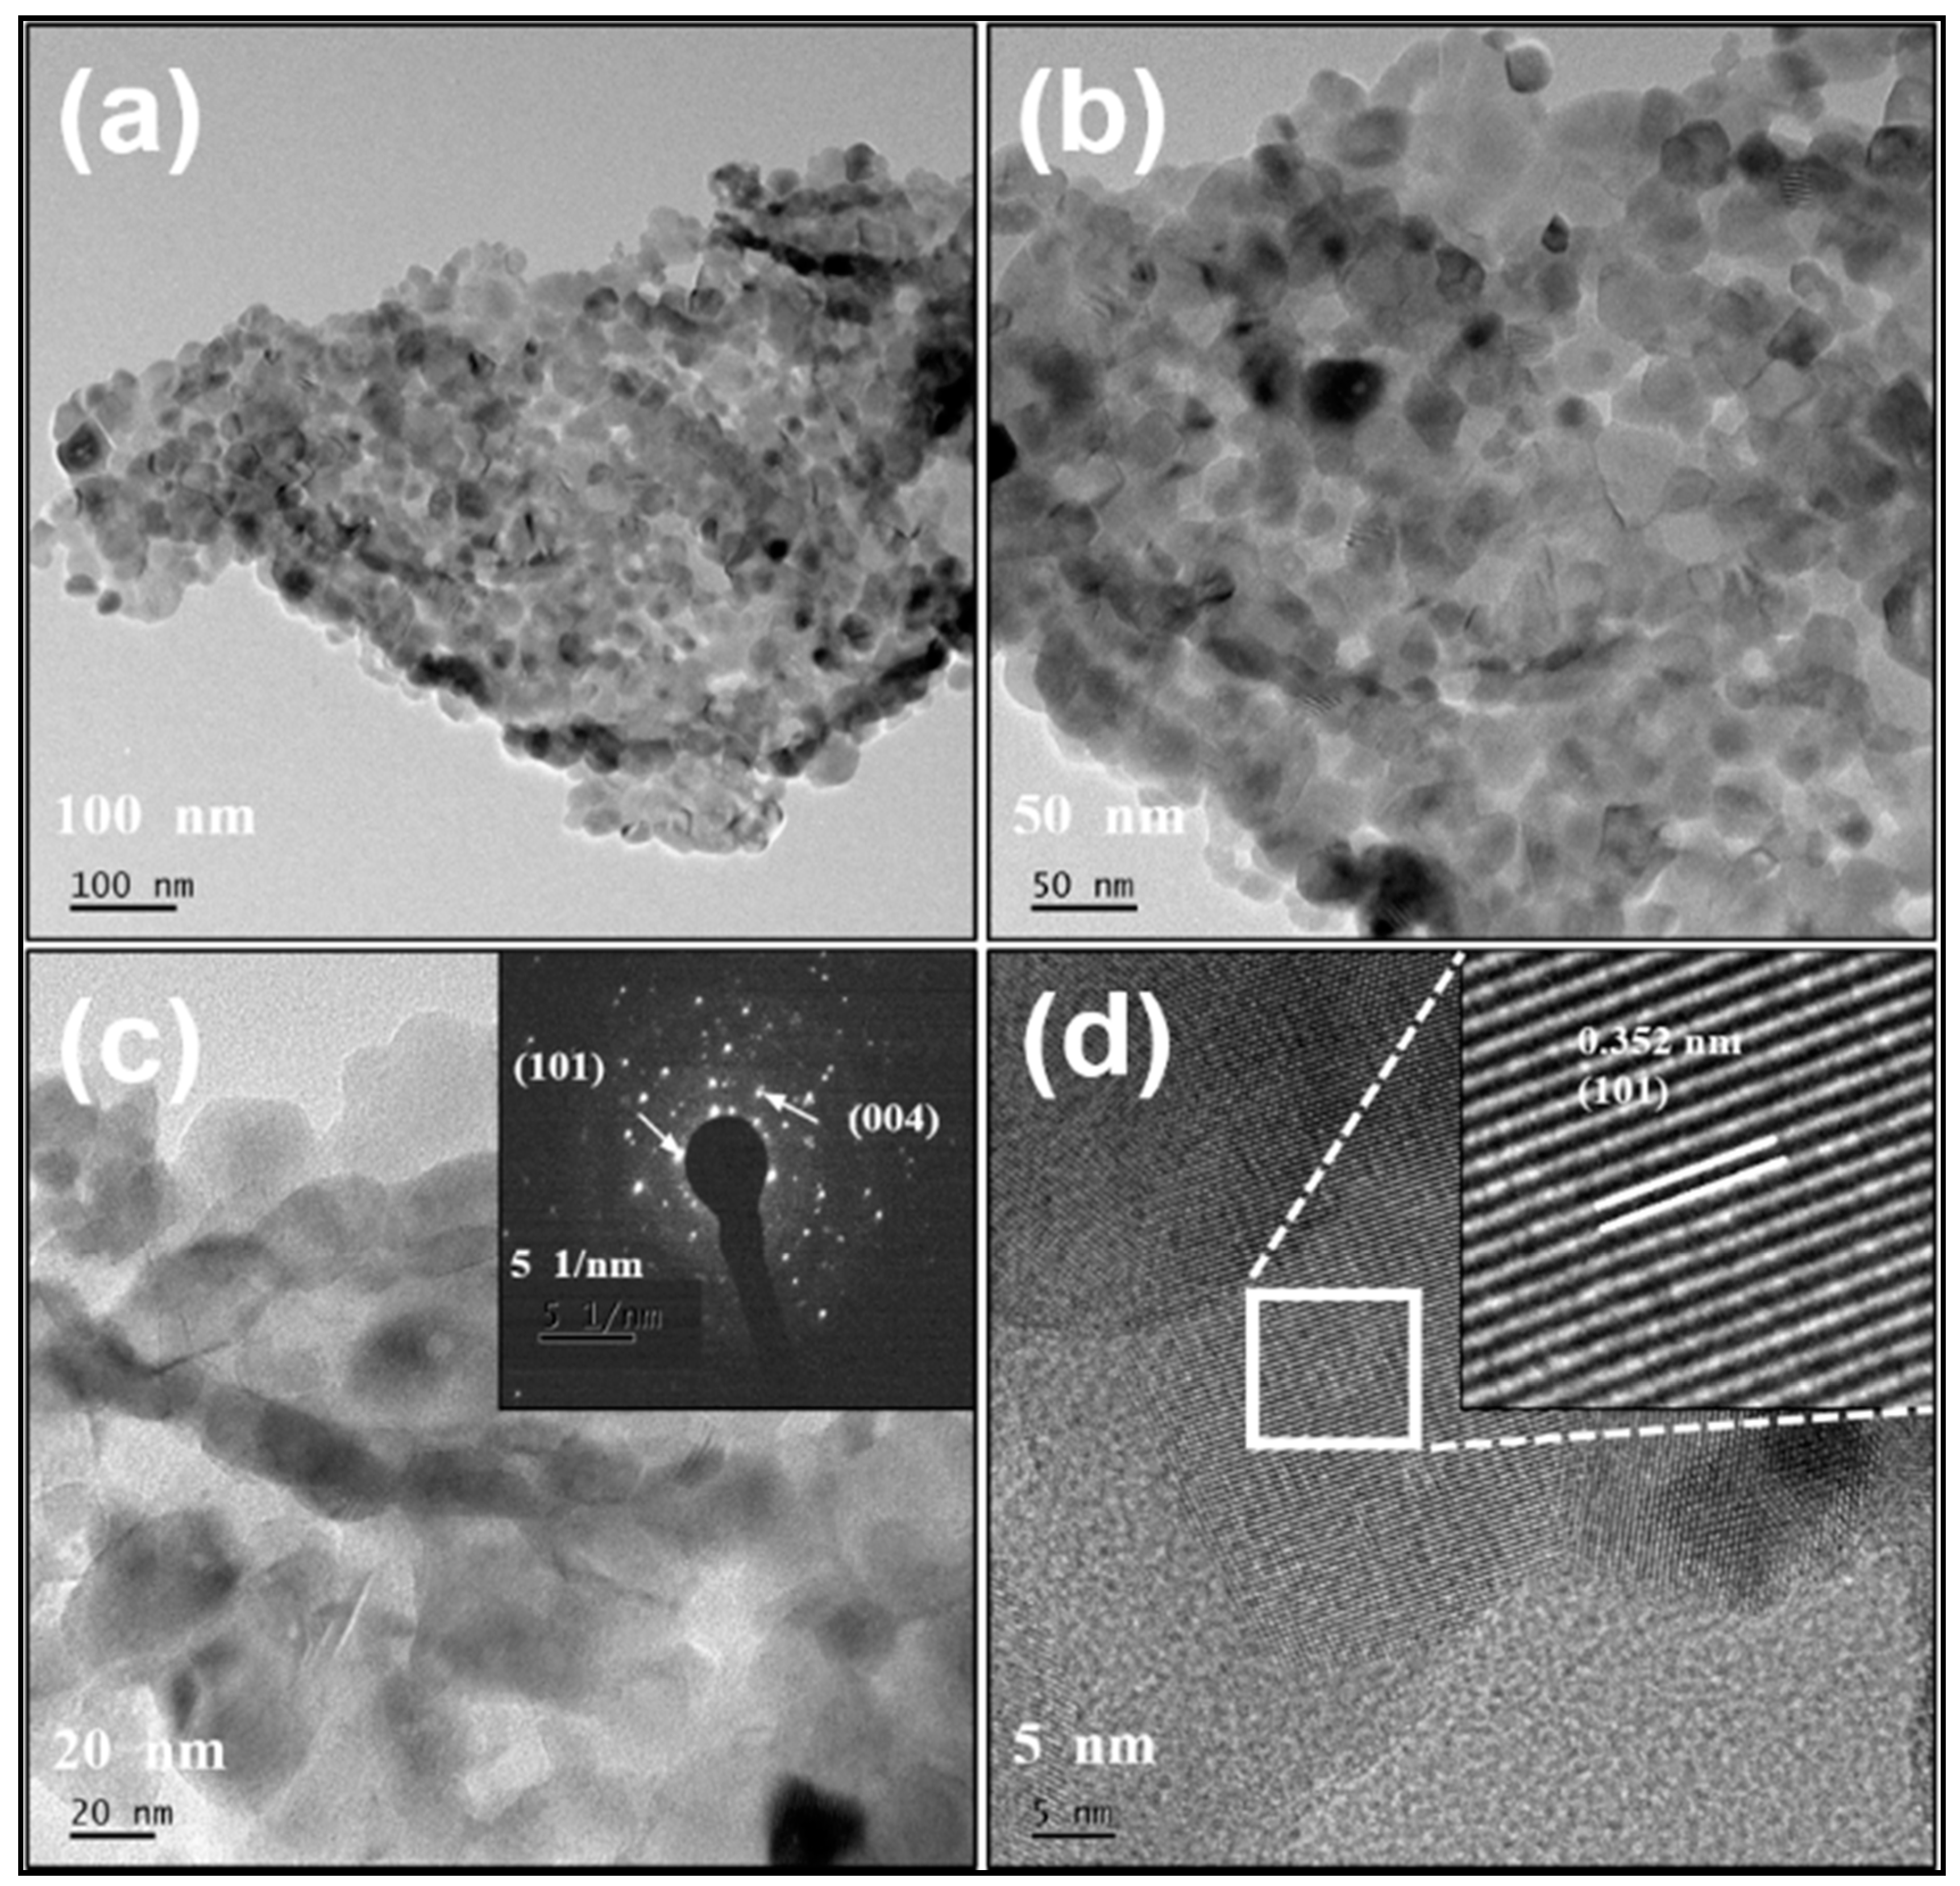
3.3. Morphological Study

The surface and morphologicalcharacterization of TiO2 and Cu-doped TiO2 nanostructures by FE-SEMis shown in Figure 5. FE-SEM images show homogeneous distribution of uniform-sized highly crystalline nanoparticles having a size in the range of 20–30 nm. For pure TiO2, i.e., G-0 (Figure 5a,b) the particles are well connected with each other.
With increasing Cu doping, marginal changes were observed in morphologies of sample G-1, G-2, and G-3. The same kind of morphology was observed for all the prepared compositions. The nanostructure assembly of submicron-sized is made up of tiny ordered spherical nanoparticles of size 20–30 nm. Interestingly, the nanoparticles are interconnected and self-aligned to each other. The nanostructure with very tiny particles was not very clear in FE-SEM. Hence, FE-TEM has been used for investigation of clear morphology and nanoparticles size. Figure S1 shows the FE-SEM images of pure TiO2 and Cu-doped TiO2 synthesized without use of template under similar conditions. The nanostructures without template have particle size is in the range of 2 um with random growth.
Further, the surface microstructure of the pure (G-0) and 2% Cu-doped TiO2 (G-2) was investigated using field emission transmission electron microscope (FE-TEM).
The low and high resolution FE-TEM images of G-0 (Figure 6a–c) and G-2 (Figure 7a–c) nanostructures, along with selected area electron diffraction pattern (Figure 6d and Figure 7d) shows a highly crystalline interconnected nanoparticle network. The SAED image validates the formation of anatase TiO2 and supports the XRD analysis. The pristine sample depicts formation of spherical shaped (20–30 nm) particles aligned with each other, forming a wavy structure. This dense particulate wavy monolayer structure looks like a graphene sheet (Figure 6a). The FE-TEM of G-0 and G-2 samples (Figure 6d and Figure 7d with insets) depict an inter-planar distance of about 0.352 nm, corresponding to [101] plane. This confirms the existence of anatase TiO2. Overall, the TEM analysis confirms the formation of nano-sized Cu-TiO2 particles having good linkage with adjacent particles.

3.4. Photocatalytic Study

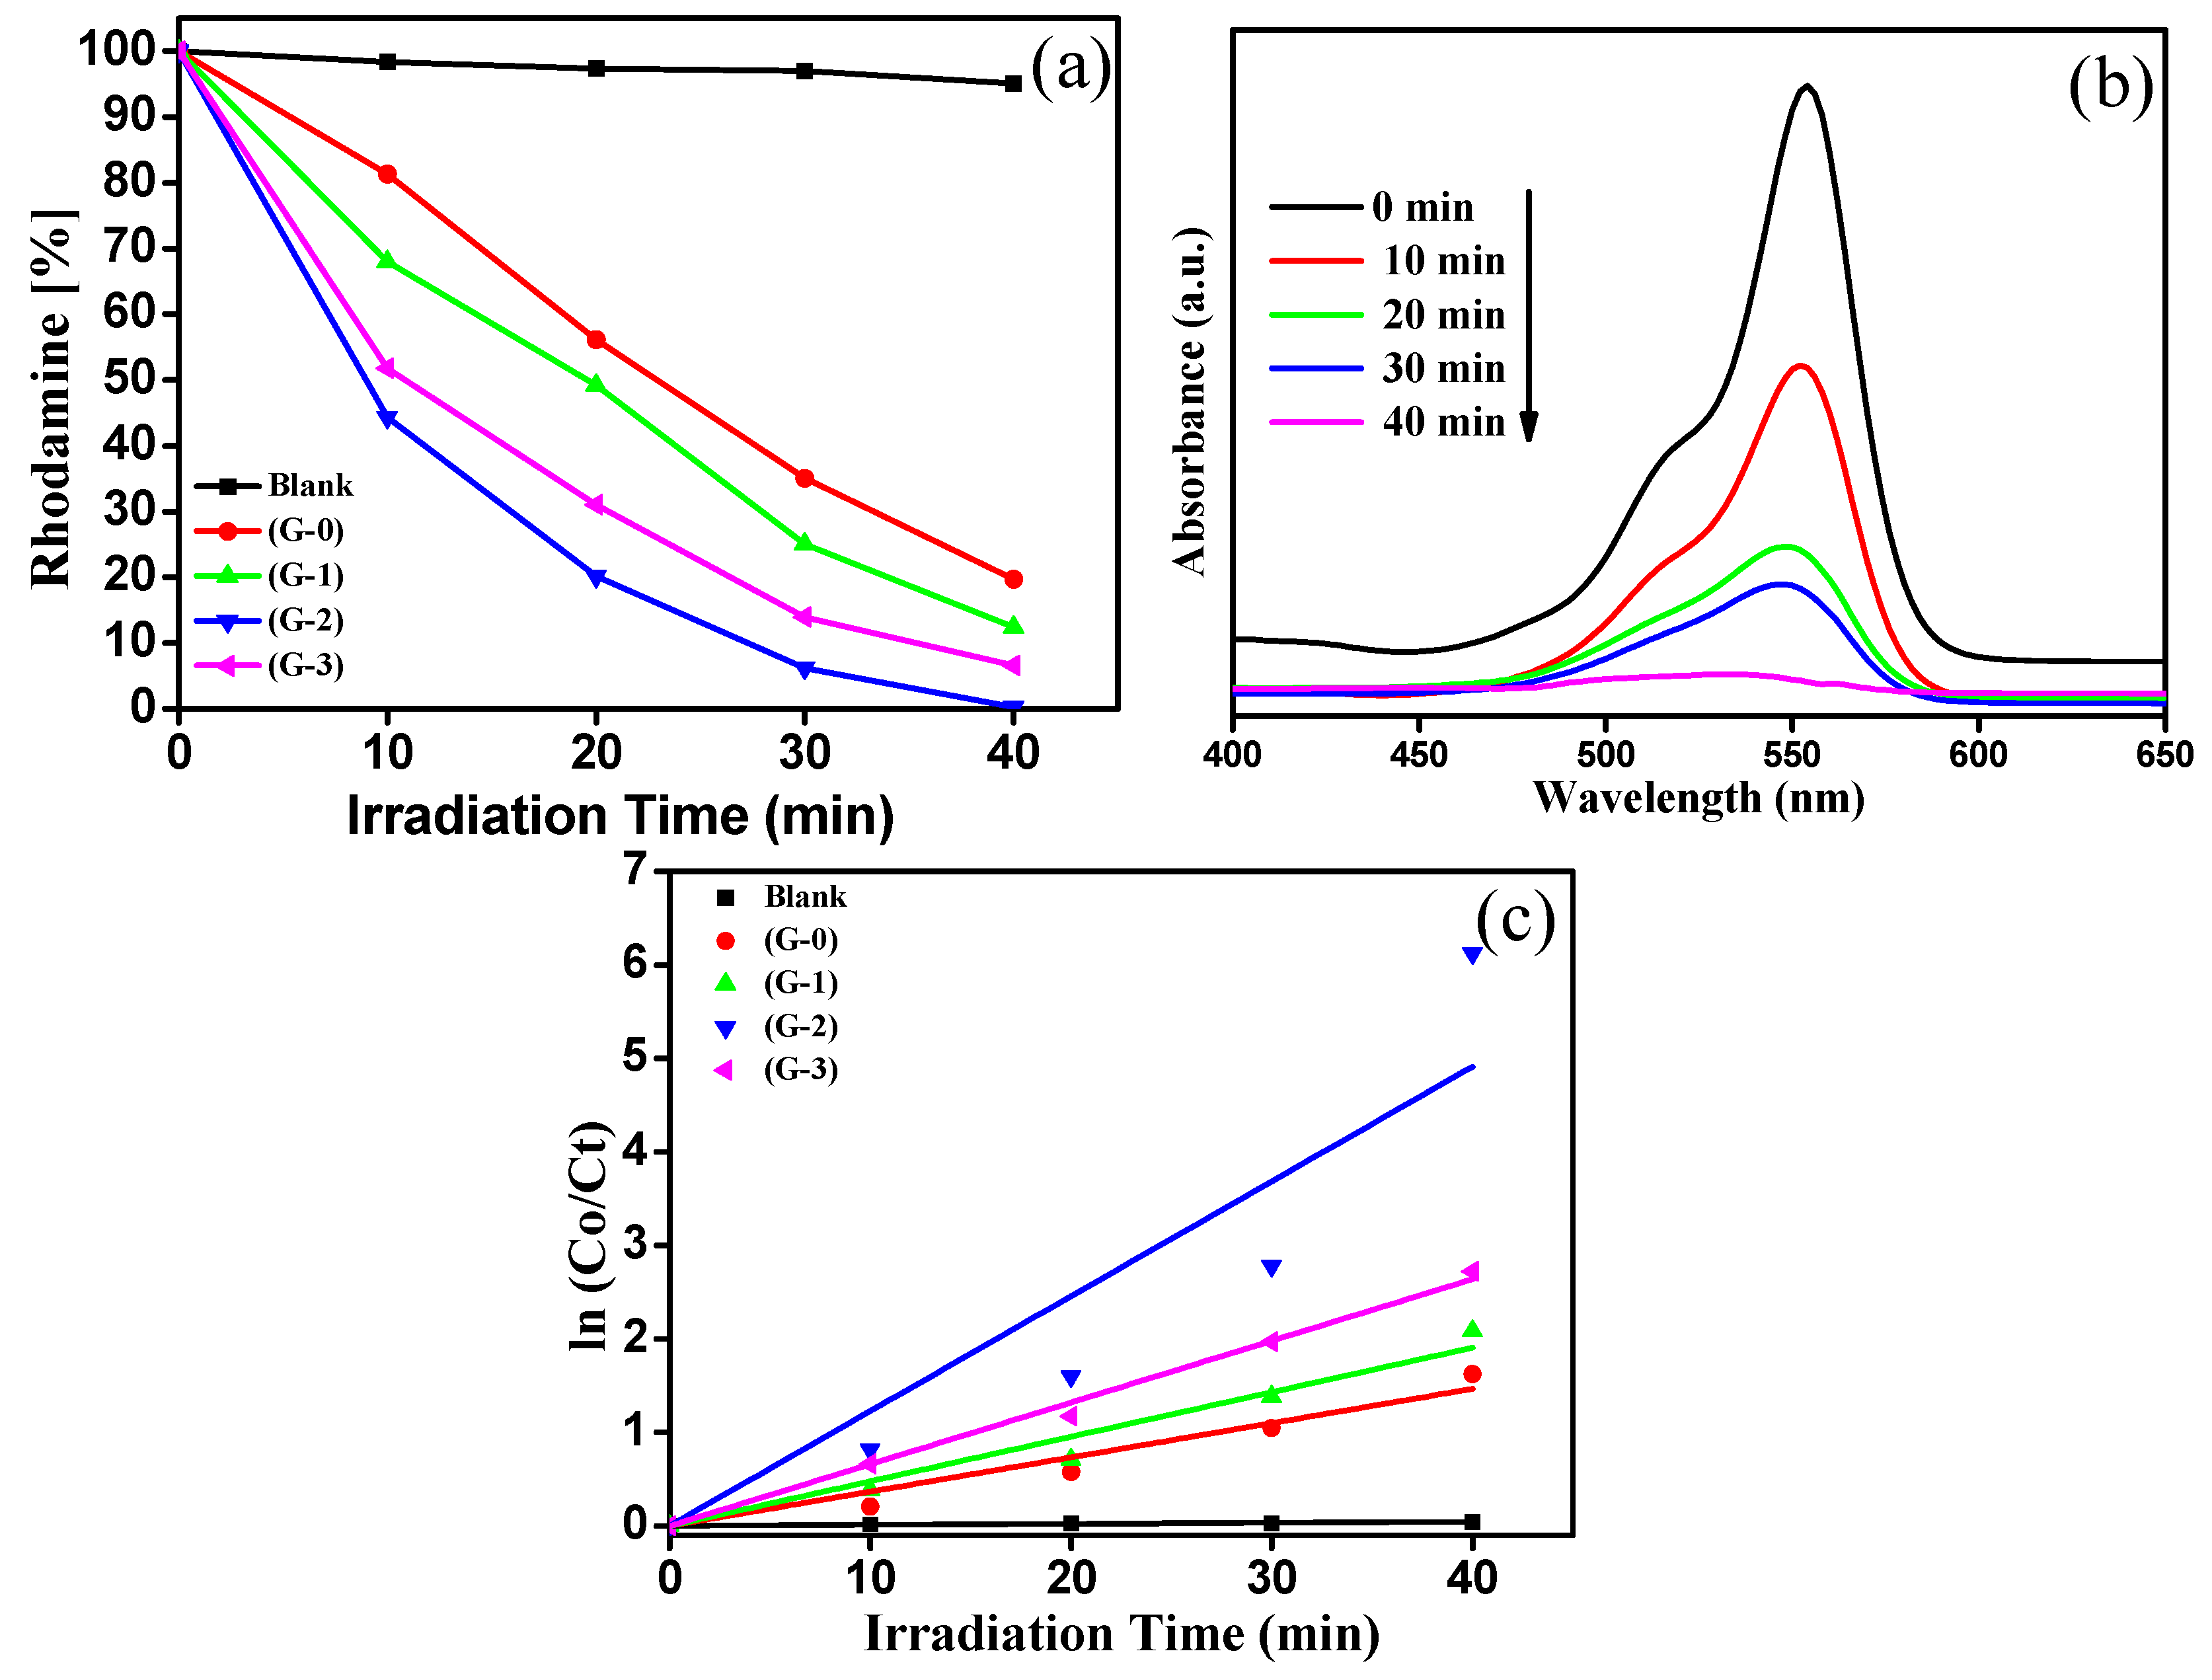
3.4.1. RhB Degradation

Photocatalytic degradation was performed using RhB as a model dye. For the photocatalytic performance study as per our earlier report, we took 100 mg of the catalyst and 100 mL of 10 ppm aqueous dye solution. The photocatalytic activity was studied during the months of April-May between 11 am to 3 pm under solar light.
The plot of %RhB vs. irradiation time is shown in Figure 8a. Pure TiO2(G-0) shows 80% of RhB degradation within 40 min, whereas the G-2 (2% Cu-doped TiO2) sample shows complete degradation of the RhB solution under the identical experimental parameters. The UV-visible absorbance spectra of RhB with time using G-2 sample is depicted in Figure 8b. From these spectra, the %RhB recovered was calculated with respect to irradiation time. The G-2 sample shows the highest photocatalytic performance as compared to other prepared compositions. It is reported that the photocatalytic dye degradation reaction shows pseudo-first order reaction kinetics. The chemical kinetics of RhB degradation was studied using the Langmuir–Hinshelwood model. The slope of the graph of ln(C0/Ct) vs. irradiation time gives the value of apparent rate constant (Kapp). The graph of ln(C0/Ct) vs. irradiation time is shown in Figure 8c. The reaction rates of photocatalytic RhB degradation using TiO2 and Cu-TiO2 catalysts are tabulated in Table 1. The G-2 sample shows an apparent rate constant (kapp) of 12.28 × 10⁻² min−1 for RhB dye degradation which is almost three times higher than that of pure TiO2.

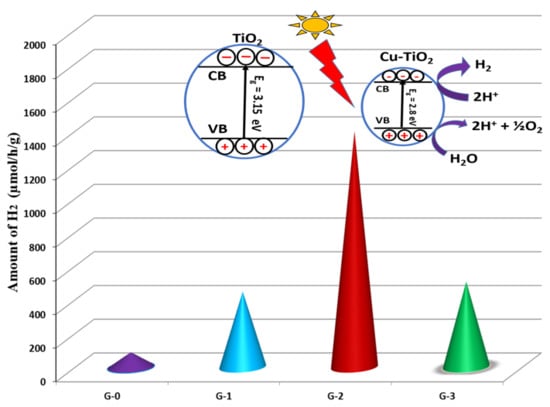
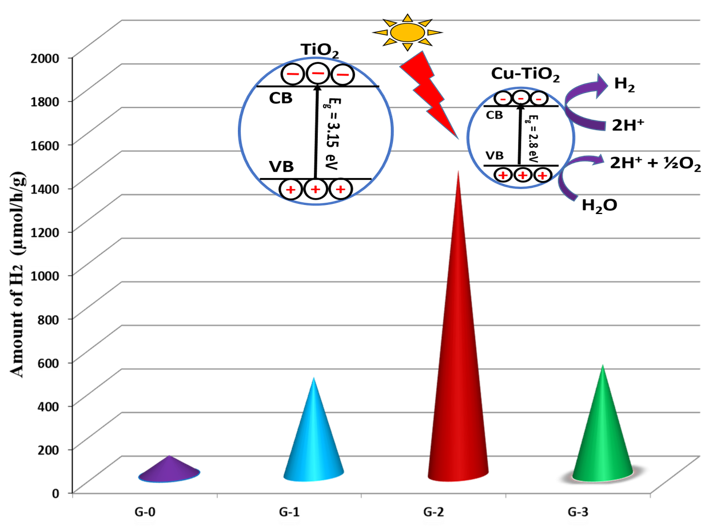
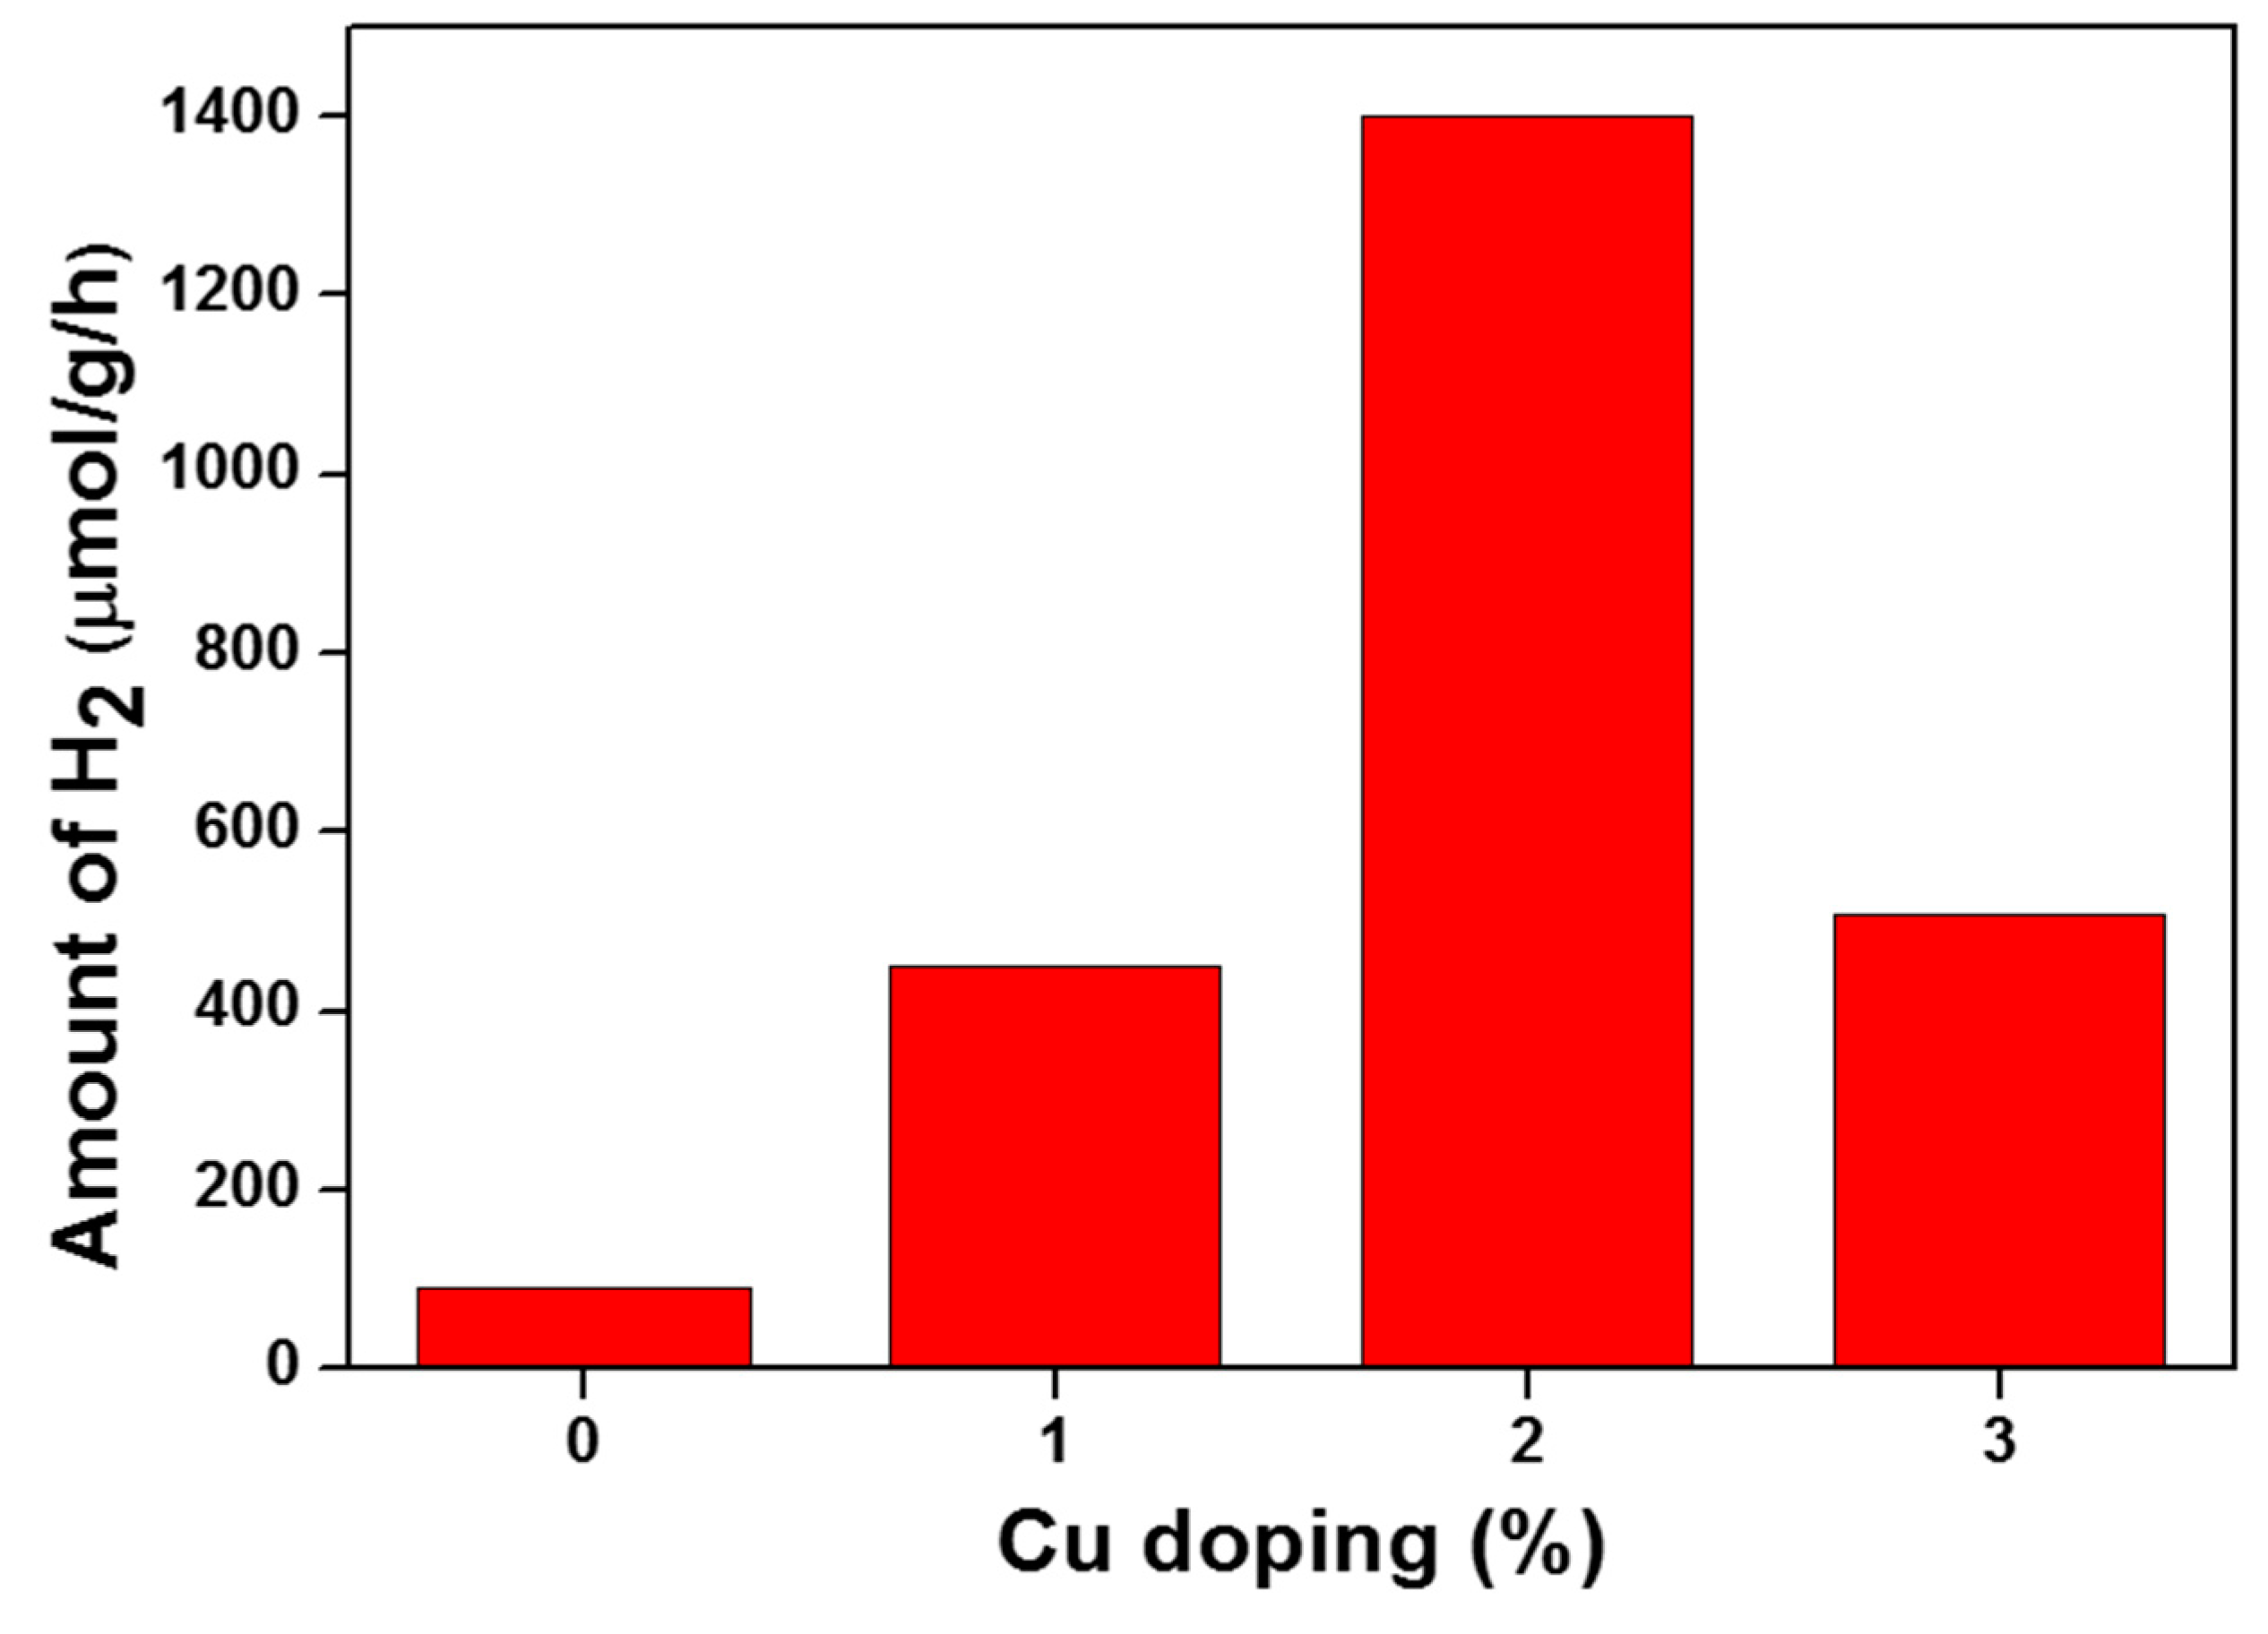
3.4.2. Photocatalytic Hydrogen Production

Photocatalytic activity of the synthesized photocatalystwas quantitatively examined for H2 generation from aqueous methanol under solar light. Here, we used methanol as a sacrificial agent, and Pt as co-catalyst to avoid fast recombination of photo-generated electrons and holes. Figure 9 shows the effect of different percentages of Cu doping on photocatalytic activity under solar light irradiation.
The amount of Cu was varied from 1% to3 % with respect to TiO2 prepared by paper template method. As the Cu percentage increases from 1% to 2%, hydrogen production increases gradually, i.e., 450 and 1400 µmol/g/h, respectively. Afterward, at higher concentration of Cu doping, i.e., at 3% the rate of H2 generation decreases to 509 µmol/g/h, this may be due to the increase in band gap. Higher band gap, leads to an increase in electron-hole recombination due to the occupancy of active site by the Cu atoms. This results in a decrease of photocatalytic activity for 3% Cu-doped TiO2. The pure TiO2, showed less activity as compared to Cu-doped samples, i.e., 90 µmol/g/h. Among the prepared samples, the 2% Cu-doped sample showed the highest H2 generation, i.e., 1400 µmol/g/h. The higher activity was due to narrowing of band gap, i.e., 2.80 eV. It showed the maximum absorption of sunlight and generation of utmost number of electrons-holes pairs. Additionally, PL study indicated the lowest intensity emission peak for 2% TiO2 showing suppression in electron-hole recombination and hence responsible for higher photocatalytic activity. Reusability of the G-2 photocatalyst was performed for photocatalytic RhB dye degradation and H2 production via water splitting. From the reusability study, it has been observed that, there is not much decrease in the photoactivity as shown in supporting information (Figures S2 and S3), which supports the stability of the photocatalyst.

4. Conclusions

Wedeveloped a new method for synthesis of TiO2 and Cu-TiO2. The use of Whatman filter as a template provides uniformly distributed Cu-TiO2 nanostructures having good linkage among the adjacent particles. The photocatalytic study shows the increase in activity up to 2% Cu doping and further decrease for 3%. In both cases H2 generation and dye degradation showed the same trend. It was suggested that 2% Cu doping is optimum in TiO2 lattice to show enhanced photoactivity. The reusability study clearly shows the stability of the photocatalyst. The present synthesis approachmay be very useful to develop a highly stable photocatalyst under visible light irradiation.

Supplementary Materials

The following are available online at https://www.mdpi.com/2504-477X/4/2/48/s1, Figure S1: FE-SEM images without template for pure TiO2 (a,b) and Cu doped TiO2 (c,d), Figure S2: Reusability study of G-2 (2%) for RhB dye degradation under similar condition, FigureS3: Reusability study of G-2 (2%) for photocatalytic water splitting under similar condition.

Author Contributions

Conceptualization, review & editing, B.K.; Methodology, Visualization and Writing—original draft, G.K.; Investigation and Visualization, S.A.; Data curation, U.C.; Formal analysis, S.K. and L.N. All authors have read and agreed to the published version of the manuscript.

Funding

This research received no external funding.

Acknowledgments

The authorswould like to thank C-MET Pune for providing research facilitiesand NanocrystallineMaterials Group, C-MET Pune for kind support.

Conflicts of Interest

The authors declare no conflict of interest.

References

  1. Sahoo, D.P.; Rath, D.; Nanda, B.; Parida, K.M. Transition metal/metal oxide modified MCM-41 for pollutant degradation and hydrogen energy production: A review. ACS Adv. 2015, 5, 83707–83724. [Google Scholar] [CrossRef]
  2. Cheng, M.; Zeng, G.; Huang, D.; Lai, C.; Xu, P.; Zhang, C.; Liu, Y. Hydroxyl radicals based advanced oxidation processes (AOPs) for remediation of soils contaminated with organic compounds: A review. Chem. Eng. J. 2016, 284, 582–598. [Google Scholar] [CrossRef]
  3. Andreozzi, R.; Caprio, V.; Insola, A.; Marotta, R. Advanced oxidation processes (AOP) for water purification and recovery. Catal. Today 1999, 53, 51–59. [Google Scholar] [CrossRef]
  4. Raman, C.D.; Kanmani, S. Textile dye degradation using nano zero valent iron: A review. J. Environ. Manag. 2016, 177, 341–355. [Google Scholar] [CrossRef]
  5. Cardoso, J.C.; Bessegato, G.G.; Zanoni, M.V. Efficiency comparison of ozonation, photolysis, photocatalysis and photoelectrocatalysis methods in real textile wastewater decolorization. Water Res. 2016, 98, 39–46. [Google Scholar] [CrossRef] [Green Version]
  6. Fujishima, A.; Honda, K. Electrochemical photolysis of water at a semiconductor electrode. Nature 1972, 238, 37–38. [Google Scholar] [CrossRef]
  7. Leary, R.; Westwood, A. Carbonaceous nanomaterials for the enhancement of TiO2 photocatalysis. Carbon 2011, 49, 741–772. [Google Scholar] [CrossRef]
  8. Yu, J.; Hai, Y.; Jaroniec, M. Photocatalytic hydrogen production over CuO-modified titania. J. Colloid Interface Sci. 2011, 357, 223–228. [Google Scholar] [CrossRef]
  9. Xu, S.; Sun, D.D. Significant improvement of photocatalytic hydrogen generation rate over TiO2 with deposited CuO. Int. J. Hydrog. Energy 2009, 34, 6096–6104. [Google Scholar] [CrossRef]
  10. Sakthivel, S.; Shankar, M.V.; Palanichamy, M.; Arabindoo, B.; Bahnemann, D.W.; Murugesan, V. Enhancement of photocatalytic activity by metal deposition: Characterisation and photonic efficiency of Pt, Au and Pd deposited on TiO2 catalyst. Water Res. 2004, 38, 3001–3008. [Google Scholar] [CrossRef]
  11. Kim, S.; Hwang, S.-J.; Choi, W. Visible light active platinum-ion-doped TiO2 photocatalyst. J. Phys. Chem. B 2005, 109, 24260–24267. [Google Scholar] [CrossRef] [PubMed]
  12. Caudillo-Flores, U.; Munoz-Batista, M.J.; Fernandez-Garcia, M.; Kubacka, A. Bimetallic Pt-Pd co-catalyst Nb-doped TiO2 materials for H2 photo-production under UV and Visible light illumination. Appl. Catal. B Environ. 2018, 238, 533–545. [Google Scholar] [CrossRef]
  13. Liu, B.; Wang, Y.; Shang, S.; Ni, Y.; Zhang, N.; Cao, M.; Hu, C. One-step synthesis of mulberry-shaped TiO2-Au nanocomposite and its H2 evolution property under visible light. Colloids Surf. A Physicochem. Eng. Asp. 2018, 553, 203–209. [Google Scholar] [CrossRef]
  14. Bera, P.; Hegde, M.S. Noble metal ions in CeO2 and TiO2: Synthesis, structure and catalytic properties. ACS Adv. 2015, 5, 94949–94979. [Google Scholar] [CrossRef]
  15. Devi, L.G.; Kavitha, R. A review on non metal ion doped titania for the photocatalytic degradation of organic pollutants under UV/solar light: Role of photogenerated charge carrier dynamics in enhancing the activity. Appl. Catal. B Environ. 2013, 140–141, 559–587. [Google Scholar] [CrossRef]
  16. Zong, X.; Lu, G.; Wang, L. Nonmetal doping in TiO2 toward visible-light-induced photocatalysis. In Environmental Photochemistry Part III; Springer: Berlin/Heidelberg, Germany, 2013; pp. 87–113. [Google Scholar]
  17. Ismael, M. Enhanced photocatalytic hydrogen production and degradation of organic pollutants from Fe (III) doped TiO2 nanoparticles. J. Environ. Chem. Eng. 2020, 8, 103676. [Google Scholar] [CrossRef]
  18. Simsek, E.B. Solvothermal synthesized boron doped TiO2 catalysts: Photocatalytic degradation of endocrine disrupting compounds and pharmaceuticals under visible light irradiation. Appl. Catal. B Environ. 2017, 200, 309–322. [Google Scholar] [CrossRef]
  19. Chen, X.; Burda, C. The electronic origin of the visible-light absorption properties of C-, N-and S-doped TiO2 nanomaterials. J. Am. Chem. Soc. 2008, 130, 5018–5019. [Google Scholar] [CrossRef]
  20. Qin, D.-D.; Wang, Q.-H.; Chen, J.; He, C.-H.; Li, Y.; Wang, C.-H.; Quan, J.-J.; Tao, C.-L.; Lu, X.-Q. Phosphorus-doped TiO2 nanotube arrays for visible-light-driven photoelectrochemical water oxidation. Sustain. Energy Fuels 2017, 1, 248–253. [Google Scholar] [CrossRef]
  21. Bakar, S.A.; Ribeiro, C. Rapid and morphology controlled synthesis of anionic S-doped TiO2 photocatalysts for the visible-light-driven photodegradation of organic pollutants. ACS Adv. 2016, 6, 36516–36527. [Google Scholar] [CrossRef]
  22. He, J.; Liu, Q.; Sun, Z.; Yan, W.; Zhang, G.; Qi, Z.; Xu, P.; Wu, Z.; Wei, S. High photocatalytic activity of rutile TiO2 induced by iodine doping. J. Phys. Chem. C 2010, 114, 6035–6038. [Google Scholar] [CrossRef]
  23. Brauer, J.I.; Szulczewski, G. Important role of surface fluoride in nitrogen-doped TiO2 nanoparticles with visible light photocatalytic activity. J. Phys. Chem. B 2014, 118, 14188–14195. [Google Scholar] [CrossRef] [PubMed]
  24. Ciocarlan, R.-G.; Seftel, E.M.; Mertens, M.; Pui, A.; Mazaj, M.; Tusar, N.N.; Cool, P. Novel magnetic nanocomposites containing quaternary ferrites systems Co0.5Zn0.25M0.25Fe2O4 (M = Ni, Cu, Mn, Mg) and TiO2-anatase phase as photocatalysts for wastewater remediation under solar light irradiation. Mater. Sci. Eng. B 2018, 230, 1–7. [Google Scholar] [CrossRef]
  25. Dholam, R.; Patel, N.; Adami, M.; Miotello, A. Hydrogen production by photocatalytic water-splitting using Cr-or Fe-doped TiO2 composite thin films photocatalyst. Int. J. Hydrog. Energy 2009, 34, 5337–5346. [Google Scholar] [CrossRef]
  26. Ampelli, C.; Passalacqua, R.; Genovese, C.; Perathoner, S.; Centi, G.; Montini, T.; Gombac, V.; Jaen, J.J.D.; Fornasiero, P. H2 production by selective photo-dehydrogenation of ethanol in gas and liquid phase on CuOx/TiO2 nanocomposites. ACS Adv. 2013, 3, 21776–21788. [Google Scholar] [CrossRef]
  27. Zhang, M.; Sun, R.; Li, Y.; Shi, Q.; Xie, L.; Chen, J.; Xu, X.; Shi, H.; Zhao, W. High H2 evolution from quantum Cu (II) nanodot-doped two-dimensional ultrathin TiO2 nanosheets with dominant exposed {001} facets for reforming glycerol with multiple electron transport pathways. J. Phys. Chem. C 2016, 120, 10746–10756. [Google Scholar] [CrossRef]
  28. Xiao, S.; Liu, P.; Zhu, W.; Li, G.; Zhang, D.; Li, H. Copper nanowires: A substitute for noble metals to enhance photocatalytic H2 generation. Nano Lett. 2015, 15, 4853–4858. [Google Scholar] [CrossRef]
  29. Xu, X.; Gao, Z.; Cui, Z.; Liang, Y.; Li, Z.; Zhu, S.; Yang, X.; Ma, J. Synthesis of Cu2O octadecahedron/TiO2 quantum dot heterojunctions with high visible light photocatalytic activity and high stability. ACS Appl. Mater. Interfaces 2016, 8, 91–101. [Google Scholar] [CrossRef]
  30. Barreca, D.; Fornasiero, P.; Gasparotto, A.; Gombac, V.; Maccato, C.; Montini, T.; Tondello, E. The potential of supported Cu2O and CuO nanosystems in photocatalytic H2 production. ChemSusChem 2009, 2, 230–233. [Google Scholar] [CrossRef]
  31. Xi, Z.; Li, C.; Zhang, L.; Xing, M.; Zhang, J. Synergistic effect of Cu2O/TiO2 heterostructure nanoparticle and its high H2 evolution activity. Int. J. Hydrog. Energy 2014, 39, 6345–6353. [Google Scholar] [CrossRef]
  32. Colon, G.; Maicu, M.; Hidalgo, M.C.; Navio, J.A. Cu-doped TiO2 systems with improved photocatalytic activity. Appl. Catal. B Environ. 2006, 67, 41–51. [Google Scholar] [CrossRef]
  33. Gombac, V.; Sordelli, L.; Montini, T.; Delgado, J.J.; Adamski, A.; Adami, G.; Cargnello, M.; Bernal, S.; Fornasiero, P. CuOx− TiO2 Photocatalysts for H2 Production from Ethanol and Glycerol Solutions. J. Phys. Chem. A 2010, 114, 3916–3925. [Google Scholar] [CrossRef] [PubMed]
  34. Valero, J.M.; Obregon, S.; Colon, G. Active site considerations on the photocatalytic H2 evolution performance of Cu-doped TiO2 obtained by different doping methods. ACS Catal. 2014, 4, 3320–3329. [Google Scholar] [CrossRef]
  35. Rajamannan, B.; Mugundan, S.; Viruthagiri, G.; Praveen, P.; Shanmugam, N. Sol–gel synthesis and characterization of pure and manganese doped TiO2 nanoparticles—A new NLO active material. Spectrochim. Acta Part A Mol. Biomol. Spectrosc. 2014, 118, 651–656. [Google Scholar] [CrossRef] [PubMed]
  36. Kumar, D.P.; Reddy, N.L.; Kumari, M.M.; Srinivas, B.; Kumari, V.D.; Sreedhar, B.; Roddatis, V.; Bondarchuk, O.; Karthik, M.; Neppolian, B.; et al. Cu2O-sensitized TiO2 nanorods with nanocavities for highly efficient photocatalytic hydrogen production under solar irradiation. Sol. Energy Mater. Sol. Cells 2015, 136, 157–166. [Google Scholar] [CrossRef]
  37. Zhu, S.; Liang, S.; Tong, Y.; An, X.; Long, J.; Fu, X.; Wang, X. Photocatalytic reduction of CO2 with H2O to CH4 on Cu (i) supported TiO2 nanosheets with defective {001} facets. Phys. Chem. Chem. Phys. 2015, 17, 9761–9770. [Google Scholar] [CrossRef]
  38. Kale, G.; Arbuj, S.; Kawade, U.; Rane, S.; Ambekar, J.; Kale, B. Synthesis of porous nitrogen doped zinc oxide nanostructures using a novel paper mediated template method and their photocatalytic study for dye degradation under natural sunlight. Mater. Chem. Front. 2017, 2, 163–170. [Google Scholar] [CrossRef]
  39. Arbuj, S.S.; Hawaldar, R.R.; Mulik, U.P.; Wani, B.N.; Amalnerkar, D.P.; Waghmode, S.B. Preparation, characterization and photocatalytic activity of TiO2 towards methylene blue degradation. Mater. Sci. Eng. B 2010, 168, 90–94. [Google Scholar] [CrossRef]
  40. Mollavali, M.; Falamaki, C.; Rohani, S. High performance NiS-nanoparticles sensitized TiO2 nanotube arrays for water reduction. Int. J. Hydrog. Energy 2016, 41, 5887–5901. [Google Scholar] [CrossRef]
  41. Jaiswal, R.; Bharambe, J.; Patel, N.; Dashora, A.; Kothari, D.C.; Miotello, A. Copper and Nitrogen co-doped TiO2 photocatalyst with enhanced optical absorption and catalytic activity. Appl. Catal. B Environ. 2015, 168–169, 333–341. [Google Scholar] [CrossRef]
  42. Murashkina, A.A.; Murzin, P.D.; Rudakova, A.V.; Ryabchuk, V.K.; Emeline, A.V.; Bahnemann, D.W. Influence of the dopant concentration on the photocatalytic activity: Al-doped TiO2. J. Phys. Chem. C 2015, 119, 24695–24703. [Google Scholar] [CrossRef]
  43. Khore, S.K.; Tellabati, N.V.; Apte, S.K.; Naik, S.D.; Ojha, P.; Kale, B.B.; Sonawane, R.S. Green sol–gel route for selective growth of 1D rutile N–TiO2: A highly active photocatalyst for H2 generation and environmental remediation under natural sunlight. ACS Adv. 2017, 7, 33029–33042. [Google Scholar] [CrossRef] [Green Version]
  44. Biesinger, M.C.; Lau, L.W.M.; Gerson, A.R.; Smart, R.S.C. Resolving surface chemical states in XPS analysis of first row transition metals, oxides and hydroxides: Cr, Mn, Fe, Co and Ni. Appl. Surf. Sci. 2010, 257, 887–898. [Google Scholar] [CrossRef]
  45. Aguilar, T.; Navas, J.; Alcantara, R.; Fernandez-Lorenzo, C.; Gallardo, J.J.; Blanco, G.; Martin-Calleja, J. A route for the synthesis of Cu-doped TiO2 nanoparticles with a very low band gap. Chem. Phys. Lett. 2013, 571, 49–53. [Google Scholar] [CrossRef]
  46. Liang, Y.-C.; Hu, C.-Y.; Liang, Y.-C. Crystallographic phase evolution of ternary Zn–Ti–O nanomaterials during high-temperature annealing of ZnO–TiO2 nanocomposites. CrystEngComm 2012, 14, 5579–5584. [Google Scholar] [CrossRef]
  47. Hussain, Z.; Salim, M.A.; Khan, M.A.; Khawaja, E.E. X-ray photoelectron and auger spectroscopy study of copper-sodium-germanate glasses. J. Non-Cryst. Solids 1989, 110, 44–52. [Google Scholar] [CrossRef]
  48. Yang, X.-J.; Shu, W.A.; Sun, H.-M.; Wang, X.-B.; Lian, J.-S. Preparation and photocatalytic performance of Cu-doped TiO2 nanoparticles. Trans. Nonferrous Met. Soc. China 2015, 25, 504–509. [Google Scholar] [CrossRef]
Figure 1. XRD Patterns of pure TiO2 (G-0) and Cu-doped TiO2 (G-1, G-2, and G-3).
Jcs 04 00048 g001
Figure 2. (a) UV-DRS spectrum of pure (G-0) and Cu-doped TiO2 (G-1, G-2, and G-3), (b) Tauc’s plot for pure (G-0, 3.15 eV) and Cu-doped TiO2 (G-1, G-2, and G-3).
Jcs 04 00048 g002
Figure 3. Photoluminescence spectra of pure TiO2 (G-0), Cu-TiO2 (G-1, G-2, and G-3).
Jcs 04 00048 g003
Figure 4. XPS spectra for G-2. (A) High resolution spectra, (B) resolution spectra for Ti, (C) resolution spectra for O, and (D)resolution spectra for Cu.
Jcs 04 00048 g004
Figure 5. FE-SEM images for pure TiO2 G-0 (a,b), Cu-doped TiO2 G-1 (c,d), G-2 (e,f), and G-3 (g,h).
Jcs 04 00048 g005
Figure 6. (a,b) FE-TEM images of pure TiO2, insets of (c) and (d) are the SAED and high-resolution TEM.
Jcs 04 00048 g006
Figure 7. (a,b) FE-TEM images of Cu-TiO2 (2%), insets of (c) and (d) are the SAED and high-resolution TEM.
Jcs 04 00048 g007
Figure 8. (a) Degradation (%) of RhB vs.irradiation time (min), (b) UV-visible absorption spectra of RhB exposed to natural sunlight for different time intervals, and (c) ln(C0/Ct)vs. irradiation time (min).
Jcs 04 00048 g008
Figure 9. Effect of Cu doping on H2 evolution under natural solar light.
Jcs 04 00048 g009
Table 1. Band gap and photocatalytic activity of TiO2 and Cu-TiO2photocatalyst.
Sr. NoCatalystBand Gap (eV)Rate Constant (min−1)H2 Production (µmol/g/h)
1G-0 (Pure)3.150.0366490
2G-1 (1%)3.000.04767450
3G-2 (2%)2.800.12281400
4G-3 (3%)2.940.06597509

