Multi-Performance Characteristics of AA5052 + 10% SiC Surface Composite by Friction Stir Processing

Abstract
:1. Introduction
2. Experimental Procedure
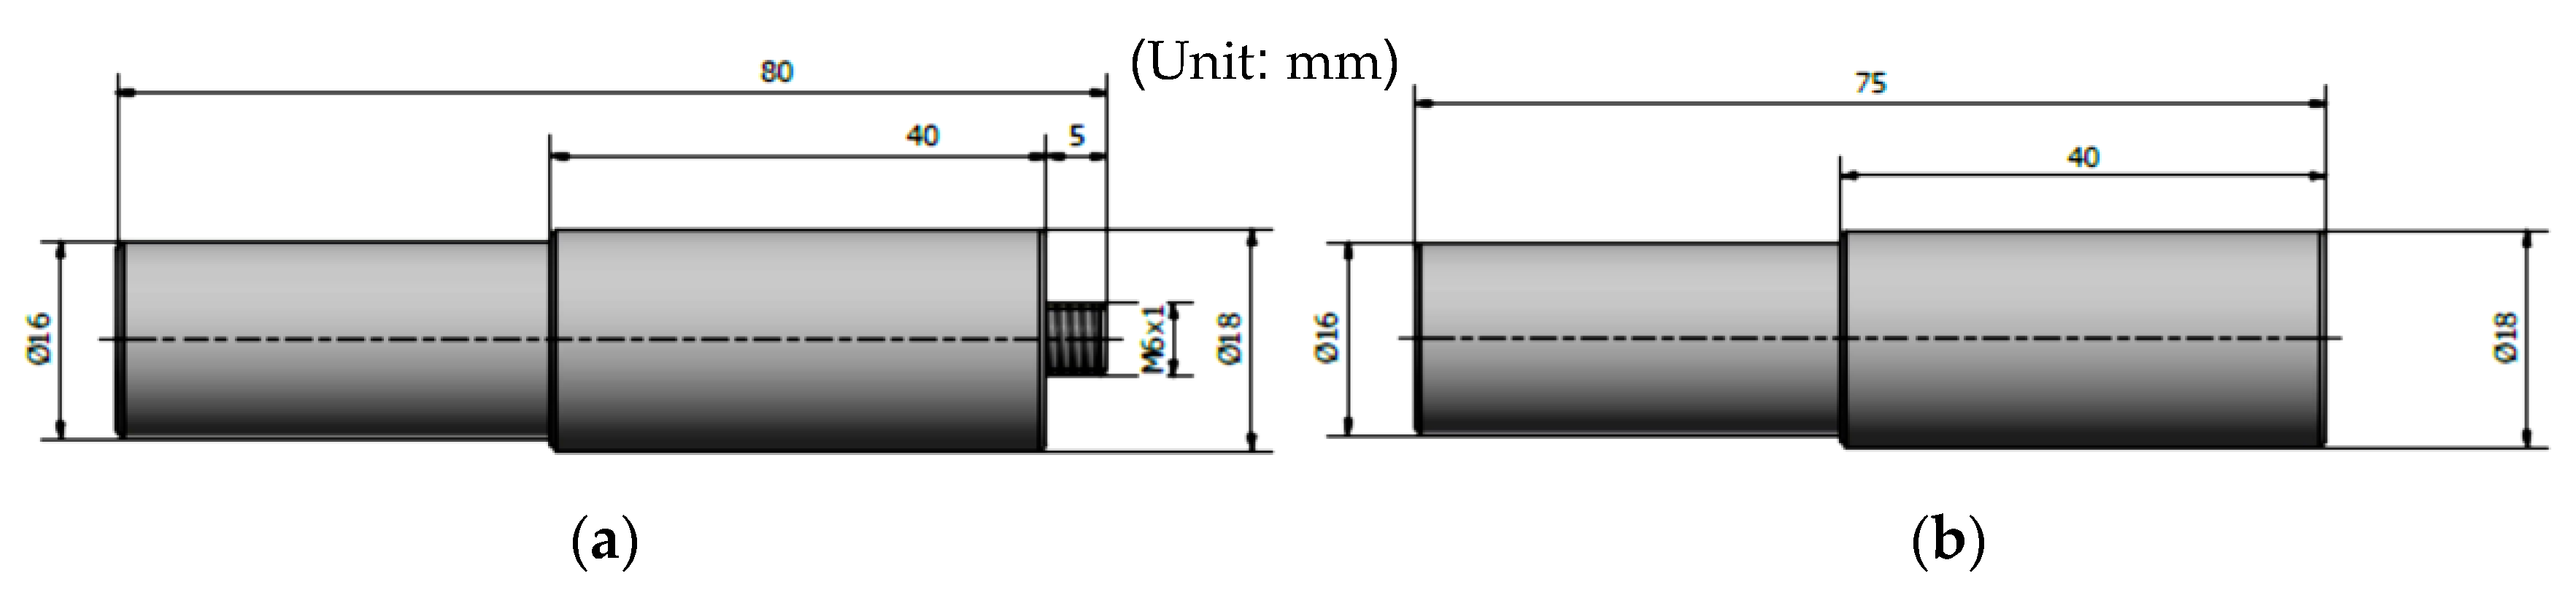
2.1. Preparation of Tool and Workpiece
2.2. Taguchi Experimental Design Methods
2.3. Measurement Method and Test Results
2.4. Grey Relational Analysis of the Experimental Data
3. Results and Discussion
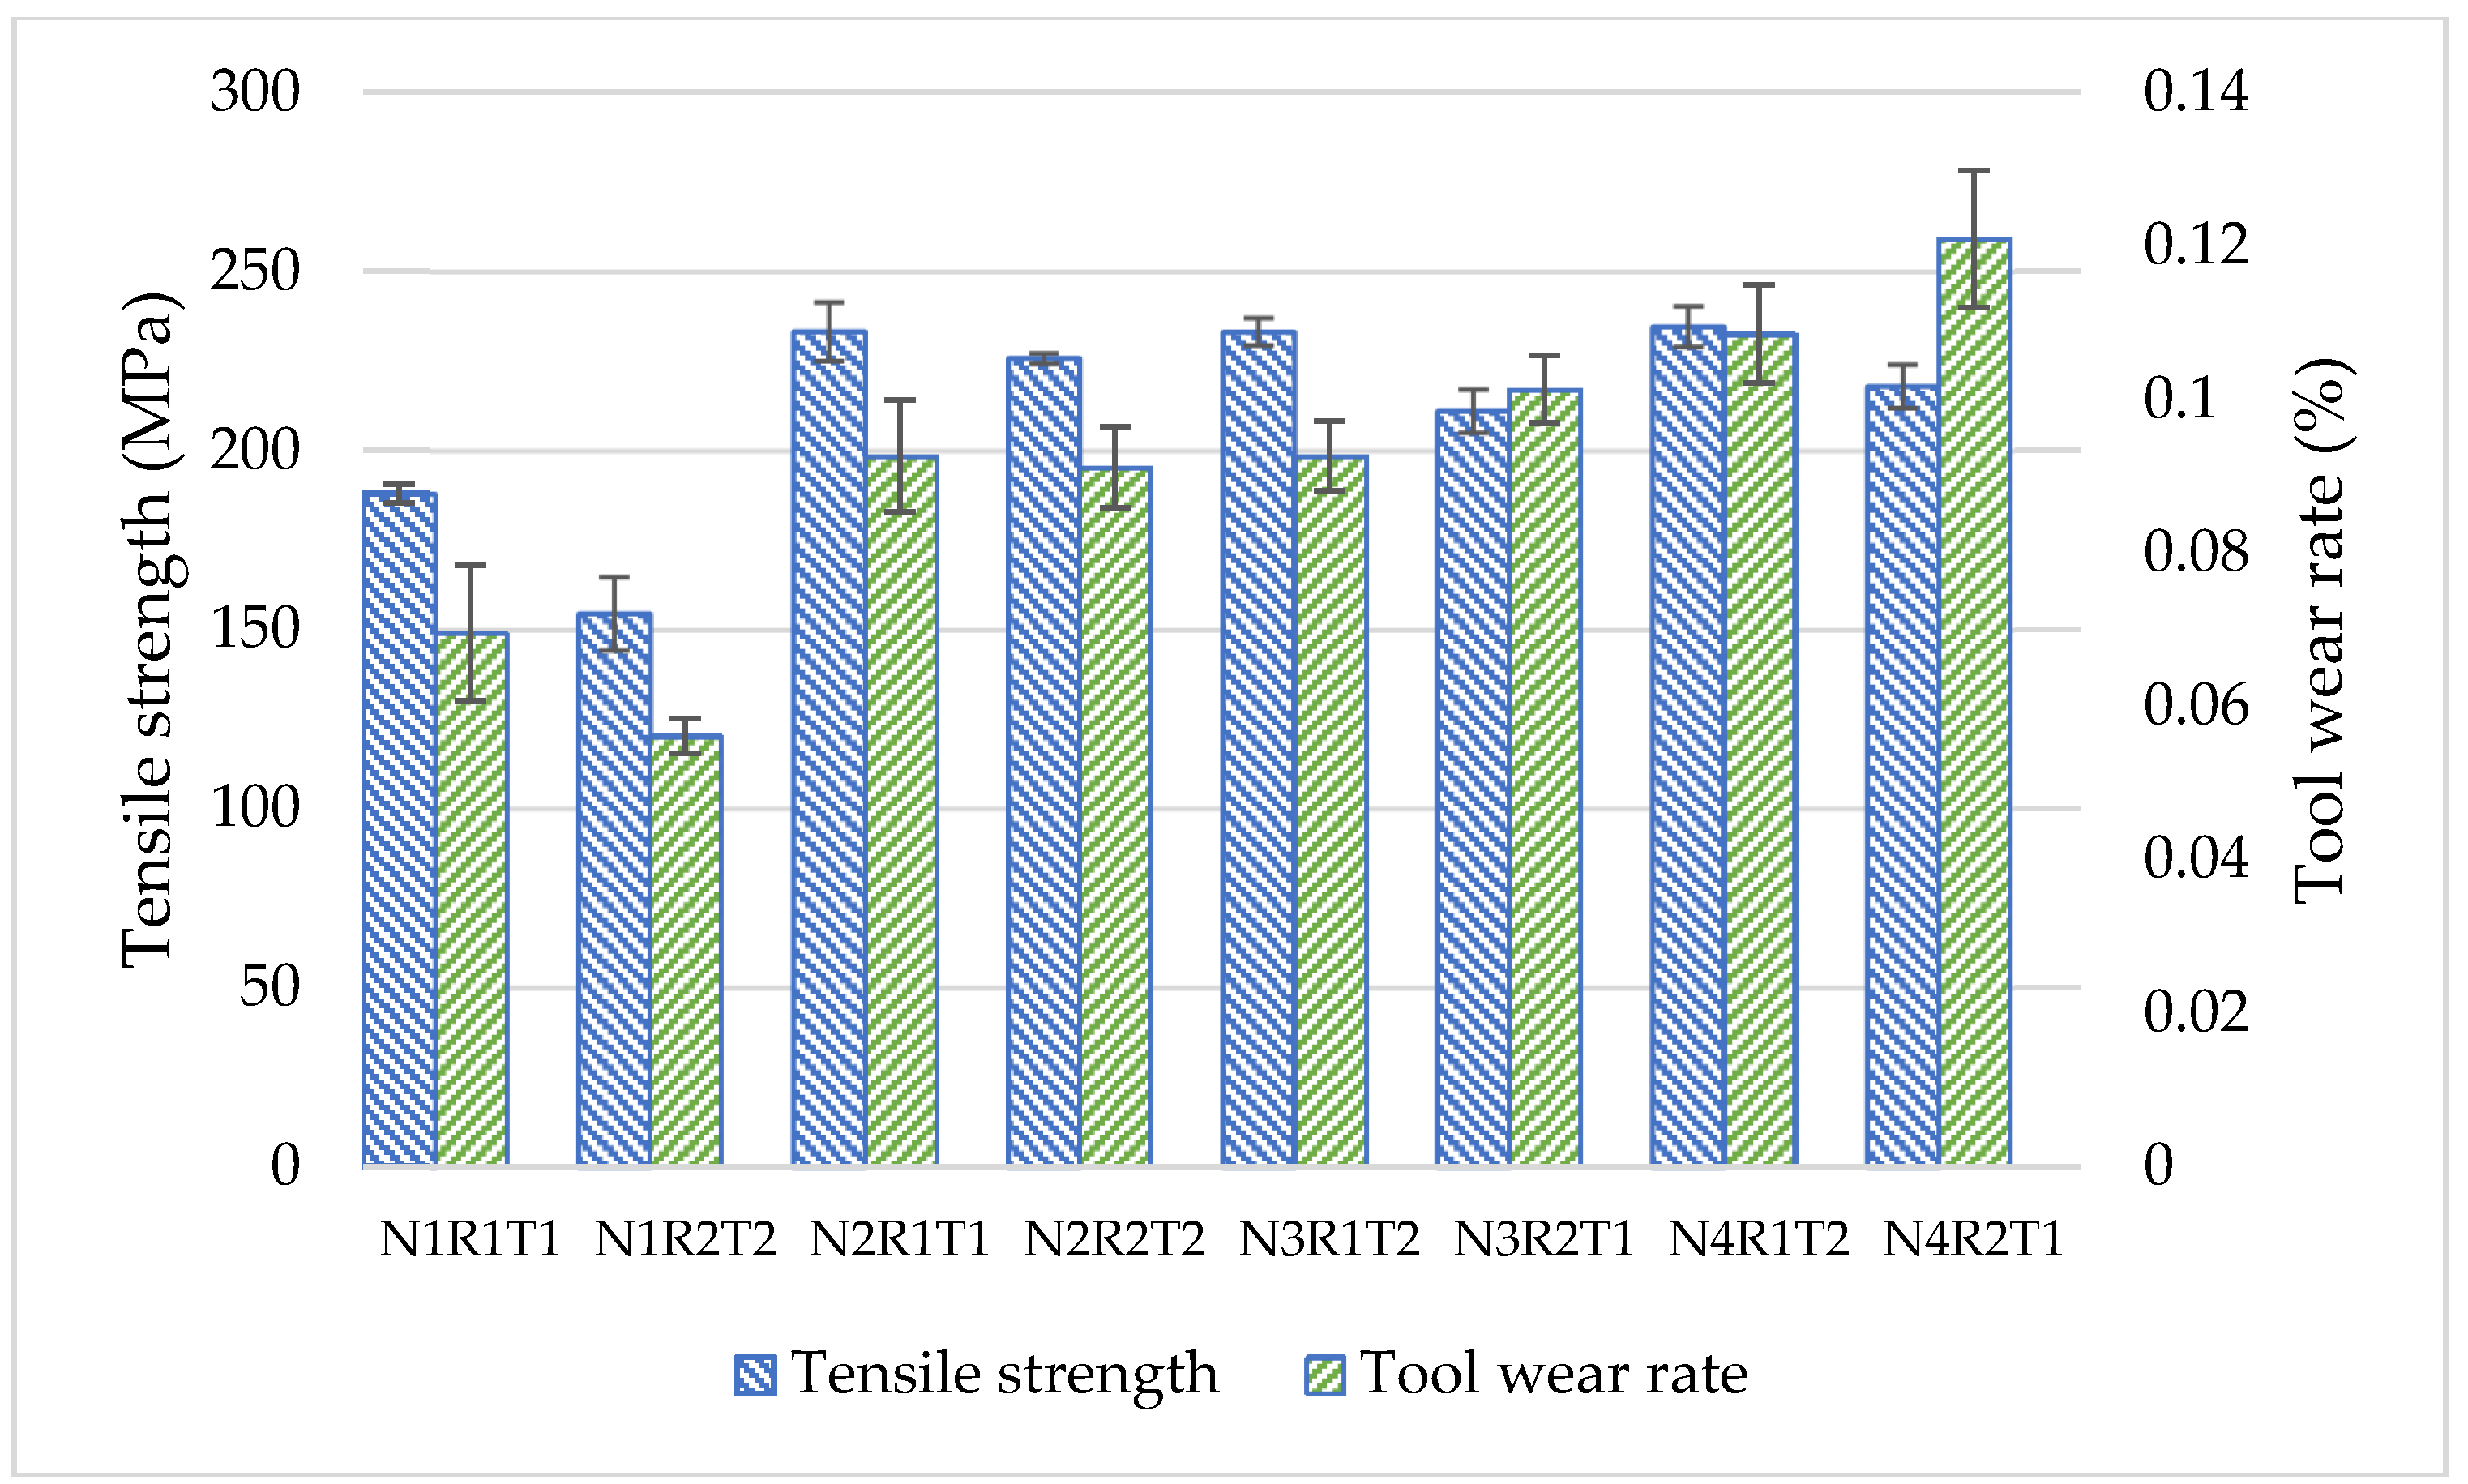
3.1. Tensile Strength and Tool Wear
3.2. Confirmation Experiments
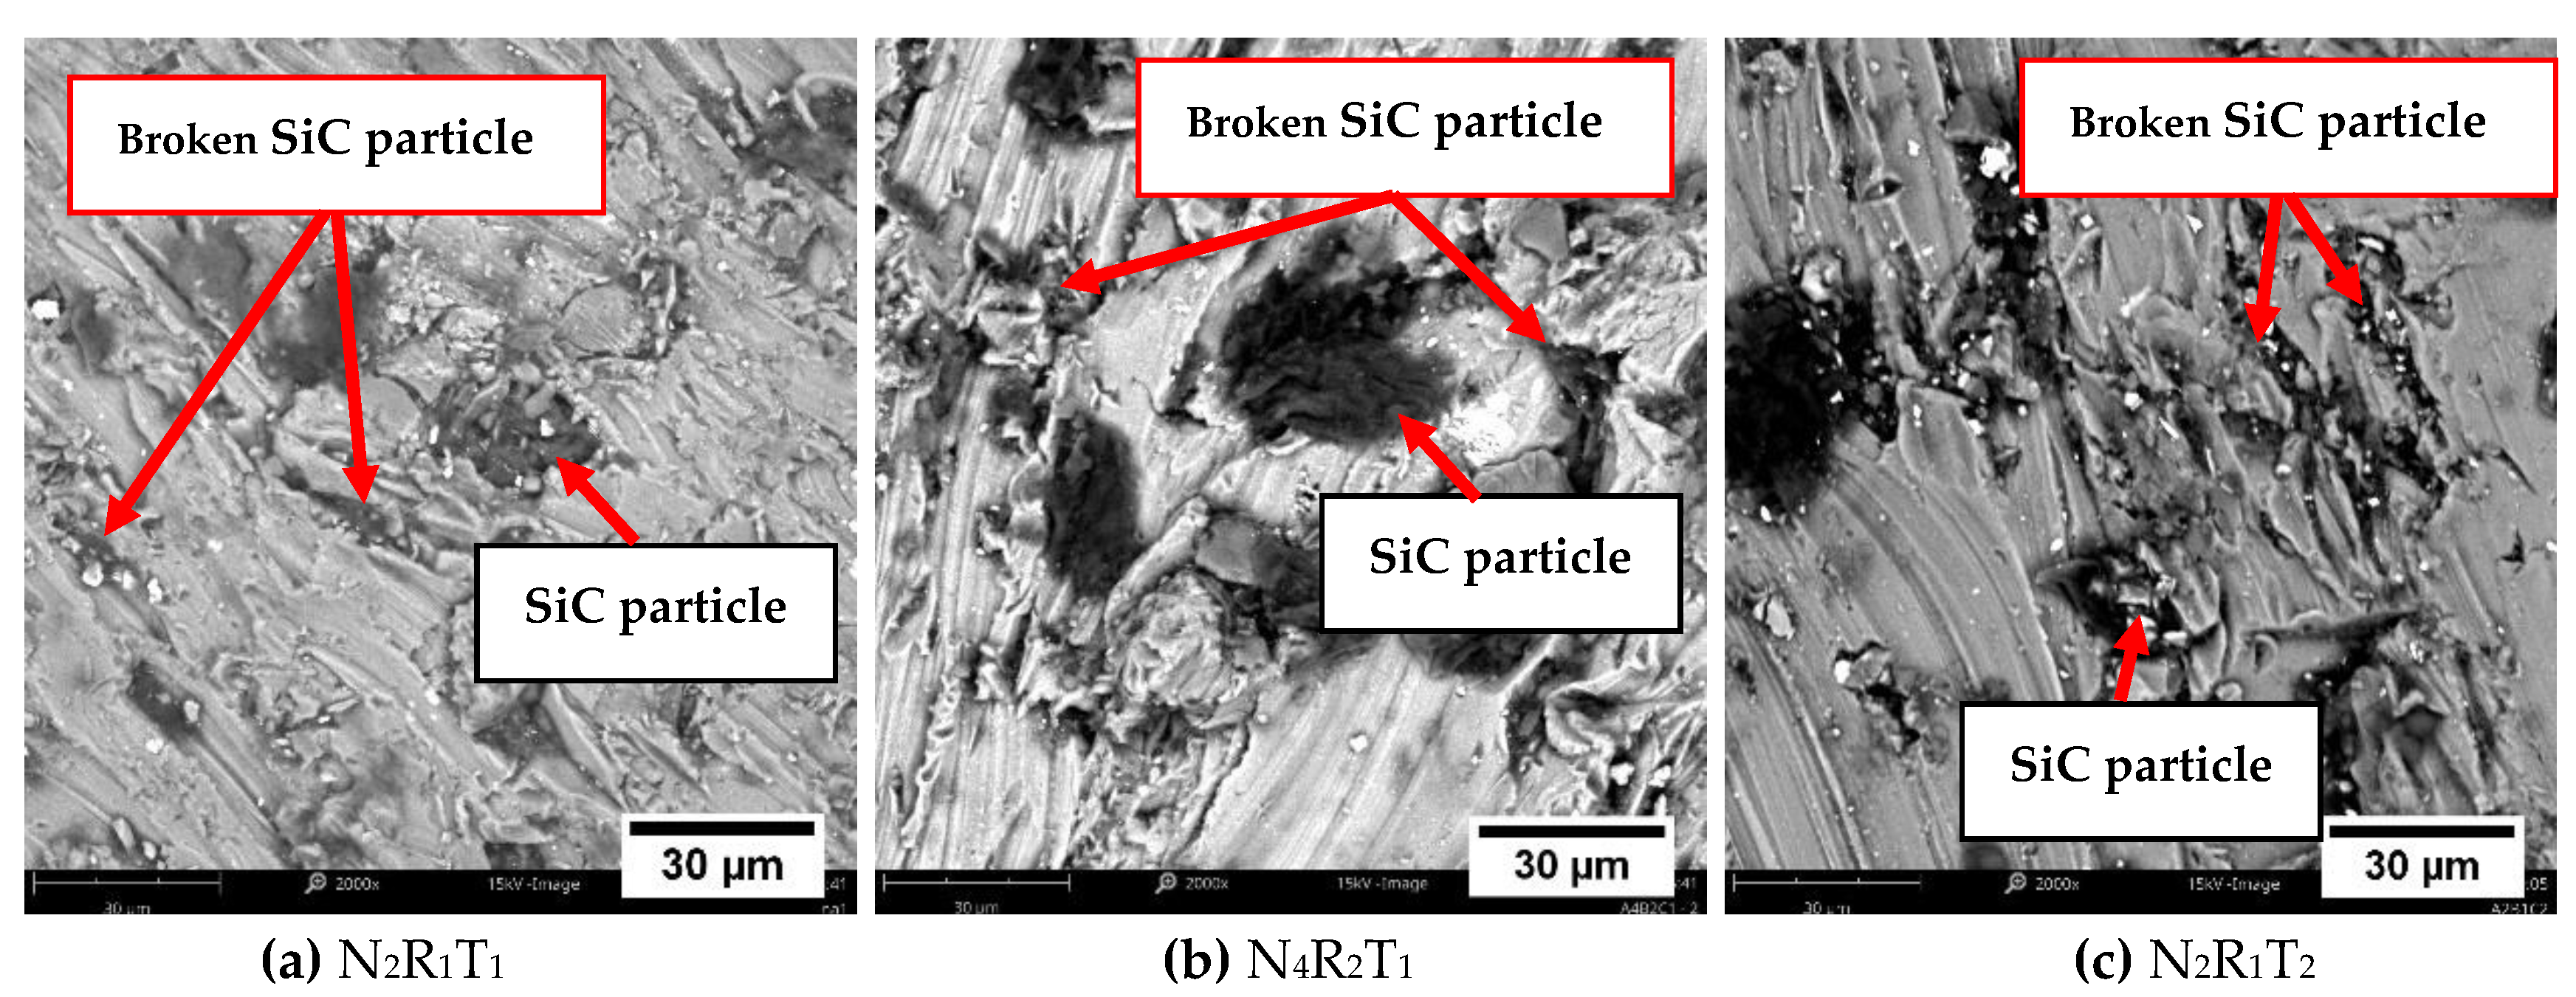
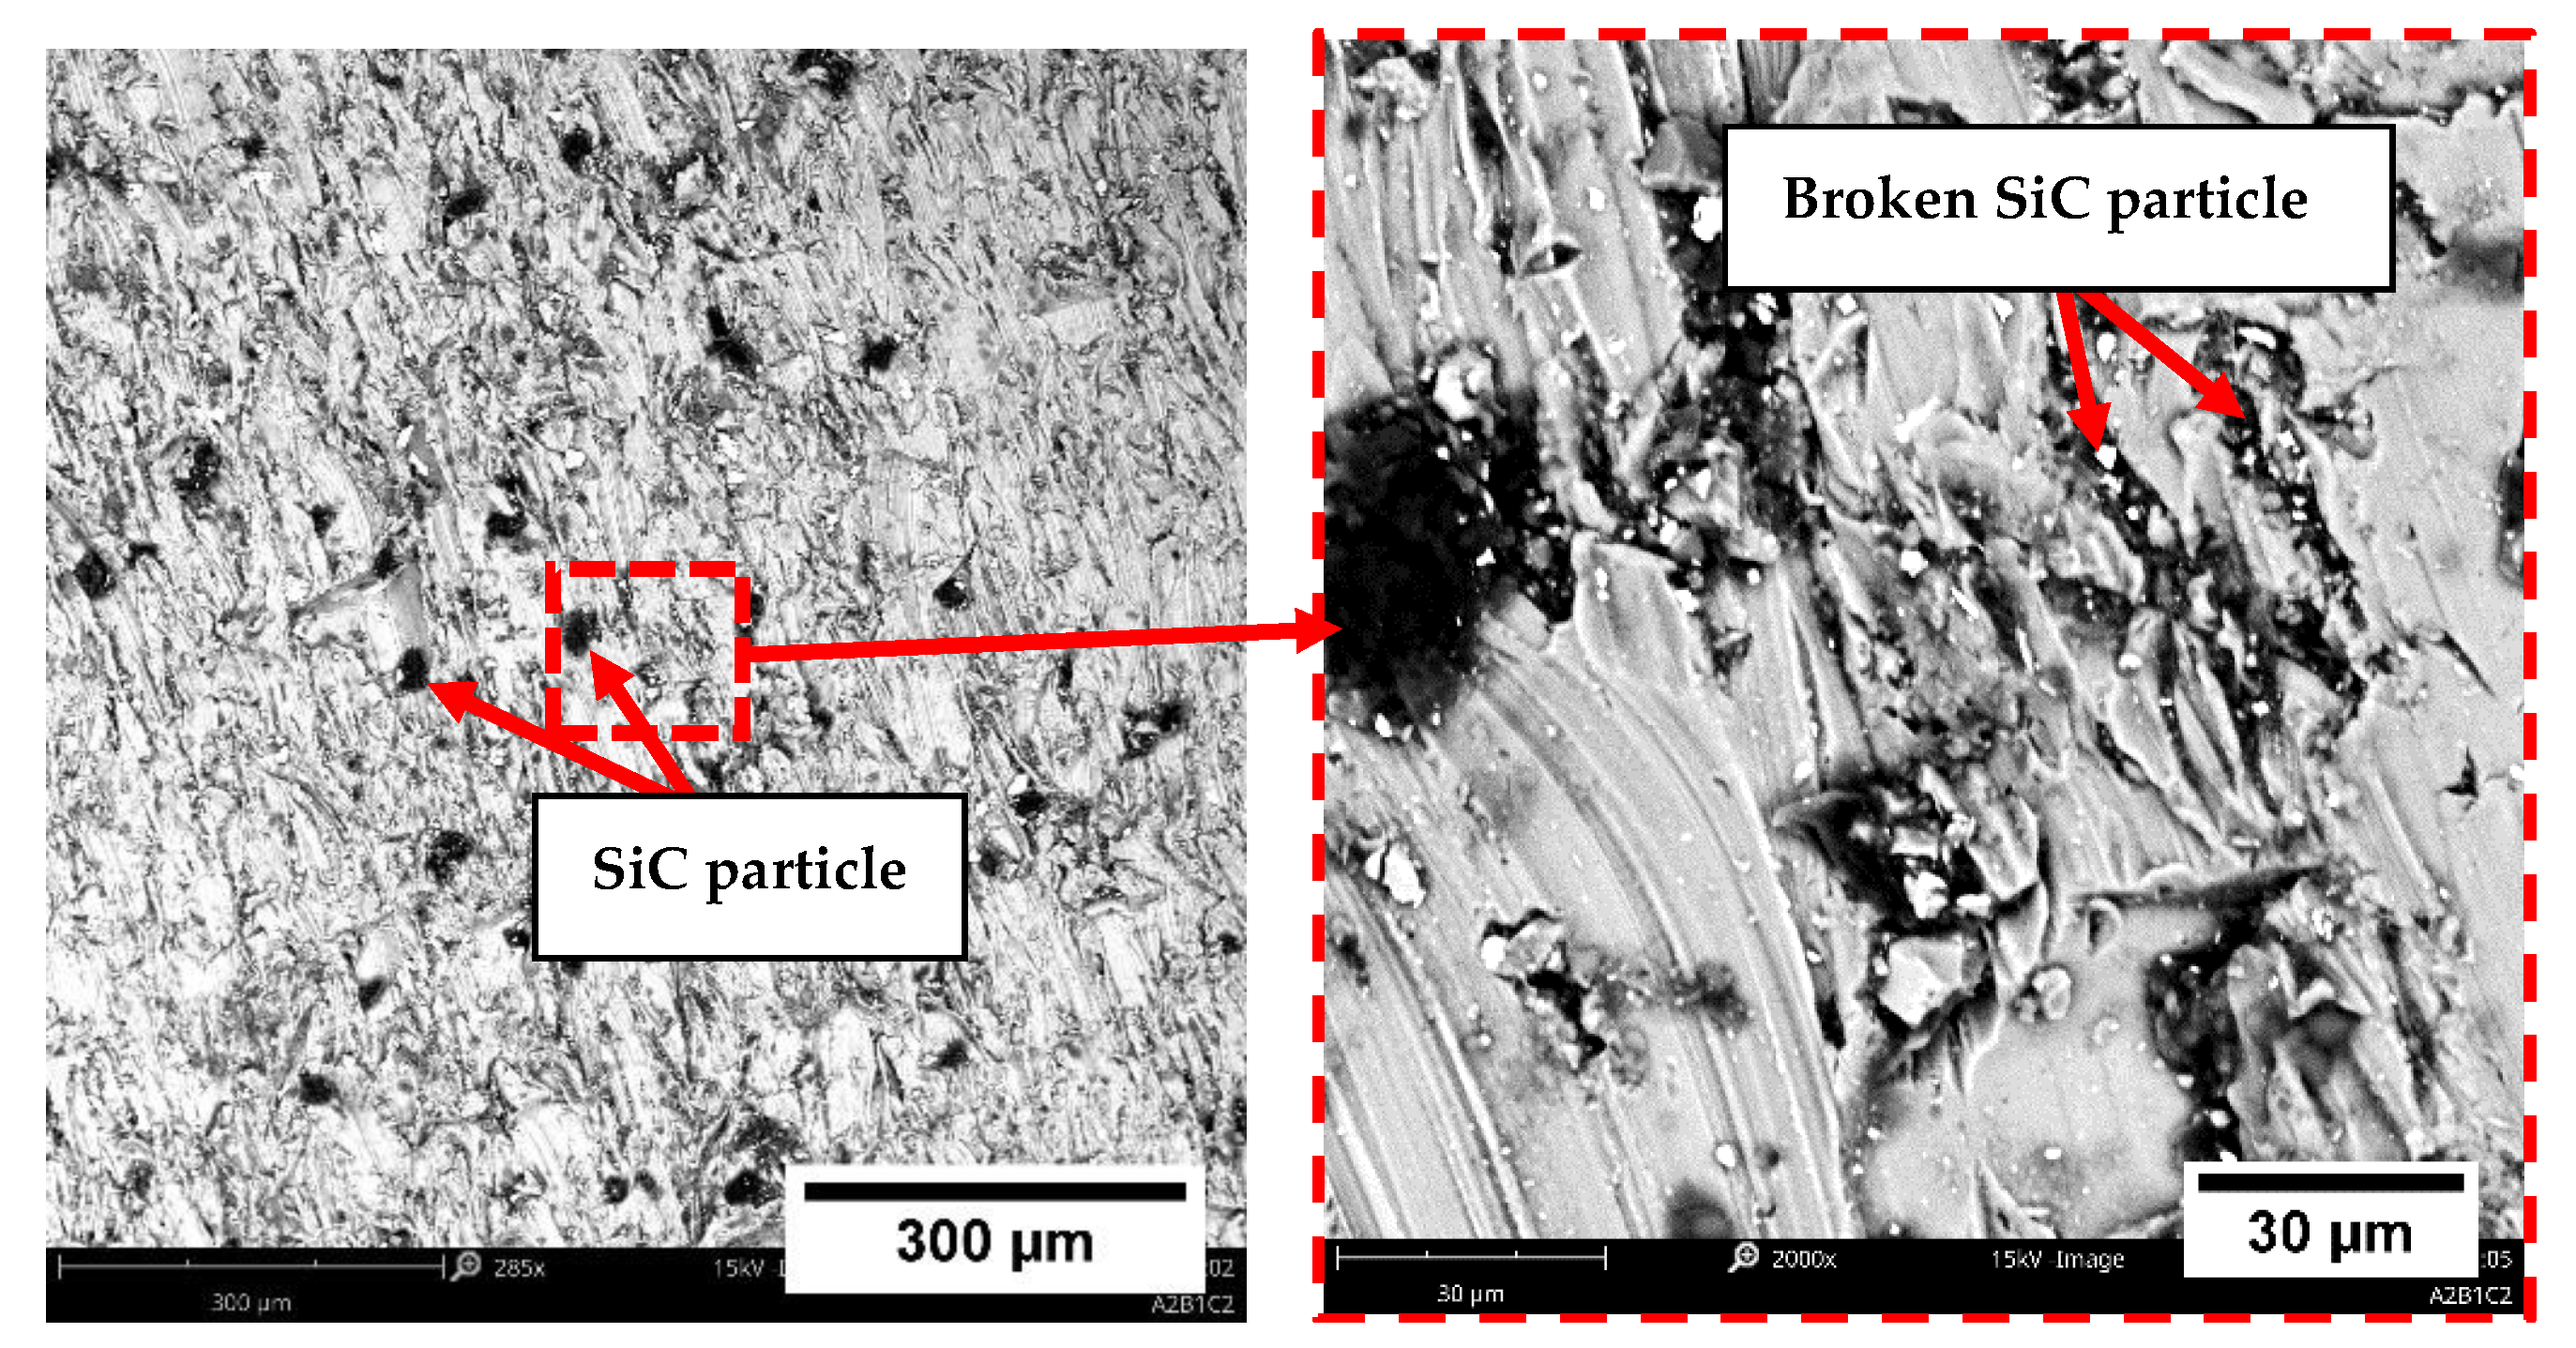
3.2.1. Microstructural Characterization
3.2.2. Comparison of Process Parameters Condition
4. Conclusions
Author Contributions
Funding
Acknowledgments
Conflicts of Interest
References
- Sharma, V.; Gupta, Y.; Kumar, B.V.M.; Prakash, U. Friction Stir Processing Strategies for Uniform Distribution of Reinforcement in a Surface Composite. Mater. Manuf. Process. 2016, 31, 1384–1392. [Google Scholar] [CrossRef]
- Thankachan, T.; Prakash, K.S. Microstructural, Mechanical and Tribological Behavior of Aluminum Nitride Reinforced Copper Surface Composites Fabricated Through Friction Stir Processing Route. Mater. Sci. Eng. A 2017, 688, 301–308. [Google Scholar] [CrossRef]
- Eskandari, H.; Taheri, R. A Novel Technique for Development of Aluminum Alloy Matrix/TiB2/Al2O3 Hybrid Surface Nanocomposite by Friction Stir Processing. Procedia Mater. Sci. 2015, 11, 503–508. [Google Scholar] [CrossRef] [Green Version]
- Bahrami, M.; Dehghani, K.; Givi, M.K.B. Novel Approach to Develop Aluminum Matrix Nano-composite Employing Friction Stir Welding Technique. Mater. Des. 2014, 53, 217–225. [Google Scholar] [CrossRef]
- Qin, Y.; Qu, M.; Pan, Y.; Zhang, C.; Schubert, D.W. Fabrication, characterization and modelling of triple hierarchic PET/CB/TPU composite fibres for strain sensing. Compos. Part A Appl. Sci. Manuf. 2020, 129, 105724. [Google Scholar] [CrossRef]
- Qu, M.; Nilsson, F.; Qin, Y.; Yang, G.; Pan, Y.; Liu, X.; Hernandez Rodriguez, G.; Chen, J.; Zhang, C.; Schubert, D.W. Electrical conductivity and mechanical properties of melt-spun ternary composites comprising PMMA, carbon fibers and carbon black. Compos. Sci. Technol. 2017, 150, 24–31. [Google Scholar] [CrossRef]
- Wang, H.; Li, L.; Qiu, S.; Zhai, W.; Li, Q.; Hao, S. Evolution of Microstructure at the Surface of 40CrNiMo7 Steel Treated by High-Current Pulsed Electron Beam. Coatings 2020, 10, 311. [Google Scholar] [CrossRef] [Green Version]
- Karbalaei Akbari, M.; Baharvandi, H.R.; Shirvanimoghaddam, K. Tensile and fracture behavior of nano/micro TiB2 particle reinforced casting A356 aluminum alloy composites. Mater. Des. 2015, 66, 150–161. [Google Scholar] [CrossRef]
- Sharifitabar, M.; Sarani, A.; Khorshahian, S.; Afarani, M.S. Fabrication of 5052Al/Al2O3 Nanoceramic Particle Reinforced Composite via Friction Stir Processing Route. Mater. Des. 2011, 32, 4164–4172. [Google Scholar] [CrossRef]
- Yang, M.; Xu, C.; Wu, C.; Lin, K.-C.; Chao, Y.J.; An, L. Fabrication of AA6061/Al2O3 Nano Ceramic Particle Reinforced Composite Coating by using Friction Stir Processing. J. Mater. Sci. 2010, 45, 4431–4438. [Google Scholar] [CrossRef]
- Gandra, J.; Miranda, R.; Vilac, P.; Velhinho, A.; Teixeira, J.P. Functionally Graded Materials Produced by Friction Stir Processing. J. Mater. Process. Technol. 2011, 211, 1659–1668. [Google Scholar] [CrossRef]
- Sharma, V.; Prakash, U.; Kumar, B.M. Surface Composites by Friction Stir Processing: A Review. J. Mater. Process. Technol. 2015, 224, 117–134. [Google Scholar] [CrossRef]
- Salehi, M.; Saadatmand, M.; Aghazadeh Mohandesi, J. Optimization of Process Parameters for Producing AA6061/SiC Nanocomposites by Friction Stir Processing. Trans. Nonferrous Met. Soc. China 2012, 22, 1055–1063. [Google Scholar] [CrossRef]
- Kurt, H.I. Influence of Hybrid Ratio and Friction Stir Processing Parameters on Ultimate Tensile Strength of 5083 Aluminum Matrix Hybrid Composites. Compos. Part B 2016, 93, 26–34. [Google Scholar] [CrossRef]
- Shahraki, S.; Khorasani, S.; Behnagh, R.A.; Fotouhi, Y.; Bisadi, H. Producing of AA5083/ZrO2 Nanocomposite by Friction Stir Processing (FSP). Metall. Mater. Trans. B 2013, 44, 1546–1553. [Google Scholar] [CrossRef]
- Narimani, M.; Lotfi, B.; Sadeghian, Z. Investigating the Microstructure and Mechanical Properties of Al-TiB2 Composite Fabricated by Friction Stir Processing (FSP). Mater. Sci. Eng. A 2016, 673, 436–442. [Google Scholar] [CrossRef]
- Sabry, I.; El-Kassas, A.M.; Mourad, A.-H.I.; Thekkuden, D.T.; Qudeiri, J.A. Friction Stir Welding of T-Joints: Experimental and Statistical Analysis. J. Manuf. Mater. Process 2019, 3, 38. [Google Scholar] [CrossRef] [Green Version]
- Prado, R.A.; Murr, L.E.; Shindo, D.J.; Soto, K.F. Tool Wear in the Friction-Stir Welding of Aluminum Alloy 6061+20%Al2O3: A Preliminary Study. Scr. Mater. 2001, 45, 745–780. [Google Scholar] [CrossRef]
- Shindo, D.J.; Rivera, A.R.; Murr, L.E. Shape Optimization for Tool Wear in The Friction-Stir Welding of Cast Al359-20%SiC MMC. J. Mater. Sci. 2002, 37, 4999–5005. [Google Scholar] [CrossRef]
- Prado, R.A.; Murr, L.E.; Soto, K.F.; McClure, J.C. Self-Optimization in Tool Wear for Friction-Stir Welding of Al 6061/20%Al2O3 MMC. Mater. Sci. Eng. A 2003, 349, 156–165. [Google Scholar] [CrossRef]
- Fernandez, G.J.; Murr, L.E. Characterization of Tool Wear and Weld Optimization in the Friction-Stir Welding of Cast Aluminum 359+20%SiC Metal-Matrix Composite. Mater. Charact. 2004, 52, 65–75. [Google Scholar] [CrossRef]
- Thompson, B.; Babu, S.S. Tool Degradation Characterization in the Friction Stir Welding of Hard Metals. Weld. J. 2010, 89, 256–261. [Google Scholar]
- Rahsepar, M.; Jarahimoghadam, H. The Influence of Multipass Friction Stir Processing on the Corrosion Behavior and Mechanical Properties of Zircon-reinforced Al Metal Matrix Composites. Mater. Sci. Eng. A 2016, 671, 214–220. [Google Scholar] [CrossRef]
- Deng, J.L. Introduction to Grey System. J. Grey Syst. UK 1989, 1, 1–24. [Google Scholar]
- Ramu, I.; Srinivas, P.; Vekatesh, K. Taguchi based grey relational analysis for optimization of machining parameters of CNC turning steel 316. IOP Conf. Ser. Mater. Sci. Eng. 2018, 377, 012078. [Google Scholar] [CrossRef]
- Wojciechowski, S.; Maruda, R.W.; Krolczyk, G.M.; Nieslony, P. Application of signal to noise ratio and grey relational analysis to minimize forces and vibrations during precise ball end milling. Precis. Eng. 2018, 51, 582–596. [Google Scholar] [CrossRef]
- Reddy, V.; Jawahar, M. Multi-objective optimization of parameters during EDM of aluminum alloy 6082 using grey relation analysis. Int. J. Latest Trends Eng. Technol. 2016, 6, 570–576. [Google Scholar]
- Zohoor, M.; Givi, M.B.; Salami, P. Effect of Processing Parameters on Fabrication of Al–Mg/Cu Composites via Friction Stir Processing. Mater. Des. 2012, 39, 358–365. [Google Scholar] [CrossRef]
- Dhayalan, R.; Kalaiselvan, K.; Sathiskumar, R. Characterization of AA6063/SiC-Gr Surface Composites Produced by FSP Technique. Proced. Eng. 2014, 97, 625–631. [Google Scholar] [CrossRef] [Green Version]
- Vijayavel, P.; Balasubramanian, V.; Sundaram, S. Effect of Shoulder Diameter to Pin Diameter (D/d) Ratio on Tensile Strength and Ductility of Friction Stir Processed LM25AA-5%SiCp Metal Matrix Composites. Mater. Des. 2014, 57, 1–9. [Google Scholar] [CrossRef]
- Zahmatkesh, B.; Enayati, M.H. A Novel Approach for Development of Surface Nanocomposite by Friction Stir Processing. Mater. Sci. Eng. A 2010, 527, 6734–6740. [Google Scholar] [CrossRef]
- Ke, L.; Huang, C.; Xing, L.; Huang, K. Al–Ni Intermetallic Composites Produced in Situ by Friction Stir Processing. J. Alloys Compd. 2010, 503, 494–499. [Google Scholar] [CrossRef]
- Qian, J.; Li, J.; Xiong, J.; Zhang, F.; Lin, X. In Situ Synthesizing Al3Ni for Fabrication of Intermetallic-Reinforced Aluminum Alloy Composites by Friction Stir Processing. Mater. Sci. Eng. A 2012, 550, 279–285. [Google Scholar] [CrossRef]
- Prater, T.J. Predictive Process Modeling of Tool Wear in Friction Stir Welding of Metal Matrix Composites. Ph.D. Dissertation, Graduate School of Vanderbilt University, Nashville, TN, USA, 2012. [Google Scholar]
- Prater, T.; Strauss, A.; Cook, G.; Gibson, B.; Cox, C. A Comparative Evaluation of the Wear Resistance of Various Tool Materials in Friction Stir Welding of Metal Matrix Composites. J. Mater. Eng. Perform. 2013, 22, 1807–1813. [Google Scholar] [CrossRef]
- Surekha, K.; Els-Botes, A. Effect of Cryotreatment on Tool Wear Behaviour of Bohler K390 and AISI H13 Tool Steel During Friction Stir Welding of Copper. Trans. Indian Inst. Met. 2012, 65, 259–264. [Google Scholar] [CrossRef]
- Ghetiya, N.D.; Patel, K.M.; Kavar, A.J. Multi-objective Optimization of FSW Process Parameters of Aluminium Alloy Using Taguchi-Based Grey Relational Analysis. Trans. Indian Inst. Met. 2016, 69, 917–923. [Google Scholar] [CrossRef]
- Rathee, S.; Maheshwari, S.; Siddiquee, A.N.; Srivastava, M. Investigating the Effects of SiC Particle Sizes on Microstructural and Mechanical Properties of AA5059/SiC Surface Composites During Multi-Pass FSP. Silicon 2019, 11, 797–805. [Google Scholar] [CrossRef]
- Prater, T.; Gibson, B.; Cox, C.; Cook, G.E.; Strauss, A.M. Effect of particle size on tool wear in friction stir welding of al 6061 with silicon carbide reinforcement. J. Manuf. Technol. Res. 2014, 6, 125–142. [Google Scholar]


| Specific Gravity (g/cm3) | Young’s Modulus (kgf/mm2) | Modulus of Rigidity (kgf/mm2) | Poisson’s Ratio | Heat Treated Hardness (HRC) |
|---|---|---|---|---|
| 7.87 | 21,700 | 8480 | 0.28 | 62–64 |
| Chemical Composition w/% | Si | Fe | Cu | Mn | Mg | Cr | Zn |
| 0.08 | 0.23 | 0.002 | 0.005 | 2.24 | 0.20 | 0.007 | |
| Mechanical Properties | Yield Strength (MPa) | Tensile Strength (MPa) | Elongation (%) | Brinell Hardness (HB) | |||
| 148.36 | 201.10 | 23.51 | 57.07 | ||||
| Parameters | Code | Levels | |||
|---|---|---|---|---|---|
| 1 | 2 | 3 | 4 | ||
| Number of pass (passes) | N | 1 | 2 | 3 | 4 |
| Rotational speed (RPM) | R | 1000 | 1500 | ||
| Traverse speed (mm/min) | T | 10 | 30 | ||
| Parameters | Values | References |
|---|---|---|
| Tool shape | cylindrical threaded pin profile | [28,29] |
| Shoulder diameter to pin diameter ratio | 3:1 | [30] |
| Tilted angle | 3° | [31,32] |
| Shoulder plunged depth | 0.3 mm | [33] |
| Dwell time | 30 s | [30] |
| Traverse distance per time | 150 mm | [20] |
| Condition | A (passes) | B (RPM) | C (mm/min) | Tensile Strength (MPa) | Tool Wear Rate (%) | ||
|---|---|---|---|---|---|---|---|
| S.D. | S.D. | ||||||
| N1R1T1 | 1 | 1000 | 10 | 187.92 | 2.5314 | 0.0695 | 0.0088 |
| N1R2T2 | 1 | 1500 | 30 | 154.59 | 10.2389 | 0.0561 | 0.0023 |
| N2R1T1 | 2 | 1000 | 10 | 233.32 | 8.1600 | 0.0926 | 0.0073 |
| N2R2T2 | 2 | 1500 | 30 | 225.86 | 1.4354 | 0.0911 | 0.0053 |
| N3R1T2 | 3 | 1000 | 30 | 233.24 | 3.8325 | 0.0926 | 0.0045 |
| N3R2T1 | 3 | 1500 | 10 | 211.16 | 6.0387 | 0.1013 | 0.0044 |
| N4R1T2 | 4 | 1000 | 30 | 234.73 | 5.6993 | 0.1085 | 0.0064 |
| N4R2T1 | 4 | 1500 | 10 | 218.07 | 6.0245 | 0.1209 | 0.0090 |
| Condition | Normalized Data, xi(k) | |
|---|---|---|
| Tensile Strength | Tool Wear Rate | |
| Ideal sequence | 1.0000 | 1.0000 |
| N1R1T1 | 0.4159 | 0.7931 |
| N1R2T2 | 0.0000 | 1.0000 |
| N2R1T1 | 0.9824 | 0.4376 |
| N2R2T2 | 0.8893 | 0.4598 |
| N3R1T2 | 0.9814 | 0.4367 |
| N3R2T1 | 0.7059 | 0.3028 |
| N4R1T2 | 1.0000 | 0.1921 |
| N4R2T1 | 0.7921 | 0.0000 |
| Condition | Grey Relational Coefficient | Grey Relational Grade | Order | |
|---|---|---|---|---|
| Tensile Strength ξi(1) | Tool Wear ξi(2) | |||
| N1R1T1 | 0.3393 | 0.7719 | 0.5556 | 6 |
| N1R2T2 | 0.2308 | 1.0000 | 0.6154 | 5 |
| N2R1T1 | 0.9446 | 0.5545 | 0.7496 | 1 |
| N2R2T2 | 0.7305 | 0.5644 | 0.6475 | 4 |
| N3R1T2 | 0.9417 | 0.5541 | 0.7479 | 2 |
| N3R2T1 | 0.5050 | 0.5010 | 0.5030 | 7 |
| N4R1T2 | 1.0000 | 0.4642 | 0.7321 | 3 |
| N4R2T1 | 0.5907 | 0.4118 | 0.5012 | 8 |
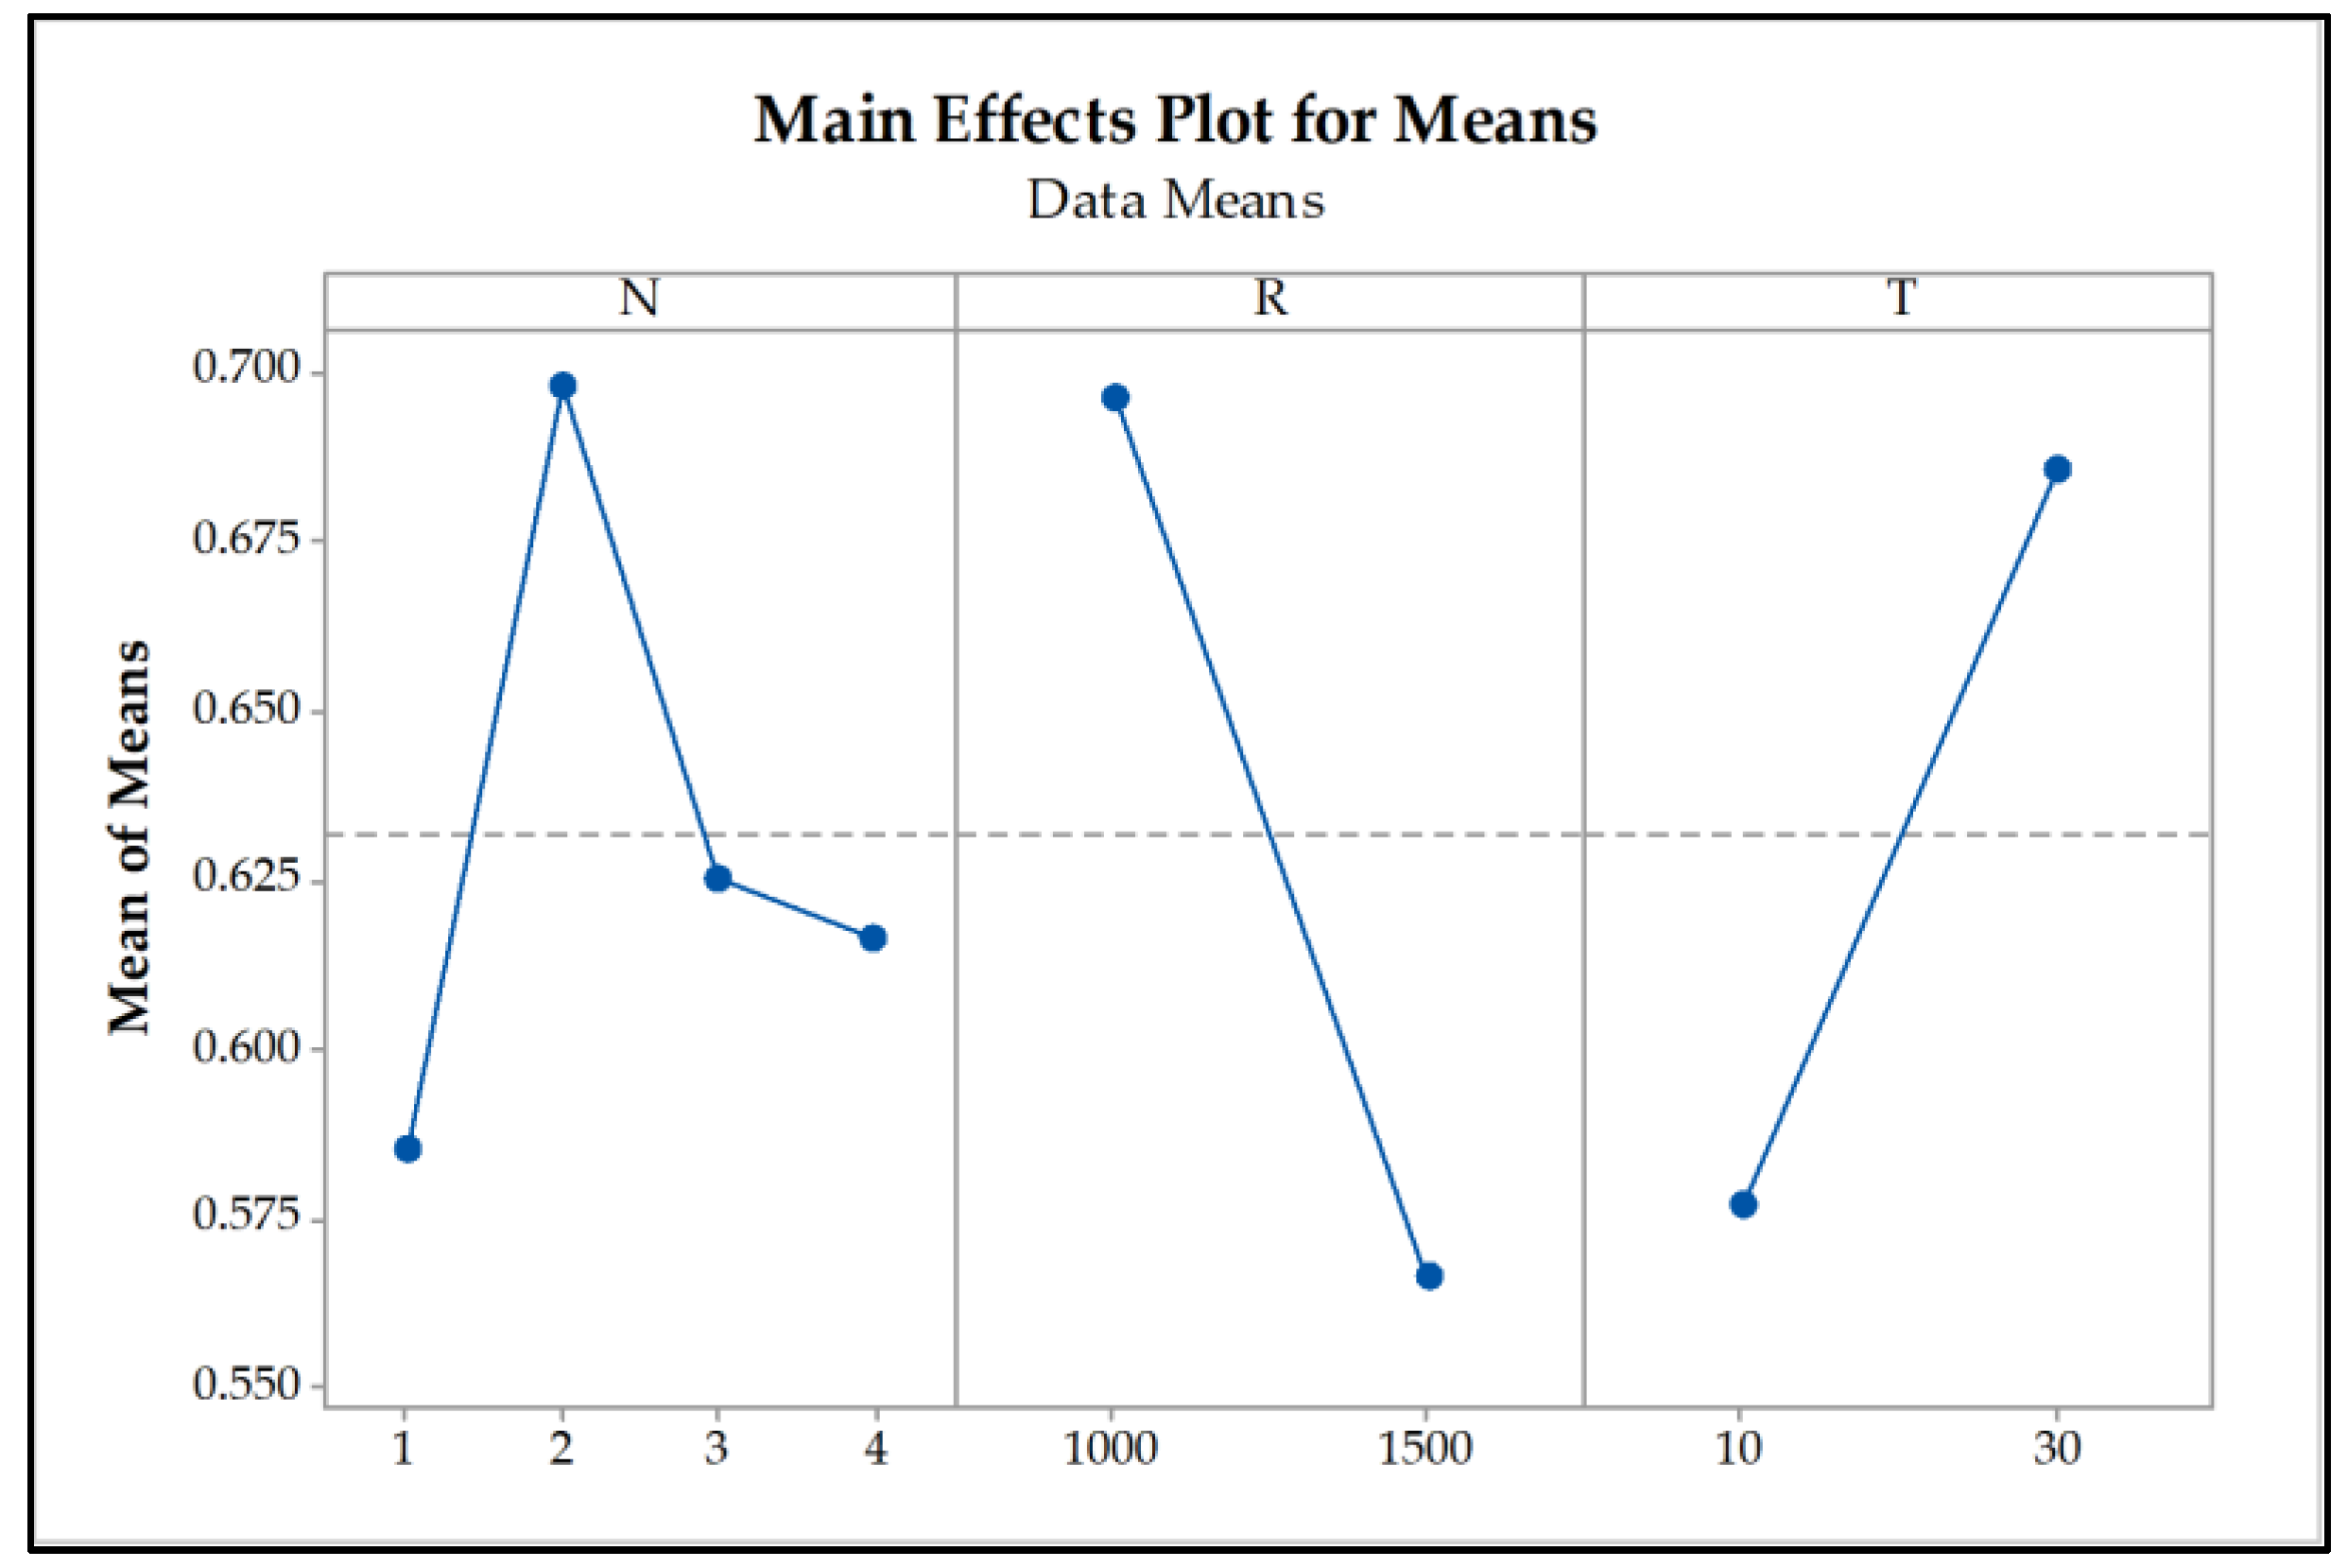
| Parameters | Grey Relational Grade | |||||
|---|---|---|---|---|---|---|
| Level 1 | Level 2 | Level 3 | Level 4 | Max-Min | Rank | |
| N | 0.5855 | 0.6985 * | 0.6254 | 0.6167 | 0.1130 | 2 |
| R | 0.6963 * | 0.5668 | - | - | 0.1295 | 1 |
| T | 0.5773 | 0.6857 * | - | - | 0.1084 | 3 |
| Parameters | DF | SS | MS | % Contribution |
|---|---|---|---|---|
| N | 3 | 0.0137 | 0.0046 | 7.05 |
| R | 1 | 0.0336 | 0.0335 | 51.68 |
| T | 1 | 0.0235 | 0.0235 | 36.18 |
| Error | 2 | 0.0066 | 0.033 | 5.08 |
| Total | 7 | 0.0774 | - | - |
| Factor Level | Process Parameter Conditions | ||
|---|---|---|---|
| Best L8 Experiment | Worst L8 Experiment | Confirmed Experiment | |
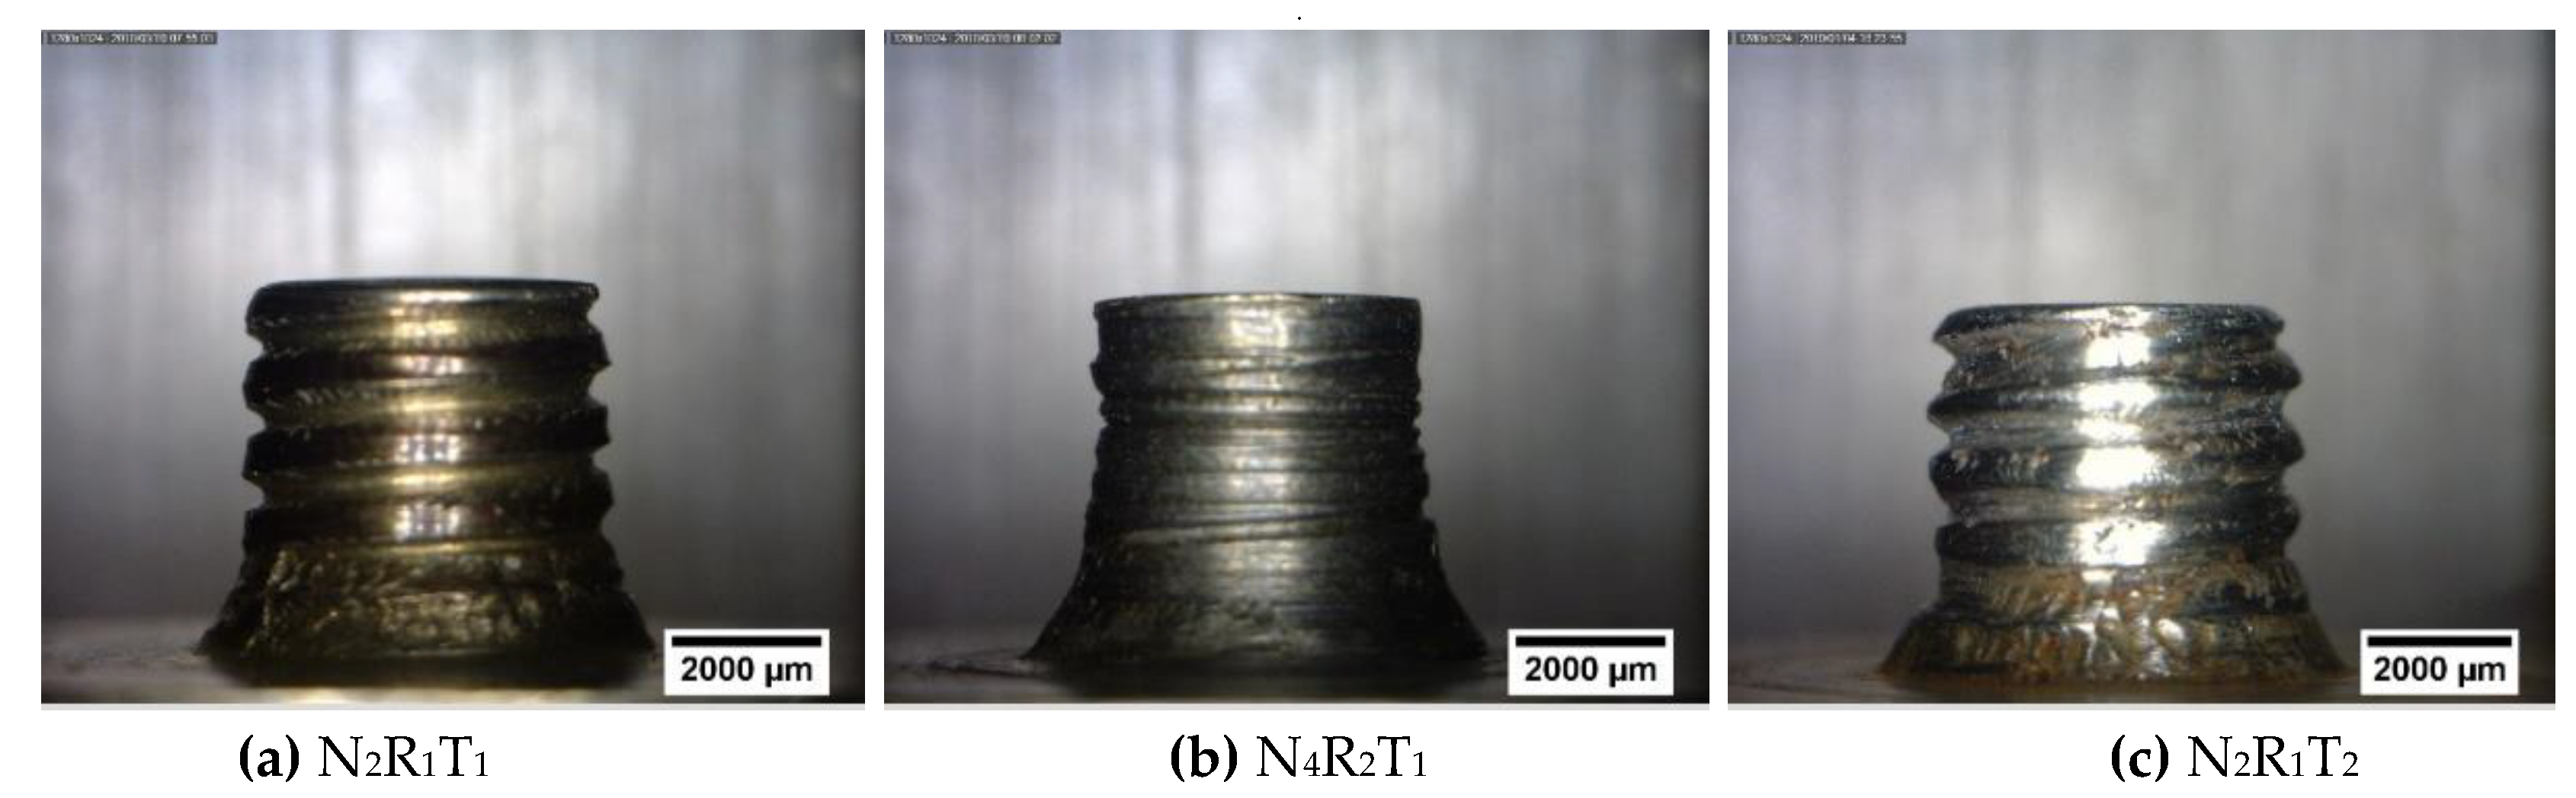
| N2R1T1 | N4R2T1 | N2R1T2 | |
| Tensile strength (MPa) | 233.32 | 218.07 | 229.90 |
| Tool wear rate (%) | 0.0926 | 0.1209 | 0.0851 |
| Grey relational grade | 0.7496 | 0.5012 | 0.8175 |
© 2020 by the authors. Licensee MDPI, Basel, Switzerland. This article is an open access article distributed under the terms and conditions of the Creative Commons Attribution (CC BY) license (http://creativecommons.org/licenses/by/4.0/).
Share and Cite
Kraiklang, R.; Onwong, J.; Santhaweesuk, C. Multi-Performance Characteristics of AA5052 + 10% SiC Surface Composite by Friction Stir Processing. J. Compos. Sci. 2020, 4, 36. https://doi.org/10.3390/jcs4020036
Kraiklang R, Onwong J, Santhaweesuk C. Multi-Performance Characteristics of AA5052 + 10% SiC Surface Composite by Friction Stir Processing. Journal of Composites Science. 2020; 4(2):36. https://doi.org/10.3390/jcs4020036
Chicago/Turabian StyleKraiklang, Rungwasun, Jariyaporn Onwong, and Charuayporn Santhaweesuk. 2020. "Multi-Performance Characteristics of AA5052 + 10% SiC Surface Composite by Friction Stir Processing" Journal of Composites Science 4, no. 2: 36. https://doi.org/10.3390/jcs4020036
APA StyleKraiklang, R., Onwong, J., & Santhaweesuk, C. (2020). Multi-Performance Characteristics of AA5052 + 10% SiC Surface Composite by Friction Stir Processing. Journal of Composites Science, 4(2), 36. https://doi.org/10.3390/jcs4020036