Progress in Experimental and Theoretical Evaluation Methods for Textile Permeability


1
Laboratoire des Systèmes Mécaniques et d’Ingénierie Simultanée (LASMIS), Université de Technologie de Troyes, Troyes 10300, France
2
Faculty of Engineering, Lebanese University, Hadath campus, Beirut 14/6573, Lebanon
3
Chair on Composites of High Performance, Ecole Polytechnique de Montréal, Montréal, QC H3T 1J4, Canada
*
Author to whom correspondence should be addressed.
J. Compos. Sci. 2019, 3(3), 73; https://doi.org/10.3390/jcs3030073
Submission received: 9 May 2019
/
Revised: 30 June 2019
/
Accepted: 2 July 2019
/
Published: 10 July 2019
Abstract
:A great amount of attention has been given to the evaluation of the permeability tensor and several methods have been implemented for this purpose: experimental methods, as well as numerical and analytical methods. Numerical simulation tools are being seriously developed to cover the evaluation of permeability. However, the results are still far from matching reality. On the other hand, many problems still intervene in the experimental measurement of permeability, since it depends on several parameters including personal performance, preparation of specimens, equipment accuracy, and measurement techniques. Errors encountered in these parameters may explain why inconsistent measurements are obtained which result in unreliable experimental evaluation of permeability. However, good progress was done in the second international Benchmark, wherein a method to measure the in-plane permeability was agreed on by 12 institutes and universities. Critical researchers’ work was done in the field of analytical methods, and thus different empirical and analytical models have emerged, but most of those models need to be improved. Some of which are based on Cozeny-Karman equation. Others depend on numerical simulation or experiment to predict the macroscopic permeability. Also, the modeling of permeability of unidirectional fiber beds have taken the greater load of concern, whereas that of fiber bundle permeability prediction remain limited. This paper presents a review on available methods for evaluating unidirectional fiber bundles and engineering fabric permeability. The progress of each method is shown in order to clear things up.
1. Introduction
1.1. Problem Statement
Fiber-reinforced polymers, a combination of resin and fibers, are generally processed by different techniques. The methods used are Liquid Composite Molding (LCM), filament winding, pultrusion, and layup processes. Depending on the application, cost, quantity and other criteria, a manufacturing process is selected. LCM process is increasingly being used to manufacture composites due to its repeatability, moderate cost and flexibility. The process is done as follows: Injection of Resin into a mold where-in dry fabric is imbedded respecting some conditions such as (constant pressure or velocity, atmospheric or vacuum outlet ports, etc.) using different methods (RTM, VARTM, VARI, RIF). These methods are considered as promising composite manufacturing techniques because of their relatively low apparatus and tooling charges, brief cycle times, repeatability, and the ability to construct complex parts.
An important problem in LCM is detected by the presence of voids and dry zones which cause different types of defects in the manufactured part. Indeed, a well manufactured part manifested after successful mold filling is characterized by a relatively low void content including both macroscopic and microscopic voids, thus insuring optimal mechanical properties. The presence of voids has a major undesired influence on the mechanical properties. As noticed in [1,2,3] the tensile, flexural and inter-laminar shear strength decrease as the void content increases. It has been shown that the decreasing percentage of inter-laminar shear strength is the largest, while the flexural modulus decrease asymptotically with increasing void contents. However, the rate of decrease is lower for tensile strength. Moreover, the micro voids could affect the fatigue life of a structural component [4,5]. In the LCM process, voids appear due to faulty injection schemes (such as incorrect placement of injection ports and air vents), or faulty injection and vent pressures, and finally wrong filling simulations. The quality of LCM-processed components depends not only on the preform and resin system, but also on the filling process itself. Parameters influencing filling behavior are the mold geometry, resin viscosity, mold temperature, placement of the injection ports, and the most critical parameter being the permeability evaluation of the reinforcement.
Software such as PAM-RTM [6], LIMS [7] and Polyworx [8] one to predict the filling behavior and to obtain the filling times and flow front shapes. This software requires some inputs:
- The drawing of the part
- The viscosity of the resin
- The permeability tensor
The geometry and viscosity are related to the designer and resin type respectively, while the permeability tensor depends on the type of textile and the fiber volume fraction after compression of the fibrous reinforcement. Dry zones and voids may appear if the specifications such as positions of injection and vent gates, injection pressure, or pressure difference are not well defined.
Thus, the most critical step in the composite manufacturing processes based on injection/infusion consists of simulating the resin flow according to injection positions and inlet flow pressure and velocity. In order to accommodate anisotropic porous media, the law of Darcy was generalized as follows and used in resin flow modeling as shown in Equation (1).
being the volume-averaged Darcy velocity, the fluid viscosity, the pressure gradient, and K the permeability tensor of the porous medium. The permeability tensor will have the following form as shown in Equation (2) and the principal coordinate system (1, 2, 3), where (1, 2) are the in-plane directions and (3) is the through-thickness direction.
As shown in Figure 1 [9], any engineering textile could be divided into three distinct scales. Macroscopic scale is considered for the whole textile where the measured permeability is noted macroscopic permeability or fabric permeability (K1, K2, K3). The second is the mesoscopic scale that serves for channel or gap size, and the third scale is the microscopic scale which is specific for the intra-bundle region where microscopic permeability is noted for measured permeability values. KL and KT denote respectively the longitudinal and transversal microscopic permeability for unidirectional fiber bundles. A good evaluation of fabric permeability has a mandatory pathway through the right prediction of the microscopic permeability.
1.2. State of Art on Reviews
In an overview of the literature, no review was done regarding the different methods predicting the permeability tensor of fibrous reinforcements. Otherwise, some reviews were dedicated to the prediction of permeability of other materials. These reviews are found to be applicable in petroleum, soil mechanics, nano-composites, and other domains. For example, Babadagli and Al-Salmi [10], involved in the petroleum field, reviewed the prediction of permeability in heterogeneous carbonates. Parameters such as porosity and other petro-physical properties of rock are used in permeability prediction and discussed for carbonaceous rocks. This discussion also involves the effectiveness of a broad variety of interrelationships established using pore-scale. Lai et al. [11] overviewed the relationship between pore throat size distribution and permeability of tight sandstones. Renard et De Marsily [12] reviewed various methods used to calculate the equivalent permeability of a heterogeneous porous medium. Water or petrol were the target flowing fluids. The review was limited to a saturated regime and single-phase medium.
Regarding fibrous reinforcements permeability, some efforts were made. Other reviewed work was not extended to cover the essential predicting methods. Patino et al. [13] focused in their review on parameters affecting the permeability such as capillary pressure and injection port positions, leaving behind a huge family of analytical models predicting fiber bed permeability and other models predicting engineering textile permeability. Also, they missed mentioning numerical prediction methods.
1.3. Article Structure
In the introductory part of the article, a bibliography study is proposed. In the next part, analytical permeability prediction methods are reviewed for both fiber bundle and engineering textiles, this being the section in which the current status regarding analytical methods of prediction for both mediums is presented. In the Section 3, numerical prediction methods for engineering textiles are listed, then a conclusion stating the current progress is presented. In the fourth part, different measurement techniques are detailed for both in-plane and through-thickness directions. Last but not least, a conclusion is set forth.
2. Fiber Bundle Permeability: Analytical Modeling
2.1. Review of Fiber Bundle Permeability Analytical Models
Major progress has occurred in the development of models predicting the permeability of unidirectional fiber beds. There is no general comparative study in the bibliography focusing on all the methods used to characterize the microscopic permeability. The predicted permeability using different approaches is used to be validated by being compared with selected results from the bibliography. The lack of a generalized comparison can be noted here. Chen and Papathanasiou [14] compared their finite element simulation results with the model of Drummond and Tahir [15]. Choi et al. [16] compared their finite element simulations to the analytical models of Gebart [17] and Berdichevsky and Cai [18,19]. Tamayol and Bahrami [20] designated their analytical model and compared it to experiments from literature. Wang and Hwang [21] tried to validate the outcomes of a finite element simulation by comparison to an analytical model of Gebart [17]. Similarly, Sadiq et al. [5] matched the experimental outcomes of their work with the asymptotic model developed by Brushke and Advani [22].
The microscopic permeability of unidirectional fibers has been studied from an analytical approach, as shown in Figure 1, and several analytical models were derived emerging from four various modeling approaches:
- lubrication theory,
- capillary model,
- analytic cell calculation,
- mixed models based on previous approaches.
At the selected porosity (ε = 0.5), a comparison has been established between several analytical models available in the bibliography Table 1. Note that for the same fiber volume fraction, different models give values of permeability with a scatter of more than 60% for longitudinal permeability and of more than 200% for transversal permeability models.
A wide scatter between permeability values is observed between analytical model outcomes, numerical simulations and experimental measurements, even though the comparison is done on a constant fiber volume fraction. The scatter reveals the importance of the objective “1” of the work, which focuses upon the inspection and comparison of various analytical models to numerical and experimental results.
In 1940s, Carman [23] and Sullivan [24] started the research on permeability of porous media for which they launched experimental work., Similarly, Kuwabara [25], Happel [26] and Brenner [27] launched the theoretical analyses. (Appendix A).
The authors considered different types of unit cells depending on the fiber stacking pattern. Figure 2 [20] shows four types of fiber stacking. Square and hexagonal arrays are the most widely used arrangements in this area.
Kuwabara [25] solved the vorticity transport and stream function equations and employed a boundary layer approach to predict the permeability for flows of normal to randomly-arranged fibers on high porosities . Happel [26] and Brenner [27] solved analytically the Stokes equation for parallel and normal flows around a single cylinder with a free surface model (limited boundary layer). Kuwabara’s study [25] revealed a different point of view in comparison with Happel and Brenner [27] who used the boundary conditions. Happel and Brenner supposed that the flow resistance of a random 3D fibrous structure is equal to one-third of the parallel plus two-thirds of the normal flow resistance of a 1D array of cylinders. Later, Sangani and Acrivos [28] performed analytical and numerical studies on viscous permeability of square and staggered arrays of cylinders for the entire range of porosity values, when their axes were perpendicular to the flow direction. Their analytical models were accurate for the lower and higher limits of the porosity range..
Drummond and Tahir [15] solved Stokes equations for normal and parallel flow towards different types of well-organized structures. They evaluated the flow-field in square, triangular, hexagonal, and rectangular arrays using a distributed singularity method. They established a comparison between their results and the numerical values of Sangani and Acrivos [28] for normal flows. Regarding the analytical approach, the comparison between the analytical model of Sangani and Acrivos [28] and that of Drummond and Tahir [15] for transversal flow revealed very close matching, but it is accurate just for the materials which have high porosities. .
Sahraoui and Kaviani [29] encompassed inertial effects and succeeded in evaluating by numerical simulation the permeability of cylinders for normal flow. In addition, they designated a correlation which produced accurate values only for a limited range of porosity values, i.e., 0.4 < 0.7. .
A general mathematical model derived by Gutowski [30] adopted an assumption for the morphology of fibers. They described the fibers as a deformable, nonlinear elastic network. By means of Darcy’s Law for anisotropic porous medium, resin flow modeling is established. Gebart [17] derived an analytical model to predict the unidirectional permeability from Navier-Stokes equation, . In 1993, Berdichevsky and Cai [19], after performing numerical simulations, considered that permeability relies upon the actual and ultimate fiber volume fractions. Then they derived a unified empirical model. . In the same year, they developed a “self-consistent model” [19], where Stokes flow and Darcy flow are correspondingly considered in each region. The boundary and interface conditions together with two consistency conditions including the total amount of flow and energy dissipations are implemented simultaneously. The permeability is calculated backed-up on these concerns. The improved permeability model brings about the flow characteristics in a given fiber bundle. As for the transverse condition, the flow resistance is managed by the gaps between adjacent fibers. The expression which emerged to represent the transverse permeability includes two variables which make it propose accurately the status of a fiber bundle. The variables are the averaged fiber volume fraction and the maximum packing efficiency.
A semi-analytical model was derived by Phelan and Wise [31], who studied—based on lubrication theory—the transverse flow through rectangular arrays of porous elliptical cylinders. The flow inside porous structures is modeled by the Brinkman equation, whereas the flow in the open media between the structures is modeled via the Stokes equation. Lee and Yang [32] viewed the flow as a non-Darcy flow through a porous medium. The continuity and momentum equations are solved at the pore scale on a Cartesian grid. Weighting functions based on the APPLE algorithm and the SIS solver are used in order to bypass the numerical complications that arise from a flow domain of irregular shape. Taking advantage of the resulting volumetric flow rate, the Darcy-Forchheimer drag (pressure drag) is then obtained under a prearranged pressure drop to develop their permeability model. Brushke and Advani [22] inspected the flow across regular arrays of cylinders. The analytic solutions are matched to produce a closed-form solution. For this purpose, they used the lubrication approach at low porosity and the analytic cell model solution at high porosity. Using numerical simulations, Van der Westhuizen and Du Plessis [33] suggested a correlation for the normal permeability of 1D fibers. Ordered fibrous media-normal and parallel flows-in ordered fibrous media were studied by Tamayol and Bahrami [20] and they derived an analytical permeability model. To predict the permeability, a compact relationship is proposed by modeling 1D fibers in contact as a combination of channel-like conduits. Also, analytical correlations were established for pressure drop and permeability of rectangular arrangements. This is performed by using an “integral technique” and simulating a parabolic velocity profile in the unit cells. The developed models are validated by the experimental outcomes collected by others for square arrangements.
The transverse permeability of fibrous porous media was studied by Tamayol and Bahrami [34] on both approaches: experimental and theoretical. They used a scale analysis procedure to evaluate the transverse permeability of fibrous media, studying various fibrous matrices (square, staggered, and hexagonal unidirectional fiber arrangements). In this domain, a relationship is established between several parameters including porosity, permeability, fiber diameter, and the tortuosity of the fibrous medium. The pressure drop through different fiber arrangements and metal foams is measured in the creeping flow regime. The outcomes obtained are then manipulated to calculate the permeability of the samples. Compact relationships can be obtained by establishing comparisons with the contemporary experimental results and the data derived by others. .
In the following section, several models predicting the longitudinal “KL” and transversal microscopic “KT” permeability are presented. The permeability is a function of the fiber radius “r” and fiber volume fraction “Vf”. Never the less, some models correlate the permeability with other parameters like the maximum fiber packing factor “Vfmax”, geometrical constants, and packing structure (square, hexagonal, or other structures) “Va”. These models will be compared in Chapter 4, where the best models predicting the permeability will be selected.
2.2. Fiber Bundle Permeability: A Comparative Study
A comparative study between different analytical models with experimental and numerical values is carried out in Ref. [35]. In this study, the best analytical models that predict the permeability of unidirectional fiber beds are chosen. To do this, 7 analytical models predicting longitudinal microscopic permeability [17,18,19,25,26,30,33] and 17 models [15,17,18,19,20,22,25,26,28,29,30,31,32] predicting transverse microscopic permeability are selected from the bibliography. As a result of the assessment, the best models for predicting longitudinal and transverse microscopic permeability are to be selected. The following step is to compare the values arising from the nominated analytical models with the numerical simulations or the experimental results of the bibliography. Those results show great variance between them for the same fiber volume fraction as shown in Table 2 and Table 3 [35].
This revealed that it is essential to conduct a novel numerical study that simulates a realistic experiment and reduces the experimental complications met. One of those real conditions is random fiber packing structure, so numerical FE modeling is done on this basis. A two-level comparative study is established between selected experiments and analytical models in Ref. [35].
Its analysis as shown in Figure 3 and Figure 4 reports that Bahrami and Tamayol [20], Drummond and Tahir [15], Berdichevsky and Cai ISCM, and “Unified model” (square arrangement) [18,19] have a good agreement with these data for longitudinal microscopic permeability components. For the matter of transverse microscopic permeability, the Berdichevsky and Cai ISCM (Hexagonal Arrangement) [19], Gebart (arrangement hexagonal) [17], Drummond et Tahir (arrangement hexagonal) [15] and Kuwabara [25] models were nominated as being the most accurate models.
In conclusion of this section, various methods were used in the bibliography to predict fiber bundle permeability. These methods have scattered results for the same fiber volume fraction. The comparative study [35] selected the analytical models that converge to reliable numerical and experimental values for both longitudinal and transversal flows. For further studies regarding engineering textile permeability or unidirectional fiber beds permeability, the selected analytical models are reliable, and there is no need at this level for an experimental measurement or a numerical simulation.
3. Experimental Measurements
This part presents different methods of permeability measurements by distinguishing between measurements in the in-plane and through-thickness directions. In the RTM manufacturing process, the resin is generally injected in a dry preform in a radial or longitudinal injection under constant pressure or at constant flow rate; in these LCM processes, the industry is interested in the in-plane permeability. Otherwise, in infusion processes, the resin flows through the thickness and the interest turns to through-thickness permeability.
The permeability is measured experimentally in different ways. The methods can be classified by the measurement procedure, measuring device, and fluid used:
- radial or longitudinal, depending on the position of the inlet gate, see Figure 5 for the in-plane permeability;
- saturated or unsaturated, depending on whether the preform is saturated with resin or dry when measuring permeability;
- constant pressure at the inlet or constant velocity during the injection;
- type of injected fluid; and
- measuring device.
3.1. Review on Measuring in-Plane Permeability
A review of experimental methods used to determine the in-plane permeability is presented. Some papers [37,38] presented an overview regarding in-plane permeability. Permeability measurements based on radial injections were used by many researchers. Kris Hoes et al. [39] used a new set-up for performing 2D radial injection using electrical sensors to detect the progression of the flow front for a 2D woven glass fabric at Vf = 0.42. The standard deviation of their experimental data was 21–22%. Song and Youn [40] used the radial flow method to measure the in-plane permeability of plain weave glass fabrics with a constant inlet pressure. Comas-Cardona et al. [41] described a radial injection methodology to measure fiber reinforcement permeability using a compression test setup after determining the anisotropy ratio; the method allows the calculation of the in-plane and through-thickness permeability. This method was applied on a glass twill weave and on NCF carbon fabrics to determine the in-plane permeability.
The saturated and unsaturated permeability were also discussed and investigated. Shojaei et al. [38] studied the saturated and unsaturated permeability of a glass-woven fabric at different injection pressure and fiber volume fractions. The experiments are based on a unidirectional injection. The difference between the unsaturated and the saturated permeability is also related to the pore structure. The saturated permeability is usually higher than the unsaturated permeability. The unsaturated in-plane permeability of three different 3D woven fabrics was determined using radial flow experiments at constant injection pressure, using pressure transducers to detect the flow front propagation by Endruweit and long [42].
In addition, some studies have focused on developing new techniques to determine the permeability of engineering textiles. Liu et al. [43] investigated the in-plane permeability measurement. A new set-up was presented, which consists of a new sensor design and new analysis software. The proposed new method was used to measure the permeability of a basalt woven twill fabric.
Naik et al. [37] presented a discussion of the factors that influence the measurement of permeability. It is shown from the conclusion that the steady-state permeability is higher than the transient permeability with few exceptions. The unsaturated permeability is also higher for synthetic fibers than for natural fibers. It is found that for high-viscosity fluids, the transient and steady-state permeability decrease. However, for lower values of viscosity, no significant effect is shown. In addition, it is noticed that transversal transient permeability is lower than in-plane transient permeability values for typical fabrics.
Different methods were used in order to measure the in-plane permeability of engineering textiles. These methods are based on many variables which in turn affect the measured result; the repetitive measurement of the same sample using different methods leads always to non-confidential results. Here, the necessity to validate a measuring method which in turn will be the basis for any future improvement was shown.
3.1.1. Benchmark Exercise
Arbter et al. [44] reported on the measurement of permeability in an international benchmark exercise between 12 different institutes and universities. Two fabrics were selected 01113-1000-TF970 (twill 2 × 2 E-glass fabric) and G0986 D 1200 (twill 2 × 2 carbon fabric), and 16 different methods were used to predict the in-plane permeability. A big scatter in the results was observed between the methods used, which were explained by experimental uncertainty, human factors, and different experimental techniques as shown in Figure 6, where different symbols indicate the used experimental method (dark diamond: radial unsaturated; light diamond: radial saturated; dark square: linear unsaturated; light square: linear saturated).
Because of this scattering, the same fabric was studied again in Benchmark II [45] to solve the problems encountered in the first Benchmark [44]. The objective was to unify the guidelines. Unidirectional injections were conducted with the goal to determine the unsaturated in-plane permeability values. Methods used in different institutes were specified in the guidelines defined for the benchmark. Participants were asked to use the same values for parameters such as fiber volume fraction, injection pressure and fluid viscosity to minimize sources of scatter. The comparison of the results from each participant showed very good agreement. The scatter between experimental data obtained by different research groups for the same fabric was about 20%, as shown in Figure 7, when they used same experimental method. Otherwise, high dispersion was observed for institutes that did not respect the guidelines.
3.1.2. Conclusions
As a conclusion, Benchmark II [45] formed the transit gate towards an agreed-on measurement method for in-plane permeability. A future benchmark is necessary in order to specify the guidelines for measuring the in-plane permeability tensor using radial injection methods.
This agreed on measuring method could be used in order to develop analytical and numerical predicting models.
3.2. Review on Measuring through-Thickness Permeability
The most common method to measure the through-thickness permeability is the one-dimensional cylindrical flow apparatus at constant flow rate, as shown in Figure 8. The fluid is injected at a flow rate, and then the corresponding injection pressure is noted. The through-thickness permeability is calculated based on a single point value using Darcy ‘s law for one-dimensional flow:
where stands for the Darcy injection speed, for the volumetric flow rate, for the area of the fabrics, for the viscosity of the injected oil, for the pressure loss, for the thickness of the reinforcement, and K3 for through-thickness permeability.
Song et al. [46,47] measured the transversal permeability using silicone oil (200 F/100 cs) as a test fluid for five different preforms by measuring the pressure difference between two points, with pressure transducers for each experiment at the inlet and outlet after injecting the resin through a permeable wall under constant pressure.
Trevino et al. [48] and Weiztenbock et al. [49] used specially designed apparatus for transverse permeability measurements based on a steady-state unidirectional experiment. They measured the pressure at the inlet and used a one-dimensional permeability equation derived from Darcy’s law to calculate permeability.
Wu et al. [50] measured the transversal permeability for three different fabrics by measuring the pressure at the inlet under constant velocity; they used DOP or water as testing fluid. The transverse permeability is shown to be independent of the flow rate only for low-pressure injections.
Sadik et al. [5] measured the flow rate and pressure drop to deduce the transverse permeability of aligned fibers. In their study, they performed a set of three different investigations: in the first one, corn syrup was used as testing fluid and solid rods for fiber arrays; in the second set of experiments, Carbopol solutions were used instead of the corn syrup; and in the third part of experiments, they used fiber bundles with corn syrup. The effects of shear thinning fluid and Newtonian fluid on measured results were compared. Nedanov et al. [51] presented an improved non-intrusive method of the SMART weave sensor system. That method is based only on visualization, where the 3D permeability of fibrous composites could be determined without using any embedded sensors. Elbouazzaoui et al. [52] calculated the transverse permeability of three non-crimped fabrics using an apparatus developed by Drapier et al. [53]. Once the pressures of the injected test fluid are calculated at the inlet and outlet of the specimen, the transverse permeability of the fabrics is determined using Darcy’s law.
Ouagne and Bréard [54] proposed a new technique to measure continuously permeability for different fiber volume fractions. It presents the advantage of automatically giving the permeability curve as a function of the volume fraction of fibers in a single experiment. The results obtained are comparable to those of conventional methods.
Scholz et al. [55] attempted to perform transverse permeability measurements with a gas and compared the results with water measurements. Taking into account air compressibility, an 8% gap was reported between water and air.
Different methods were reported in the bibliography regarding through-thickness permeability measurement. Most of these methods measure a saturated permeability value due to the difficulties encountered to follow the flow front through the thickness. An international benchmark exercise between large numbers of institutes is to be launched. The goal of this benchmark is to agree on a method predicting the through-thickness permeability value.
4. Fabric Permeability Prediction: Analytical Models
After several years of struggle trying to predict the permeability of fibrous reinforcements considering only a single porosity scale, researchers have spontaneously shifted the research towards taking into consideration the dual-scale architecture of engineering textiles. In fact, the presence of micropores between the fibers reduces permeability compared to a single scale prediction. The amount of reduction depends on the arrangement of micropores and mesopores; in other words, it is related to the architecture of woven fabrics.
Analytical models are generally based on single-scale theory, so dual-scale permeability has not been well predicted. Some models incorporate the effect of micropores by using an empirical factor. Because of several limitations as well as the complicated interactions between the flowing resin and the fiber bed, previous work focuses on deriving analytical models predicting the permeability values of unidirectional fiber beds, typically known as microscopic permeability values.
4.1. Review of Fabric Permeability Prediction: Analytical Models
This part focuses on presenting the analytical models available to predict engineering textile permeability. The first model and mostly applied is the Kozeny-Carman model [56] which was suggested at first to predict the permeability K of granular spheres. This approach was administered later into a composite domain. This model designates a relation between the following parameters: permeability, fiber volume fraction Vf, fiber radius rf together with an empirical parameter k called the Kozeny constant.
The Kozeny-Carman Equation (4) was initially developed in Soil Mechanics. Later on, Gebart got benefits from it in evaluating the permeability of unidirectional fiber beds (microscopic permeability) [17], as well as that of fabrics (macroscopic permeability) [16,57]. Simacek and Advani [58] sought predicting the permeability of a woven fabric, so they simplified the case-study by considering the 3D reinforcement as a 2D problem. They established a model that can be resolved numerically. Darcy’s equation governs the flow within the yarns while the Stokes equation describes the flow between the yarns and the mold. Using lubrication theory, the flow is modeled in the mesopores which are found between the fabric and the mold. The mesopores inside the fabric are neglected. The longitudinal and transversal microscopic permeability values were considered equal. In order to authenticate the model, the effect of shear on pre-estimated values of permeability was investigated. It was observed that the trends for change in permeability with the angle of shearing are weaker in the model. The model is evaluated using some qualitative factors.
Choi et al. [16] considered the unit cell as a dual-scale fibrous medium. A coupled flow model was established in this study which combines sequential and parallel flows in the micropores and mesopores. In order to predict the microscopic and mesoscopic permeability values, the Carman-Kozeny model was used. Carman-Kozeny constants are evaluated from finite element analysis. This model may be used to obtain a more quantitative estimation of the permeability of fibrous media. The results were compared to the experimental measurements of Skartsis et al. on Hercules AS-4 graphite-aligned fibers beds [59]. For perpendicular flow, the model is limited in predicting the permeability at relatively low fiber volume fraction. Although the agreement is yet far from perfection, the model showed an advance in comparison with previous models.
An empirical model was developed by Shih and Lee [57], which takes into consideration the flow in the micropores and mesopores. The Berdichevsky and Cai model [18] was used with the aim of evaluating the permeability of the micropores. Based on curve fitting with experimental measurements, the permeability of mesopores was predicted by the Carman-Kozeny equation. The total permeability was summed up as a percentage of sequential and parallel permeability values. The results were qualitatively compared with experimental data.
Yu and Lee [60] considered a dual-scale flow problem; in the mesopores, they got benefit from the Stokes equation, whereas in the micropores, they applied the Berdichevsky and Cai model. The fabric architecture was inspected prior to compaction and its parameters were measured. Based on experimentally measured permeability values, factors serving to predict the geometry of the compacted fabric were introduced. The model was validated for three different fabrics. Then Yu et al. [61] developed a fractal in-plane permeability model for the same fabrics; the pore size was calculated as a function of the total fiber volume fraction. The Hagen-Poiseuille equation was modified in order to determine the rate of flow through a single pore. The pore area fractal dimension, the tortuosity fractal dimension, and the parameters of fabric architecture are all parameters that make up the fractal in-plane permeability model which was finally proposed. Results were then compared with previous data [62]. Nordlund et al. [63] developed and applied a combined CFD unit cell/Network technique applied to NCF fabrics. The local permeability tensor is predicted by CFD, and by using a network modeling technique, the local permeability values are summed up in order to predict in-plane permeability values. More data of the geometrical dimensions were required to be able to accurately validate the model, but the model values seem to follow the trend of experimental data.
Chen et al. [64] predicted the permeability in mesopores and micropores by numerical simulation and the Gebart analytical model [17] respectively. Satisfactory agreement is observed for three plain-weave fabrics with experimental data available in the literature [65]. Dong et al. [62] constructed a model in order to predict the permeability of non-crimped stitched fabric. The model discretizes the unit cell with two regions, inside the tows and between it. Regarding the tows region, the Gebart model [17] was applied to predict the permeability in the micropores. Based on Bahrami et al. [66], the permeability in the second region is predicted based on the pressure drop that can be related to geometric parameters of the cross-section. Finally, for a single fiber volume fraction, the calculated permeability is compared with finite element simulations [67] and experimental measurements [68]. A fiber volume fraction range of acceptability is noticed. Shou et al. [69] predicted analytically the transversal permeability of aligned fibrous beds in a dual-scale medium. Their model correlated fairly well with experimental and numerical results in the literature [5,31,70].
In order to predict the permeability of 2.5 D interlock fabrics, Vernet and Trochu [71,72] developed an analytical model that calculates the pressure drop inside the fabric after predicting the size and distribution of the mesopores. Good agreement was observed at a selected fiber volume fraction for each fabric.
4.2. Developed Analytical Model
The permeability illustrates the extent to which a composite fabric allows fluids to pass through it. A predictive model [73] concerned with a family of non-crimped and 3D orthogonal fabrics has been developed to predict the unidirectional permeability in warp and weft directions as shown in Figure 9 and Figure 10 [73] The model relies on an analytical solution based on previous work [35], in which the microscopic permeability of unidirectional fiber bundles is calculated.
Figure 11 shows the modeling methodology. The model requires inputs such as parameters of the fabric architecture and geometry and information concerning the compaction of the preform. Pictures taken for the fabric serve to acquire parameters such as the dimension of the mesopores and architecture of the fiber bundles. The textile data sheet is needed too. In addition, the average volumes of mesopores and fiber bundles are required and are calculated for different fiber volume fractions taking into account a selected unit cell in the warp and weft directions. As a matter of fact, the model plays a good role in dealing with two contributions; the first one deals with the flow inside and in between the tows while the second one shows the flow deviations arising from the stitching yarns. The effective radius and fiber volume fraction are essential as an input for the model. The predictive model is validated by the aid of an experimental investigation by analyzing five different fabrics and three different fiber volume fractions. A satisfying agreement is found between experimental results and those predicted by the proposed analytical model.
4.3. Conclusion on Predicting Fabric Permeability
Several permeability models have been proposed in the bibliography for both single and dual scale mediums. As a conclusion for this state of the art, a comparative study could not be launched between different models due to the following reasons:
- They are applicable for a certain type of architecture;
- they are valid on a selected fiber volume fraction; and
- some are semi-empirical models and are expressed as a function of geometrical parameters.
The Kozeny-Carman model defined permeability as material and architecture-depending parameter which are manifested in the Kozeny constant and porosity of the medium. The Kozeny constant must be predicted numerically, where each textile has its own Kozeny constant values for each Vf and each flowing direction. In addition to what has been stated, the Kozeny-Carman model was developed for granular beds and does not take anisotropy into account, thus several limitations appeared when it was applied to engineering textiles.
Analytical models are classified into semi-analytical or analytical models. “Empirical and semi-analytical models” are based on a sub-model, same as the Kozeny-Carman model or backed up with an experimental measurement or a numerical simulation. Kozeny-Carman constants can be predicted numerically [16,57,69]. In order to predict the compacted fabric architectural parameters, Ref. [60] selected the permeability values matching with the experimental data. In Ref. [69], the permeability of unidirectional fiber beds is predicted, but their model cannot be applied to engineering textiles.
Very few models predicting the permeability of engineering textiles are classified as “pure analytical models”, like Refs. [71,72]. Their model is a function of weaving parameters, tortuosity and length of mesopores; function of these parameters’ pressure drop is estimated. It was applied on a single type of architecture “3D interlock fabric” and validated on a single fiber volume fraction.
In 2017, an analytical model was developed by Karaki et al. [73] The model is based on an analytical solution derived from a previous study [35], in which the microscopic permeability of unidirectional fiber bundles is estimated. This model is based on the basic architecture of the reinforcement. The model is validated with experimental data on five different fabrics at three different fiber volume fractions.
5. Fabric Permeability Prediction: Numerical Simulations
5.1. Review of Fabric Permeability Prediction: Numerical Simulations
In some cases, the geometrical complexity of the unit cell hinders the derivation of an analytical solution. It is then necessary to resort to numerical methods and solve the equations of Fluid Mechanics at the mesoscopic level or dual-scale fibrous medium (microscopic and mesoscopic scales). Authors developed different methods to predict the in-plane permeability tensor numerically. These methods come out under three families of numerical techniques: finite element, finite difference, and Lattice-Boltzmann. Each method exhibits advantages and drawbacks.
Finite element methods are used in a large number of articles [68,69,70,71,72,73,74,75,76,77,78,79]. The approach consists of discretizing the unit cell into elements, inside which reference elements are defined. These local functions have the advantage of being simpler than those which could possibly be used to represent the total unit cell. Fournier [68] compared the derived results with a developed analytical model; the comparison shows good agreement for permeability values larger than 10−4 m2. The main disadvantage of this method is its inability to be applied to engineering textiles since finite element simulations did not converge on this permeability order.
Hoareau developed an analytical model based on lubrication theory and finite element simulations which were carried out on unidirectional lenticular impermeable fiber bundles [74]. Due to a lack of experimental data, no comparison was made between experimental and numerical results. An acceptable agreement is observed between permeability values derived from analytical and numerical modeling.
Laine performed numerical simulations in order to predict the permeability of two Hexcel fabrics: 2 × 2 twill weaved (G986) and a 2.5D interlock (G1151) [75,76]. Nesting factor as well as plies quantity effects are considered during predicting the permeability of the reinforcements. The permeability with the nesting factor neglected is compared to the permeability considering the nesting factor for both Stokes flow and Stokes-Brinkmann flow. Higher permeability values are observed for fabrics where the nesting factor is neglected. The limited amount of experimental results published on woven reinforcements prevented them from carrying out a deep numerical-experimental prediction comparison.
Loix developed a methodology allowing to determine numerically the permeability when considering slow saturated flows through previously deformed woven fabrics [77]. Loix considered that the in-plane permeability magnitude order (10−9 m2) is realistic as compared to experimental results obtained using similar fabrics. His comparison is more likely to be qualitative than quantitative.
Ngo and Tamma [78] applied the stokes equation to model the flow in the mesopores and brinkman’s equation in the micropores. The simulations were performed on a woven fabric. Due to the lack of literature on experimental measurements, the results were compared to experimental measurements of Adams et al. [65] with a lower fiber volume fraction.
With the help of FEM, Takano et al. [79] presented a new evaluation method for the permeability of different fabrics from the multi-scale viewpoints by the asymptotic homogenization theory. They tried to study the relation between microscopic and macroscopic permeability for woven fabrics. The verification of the proposed method was given only for UD composites.
The main drawbacks of these methods are the 3D meshing complexity as well as very large computing time. Note that some authors compared their results qualitatively with published data, this reveals either the lack of published permeability measurements or the inconsistency of the modeling.
The Lattice-Boltzmann methods have the same advantages, with the disadvantage of not converging as rapidly as a function of the discretization pitch and are also more expensive in terms of computational time. These methods study the fibrous medium at mesoscopic scale and consider fictitious particles in a discrete space-time grid [80,81,82,83,84,85,86]. Figure 12 [87] shows digitized sandstones (i.e., Fontainebleau(FO), Berea (BE), and Sumatra (SU)) where the Latice Boltzman method is applied in order to predict the permeability values.
Shan and Chen [84] developed a lattice Boltzmann model which has the ability to simulate flows with immiscible components as well as multiple phases; multiple thermodynamic phases are the targeted medium. This method was later on explained in detail in Ref. [85]. The considerably weak point in this model is the lack of an energy conservation relation. They did not apply this method in the composite domain. Later on, Chen et al. [83] focused on describing the fundamental connections between microscopic dynamics and macroscopic phenomena and the applicability of the Lattice-Boltzmann method versus lattice gas approach (LGA). Martys and Chen [81] applied the method previously developed by Shan and Chen [84,85] on an image of a Fontainebleau sandstone [88]. Due to computer limitations, the selected microstructures were 64 subsections of the original 224 × 288 microstructure. The used lattice spacing was of the order of 7.5 µm, and the medium had porosity near 15.2%. The relative permeability was compared to experimental results where acceptable agreement is observed.
Later on, in 1997, Spaid and Phelan [86] demonstrated that the lattice Boltzmann method [84] may be modified to solve the Stokes/Brinkman formulation for flow in dual scale porous media. In prospect of applying this method in the composite domain, they employed the modified method in order to predict the transversal permeability of elliptical fiber tows for both hexagonal and square packing as shown in Figure 13. They compared simulation results with analytical predictions derived from the Phelan and Wise model [31], where good agreement was found. They encouraged the use of the Lattice-Boltzmann method for simulating flow in transient or dynamic mode. In 1998, Spaid and Phelan [80] developed this method which serves to model void entrapment in liquid composite manufacturing processes.
Dunkers et al. [82] binary images of the microstructure of a unidirectional E-glass/epoxy composite were generated from the low contrast OCT (optical coherence tomography) data through image de-noising, contrast enhancement and feature recognition. The resulting data represent the input data for a lattice Boltzmann model for permeability prediction. These results were dependent on the selected method in image processing. When using Level-set methods for image processing [89], good agreement was found for predicting the permeability of unidirectional fiber beds, otherwise this result was a function of sample size, and further simulations on more realistic sample size are suggested.
Finite difference methods seek approximate solutions of partial differential equations by solving a system linking the values of unknown functions at certain points sufficiently close to each other. Verleye et al. [90] employed a three-dimensional finite difference solver. The solver works on a regular grid like the lattice Boltzmann method (LBM); however, it works with more acceleration techniques for the resulting partial differential system of equations. The fabrics were drawn in WiseTex, in a second step FlowTex software in order to predict the permeability. Figure 14 and Figure 15 show the modeling technique, where the homogenization of the Stokes equations is applied within the periodic domain of a textile and yields Darcy’s law on the macro-level. The validation of this method on three kinds of fabrics is done with respect to experimental data from the literature; a maximum scattering of 50% is observed. This error was assigned to the sensitivity of the mesopores’ size measurement.
Verley et al. [91] solved the Navier-Stokes and Brinkman equations with the finite difference discretization method. The developed model was implemented into WiseTex software. The simulations showed good agreement when compared to experimental results from the bibliography for monofilament textile. Trochu and Gauvin [92] developed a finite difference method that predicts the in-plane permeability values; this model was compared with experimental measurements for fiber mats with irregular shapes. Its application showed many limitations such as computer limitations where a new mesh must be generated at each time step. Finite element methods were then suggested by the author in order to cover the limitations. Hori [93] applied a finite difference method on rock material; his approach was not tested on engineering textiles.
The main drawback of this approach is the very fine discretization required to converge.
Even though the finite element method is well adapted to complex geometries, its main disadvantage is the need for a 3D mesh. Obtaining this mesh is sometimes very difficult because of the complex 3D architecture of fibrous reinforcements, and also because of the prolonged computational durations especially in a multiphase medium. Finite differences and Boltzmann’s lattice methods solve problems on uniform meshes, hence they do not present this type of problem, but they require a discretization pitch sufficiently low to ensure convergence. Because the motivators for their creation are not basically linked to this area, they are not applied widely in the composite domain. One of the major advantages of lattice methods for simulating fluid flows as compared to traditional numerical methods is their ability to robustly model interfaces between two or more fluids.
5.2. Advance in Numerical Methodology
In this study, a steady-state simulation considering a theoretical unit cell is launched. The micropores are assumed to be blocked so a single-phase problem is solved. This reduces computational times significantly as well as meshing problems. The meshing and simulating time are short compared to a simulation in a dual scale transient mode (without blocking the micropores).
The bundles’ shape and dimensions as well as mesopores’ sizes are respected in each simulation. The predicted permeability results are saturated permeability values inside a theoretical REV, as shown in Figure 16. However, the reality is that the mesopores’ dimensions are not ideal and some of them could be closed or reduced. In order to compensate this issue, a pressure drop ΔP1 is considered. A saturated permeability value inside a real REV is gathered. A second pressure drop ΔP2 should be considered in order to take the saturation effect including capillary pressure. This leads to the unsaturated permeability value inside a real REV as shown in Figure 16 and Figure 17, which will be compared with measured permeability values.
In order to take the two pressures drop effects into consideration, a single mutation to the theoretical unit cell is assumed, where a single fiber is inserted inside each mesopore along the flow path and in the same direction. This fiber is small enough that its addition does not affect the total fiber volume fraction. This addition corrected the predicted permeability value. For plain weave or interlock textiles, since the warp and weft bundles are interlaced together, the mesopore volume is relatively small. Hence, the porous structure of the fiber bed is well described and secondary pathways are taken into consideration in the simulation.
Figure 18 shows the modeling methodology. As a first step, the bundle width “a” in Figure 19 as well as all the non-compacted fabrics’ geometrical data are collected from the fabrics’ data sheets. The second step is to predict these data for different fiber volume fractions. A theoretical unit cell is selected. This unit cell is drawn using TexGen software, as shown in Figure 20. The permeability correction factor is inserted into the drawings as shown in Figure 21. In the sixth step, the numerical simulations predicting permeability before and after the insertion of the fiber are launched. Finally, the results are compared to measured experimental results.
A comparison between error results before and after adding fibers in the mesopores is shown. The numerical results are compared to experimental measurements of the in-plane permeability tensor, and a good agreement is found between predicted and experimental values.
As a conclusion, the FE modeling done in this study has proved its efficiency, where it could be used for modeling the permeability at different fiber volume fractions for different textiles architectures in both warp and weft directions. Since these simulations are carried out in three conditions:
- Static mode;
- single porous medium; and
- meshing is done in the mesopores region.
Thus, these simulations are done much faster than traditional FE modeling, no computer limitations are observed, and the results agree with experimental measured results.
6. Conclusions
Considering the different methods used to measure permeability, the results obtained do not generally agree. Minor changes in the experimental procedures affect significantly the measured values. The international benchmark II [45] agreed on a measurement method of the in-plane permeability. This method can now be adopted as a reference.
Some progress appeared in numerical modeling, but computational limitations remain an obstacle. The analytical models predict well the permeability of the unidirectional fiber bed. However, no comparative study was carried out to select the best models. Few published works are available to predict permeability by analytical models and the few one that exist are not generalized and are far from being perfect. Although the general trend as a function of fiber volume fraction is reproduced, the predicted permeability values do not match measurement results.
An examination of the main issues on the permeability of composites has been completed in this review. Progress is proposed in each section where best predicting models and measuring techniques are nominated for predicting fiber bundle permeability and fabric permeability.
Author Contributions
Project administration, F.T.; Resources, P.L.; Supervision, R.Y.; Writing—original draft, M.K.
Funding
This research received no external funding
Conflicts of Interest
The authors declare no conflict of interest.
Abbreviations
| Symbol | Definition |
| ε | Porosity |
| εeff | Effective porosity |
| Vfy | Intra yarn fiber volume fraction |
| Vf | Fiber volume fraction |
| Vf0 | Vf for non-compacted fabrics |
| Vfi | Vf for compacted fabrics |
| Q | Resin flow |
| H | Fabric thickness |
| H0 | Fabric thickness prior to compaction |
| K0° | Macroscopic permeability warp direction |
| K90° | Macroscopic permeability weft direction |
| KL | Microscopic longitudinal permeability |
| KT | Microscopic transversal permeability |
| Hi | Fabric thickness on Vfi |
| hw | Warp yarn thickness |
| ρs | Surface density of the fabric |
| Ρ | Material density |
| hf | Weft yarn thickness |
Appendix A. Unidirectional Permeability Predicting Models

Table A1.
Gebart model constants.
| Fiber Arrangement | c | ||
|---|---|---|---|
| Quadratic | 57 | ||
| Hexagonal | 53 |
where:
References
- Hu, J.; Liu, Y.L.; Shao, Y. Study on void formation in multi-layer woven fabrics. Compos. Part A Appl. Sci. Manuf. 2004, 35, 595–603. [Google Scholar]
- Mayer, C.; Wang, X.; Neitzel, M. Macro-and micro-impregnation phenomena in continuous manufacturing of fabric reinforced thermoplastic composites. Composites Part A 1998, 29, 783–793. [Google Scholar] [CrossRef]
- Shih, C.H.; Lee, L.J. Analysis of void removal in liquid composite molding using microflow models. Polym. Compos. 2002, 23, 120–131. [Google Scholar] [CrossRef]
- Lundstrom, T.; Gebart, B.; Lundemo, C. Void formation in RTM. J. Reinf. Plast. Compos. 1993, 12, 1339–1349. [Google Scholar] [CrossRef]
- Sadiq, T.; Advani, S.; Parnas, R. Experimental investigation of transverse flow through aligned cylinders. Int. J. Multiph. Flow 1995, 21, 755–774. [Google Scholar] [CrossRef]
- Available online: www.esi-group.com (accessed on 8 July 2019).
- Available online: https://www.ccm.udel.edu/software/lims-software/ (accessed on 8 July 2019).
- Available online: https://www.innovmetric.com/en/products/polyworks-inspector (accessed on 8 July 2019).
- Karaki, M. Permeability Modeling of Engineering Textiles Used in Composite Materials; Université de Technologie de Troyes: Troyes, France, 2017. [Google Scholar]
- Babadagli, T.; Al-Salmi, S. A review of permeability-prediction methods for carbonate reservoirs using well-log data. SPE Reservoir Eval. Eng. 2004, 7, 75–88. [Google Scholar] [CrossRef]
- Lai, J.; Wang, G.; Wang, Z.; Chen, J.; Pang, X.; Wang, S.; Zhou, Z.; He, Z.; Qin, Z.; Fan, X. A review on pore structure characterization in tight sandstones. Earth-Sci. Rev. 2017, 177, 436–457. [Google Scholar] [CrossRef]
- Renard, P.; De Marsily, G. Calculating equivalent permeability: A review. Adv. Water Res. 1997, 20, 253–278. [Google Scholar] [CrossRef]
- Patiño, I.; Vargas, C.; Vanegas, J. Methods for permeability measurements of fibrous reinforced preforms. Revista Facultad de Ingeniería Universidad de Antioquia 2014, 72, 186–2002. [Google Scholar]
- Chen, X.; Papathanasiou, T. Micro-scale modeling of axial flow through unidirectional disordered fiber arrays. Compos. Sci. Technol. 2007, 67, 1286–1293. [Google Scholar] [CrossRef]
- Drummond, J.; Tahir, M. Laminar viscous flow through regular arrays of parallel solid cylinders. Int. J. Multiph. Flow 1984, 10, 515–540. [Google Scholar] [CrossRef]
- Choi, M.A.; Lee, M.H.; Chang, J.; Lee, S.J. Permeability modeling of fibrous media in composite processing. J. Non-Newtonian Fluid Mech. 1998, 79, 585–598. [Google Scholar] [CrossRef]
- Gebart, B. Permeability of unidirectional reinforcements for RTM. J. Compos. Mater. 1992, 26, 1100–1133. [Google Scholar] [CrossRef]
- Berdichevsky, A.L.; Cai, Z. Preform permeability predictions by self-consistent method and finite element simulation. Polym. Compos. 1993, 14, 132–143. [Google Scholar] [CrossRef]
- Cai, Z.; Berdichevsky, A. An improved self-consistent method for estimating the permeability of a fiber assembly. Polym. Compos. 1993, 14, 314–323. [Google Scholar] [CrossRef]
- Tamayol, A.; Bahrami, M. Analytical determination of viscous permeability of fibrous porous media. Int. J. Heat Mass Transf. 2009, 52, 2407–2414. [Google Scholar] [CrossRef]
- Wang, J.F.; Hwang, W.R. Permeability prediction of fibrous porous media in a bi-periodic domain. J. Compos. Mater. 2008, 42, 909–929. [Google Scholar] [CrossRef]
- Bruschke, M.; Advani, S. Flow of generalized Newtonian fluids across a periodic array of cylinders. J. Rheol. 1993, 37, 479–498. [Google Scholar] [CrossRef]
- Carman, P. The determination of the specific surface of powders. J. Soc. Chem. Ind. Trans. 1938, 57, 225. [Google Scholar]
- Sullivan, R. Specific surface measurements on compact bundles of parallel fibers. Appl. Phys. 1942, 13, 725–730. [Google Scholar] [CrossRef]
- Kuwabara, S. The forces experienced by randomly distributed parallel circular cylinders or spheres in a viscous flow at small Reynolds numbers. J. Phys. Soc. Jpn. 1959, 14, 527–532. [Google Scholar] [CrossRef]
- Happel, J. Viscous flow relative to arrays of cylinders. AIChE J. 1959, 5, 174–177. [Google Scholar] [CrossRef]
- Happel, J.; Brenner, H. Low Reynolds Number Hydrodynamics: With Special Applications to Particulate Media; Noordhoff International Publishing: Leyden, the Netherlands, 1973. [Google Scholar]
- Sangani, A.; Acrivos, A. Slow flow past periodic arrays of cylinders with application to heat transfer. Int. J. Multiph. Flow 1982, 8, 193–206. [Google Scholar] [CrossRef]
- Sahraoui, M.; Kaviany, M. Slip and no-slip velocity boundary conditions at interface of porous, plain media. J. Heat Mass Transf. 1992, 35, 927–943. [Google Scholar] [CrossRef] [Green Version]
- Gutowski, T.; Cai, Z.; Bauer, S.; Boucher, D.; Kingery, J.; Wineman, S. Consolidation experiments for laminate composites. J. Compos. Mater. 1987, 21, 650–669. [Google Scholar] [CrossRef]
- Phelan, F.R.; Wise, G. Analysis of transverse flow in aligned fibrous porous media. Compos. Part A Appl. Sci. Manuf. 1996, 27, 25–34. [Google Scholar] [CrossRef]
- Lee, S.; Yang, J. Modeling of Darcy-Forchheimer drag for fluid flow across a bank of circular cylinders. J. Heat Mass Transf. 1997, 40, 3149–3155. [Google Scholar] [CrossRef]
- Van der Westhuizen, J.; Du Plessis, J.P. An attempt to quantify fibre bed permeability utilizing the phase average Navier-Stokes equation. Compos. Part A Appl. Sci. Manuf. 1996, 27, 263–269. [Google Scholar] [CrossRef]
- Tamayol, A.; Bahrami, M. Transverse permeability of fibrous porous media. Phys. Rev. E 2011, 83, 046314. [Google Scholar] [CrossRef] [Green Version]
- Karaki, M.; Hallal, A.; Younes, R.; Trochu, F.; Lafon, P.; Hayek, A.; Kobeissy, A.; Fayad, A. A comparative analytical, numerical and experimental analysis of the microscopic permeability of fiber bundles in composite materials. Int. J. Compos. Mater. 2017, 7, 82–102. [Google Scholar]
- Dave, R.; Kardos, J.; Duduković, M. A model for resin flow during composite processing part 2: Numerical analysis for unidirectional graphite/epoxy laminates. Polym. Compos. 1987, 8, 123–132. [Google Scholar] [CrossRef]
- Naik, N.; Sirisha, M.; Inani, A. Permeability characterization of polymer matrix composites by RTM/VARTM. Prog. Aerosp. Sci. 2014, 65, 22–40. [Google Scholar] [CrossRef]
- Shojaei, A.; Trochu, F.; Ghaffarian, S.; Karimian, S.; Lessard, L. An experimental study of saturated and unsaturated permeabilities in resin transfer molding based on unidirectional flow measurements. J. Reinf. Plast. Compos. 2004, 23, 1515–1536. [Google Scholar] [CrossRef]
- Hoes, K.; Dinescu, D.; Sol, H.; Vanheule, M.; Parnas, R.S.; Luo, Y.; Verpoest, I. New set-up for measurement of permeability properties of fibrous reinforcements for RTM. Compos. Part A Appl. Sci. Manuf. 2002, 33, 959–969. [Google Scholar] [CrossRef]
- Song, Y.-S.; Youn, J.-R. Asymptotic expansion homogenization of permeability tensor for plain woven fabrics. Compos. Part A Appl. Sci. Manuf. 2006, 37, 2080–2087. [Google Scholar] [CrossRef]
- Comas-Cardona, S.; Binetruy, C.; Krawczak, P. Unidirectional compression of fibre reinforcements. Part 2: A continuous permeability tensor measurement. Compos. Sci. Technol. 2007, 67, 638–645. [Google Scholar] [CrossRef]
- Endruweit, A.; Long, A. Analysis of compressibility and permeability of selected 3D woven reinforcements. J. Compos. Mater. 2010, 44, 2833–2862. [Google Scholar] [CrossRef]
- Liu, Q.; Parnas, R.S.; Giffard, H.S. New set-up for in-plane permeability measurement. Compos. Part A Appl. Sci. Manuf. 2007, 38, 954–962. [Google Scholar] [CrossRef]
- Arbter, R.; Beraud, J.; Binetruy, C.; Bizet, L.; Bréard, J.; Comas-Cardona, S.; Demaria, C.; Endruweit, A.; Ermanni, P.; Gommer, F. Experimental determination of the permeability of textiles: A benchmark exercise. Compos. Part A Appl. Sci. Manuf. 2011, 42, 1157–1168. [Google Scholar] [CrossRef]
- Vernet, N.; Ruiz, E.; Advani, S.; Alms, J.; Aubert, M.; Barburski, M.; Barari, B.; Beraud, J.; Berg, D.; Correia, N. Experimental determination of the permeability of engineering textiles: Benchmark II. Compos. Part A Appl. Sci. Manuf. 2014, 61, 172–184. [Google Scholar] [CrossRef] [Green Version]
- Cho, Y.K.; Song, Y.S.; Kang, T.J.; Chung, K.; Youn, J.R. Permeability measurement of a circular braided preform for resin transfer molding. Fibers Polym. 2003, 4, 135–144. [Google Scholar] [CrossRef]
- Chae, H.S.; Song, Y.S.; Youn, J.R. Transverse permeability measurement of a circular braided preform in liquid composite molding. Korea-Aust. Rheol. J. 2007, 19, 17–25. [Google Scholar]
- Trevino, L.; Rupel, K.; Young, W.; Liou, M.J.; Lee, L.J. Analysis of resin injection molding in molds with preplaced fiber mats. I: Permeability and compressibility measurements. Polym. Compos. 1991, 12, 20–29. [Google Scholar] [CrossRef]
- Weitzenböck, J.; Shenoi, R.; Wilson, P. Measurement of three-dimensional permeability. Compos. Part A Appl. Sci. Manuf. 1998, 29, 159–169. [Google Scholar] [CrossRef]
- Wu, X.; Li, J.; Shenoi, R. A new method to determine fiber transverse permeability. J. Compos. Mater. 2007, 41, 747–756. [Google Scholar] [CrossRef]
- Nedanov, P.B.; Advani, S.G. A method to determine 3D permeability of fibrous reinforcements. J. Compos. Mater. 2002, 36, 241–254. [Google Scholar] [CrossRef]
- Elbouazzaoui, O.; Drapier, S.; Henrat, P. An experimental assessment of the saturated transverse permeability of non-crimped new concept (NC2) multiaxial fabrics. J. Compos. Mater. 2005, 39, 1169–1193. [Google Scholar] [CrossRef]
- Drapier, S.; Pagot, A.; Vautrin, A.; Henrat, P. Influence of the stitching density on the transverse permeability of non-crimped new concept (NC2) multiaxial reinforcements: Measurements and predictions. Compos. Sci. Technol. 2002, 62, 1979–1991. [Google Scholar] [CrossRef]
- Ouagne, P.; Bréard, J. Continuous transverse permeability of fibrous media. Composites Part A 2010, 41, 22–28. [Google Scholar] [CrossRef] [Green Version]
- Scholz, S.; Gillespie, J.W.; Heider, D. Measurement of transverse permeability using gaseous and liquid flow. Composites Part A 2007, 38, 2034–2040. [Google Scholar] [CrossRef]
- Carman, P.C. Fluid flow through granular beds. Trans. Inst. Chem. Eng. 1937, 15, 150–166. [Google Scholar] [CrossRef]
- Shih, C.H.; Lee, L.J. Effect of fiber architecture on permeability in liquid composite molding. Polym. Compos. 1998, 19, 626–639. [Google Scholar] [CrossRef]
- Šimáček, P.; Advani, S.G. Permeability model for a woven fabric. Polym. Compos. 1996, 17, 887–899. [Google Scholar] [CrossRef]
- Skartsis, L.; Khomami, B.; Kardos, J. Resin flow through fiber beds during composite manufacturing processes. Part II: Numerical and experimental studies of Newtonian flow through ideal and actual fiber beds. Polym. Eng. Sci. 1992, 32, 231–239. [Google Scholar] [CrossRef]
- Yu, B.; James Lee, L. A simplified in-plane permeability model for textile fabrics. Polym. Compos. 2000, 21, 660–685. [Google Scholar] [CrossRef]
- Yu, B.; Lee, L.J.; Cao, H. A fractal in-plane permeability model for fabrics. Polym. Compos. 2002, 23, 201–221. [Google Scholar] [CrossRef]
- Dong, S.; He, H.; Jia, Y.; Wang, C.; Jiao, X. A new structure-related model to predict the permeability of non-crimp fabric preform. J. Compos. Mater. 2013, 47, 3053–3063. [Google Scholar] [CrossRef]
- Nordlund, M.; Lundström, T.; Frishfelds, V.; Jakovics, A. Permeability network model for non-crimp fabrics. Composites Part A 2006, 37, 826–835. [Google Scholar] [CrossRef]
- Chen, Z.-R.; Ye, L.; Lu, M. Permeability predictions for woven fabric preforms. J. Compos. Mater. 2009. [Google Scholar] [CrossRef]
- Adams, K.L.; Miller, B.; Rebenfeld, L. Forced in-plane flow of an epoxy resin in fibrous networks. Polym. Eng. Sci. 1986, 26, 1434–1441. [Google Scholar] [CrossRef]
- Bahrami, M.; Yovanovich, M.M.; Culham, J.R. A novel solution for pressure drop in singly connected microchannels of arbitrary cross-section. Int. J. Heat Mass Transfer 2007, 50, 2492–2502. [Google Scholar] [CrossRef]
- Nordlund, M.; Lundstrom, T.S. Numerical study of the local permeability of noncrimp fabrics. J. Compos. Mater. 2005, 39, 929–947. [Google Scholar] [CrossRef]
- Shou, D.; Ye, L.; Tang, Y.; Fan, J.; Ding, F. Transverse permeability determination of dual-scale fibrous materials. Int. J. Heat Mass Transfer 2013, 58, 532–539. [Google Scholar] [CrossRef]
- Papathanasiou, T. Flow across structured fiber bundles: A dimensionless correlation. Int. J. Multiph. Flow 2001, 27, 1451–1461. [Google Scholar] [CrossRef]
- Vernet, N.; Trochu, F. Permeability analytical modeling of 3d interlock fabrics. In Proceedings of the 19th International Conference on Composite Materials, Montreal, QC, Canada, 28 July–2 August 2013. [Google Scholar]
- Vernet, N.; Trochu, F. Analysis of mesoscopic pore size in 3D-interlock fabrics and validation of a predictive permeability model. J. Reinf. Plast. Compos. 2016, 35, 471–486. [Google Scholar] [CrossRef]
- Karaki, M.; Hallal, A.; Younes, R.; Trochu, F.; Lafon, P. In-plane permeability prediction model for non-crimp and 3D orthogonal fabrics. J. Text. Inst. 2018, 109, 1110–1126. [Google Scholar] [CrossRef]
- Fournier, R. Optimisation et modélisation du procédé RTM. Ph.D. Thesis, École Nationale Supérieure des Mines de Paris, Paris, France, 2003. [Google Scholar]
- Hoareau, C. Injection sur Renfort: Etude du Remplissage de Moule et Détermination Théorique de la Perméabilité des Tissus. Ph.D. Thesis, Ecole nationale supérieure des Mines de Paris, Paris, France, 1994. [Google Scholar]
- Laine, B. Influence des Déformations d’un Renfort Fibreux sur sa Perméabilité: Modélisations et Expériences. Ph.D. Thesis, Arts et Métiers ParisTech, Paris, France, 2008. [Google Scholar]
- Laine, B.; Beauchêne, P.; Boisse, P.; Hivet, G.; Lomov, S.V.; Hirsekorn, M.; Badel, P. Permeability of woven fabrics: Analytical and numerical predictions. In Proceedings of the FPCM-10, 10th International Conference on Flow Processes in Composite Materials, Monte Verità/Ascona, Switzerland, 12–15 July 2010. [Google Scholar]
- Loix, F.; Badel, P.; Orgéas, L.; Geindreau, C.; Boisse, P. Woven fabric permeability: From textile deformation to fluid flow mesoscale simulations. Compos. Sci. Technol. 2008, 68, 1624–1630. [Google Scholar] [CrossRef]
- Ngo, N.; Tamma, K. Microscale permeability predictions of porous fibrous media. Int. J. Heat Mass Transfer 2001, 44, 3135–3145. [Google Scholar] [CrossRef]
- Takano, N.; Zako, M.; Okazaki, T.; Terada, K. Microstructure-based evaluation of the influence of woven architecture on permeability by asymptotic homogenization theory. Compos. Sci. Technol. 2002, 62, 1347–1356. [Google Scholar] [CrossRef]
- Spaid, M.A.; Phelan, F.R. Modeling void formation dynamics in fibrous porous media with the lattice Boltzmann method. Composites Part A 1998, 29, 749–755. [Google Scholar] [CrossRef]
- Martys, N.S.; Chen, H. Simulation of multicomponent fluids in complex three-dimensional geometries by the lattice Boltzmann method. Phys. Rev. E 1996, 53, 743. [Google Scholar] [CrossRef]
- Dunkers, J.P.; Phelan, F.R.; Flynn, K.M.; Sanders, D.P.; Parnas, R.S. Permeability Prediction from Non-Destructive Imaging of Composite Microstructure. In Proceedings of the 59th Society of Plastics Engineers Annual Conference, Dallas, TX, USA, 1 May 2001. [Google Scholar]
- Chen, H.; Gould, H.; Tobochnik, J. Discrete Boltzmann systems and fluid flows. Comput. Phys. 1993, 7, 632–637. [Google Scholar] [CrossRef]
- Shan, X.; Chen, H. Lattice Boltzmann model for simulating flows with multiple phases and components. Phys. Rev. E 1993, 47, 1815. [Google Scholar] [CrossRef]
- Shan, X.; Chen, H. Simulation of nonideal gases and liquid-gas phase transitions by the lattice Boltzmann equation. Phys. Rev. E 1994, 49, 2941. [Google Scholar] [CrossRef]
- Spaid, M.A.; Phelan Jr, F.R. Lattice Boltzmann methods for modeling microscale flow in fibrous porous media. Phys. Fluids 1997, 9, 2468–2474. [Google Scholar] [CrossRef]
- Irayani, Z.; Fauzi, U.; Viridi, S.; Latief, F. Calculation of anisotropy permeability from 3D tomographic images using renormalization group approaches and lattice Boltzmann method. J. Pet. Explor. Prod. Technol. 2018, 9, 889–897. [Google Scholar] [CrossRef] [Green Version]
- Auzerais, F.; Dunsmuir, J.; Ferreol, B.; Martys, N.; Olson, J.; Ramakrishnan, T.; Rothman, D.; Schwartz, L. Transport in sandstone: A study based on three dimensional microtomography. Geophys. Res. Lett. 1996, 23, 705–708. [Google Scholar] [CrossRef]
- Sethian, J.A. Level set methods and fast marching methods. J. Comput. Inf. Technol. 2003, 11, 1–2. [Google Scholar]
- Verleye, B.; Croce, R.; Griebel, M.; Klitz, M.; Lomov, S.V.; Morren, G.; Sol, H.; Verpoest, I.; Roose, D. Permeability of textile reinforcements: Simulation, influence of shear and validation. Compos. Sci. Technol. 2008, 68, 2804–2810. [Google Scholar] [CrossRef]
- Verleye, B.; Klitz, M.; Croce, R.; Roose, D.; Lomov, S.V.; Verpoest, I. Computation of permeability of textile reinforcements. In Proceedings of the 17th IMACS World Congres, CD-edition, Paris, France, 11–15 July 2005. [Google Scholar]
- Trochu, F.; Gauvin, R. Limitations of a boundary-fitted finite difference method for the simulation of the resin transfer molding process. J. Reinf. Plast. Compos. 1992, 11, 772–786. [Google Scholar] [CrossRef]
- Hori, M. Bounds for effective material properties of statistically nonhomogeneous solid. Struct. Engrg. Earthq. Engrg 1993, 11, 131s–140s. [Google Scholar]
Figure 1.
Different scales considered in a 3D orthogonal fabric.
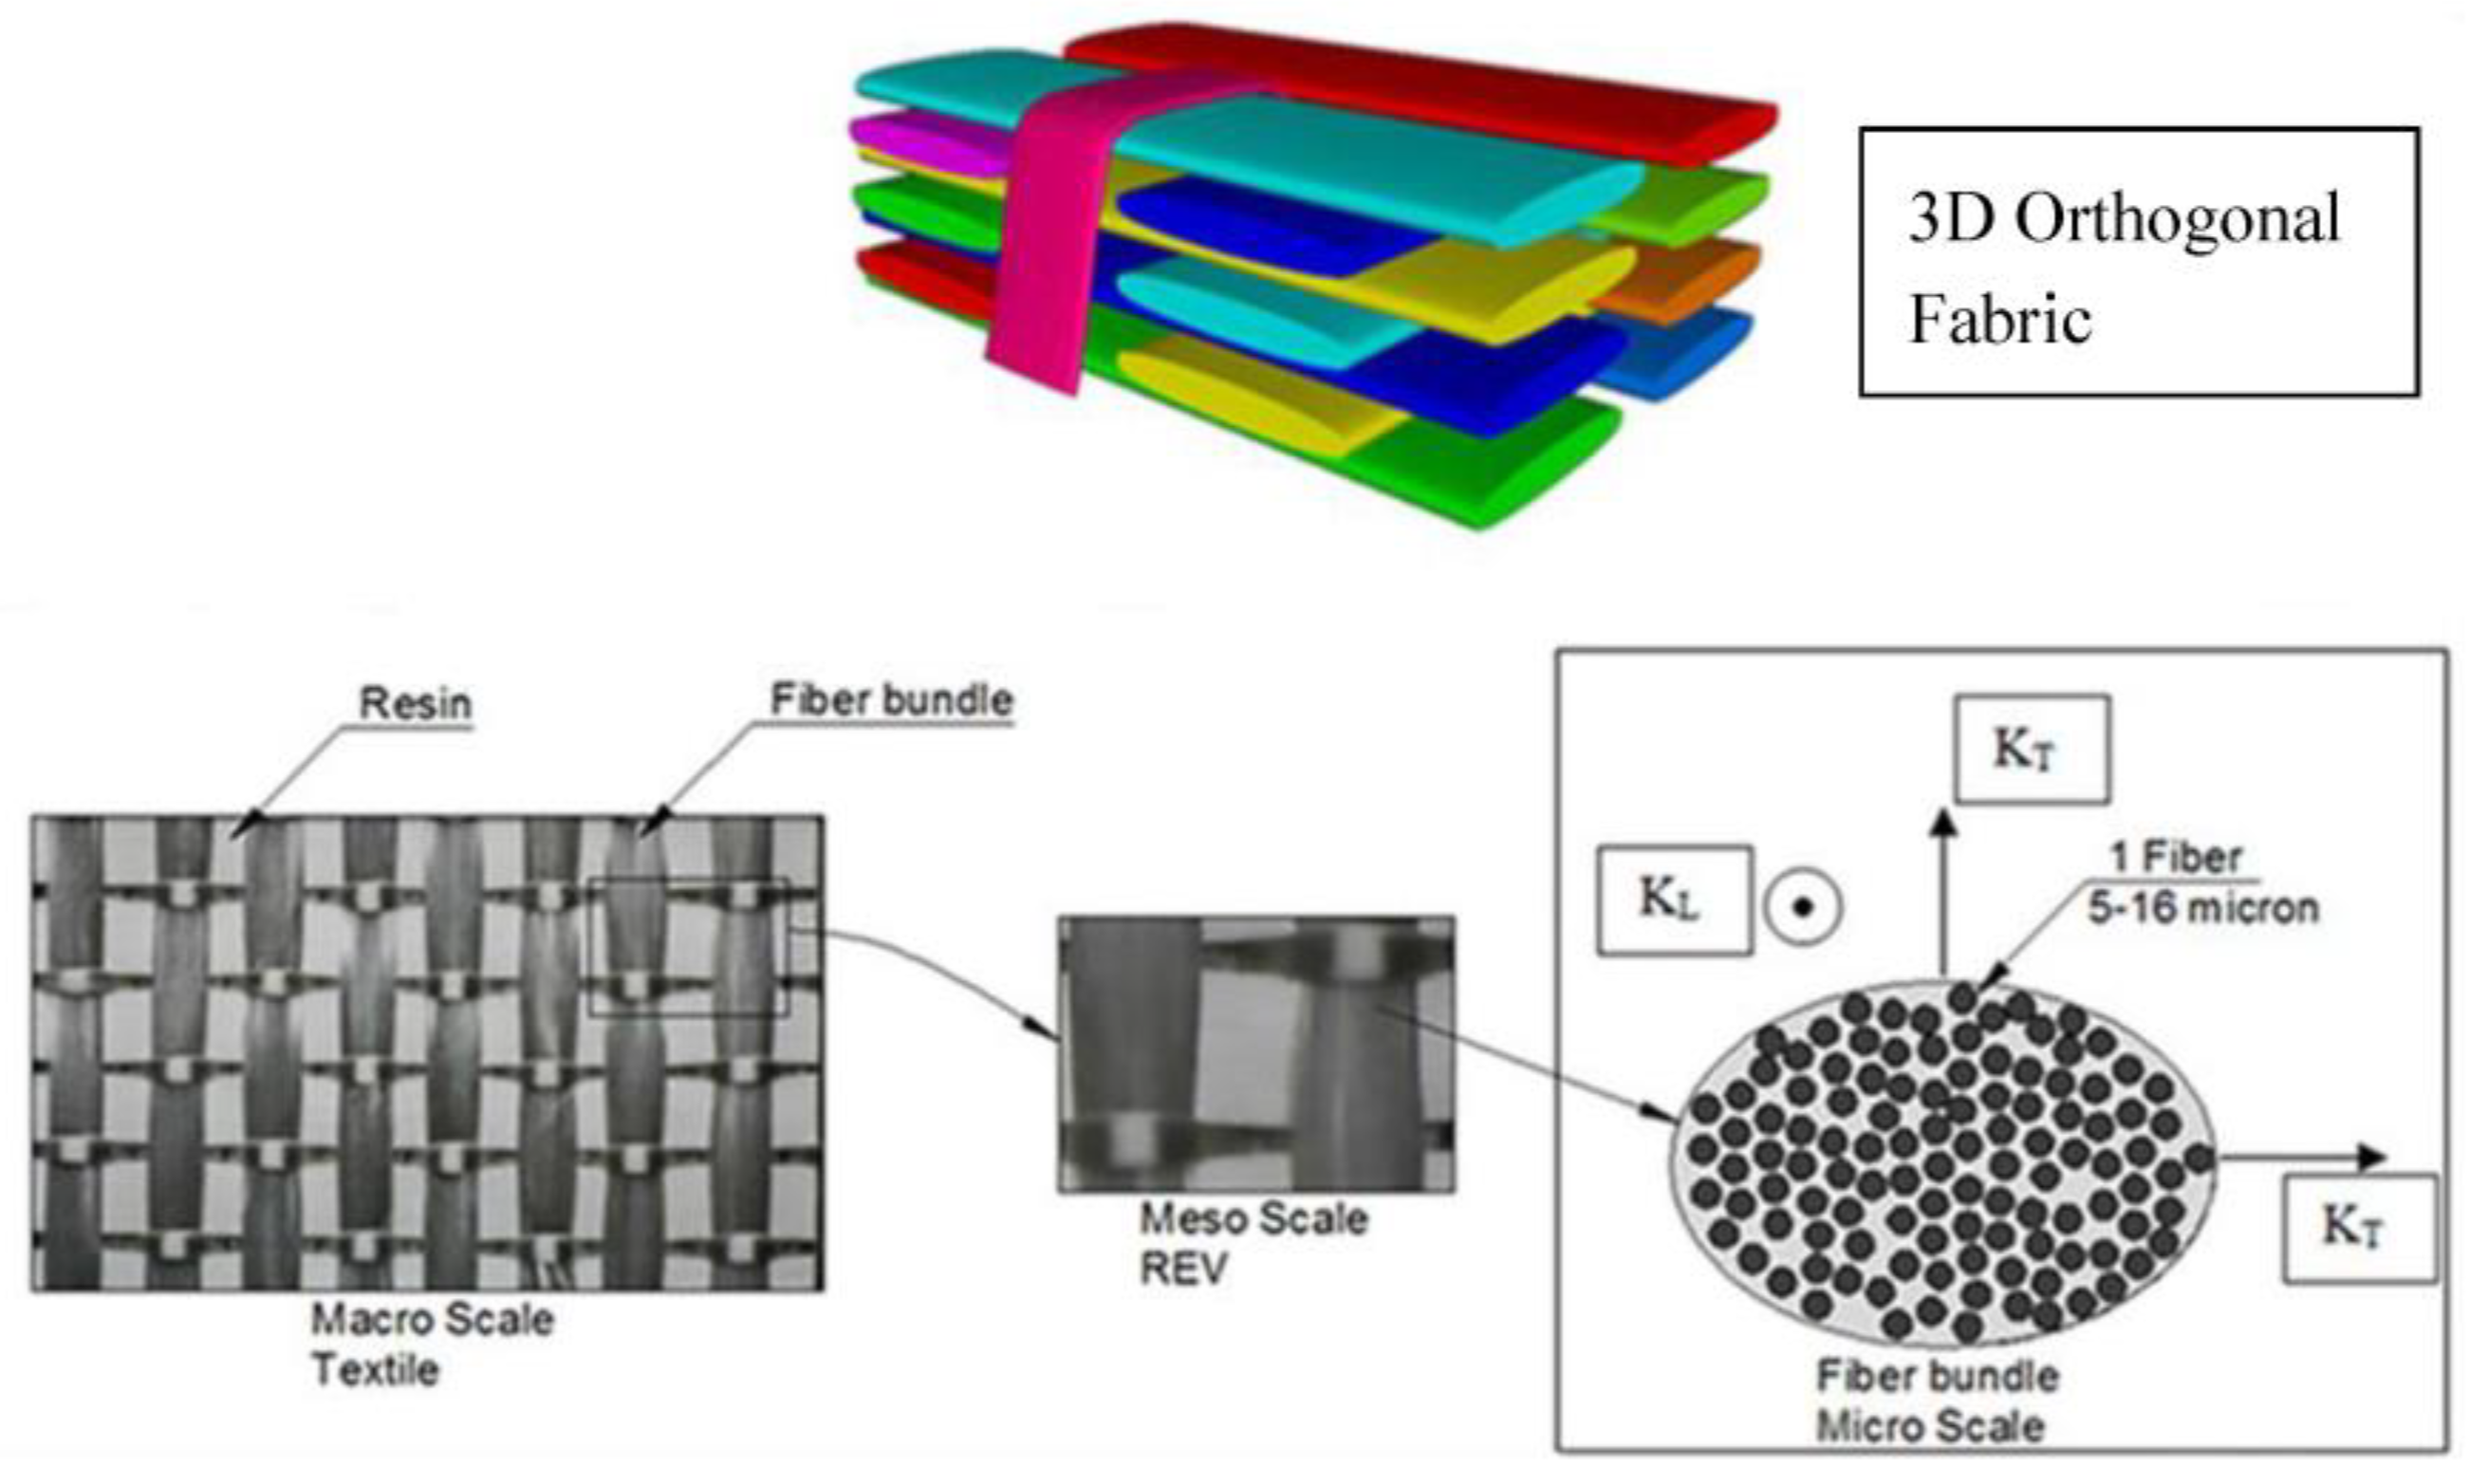
Figure 2.
Square (a), triangular (b), and hexagonal unit cells (c), and a combination of octagonal and square arrays of cylinders (d).
Figure 2.
Square (a), triangular (b), and hexagonal unit cells (c), and a combination of octagonal and square arrays of cylinders (d).
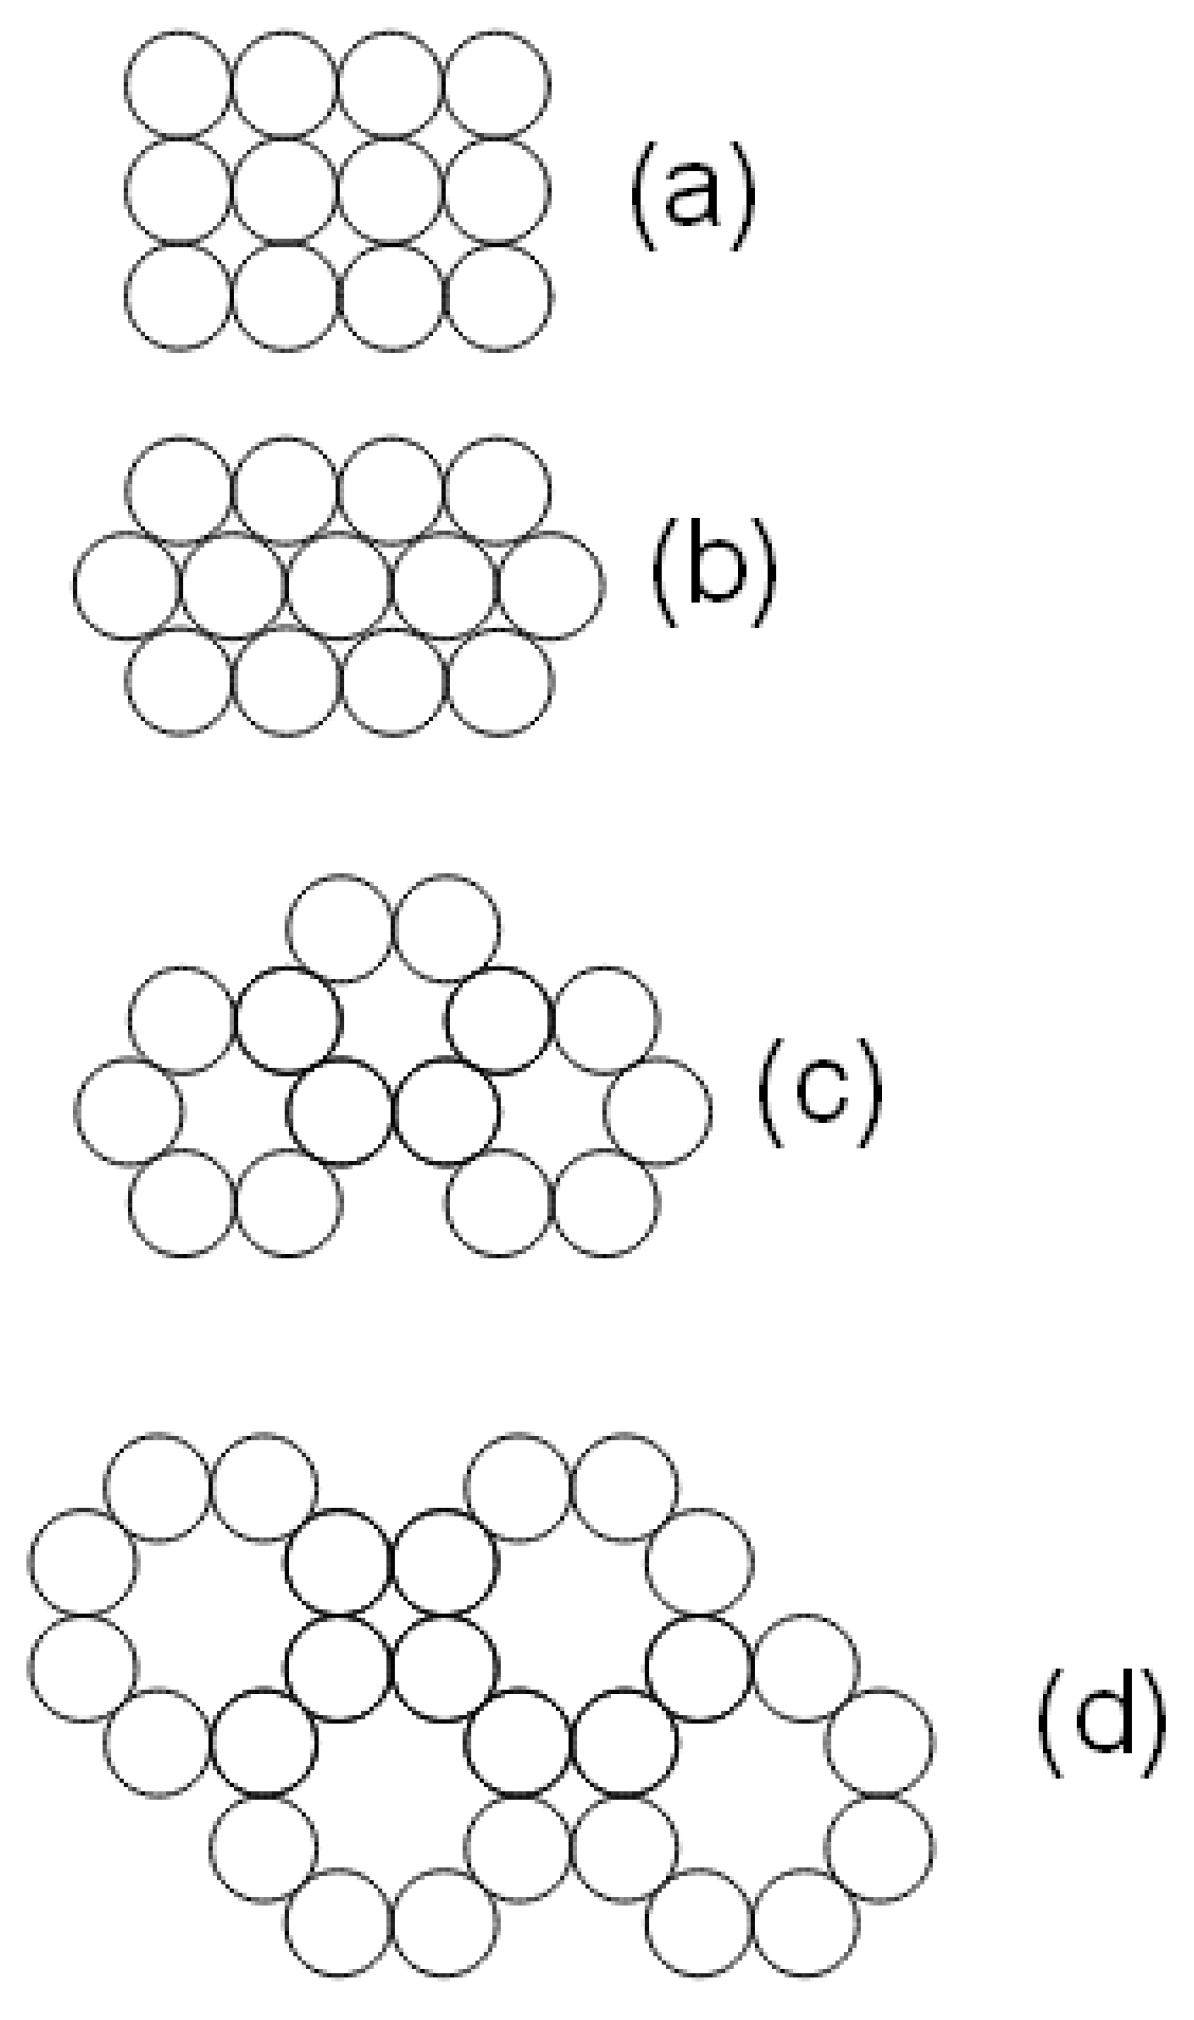
Figure 3.
Comparison between longitudinal direction models [35].
Figure 3.
Comparison between longitudinal direction models [35].
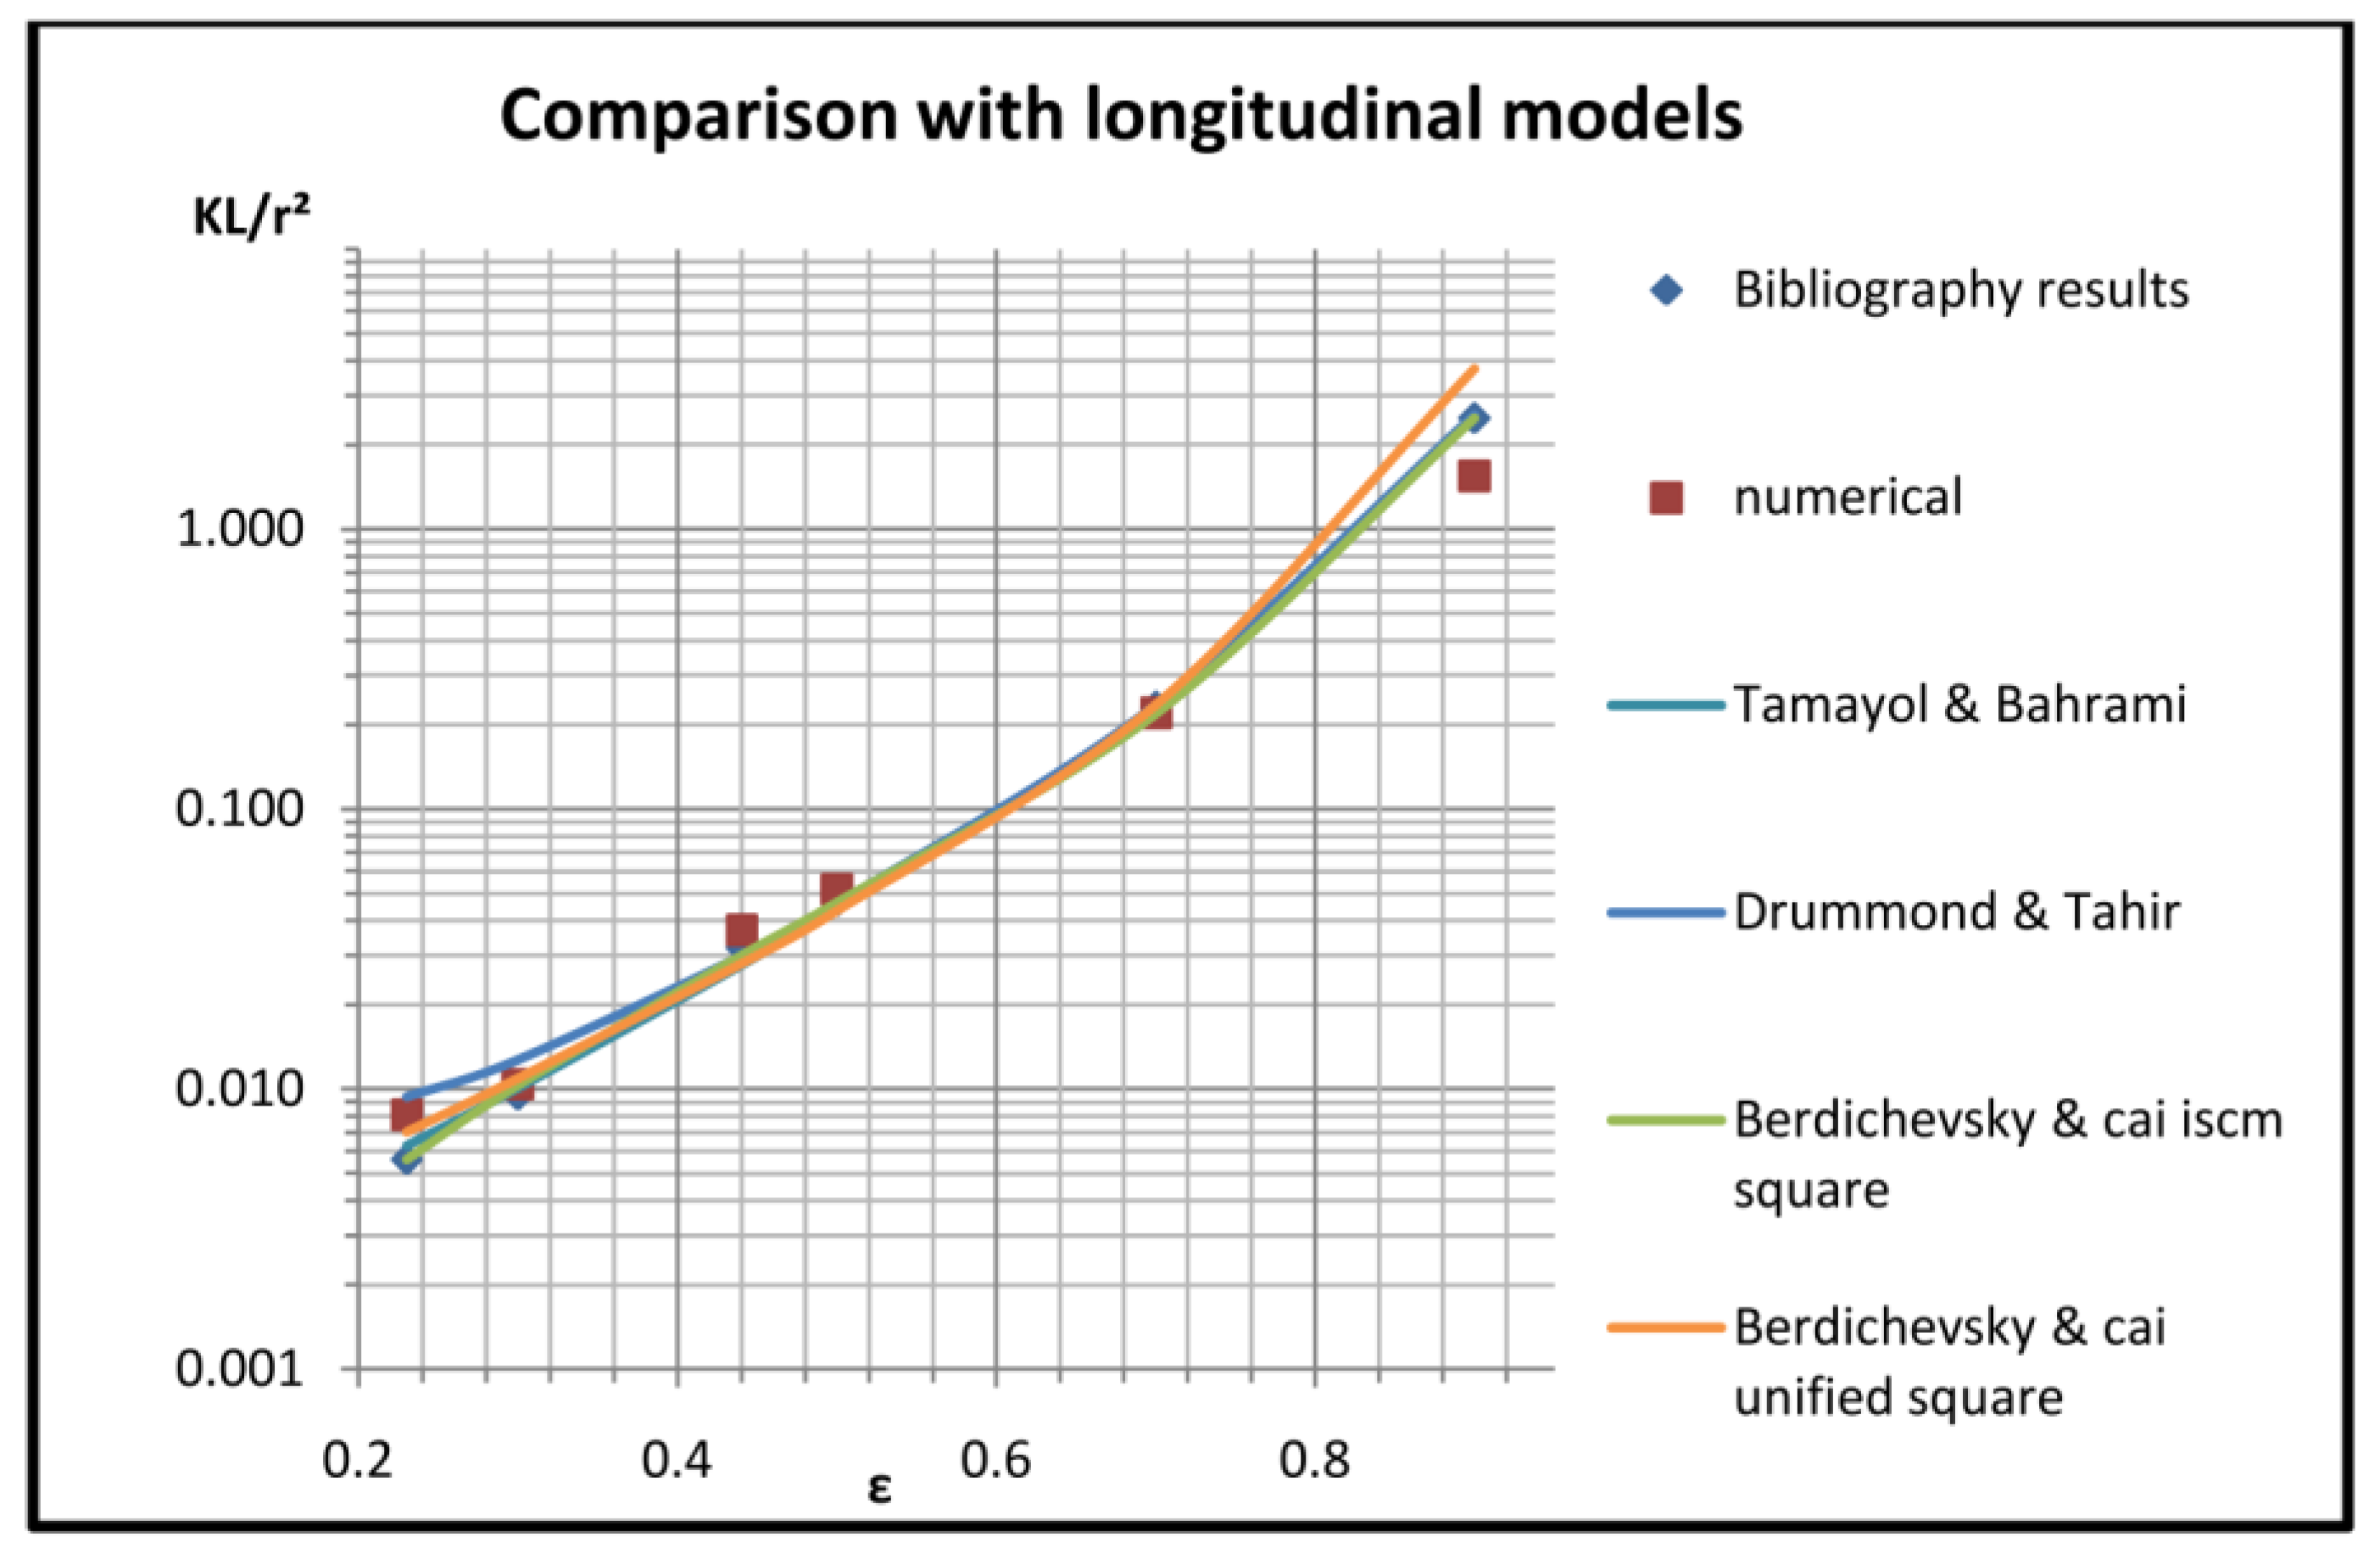
Figure 4.
Comparison between transversal direction models [35].
Figure 4.
Comparison between transversal direction models [35].
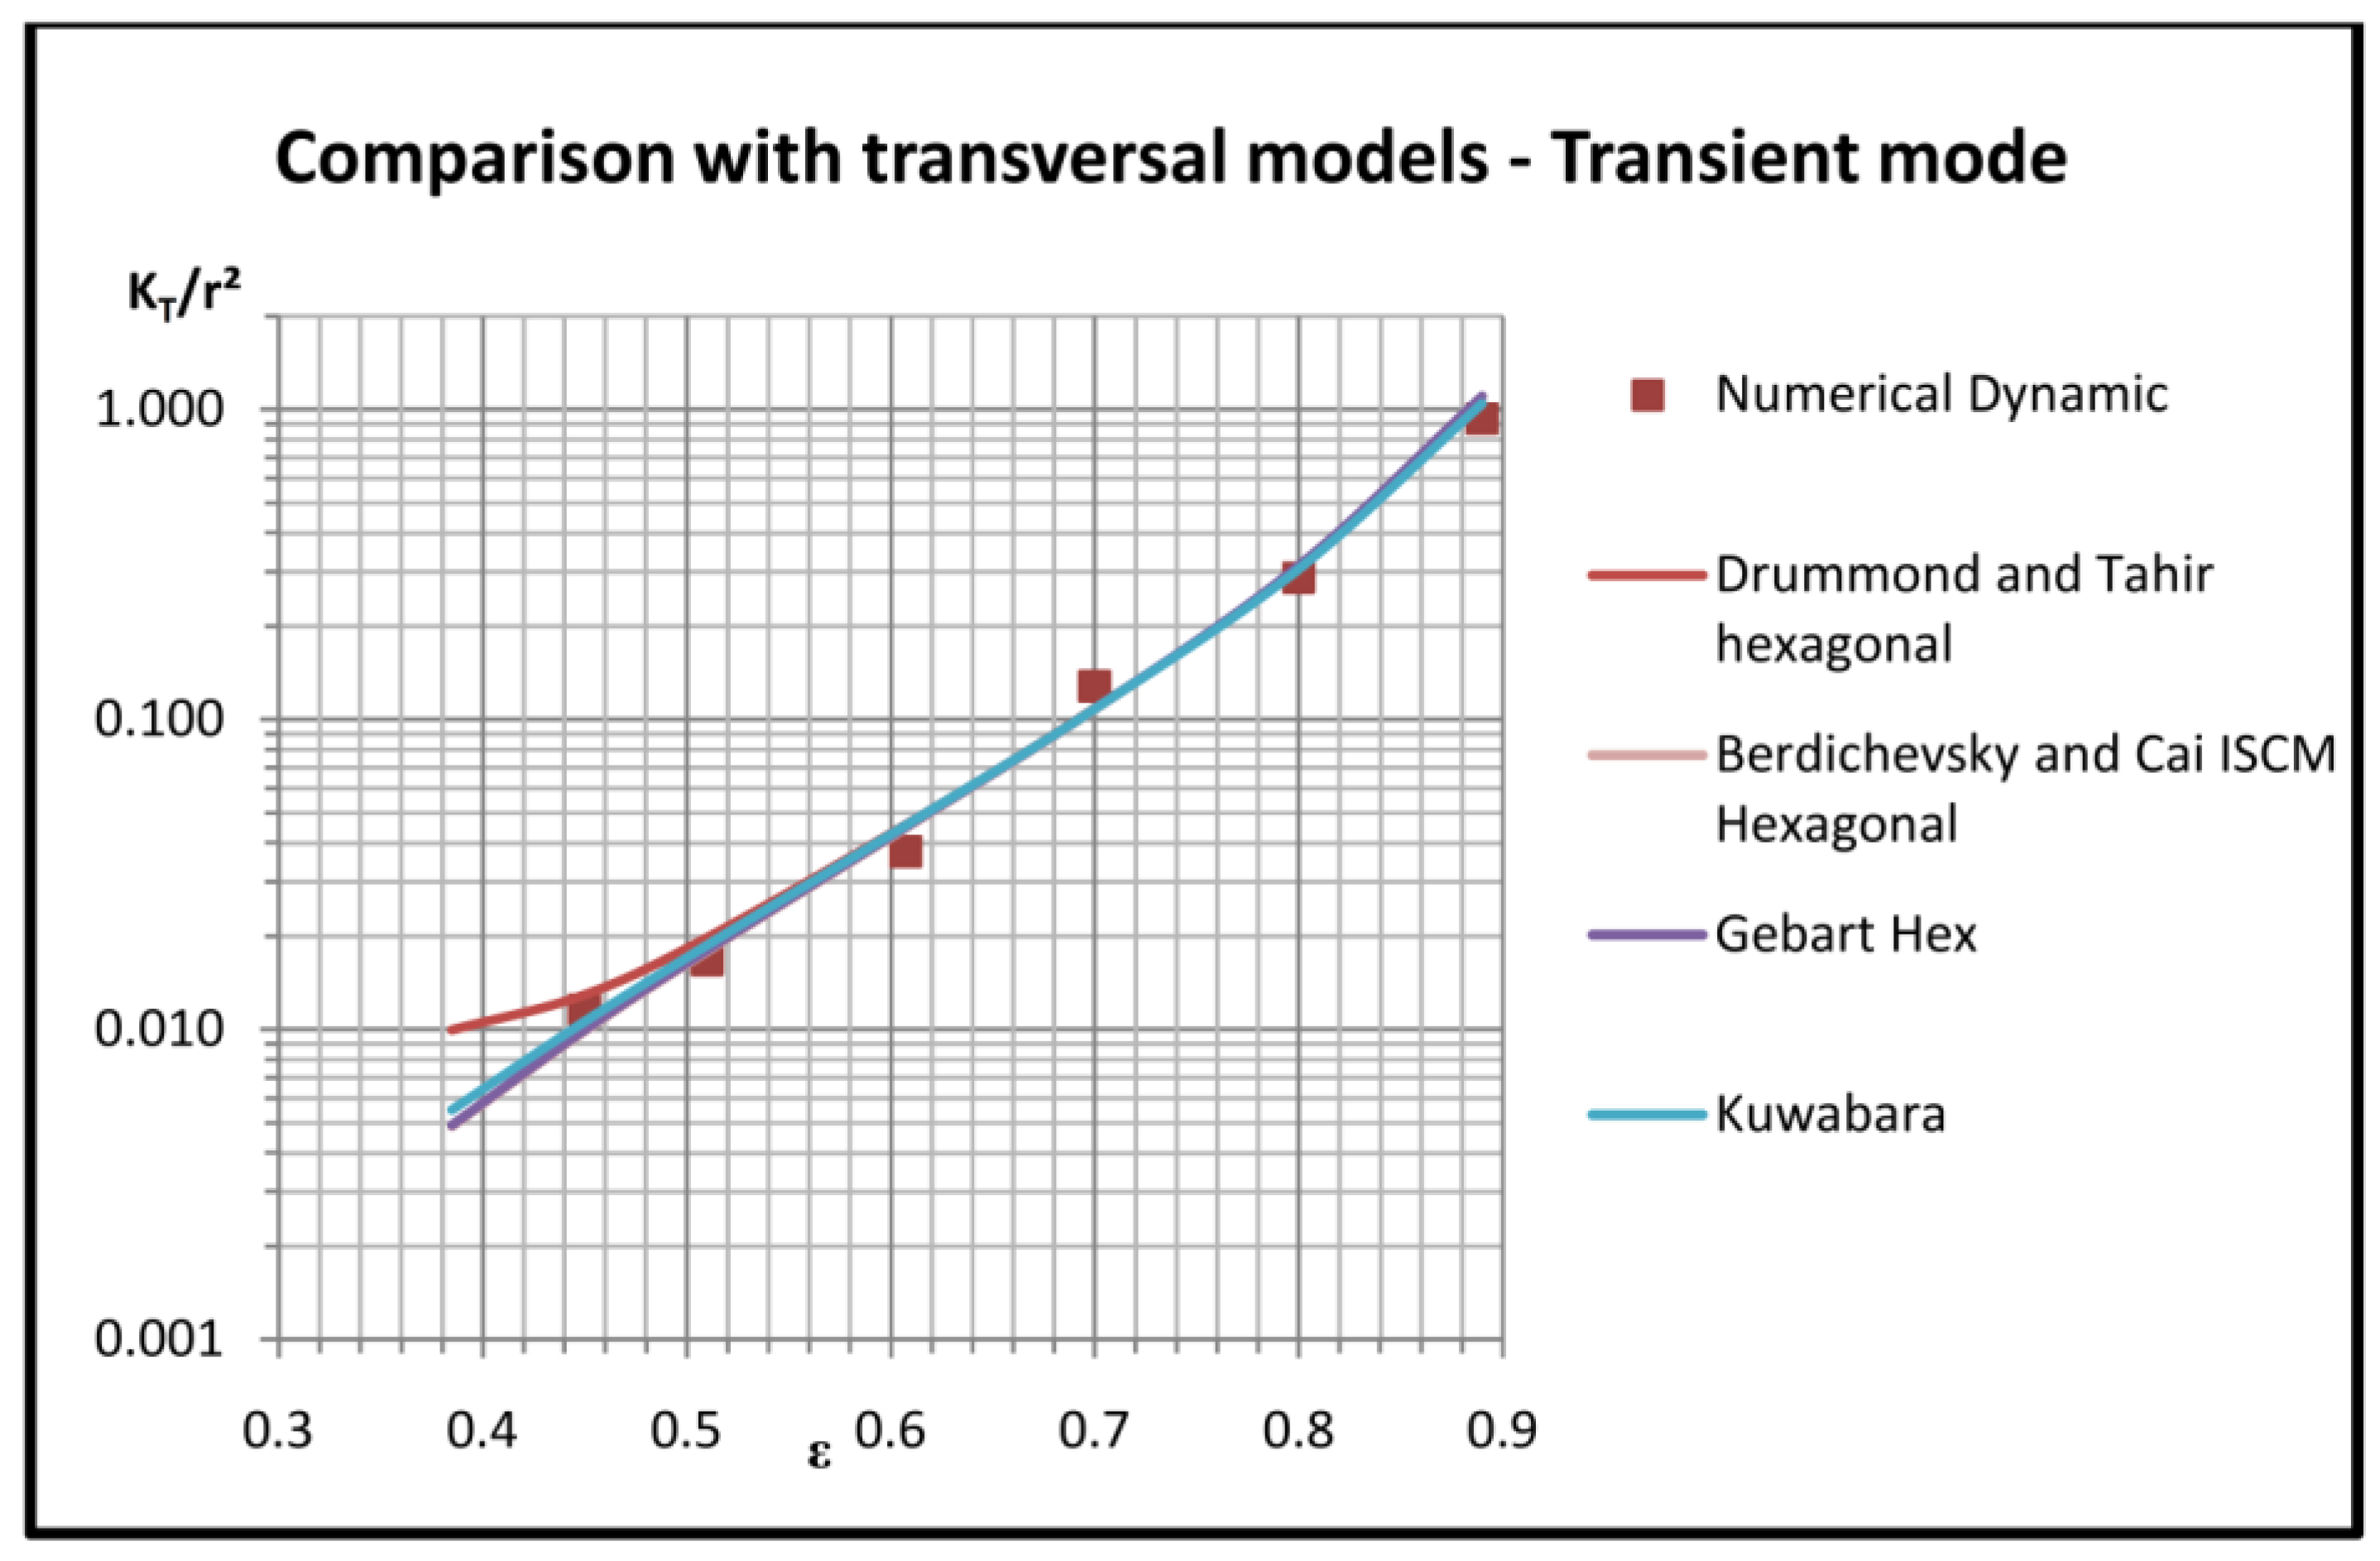
Figure 5.
Schematic of two types of flow geometries considered in the testing of the in-plane permeability; (a) describes unidirectional flow experiments and (b) radial flow experiments [9].
Figure 5.
Schematic of two types of flow geometries considered in the testing of the in-plane permeability; (a) describes unidirectional flow experiments and (b) radial flow experiments [9].
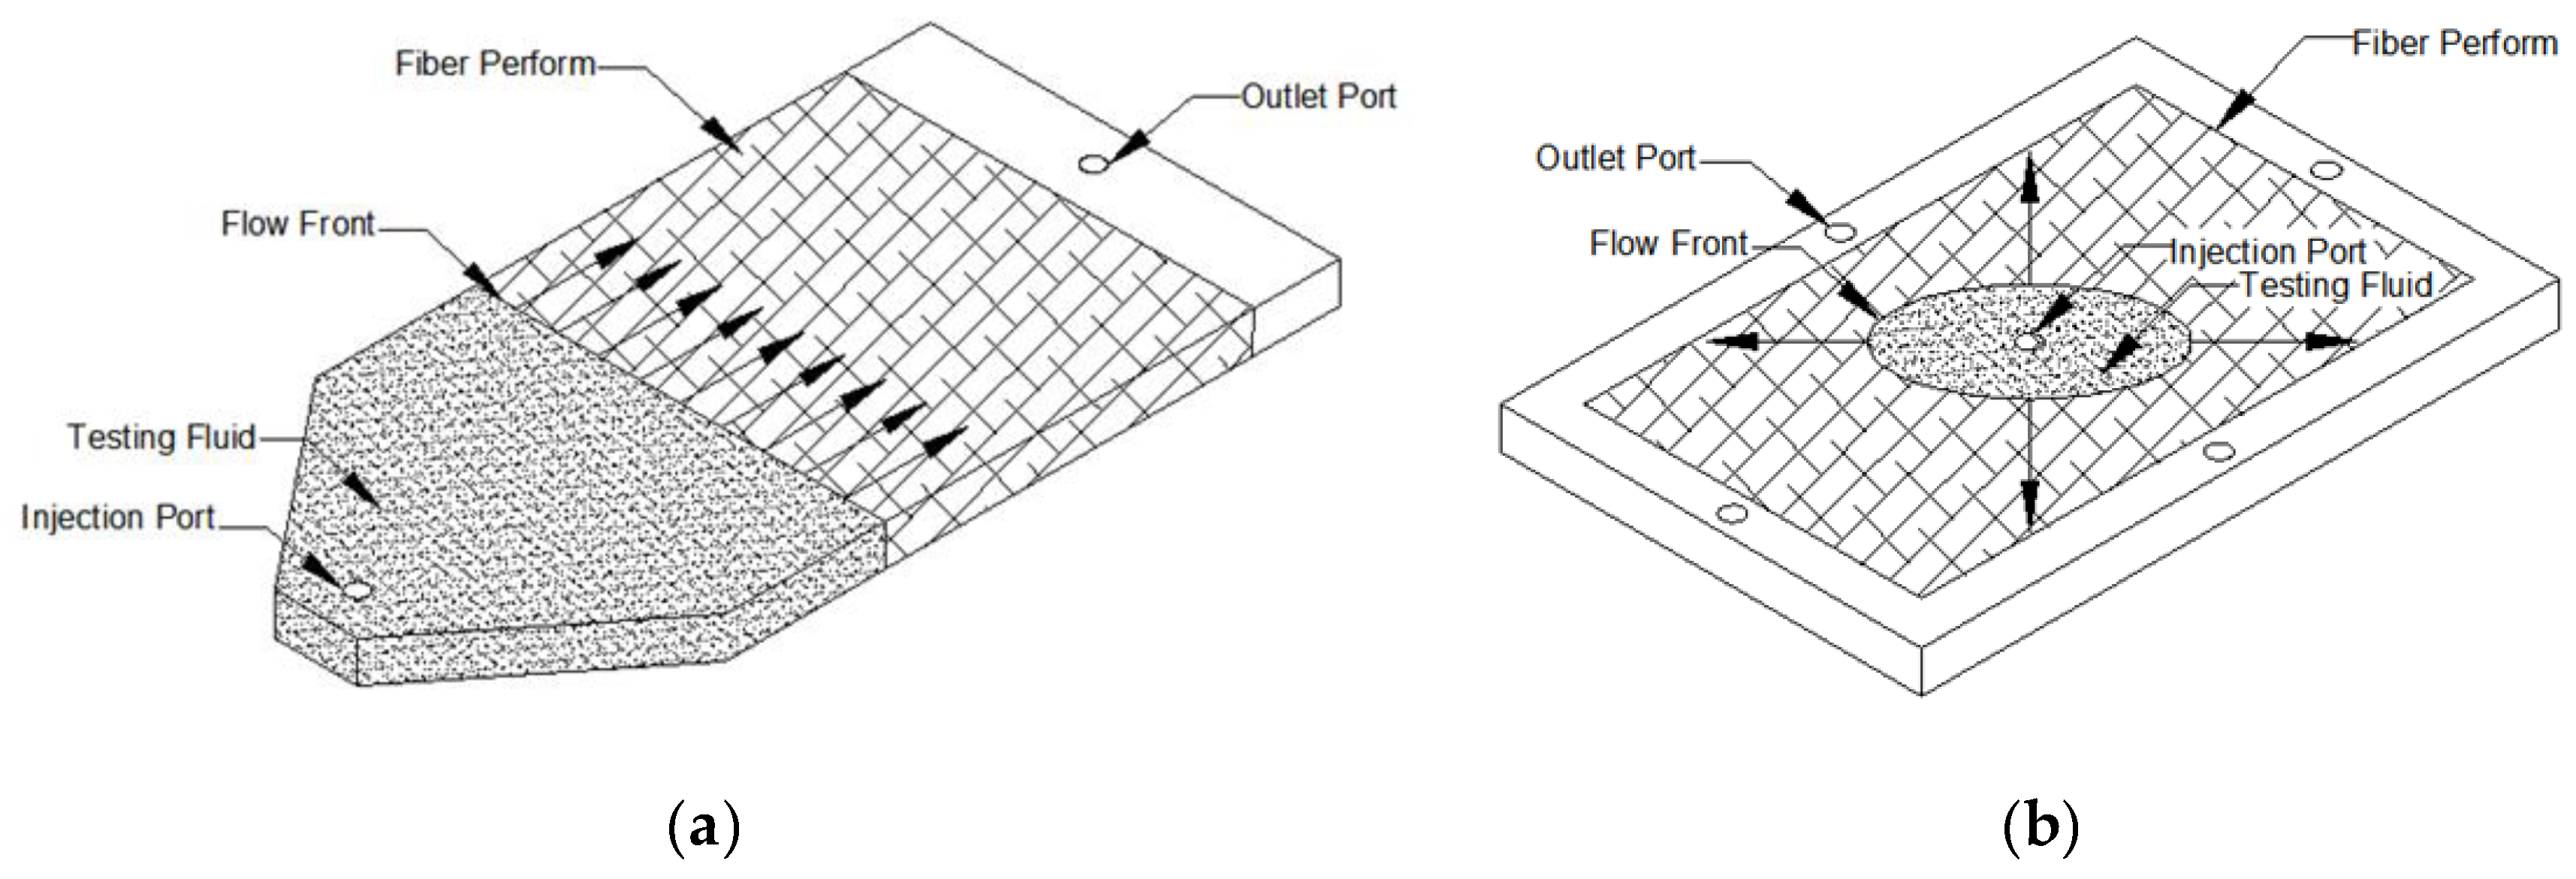
Figure 6.
Principal permeability values for G0986 fabric (direction 2) [44].
Figure 6.
Principal permeability values for G0986 fabric (direction 2) [44].

Figure 7.
Principal permeability values for G0986 fabric (direction 2) [45].
Figure 7.
Principal permeability values for G0986 fabric (direction 2) [45].
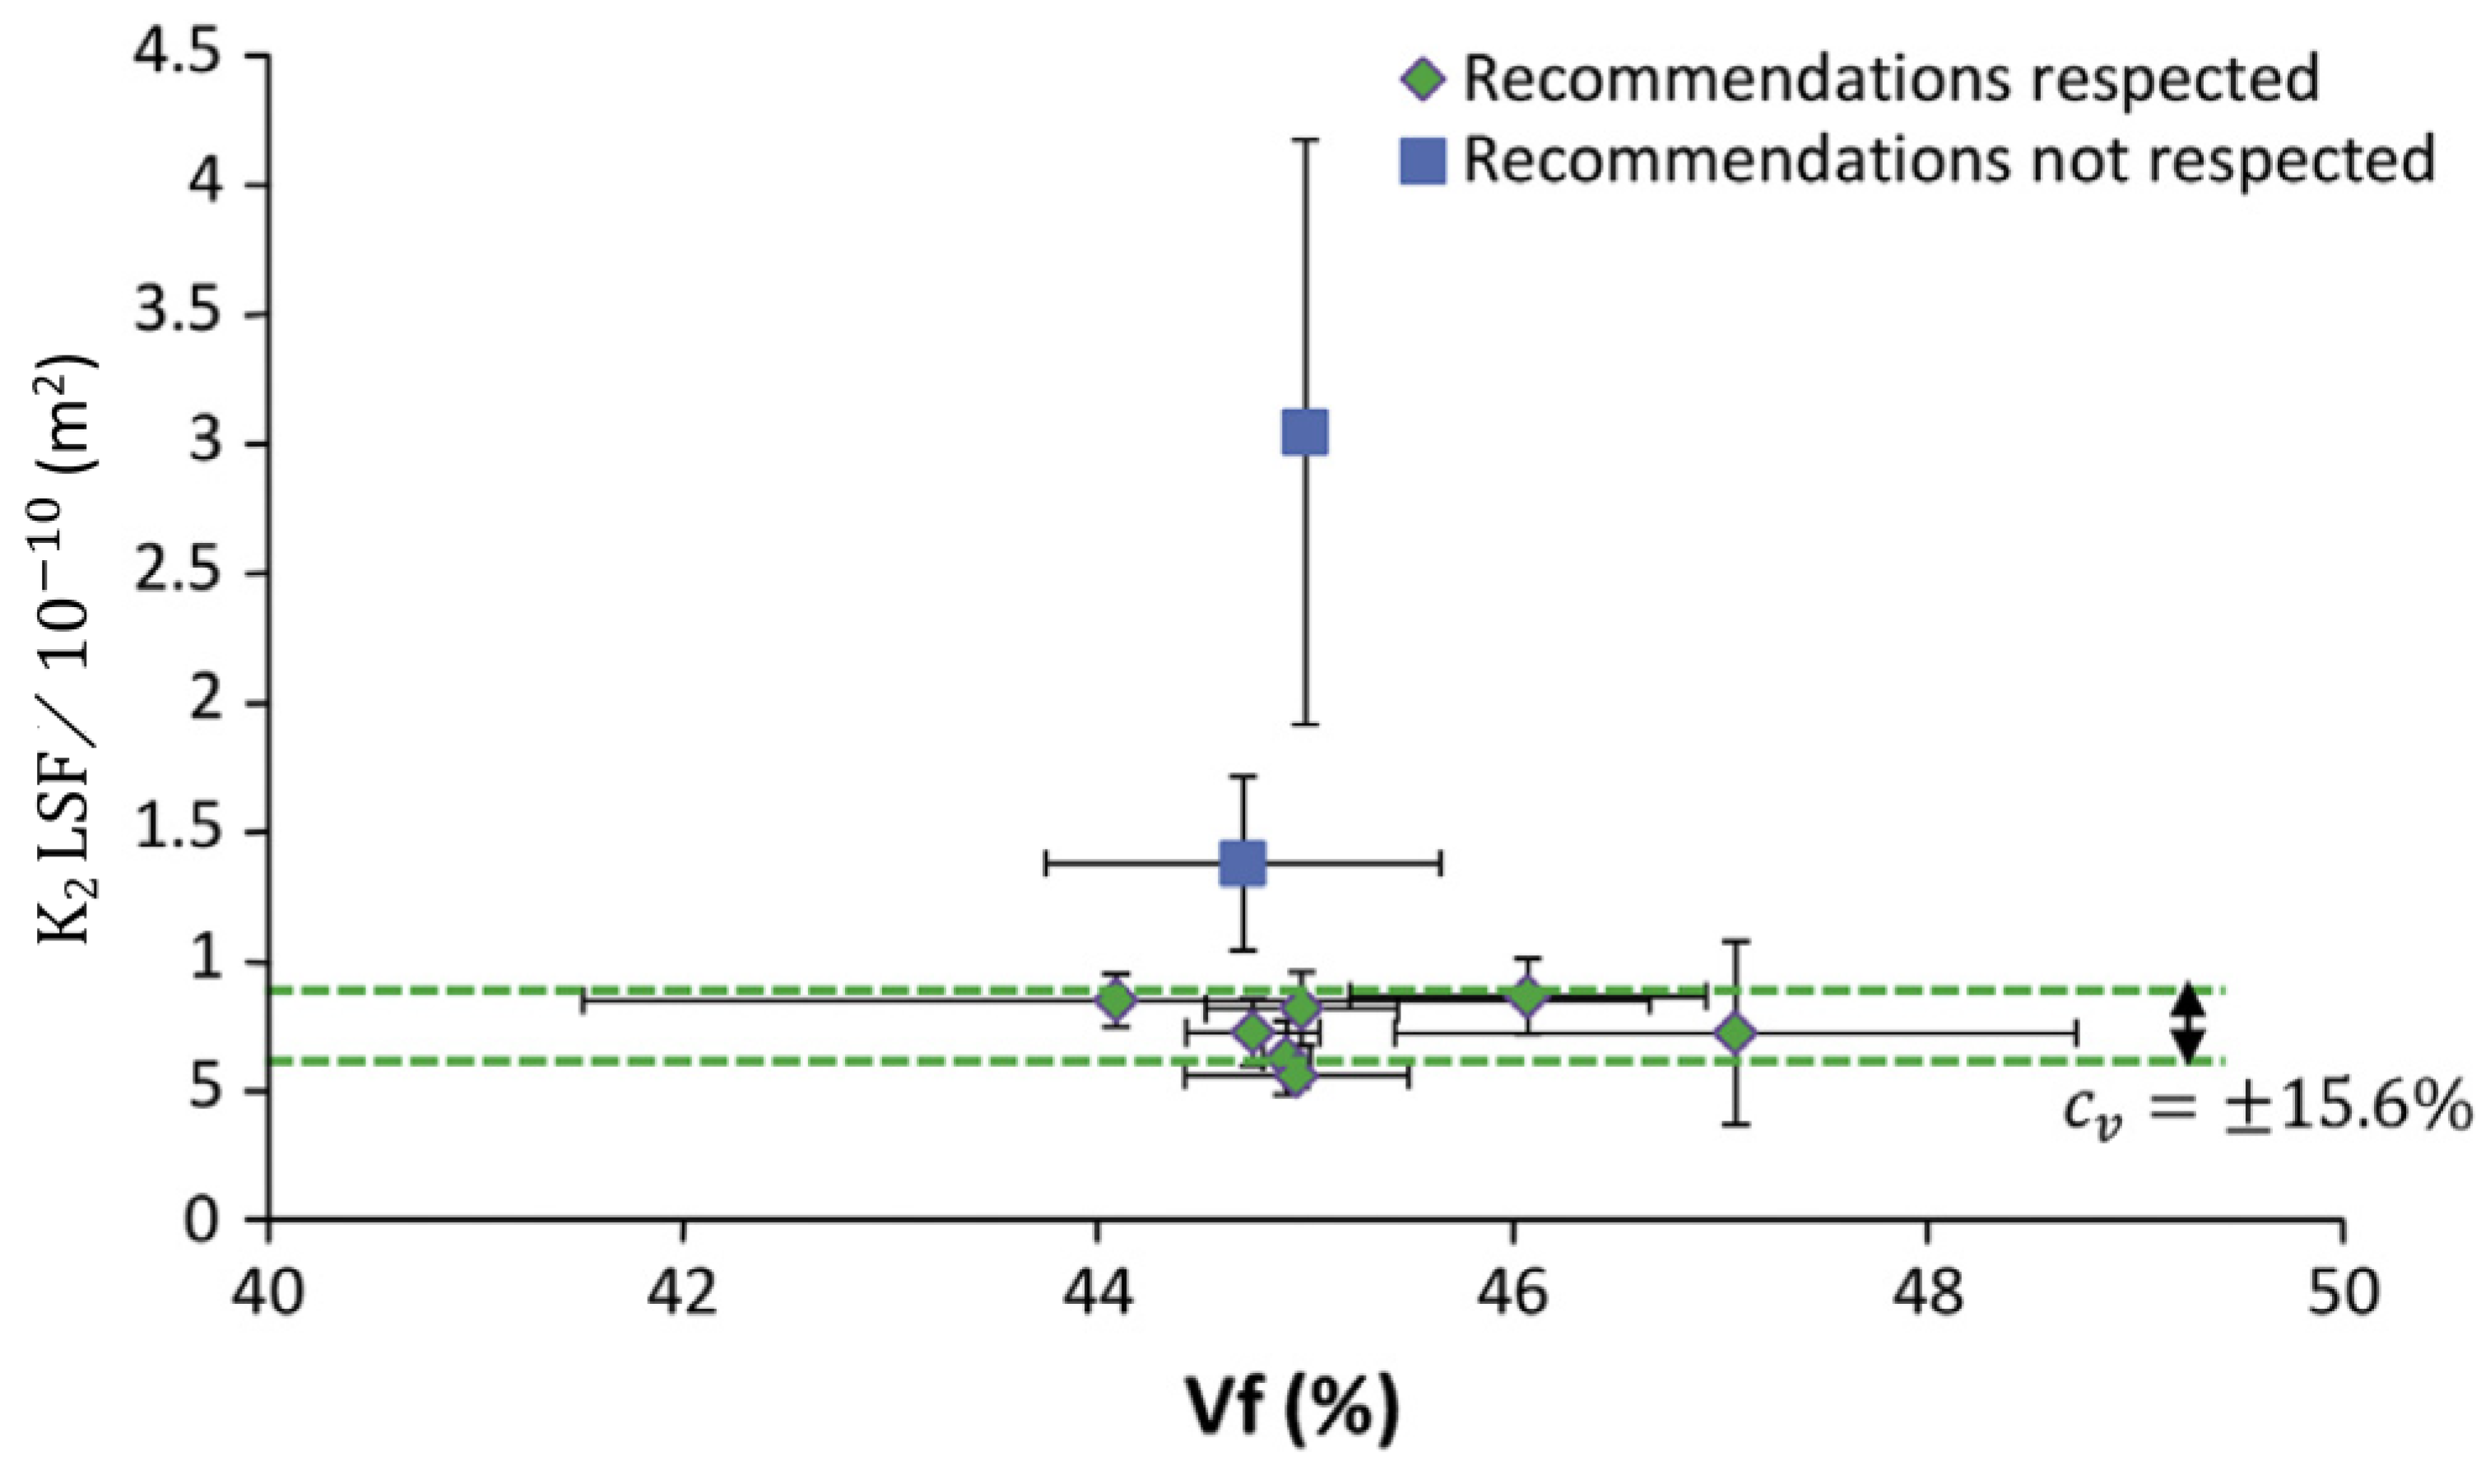
Figure 8.
Through-thickness permeability measuring device [20] karaka.
Figure 8.
Through-thickness permeability measuring device [20] karaka.
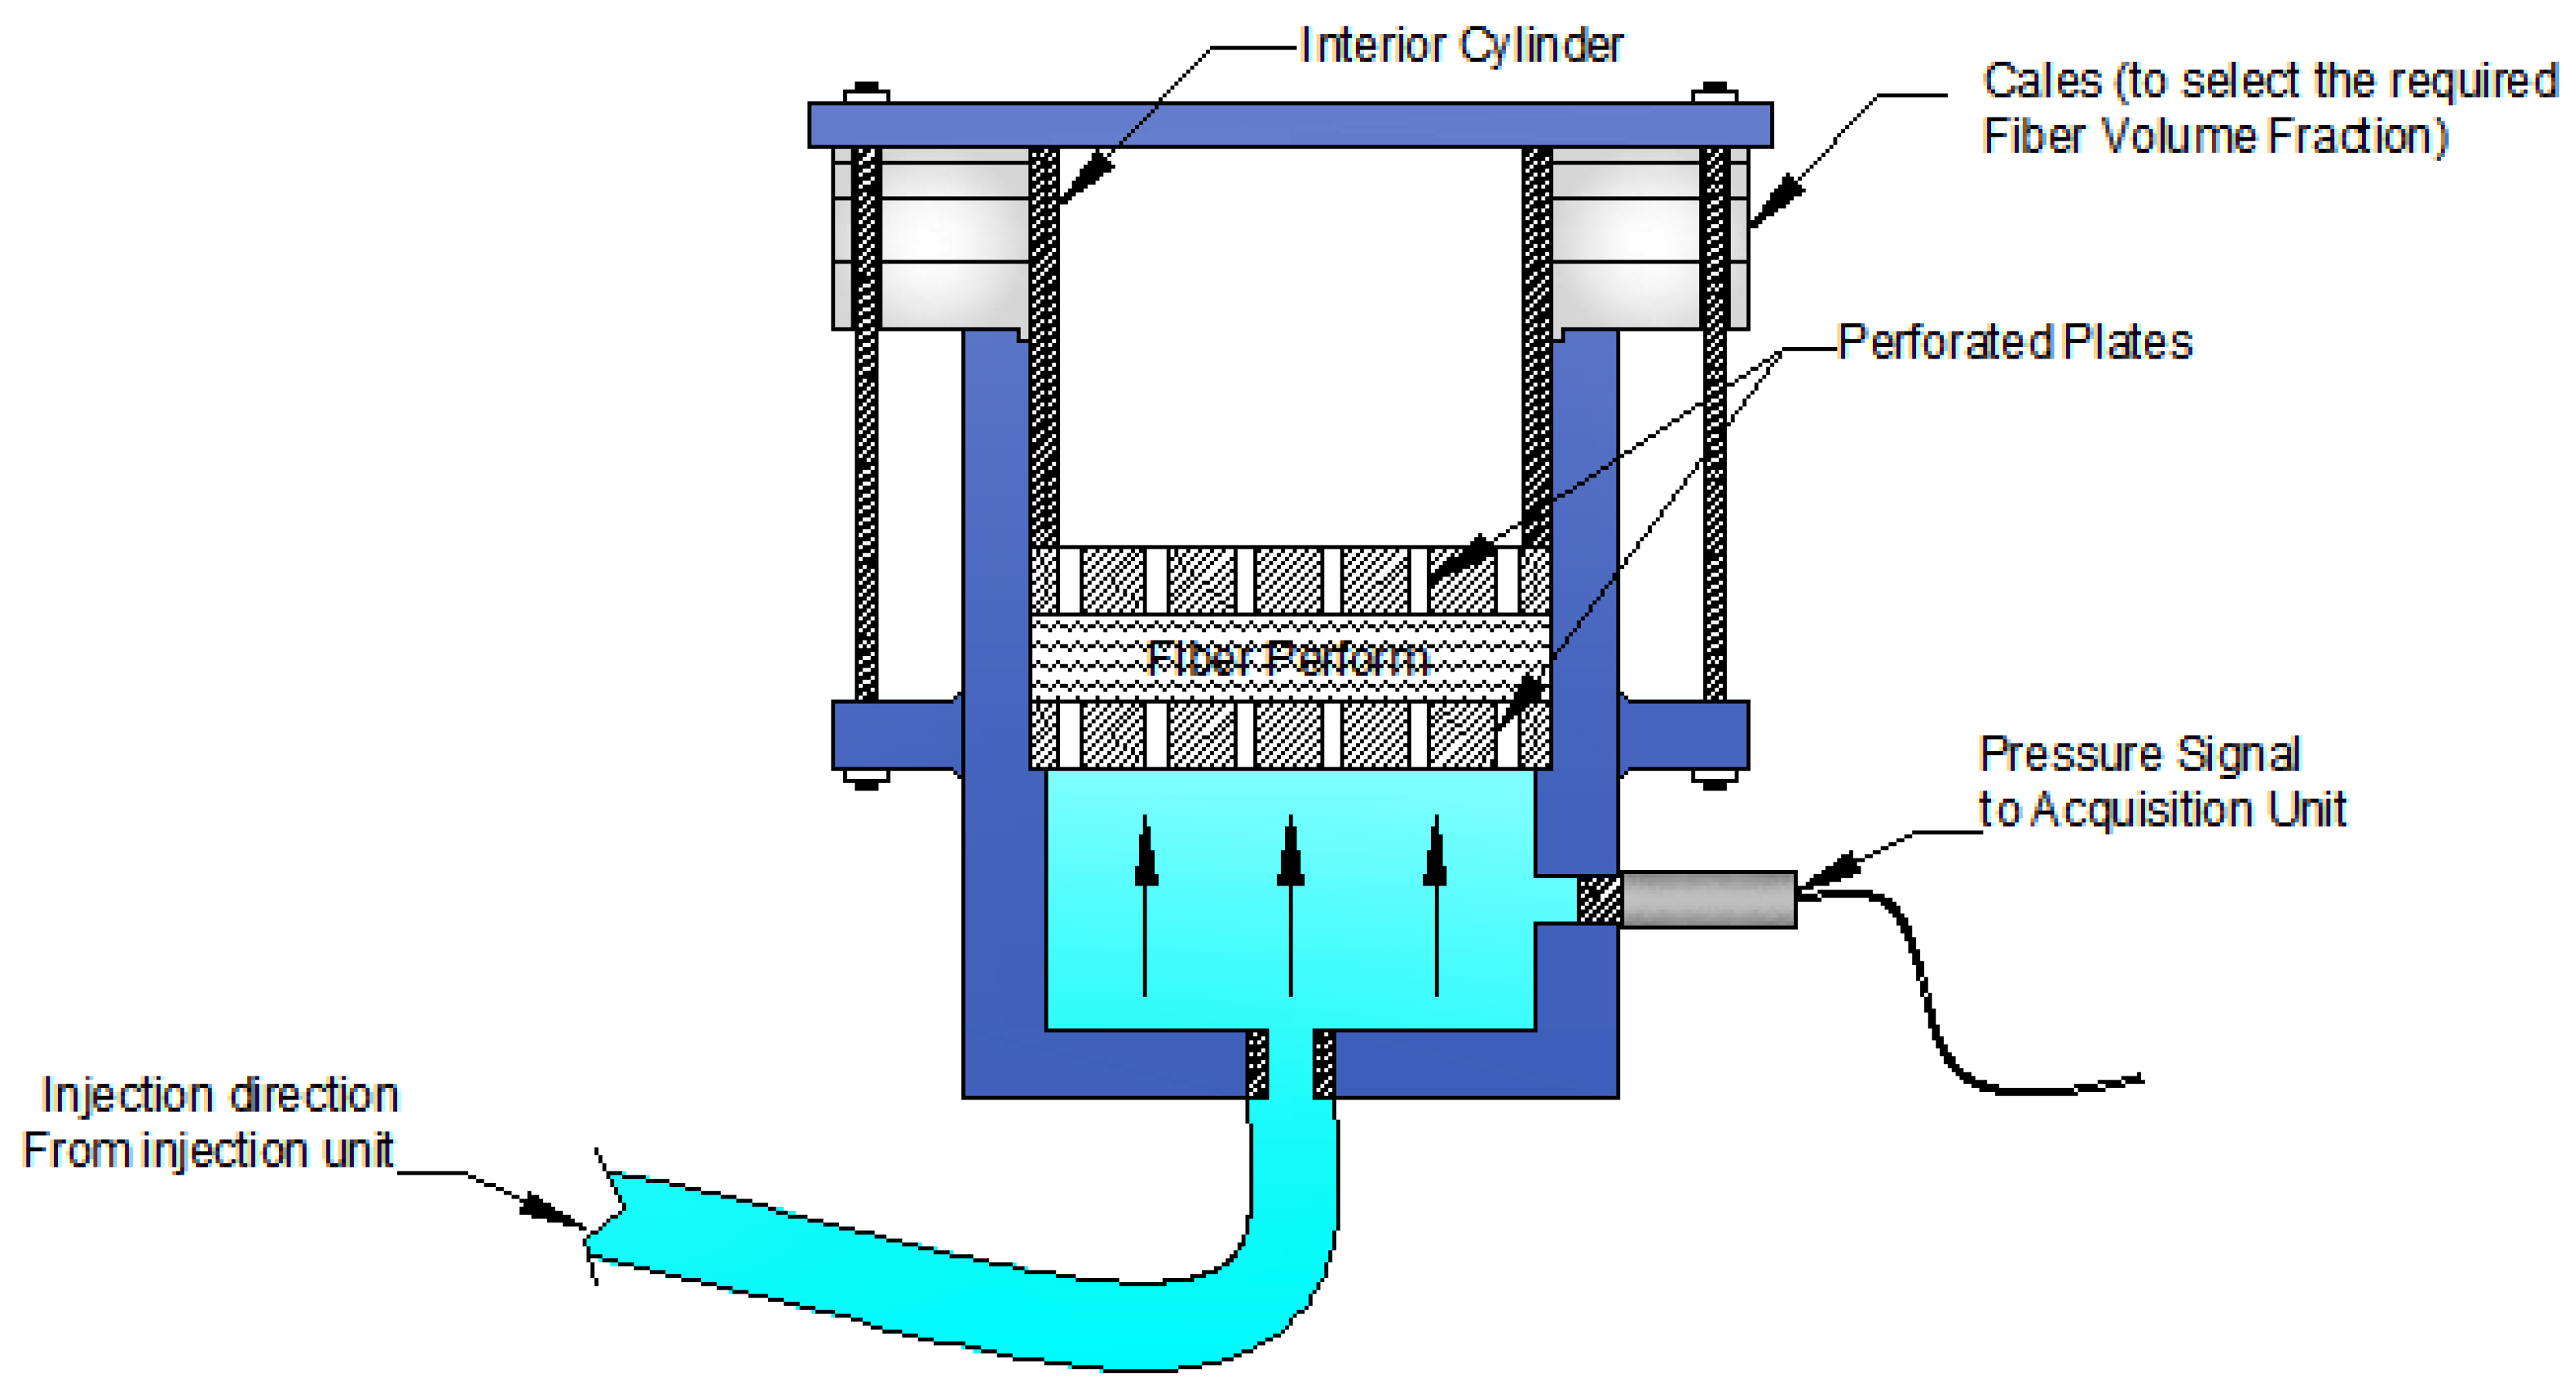
Figure 9.
NCF fabrics: TG15N and TG33N (a) 3D view (b) top view.
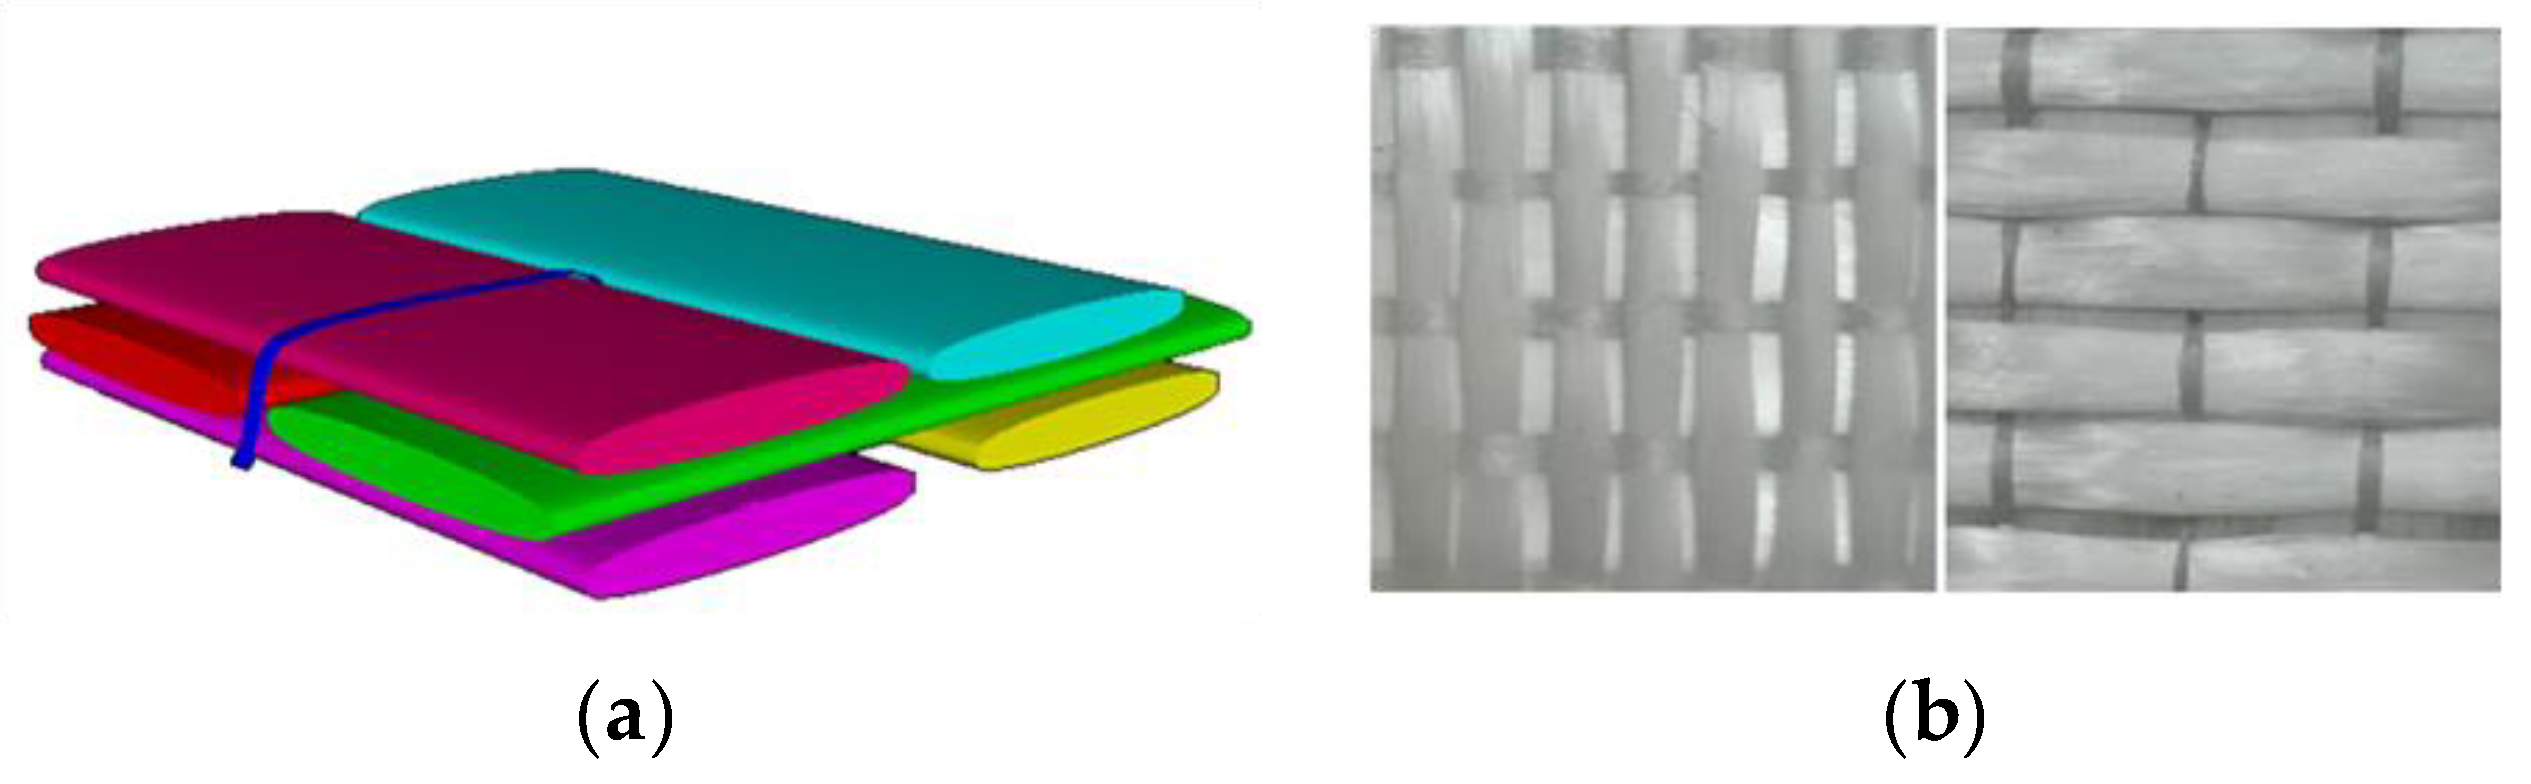
Figure 10.
3D orthogonal fabrics: TG54N, TG75N and TG96N (a) 3D view (b) top view.
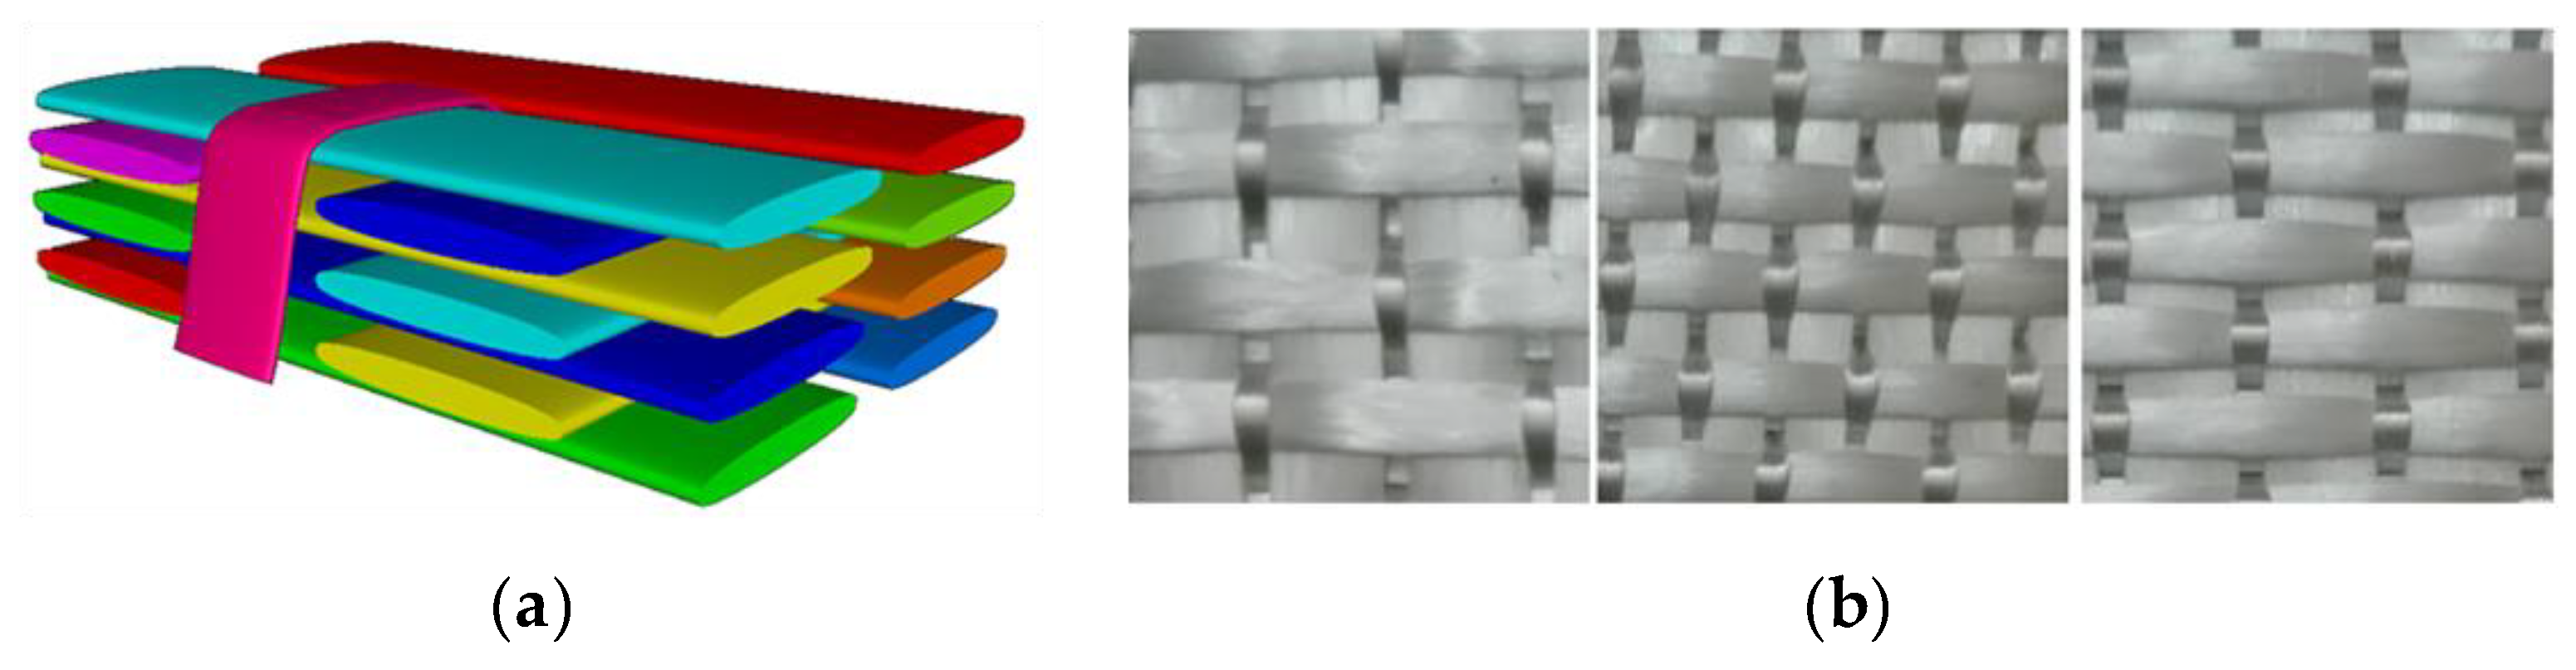
Figure 11.
Methodology of modeling [9].
Figure 11.
Methodology of modeling [9].
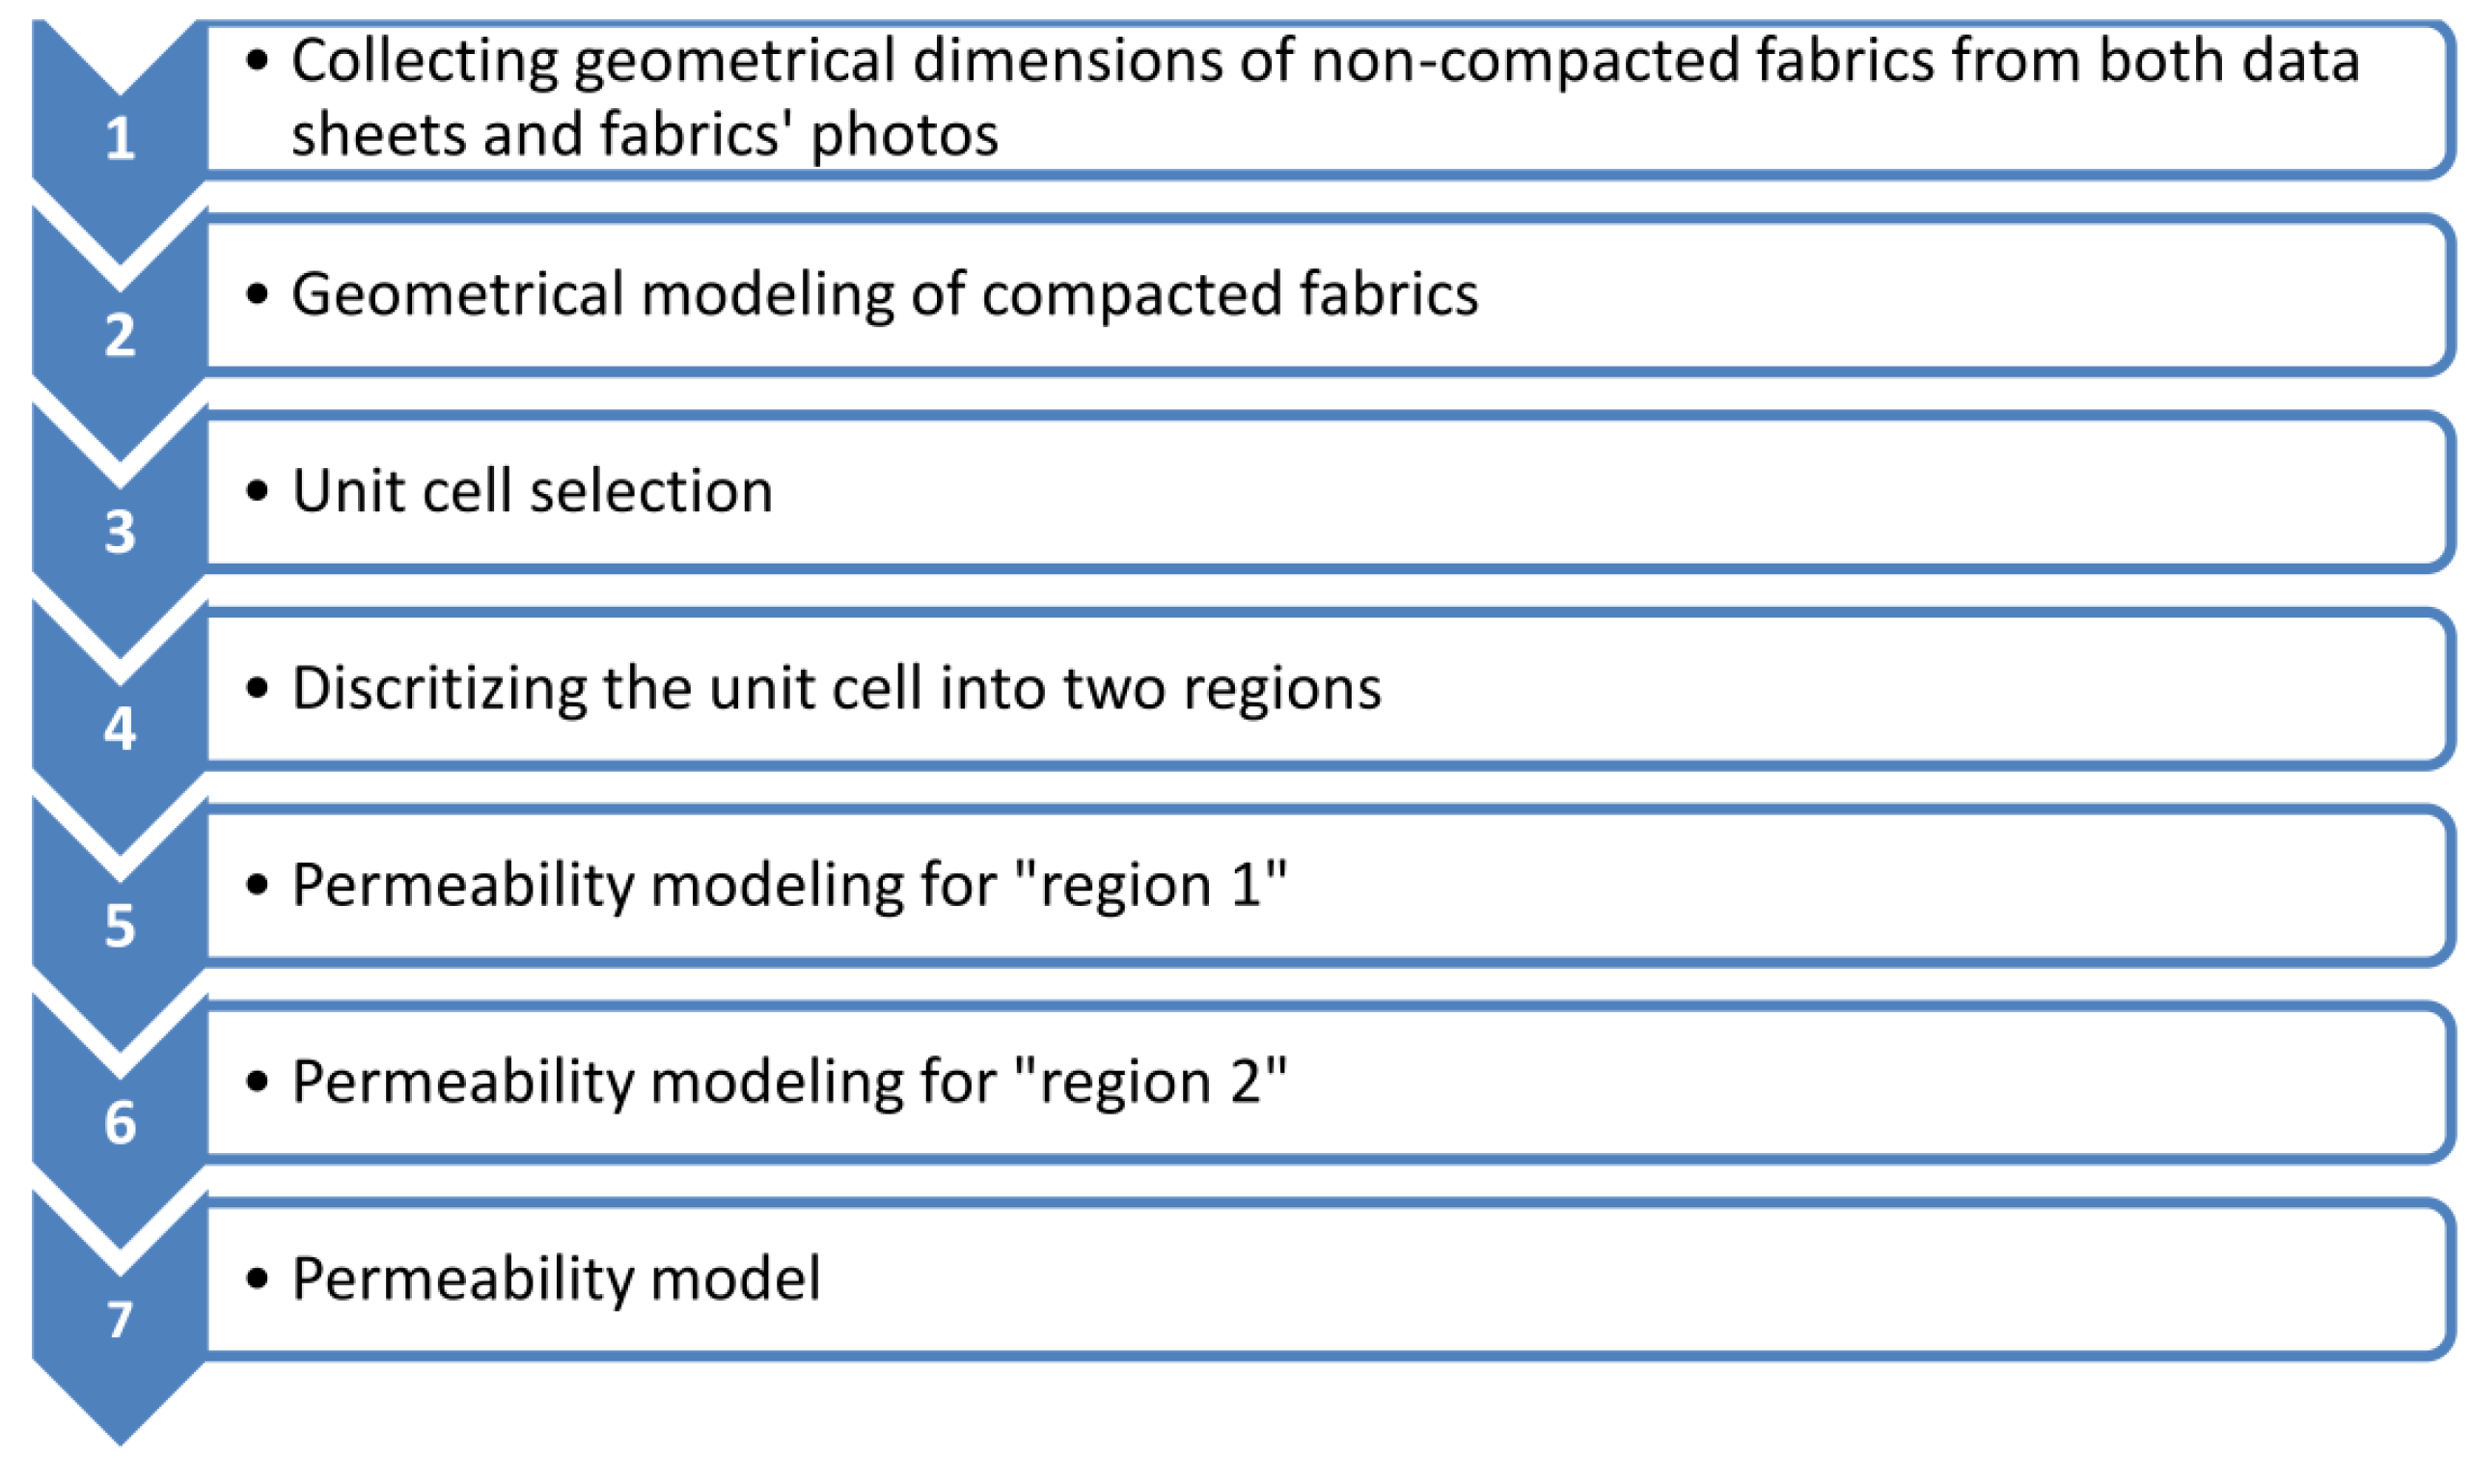
Figure 12.
Top view and 2D cross section (Left to right: Fontainebleau (FO), Berea (BE), and Sumatra (SU)).
Figure 12.
Top view and 2D cross section (Left to right: Fontainebleau (FO), Berea (BE), and Sumatra (SU)).
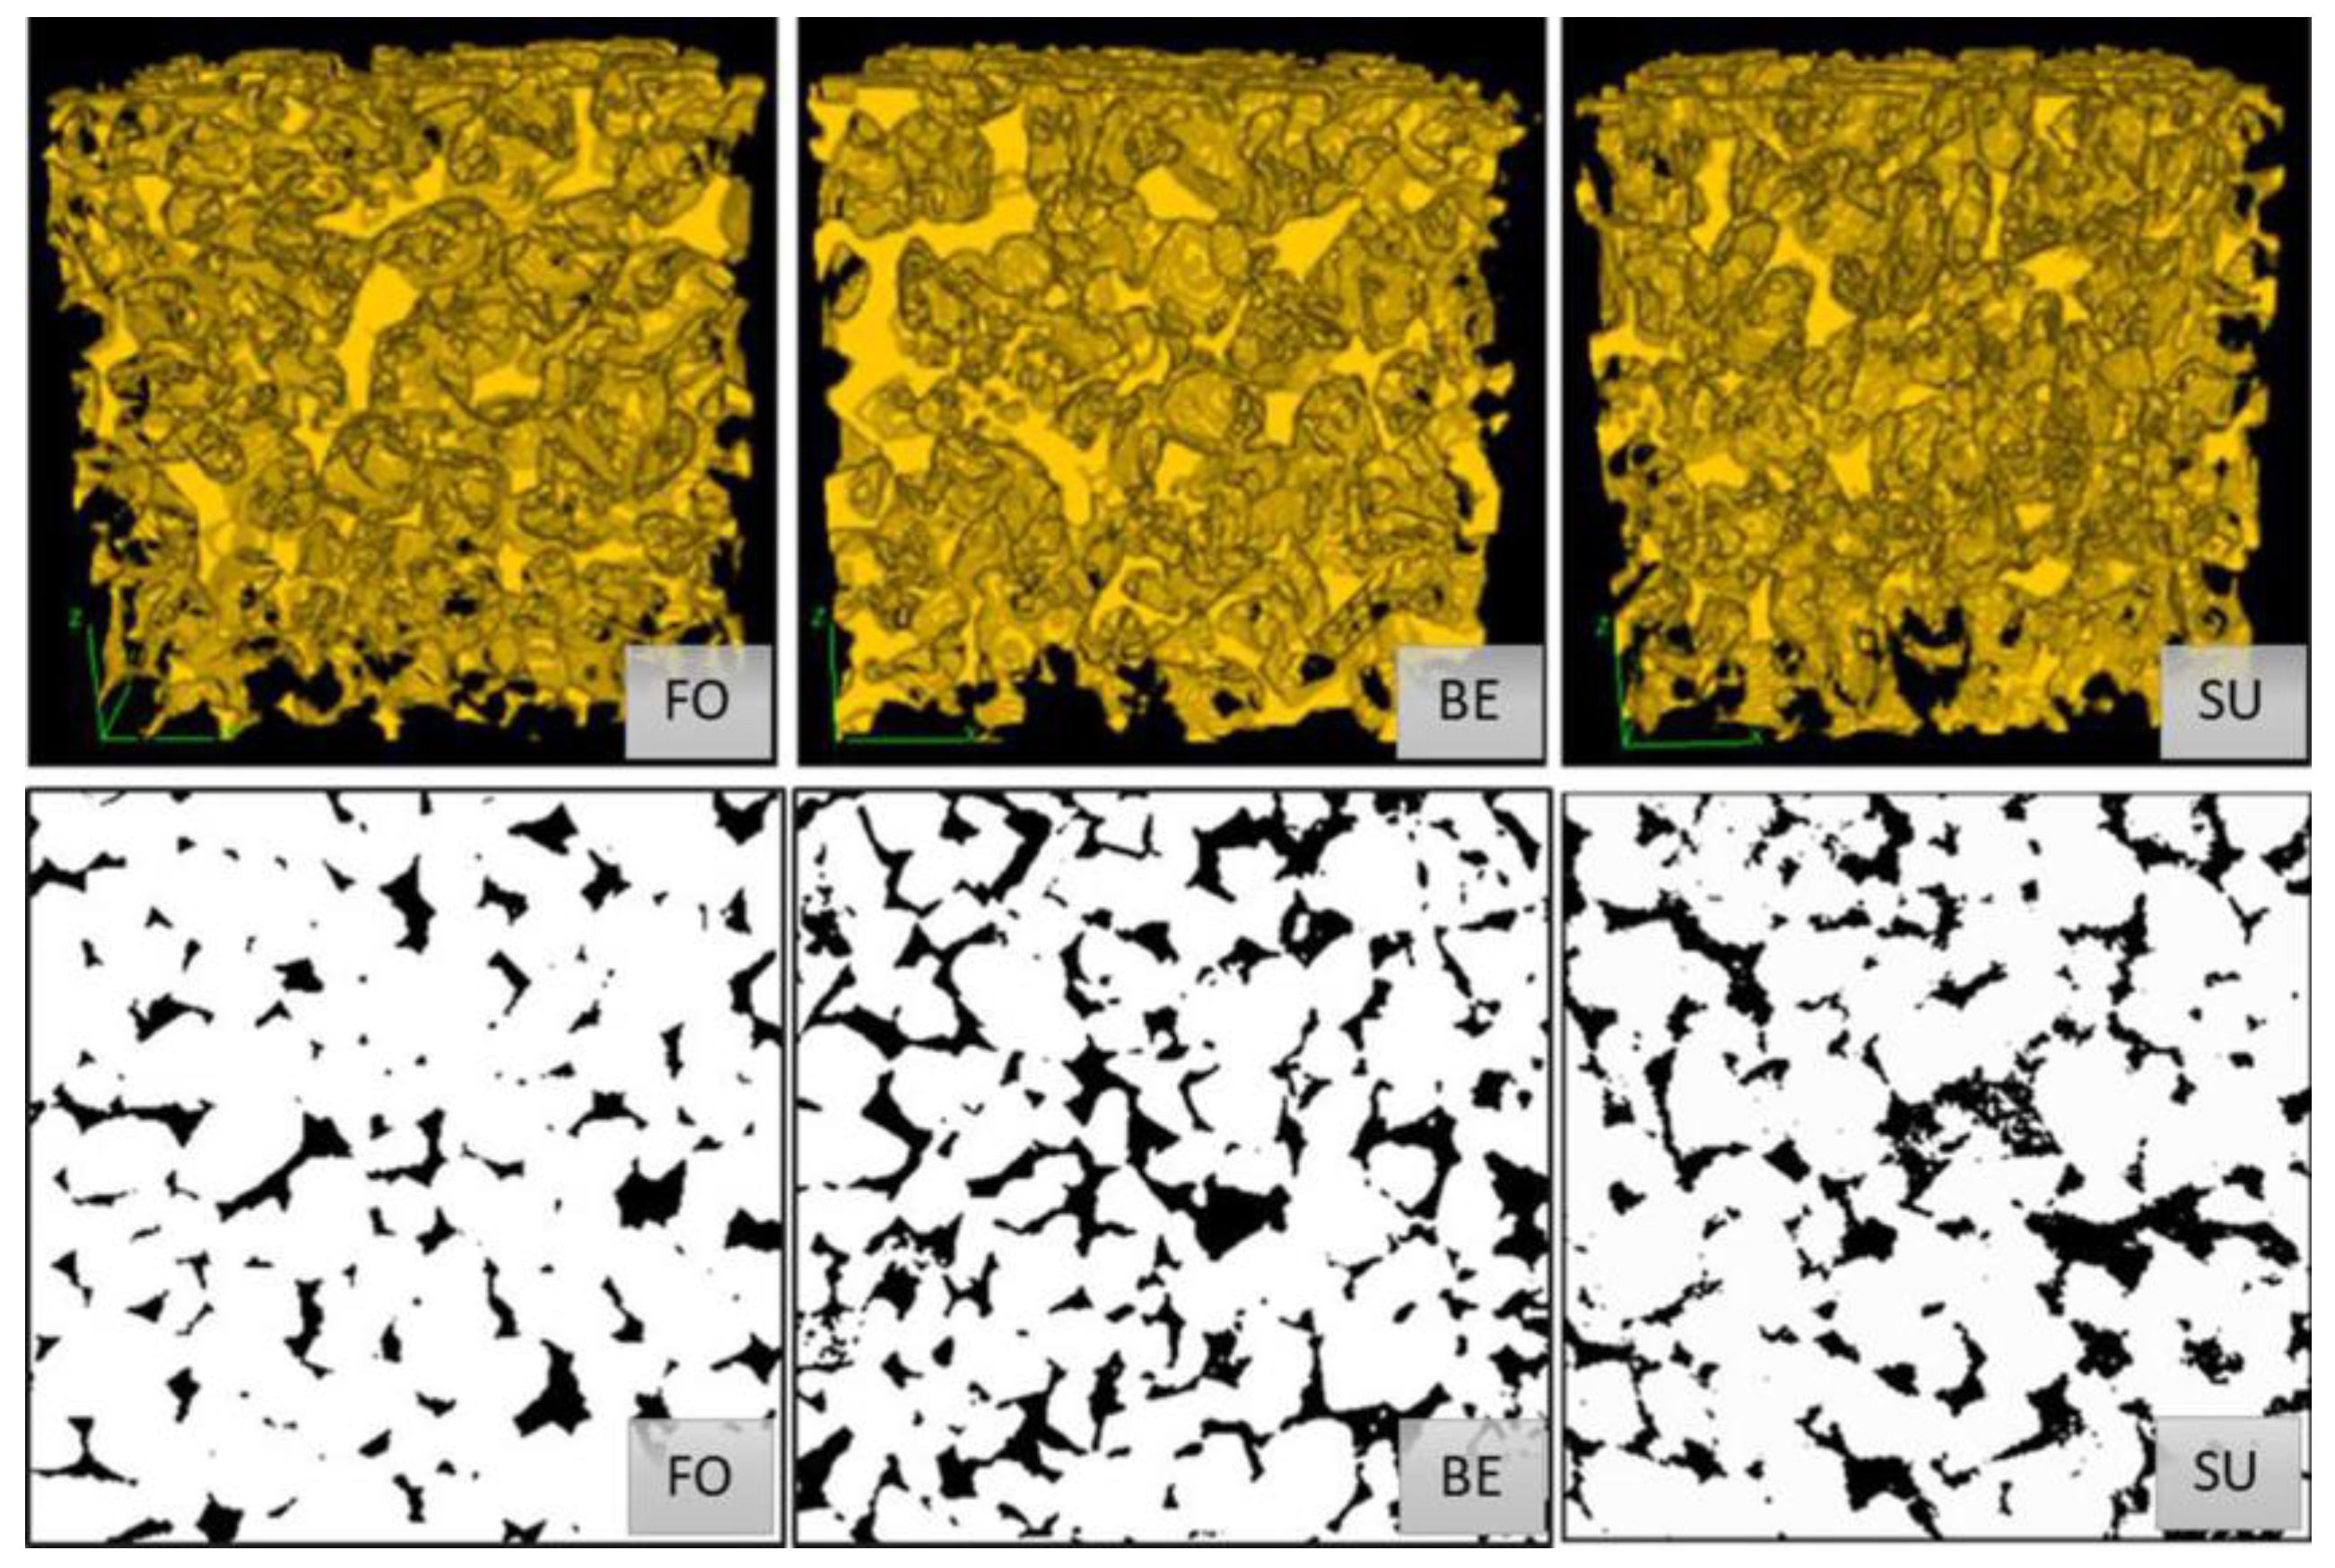
Figure 13.
Typical packing configurations for elliptical tows comprising the microstructure of fibrous porous media in liquid composite molding applications.
Figure 13.
Typical packing configurations for elliptical tows comprising the microstructure of fibrous porous media in liquid composite molding applications.
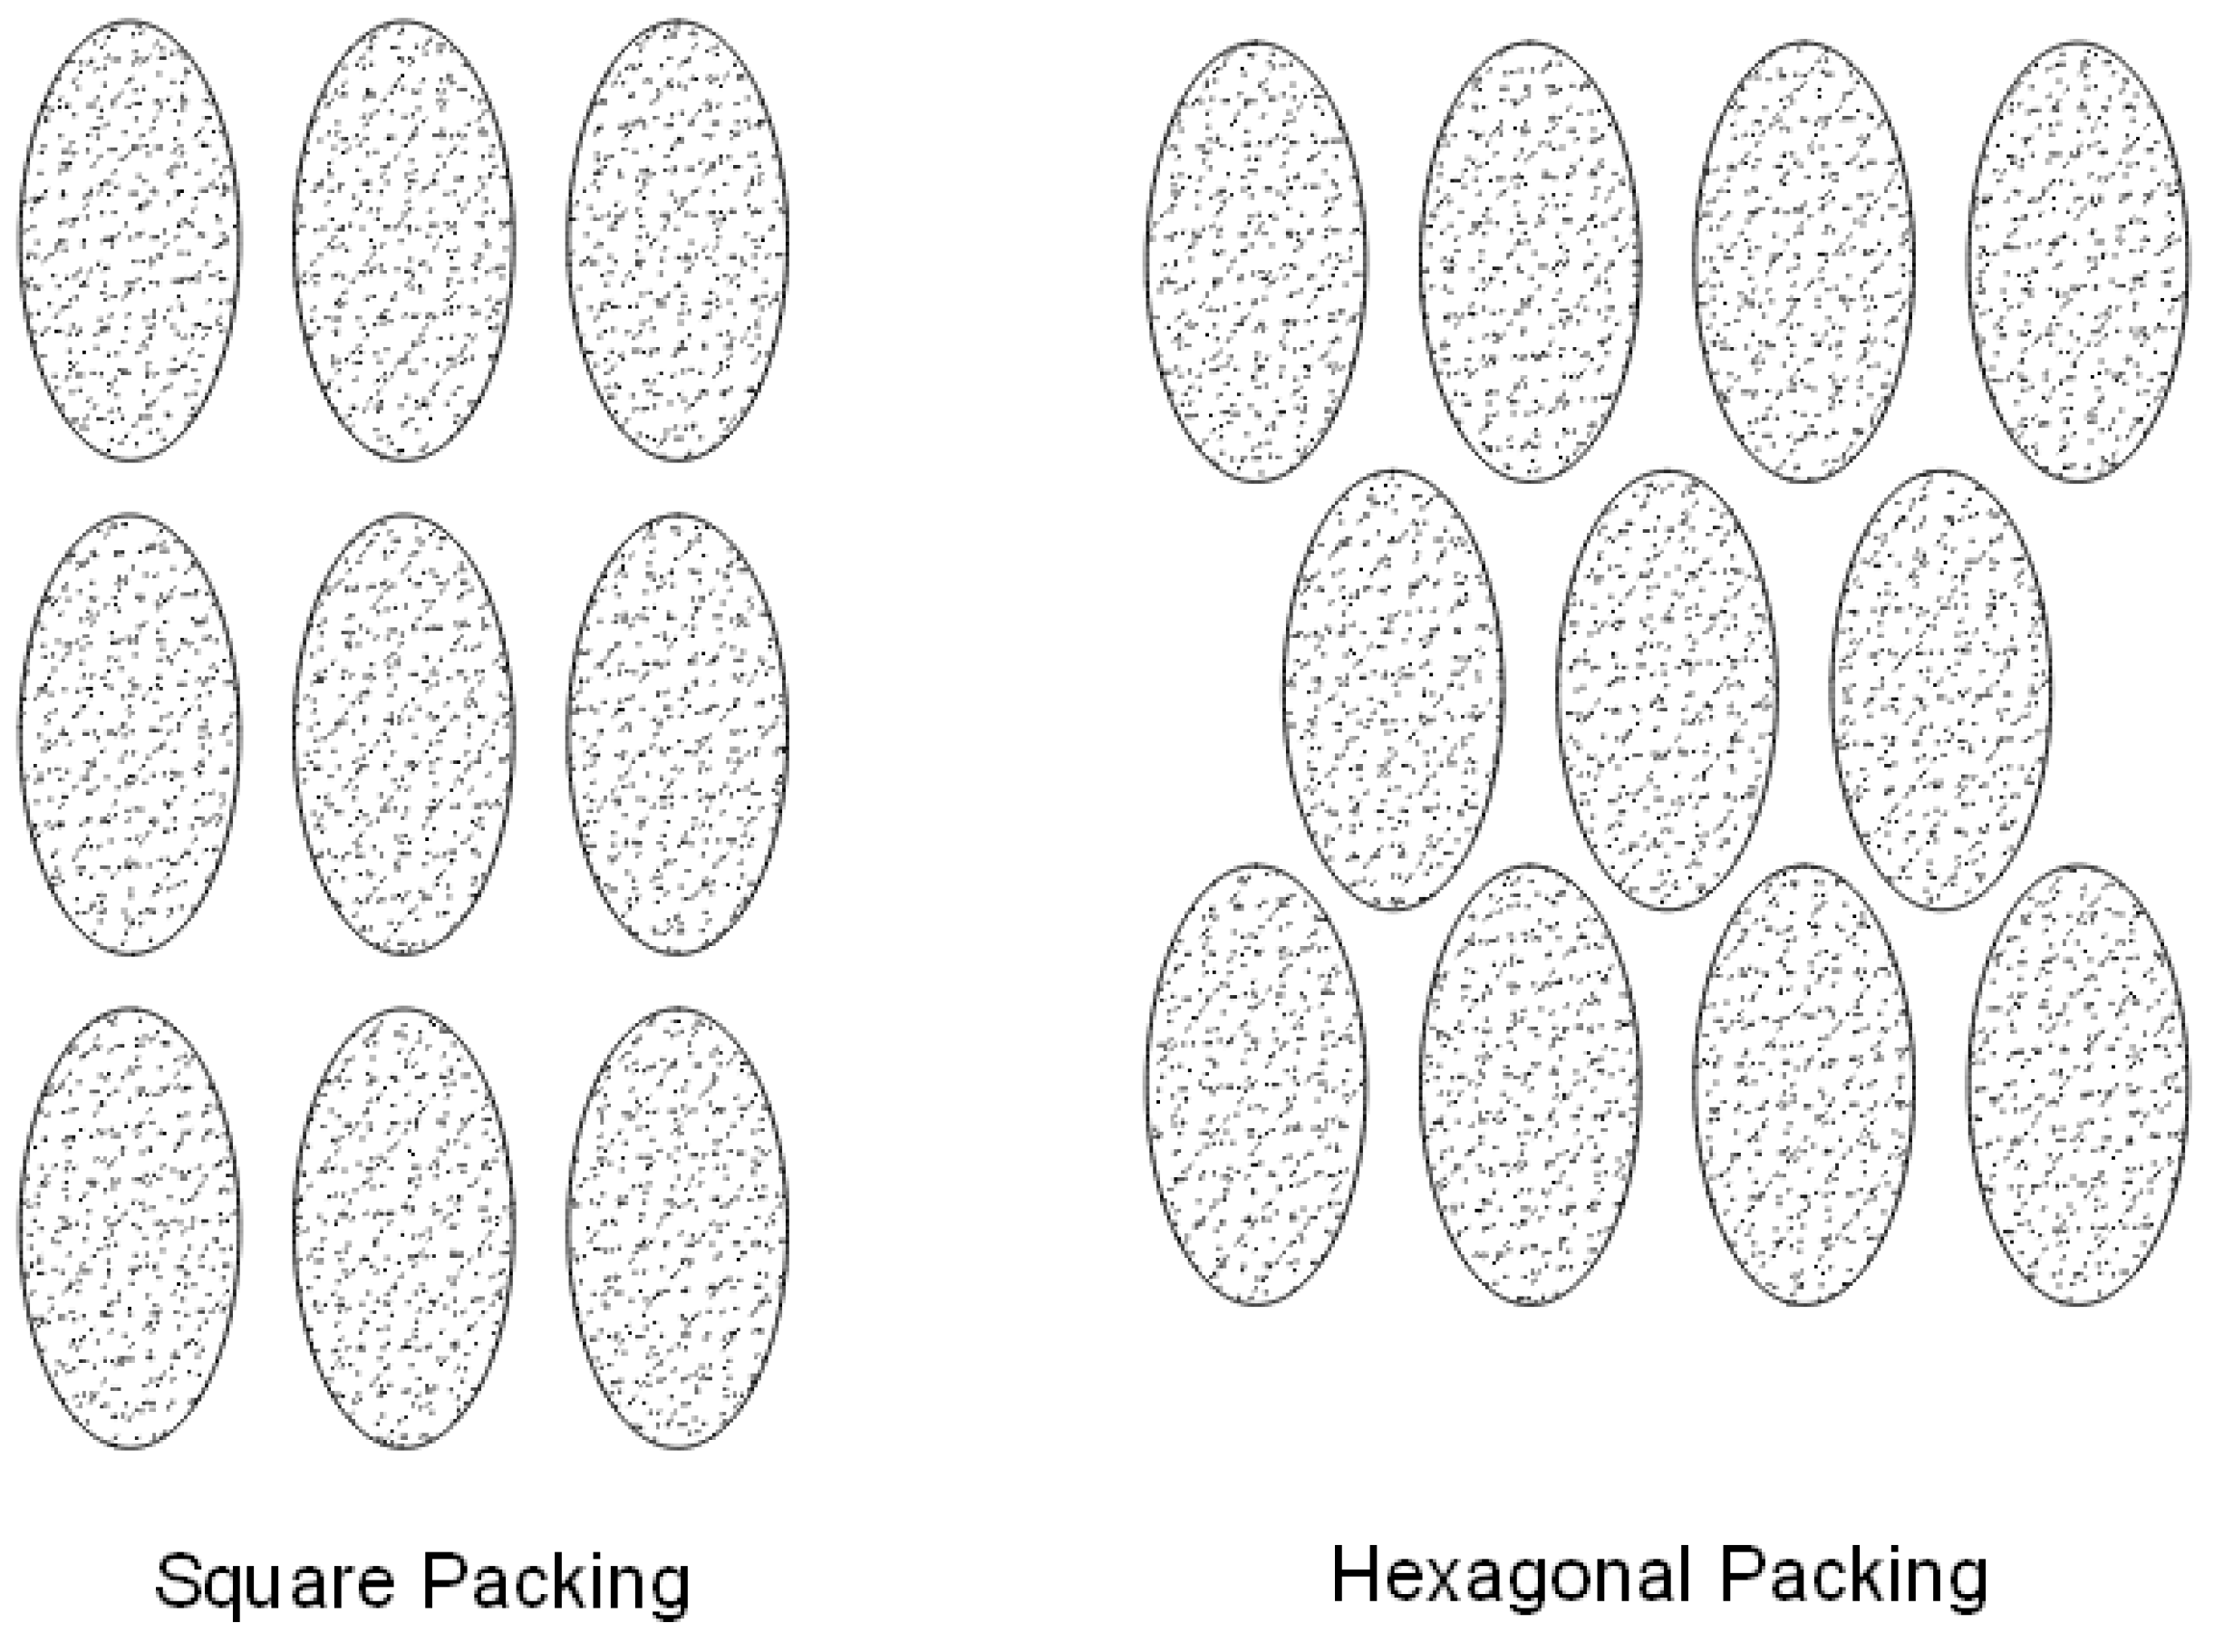
Figure 14.
Different scales and corresponding mathematical models.
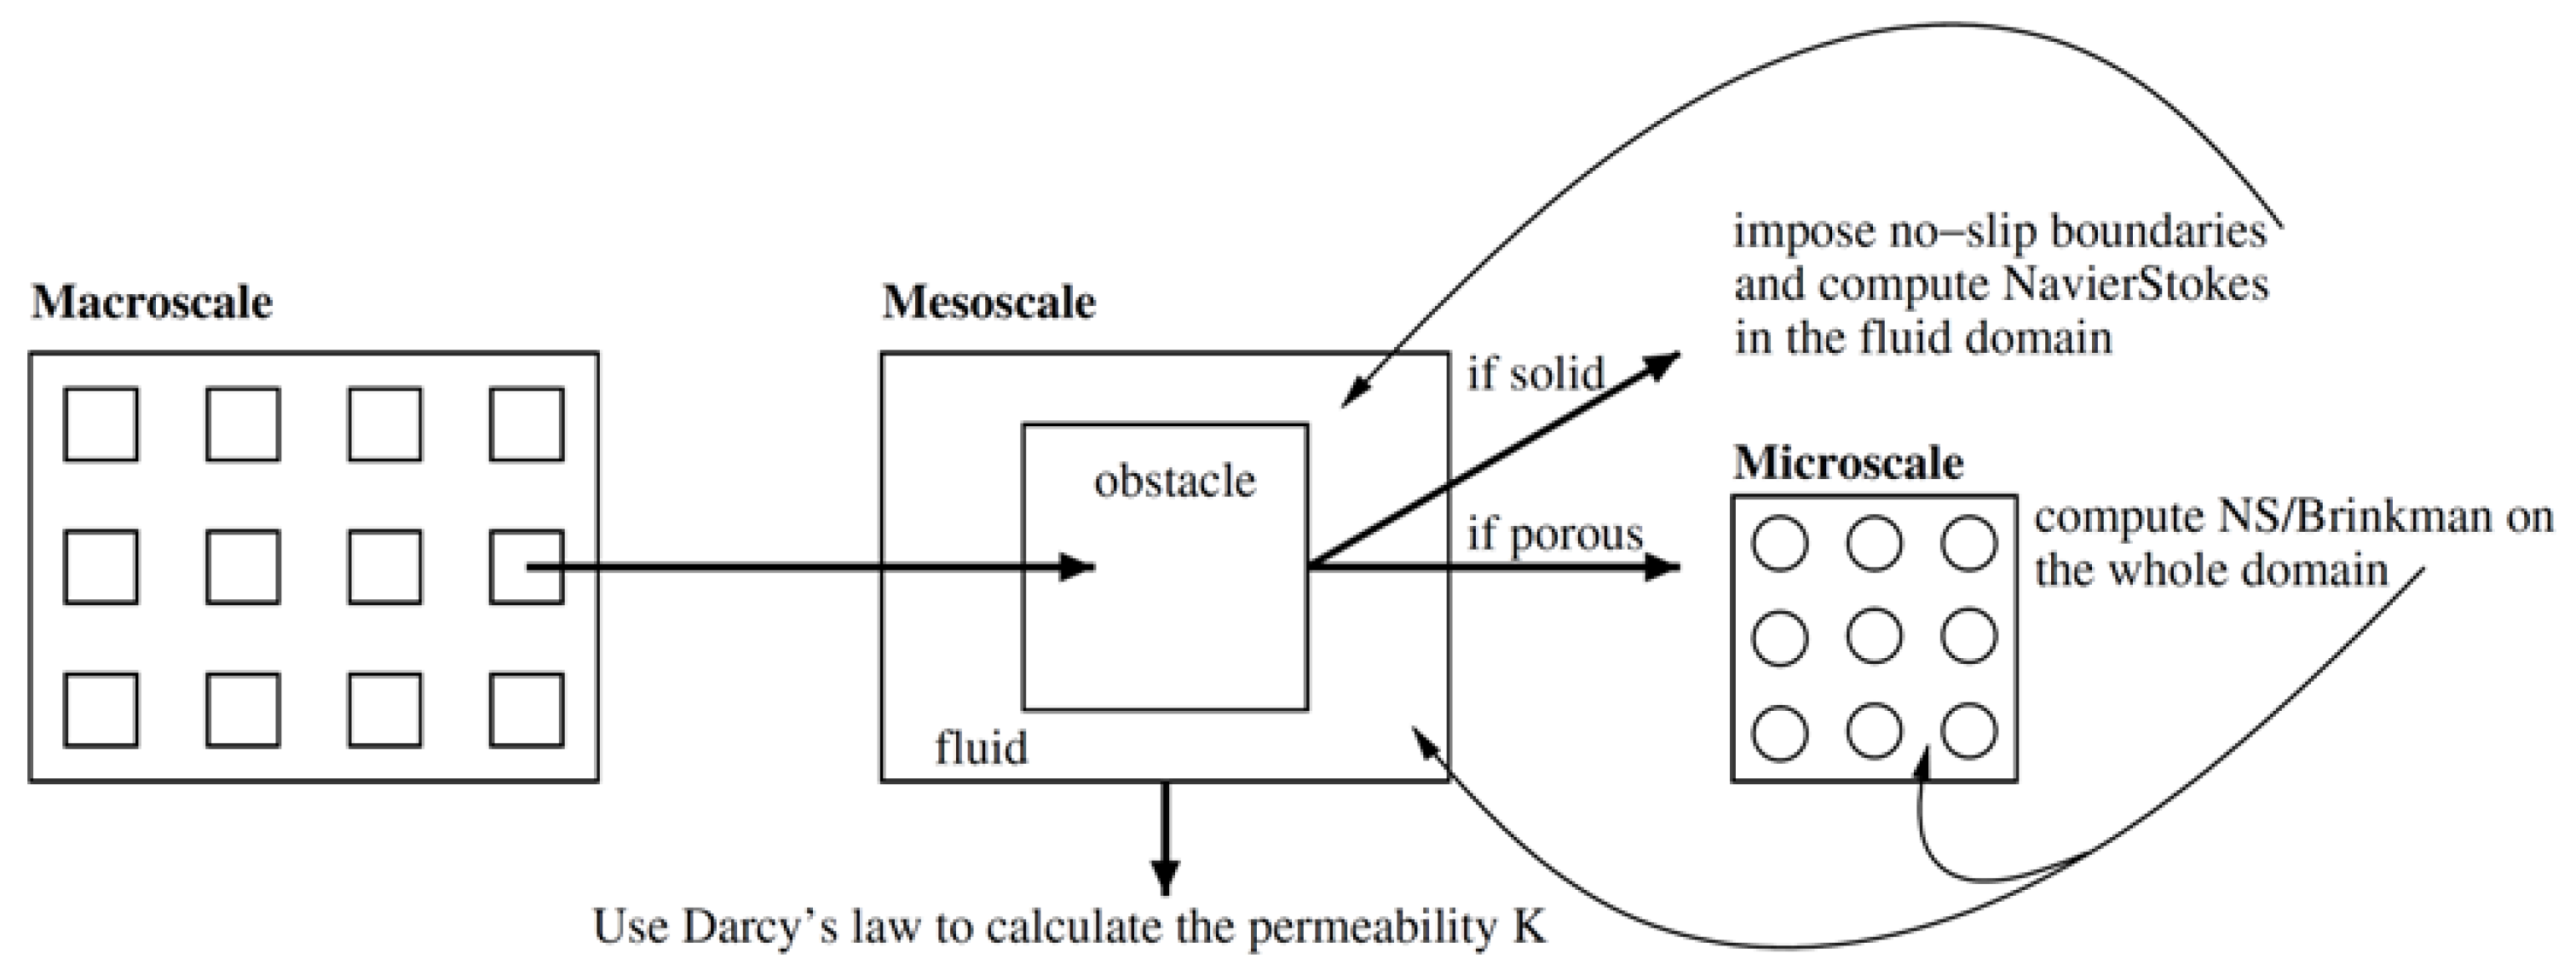
Figure 15.
Chart of Lattice-Boltzmann numerical procedure.
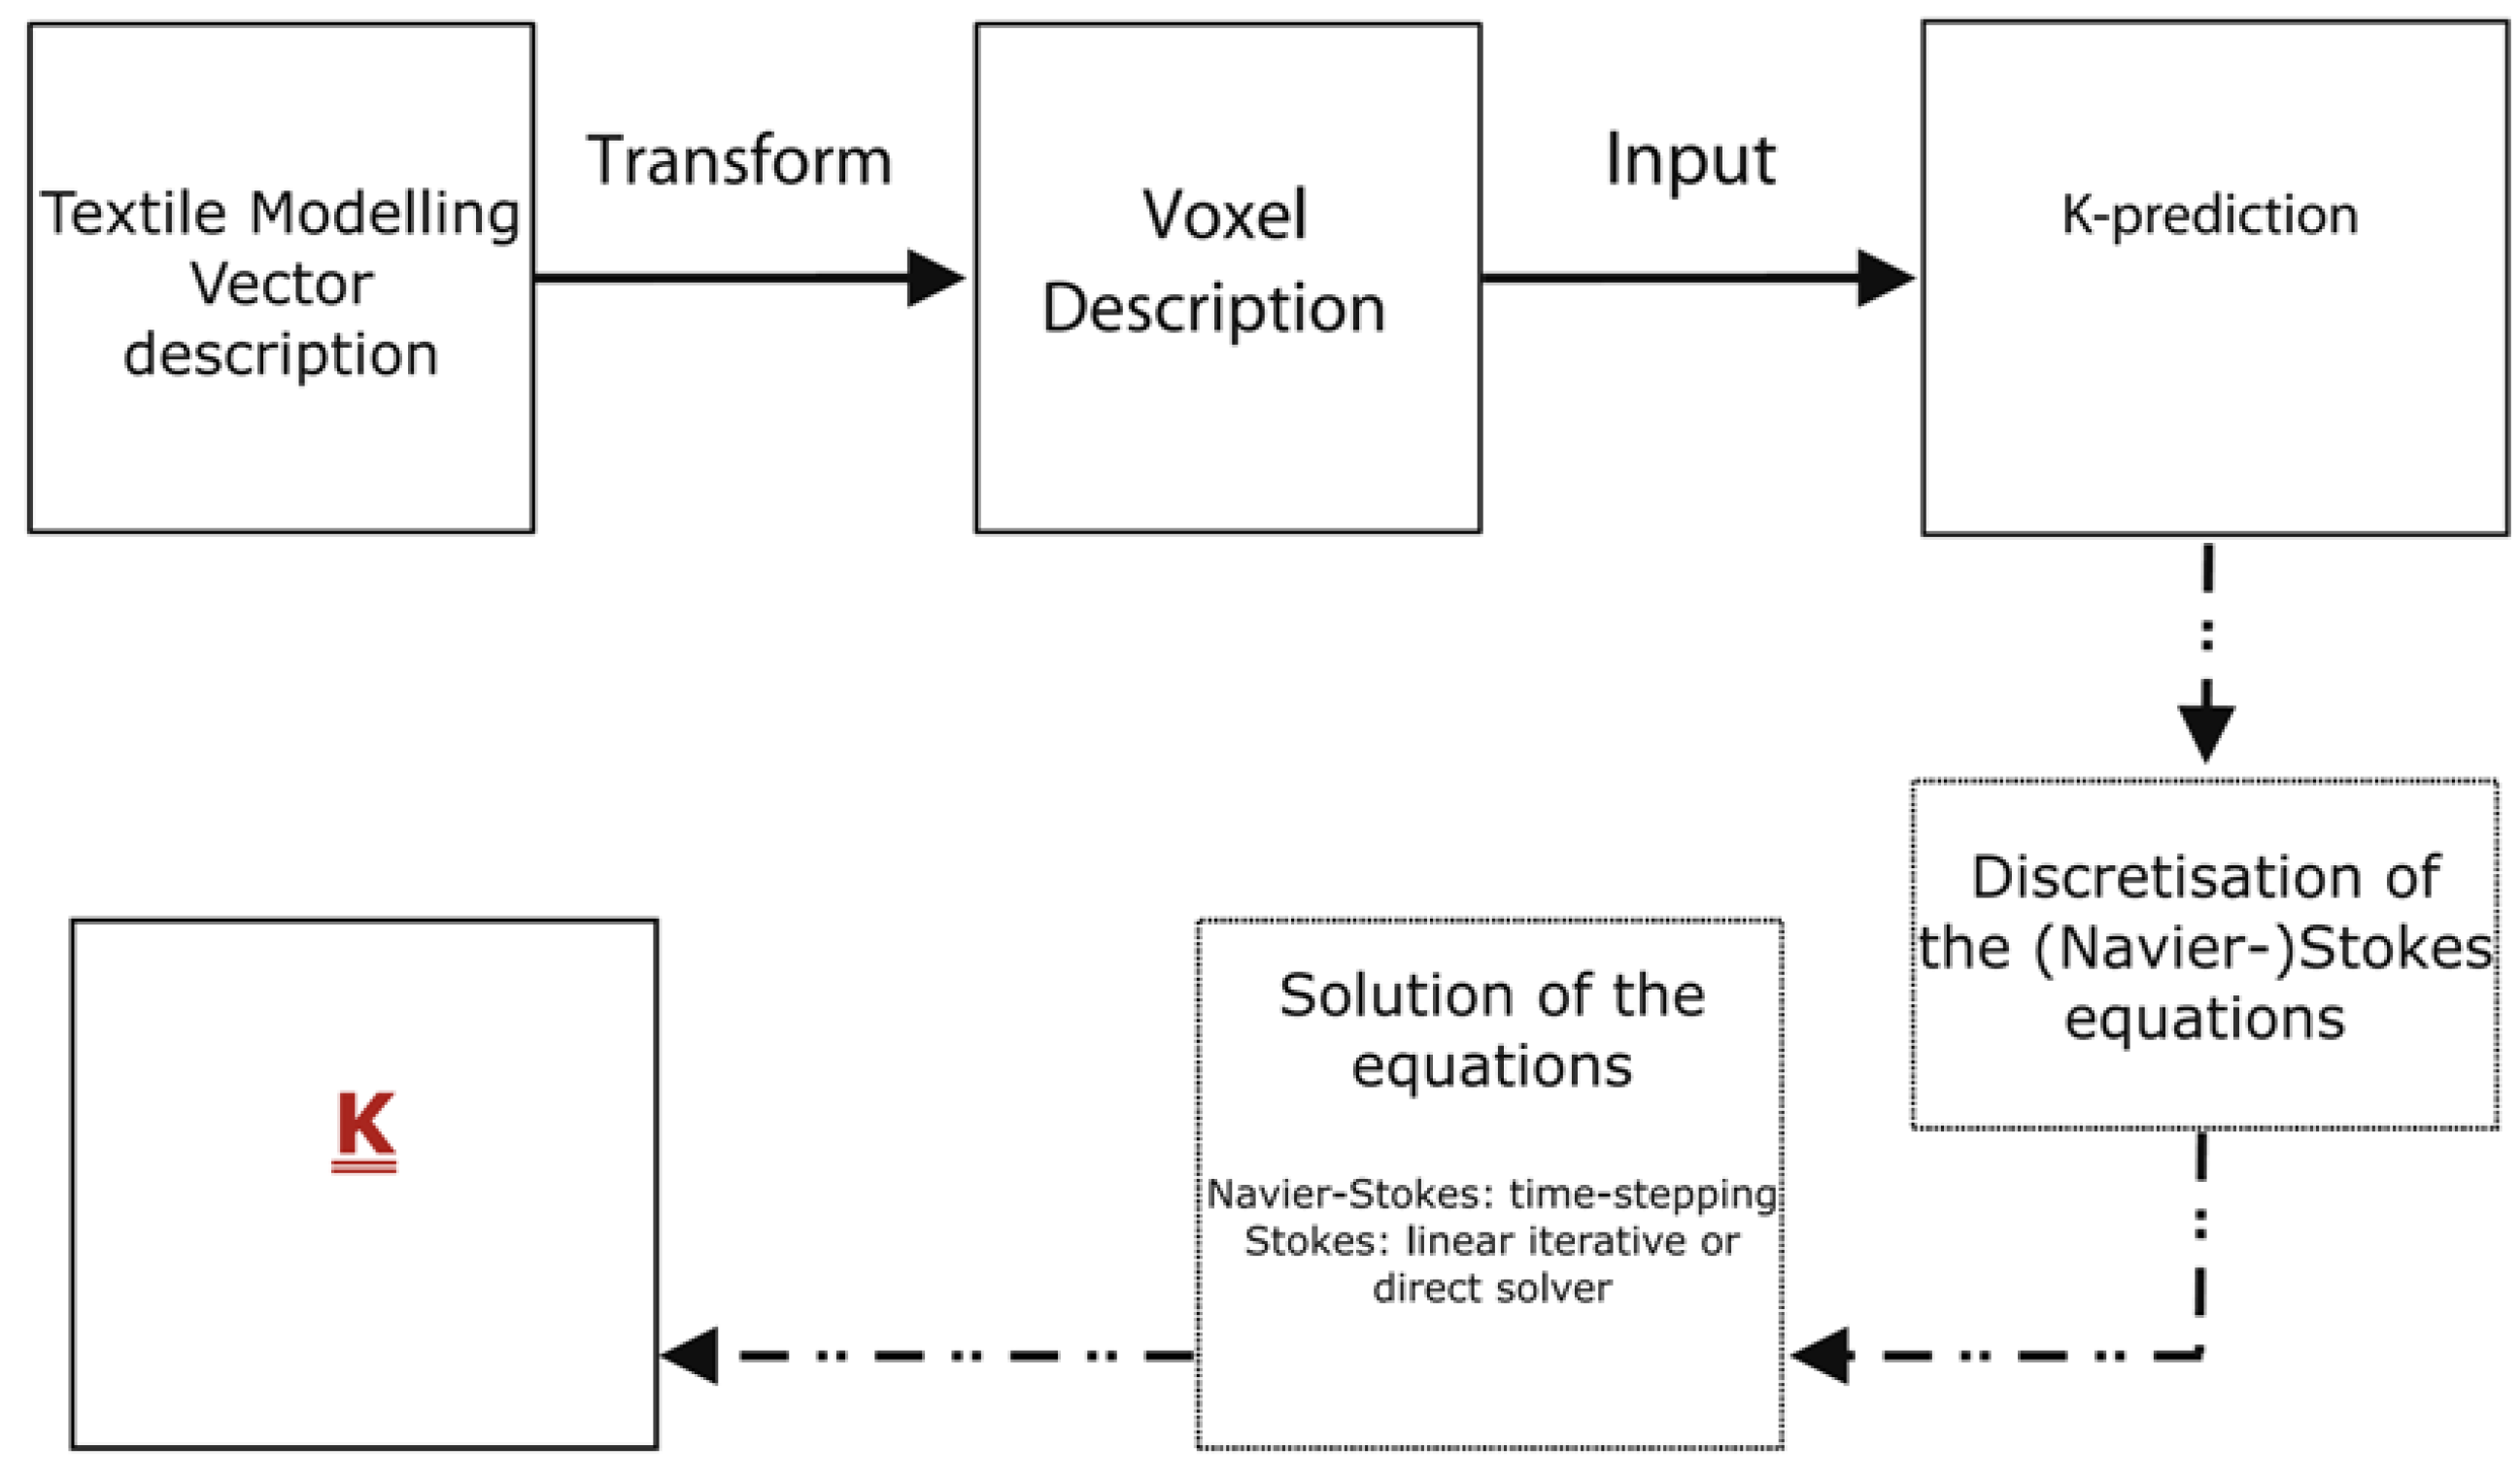
Figure 16.
Work flow.
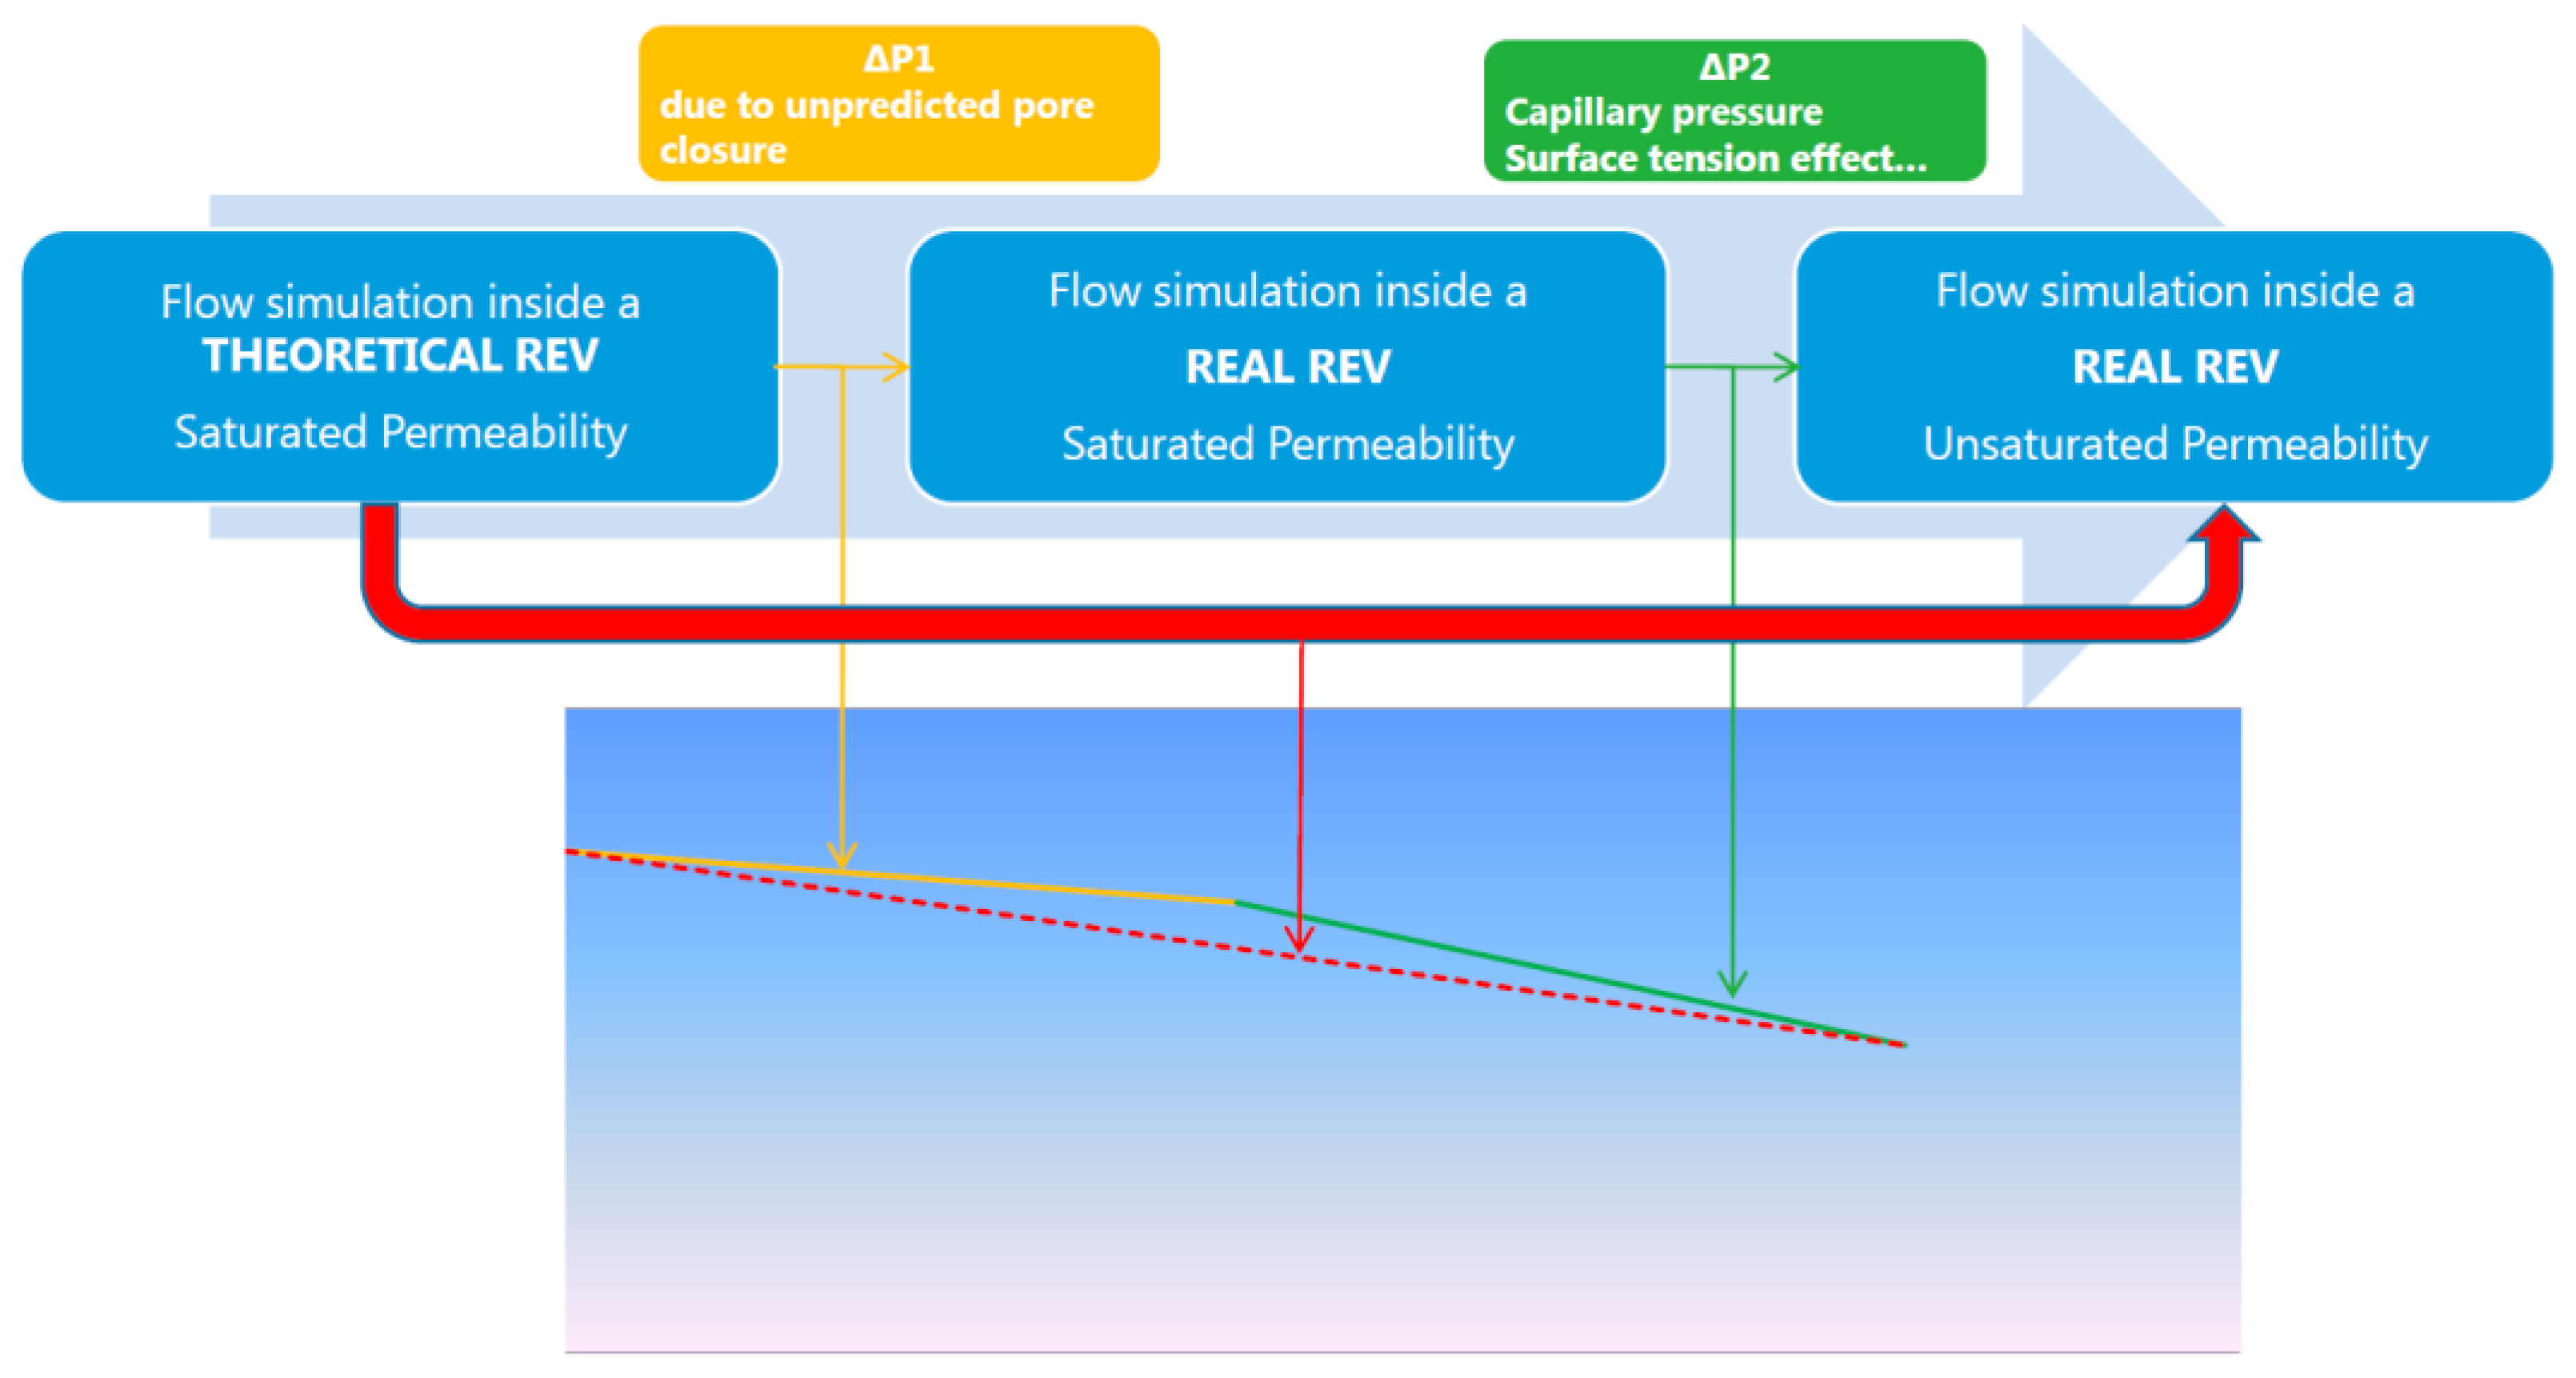
Figure 17.
Work flow schematic.

Figure 18.
Working flow chart.
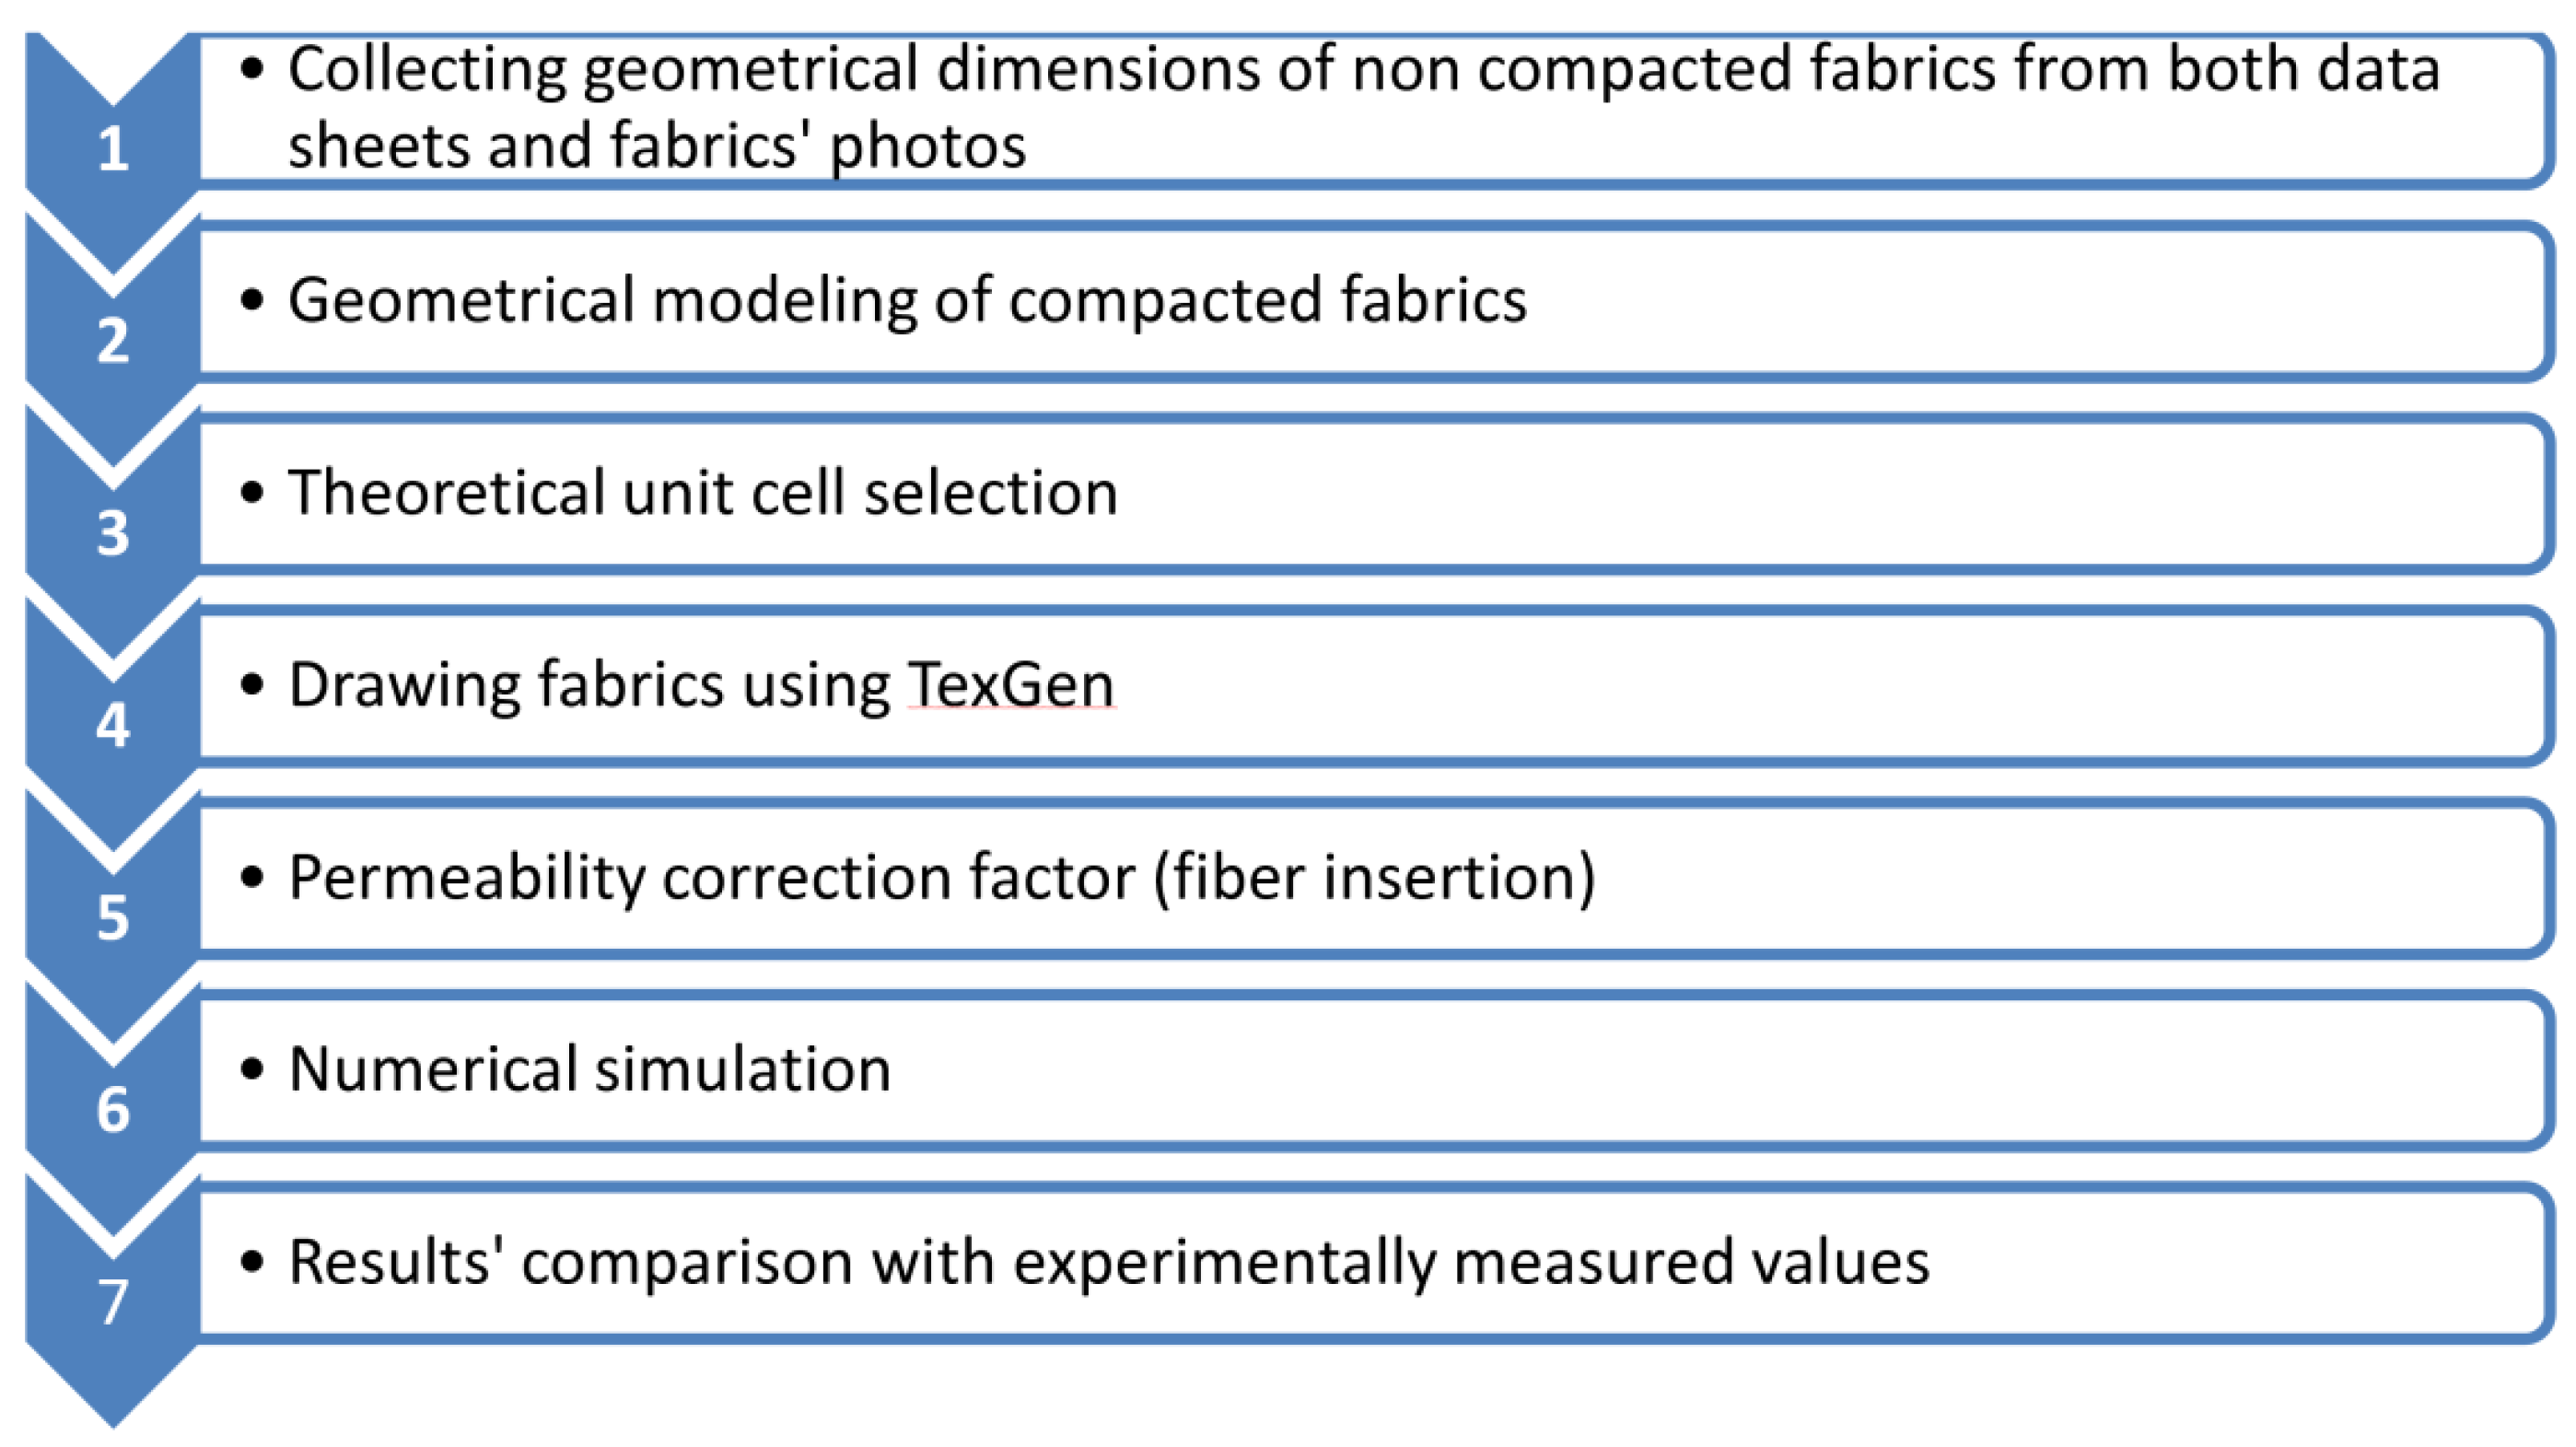
Figure 19.
Textiles dimensions.
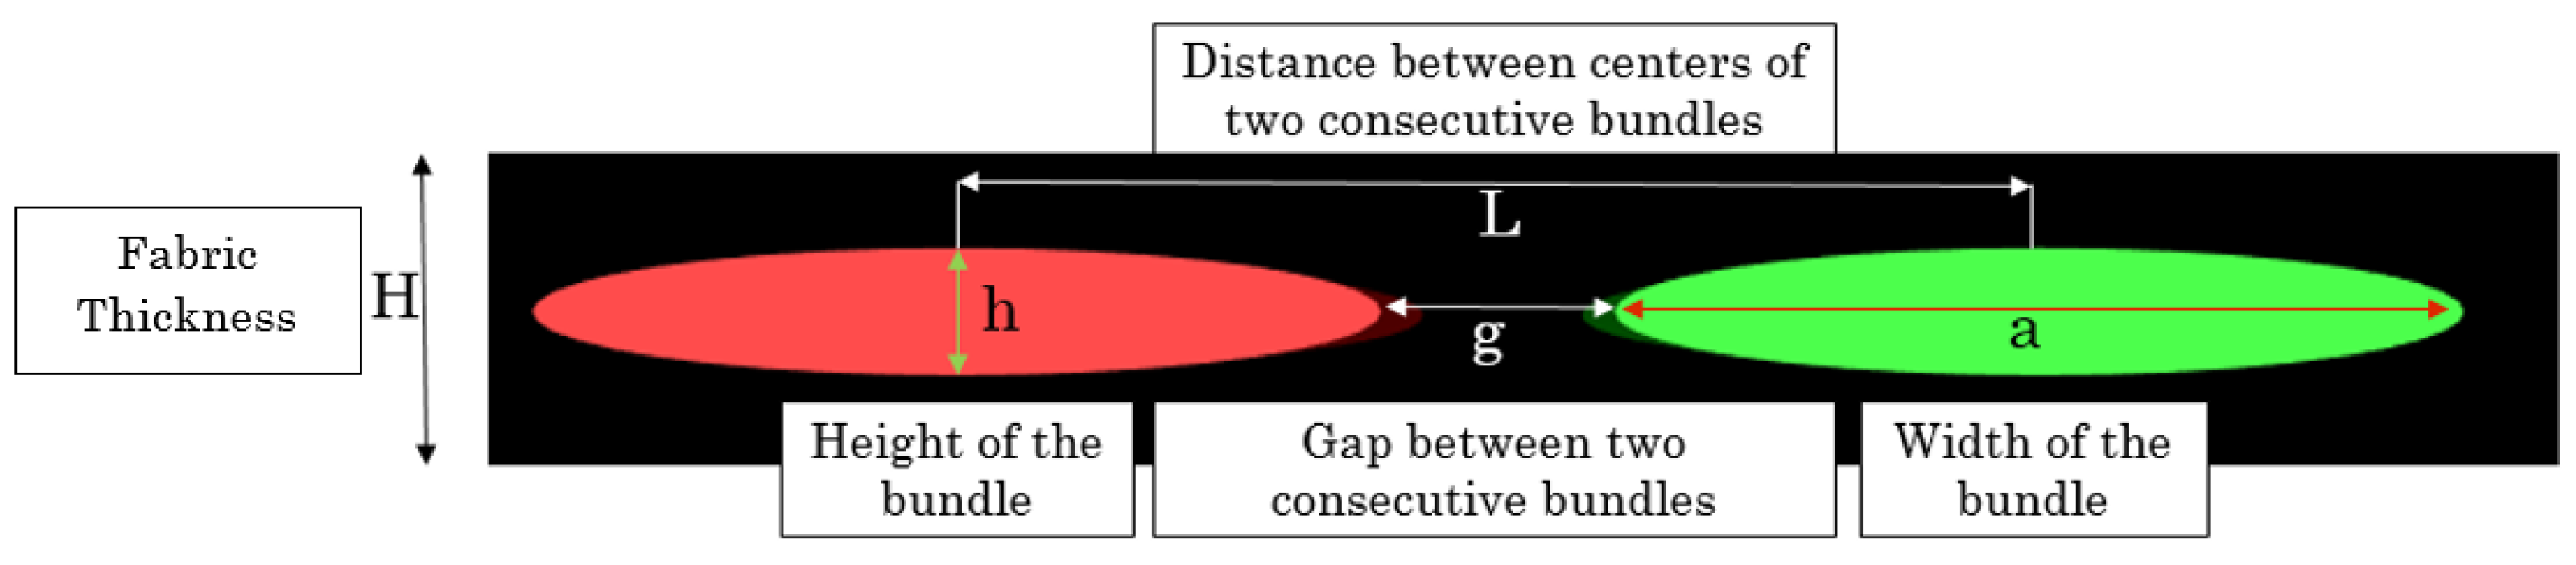
Figure 20.
Geometry of the TG-15-N textile from Texonic.
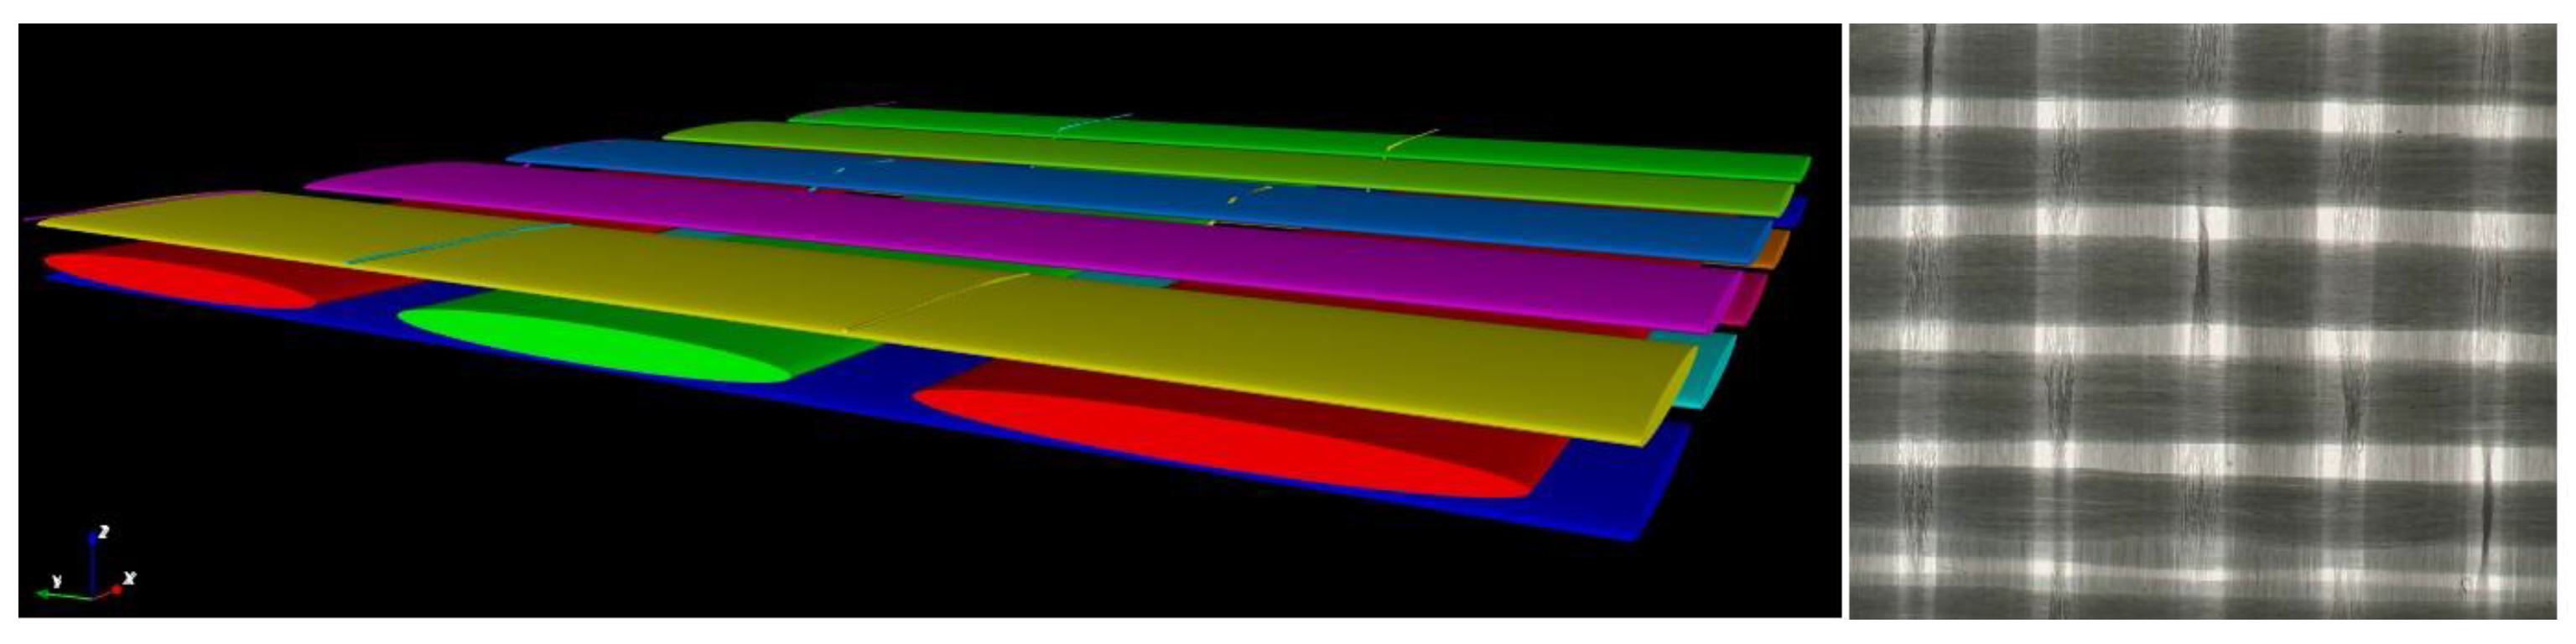
Figure 21.
Unit Cell of TG-15-N at Vf = 0.4063.
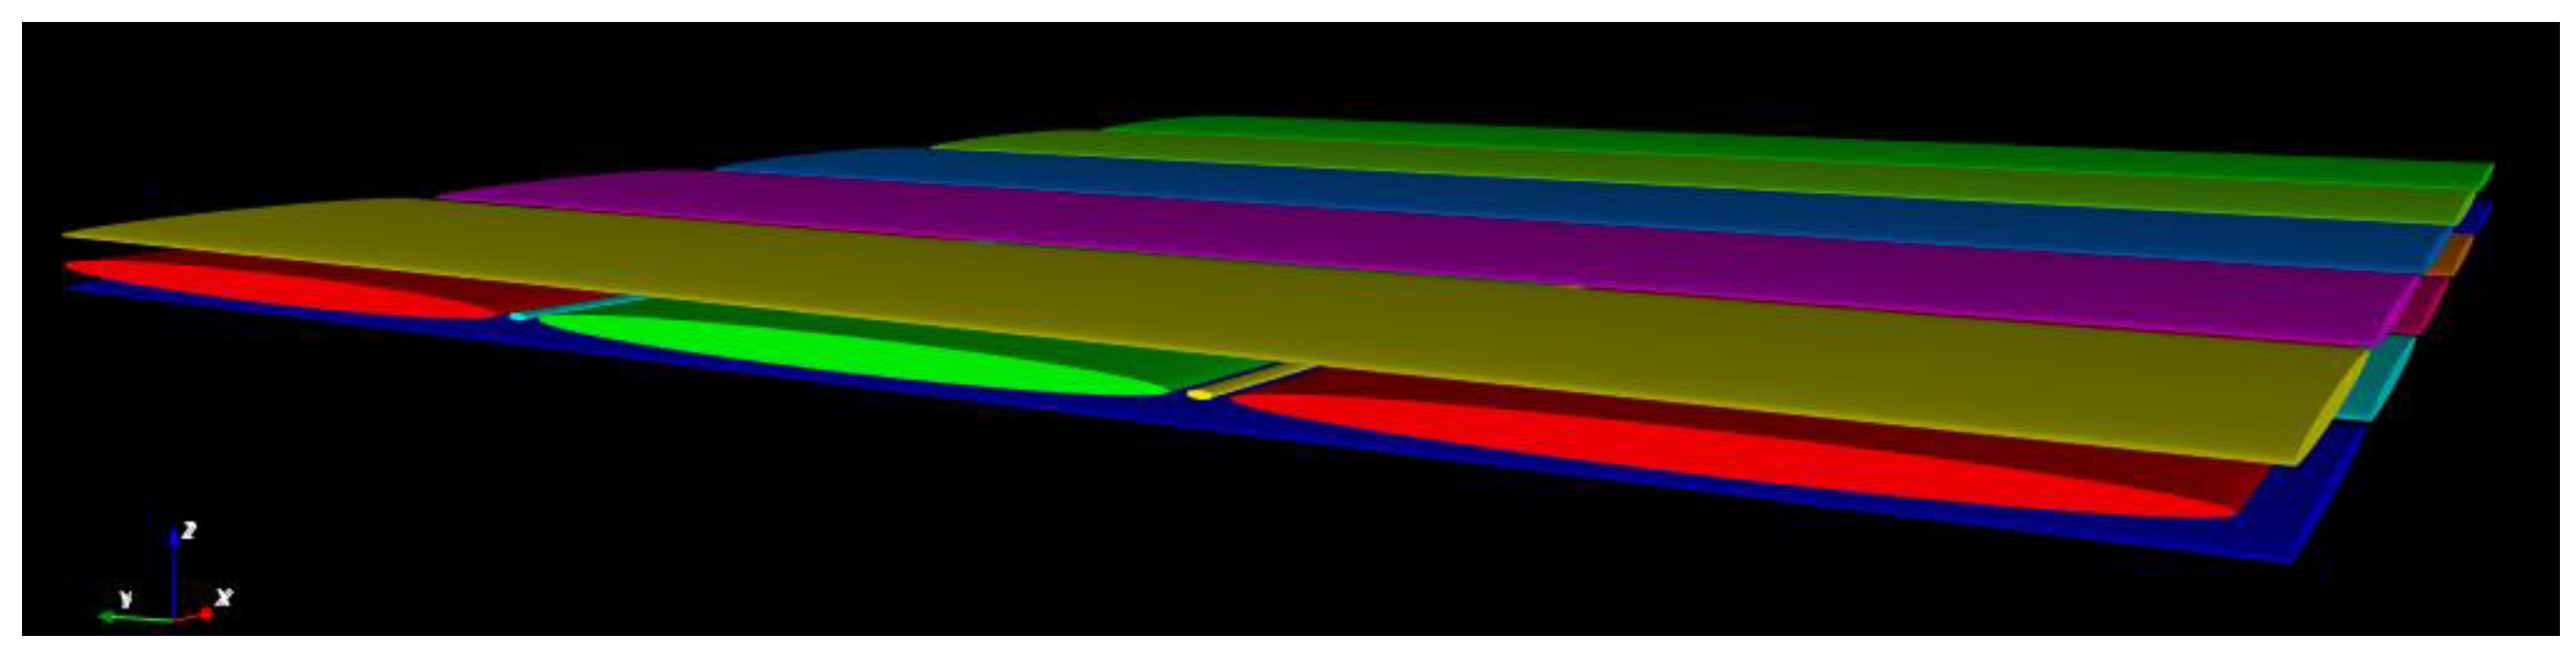
Table 1.
Comparison between analytical models from the bibliography for a selected porosity ε = 0.5.
Table 1.
Comparison between analytical models from the bibliography for a selected porosity ε = 0.5.
| Model Name/(ε = 0.5) | KL/r2 | KT/r2 |
|---|---|---|
| Kuwabara [33] | 0.0342 | 0.017 |
| Gutowski (for Va = 0.83) [34] | - | 0.0131 |
| Gutowski (for Va = 0.78) [34] | 0.1786 | 0.0086 |
| Gebart (Square) [27] | 0.0702 | 0.0129 |
| Gebart (Hexagonal) [27] | 0.0755 | 0.0164 |
| Berdichevsky and Cai ISCM (Square) [29] | 0.0464 | 0.0097 |
| Berdichevsky and Cai ISCM (Hexagonal) [29] | 0.0354 | 0.0116 |
| Tamayol and Bahrami (Square) [35] | - | 0.0117 |
| Scattering | 67.7% | 217.6% |
Table 2.
Permeability values with corresponding scattering [35].
Table 2.
Permeability values with corresponding scattering [35].
| ε | KT/r2 | Reference | Difference % |
|---|---|---|---|
| 0.4345 | 0.007912 | Coulaud | 55% |
| 0.4345 | 0.005076 | Lee and yang | |
| 0.5 | 0.0488 | Sangani and Yao | 300% |
| 0.5 | 0.012 | Sadiq et Al | |
| 0.7 | 0.1292 | Kirsch and Fuchs | 240% |
| 0.7 | 0.24 | Sangani and Yao |
Table 3.
Scattering between the numerically-predicted permeability values for two selected porosities affected by the packing structure [35].
Table 3.
Scattering between the numerically-predicted permeability values for two selected porosities affected by the packing structure [35].
| Reference | Geometry | ε = 0.3 | ε = 0.7 | ε = 0.3 | ε = 0.7 | ||
|---|---|---|---|---|---|---|---|
| KT/r2 | Average | Scatter | Average | Scatter | |||
| Dave et al. [36] | - | 1.25 × 10³ | 8.66 × 101 | 1.04 × 10³ | 75.85% | 1.86 × 101 | 130.59% |
| Gutowski [30] | Square Packing | 1.92 × 10⁴ | 8.65 × 10² | ||||
| Gutowski [30] | Hex. Packing | 1.31 × 10³ | 1.23 × 101 | ||||
| Berd. and Cai [19] | - | 2.57 × 10³ | 1.54 × 101 | ||||
| Berd.and Cai [19] | Hex. Packing | 1.62 × 10³ | 1.08 × 101 | ||||
| Berd. and Cai [19] | Square Packing | 3.32 × 10⁴ | 1.02 × 101 | ||||
| Wang et al. [21] | Square Packing | 4.26 × 10⁴ | 1.10 × 101 | ||||
| Choi et al. [16] | Hex. Packing | 1.57 × 10³ | 9.84 × 10² | ||||
| Choi et al. [16] | Square Packing | 8.18 × 10⁵ | 2.44 × 10² | ||||
© 2019 by the authors. Licensee MDPI, Basel, Switzerland. This article is an open access article distributed under the terms and conditions of the Creative Commons Attribution (CC BY) license (http://creativecommons.org/licenses/by/4.0/).
Share and Cite
MDPI and ACS Style
Karaki, M.; Younes, R.; Trochu, F.; Lafon, P. Progress in Experimental and Theoretical Evaluation Methods for Textile Permeability. J. Compos. Sci. 2019, 3, 73. https://doi.org/10.3390/jcs3030073
AMA Style
Karaki M, Younes R, Trochu F, Lafon P. Progress in Experimental and Theoretical Evaluation Methods for Textile Permeability. Journal of Composites Science. 2019; 3(3):73. https://doi.org/10.3390/jcs3030073
Chicago/Turabian StyleKaraki, Mohamad, Rafic Younes, Francois Trochu, and Pascal Lafon. 2019. "Progress in Experimental and Theoretical Evaluation Methods for Textile Permeability" Journal of Composites Science 3, no. 3: 73. https://doi.org/10.3390/jcs3030073