Article

Thermomechanical Properties of Sustainable Polymer Composites Incorporating Agricultural Wastes

1
Department of Mechanical Engineering, Southern University and A&M College, Baton Rouge, LA 70813, USA
2
Department of Biological Sciences and Chemistry, Southern University and A&M College, Baton Rouge, LA 70813, USA
3
Department of Mechanical & Industrial Engineering, Louisiana State University, Baton Rouge, LA 70803, USA
*
Author to whom correspondence should be addressed.
J. Manuf. Mater. Process. 2025, 9(9), 315; https://doi.org/10.3390/jmmp9090315
Submission received: 25 July 2025 / Revised: 27 August 2025 / Accepted: 5 September 2025 / Published: 15 September 2025

Abstract

Polymer matrix composites have been used extensively in the aerospace and automotive industries. Nevertheless, the growing demand for composites raises concerns about the thermal stability, cost, and environmental impacts of synthetic fillers like graphene and carbon nanotubes. Hence, this study investigates the possibility of enhancing the thermomechanical properties of polymer composites through the incorporation of agricultural waste as fillers. Particles from walnut, coffee, and coconut shells were used as fillers to create particulate composites. Bio-based composites with 10 to 30 wt.% filler were created by sifting these particles into various mesh sizes and dispersing them in an epoxy matrix. In comparison to the pure polymer, DSC results indicated that the inclusion of 50 mesh 30 wt.% agricultural waste fillers increased the glass transition temperature by 8.5%, from 55.6 °C to 60.33 °C. Also, the TGA data showed improved thermal stability. Subsequently, the agricultural wastes were employed as reinforcement for laminated composites containing woven glass fiber with a 50% fiber volume fraction, eight plies, and varying particle filler weight percentages from 0% to 6% with respect to the laminated composite. The hybrid laminated composite demonstrated improved impact resistance of 142% in low-velocity impact testing. These results demonstrate that fillers made of agricultural wastes can enhance the thermomechanical properties of sustainable composites, creating new environmentally friendly prospects for the automotive and aerospace industries.

Graphical Abstract

1. Introduction

One of the most promising materials over the past five decades has been polymer composites. Their application and access to new markets have increased steadily [1]. These materials have versatility and the ability to satisfy a range of functionalities, making them a potent force in the market [2]. The main advantages of polymer composite materials over other materials currently in use, such as metals or alloys, are their high specific tensile strength and stiffness, and corrosion resistance, permitting weight reduction in the finished products [3]. Polymer composite materials perform better in comparison to constituent materials because the distinct materials retain their individual properties while working collectively to form a new material with improved properties [4]. Polymer composite materials can be distinguished by the reinforcement used, such as fiber-reinforced polymer composite and particle-reinforced composite, or hybrid composite [5]. Polymer composites have emerged as versatile materials with superior tensile strength, stiffness, and corrosion resistance, enabling their use across diverse sectors including aerospace, automotive, marine, energy, and infrastructure [6,7]. Their mechanical performance arises from the synergy between the reinforcement, whether fiber, particle, or hybrid, and the polymer matrix, which ensures efficient load transfer [8,9]. The choice of reinforcement significantly influences composite properties, as it governs interfacial bonding, load-bearing capacity, and overall structural integrity. As a result, composite performance depends on the type, distribution, and interaction of the reinforcement within the matrix, as well as the interphase region, which together determine the stiffness, strength, and toughness of the final material [10].
Extensive studies have been conducted on the mechanical characteristics of agricultural waste-reinforced polymer composites to examine the possibilities of applying agricultural waste fillers to improve the performance of polymer composites [11,12,13,14,15]. For example, Naik et al. [16] utilized the readily available agricultural waste in India to examine the usage of tamarind seed particles as reinforcement in epoxy resin composites. The composite specimens were made using epoxy resin and tamarind seed powder with varying weight percentages. The results indicated that the composites have enhanced mechanical characteristics, including higher tensile strength, impact strength, modulus of rupture (MOR), and modulus of elasticity (MOE). This study emphasizes the potential of epoxy composites reinforced with tamarind seed particles for use in coatings, structural applications, and automotive design. Chand et al. [17] focused on using banana and bagasse fibers, which are readily available and low-cost, as reinforcement components in epoxy composites. To improve the adhesion qualities, sodium hydroxide (NaOH) and sodium chloride (NaCl) solutions were applied to the fibers. Tensile and flexural tests were used to assess the mechanical properties of the composite materials with various fiber volume fractions. The findings demonstrate the promise of these composites in a variety of applications by showing that increasing the volume percentage of fibers, especially at 30%, resulted in improved stiffness, elasticity, and ultimate tensile strength (UTS). The use of oil palm empty fruit bunch fibers as reinforcement for epoxy composites was investigated by Yusup et al. [18]. Examination of how varied alkaline treatment times affected the fibers’ mechanical, physical, and morphological properties was carried out. Also, the flexural and impact strengths of the composite samples, which were created using mold casting techniques, were determined. The findings suggest that composite materials with fibers treated for 24 h had the maximum flexural strength (83.63 MPa) and impact strength (1.1527 J/mm2), making them promising materials for sporting goods. The porosity ranges from 1.57% to 2.02%, while the density of the composites is between 1.1479 and 1.1527 g/cm3. Ghazi and Jaddan [19] studied the use of date palm waste as a reinforcing filler in green composite materials for insulation and interior parts in the shipbuilding and automotive industries. Six composites were created using various fillers and loading percentages. The filler volume fraction and type affected the thermal properties, with the seed date palm obtaining the lowest values at the highest volume fraction (30%). The lowest thermal conductivity was demonstrated by the epoxy hybrid composites, which made them ideal for use in thermal insulation applications. The thermal conductivity of the seed date palm filler at maximum loading was found to be 0.138 W/m·K, along with thermal diffusivity of 0.0201 J/kg·K and specific heat of 720 m2/s.
While natural fillers such as banana fiber and bagasse have been explored in prior studies, comparative analysis across multiple agricultural waste types within a consistent polymer system remains limited. Moreover, few studies comprehensively address damping behavior via DMA or correlate it with microstructural and thermal observations. In addition to the above examples, other agricultural wastes have also been studied, including coconut shells [20,21,22,23], coffee beans [24,25], and walnut shell particles [26,27]. This paper offers the like-for-like, systematic comparison of the three agricultural waste fillers, that is, coconut shell, coffee bean, and walnut shell, within the same epoxy matrix, therefore removing polymer-system variability that has hampered previous works. We marry macroscopic mechanical testing, dynamic mechanical analysis (DMA), thermal characterization, and cross-section SEM of post-impacts to directly correlate damping, stiffness, and strength to microstructure and thermal behavior. The simultaneous experimental comparison of particulate matrices and laminated composites under a unified experimental framework provides novel, applicable guidance on filler-dependent performance and scalability, and a clear roadmap on the selection and treatment of agricultural waste particles applicable to composite use in the industrial context.

2. Experimental Section

2.1. Materials

The monomers, the Aeromarine resin #300, also called Bisphenol A diglycidyl ether (DGEBA), and Aeromarine hardener #21 (a polyetheramine-based curing agent), were purchased from Aeromarine Products Inc., San Diego, CA, USA, and used without any pre-treatment. The raw agricultural wastes utilized in this project (walnut shell powder, coconut shell powder, and coffee bean powder) were all purchased from HNCO Organics (Kathwada, India), Ecotropicals (Delhi, India), and Starbucks Coffee Company, Seattle, WA, USA, respectively. The reinforcement fabric was an E-glass plain weave (Fibreglast Developments Corp., Brookville, OH, USA) with a surface density of 200 g·m2. E-glass, an alumino-borosilicate with low alkali content, was selected for its well-established use in polymer composites, offering high tensile strength (~3.4 GPa), elastic modulus (~72 GPa), and chemical resistance at comparatively low cost. The plain weave configuration provided uniform resin impregnation, and the measured fiber volume fraction (Vf), determined by ASTM D2584 [28] resin burn-off, averaged 49.8 ± 2.3% across all laminates.

2.2. Preparation of the Agricultural Waste Reinforced Polymer Composites

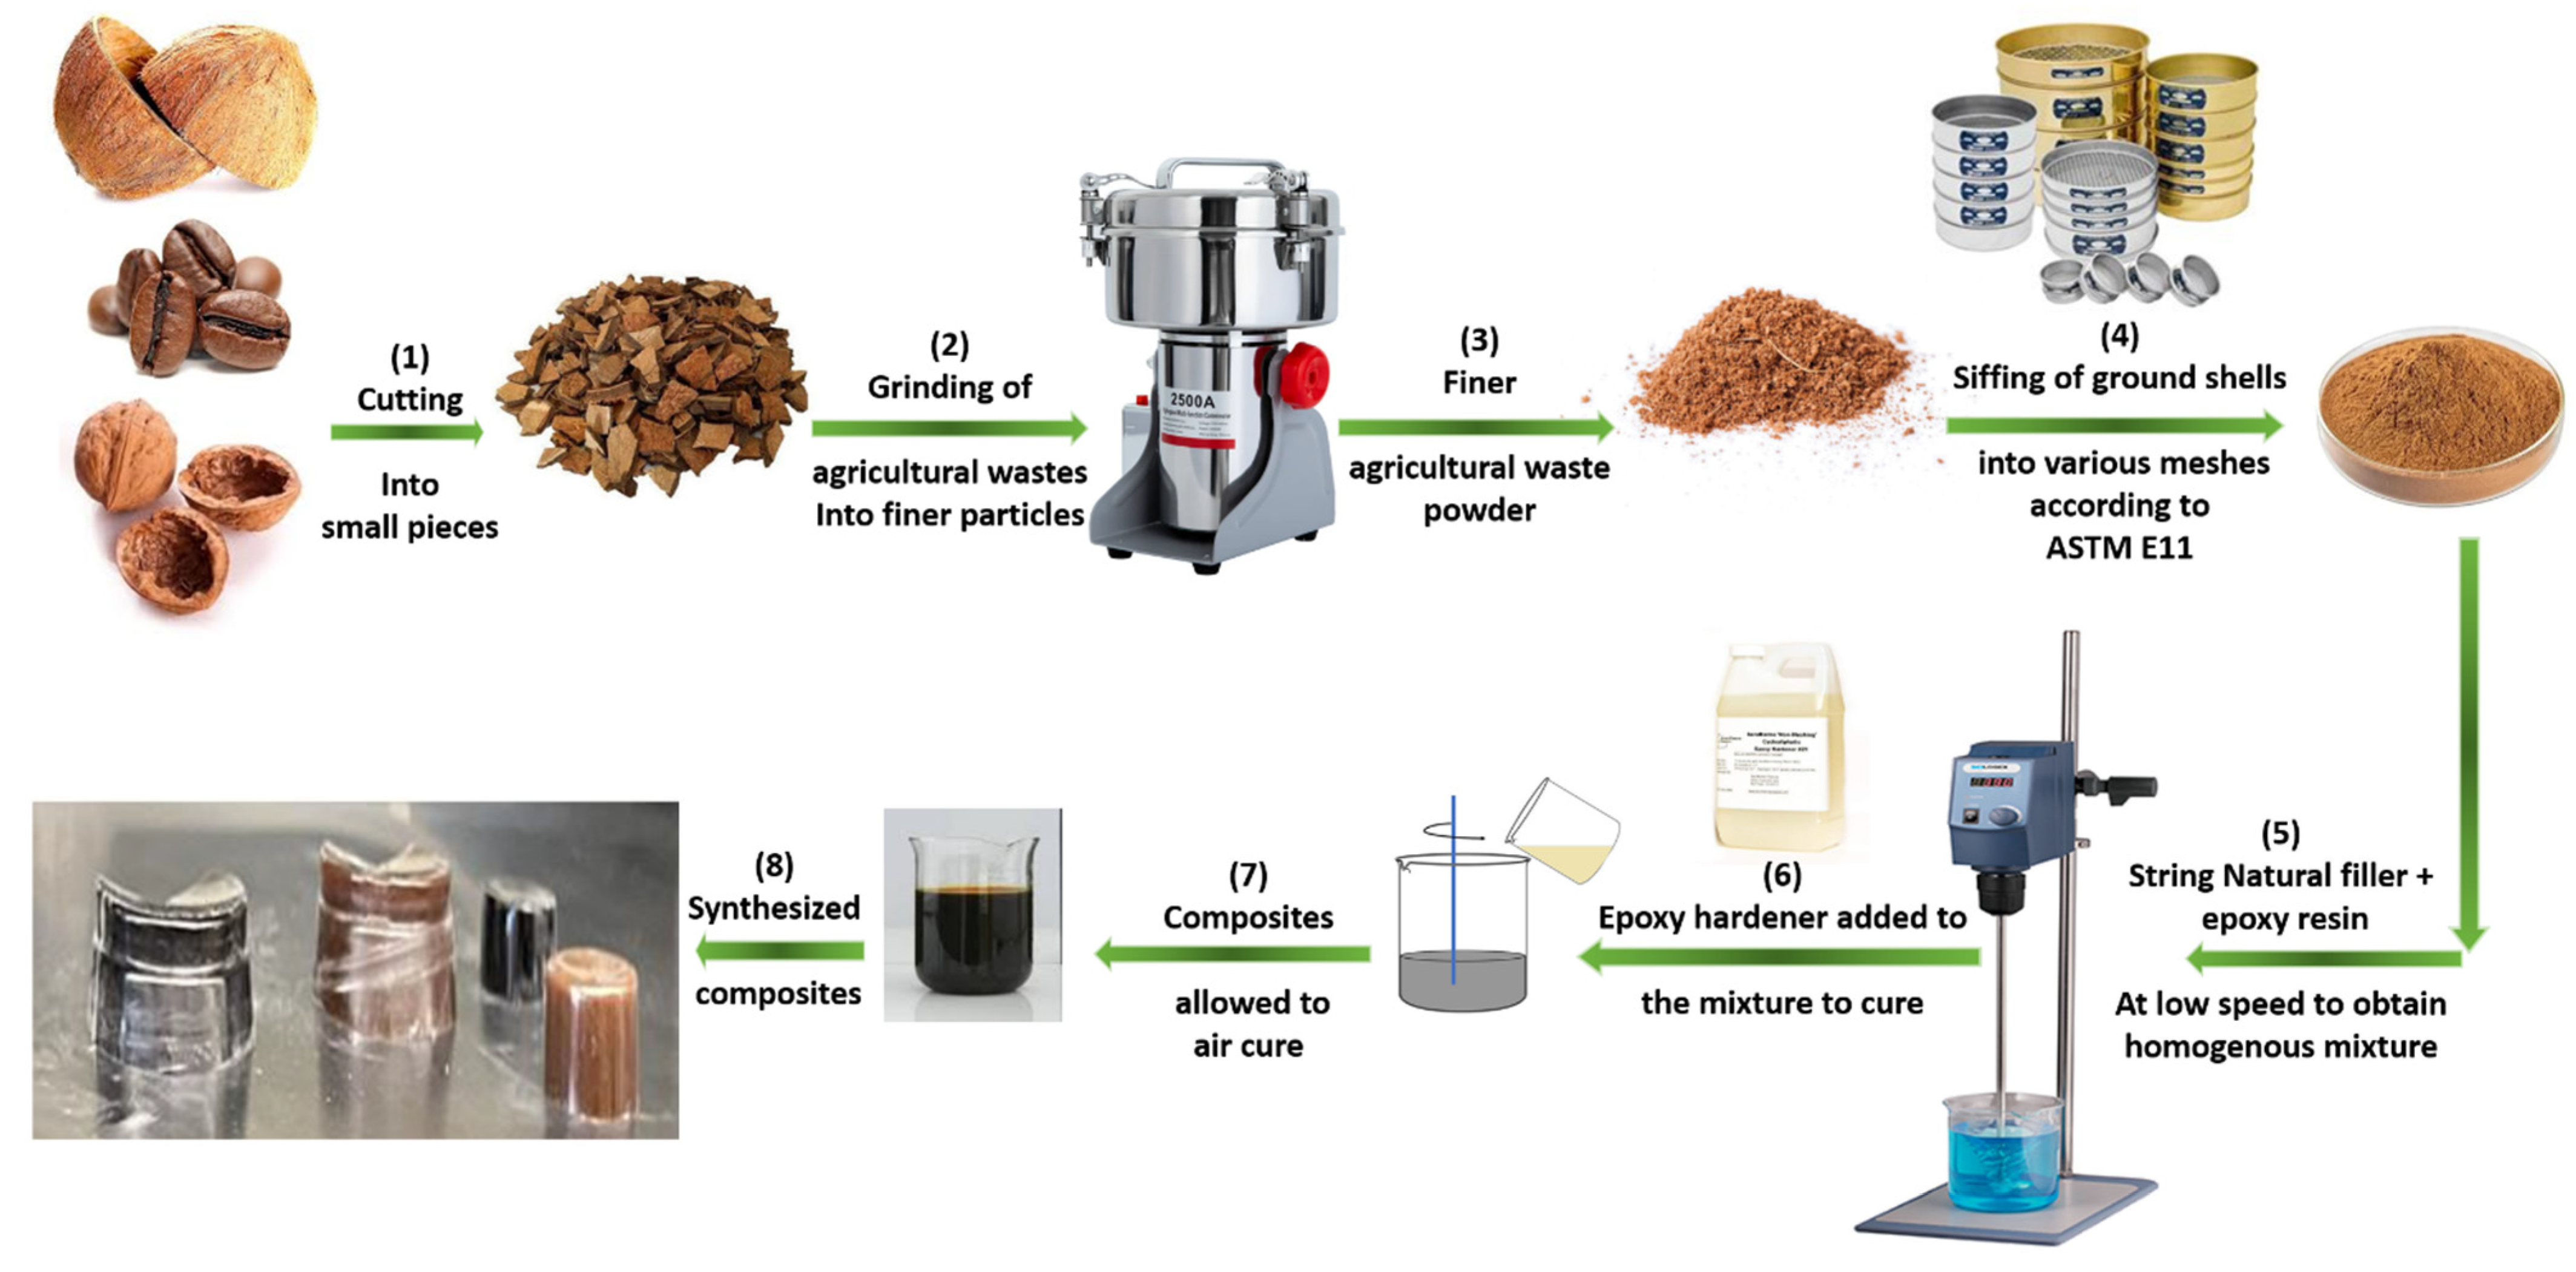
Before grinding, walnut shells, coconut shells, and coffee beans were oven-dried at 105 °C for 24 h to remove residual moisture. The samples were cooled in a desiccator before weighing and grinding to prevent reabsorption of ambient humidity. The initial moisture content was determined gravimetrically by recording mass before and after drying. The average residual moisture content across all powders was <1 wt.%, which is within acceptable limits for epoxy composite fabrication. This pre-drying step ensured consistent particle morphology during grinding and uniform dispersion during composite mixing. A VEVOR 2500 g electric mill grinder (Shanghai, China)was used to grind the agricultural waste into finer particles for five minutes at a speed of 2500 rpm. Each of the waste materials was sifted into various mesh sizes of 50-mesh (0.297 mm), 100-mesh (0.149 mm), and 200-mesh (0.074 mm) per ASTM-E11 [29]. Particulate composites were synthesized for each mesh size of coconut shell, coffee bean, and walnut shell for 10 wt.%,15 wt.%, 20 wt.%, 25 wt.%, and 30 wt.%, respectively. DGEBA was employed in a 2:1 ratio with the curing agent. In a mixer running at 76 rpm for 12 h, the weighted agricultural waste particles were combined with a measured quantity of DGEBA. After mixing, the resin–filler mixture was transferred to a vacuum chamber and held under −0.09 MPa vacuum for 30 min to remove entrapped air bubbles prior to curing. The degassing step was continued until no visible bubbling was observed at the resin surface, ensuring thorough removal of micro-voids. This process minimized porosity in the cured composites and was essential for the reproducibility of mechanical property measurements. The effectiveness of degassing was later confirmed by SEM analysis (Figure 1B–D), which shows uniform filler distribution with minimal voids. The mixture was poured into a cylindrical mold with a diameter of 40 mm and a height of 60 mm. The mixture was left to air-cure for 24 h at room temperature (~25 °C) under ambient conditions, which facilitated gradual heat dissipation. The recorded internal temperature did not exceed 65 °C, which is only slightly above ambient and well below the onset of degradation as later reported in the TGA. After curing, the as-fabricated composites were polished and sectioned for characterization. Scheme 1 shows the manufacturing process.

2.3. Fabrication of Hybrid Laminated Composites

Eight plies, each measuring 203.4 mm by 152.4 mm, were used to create a pure composite laminate. The fibre volume fraction (Vf) of the hybrid laminates (target ~50%) was determined using the resin burn-off method in accordance with ASTM D2584. Rectangular specimens (25 × 25 mm) were cut from three different regions of each laminate type to account for spatial variation. Samples were weighed (Wc) and then placed in a muffle furnace at 565 ± 10 °C for 4 h to burn off the epoxy matrix, leaving only the fibre reinforcement. The remaining fibres were cooled in a desiccator and reweighed (Wf). The Vf was calculated using the following:
Vf = (Wf/ρf)/[(Wf/ρf) + (Wm/ρm)]
where Wm = Wc − Wf, and ρf and ρm are the densities of fibre and matrix, respectively. Across three replicate laminates per composite type, the measured Vf averaged 49.8%, with a standard deviation of ±2.3%. Initially, the glass fabric sheet was placed on a table, and a non-porous Teflon sheet was placed on it to prevent the epoxy from adhering to the glass. A single ply was placed on top of the non-porous Teflon sheet. A specific quantity of particle-reinforced epoxy composite was applied to the ply and rolled after thoroughly mixing the curing agent and DGEBA to obtain a homogenous solution. The resin was then simultaneously poured, and the remaining layers were applied. While mesh size variation (50, 100, 200 mesh) was studied for the particulate composites (Table S1, Supplementary File), the laminated composites were fabricated using the most thermally stable formulation: 50 mesh, 30 wt.% filler. To provide a uniform thickness, a Teflon sheet was also positioned on the top. The laminate was then sandwiched between two cover press plates and allowed to cure at room temperature for 24 h. To confirm the extent of curing, DSC analysis (Figure S4d, Supplementary Information) revealed no residual exothermic peaks, confirming that no further curing reaction remained. The measured glass transition temperatures (Tg) of the composites were stable and consistent across replicate samples, while TGA data (Table 1, Table 2 and Table 3) showed no signs of incomplete polymerization or premature degradation. Based on this combined evidence, we determined that the system had reached full cure under ambient conditions, and therefore, no additional post-curing cycle was required. In these laminates, the particle loading is expressed relative to the entire laminate weight (resin + fibers + fillers), resulting in a lower effective filler content of 2–6 wt.% The above procedure was used to create the hybrid laminates with filler ratios with respect to the entire laminate composite of 2 wt.%, 4 wt.%, and 6 wt.%. After fabrication, the cured laminates were cut into coupons for low-velocity impact testing.

2.4. Characterization

2.4.1. Scanning Electron Microscopy

A sputter coater (Denton Vacuum Desk V, Denton Vacuum, Moorestown, NJ, USA) was used to coat a film of gold on the as-fabricated agricultural waste (coconut shells, coffee bean, and walnut shells) reinforced polymer composites as well as the cured pure epoxy-resin-hardener at a current of 10 mA until the thickness reached 0.15 kÅ (≈15 nm) to minimize charging effects and render the surface conductive for the scanning electron microscopy imaging.
The Scanning electron microscope (SEM) (Phenom ProX desktop, Phenom-World (Thermo Fisher), Eindhoven, The Netherlands) was used to examine the particle distribution in the as-fabricated agricultural waste particulate polymer composites. Additionally, an acceleration voltage of 10 kV was used for all measurements.

2.4.2. Fourier Transform Infrared (FT-IR) Spectroscopy

A Fourier Transform Infrared (FTIR) spectrometer (PerkinElmer Spectrum Two FT-IR, Llantrisant, UK) was used to characterize the chemical structure of the monomers (DGEBA and curing agent) and the cured sample. Thirty-two scans were collected using wavenumbers ranging from 4000 cm−1 to 400 cm−1. A force gauge of 25 was applied to ensure effective contact between the films (monomers) and the ATR top plate, and the same force gauge was applied to the cured samples.

2.4.3. Density Measurement

The density of the agricultural waste particle reinforced polymer composites was determined by using a Gas Pycnometer (Micrometrics AccuPyc II 1340, Norcross, GA, USA) with helium as the probe gas and a sample holder size of 1 cm3. The pressure was determined by a 316L SS pressure sensor(Dwyer Omega, Michigan City, IN, USA) with ±0.1% pressure nonlinearity in the pressure range of 0 kPa to 207 kPa. The mass of each composite sample was recorded using a balance. The measurement was performed at room temperature. Each measurement collected data from 5 cycles with nearly consistent values that were averaged.

2.4.4. Thermogravimetric Analysis

The thermal stability of the agricultural waste particle reinforced polymer composites and the pure polymer without particles was determined by using a Thermogravimetric Analyzer (TGA) (TGA 550, TA instrument, New Castle, DE, USA). The samples were heated from room temperature to 500 °C at a heating rate of 10 °C/min under a nitrogen environment at a purge rate of 40 mL·min1. An average mass of 10 mg was used for the study. The weight loss percentage at 110 °C, the temperature at which 5% of the weight is lost, the percentage weight loss at 320 °C, the residual weight percentage at 460 °C, and the maximum of the thermogravimetric analysis (DTG) curve were calculated at wt.% loss @ 110 °C; T5% (°C); wt.% loss @ 320 °C; Tmax (°C); Residual wt.% @ 460 °C and Tmax, respectively.

2.4.5. Differential Scanning Calorimetry

A Differential Scanning Calorimeter (DSC) (PerkinElmer 4000, Waltham, MA, USA) was used to evaluate the glass transition temperatures of the agricultural waste particle reinforced polymer composites and the pure polymer using the heat-cool-heat procedure. The samples of average mass of 10 mg were maintained at a flow rate of 30 mL/min in a nitrogen atmosphere. After being kept at 100 °C for three minutes, the samples were heated to 150 °C at a rate of 10 °C per minute. The samples were then cooled to −20 °C at a rate of −10 °C/min after being maintained at 150 °C for two minutes. The samples were first maintained at −20 °C for three minutes, and then they were heated to 150 °C at a rate of 10 °C/min. The second heating cycle was used to determine the thermal behaviour of the polymer and the polymer composite.

2.4.6. Low Velocity Impact Test

Low-velocity impact tests were performed on hybrid polymer composite samples with typical dimensions of 160 mm × 25 mm × 3.5 mm, in accordance with Abedin et al. [30]. These tests were conducted in accordance with ASTM D3763-18 [31] using the Instron Dynatup 8250 HV impact tester (Instron, Norwood, MA, USA). A hammer dropped from a height of 205 mm was used to impact the composite samples to achieve an impact velocity of 2 m/s. Data was gathered for examination, and testing was performed on at least 4 effective samples.

2.4.7. Three-Point Bending Test

A standardized three-point bending test was carried out on hybrid polymer composite samples. Flexural test specimens were prepared according to ASTM D790 [32], with dimensions of 80 × 12 × 3.5 mm. A span length of 55 mm was used, with a 5 mm diameter loading nose and 10 mm diameter support rollers. The loading rate was maintained at 1 mm/min. Four replicate specimens were tested for each composite composition, and results are reported as mean ± standard deviation. Testing was conducted on a calibrated testing machine, MTS, Q-test 150 machine.

2.4.8. Dynamic Mechanical Analysis (DMA) Test

DMA specimens measured 35 × 10 × 3.5 mm and were tested using a three-point bending fixture (RSA-G2 Solid Analyzer) with a support span of 35 mm. An oscillation amplitude of 15 µm was applied at a frequency of 1 Hz, with a temperature ramp from 28 °C to 110 °C. Also, a loading gap of 4 mm and a standard oscillatory temperature ramp were ensured during the test. Four replicate specimens per group were tested, and average values with standard deviations are reported.

3. Results

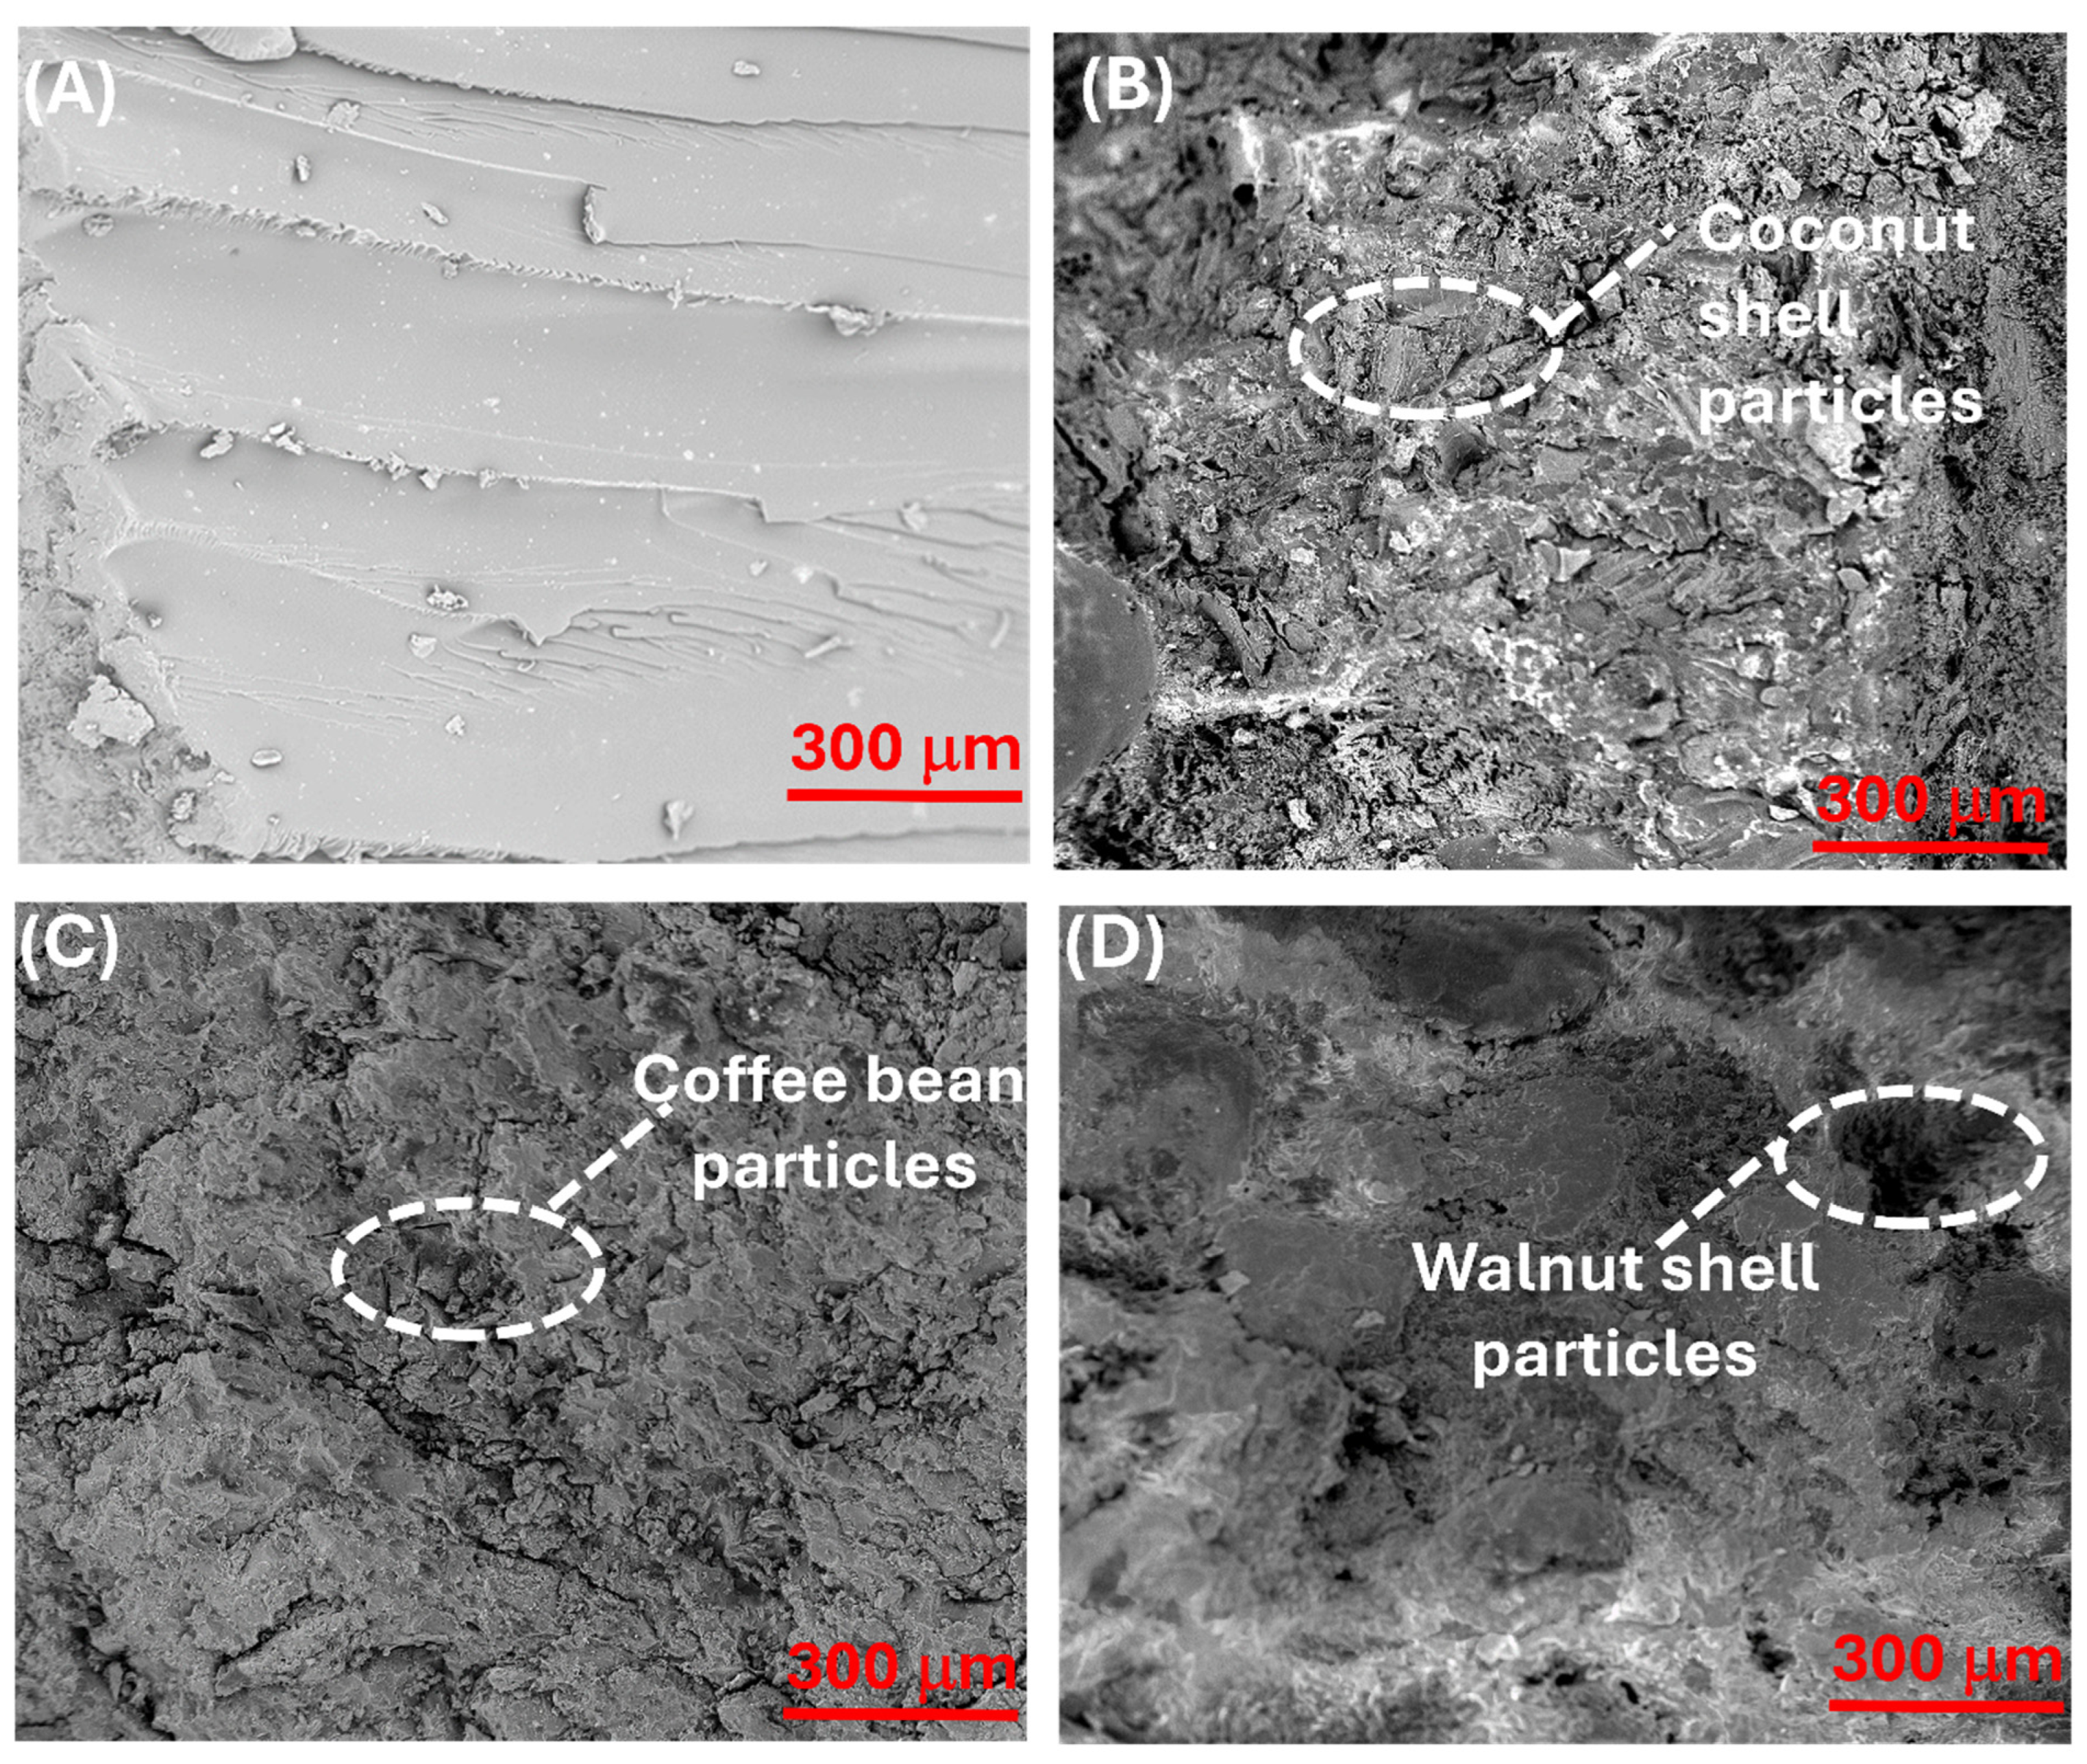
The morphology of the reinforced polymer composites was investigated with SEM micrographs. The control sample, which was just the epoxy matrix with no particles, had a smooth surface compared to the reinforced polymer composites, as seen in Figure 1A.
Figure 1. SEM micrographs of (A) Control (no particles) polymer. (B) Coconut shell reinforced polymer composites (CSRPC). (C) Coffee bean reinforced polymer composites (CBRPC). (D) Walnut shell reinforced polymer composites (WSRPC).
Jmmp 09 00315 g001
However, the coconut shell, coffee beans, and walnut shell particles are evenly distributed in the epoxy matrix of their respective reinforced polymer composites, as shown in Figure 1B–D. The distribution of the reinforcement within the polymer matrix is essential for improving the structural and non-structural properties of the as-synthesized composites.
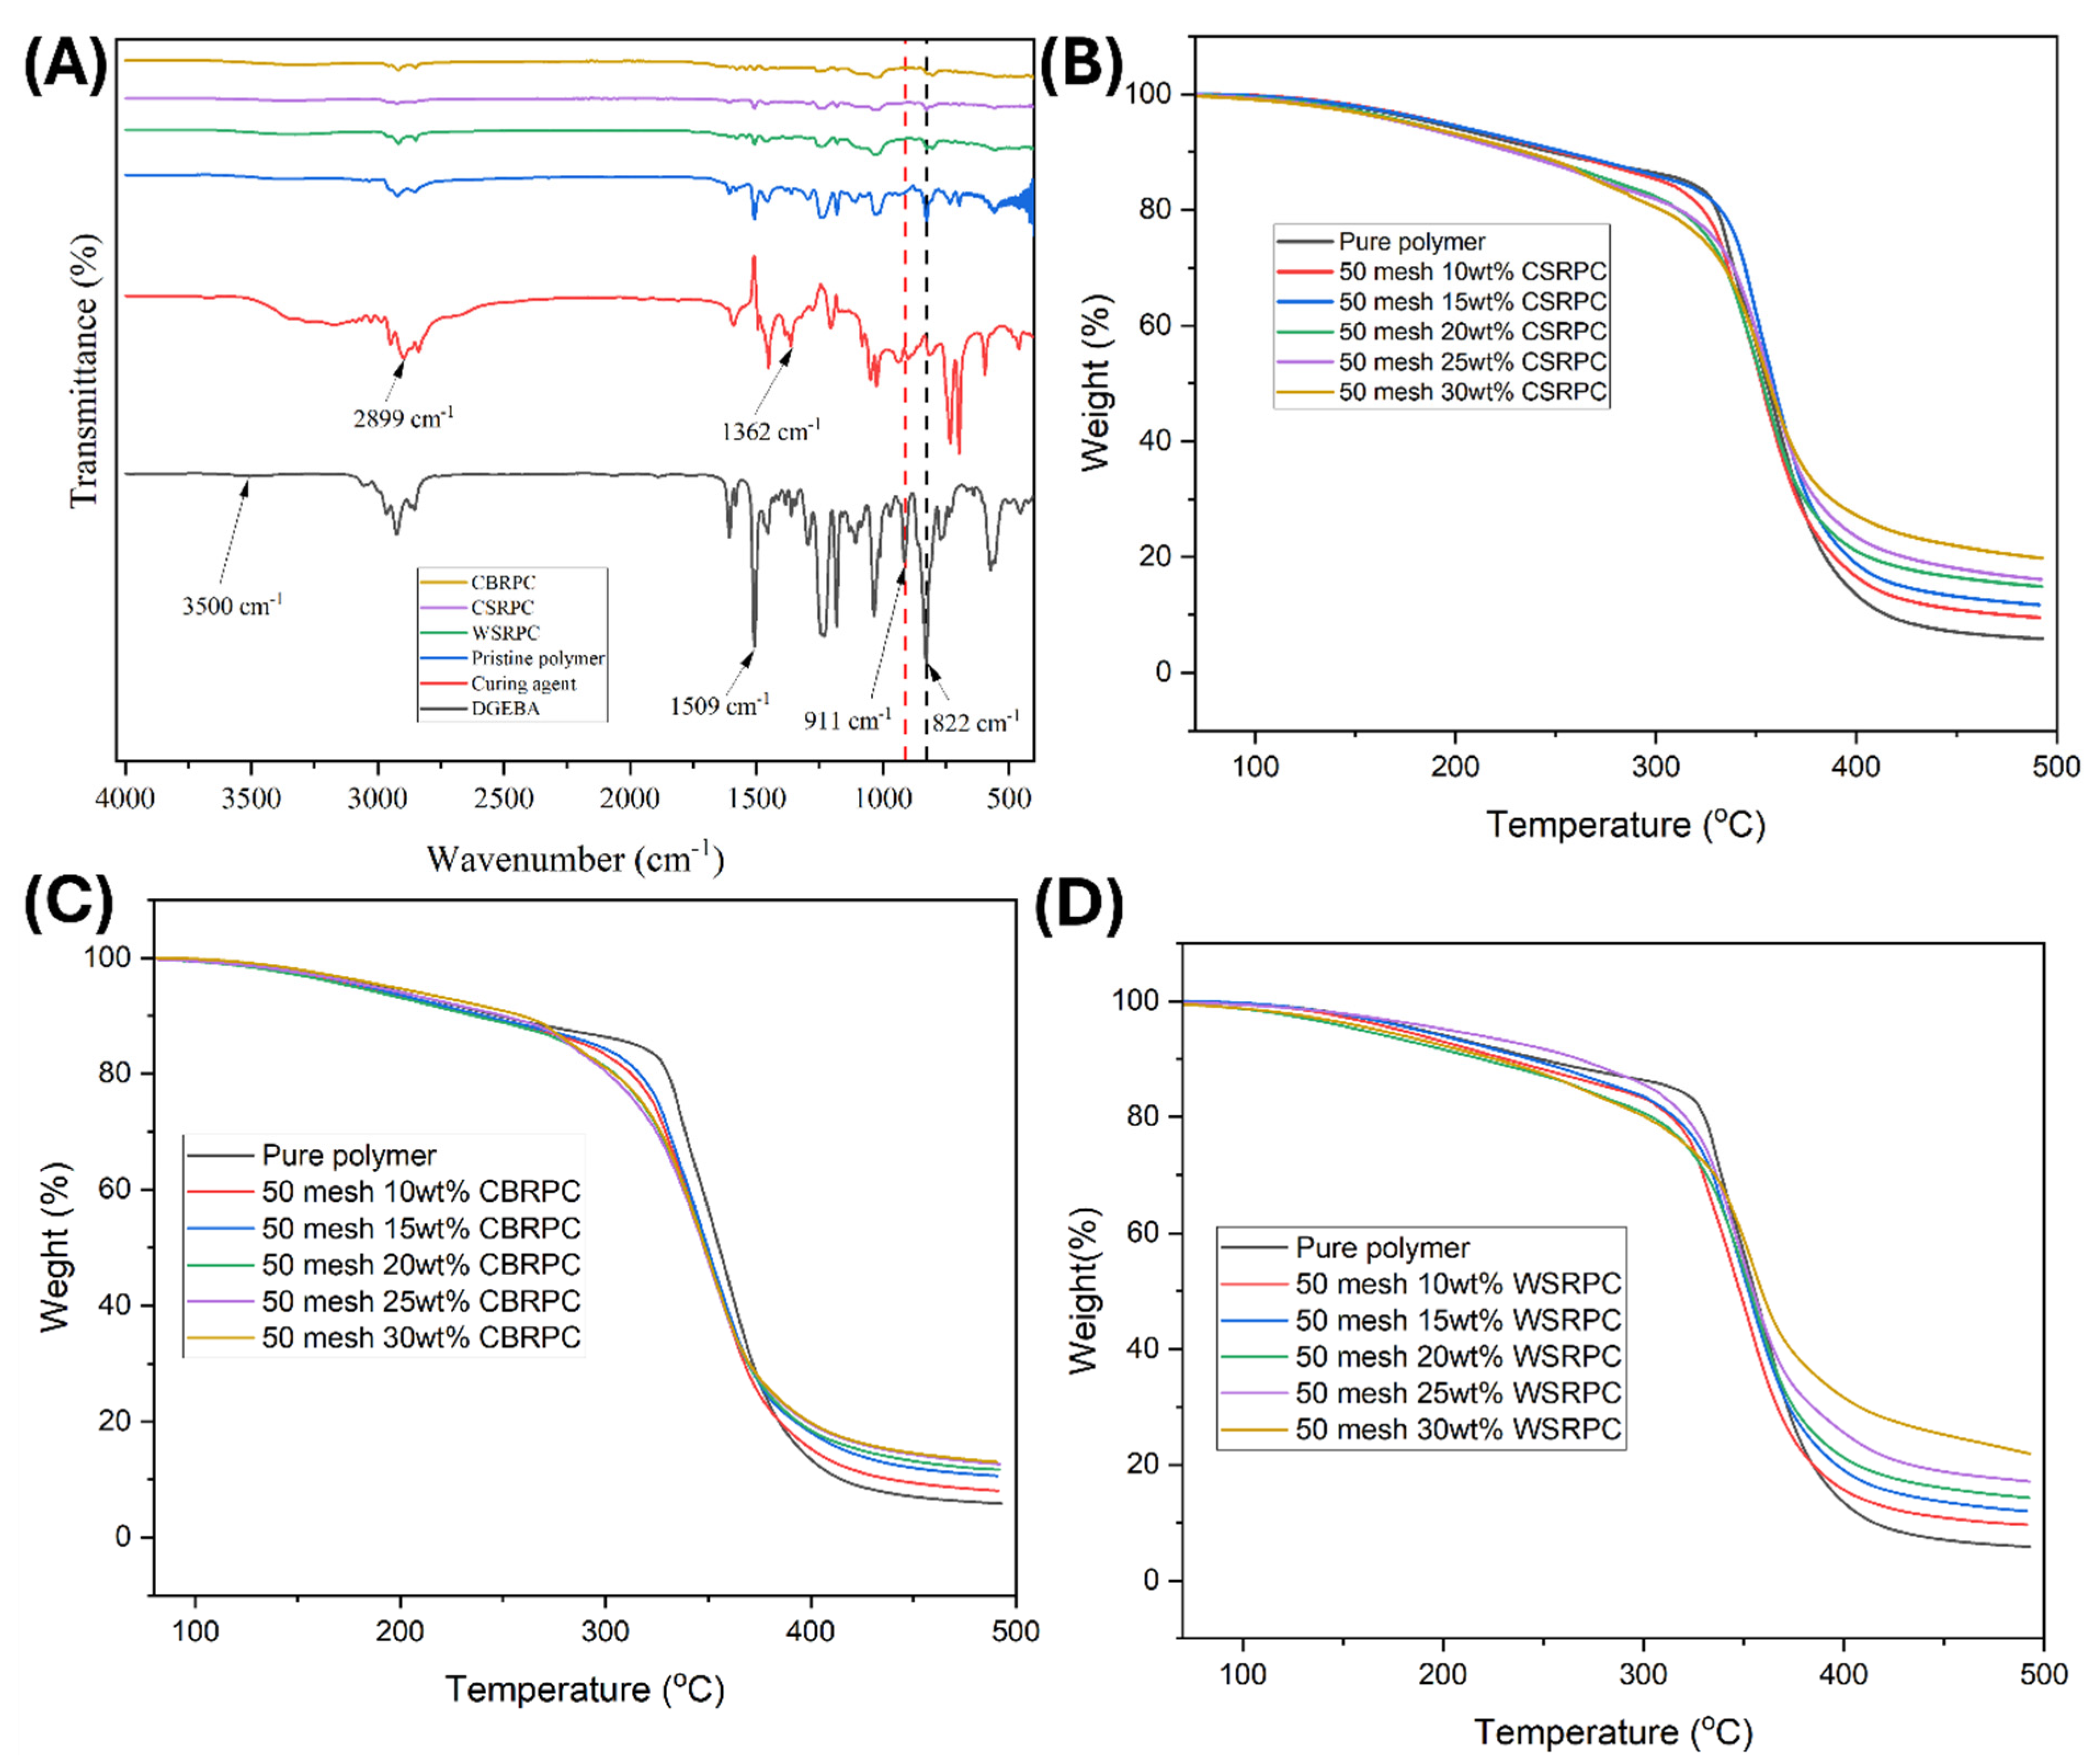
The intermolecular bond stretching in DGEBA, the curing agent, pure polymer, walnut shell (WSRPC), coconut shell (CSRPC), and the coffee bean reinforced polymer composites (CBRPC) was investigated using FT-IR, as shown in Figure 2A. It can be observed that the peaks for DGEBA exhibit epoxide group characteristics at wavenumbers of 911 cm−1 and 822 cm−1. Two distinct peaks were detected at 1101 cm−1 and 1033 cm−1, respectively: the -C-N- absorption peak and the -C-O-C- strong peak [33]. Additionally, the hydroxyl group (OH) is assigned the wavenumber at 3500 cm−1. The characteristic of substituted aromatic rings is the absorption peak at 1509 cm−1 [34]. The N-H and C-N stretching is attributed to the curing agent’s peaks at 2899 cm−1 and 1362 cm−1, respectively. The epoxide group in the pure polymer and the composites reinforced with agricultural waste particles disappear at 911 cm−1 and 822 cm−1, respectively, indicating complete curing of the epoxy resin.
The thermal stability of the pure polymer and the fabricated agricultural waste particle reinforced polymer composites was investigated with the thermogravimetric analyzer. The analysis was performed by comparing the pure polymer with different weight percentages of the reinforcement in a 50 mesh. Figure 2B–D shows the weight loss of the samples as a function of temperature. At 110 °C, every sample had a weight decrease due to the evaporation of the absorbed water molecules. The samples all had a significant decrease in weight at 320 °C, which was due to the degradation of the polymer’s functional groups.
From the derivative thermogravimetry (DTG) analysis, as shown in Figure S4a–c, it is evident that all samples experienced the fastest decomposition between 350 and 360 °C (the peak temperature corresponding to the DTG curve), which corresponds with the degradation of the polymer’s functional group. However, the weight loss of the composites and the pure polymer differed significantly at 460 °C because of the interaction between the functional groups within the agricultural waste, which helped in increasing the thermal stability of the agricultural waste particle reinforced polymer composite compared with the pure polymer. The residual weight of the polymer increased with the increase in reinforcement weight percentage; the 30 wt.% of all the reinforced polymer composites had the highest residual weight at 460 °C. However, 50 mesh 30 wt.% WSRPC had the highest residue of 24.43 wt.% among the reinforced polymer composites, followed by 50 mesh 30 wt.% CSRPC with 21.32 wt.% residue, and 50 mesh 30 wt.% CBRPC with 14.10 wt.% residue, which are all greater than the pure polymer with 6.66 wt.% residue. The thermal properties analysis of the polymer and the reinforced polymer composites using TGA was also summarized in Table 1, Table 2 and Table 3.
Table 1. Thermal properties analysis of pure polymer and coconut shell reinforced polymer composites (CSRPC) using TGA.
Sampleswt.% Loss
@ 110 °C
T5%
(°C)
wt.% Loss
@ 320 °C
Tmax
(°C)
Residue wt.%
@ 460 °C
Pure Polymer0.57189.7415.83354.926.66
50 mesh 10 wt.% CSRPC0.41194.7218.67356.4710.50
50 mesh 15 wt.% CSRPC0.52194.1016.54359.4512.76
50 mesh 20 wt.% CSRPC0.93178.4122.42346.6016.02
50 mesh 25 wt.% CSRPC1.08174.7321.87356.8617.50
50 mesh 30 wt.% CSRPC1.26177.2124.01354.0521.32
Table 2. Thermal properties analysis of pure polymer and coffee bean reinforced polymer composites (CBRPC) using TGA.
Sampleswt.% Loss
@ 110 °C
T5%
(°C)
wt.% Loss
@ 320 °C
Tmax
(°C)
Residue wt.%
@ 460 °C
Pure Polymer0.57189.7415.83354.926.66
50 mesh 10 wt.% CBRPC0.66183.1523.77359.478.99
50 mesh 15 wt.% CBRPC0.47184.5821.58350.7111.54
50 mesh 20 wt.% CBRPC0.88177.8726.28360.2312.68
50 mesh 25 wt.% CBRPC0.78187.8527.45349.3313.83
50 mesh 30 wt.% CBRPC0.33196.0426.01350.8114.10
Table 3. Thermal properties analysis of pure polymer and walnut shell reinforced polymer composites (WSRPC) using TGA.
Sampleswt.% Loss
@ 110 °C
T5%
(°C)
wt.% Loss
@ 320 °C
Tmax
(°C)
Residue wt.%
@ 460 °C
Pure Polymer0.57189.7415.83354.926.66
50 mesh 10 wt.% WSRPC0.51178.7122.45347.0710.47
50 mesh 15 wt.% WSRPC0.44187.8721.54353.7513.12
50 mesh 20 wt.% WSRPC1.55159.2824.39357.1715.50
50 mesh 25 wt.% WSRPC0.71203.4519.65351.8018.33
50 mesh 30 wt.% WSRPC1.43168.06124.48355.4124.43
The Differential Scanning Calorimeter (DSC) was used to analyze the glass transition temperature (Tg) of the pure polymer as well as the fabricated 50 mesh 30 wt.% CSRPC, WSRPC, and CBRPC, as shown in Figure S4d. The glass transition temperature (Tg) of the polymer plays an important role in determining the mechanical properties of the samples with respect to their thermal stability; this confirms the operating range of a material in which the mechanical strength is retained. The Tg of the pure polymer was 55.60 °C; however, when the polymer was reinforced as CBRPC, CSRPC, and WSRPC, the Tg increased to 56.84, 57.27, and 60.33 °C, respectively. The increase in Tg of the reinforced polymer composites is due to the filler limiting the mobility of the polymer chains with increasing temperature.
Density measurements were carried out to evaluate the potential thermal insulation capabilities of the as-fabricated agricultural waste (coconut shells, coffee beans, walnut shells) reinforced polymer composites. Different weight compositions and mesh sizes were used for the density analysis of the fillers. For the coconut shell particles, the density is reduced with an increase in weight composition. From Table S1, for 50 mesh, CSRPC had a density of 1.89 g/cm3 for 10 wt.%, which decreased by 18.5% to a density of 1.54 for 30 wt.%. However, the density increased with increasing mesh sizes. Maintaining the weight composition at 10 wt.%, 50 mesh CSRPC had a density of 1.89 g/cm3, which increased to 2.09 g·cm3 for 300 mesh CSRPC. 30 wt.% 50 mesh coconut shell reinforced polymer composite had the lowest density of 1.5443 g·cm3, which is about 35.6% less than the density of 10 wt.% composite containing 200 mesh coconut shell particles that recorded the highest density. A similar trend was identified for CBRPC and WSRPC in Table S1, indicating that the agricultural waste fillers have a significant effect on the density of the composites.
The low-impact velocity testing was conducted to determine the mechanical behaviour of the laminated composites using the particulate composite as matrix, and the control laminated composite using the pure polymer as matrix. The composite laminates were synthesized using 2, 4, and 6 wt.% of CSRPC, CBRPC, and WSRPC with respect to the entire laminate composite. Figure 3A shows the representative load and energy plots for the glass fabric-reinforced CSRPC laminate.
Li et al. [35] stated that crack initiation energy is a metric used to evaluate the specimen’s elastic energy transfer potential. The impact energy corresponding to the peak impact load from the low-velocity impact test is referred to as the crack initiation energy [36]. The crack initiation energy is observed to increase with increasing wt.% of CSRPC filler used in the glass-fiber/CSRPC laminate, as shown in Figure 3B. The crack initiation energy increased by 142% (from 4.92 J to 11.91 J), and the peak load increased by 162% (from 1.23 kN to 3.22 kN) for 6 wt.% CSRPC laminates compared to the control. Similarly, the glass-fiber/CBRPC and glass-fiber/WSRPC laminates resulted in increasing crack initiation energy and peak load for the same wt.% as displayed in Figure 3C,D, respectively. The increase in the crack initiation energy and peak load shows an increase in the impact resistance with the addition of the agricultural waste reinforcement due to the interaction of the functional groups of the reinforcement with the polymer matrix and the glass fiber.
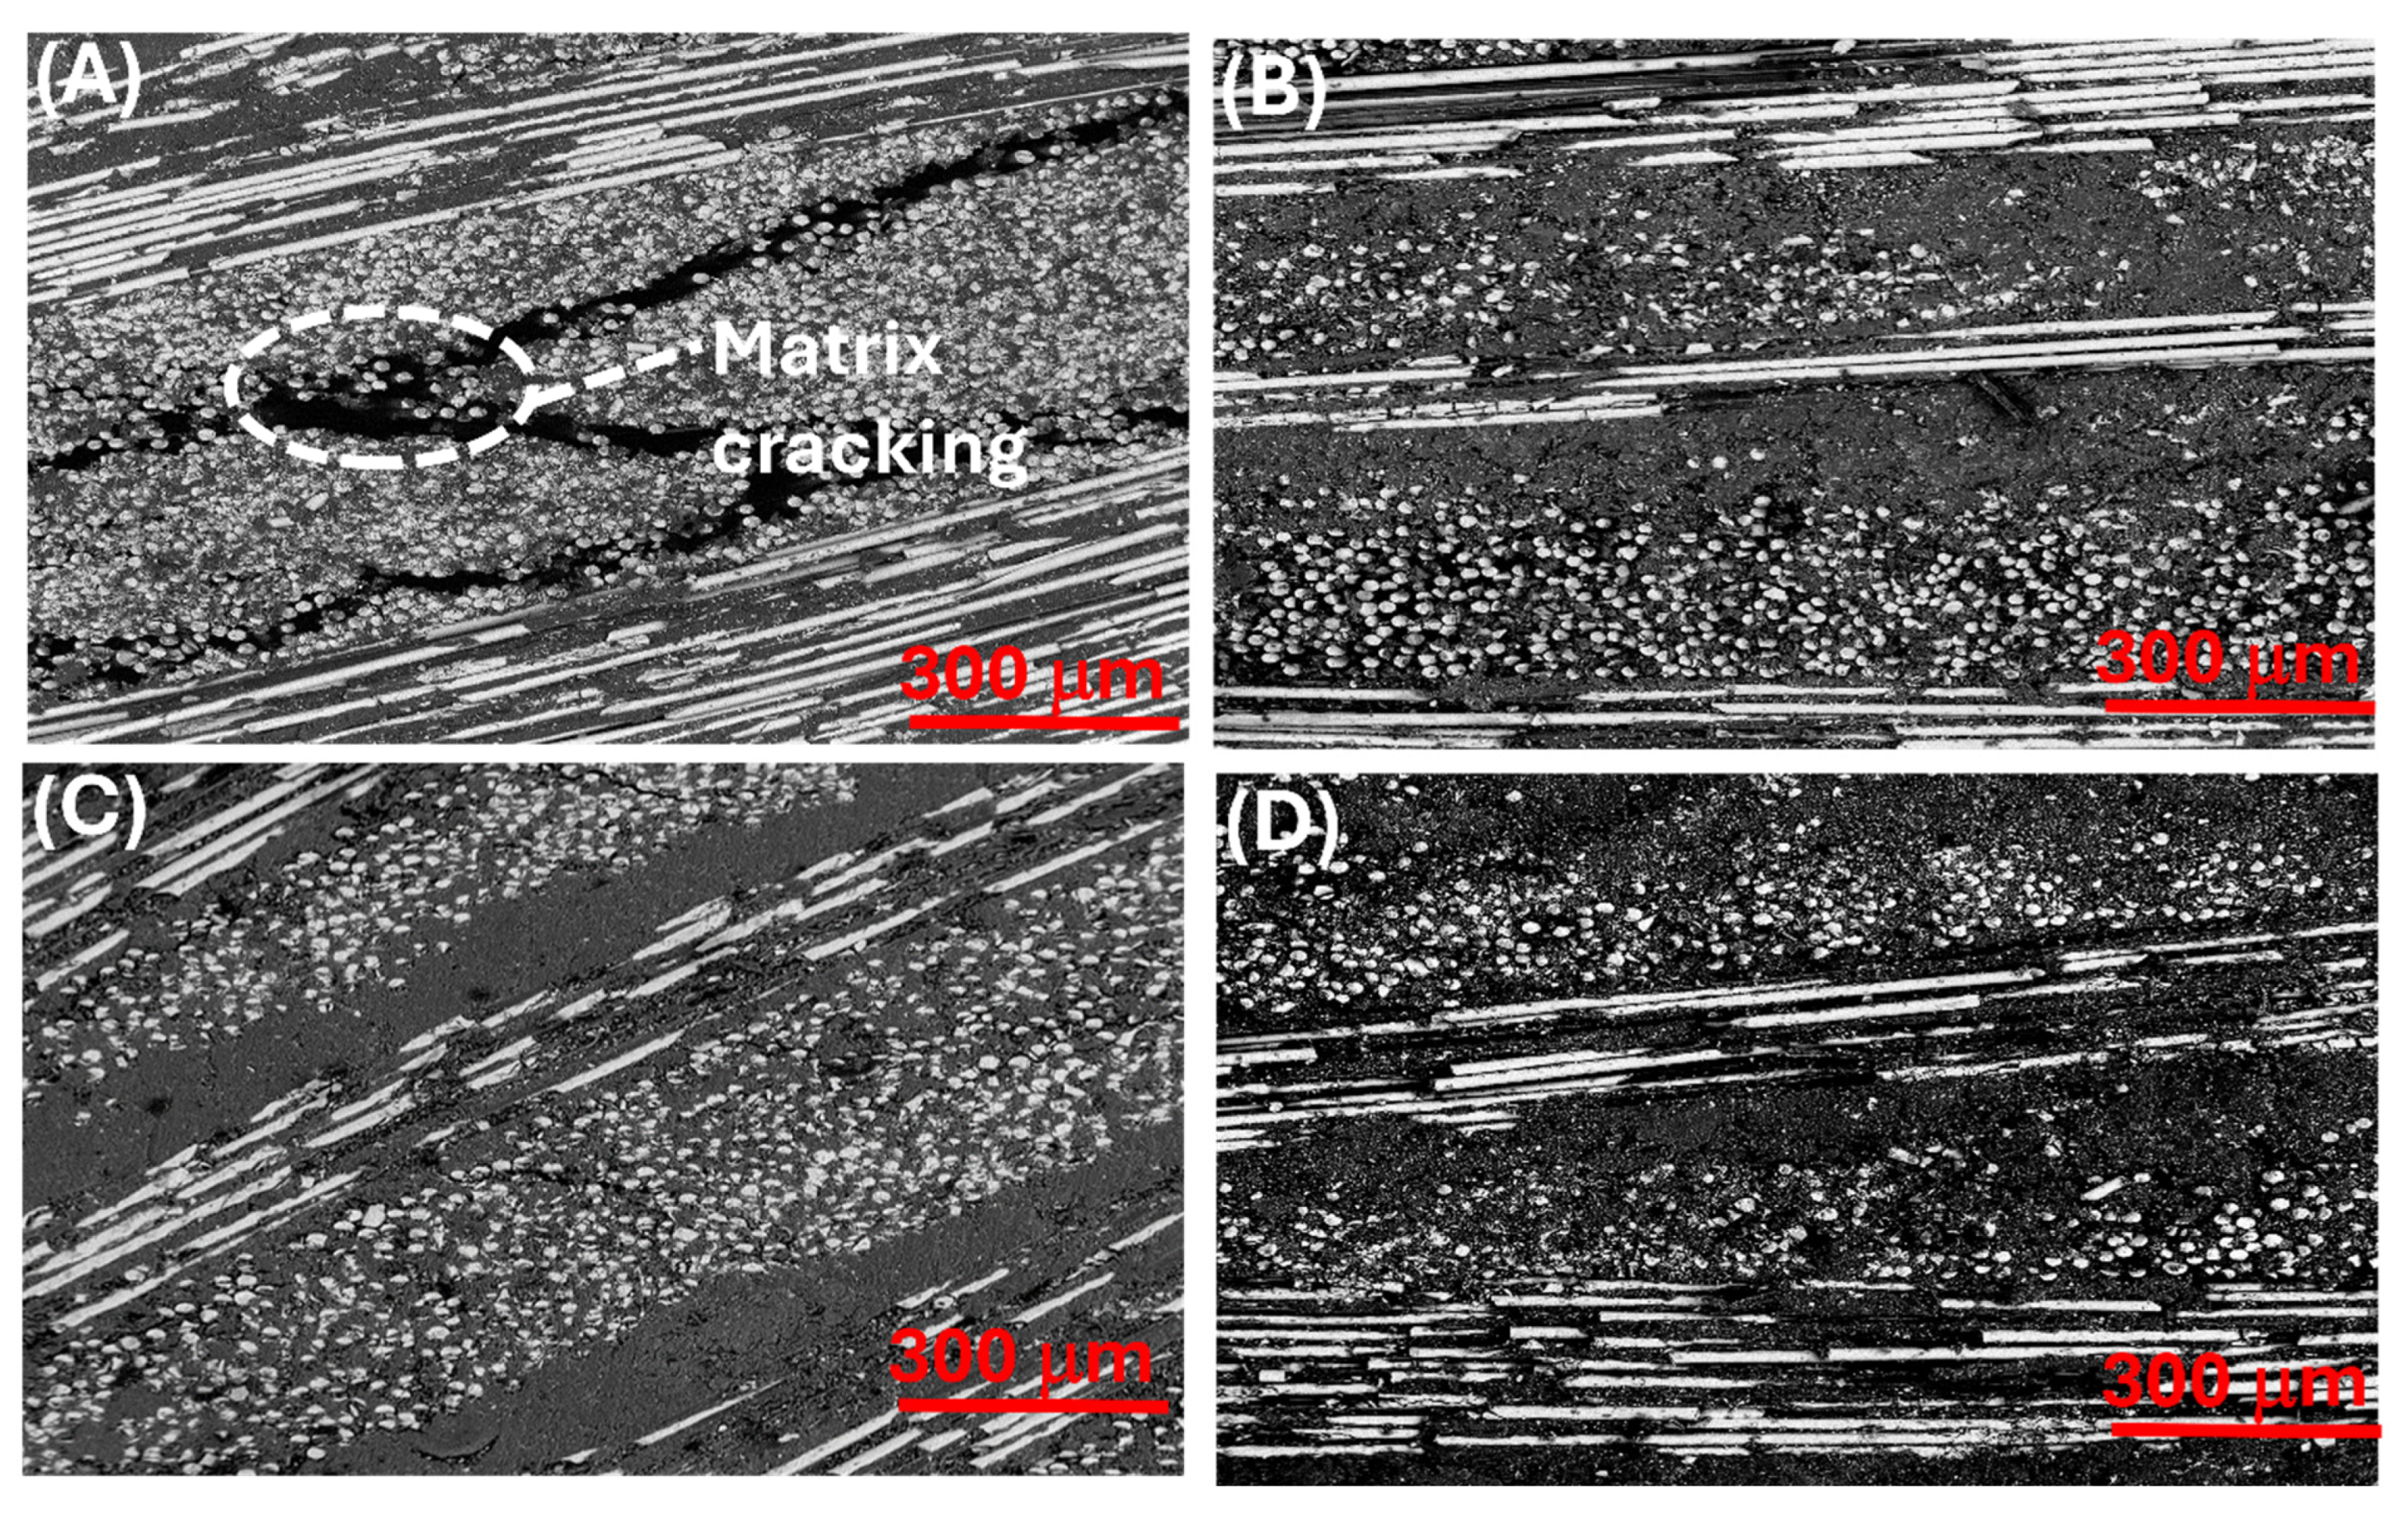
The impacted laminates were further subjected to SEM analysis to evaluate the impact of the damage on the surface of the laminates. For Figure 4, impacted laminates were sectioned perpendicular to the impacted surface using a precision diamond saw. The cross-sectioning plane passed through the central axis of the impact site to capture the primary damage zone. Sections were progressively polished with 400–1200 grit SiC papers followed by 0.5 µm alumina slurry, rinsed, and dried. Samples were then sputter-coated with a thin layer (~10 nm) of gold to prevent charging. The resulting viewing plane reveals through-thickness crack propagation, fiber–matrix debonding, and resin fracture morphology relative to the point of impact. The control laminate showed visible cracks in the polymer matrix and breakage in the glass fiber, as displayed in Figure 4A. However, the 6 wt.% of the glass-fiber/composite laminates showed no visible cracks, indicating the increase in impact resistance due to the addition of the agricultural waste fillers as seen in Figure 4B–D.
To fully investigate the flexural mechanical properties of the laminate composites, the composites were tested at varying filler concentrations (2, 4, and 6 wt.%) to evaluate their flexural strength and flexural modulus, with a well-calibrated and credible mechanical testing machine equipped with a Three-Point Bending Test Fixture. The objective of this particular Mechanical Property Test is to basically comprehend the effect of the particulate natural fillers on the material’s flexural behavior in terms of structural integrity, stiffness, and its ultimate bending ability. Flexural strength and modulus data for all filler types are provided in Figures S7–S9 of the Supplementary Material.
Both flexural modulus and flexural strength of laminate composites seem to depend on filler type and filler loading. With 2 wt.% loading, WSRPC had the flexural strength of 134 MPa and flexural modulus of 12.36 GPa, which is above the strength and modulus values recorded for the CSRPC (110 MPa, 9.50 GPa) and CBRPC (114 MPa, 14.91 GPa) fillers at the same loading. By augmenting the filler ratio to 6 wt.%, CBRPC exhibited the optimum balance with a flexural strength of 146 MPa and modulus of 10.08 GPa, showing a positive effect on adhesion as well as dispersion. However, CSRPC and WSRPC composites showed a decrease in stiffness at higher filler contents. With CSRPC, the 6 wt.% combination produced a strength of 122 MPa and a 10.71 GPa modulus, and in WSRPC, the 6 wt.% combination produced a strength of 115 MPa and a modulus of 10.37 GPa. This reduction of modulus at higher filler loading can be expected in terms of microstructural disruptions, especially filler agglomeration, that limits the ability of the filler to transfer stress within the matrix efficiently (Figure 1). The performance profile of CBRPC was more consistent in all filler loadings and was indicative of better interfacial bonding and homogeneous dispersion. This led to an increase in the stiffness of the matrix and better loading distribution than CSRPC and WSRPC. Such observations are consistent with the particle-filler theories, which state that homogeneous dispersion promotes better mechanical interlocking and stress transfer. This performance is further supported by the DMA and SEM analysis (Figures S10–S12).
A Dynamic Mechanical Analysis (DMA) test was performed to study the viscoelastic behavior of composites near the rubbery state and, in general, the mechanical properties of hybridized laminate composite with respect to temperature. DMA test was carried out on laminate composites within a temperature range from 28 °C to −110 °C with the objective of studying storage modulus (E′), loss modulus (E′′), and damping factor (tan δ) to understand material stiffness, energy dissipation, and efficiency in damping. The instrument used was the RSA-G2 TA Instrument equipped with a Three-point Bending fixture. Evidently, the stiffness, given by the storage modulus (E’), is different for different fillers and their concentrations. DMA Results can be seen in Supplementary Figures S10–S12. At 6% by weight, CBRPC exhibits the highest stiffness, at 29.47 GPa at 35 °C, while the stiffness of CSRPC increases gradually from 2% to 6%, attaining its peak at 24.69 GPa at 32 °C. The higher storage modulus of CBRPC is consistent with the uniform filler distribution and minimal void formation observed in Figure 1C and Figure 4C, which enable efficient load transfer in the glassy region. WSRPC exhibited an increase in stiffness in the initial stages from 2% to 4% but declined at 6% with 6.01 GPa at 33 °C. The maximum value recorded for the loss modulus E’’ representing the energy dissipation for 6% of CBRPC is 4.56 GPa at 59 °C, and for 6% CSRPC, it is 3.51 GPa at 51 °C. This reflects the ability to dissipate the vibrational energy. Maximum damping efficiency as obtained from Tan Delta (δ) for 6% CSRPC, which is 0.365 at 55 °C, is indicative of superior energy dissipation and a Tg temperature around that value. The tests run before the DMA tests were TGA, DSC, and FT-IR/SEM; hence, the previous thermal and chemical/microstructural data were taken into consideration when interpreting the results of the DMA tests. These variations in damping factor (tan δ) are a combination of bulk polymer relaxations and interfacial energy dissipations. Since the DMA was conducted last, we directly linked the high or widened tan δ peaks with the microscale interfacial gap as viewed by the SEM and the FT-IR signals that demonstrate weaker interfacial chemistry (e.g., CSRPC, tan 6 = 0.365 at 55 °C). Oppositely, both lower tan δ and elevated Tg, along with high residue on TGA, are indicative of greater filler-to-matrix affinity (as is the case with some samples of walnuts and coffee). This experimental sequence further reinforces our inference that we saw changes in the tan δ, likely due to bulk viscoelasticity as well as the filler-matrix interfacial behavior.
These results depict that higher filler content, in general, increases the damping properties due to the homogeneous dispersion of fillers, which enhances the energy dissipation at the polymer-filler interface. The moderate Tg developed in coconut and coffee composites could indicate that the lignocellulose structures of the fillers may contribute to the stiffness and damping due to inherent rigidity and compatibility with the matrix. The lower stiffness of 6% walnut composites may relate to possible agglomeration at higher filler loads, reducing the effective stress transfer.
In conclusion, 6% coffee fillers exhibit the highest stiffness value, while at the same loading, coconut fillers provide the greatest damping efficiency; thus, filler-specific mechanical responses are suitable in the designed applications of advanced composites. Compared to graphene and carbon nanotubes, which cost $100–$500/kg, agricultural waste fillers are readily available at <$5/kg. While carbon-based nanofillers exhibit superior strength (~200 GPa), their poor dispersion and high cost limit scalability. Our composites showed flexural strengths up to 146 MPa and excellent damping behavior, offering a sustainable, cost-effective alternative with ~90% lower cost and simpler processing.
4. Conclusions

The agricultural waste particles were prepared to form polymer composites for investigating the thermomechanical properties. The filler content and mesh sizes significantly affect the thermal properties of the polymer composites. The TGA analysis showed improved thermal stability with the addition of the agricultural waste fillers in comparison with the pure polymer; the analysis was carried out for a uniform mesh size of 50 to study the importance of the weight composition. The 30 wt.% of all the reinforced polymer composites had the highest residual weight at 460 °C, WSRPC had the highest 24.43 wt.% residue among the reinforced polymer composites, followed by CSRPC with 21.32 wt.% residue and CBRPC with 14.10 wt.% residue, which are all greater than the pure polymer with 6.66 wt.% residue. The thermal stability was further evaluated with DSC analysis, which showed improved glass transition temperature (Tg) of 57.27, 56.84, and 60.33 °C for CSRPC, CBRPC, and WSRPC, respectively, compared to the pure polymer of 55.60 °C. WSRPC had the most improved thermal properties among the agricultural waste-based fillers.
The laminated composites with filler-reinforced polymer as matrix were subjected to low-velocity impact testing to evaluate the crack initiation energy and peak load with a laminated composite prepared by the pure polymer matrix as the reference. The laminated composites with CSRPC, CBRPC, and WSRPC particles had higher crack initiation energy and peak load than the control (no particulate) laminate. The impact-damaged composite laminates and the control laminates were subjected to surface morphology analysis, and only the control laminate had cracked in the polymer matrix, showing the improvement in load-carrying capacity in the agricultural waste filler-reinforced polymer. Turning bio-based sustainable waste into valuable composite materials can offer a promising approach to broad industrial applications. All these mechanical properties of hybridized composites depend upon the type and the concentration of the filler. Whereas, for coffee fillers, 6% gives maximum stiffness of 29.5 GPa with balanced flexural strength due to improved filler-matrix bonding and dispersion. Coconut fillers have shown excellence in damping efficiency with a Tan δ value of 0.365, with good moderate thermal properties; however, they showed reduced stiffness with increased loading due to agglomeration. In general, walnut fillers evidenced an optimum between 2 and 4%, providing a very high value of flexural strength of 134 MPa, but the stiffness decreased at 6% because of matrix disruptions. In summary, the most promising fillers would be made from coffee regarding stiffness and strength, coconut regarding energy dissipation, and walnut for intermediate mechanical requirements at low concentrations. The conclusions are supported by comprehensive mechanical, thermal, and damping data (Figure 1, Figure 2, Figure 3 and Figure 4 and Figures S1–S12), confirming the potential of agricultural fillers for thermomechanical applications. Such tailoring of the properties makes the fillers suitable for specific advanced composite applications.

Supplementary Materials

The following supporting information can be downloaded at https://www.mdpi.com/article/10.3390/jmmp9090315/s1. Figure S1: The synthesis process for the fabrication of agricultural waste-reinforced polymer composites.; Figures S2–S12: Fabrication procedures, mechanical testing plots, and DMA results.; Table S1: Density data for different mesh sizes and weight composition of CBRPC, CSRPC, and WSRPC; and Table S2: Summary of Dynamic Mechanical Analysis Test.

Author Contributions

Conceptualization, E.K.A. and M.J.; methodology, E.K.A. and A.S.; software, E.K.A. and A.S.; validation, E.K.A., M.J., and P.M.; formal analysis, E.K.A.; investigation, E.K.A., M.J., A.S., and P.M. and G.L.; resources, P.M. and G.L.; data curation, M.J., P.M., and G.L.; writing—original draft preparation, E.K.A. and M.J.; writing—review and editing, M.J., G.L., and P.M.; visualization, E.K.A. and M.J.; supervision, M.J. and P.M.; project administration, P.M.; funding acquisition, P.M. All authors have read and agreed to the published version of the manuscript.

Funding

This work is supported by the US National Science Foundation (NSF) under grant numbers HRD 1736136, OIA-2418415, and OIA-1946231, and the Louisiana Board of Regents for the Louisiana Materials Design Alliance (LAMDA).

Data Availability Statement

Data are available from the corresponding author upon reasonable request. No publicly archived datasets were generated.

Acknowledgments

We thank Kingsley Yeboah for his assistance during this project.

Conflicts of Interest

The authors declare that they have no known competing financial interests or personal relationships that could have appeared to influence the work reported in this paper.

References

  1. Barbero, E.J. Introduction to Composite Materials Design; CRC Press: Boca Raton, FL, USA, 2017. [Google Scholar]
  2. Neher, B.; Mahbubur, M.; Bhuiyan, M.M.R.; Kabir, H.; Qadir, M.R.; Gafur, M.A.; Ahmed, F. Study of Mechanical and Physical Properties of Palm Fiber Reinforced Acrylonitrile Butadiene Styrene Composite. Mater. Sci. Appl. 2014, 5, 39–45. [Google Scholar] [CrossRef]
  3. Abramovich, H. Introduction to composite materials. In Stability and Vibrations of Thin-Walled Composite Structures; Elsevier Ltd.: Haifa, Israel, 2017; pp. 1–47. [Google Scholar]
  4. Clyne, T.W.D.H. An Introduction to Composite Materials; Cambridge University Press: Cambridge, UK, 2019. [Google Scholar]
  5. Zweben, C. Composite Materials. In Mechanical Engineers’ Handbook, 4th ed.; John Wiley & Sons, Inc: Hoboken, NJ, USA, 2014; pp. 1–35. [Google Scholar]
  6. Sharma, A.K.; Bhandari, R.; Sharma, C.; Dhakad, S.K.; Pinca-Bretotean, C. Polymer matrix composites: A state of the art review. Mater. Today Proc. 2022, 57, 2330–2333. [Google Scholar] [CrossRef]
  7. Hamidi, Y.K.; Altan, C.M. 2.5 Process-Induced Defects in Resin Transfer Molded Composites. In Comprehensive Composite Materials II; Elsevier Ltd.: Oxford, UK, 2018; pp. 95–106. [Google Scholar]
  8. Hsissou, R.; Seghiri, R.; Benzekri, Z.; Hilali, M.; Rafik, M.; Elharfi, A. Polymer composite materials: A comprehensive review. Compos. Struct. 2021, 262, 113640. [Google Scholar] [CrossRef]
  9. Kenned, J.J.; Sankaranarayanasamy, K.; Kumar, C.S. Chemical, Biological, and Nanoclay Treatments for Natural Plant Fiber Reinforced Polymer Composites: A Review. Polymers 2021, 29, 1011–1038. [Google Scholar] [CrossRef]
  10. Morampudi, P.; Namala, K.K.; Gajjela, Y.K.; Barath, M.; Prudhvi, G. Review on glass fiber reinforced polymer composites. Mater. Today Proc. 2021, 43, 314–319. [Google Scholar] [CrossRef]
  11. Das, O.; Babu, K.; Shanmugam, V.; Sykam, K.; Tebyetekerwa, M.; Neisiany, R.; Försth, M.; Sas, G.; Gonzalez-Libreros, J.; Capezza, A.J.; et al. Natural and industrial wastes for sustainable and renewable polymer composites. Renew. Sustain. Energy Rev. 2022, 158, 112054. [Google Scholar] [CrossRef]
  12. Omran, A.; Mohammed, A.; Sapuan, S.M.; Ilyas, R.A.; Asyraf, M.R.M.; Koloor, S.; Petrů, M. Micro- and Nanocellulose in Polymer Composite Materials: A Review. Polymers 2021, 13, 231. [Google Scholar] [CrossRef]
  13. Khoo, R.Z.; Chow, W.S.; Ismail, H. Sugarcane bagasse fiber and its cellulose nanocrystals for polymer reinforcement and heavy metal adsorbent: A review. Cellulose 2018, 25, 4303–4330. [Google Scholar] [CrossRef]
  14. Väisänen, T.; Haapala, A.; Lappalainen, R.; Tomppo, L. Utilization of agricultural and forest industry waste and residues in natural fiber-polymer composites: A review. Waste Manag. 2016, 54, 62–73. [Google Scholar] [CrossRef]
  15. Bharath, K.N.; Basavarajappa, S. Applications of biocomposite materials based on natural fibers from renewable resources: A review. Sci. Eng. Compos. Mater. 2016, 23, 123–133. [Google Scholar] [CrossRef]
  16. Naik, S.; Balachandra, H.; Raju, U.G. Investigation of the mechanical properties of tamarind seed particles reinforced epoxy composites. In Proceedings of the Second International Conference on Polymer Composites (ICPC 2018), Surathkal, India, 15–16 December 2018. [Google Scholar]
  17. Prem, C.R.; Ravitej, Y.P.; Shiva Mani Kanta, J.V. Characterization of Banana and Bagesse Fiber-Reinforced Hybrid Epoxy Composites. In Proceedings of the Second International Conference on Polymer Composites (ICPC 2018), Surathkal, India, 15–16 December 2018. [Google Scholar]
  18. Yusup, E.M.; Mahzan, S.; Kamaruddin, M. Natural Fiber Reinforced Polymer for the Application of Sports Equipment using Mold Casting Method. Mater. Sci. Eng. 2019, 494, 012040. [Google Scholar] [CrossRef]
  19. Jaddan, I.; Ghazi, I.; Riyam, I. Thermal Conductivity Characterization of Epoxy Based Composites Reinforced with Date Palm Waste Particles. In Proceedings of the 3rd International Scientific Conference of Engineering Science and Advances Technologies (IICESAT), Babylon, Iraq, 4–5 June 2021. [Google Scholar]
  20. Brahmakumar, M.; Pavithran, C.; Pillai, R.M. Coconut fibre reinforced polyethylene composites: Effect of natural waxy surface layer of the fibre on fibre/matrix interfacial bonding and strength of composites. Compos. Sci. Technol. 2005, 65, 563–569. [Google Scholar] [CrossRef]
  21. Sarki, J.; Hassan, S.B.; Aigbodion, V.S.; Oghenevweta, J.E. Potential of using coconut shell particle fillers in eco-composite materials. J. Alloys Compd. 2011, 509, 2381–2385. [Google Scholar] [CrossRef]
  22. Feni, F.; Jahan, M.; Zhao, R.; Li, G.; Zhao, G.L.; Mensah, P. Multifunctional Composite with Hybrid Carbon Fiber and Carbonaceous Coconut Particle Reinforcement. Front. Mater. 2023, 10, 1278222. [Google Scholar] [CrossRef]
  23. Feni, F.; Jahan, M.; Dawan, F.; Ibekwe, S.; Li, G.; Mensah, P. Enhancing the Mechanical Performance of Carbon Fiber Reinforced Polymer Using Carbonized Coconut Shell Particles. Mater. Today Commun. 2022, 33, 104727. [Google Scholar] [CrossRef]
  24. Hejna, A. Potential applications of by-products from the coffee industry in polymer technology–Current state and perspectives. Waste Manag. 2021, 121, 296–330. [Google Scholar] [CrossRef] [PubMed]
  25. Muhi, T.F.; Nassir, N.A.; Salih, W.M. The effect of coffee beans powder particle additive on the mechanical properties of glass fiber reinforced polymer composite. AIP Conf. Proc. 2024, 3002, 080025. [Google Scholar] [CrossRef]
  26. Gürü, M.; Atar, M.; Yıldırım, R. Production of polymer matrix composite particleboard from walnut shell and improvement of its requirements. Mater. Des. 2008, 29, 284–287. [Google Scholar] [CrossRef]
  27. Sivakumar, A.; Srividhya, S.; Prakash, R.; Subbarayan, M.R. Exploring the effects of eco-friendly and biodegradable biocomposite with PLA incorporating eggshell and walnut powder as fillers. Glob. NEST J. 2024, 26, 05471. [Google Scholar]
  28. ASTM D2584-18; Standard Test Method for Ignition Loss of Cured Reinforced Resins. ASTM International: West Conshohocken, PA, USA, 2018.
  29. ASTM E11-17; Standard Specification for Woven Wire Test Sieve Cloth and Test Sieves. ASTM International: West Conshohocken, PA, USA, 2017.
  30. Abedin, R.; Konlan, J.; Feng, X.; Mensah, P.; Li, G. A hybrid shape memory polymer filled metallic foam composite: Shape restoring, strain sensing, Joule heating, strengthening, and toughening. Smart Mater. Struct. 2022, 31, 095009. [Google Scholar] [CrossRef]
  31. ASTM D3763-18; Standard Test Method for High Speed Puncture Properties of Plastics Using Load and Displacement Sensors. ASTM International: West Conshohocken, PA, USA, 2023.
  32. ASTM D790; Standard Test Methods for Flexural Properties of Unreinforced and Reinforced Plastics and Electrical Insulating materials. ASTM International: West Conshohocken, PA, USA, 2017.
  33. Chowdhury, R.A.; Hosur, M.V.; Nuruddin, M.; Tcherbi-Narteh, A.; Kumar, A.; Boddu, V.; Jeelani, S. Self-healing epoxy composites: Preparation, characterization and healing performance. J. Mater. Res. Technol. 2015, 4, 33–43. [Google Scholar] [CrossRef]
  34. Khanna, A.S.; Narayani, R. Effect of Methyltrimethoxy Silane Modification on Yellowing of Epoxy Coating on UV (B) Exposure. J. Coat. 2014, 2014, 515470. [Google Scholar]
  35. Li, G.; Chakka, V.S. Isogrid stiffened syntactic foam cored sandwich structure under low-velocity impact. Compos. Part A Appl. Sci. Manuf. 2010, 41, 177–184. [Google Scholar] [CrossRef]
  36. Konlan, J.; Mensah, P.; Ibekwe, S.; Li, G. A laminated vitrimer composite with strain sensing, delamination self-healing, deicing, and room-temperature shape restoration properties. J. Compos. Mater. 2022, 56, 2267–2278. [Google Scholar] [CrossRef]
Scheme 1. The synthesis process for the fabrication of agricultural waste reinforced polymer composites.
Jmmp 09 00315 sch001
Figure 2. (A) FT-IR spectra of DGEBA, curing agent, pure polymer, and as-synthesized polymer composites; TGA analysis of the pure polymer with (B) different wt.% of CSRPC, (C) different wt.% of CBRPC, and (D) different wt.% of WSRPC.
Jmmp 09 00315 g002
Figure 3. (A) Representative load, energy against time of Glass fiber/CSRPC at different weight compositions of coconut particles; Crack initiation energy (CIE) and peak load (PL) of (B) Glass fiber/CSRPC, (C) Glass fiber/CBRPC, and (D) Glass fiber/WSRPC.
Jmmp 09 00315 g003
Figure 4. SEM micrograph of as-impacted laminates: (A) Control, (B) Glass fiber/CBRPC, (C) Glass fiber/CSRPC, and (D) Glass fiber/WSRPC.
Jmmp 09 00315 g004
Disclaimer/Publisher’s Note: The statements, opinions and data contained in all publications are solely those of the individual author(s) and contributor(s) and not of MDPI and/or the editor(s). MDPI and/or the editor(s) disclaim responsibility for any injury to people or property resulting from any ideas, methods, instructions or products referred to in the content.