1. Introduction
Single point incremental sheet forming (SPIF) is a flexible and cost-effective manufacturing technique that shapes sheet metal through localized, incremental deformation, offering distinct advantages over conventional forming processes. Unlike traditional die-based forming, SPIF eliminates the need for dedicated tooling by employing a CNC-controlled forming tool, thereby reducing setup time and cost [
1,
2]. This makes SPIF particularly well-suited for prototyping and low-volume production where adaptability and rapid design iterations are crucial. In addition to process flexibility, SPIF accommodates complex geometries and offers enhanced formability, especially in materials that are otherwise challenging to shape using conventional methods [
3]. These benefits have contributed to the growing interest in SPIF within the metal forming community, positioning it as an emerging transformative manufacturing technique [
4].
Despite its advantages, SPIF faces significant challenges, including thinning, springback, and fracture, which affect the accuracy, formability, and structural integrity of formed components [
5]. Thinning, which refers to the reduction in sheet thickness, occurs due to localized deformation during incremental forming. This phenomenon is a primary concern as excessive thinning compromises the mechanical strength of the component, increasing the risk of premature failure and limiting its suitability for precision applications [
6]. Another major challenge is springback, an elastic recovery effect that causes deviation from the intended geometry, reducing dimensional accuracy [
7]. Additionally, fracture is a common issue in SPIF, occurring when the material exceeds its forming limit, ultimately leading to failure [
8]. Recent work by López-Fernández et al. provides a comprehensive evaluation of fracture mechanisms in SPIF, emphasizing current modeling and prediction strategies [
9]. Additionally, other process-induced defects, such as wrinkling, though less frequently emphasized, can arise in unsupported regions or under complex boundary conditions. This mechanism further affects surface quality and process stability. Addressing these failure mechanisms holistically is essential for developing robust and predictable ISF processes. Among these, thinning is of particular concern in industrial applications where uniform thickness and structural reliability are essential [
10]. Therefore, controlling thinning is crucial to ensure that the final product retains adequate mechanical properties and structural integrity. A comprehensive understanding of thinning behavior in SPIF is necessary to enhance its feasibility as a manufacturing method. The work herein focuses on the control of thinning to minimize material loss and enhance component durability.
SPIF outcomes are highly sensitive to process parameters. Therefore, by optimizing key process parameters such as step size, wall angle, and tool diameter can lead to improved part quality and reliability [
11]. This study focuses on step size and wall angle due to their predominant role in altering strain distribution and deformation depth across the sheet [
12]. While the influence of other parameters on SPIF performance is acknowledged, they are excluded from this study to maintain a focused scope and minimize confounding variables. Future work may expand on these additional factors.
Both experimental and numerical approaches play a critical role in accurately assessing thinning behavior in SPIF. Experimental trials provide essential insights into forming forces, thickness variations, and failure mechanisms, which are vital for refining and validating finite element analysis (FEA) models [
7]. While FEA offers a cost-effective and time-efficient method for predicting material deformation and thinning distribution under various process conditions, it relies on assumptions about material properties, boundary conditions, and numerical techniques, which can introduce discrepancies. Therefore, experimental validation is essential to ensure the accuracy and reliability of the simulation results [
8]. By combining numerical simulations with experimental data, process parameters can be optimized to reduce material waste, improve forming efficiency, and enhance the overall reliability of SPIF.
Thinning behavior of various metal alloys, including AA5052 (magnesium-based) [
13], AA7075 (zinc-based) [
14], DC04 steel [
11], and Ti-6Al-4V [
15], has been studied in SPIF. However, prior work has not sufficiently addressed how manganese-based aluminum alloys (e.g., AA3003) respond to incremental deformation under changing process conditions, creating an opportunity to explore its behavior in greater depth. The research herein investigates the thinning behavior of aluminum alloy AA3003-H14, a commercially pure, non-heat-treatable alloy widely used in automotive, architectural, and food processing applications due to its excellent formability, corrosion resistance, and cost-effectiveness [
16]. Specifically, the present study aims to gain deeper insight into how wall angle and step size influence localized thinning in AA3003 during SPIF.
Motivated by the need to improve thinning prediction and optimize SPIF for industrial adoption, the study combines experimental analysis and numerical simulations (FEA) to investigate the thinning behavior of AA3003 under controlled process variations. When properly validated, FEA can serve as a reliable predictive tool that reduces or eliminates the need for repeated physical experiments, ultimately lowering cost, reducing material waste, and accelerating industrial implementation. Thus, numerical simulations are conducted in ANSYS 2024 [
17] and validated against experimental results to ensure model accuracy. The outcomes of this research will contribute to refining SPIF process models, optimizing key parameters, and supporting the transition of SPIF from laboratory-scale research to standardized industrial applications.
The remainder of this paper is organized as follows.
Section 2 reviews the prior related work, focusing on studies that address thinning behavior in SPIF across various materials and process conditions.
Section 3 details the analysis methodology, including material selection, experimental design, and numerical modeling approach.
Section 4 presents and discusses the results from the experiments, statistical analysis, and finite element simulations, examining the influence of wall angle and step size on thinning. This section also includes a comparative analysis of experimental findings and simulation outputs to validate accuracy of the FEA model. Finally,
Section 5 concludes the paper by summarizing the key findings and proposing future research directions aimed at improving SPIF predictability and expanding its industrial applications.
2. Prior Related Work
Numerous studies have addressed the mechanical challenges in SPIF, particularly focusing on thinning, springback, and fracture. Among them, thinning has remained a primary concern due to its direct impact on part integrity and performance [
18]. Thinning refers to the decrease in the thickness of material that occurs during forming. Researchers have explored both experimental and numerical approaches to understand and mitigate this phenomenon across various materials and geometries [
19,
20]. A major focus has been on identifying how SPIF process parameters such as tool diameter, step size, tool path, and wall angle influence thickness distribution.
For example, tool (tip) diameter has been shown to directly influence the contact area and strain distribution in SPIF. Larger diameters improve thickness uniformity but may increase global thinning, while smaller tools concentrate strain and lead to localized thinning. Prior studies have demonstrated this dynamic using FEA, validating predictive models through experimental results [
6,
21,
22]. Similarly, step size, defined as the vertical increment between tool passes, was found to significantly affect thinning rates. Mohammadi et al. [
23] and Bahloul et al. [
24] used FEA and optimization techniques such as response surface methodology (RSM) and genetic algorithms to demonstrate how smaller step sizes reduce thinning at the cost of process time. Tool path strategy is another critical factor influencing thinning. Esmaeilpour et al. [
25] and Nirala and Agrawal [
26] compared spiral, Z-level, and fractal paths, showing how different toolpaths lead to better strain distribution and reduced localized thinning. These studies underscore the importance of tool trajectory design in controlling thinning. The influence of wall angle on thinning behavior has also been extensively studied. Research by Han and Mo [
27], Mulay et al. [
28], and Arfa et al. [
7] revealed that steeper wall angles are associated with increased thinning due to localized stress accumulation. Adjustments to these angles which are validated by simulation have been shown to improve thickness retention.
Material characteristics, particularly plasticity, anisotropy, and strain-hardening behavior have also been shown to govern thinning. Studies by Esmaeilpour et al. [
14] and Barnwal et al. [
29] emphasized the importance of incorporating accurate material behavior for AA6061 and AA7075 in numerical simulations. Research by Mohanraj and Elangovan [
15] and Thakur and Chauhan [
30], demonstrated that steep wall angles and feature complexity, such as perforations, exacerbate thinning in Ti-6Al-4V and Grade-2 titanium sheets. Similarly, Mulay et al. [
28] and Jun-chao et al. [
31] highlighted that both wall angle and step size significantly influence thinning behavior in these materials. Beyond core parameters, friction and lubrication also play a key role in material thinning. Yamashita et al. demonstrated how higher friction coefficients promote strain uniformity [
32].
Previous studies have investigated AA3003 in the context of incremental sheet forming, focusing on aspects such as process optimization, deformation force prediction, and thinning behavior. Murugesan et al. [
33] applied the Taguchi method to optimize forming parameters and examine thinning in AA3003-H18. Oraon et al. [
34] developed predictive models for forming force using statistical and neural network approaches. Benmessaoud et al. [
8] combined finite element simulation with experimental validation to analyze thickness distribution and failure in AA3003-H12 under pyramidal SPIF. Bahloul et al. [
24] and Arfa et al. [
7] studied thinning, punch force, and tool path strategies for truncated cone geometries using AA3003. Coman et al. [
35] presented an experimental study on force variation, surface quality, and ANOVA-based analysis for AA3003 in SPIF using TiN-coated tools. While these studies provide valuable insights into AA3003 behavior under various conditions, detailed experimental and numerical analysis of localized thinning behavior in AA3003-H14 particularly under varying wall angles and step sizes at different depths remains unreported. The present study addresses this gap by offering a coupled experimental–numerical investigation of thickness evolution during SPIF of AA3003-H14.
3. Materials and Methods
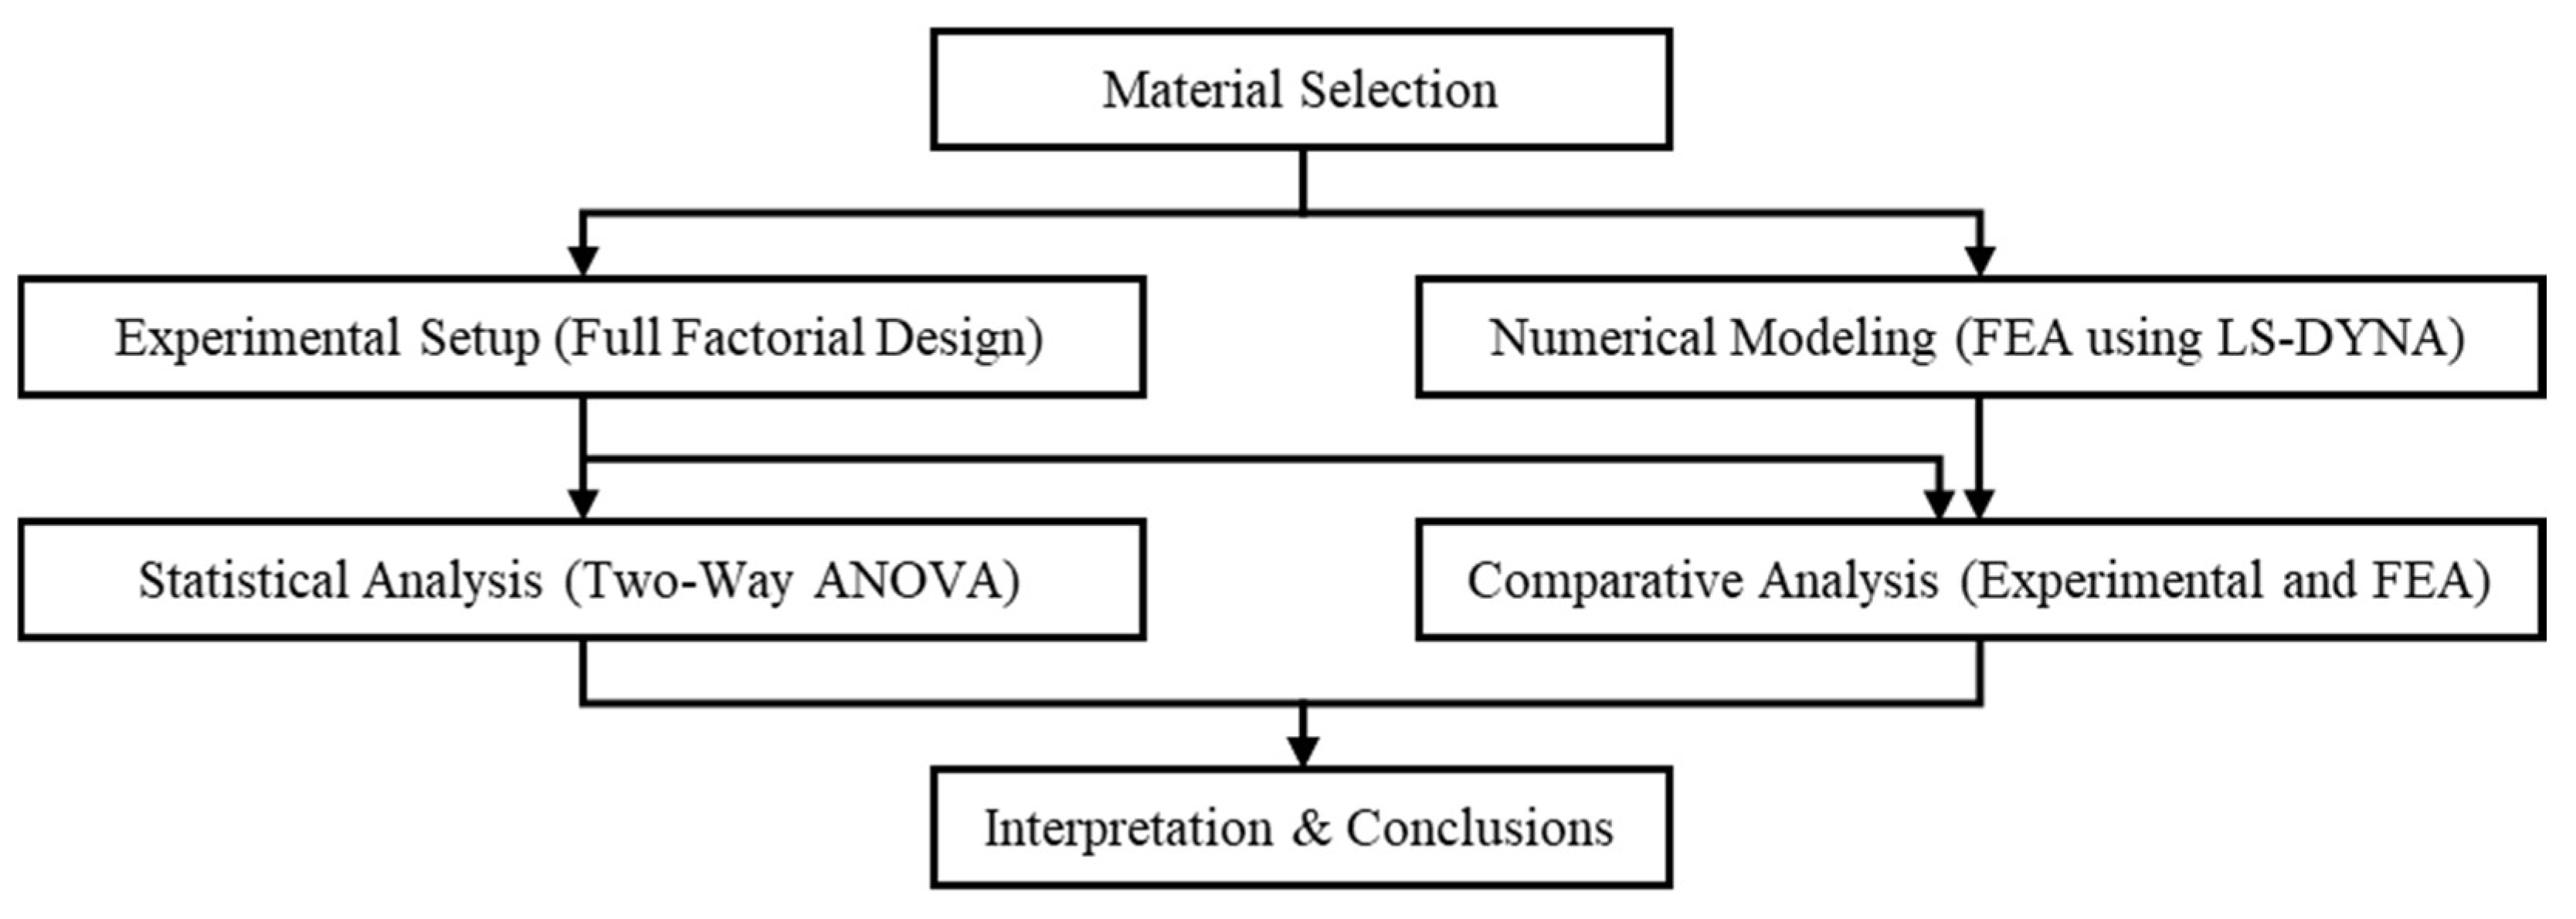
This study adopts a systematic approach that combines both experimental and numerical methods to examine the thinning behavior of sheet metal in SPIF, supporting broader adoption across a range of industries. First, a suitable sheet material is selected based on its industrial relevance and mechanical properties. Next, a full factorial experimental design is employed to investigate the effects of varying wall angles and step sizes on thinning. In parallel, finite element simulations are carried out using LS-DYNA to model the deformation behavior and predict thickness distribution. To ensure the accuracy of the numerical model, simulation results are validated against experimental measurements. Additionally, statistical analyses are performed on experimental data to evaluate the significance and interaction effects of the process parameters. This integrated methodology provides a framework for analyzing and predicting thinning in SPIF applications. The overall workflow of the study is illustrated in
Figure 1.
3.1. Material Selection
For broad applications of SPIF across automotive, architectural, food processing, and other industries, ease of shaping, durability, and cost-effectiveness are essential material considerations. AA3003 is a commercially pure, non-heat-treatable aluminum-manganese aluminum alloy known for its excellent formability, moderate strength, and high corrosion resistance [
16]. Its high ductility allows it to undergo substantial plastic deformation without cracking, making it particularly suitable for forming complex geometries typical in SPIF. Thus, AA3003-H14 sheet with a thickness of 1 mm was selected for this study.
Despite its industrial relevance, relatively few studies have focused on the application of AA3003 in SPIF. This study seeks to address this gap by evaluating the thinning behavior of AA3003 under different forming conditions, thereby contributing to the characterization of its formability in SPIF applications. The key mechanical and chemical properties of the AA3003-H14 aluminum alloy used in this study are summarized in
Table 1.
This work addresses a notable gap in SPIF research, as AA3003 remains underexplored compared to other common industrial materials. This study aims to provide practical insights into the performance of AA3003-H14 in SPIF and to support the development of more reliable, material-specific predictive models.
3.2. Experimental Setup
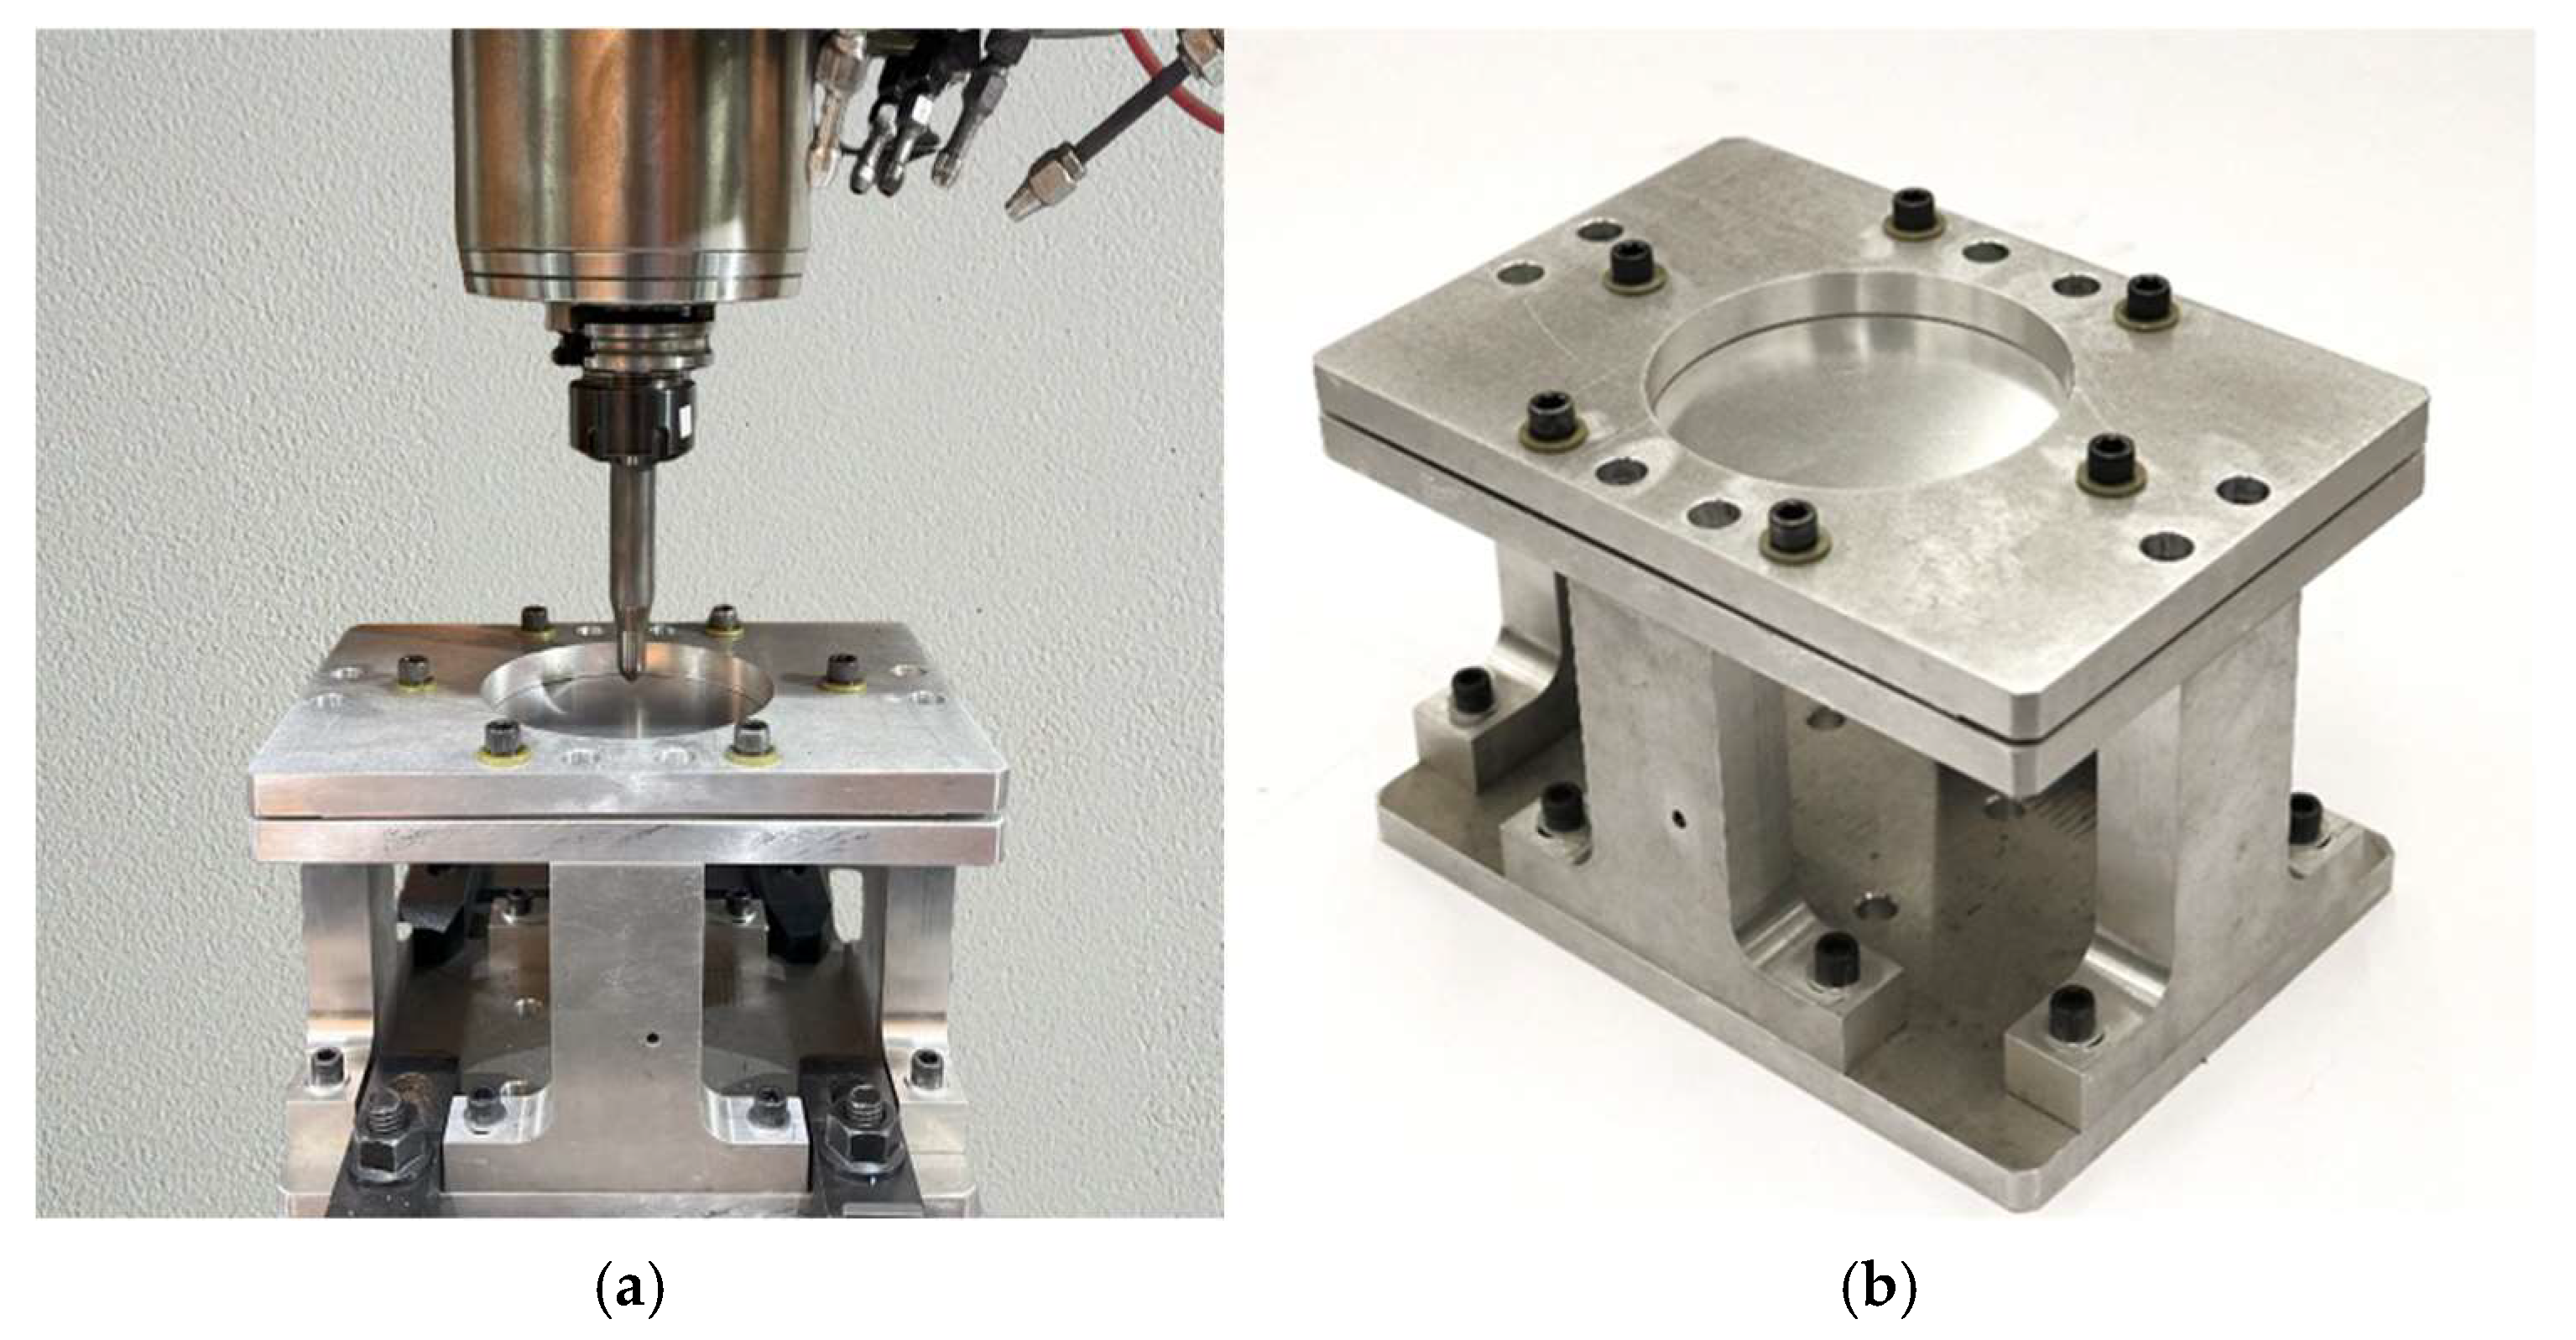
The experiment was carried out using a Haas VF-2 three-axis CNC milling machine [
36], equipped with a 12 mm diameter cylindrical tool featuring a hemispherical head made of tool steel. The forming setup, including the CNC machine and the custom-built clamping fixture, is shown in
Figure 2. The aluminum sheet was securely clamped, and a conical spiral tool path, generated in Fusion 360 [
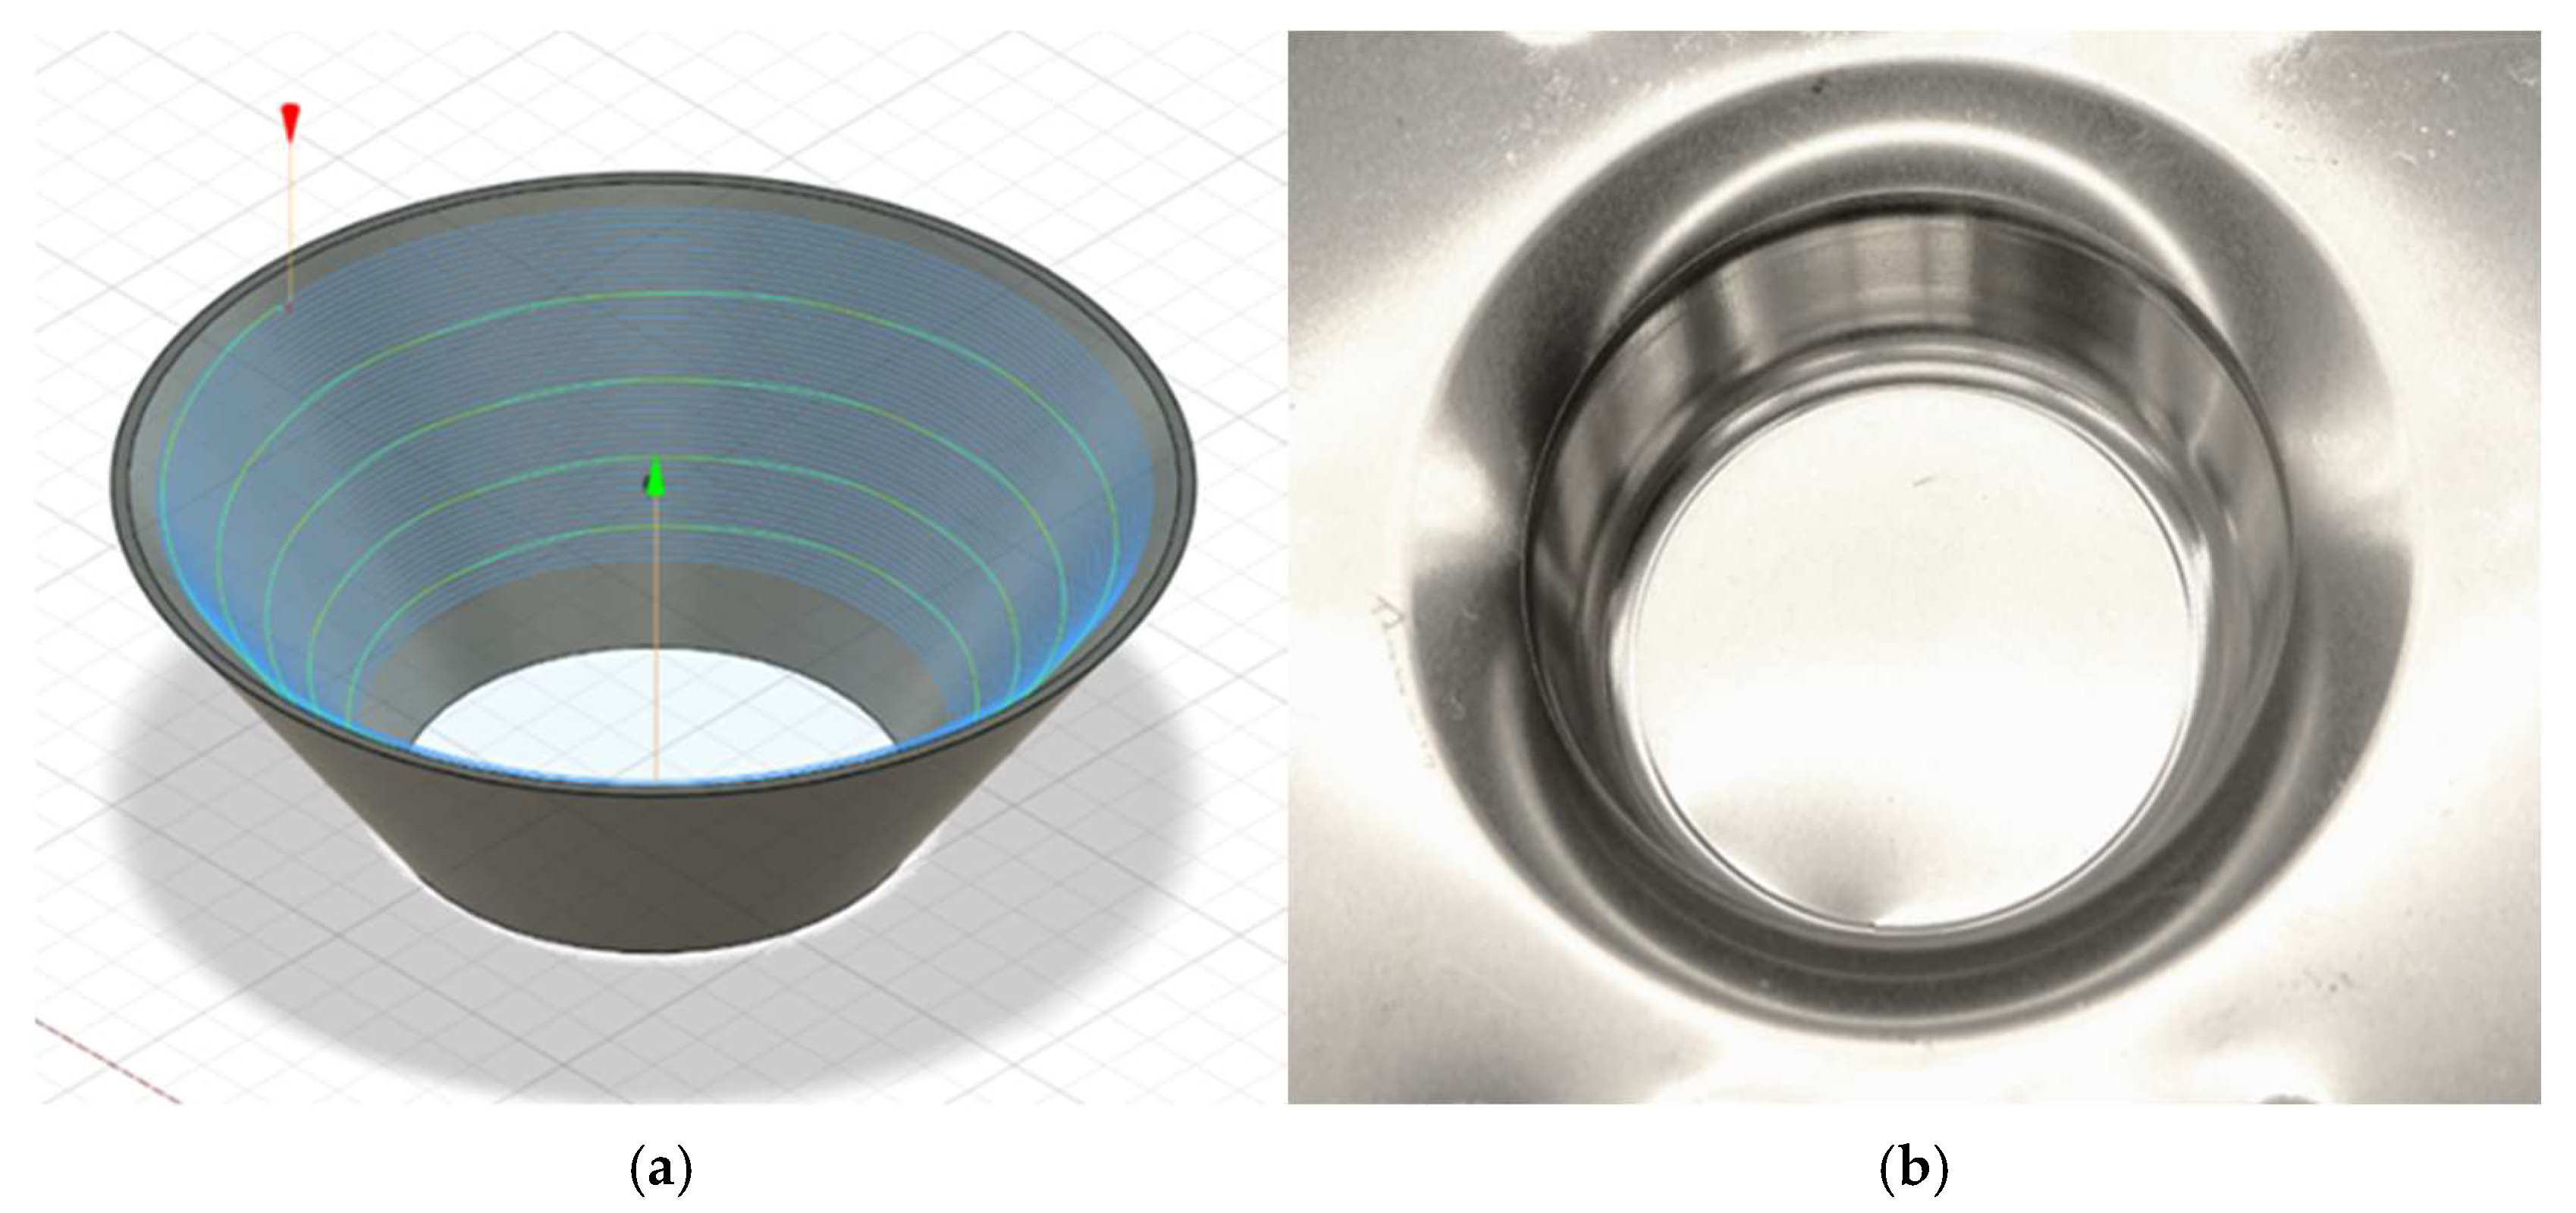
37], was utilized to form a cone-shaped geometry.
Figure 3 shows both the conical tool path from Fusion 360 and the experimentally formed part. To reduce friction and minimize tool wear, Mobil DTE™ Light lubricant [
38] was applied during the forming process.
A full factorial design was implemented to systematically analyze the effects of wall angle and step size on thinning behavior in SPIF. The combinations of wall angles and step sizes used in this study are summarized in
Table 2. The number of experiments (nine) was determined using a 3 × 3 full factorial design. This experimental design ensures a comprehensive evaluation of the interaction between these two factors.
Greater wall angles lead to increased material stretching and greater thinning. Arfa et al. reported that wall angles of 45°, 60°, and 70° resulted in progressive thinning, with failure typically occurring at 70° [
7]. Based on these findings, wall angles of 45°, 55°, and 65° were selected to systematically examine this effect while maintaining a balance between thinning and failure.
Larger step sizes reduce forming time but lead to increased thinning, whereas smaller step sizes improve thickness reduction at the cost of longer processing times. Benmessaoud demonstrated that step sizes ranging from 0.2 mm to 0.75 mm effectively capture variations in thinning behavior [
8].
Therefore, step sizes of 0.25 mm, 0.50 mm, and 0.75 mm were selected to investigate this trend. All experimental combinations were completed in a random order to eliminate systematic bias. Random numbers were generated using a uniform distribution (X ~ U(0,1)) for each trial, followed by ranking to assign the experimental sequence.
3.3. Numerical Setup
The FEA in this study was conducted using explicit dynamic simulations in LS-DYNA, which is effective for modeling SPIF due to its capability to capture large plastic deformations and complex contact behavior [
39]. The tool path was generated in MATLAB (R2025a) Online to enable precise incremental control and was imported into LS-DYNA via a key file. The model geometry and mesh were prepared in ANSYS Workbench and post-processed in LS-PrePost for simulation and analysis (
Figure 4).
In the model, the forming tool was defined as a rigid body with prescribed displacement in X, Y, and Z directions. The AA3003-H14 aluminum sheet was modeled as a deformable body using solid-shell elements (ELFORM = 18 in LS-DYNA), offering a balance between computational efficiency and through-thickness accuracy. A structured quadrilateral mesh with 17,248 nodes and 17,014 elements was used. Material properties were defined based on standard data for AA3003-H14, using an isotropic von Mises yield criterion. Although the material is known to exhibit anisotropy due to cold rolling, the isotropic assumption was adopted as for valid simplification of this study consistent with prior SPIF modeling approaches where acceptable predictive accuracy was achieved despite the simplification [
40]. Contact between the tool and sheet was defined using a surface-to-surface forming contact algorithm with a friction coefficient of 0.1. The sheet edges were fully constrained to replicate experimental clamping conditions. Time integration was controlled using LS-DYNA’s automatic time-stepping procedure, with an initial timestep and scale factor selected to ensure stability throughout the forming process.
A mesh sensitivity analysis was conducted using three element sizes: 0.8 mm, 1.0 mm, and 1.2 mm. While the 0.8 mm mesh yielded the lowest error, it significantly increased computation time. Conversely, the 1.2 mm mesh reduced computation time but introduced greater thickness prediction error. A 1.0 mm element size was selected as the optimal compromise, ensuring thickness predictions within 3% variation between refinement levels while maintaining computational efficiency. Numerical model outputs including thickness distribution, plastic strain, and von Mises stress were used to investigate deformation and were validated against experimental data.
4. Results and Discussion
This section presents a comprehensive analysis of thinning behavior in SPIF through experimental observations, numerical simulations, and statistical evaluations. It also includes a comparative assessment between experimental and numerical results to validate the accuracy of the model.
4.1. Experimental Findings
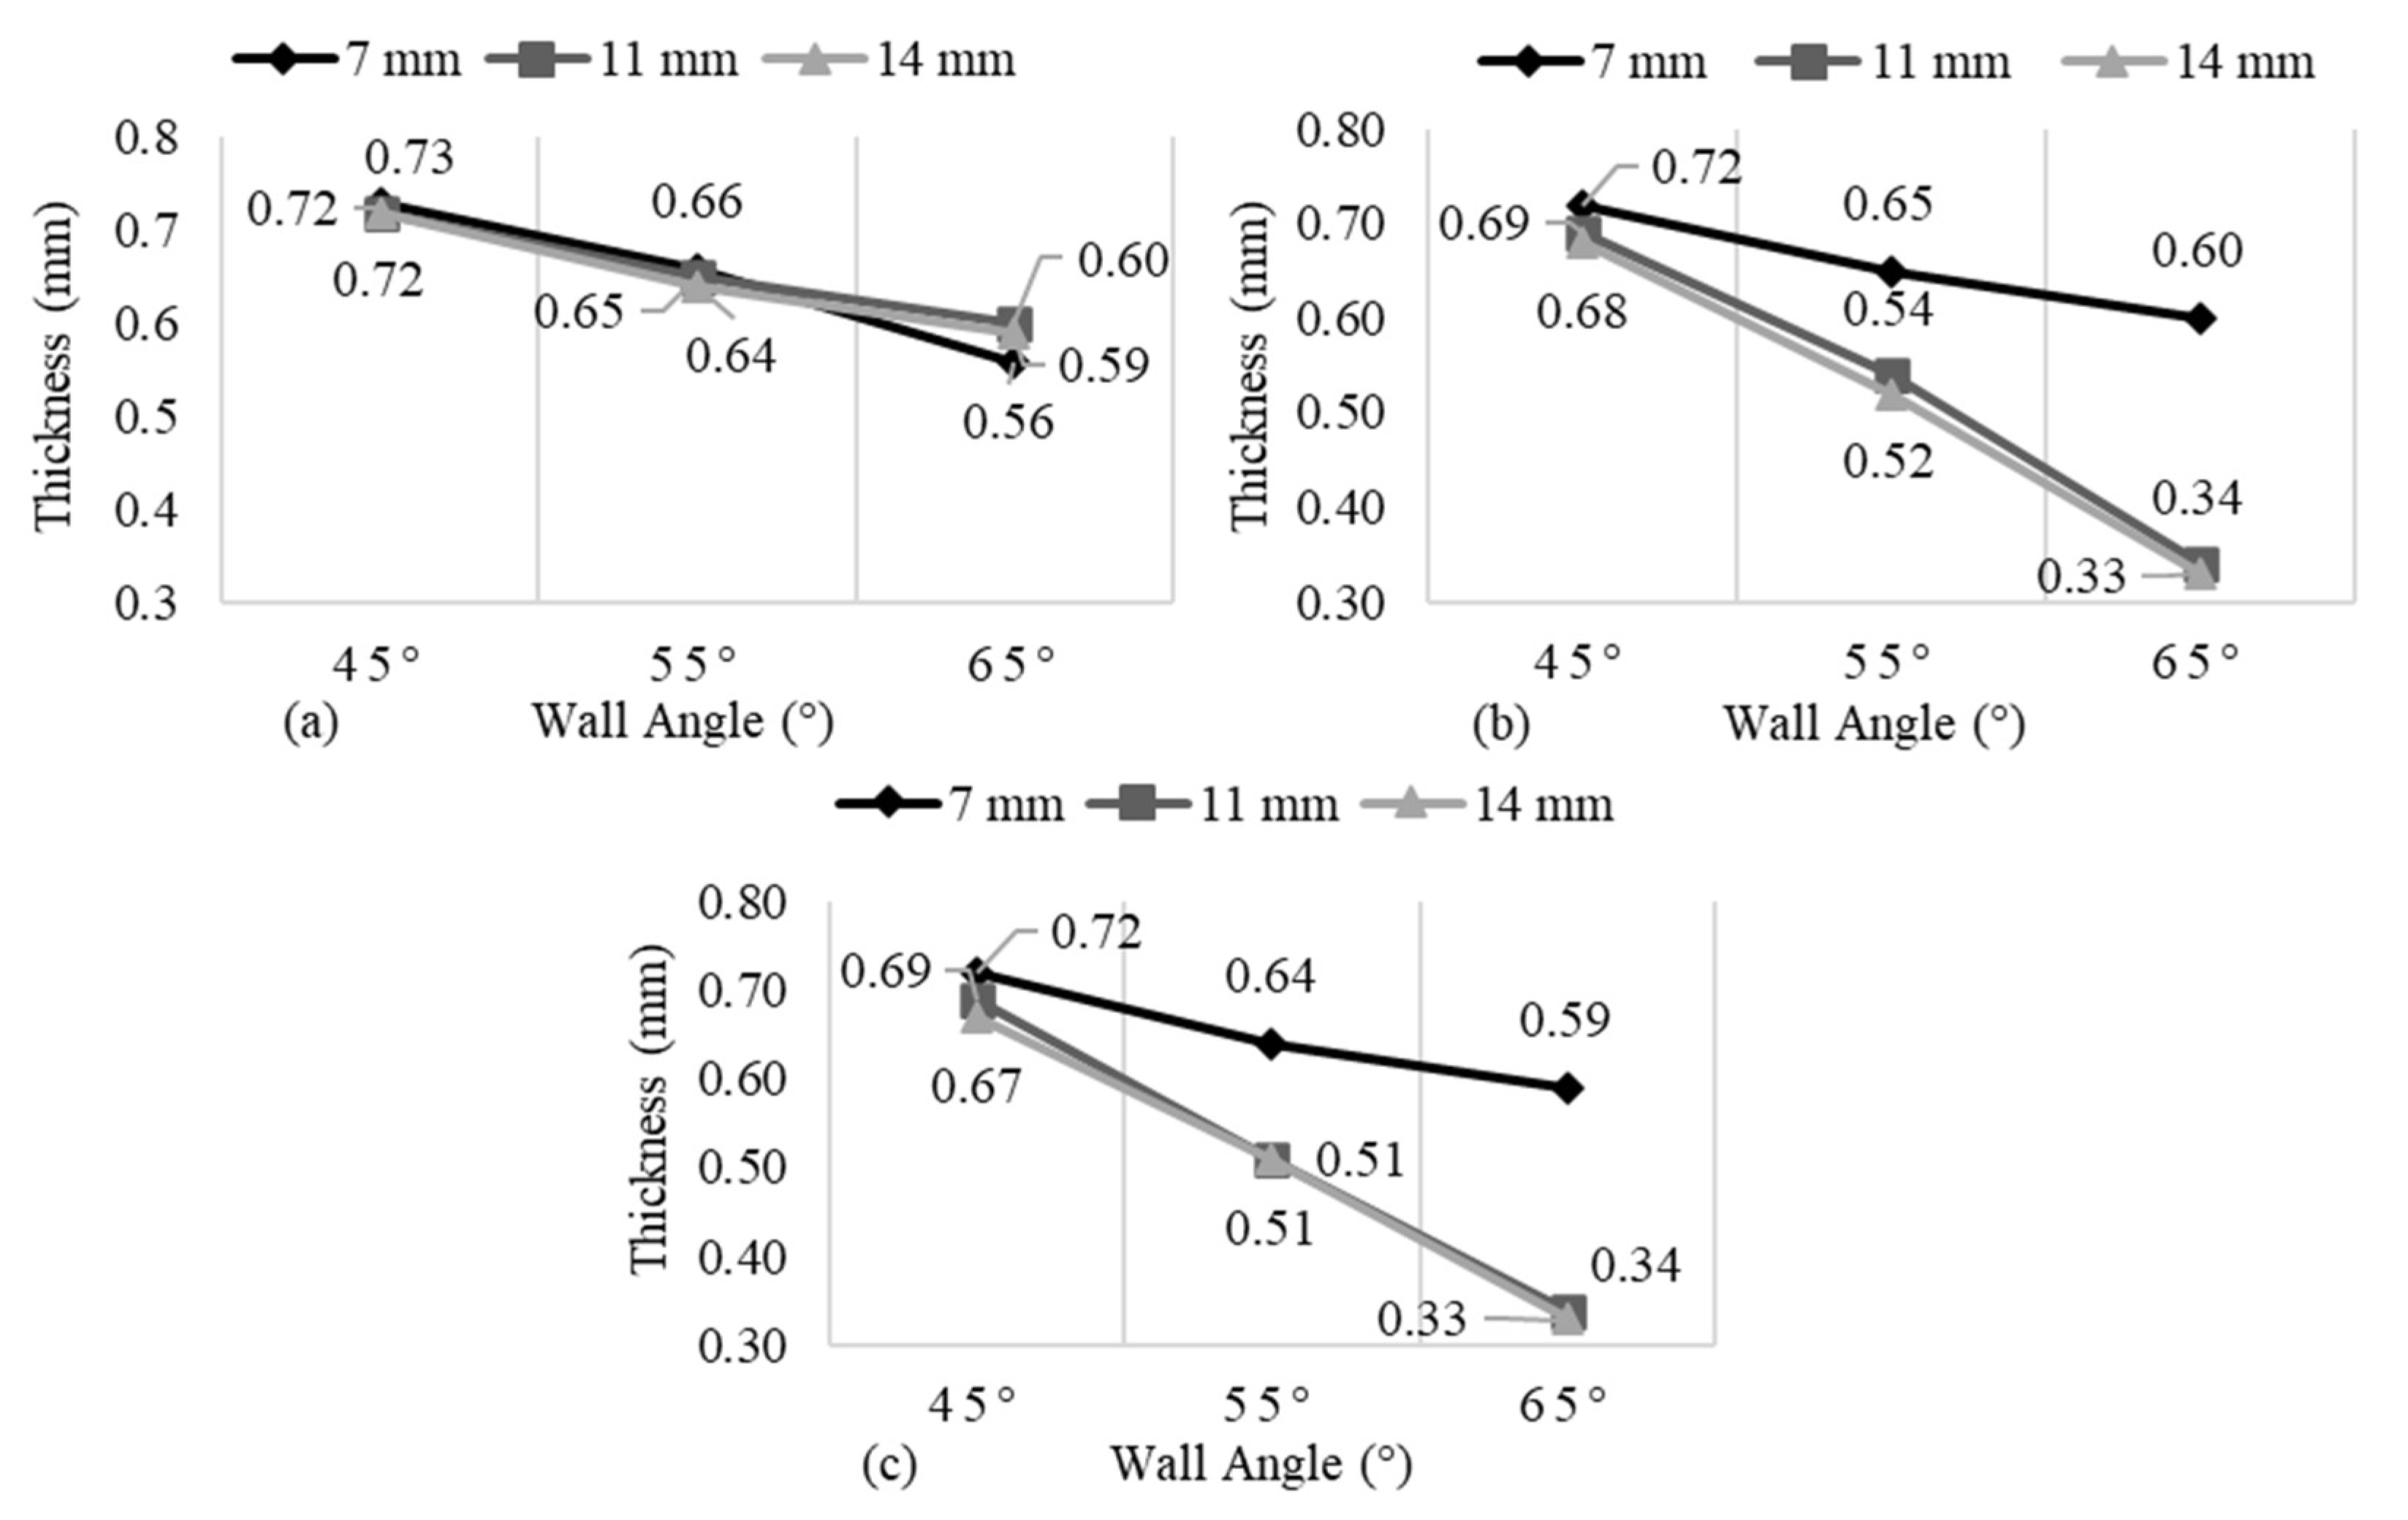
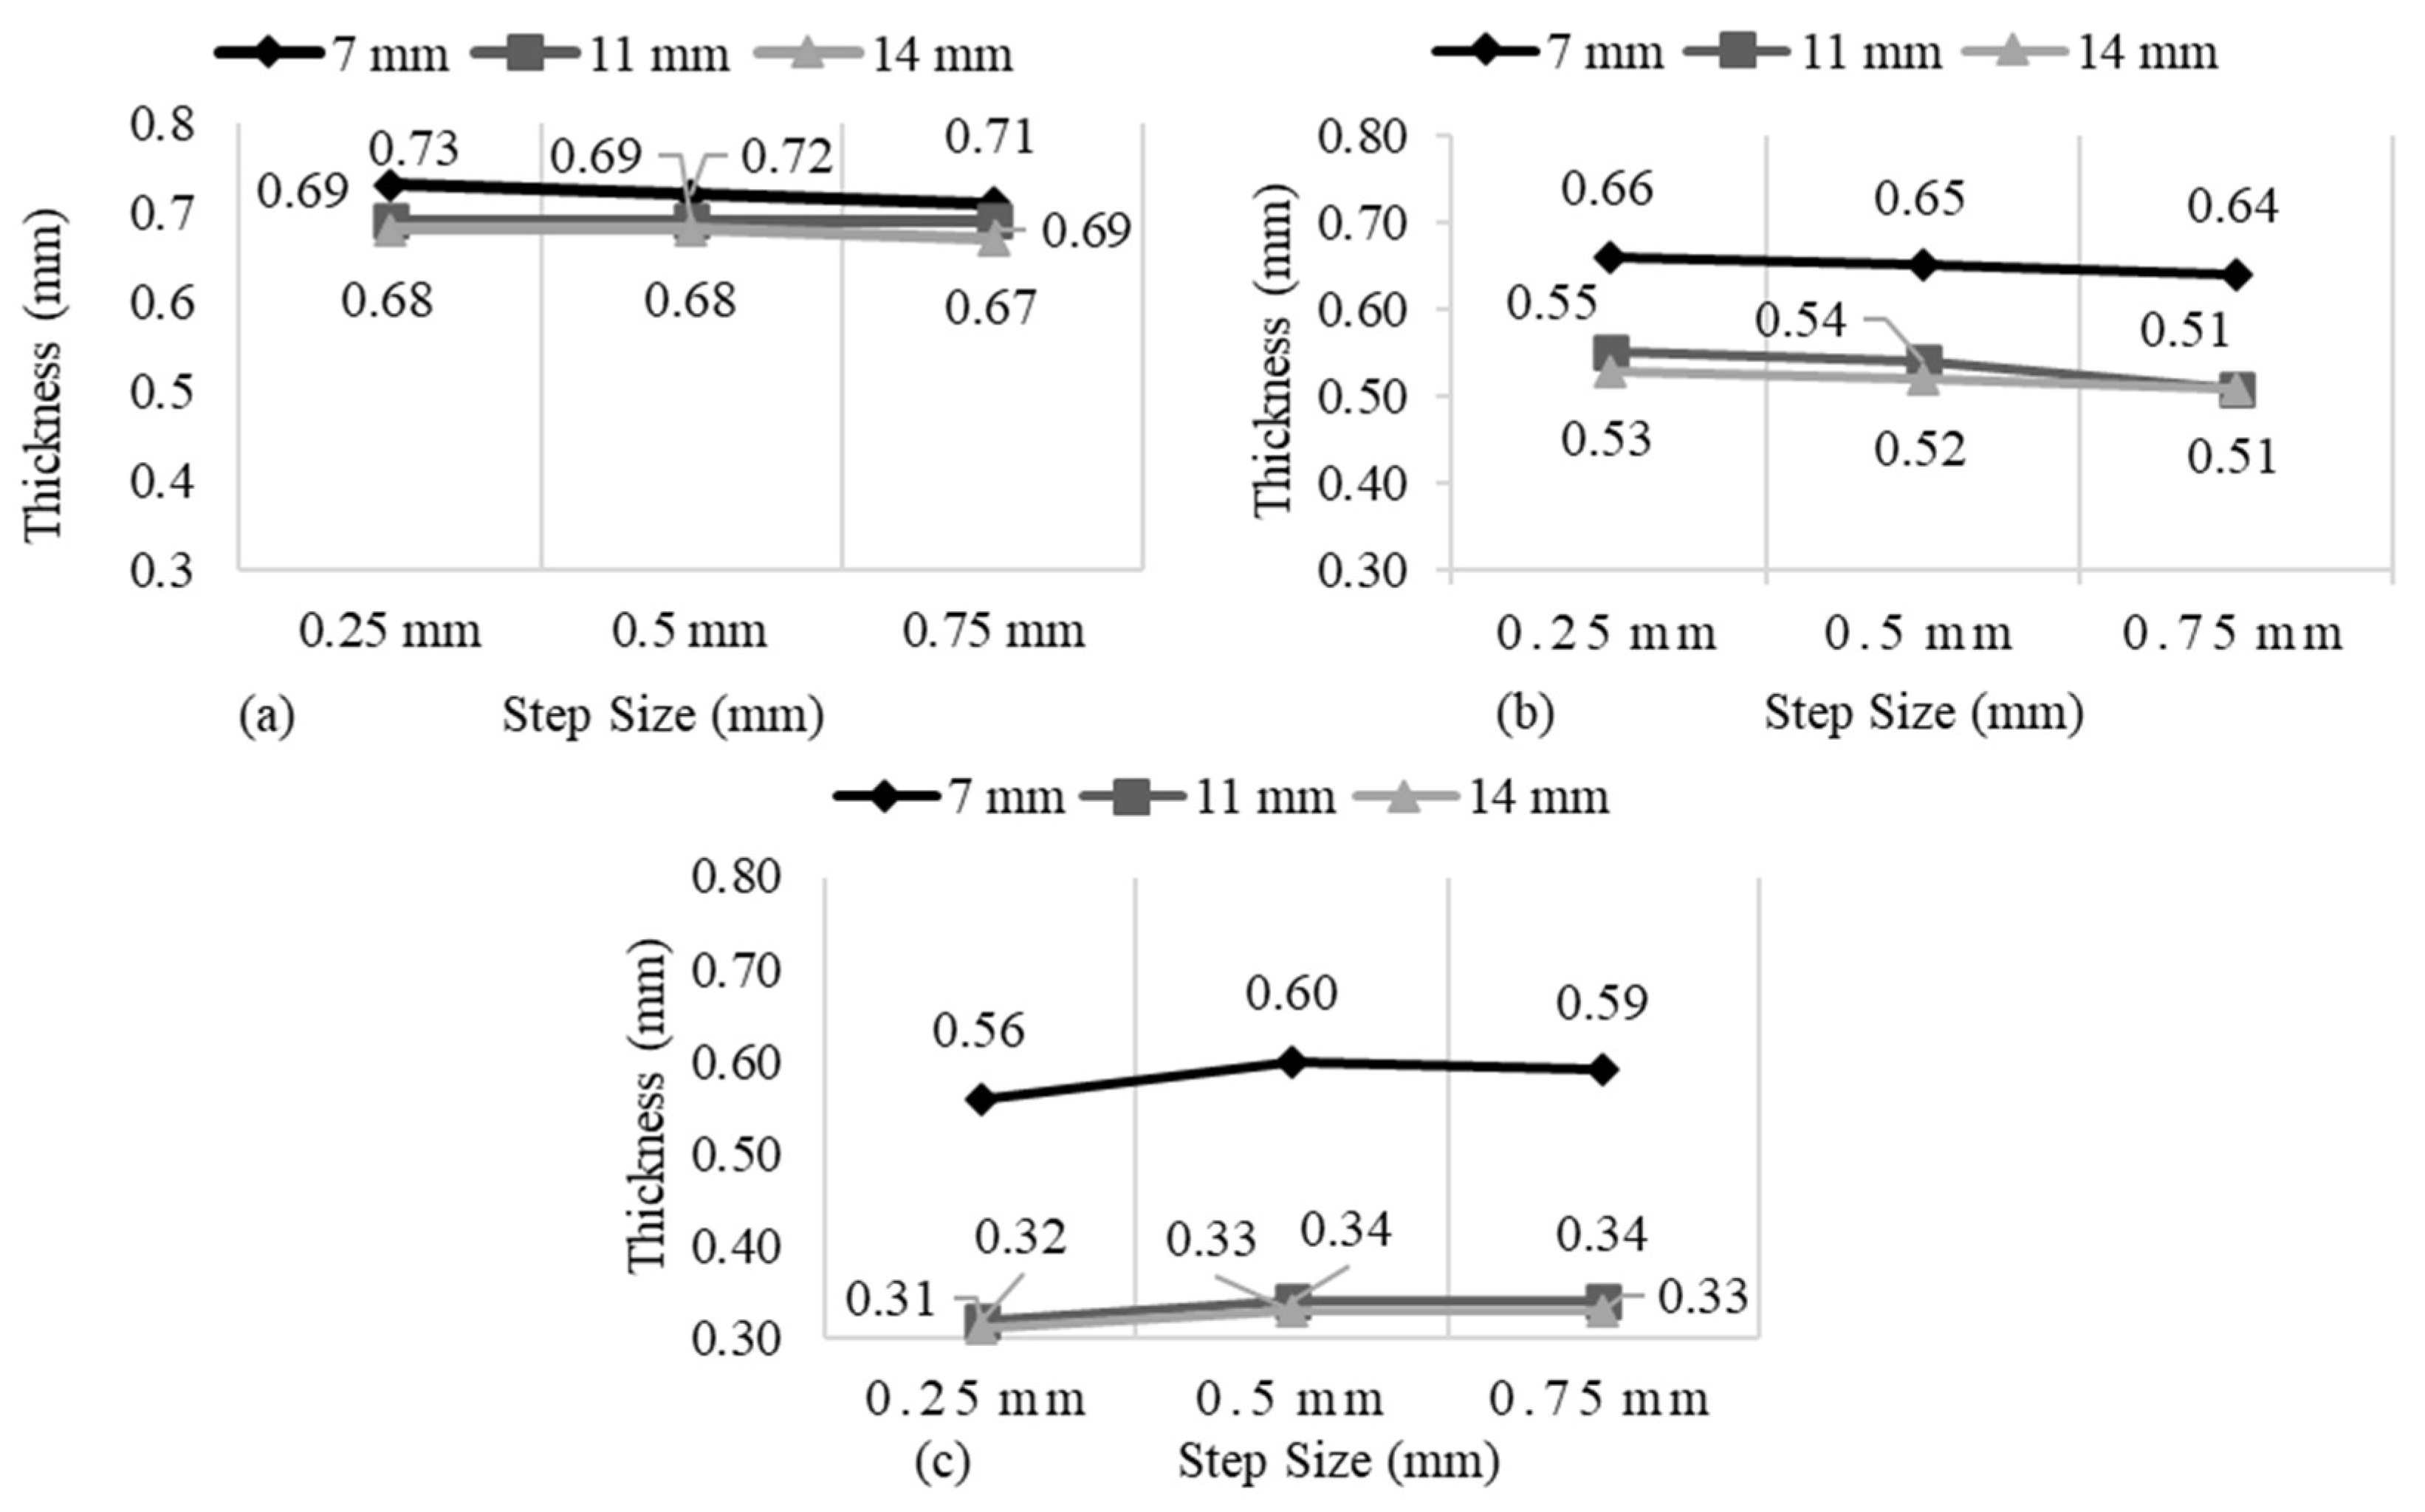
The experimental study was conducted to evaluate thinning behavior in SPIF under varying process parameters. A total of nine experiments were conducted with three replications each, ensuring the reliability of the results. In total, 27 experiments were performed to investigate the effect of wall angle and step size on thinning behavior. Thickness was measured using a point micrometer at three forming depths (7 mm, 11 mm, and 14 mm along the wall from the cone opening) to evaluate the distribution of thinning across the formed parts. Three thickness measurements were taken along the circumference at each forming depth. The average thickness for each location is reported in
Figure 5 and
Figure 6, indicating a clear relationship between wall angle and step size on thinning behavior.
Thinning behavior is significantly influenced by the wall angle. Larger wall angles lead to higher thinning due to increased strain and stress. In
Figure 5a, for a 0.25 mm step size, the influence of wall angle on thickness reduction is evident, though the magnitude of thinning remains moderate compared to higher step sizes. At all three forming depths (7 mm, 11 mm, and 14 mm), a consistent decrease in thickness is observed with increasing wall angle. The most substantial reduction occurs at a depth of 7 mm, where thickness decreases by approximately 23.3% when increasing wall angle from 45° to 65°. At depths of 11 mm and 14 mm, the reductions remain substantial, around 16.7% and 18.1%, respectively. These results suggest thinning intensifies with wall angle. Intuitively, lower wall angles would promote more uniform strain distribution and reduced stretching, as corroborated by these findings. In contrast, more pronounced thinning at larger wall angles reflect increasing strain concentration and localized deformation as forming proceeds.
Figure 5b, for a 0.50 mm step size, reveals more pronounced thinning as wall angle increases. At a depth of 7 mm, the change in thinning with increasing wall angle is similar to that observed in
Figure 5a. At depths of 11 mm and 14 mm, thinning becomes significantly more severe, showing thickness reductions of 50.7% and 51.5%, respectively, when wall angle increases from 45° to 65°. These dramatic changes indicate that moderate increases in wall angle can lead to critical thinning when combined with larger forming depths.
Figure 5c, for a 0.75 mm step size, demonstrates the most severe thinning across all conditions. The trend follows a similar pattern to the smaller step sizes, but with generally lower retained thickness. At a depth of 7 mm, thinning increases by 18.1% with an increase in wall angle from 45° to 65°. However, at depths of 11 mm and 14 mm, the thinning again reduces by 50.7%. This suggests that at larger step sizes, wall angle becomes a dominant factor in thinning severity, especially when forming deeper sections typical of SPIF. The near-identical thinning percentages at 11 mm and 14 mm for both 0.50 mm and 0.75 mm step sizes imply a threshold beyond which wall angle becomes a dominant factor in controlling thinning.
Step size also influences the thinning behavior of SPIF. To analyze the influence of step size on thinning, this section examines how varying incremental depths impact thickness reduction.
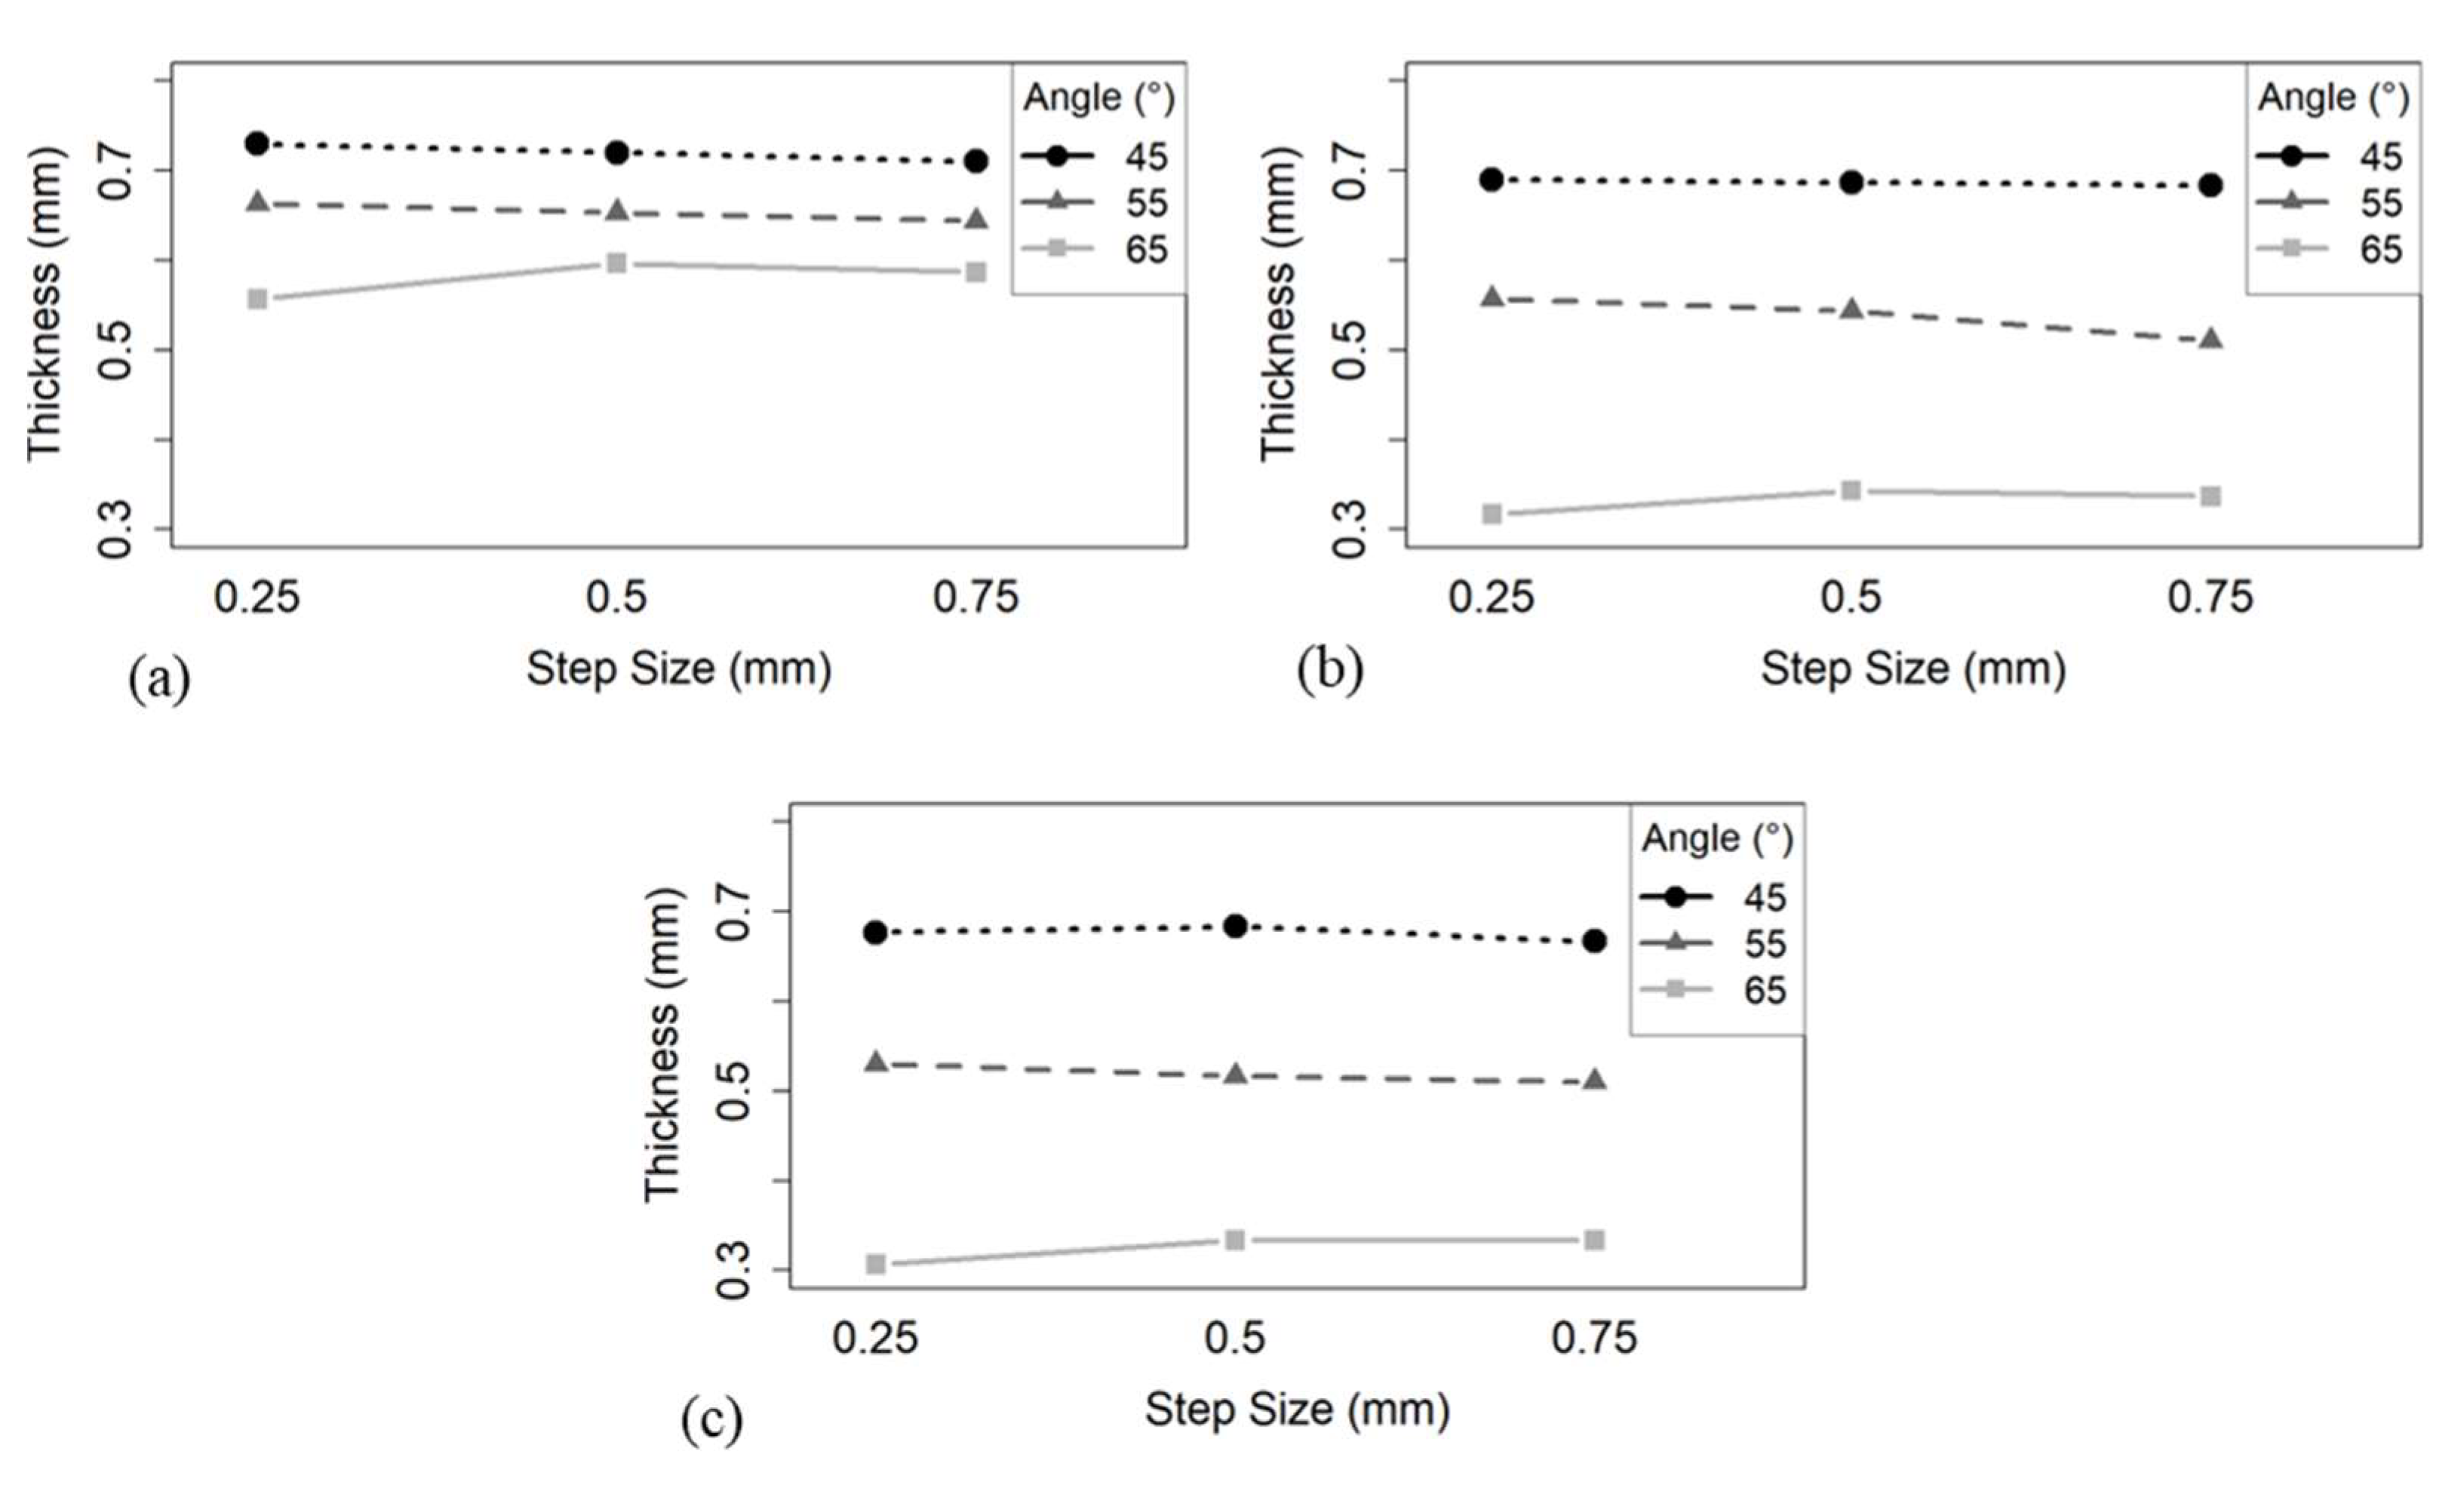
Figure 6a, representing the 45° wall angle, shows that step size has a minimal effect on thinning across all forming depths. At a 7 mm depth, the thickness decreases slightly from 0.73 mm to 0.71 mm as the step size increases from 0.25 mm to 0.75 mm, reflecting a minor thinning of 2.7%. At an 11 mm depth, no variation is observed, with a constant thickness of 0.69 mm across all step sizes. Similarly, at a 14 mm depth, thickness decreases only marginally from 0.68 mm to 0.67 mm, indicating a 1.5% reduction. These results suggest that at lower wall angles, such as 45°, step size plays a limited role in influencing thinning behavior during SPIF.
Figure 6b, corresponding to a 55° wall angle, demonstrates the more pronounced influence of step size on thinning, particularly at greater forming depths. At a 7 mm depth, thickness decreases modestly from 0.66 mm to 0.64 mm with increasing step size, indicating a 3% reduction. At an 11 mm depth, the thickness drops from 0.55 mm to 0.51 mm, marking a 7.3% thinning, while at a 14 mm depth, the change from 0.53 mm to 0.51 mm reflects a 3.8% reduction. These results suggest that with steeper wall angles, the impact of step size becomes more evident, especially in deeper regions of the formed wall, where increased strain localization promotes more severe thinning.
At 65° wall angle, shown in
Figure 6c, exhibits an inverse trend compared to typical thinning behavior, particularly at 7 mm depth. Instead of a monotonic decrease, thickness increases from 0.56 mm to 0.60 mm at the 0.5 mm step size, before slightly declining to 0.59 mm at 0.75 mm. At 11 mm depth, thickness increases from 0.32 mm to 0.34 mm, representing a 6.25% rise. Similarly, at 14 mm depth, thickness increases from 0.31 mm to 0.33 mm, reflecting a 6.45% increase. Both trends deviate from those observed at lower wall angles, where thickness generally decreased with increasing step size. This reversal of trend and convergence in thickness suggest that at high wall angles, the influence of step size becomes negligible. The steep geometry introduces dominant stretching and localized strain, which overshadows the effect of incremental step size changes and results in uniformly high thinning, regardless of step size.
As each experimental condition includes three replicates, the data demonstrates strong consistency across repeated trials. For most combinations of wall angle and step size, the thickness values show minimal variation among replicates typically within 1–3% indicating good repeatability. However, at higher wall angles (65°) and greater depths (11 mm and 14 mm), slightly higher variations of up to 12–15% are observed, reflecting the increased strain and localized deformation in these cases. Overall, the consistent trends across replicates support the reliability of the experimental results.
4.2. Statistical Analysis
As discussed in detail above, to assess how wall angle and step size affect sheet thinning in SPIF, a full factorial design was adopted involving three levels of each factor. Sheet thickness was measured at three forming depths. Statistical analysis was conducted to determine both the individual effects and interaction effects of these two factors on thinning.
This analysis, including calculation of percentage deviation and interpretation of factorial interactions, was carried out using R software (version 4.5.1), which enabled efficient comparison and visualization of results.
Two-way ANOVA is particularly suitable for this study because it not only evaluates the main effects of individual factors but also determines whether the effect of one variable depends on the level of the other. This type of analysis is especially relevant in SPIF, where geometric and process parameters often interact non-linearly due to complex material flow and evolving strain paths. A two-way ANOVA was employed for thinning at each forming depth to evaluate the effects of the two independent variables (factors) and their interaction. This method was chosen after confirming that the underlying assumptions of normality and homogeneity of variances were reasonably satisfied. The hypotheses tested were H0(1): Wall angle has no effect on sheet thinning, H0(2): Step size has no effect on sheet thinning, H0(3): There is no interaction between wall angle and step size. A p-value less than 0.01 indicates convincing evidence, between 0.01 and 0.05 reflects moderate evidence, between 0.05 and 0.10 is suggestive but inconclusive, and above 0.10 indicates little to no evidence to reject the null hypothesis.
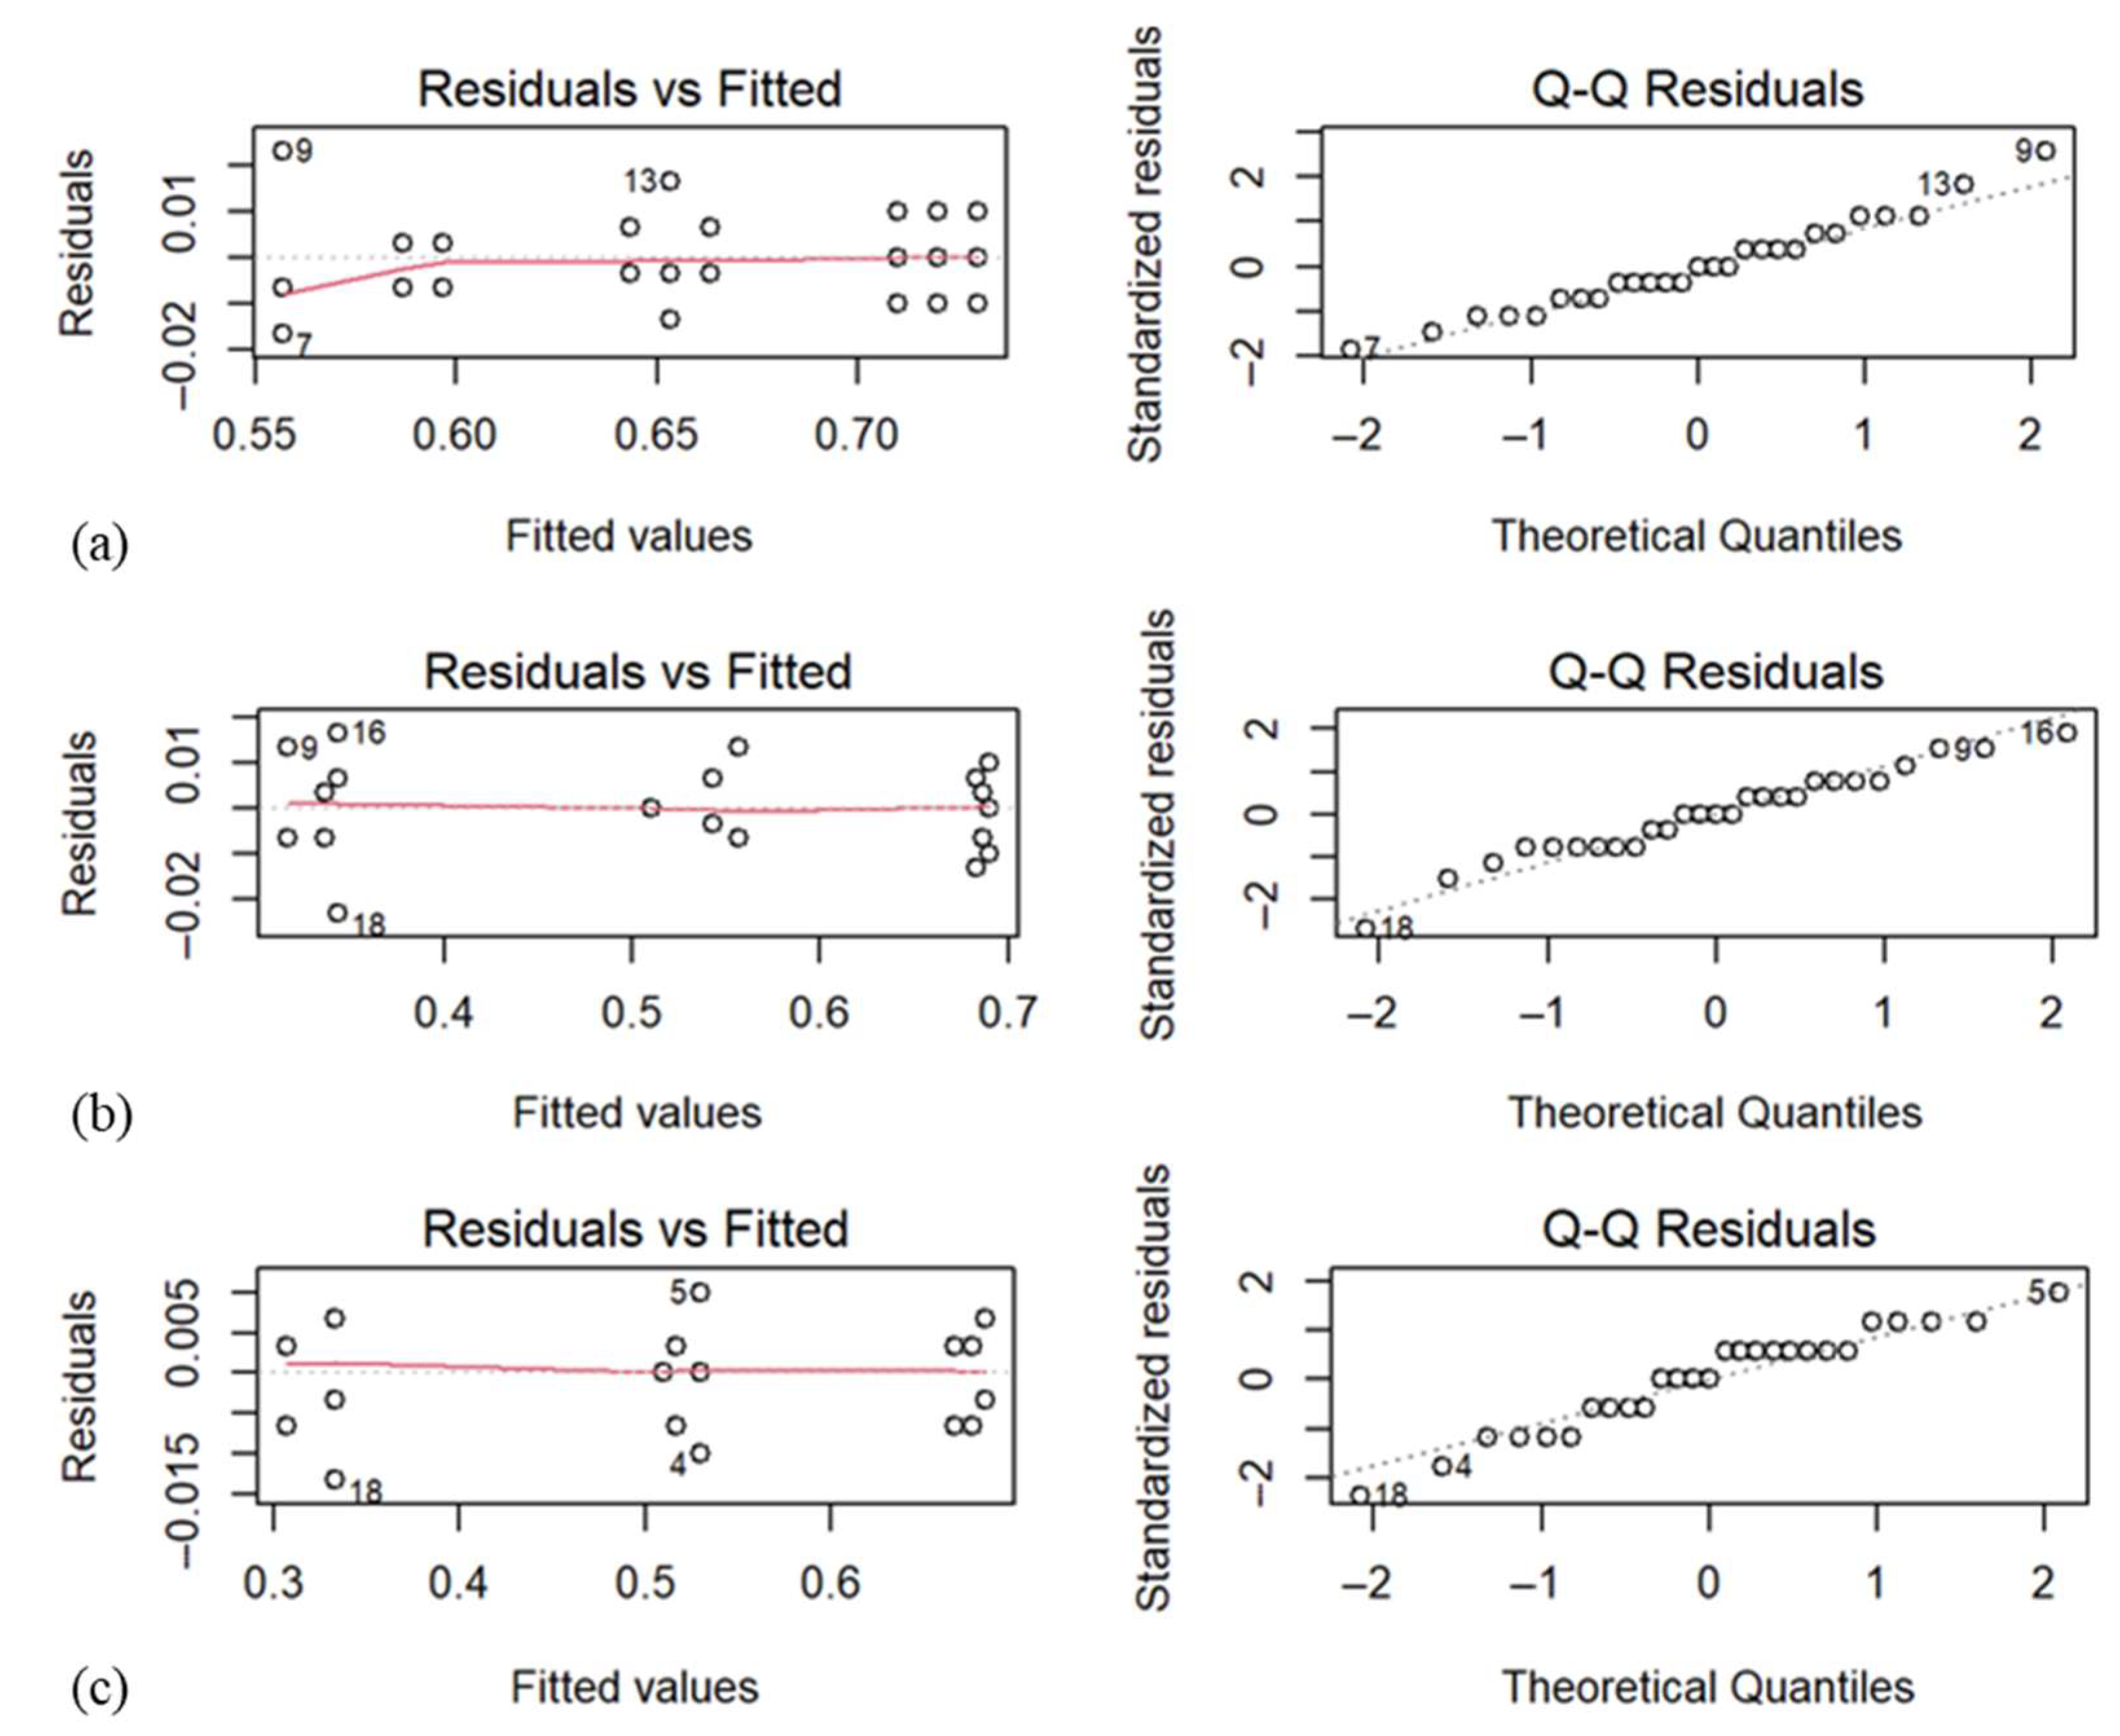
As illustrated in
Figure 7, the Q-Q residuals plots show the residuals approximately follow a normal distribution, while the residuals vs. fitted values plots suggest a consistent spread of residuals across predicted values. These diagnostic plots showed that the residuals are approximately normally distributed and exhibited no clear pattern, suggesting constant variance.
At 7 mm depth, thinning was primarily influenced by wall angle. As seen in the interaction plot (
Figure 8a), the thickness decreased with increasing wall angle, consistent across step size. While step size had a comparatively smaller effect, its influence became significant in combination with the wall angle.
The two-way ANOVA results for 7 mm depth are presented in
Table 3. There is convincing evidence that wall angle has an effect on thinning at 7 mm depth (
p < 2.97 × 10
−15, two-way ANOVA). There is no statistically significant evidence that step size has an effect on thinning (
p = 0.177, two-way ANOVA). Also, there is convincing evidence that the interaction between wall angle and step size has an effect on thinning (
p = 0.00159, two-way ANOVA).
Figure 7a confirmed the suitability of the model for the 7 mm depth. The residuals vs. fitted values plot displayed random dispersion around zero, indicating equal variance. The Q-Q residuals plot showed that the residuals closely followed the theoretical normal distribution line, confirming normality.
Thinning at 11 mm depth followed a similar trend but with a more pronounced reduction in thickness at higher wall angles. The interaction plot (
Figure 8b) showed that, especially at 55°, increasing the step size increased thinning. At 45°, the influence of step size was minimal. The two-way ANOVA results for 11 mm depth are presented in
Table 4. There is convincing evidence that wall angle has an effect on thinning at the 11 mm depth (
p < 2 × 10
−16, two-way ANOVA). There is also convincing evidence that the interaction between wall angle and step size has an effect on thinning (
p = 0.000702, two-way ANOVA). Additionally, there is moderate evidence that step size has an effect on thinning (
p = 0.026294, two-way ANOVA), which contrasts with the minimal influence observed at the 7 mm depth.
Model validation for the 11 mm depth was supported by the residual diagnostics shown in
Figure 7b. The residuals vs. fitted plot showed no discernible pattern, confirming equal variance, and the Q-Q plot indicated that the residuals followed a nearly normal distribution.
At a 14 mm depth, the thinning was most severe, especially at the 65° wall angle. The interaction plot (
Figure 8c) demonstrated that the mean sheet thickness continued to decline with increased wall angle. The two-way ANOVA results for a 14 mm depth are presented in
Table 5. There is convincing evidence that wall angle has an effect on thinning at the 14 mm depth (
p < 2 × 10
−16, two-way ANOVA). There is also convincing evidence that the interaction between wall angle and step size has an effect on thinning (
p = 9.94 × 10
−5, two-way ANOVA). Additionally, there is suggestive but inconclusive evidence that step size has an effect on thinning (
p = 0.0598, two-way ANOVA)
The model diagnostics in
Figure 7c confirmed the assumptions of ANOVA for the 14 mm depth. The residuals were evenly spread around zero in the fitted plot and followed a near-linear path in the Q-Q plot, validating both equal variance and normality.
4.3. Numerical Analysis Results
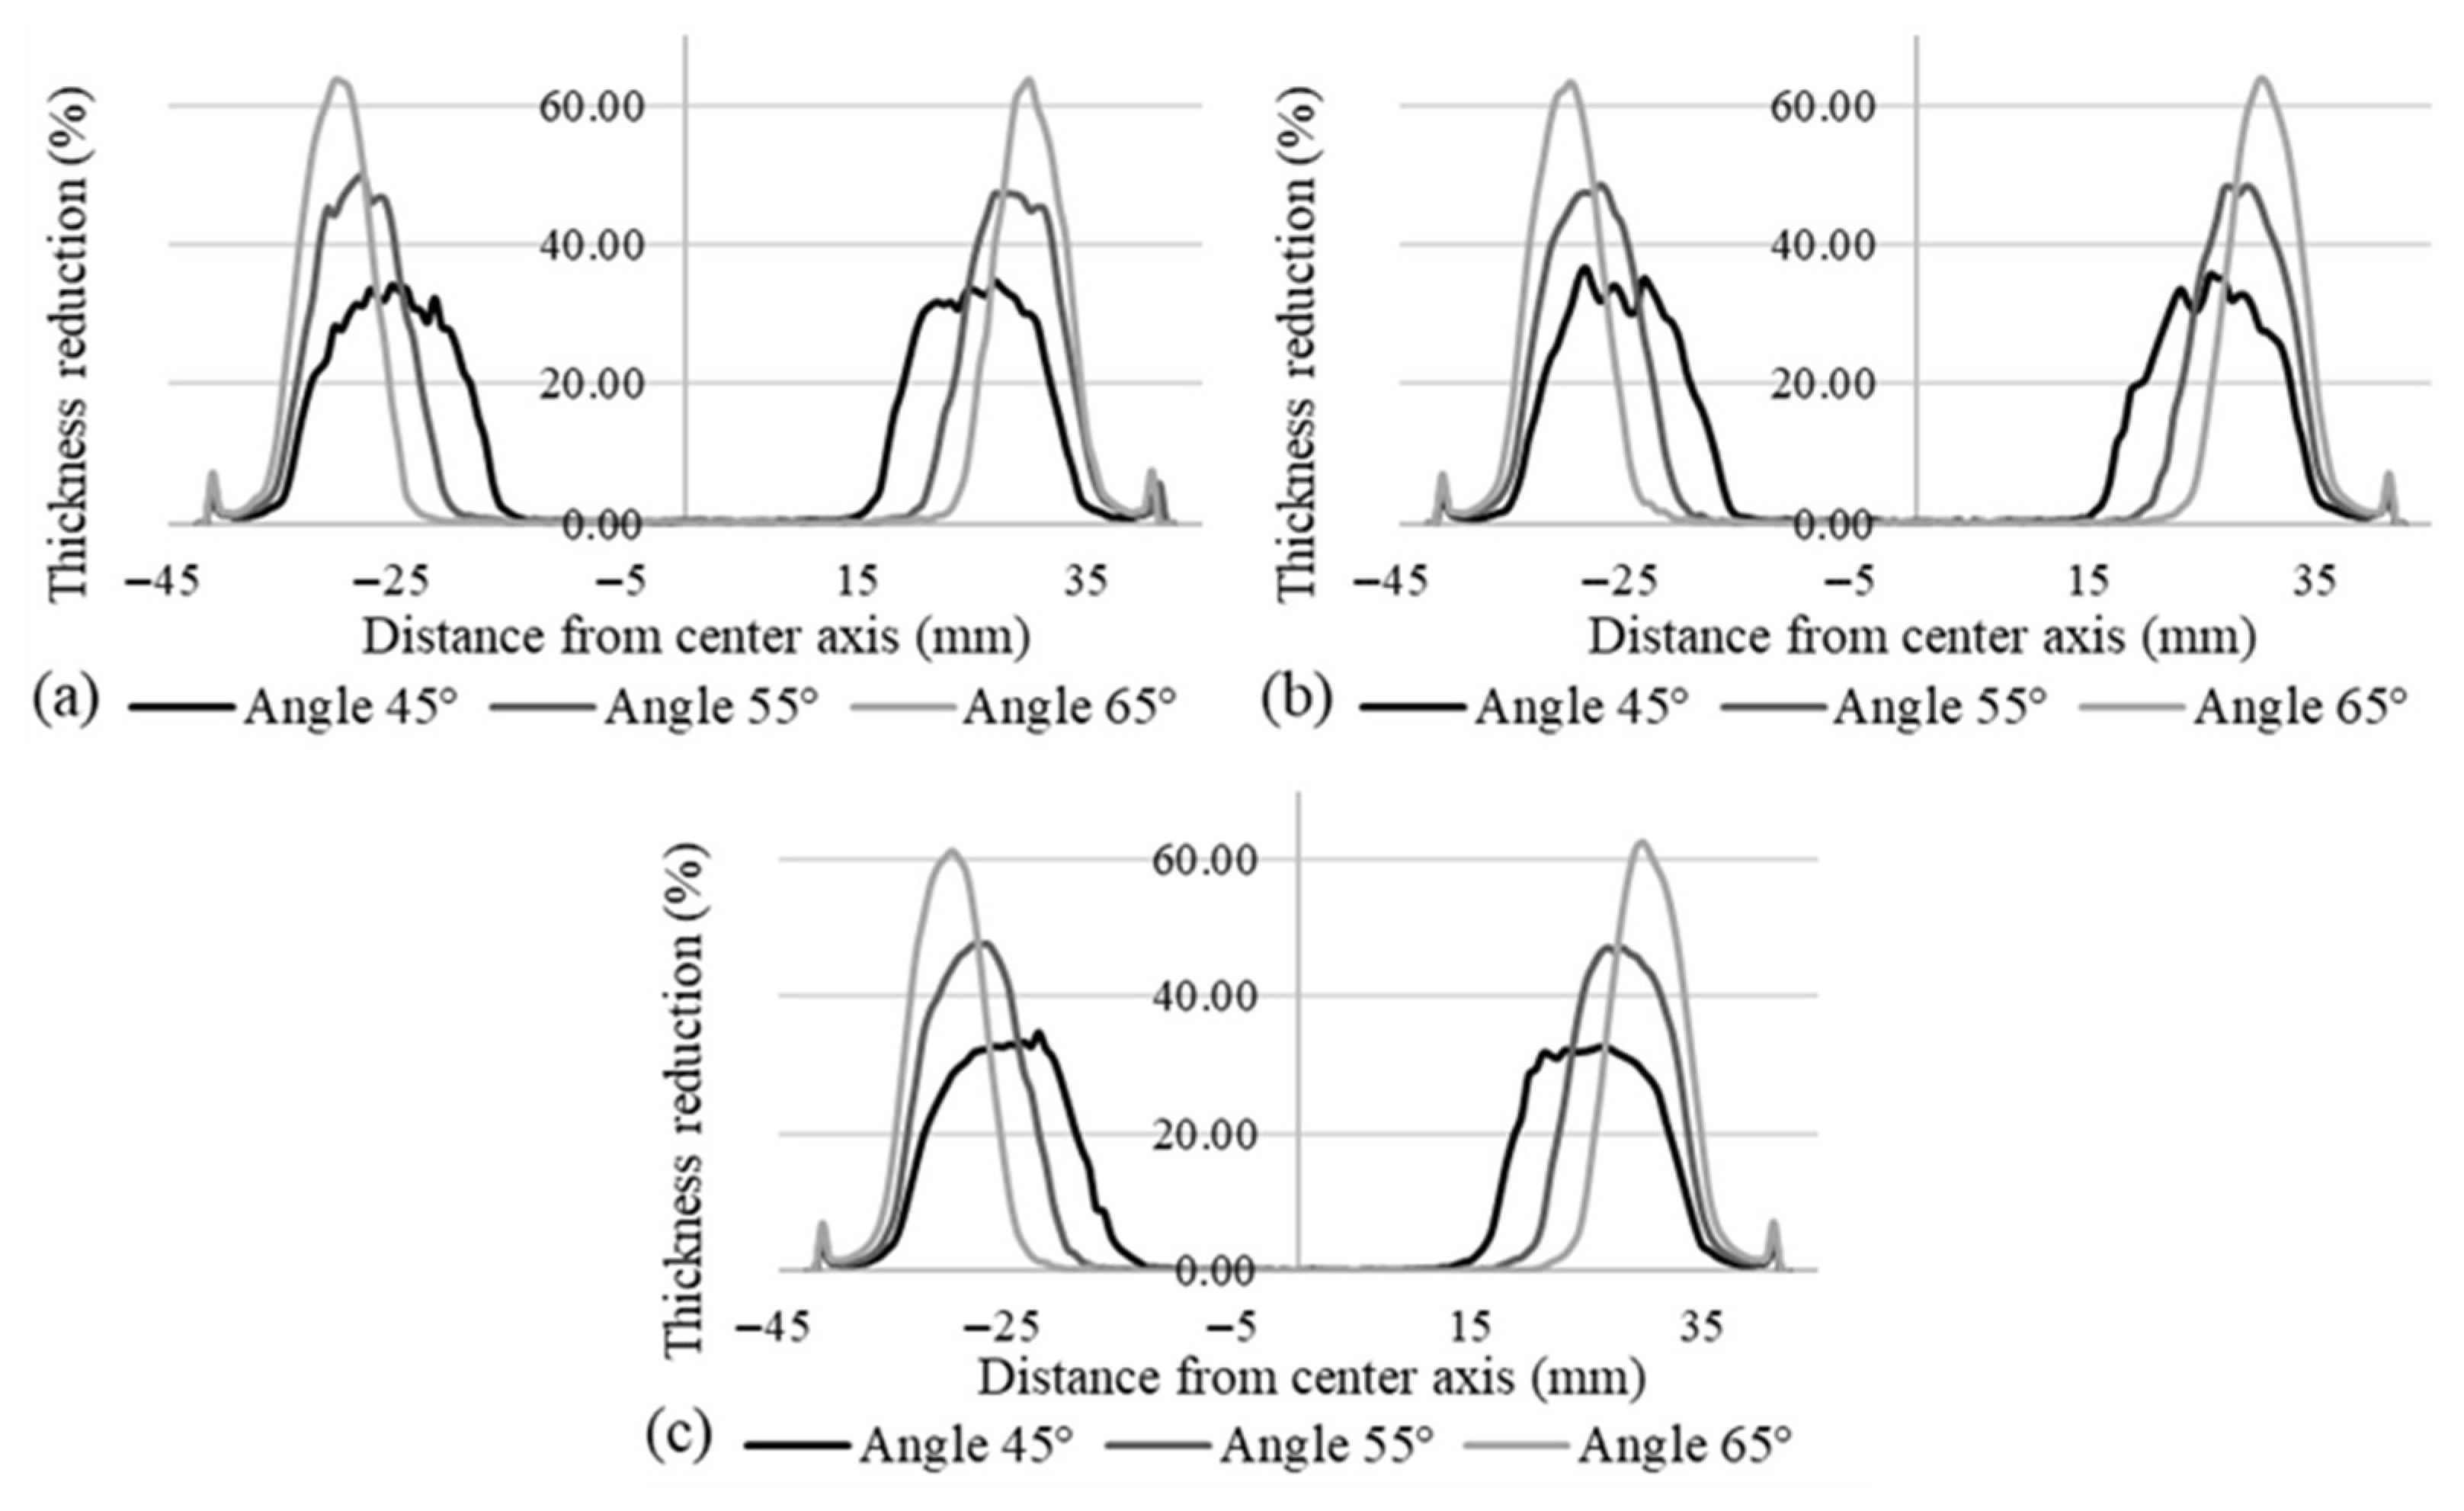
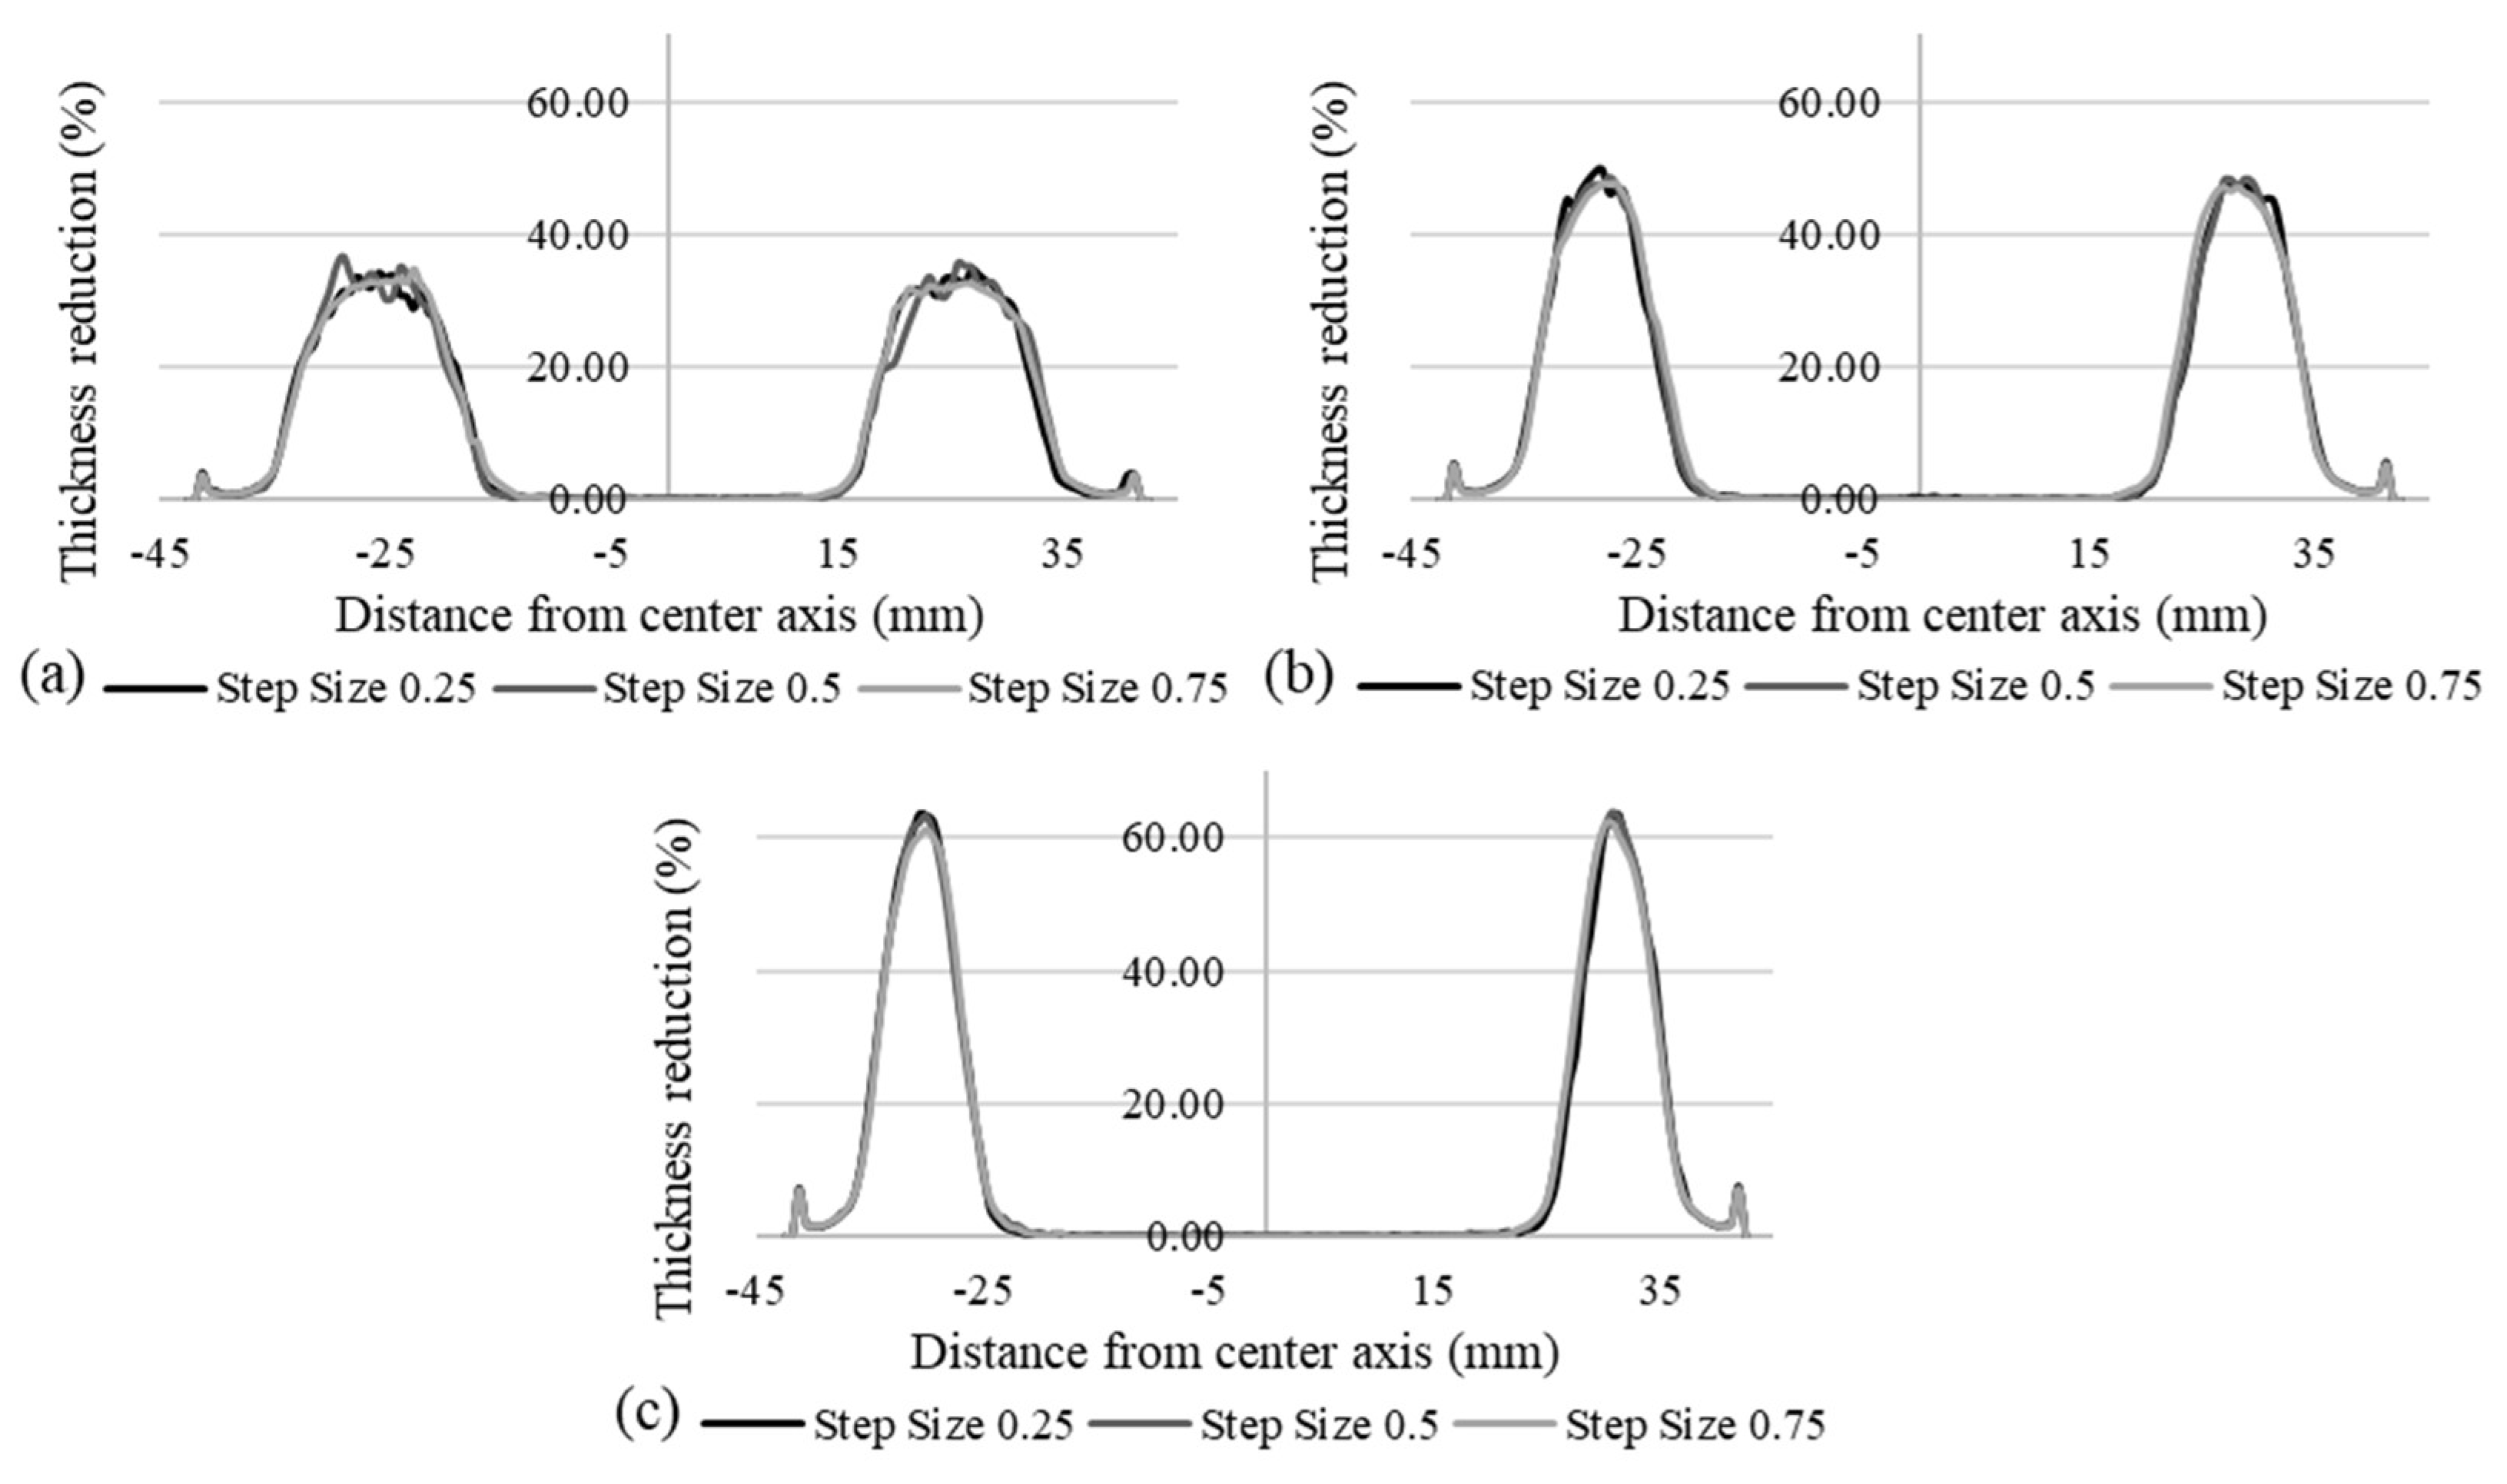
Numerical simulations were performed using LS-DYNA to predict the thinning behavior of AA3003-H14 aluminum alloy under varying wall angles (45°, 55°, 65°) and step sizes (0.25 mm, 0.50 mm, 0.75 mm). Further, the above experimental results were used to validate the predictive numerical model. To evaluate the effect of the selected process parameters on material thinning, the thickness reduction was extracted along the y-direction and plotted for each wall angle with respect to step size and each step size across different wall angles. These plots facilitate a direct comparison of thinning distribution across all forming conditions.
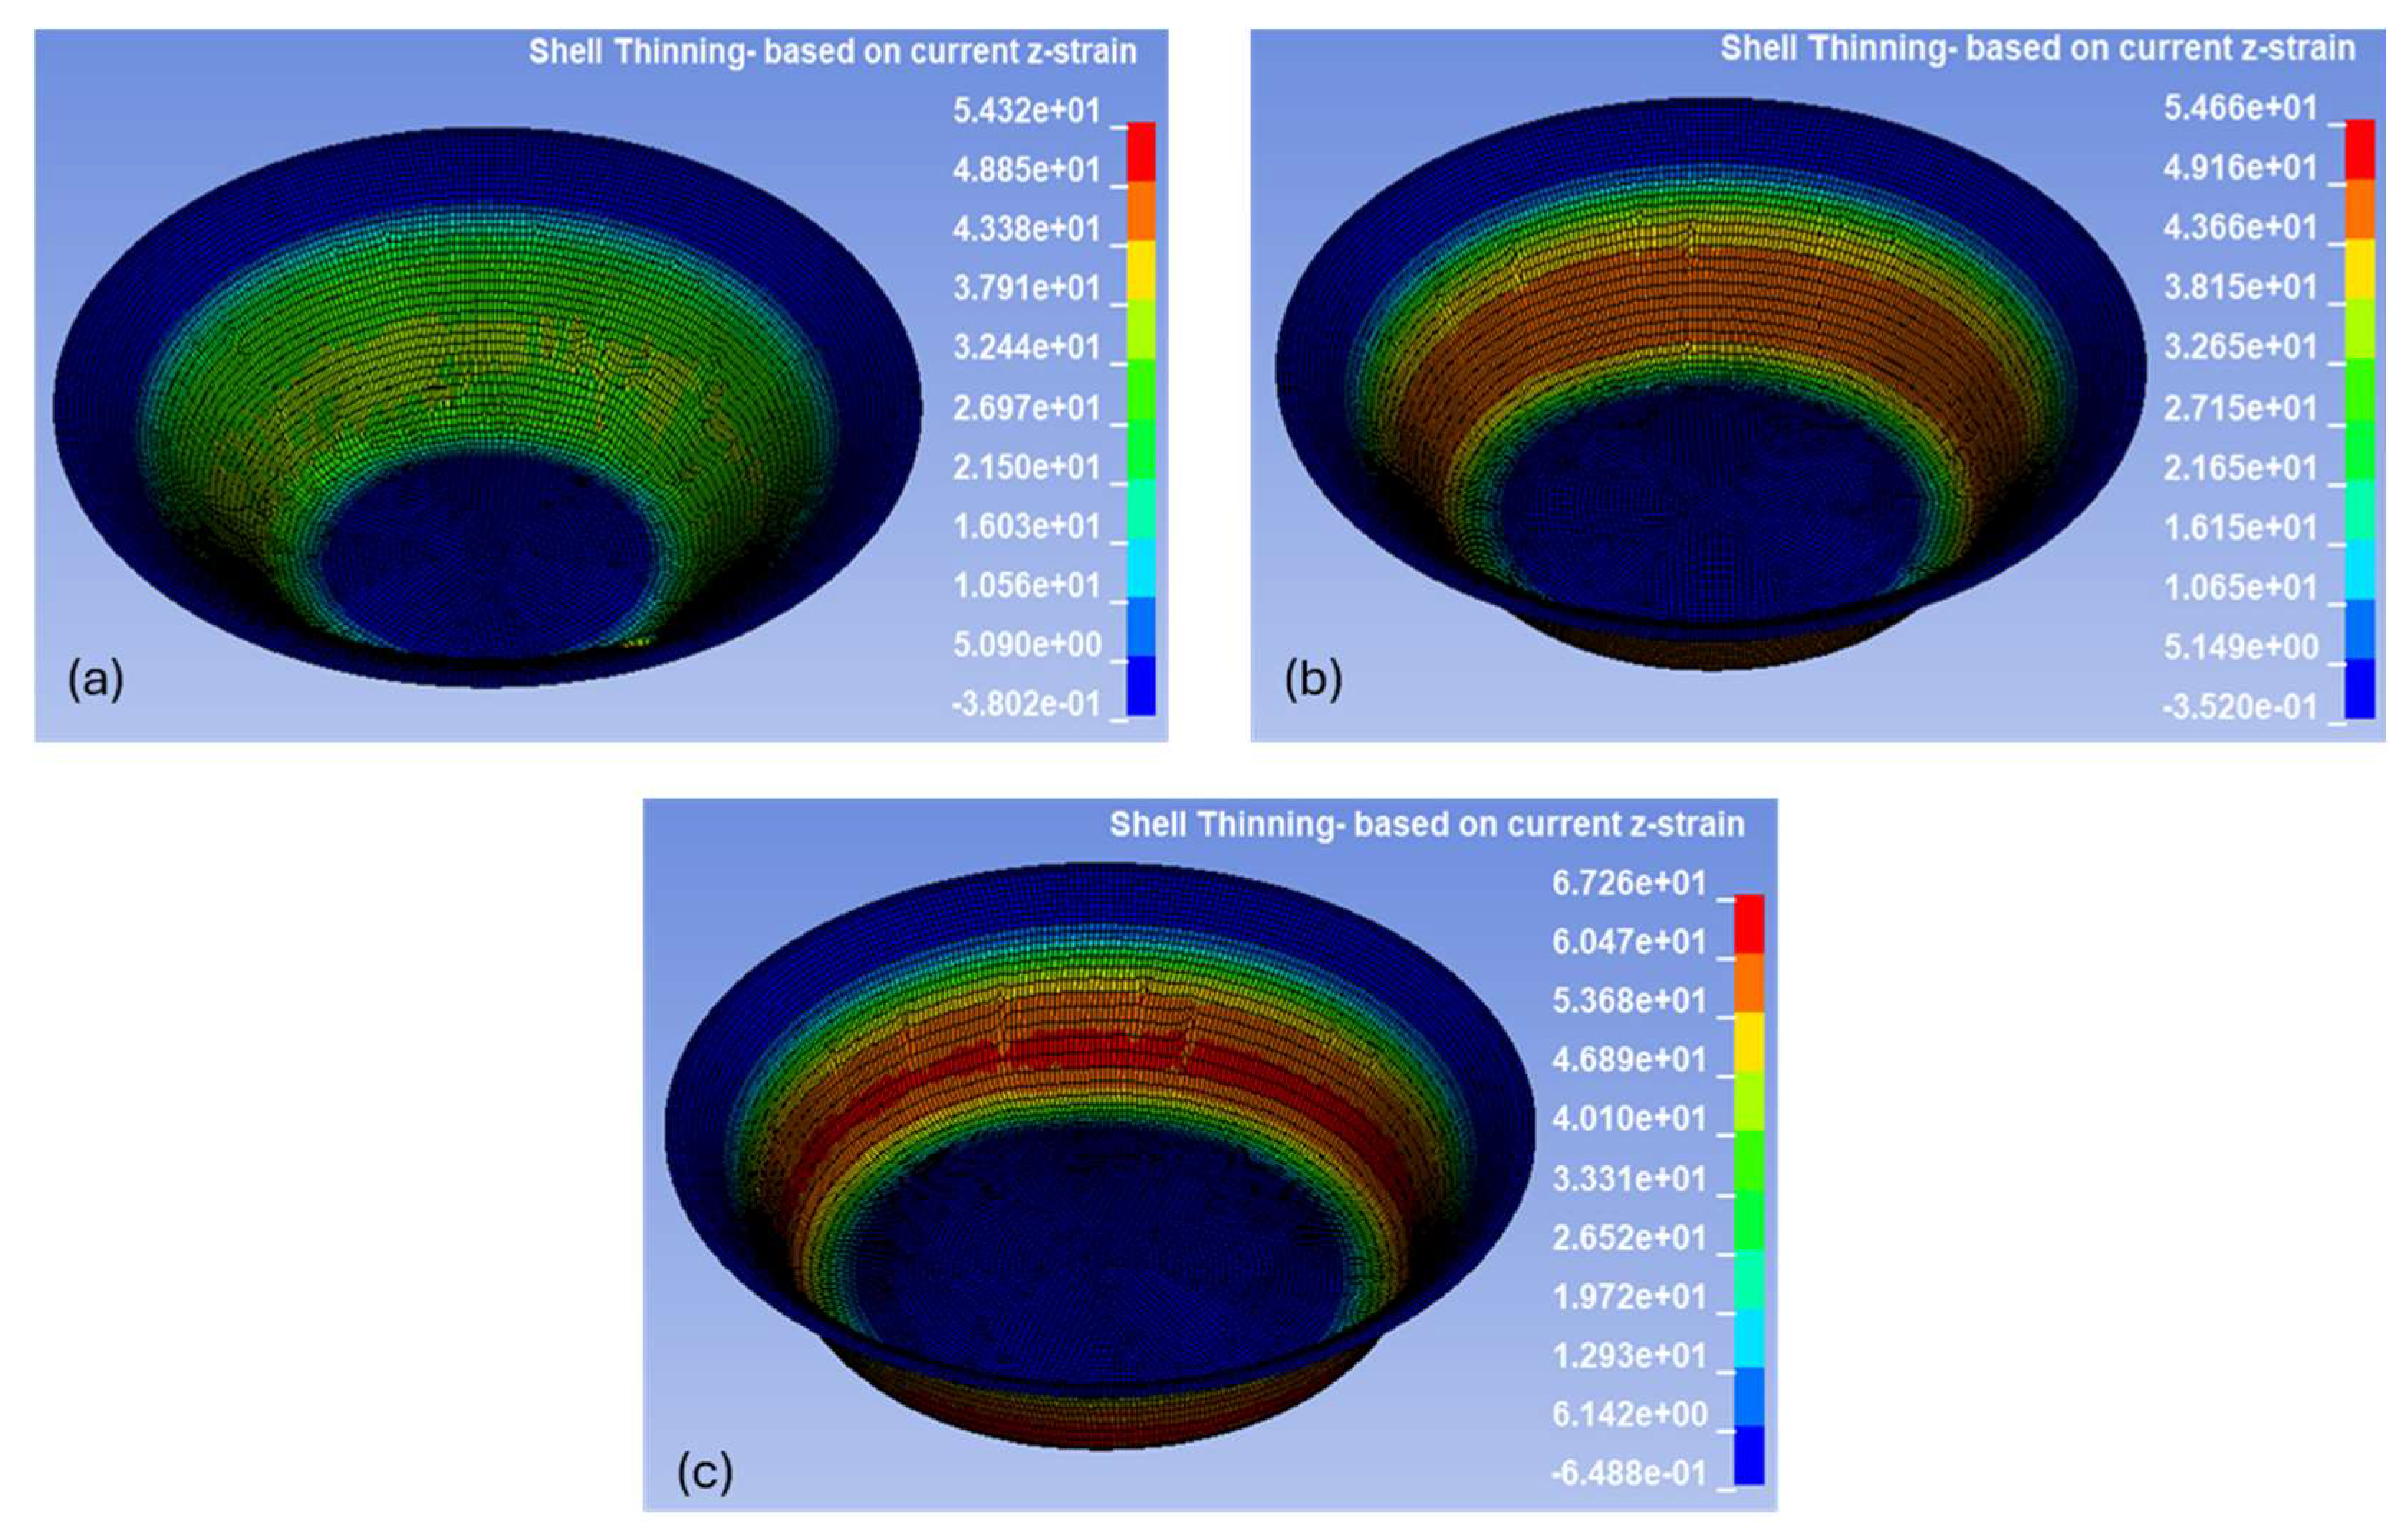
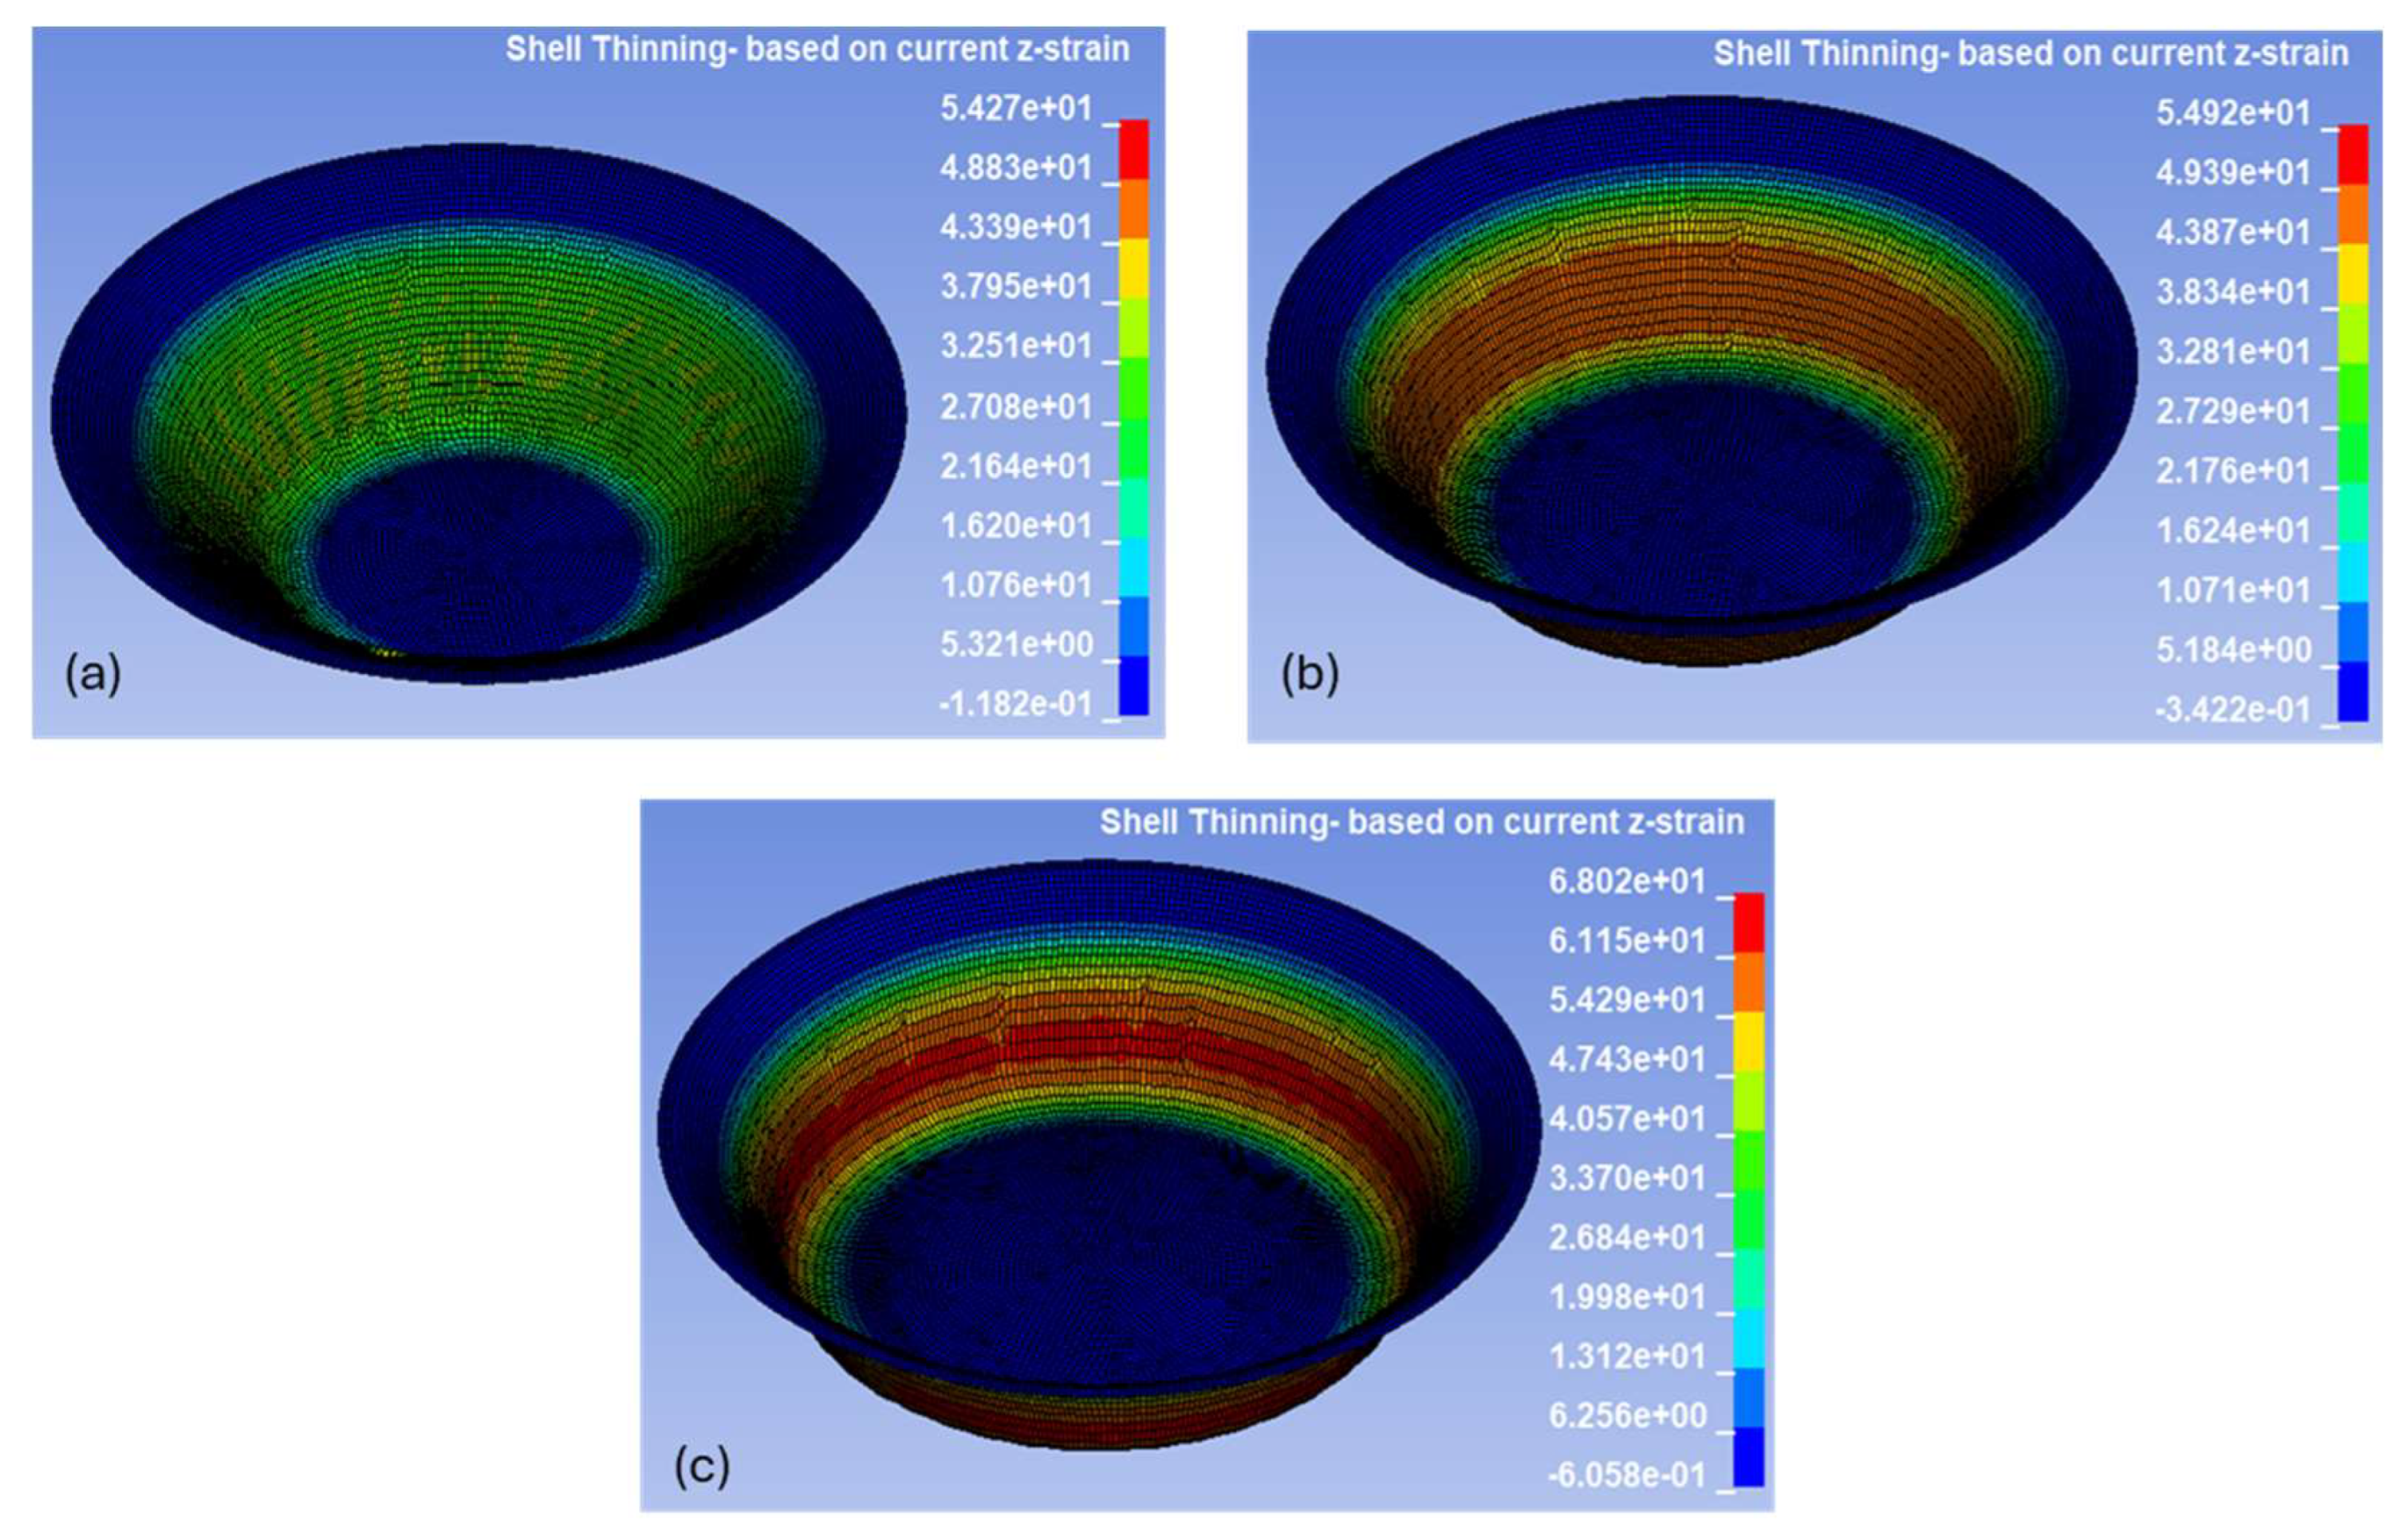
Figure 9 presents a representative plot of shell thinning calculated based on strain in the applied tool force direction (z-strain) in LS-DYNA, visualizing the thickness distribution in the deformed AA3003-H14 sheet under deformation in SPIF (wall angle: 65°, step size: 0.75 mm). The legend indicates the percentage of thickness reduction, where warmer colors (red, orange) highlight regions of maximum thinning and cooler colors (blue) show areas of minimal deformation. This spatial distribution illustrates how thinning intensifies along the formed wall, particularly toward the mid-to-lower sections where material undergoes the greatest stretching. The contour plot demonstrates the overall symmetry of the process and highlights critical zones that are prone to localized thinning. Further, it serves as a visual reference to aid interpretation of the more detailed quantitative comparisons presented in the ensuing analysis. Similar plots in
Figure A1,
Figure A2 and
Figure A3, further illustrate how varying parameters influence localized thinning patterns.
Figure 10 illustrates the effect of wall angle on thickness reduction for the selected step sizes. These plots reveal the progressive effect of wall angle on localized thinning across the formed geometry. For all three selected step sizes, the 65° wall angle exhibits the most severe thinning, with higher peak values and steeper gradients, followed by wall angles of 55° and 45°, respectively. It can be observed that increasing wall angles intensifies the material stretching during forming, which leads to sharper thickness reduction profiles, indicating greater strain localization. This trend is consistent for all three step sizes, demonstrating that wall angle plays a vital role in controlling thinning.
Figure 11 illustrates the effect of step size on thickness reduction for the selected wall angles. Across all wall angles, the influence of step size appears relatively minor, with thickness reduction curves showing similar peak values and overall trends. At a wall angle of 45°, the curves are nearly overlapping, indicating consistent thinning behavior regardless of the step size. Even at higher wall angles, where thinning typically intensifies, the variations among different step sizes remain small.
These results suggest that within the investigated range (0.25 mm to 0.75 mm), step size has a limited effect on peak thinning, with wall angle playing a more dominant role in controlling deformation severity. This highlights that wall angle is the more critical parameter in governing localized thinning during SPIF for AA3003-H14 under the selected conditions.
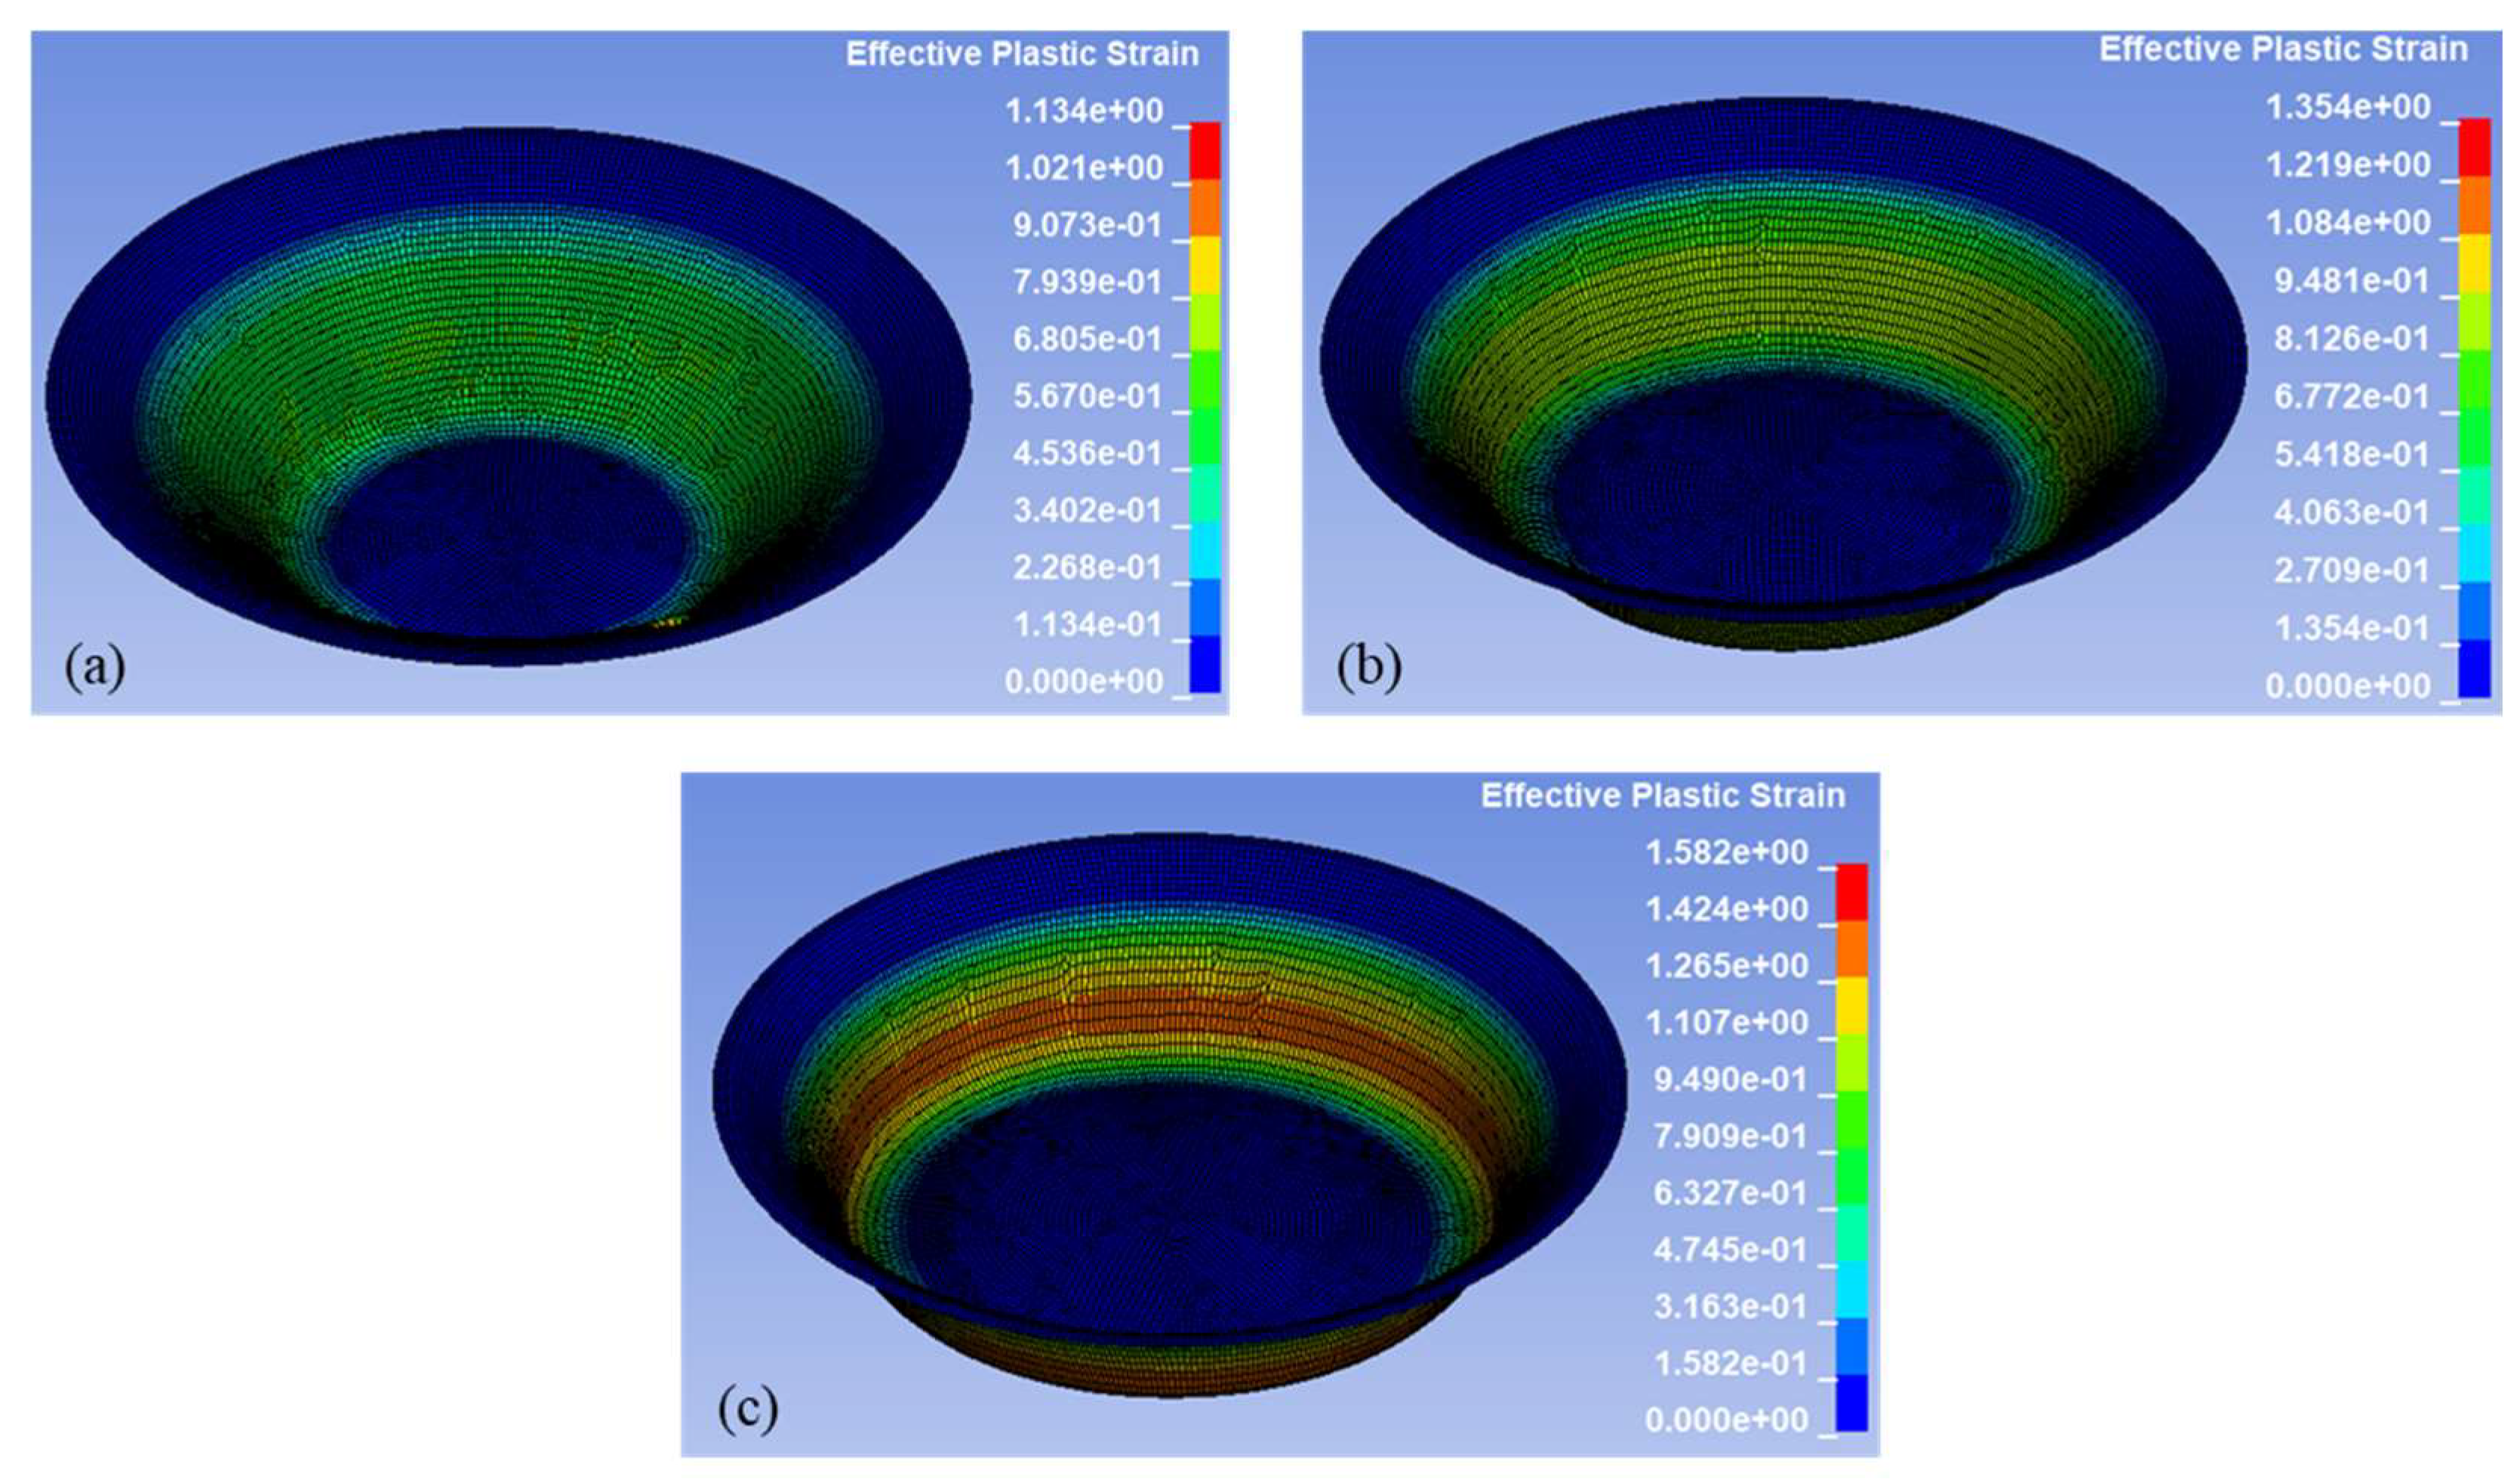
In addition to thickness reduction analysis, the effective plastic strain distribution in the formed aluminum sheets was evaluated through numerical simulations in LS-DYNA across nine process conditions.
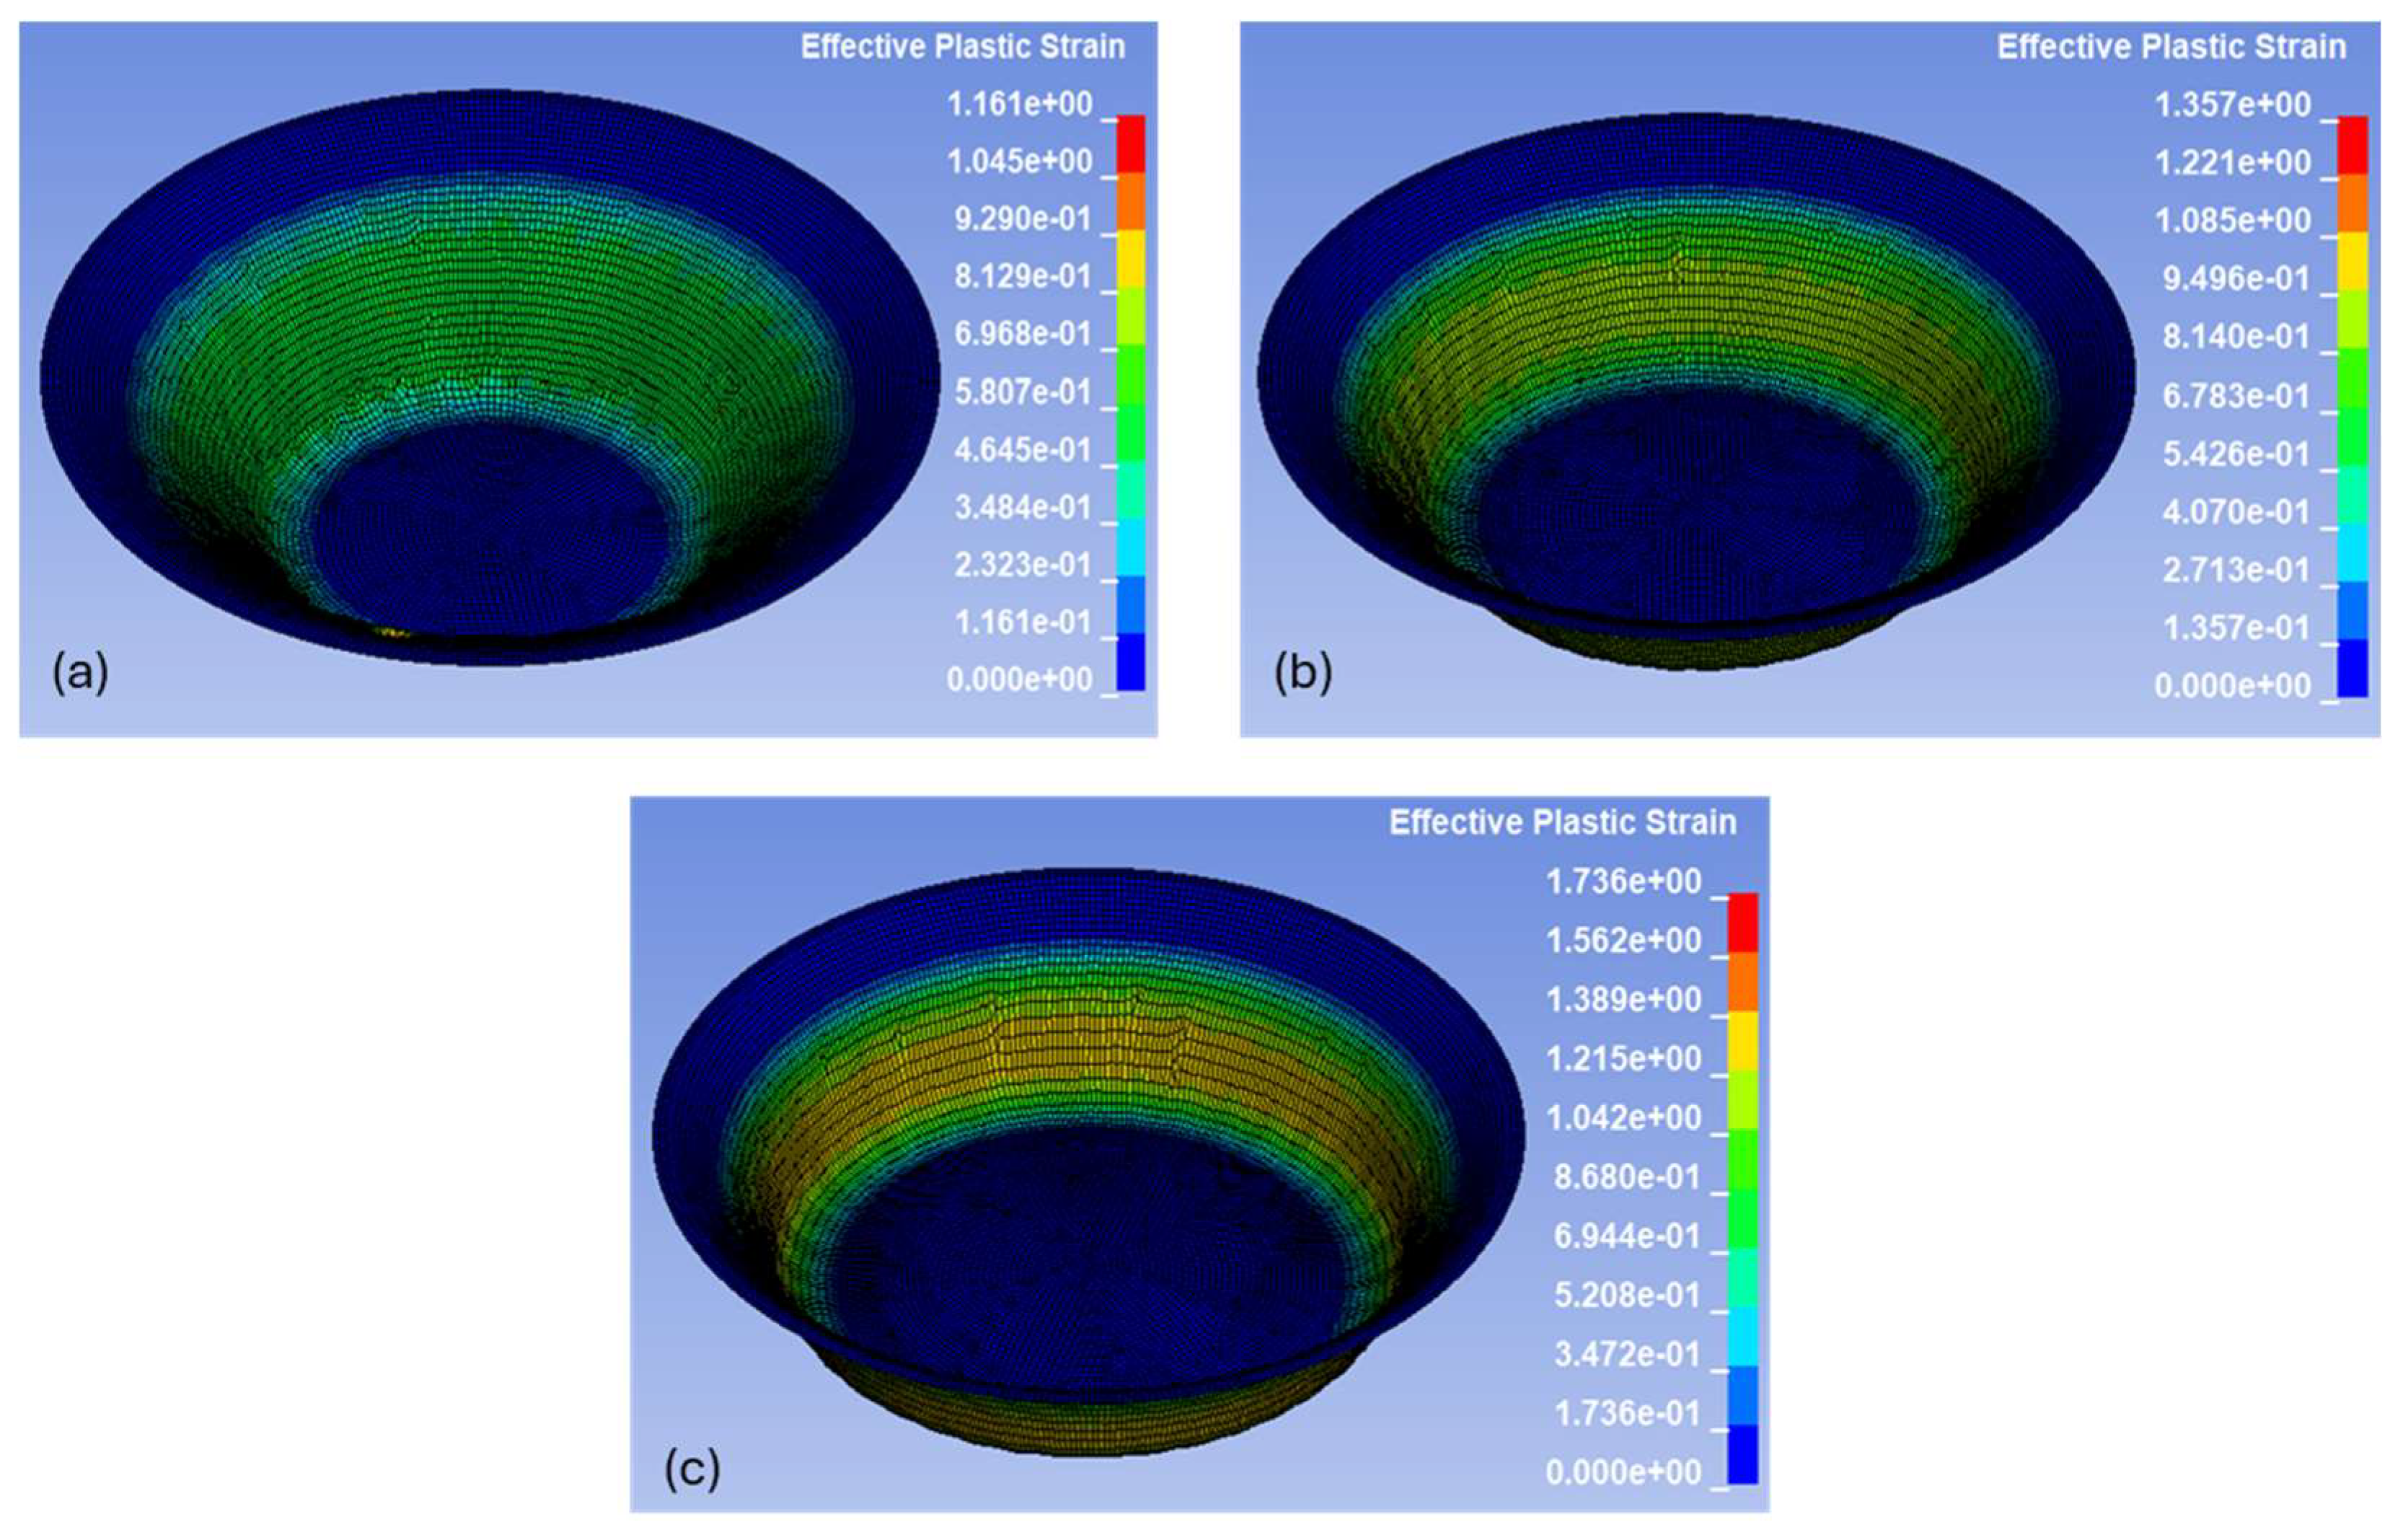
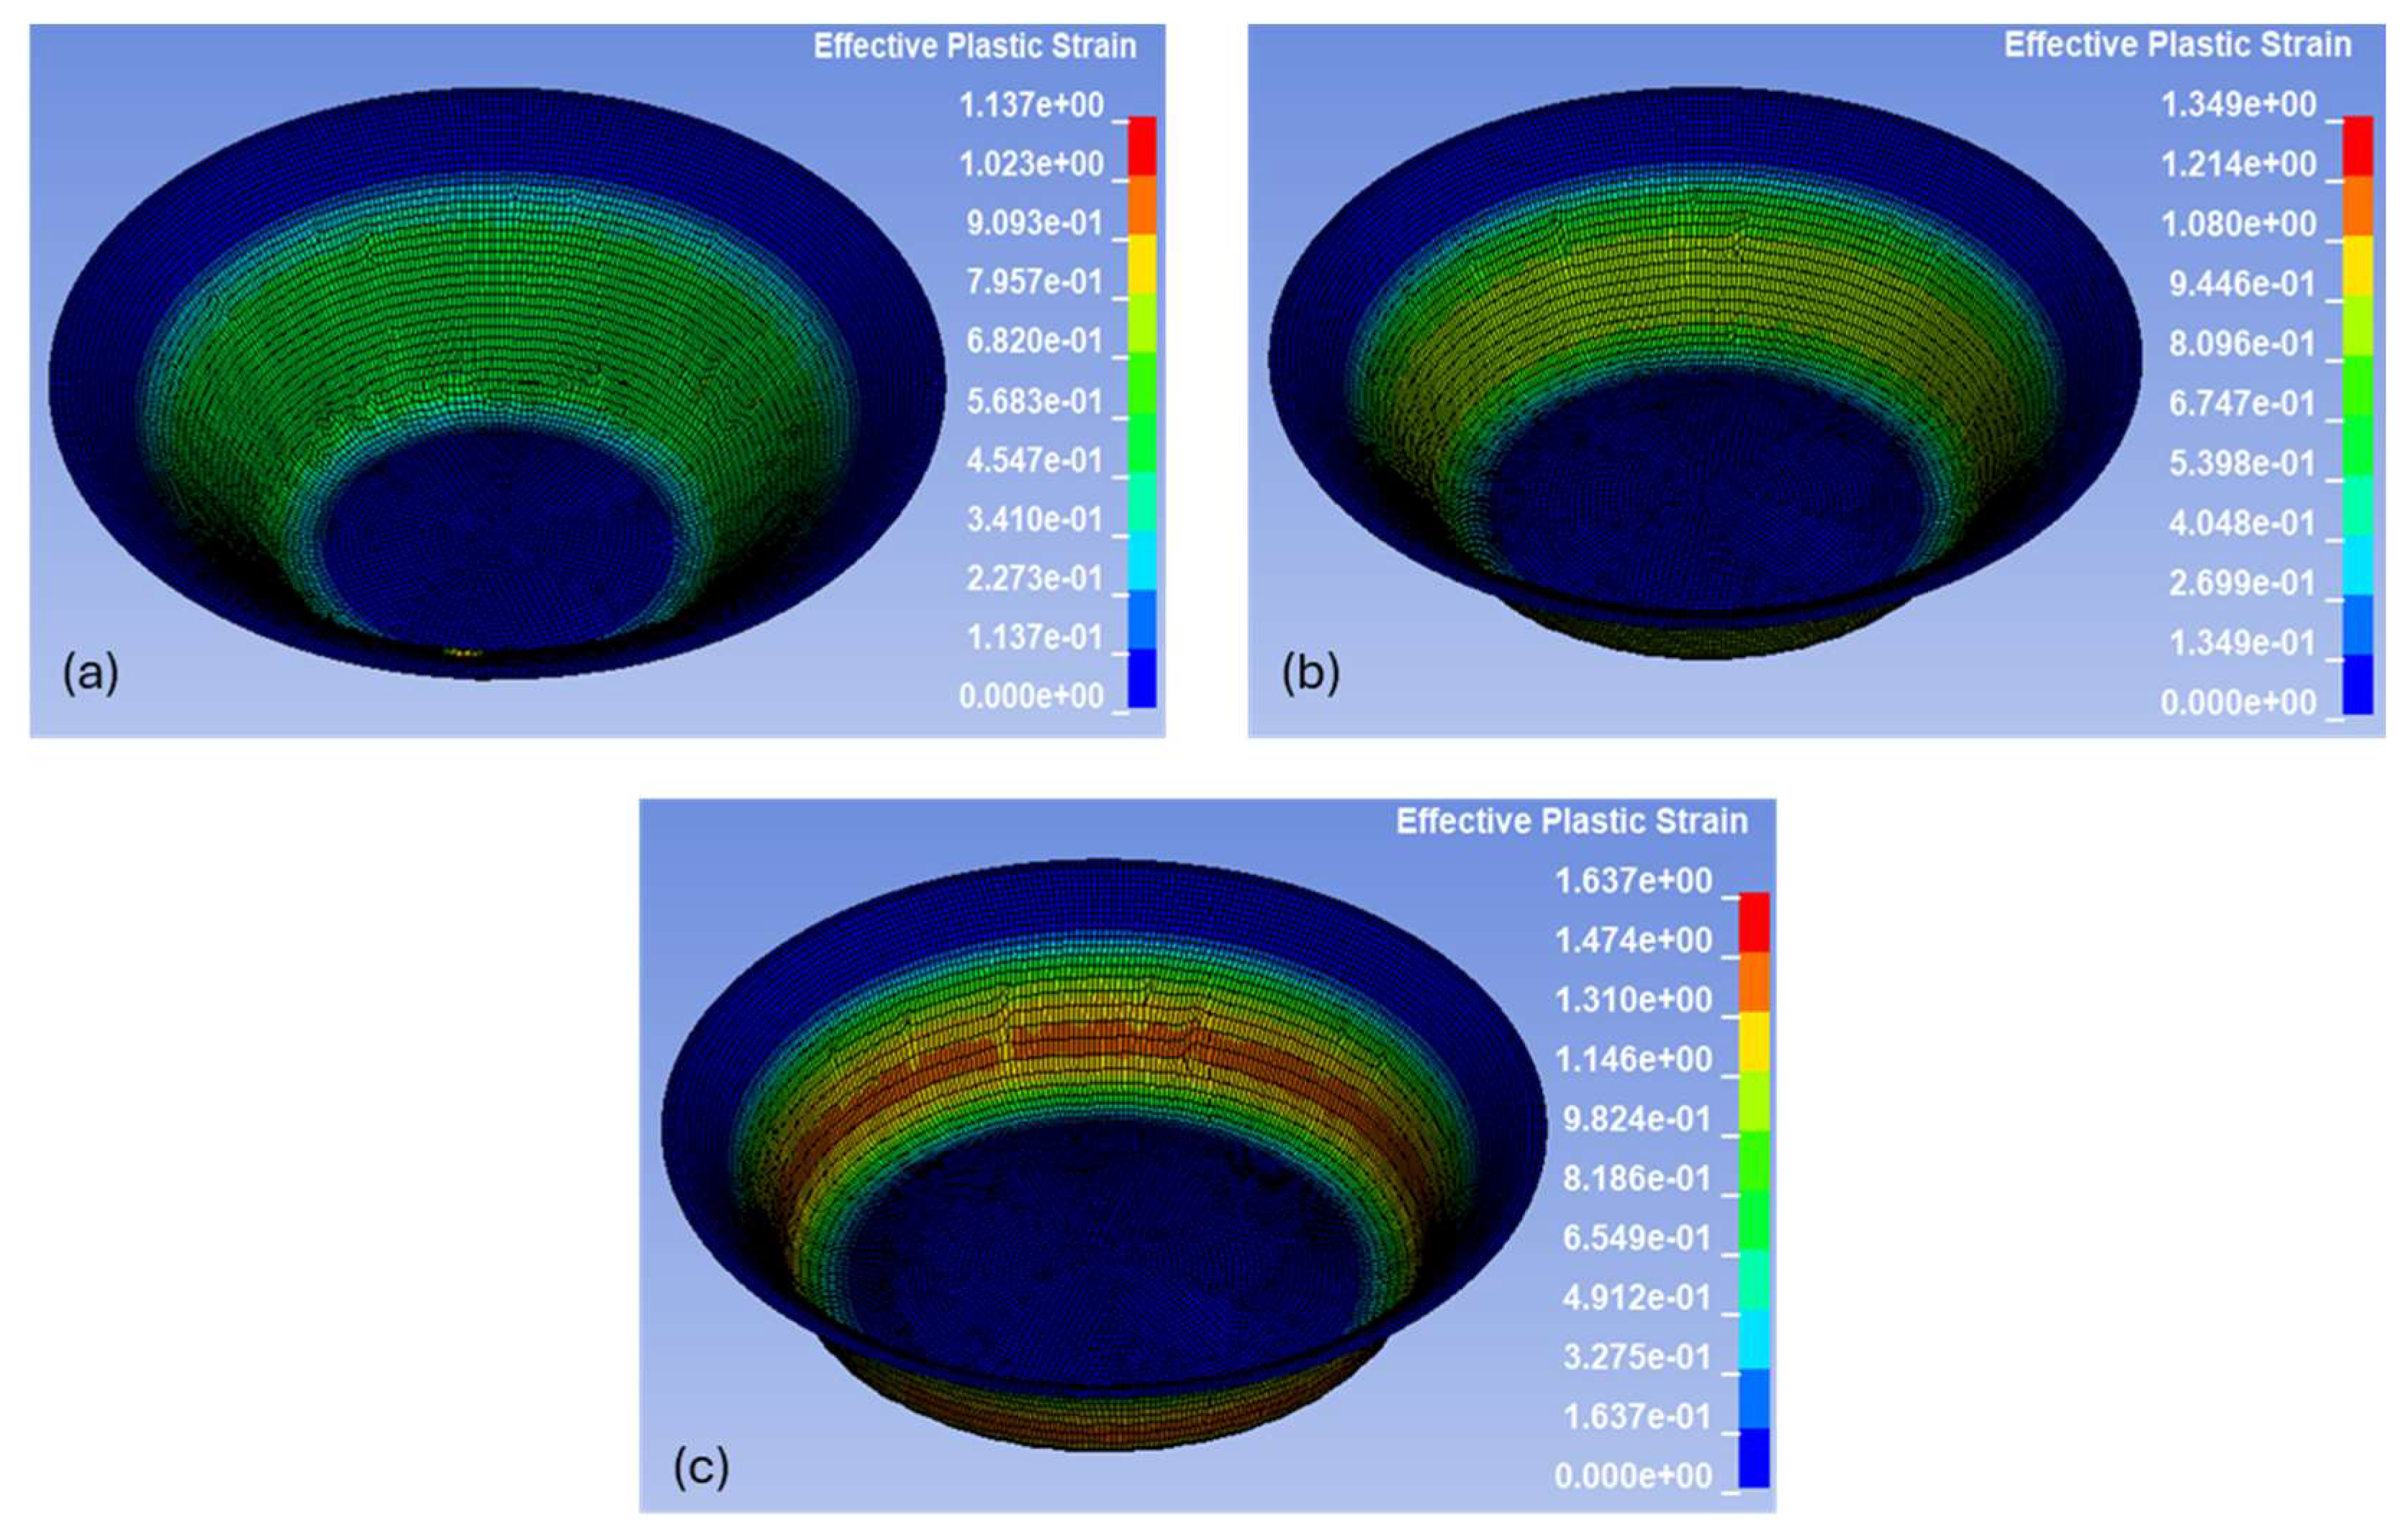
Figure 12 represents contour plots of effective plastic strain for a step size of 0.75 mm using the three selected wall angles. The contour plots at the final forming depth provide critical insights into the plastic deformation zones and strain localization patterns induced by varying wall angle. Similar insights can also be drawn for varying step size, which are not reported herein due to space constraints, but can be found in
Figure A4 and
Figure A5.
The numerical results indicate that plastic strain is concentrated in the region of active tool contact. This behavior is attributed to enhanced stretching and reduced material support, which elevates localized deformation. As the wall angle increases from 45° to 65°, the effective plastic strain intensifies, particularly forming a band along the midsection of the conical wall.
Figure 12a, which corresponds to a 45° wall angle, shows that plastic strain remains moderate and broadly distributed. The dominant green to yellow shades correspond to strain values between approximately 0.567 and 0.907, suggesting more uniform deformation with reduced severity.
Figure 12b, corresponding to a 55° wall angle, reveals a narrower and more defined strain band. Yellow to orange zones indicate higher strain levels ranging from 0.677 to 1.08, reflecting more localized stretching and increased deformation compared to the 45° case.
Figure 12c, which corresponds to a 65° wall angle, shows even sharper plastic strain concentration, especially in the lower mid-wall region. Red and orange bands emerge in this area, indicating extreme strain values between 1.107 and 1.58. These regions represent the peak of plastic deformation and signal a critical risk of thinning or failure.
Following the analysis of plastic strain,
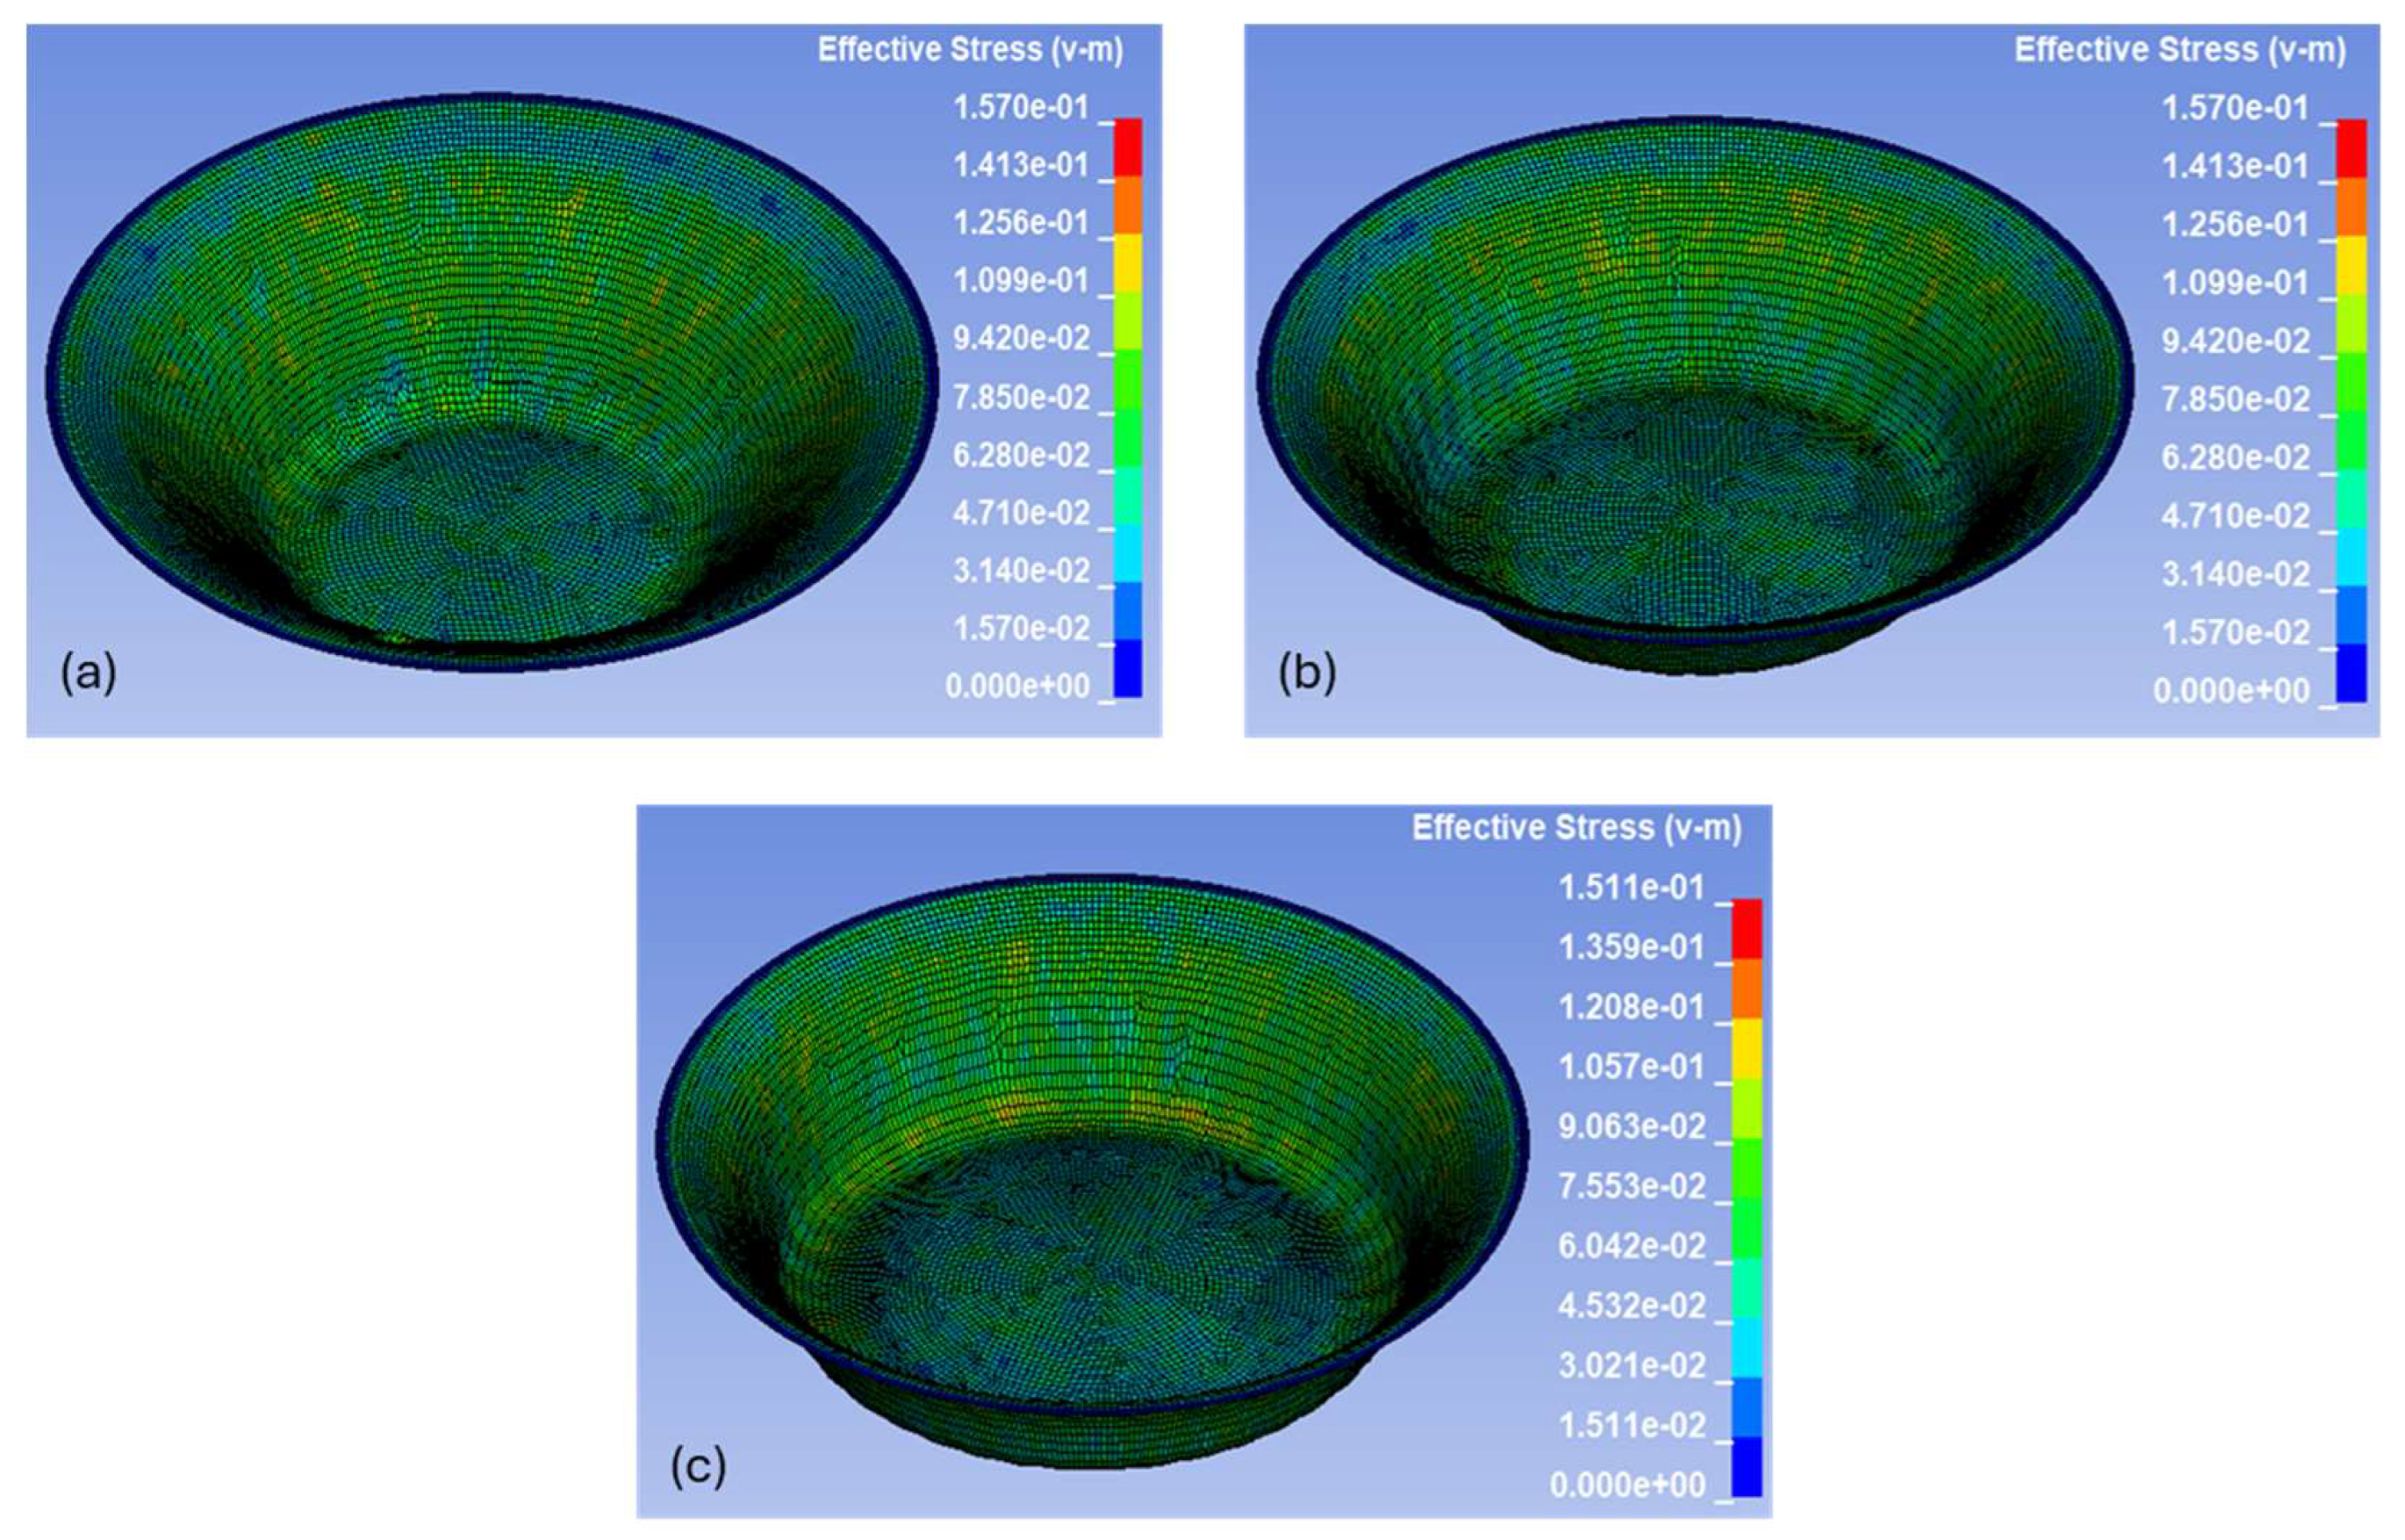
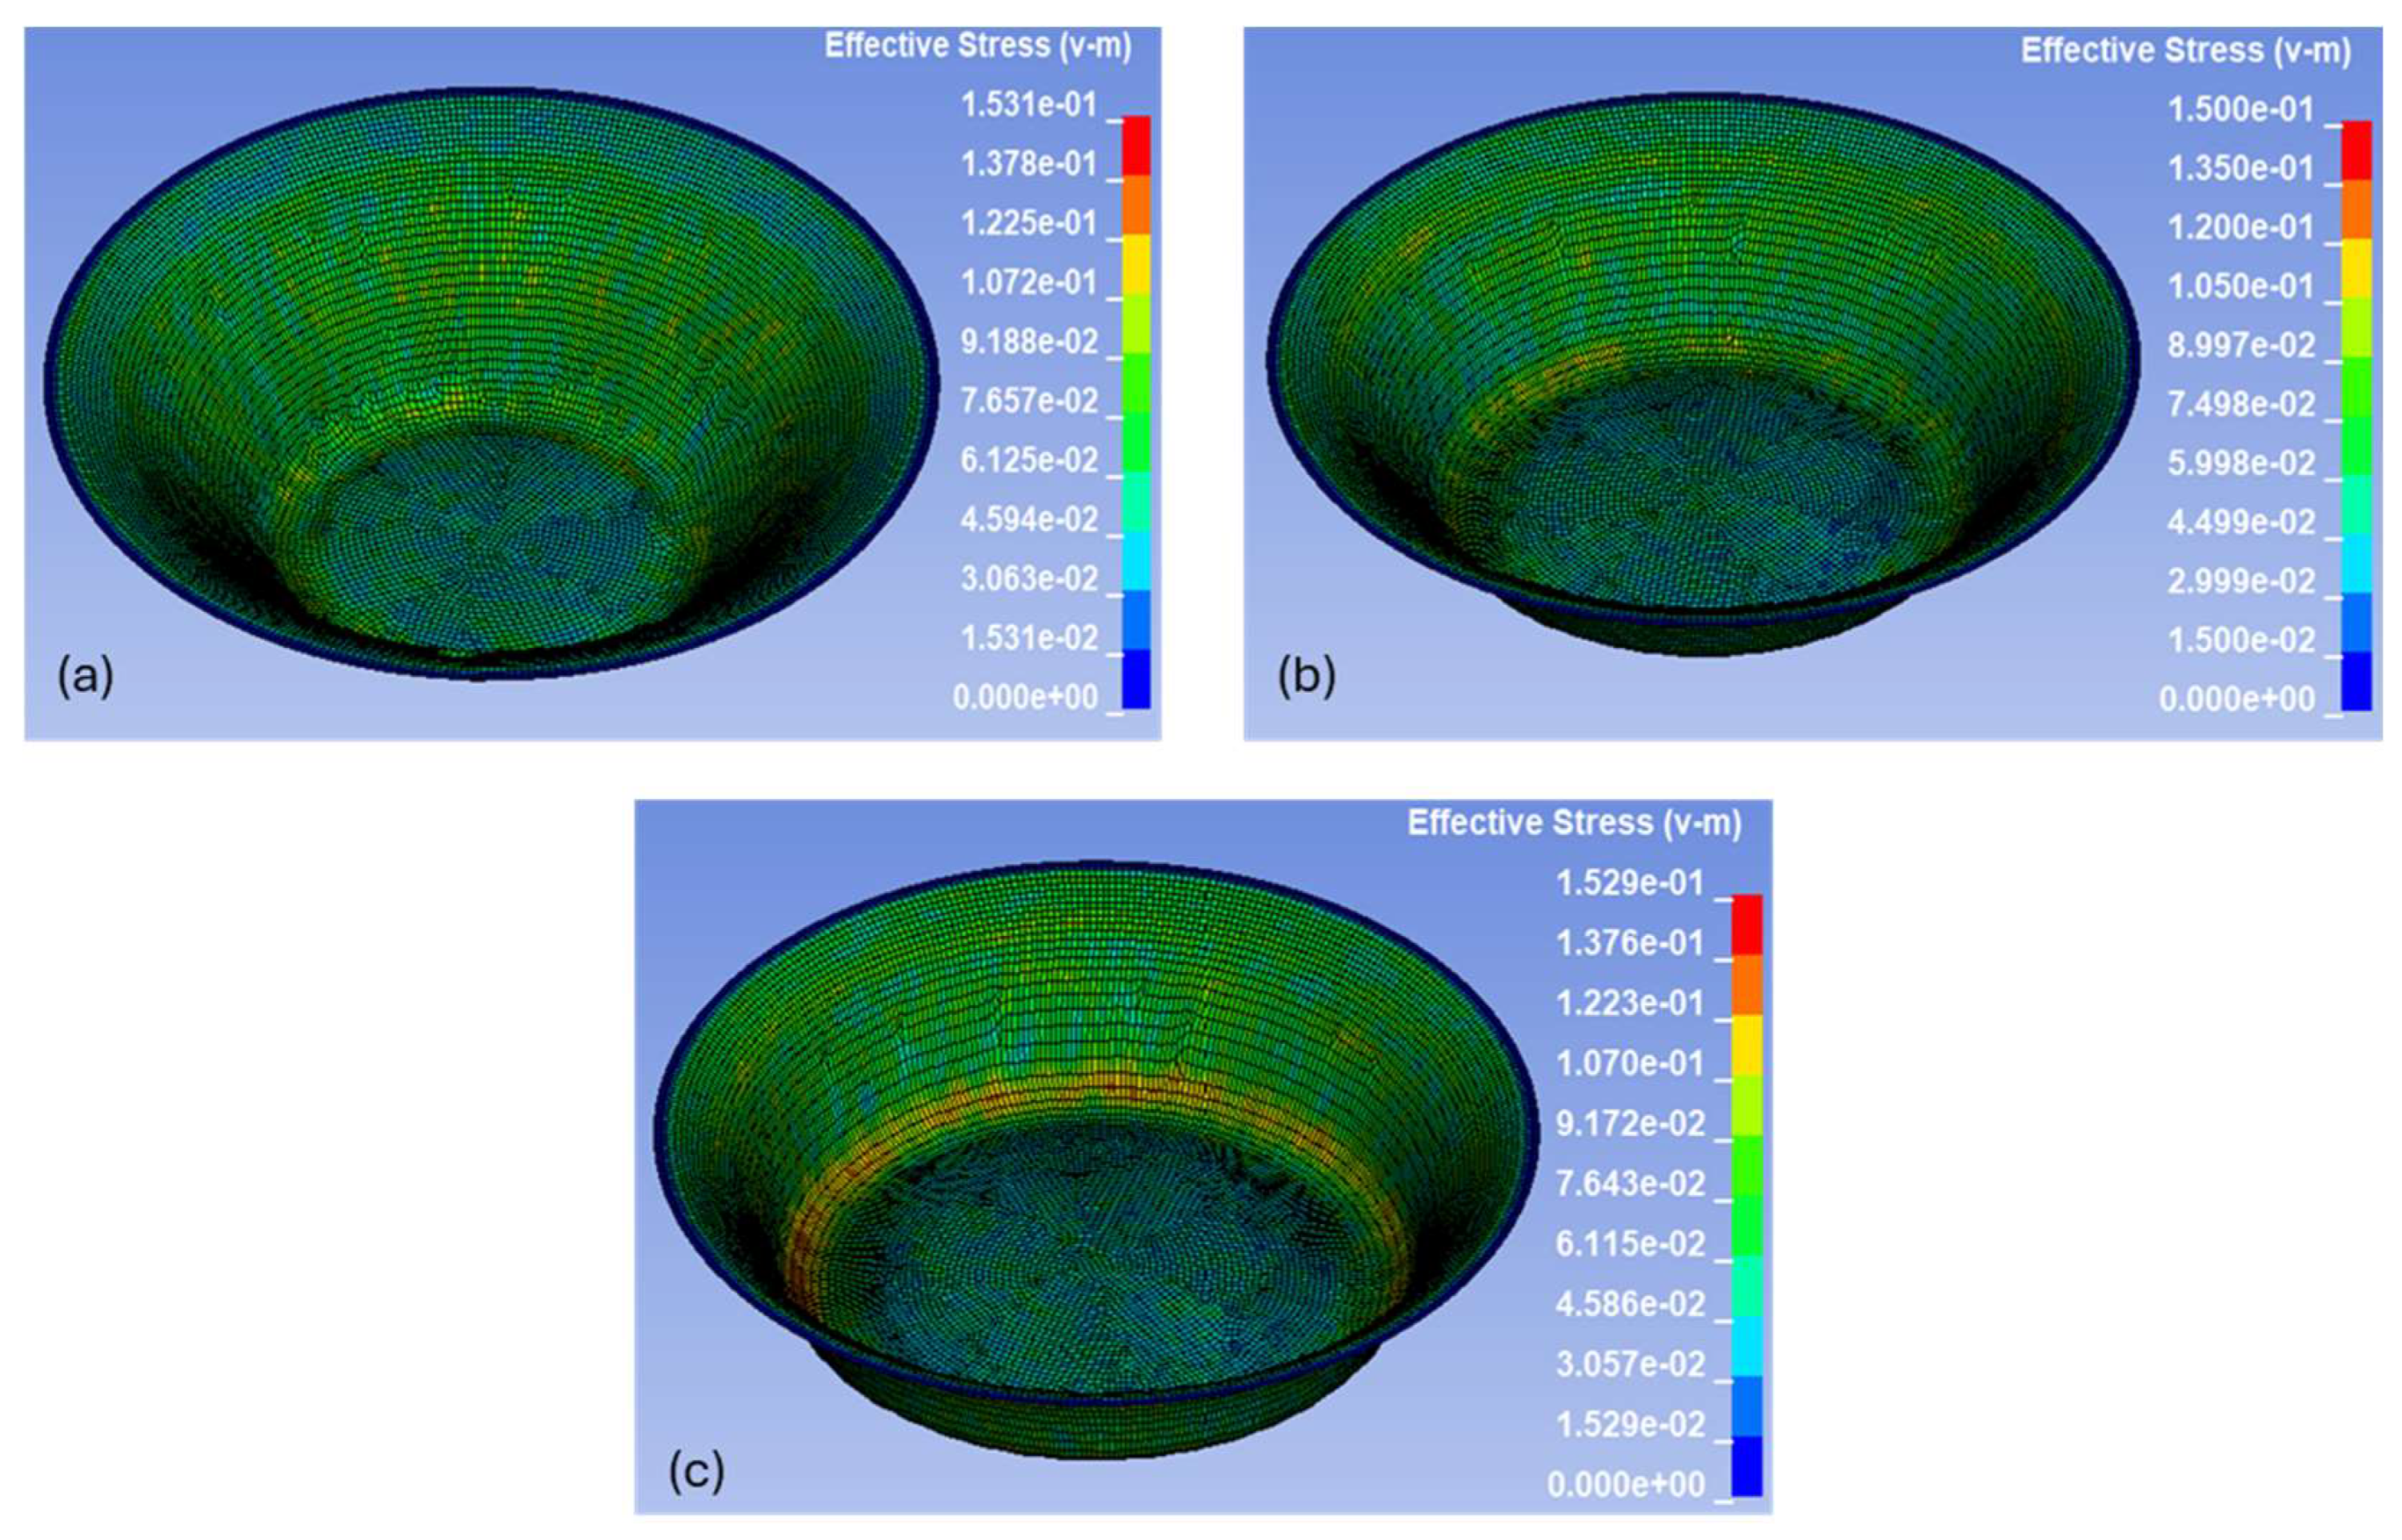
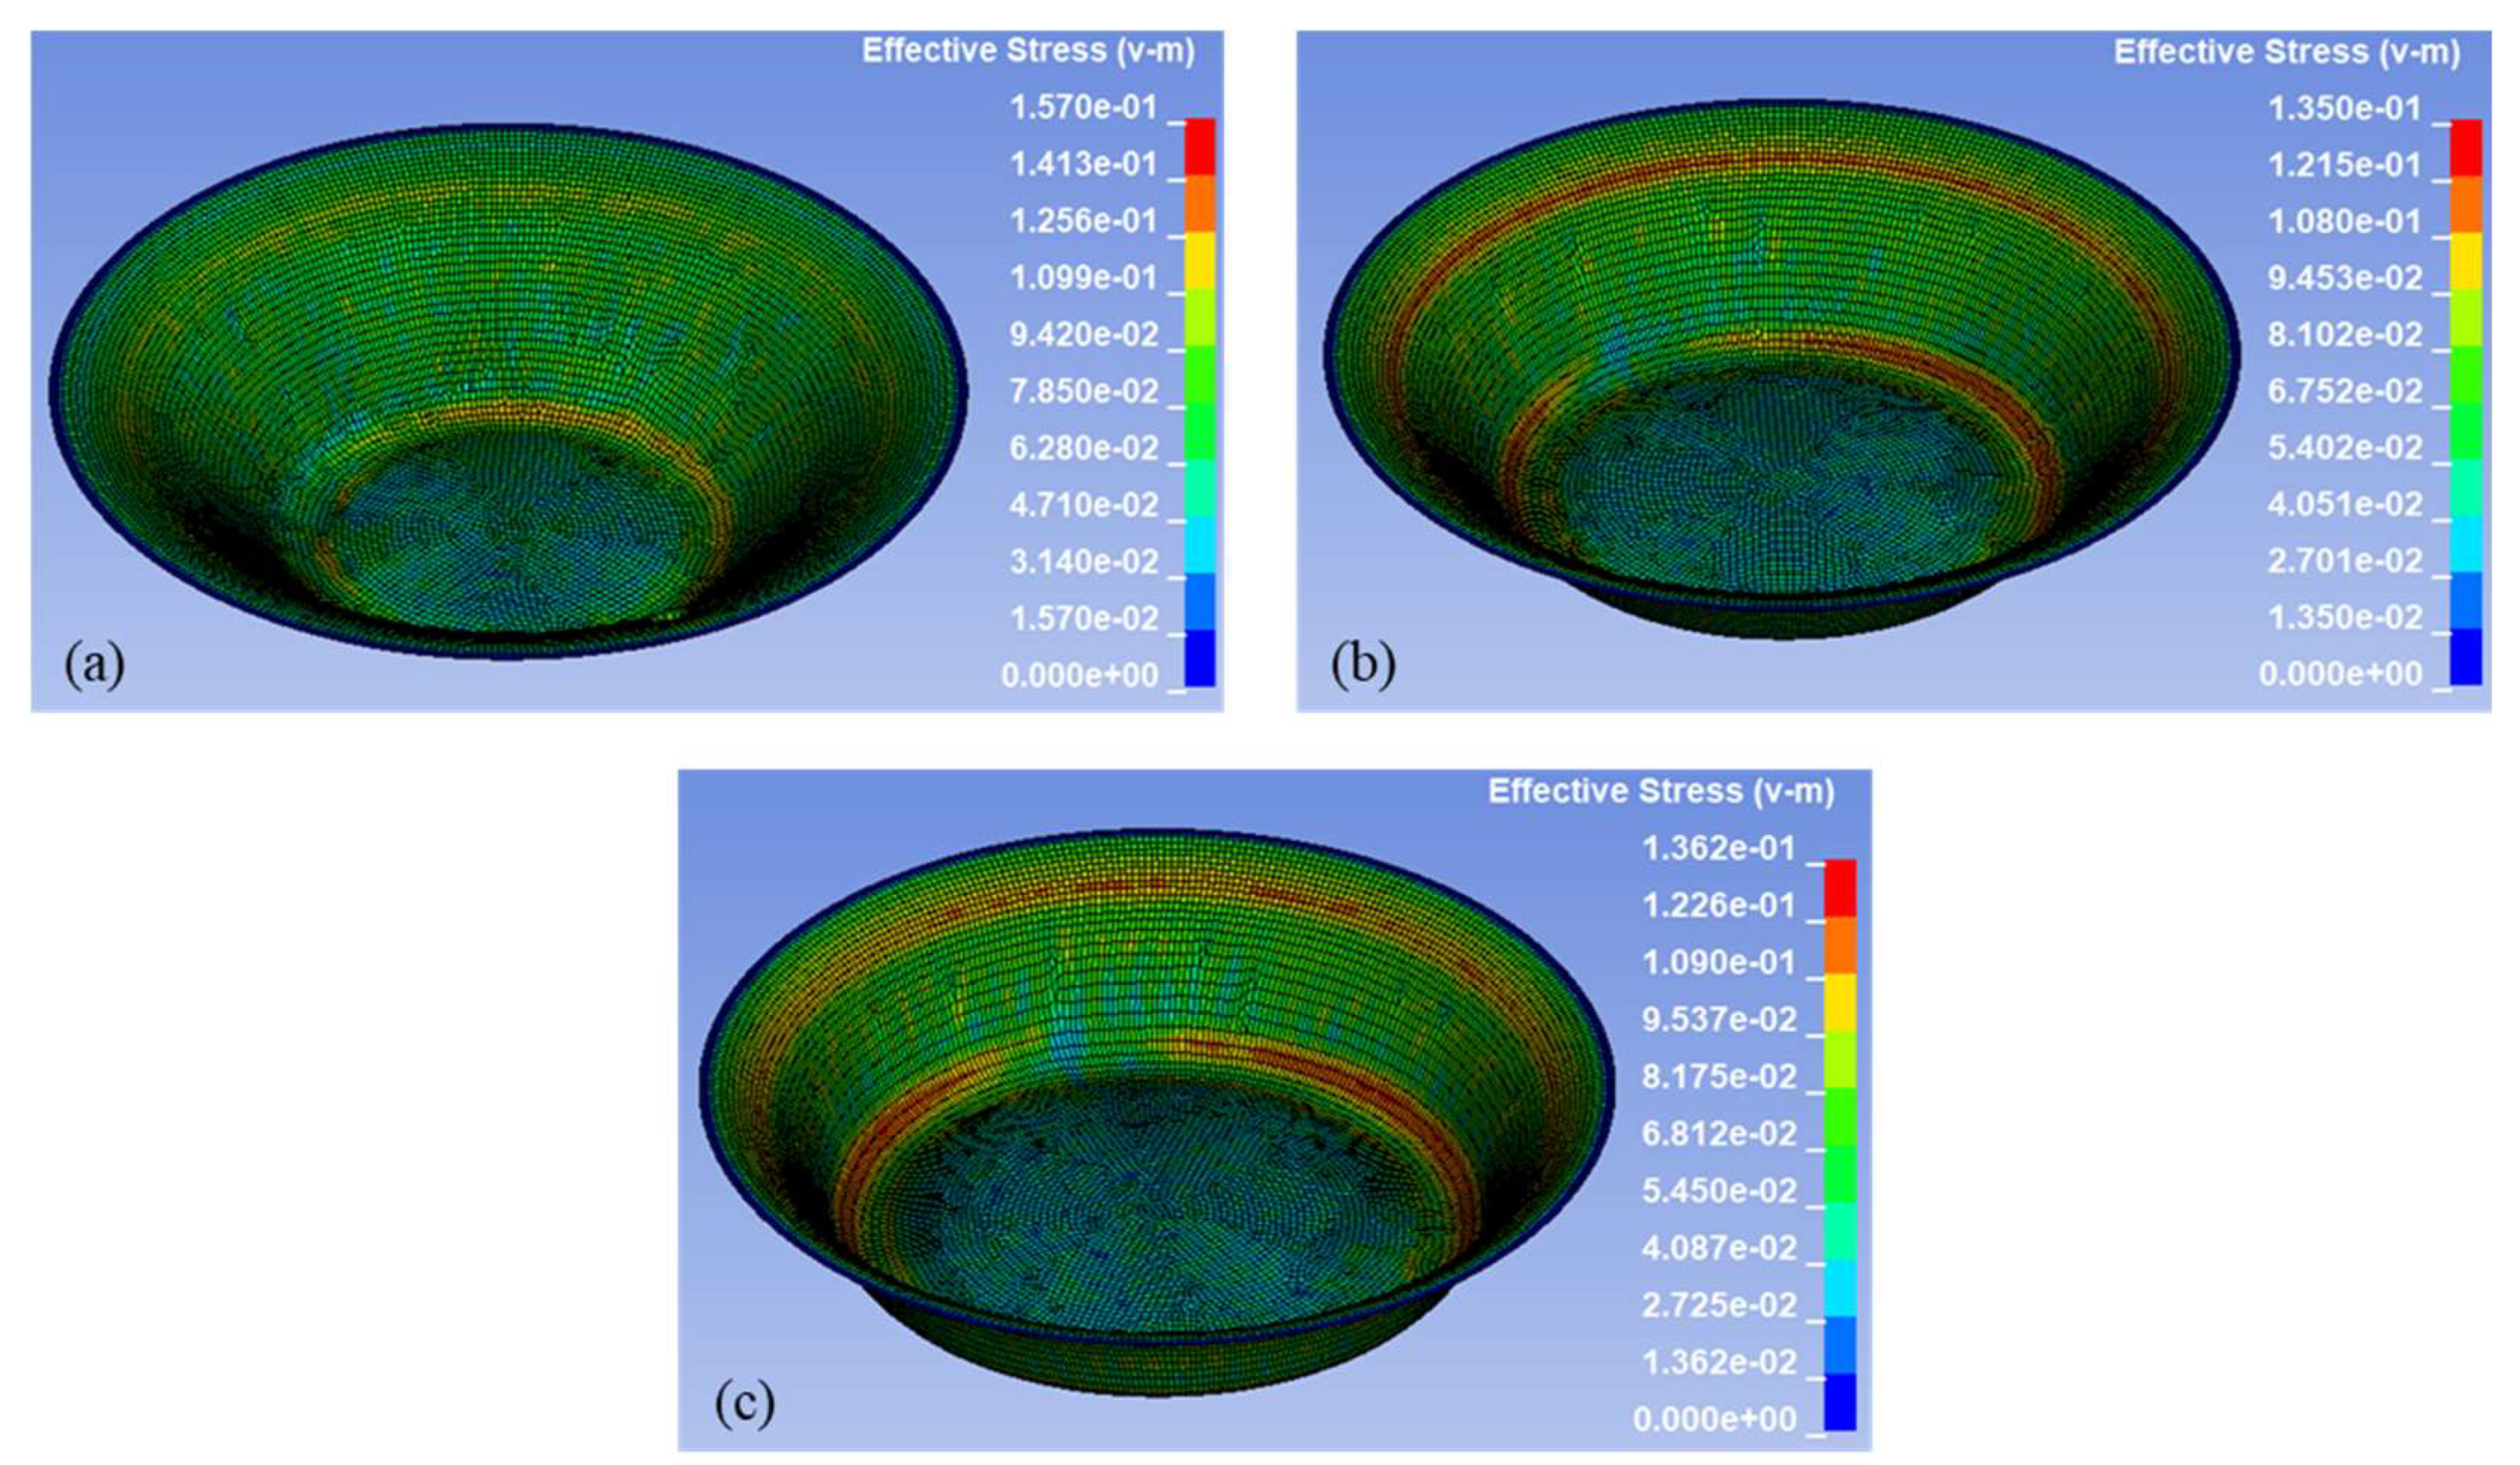
Figure 13 presents von Mises stress contours for a 0.75 mm step size at the same wall angles, highlighting multiaxial stress conditions and localized concentrations. These results complement the strain distribution by identifying regions susceptible to yielding or failure due to multiaxial loading conditions in SPIF. Additional stress distributions for varying step sizes are available in
Figure A6 and
Figure A7.
In
Figure 13a, which corresponds to a 45° wall angle, the stress distribution is relatively uniform throughout the part, of approximately 0.062 to 0.125 GPa. This range of stress indicates plastic deformation without severe stress concentrations, suggesting a more distributed strain field and stable forming behavior. In
Figure 13b,c, which correspond to 55° and 65 wall angle, the stress becomes more localized. Yellow to red bands can be seen near the upper and lower regions of the wall along the tool path, representing effective stress values in the range of 0.081 to 0.135 GPa. These narrow high-stress zones suggest increased strain localization and elevated forming intensity compared to the 45° case.
Figure 13c which corresponds 65° wall angle, stress concentration becomes more severe. Distinct red and orange rings emerge along the upper and lower wall, indicating local stresses in the range of 0.109 to 0.136 GPa. These bands suggest intensified plastic strain and the potential onset of localized thinning.
Overall, the stress results align well with strain and thinning patterns, confirming that increased wall angle elevates multiaxial stress conditions. These plots reinforce the importance of stress-based assessment in SPIF simulations to predict critical deformation zones and guide process optimization.
4.4. Comparison of Experimental and Numerical Results
To validate the accuracy of the numerical simulation, a comparative analysis was conducted between the experimentally measured thickness values and FEA-predicted results at three forming depths: 7 mm, 11 mm, and 14 mm. The results are summarized in
Table 6 for each of the nine experimental conditions.
Overall, the simulation results show strong agreement with experimental data. At a 7 mm forming depth, the average deviation across all conditions remained under ±5% with one exception of −7.14%, which confirms that the simulation captured the initial thinning stage reliably. At forming depths of 11 mm and 14 mm, the deviation remained within ±5% for most conditions, except for simulations for a 65° wall angle, where the numerical model significantly underestimated thinning by 9.09% to 19.35%, depending on the step size.
The largest deviation was observed at higher wall angle (65°) and smaller step size (0.25 mm), where the simulation tended to underpredict thinning at greater depths. For example, 65°, 0.25 mm step size showed a −19.35% deviation at 14 mm, indicating limitations in the model’s ability to accurately capture severe localized plasticity. Nevertheless, most deviations remained within acceptable limits (<10%), which is consistent with previous SPIF simulation validations. The trends across wall angles and step sizes were also mirrored between experiment and simulation. Lower wall angles consistently resulted in less thinning, and smaller step sizes led to more uniform thickness retention outcomes well-captured by the numerical results. These findings confirm that the developed FEA model provides a reliable framework for predicting thinning behavior in SPIF, particularly when used for comparative and optimization studies. However, the discrepancies at high wall angles suggest further model refinement.
Furthermore, at lower wall angles, both experimental and simulated outcomes showed less thinning and moderate strain. The strain contour plots in these cases indicate low strain levels. This corresponds with retained thickness values near 0.68–0.73 mm in the experimental study, validating the simulation’s ability to reflect moderate, evenly distributed deformation. In contrast, with a 65° wall angle, both experimental and simulated results confirmed significant thinning and high plastic strain, especially with 0.75 mm step sizes. These consistencies substantiate the numerical model’s accuracy in predicting failure-prone zones.
5. Conclusions
This study investigated the thinning behavior of AA3003 aluminum alloy in SPIF through a combination of experimental trials and finite element simulations using LS-DYNA. The effects of step size and wall angle were systematically examined across a full factorial design, revealing that higher wall angles and larger step sizes lead to greater thinning due to increased material stretching and localized plastic deformation. The simulation results, including thickness distribution, effective plastic strain, and von Mises stress contours, closely matched experimental observations, with deviations generally within acceptable limits. These findings confirm the suitability of the developed FEA model for accurately capturing localized thinning and validating deformation mechanisms in SPIF.
While non-uniform thinning is observed along the formed wall, this variation can be attributed to a combination of factors such as strain path complexity, tool-sheet contact conditions, and material flow behavior. In SPIF, the strain path is highly non-linear due to the incremental tool movement, resulting in localized deformation zones that affect thickness distribution. Additionally, continuous tool-sheet contact generates varying pressure and frictional conditions along the wall, influencing how material is stretched or compressed. Material flow is further restricted near the clamped regions and freer near the open edge, contributing to asymmetric thinning. These factors collectively lead to the observed non-uniformity, and understanding their interplay is critical for accurate prediction and process optimization.
The integrated approach of combining experimental data, statistical analysis, and numerical simulations provides a robust framework for examining how process parameters influence thinning behavior in AA3003-H14. This work highlights the dominant effect of wall angle and the moderate yet relevant role of step size, contributing to improved process control and thickness uniformity in SPIF. In doing so, the study addresses a key gap in the literature by focusing on AA3003-H14, a widely used yet underexplored aluminum alloy in SPIF applications and demonstrates how validated FEA can support process optimization while minimizing experimental effort, material waste, and time.
To enhance the predictive reliability of SPIF models and extend applicability to complex geometries and advanced materials, future research should incorporate damage evolution, adaptive meshing strategies, and material models capable of capturing failure mechanisms. Investigating heat-treated or high-strength aluminum alloys, along with non-axisymmetric geometries, may also advance SPIF for broader industrial use in aerospace, automotive, and biomedical applications. Additionally, future studies should explore the influence of other key process parameters such as tool diameter, feed rate, spindle speed, and lubrication conditions on thinning behavior to develop a more comprehensive insight into their individual and interactive effects. This will enhance real-world implementation in applications where thickness tolerance and structural integrity are critical, such as pressure vessels or aerospace sheet components. This will support the development of more generalized and robust SPIF models applicable to a wider range of forming scenarios.

