Article

Spot Melting Strategy for Contour Melting in Electron Beam Powder Bed Fusion

1
Chair of Materials Science and Engineering for Metals, Friedrich-Alexander-Universität Erlangen-Nürnberg, Martensstr. 5, 91058 Erlangen, Germany
2
Pro-Beam Additive GmbH, Zeppelinstr. 26, 82205 Gilching, Germany
*
Author to whom correspondence should be addressed.
J. Manuf. Mater. Process. 2025, 9(9), 303; https://doi.org/10.3390/jmmp9090303
Submission received: 28 July 2025 / Revised: 29 August 2025 / Accepted: 3 September 2025 / Published: 4 September 2025
(This article belongs to the Special Issue Advances in Powder Bed Fusion Technologies)

Abstract

Spot melting is an emerging alternative to traditional line melting in electron beam powder bed fusion, dividing a layer into thousands of individual spots. This method allows for an almost infinite number of spot arrangements and spot melting sequences to tailor material and part properties. To enhance the productivity of spot melting, the number of spots can be reduced by increasing the beam diameter. However, this results in rough surfaces due to the staircase effect. The classical approach to counteract these effects is to melt a contour that surrounds the infill area. Creating effective contours is challenging because the melted area ought to cover the artifacts from the staircase effect and avoid porosity in the transition area between the infill and contour, all while minimizing additional energy and melt time. In this work, we propose an algorithm for generating a spot melting sequence for contour lines surrounding the infill area. Additionally, we compare three different approaches for combining the spot melting of infill and contour areas, each utilizing a combination of large infill spots and small contour spots. The quality of the contours is evaluated based on optical inspection as well as the porosity between infill and contour using electron optical images, balanced against the additional energy input. The most suitable approach is used to build a complex brake caliper.

Graphical Abstract

1. Introduction

Spot melting, first described by Dehoff et al. [1], is an emerging alternative to the traditional line melting in electron beam powder bed fusion (PBF-EB). This approach allows an almost infinite number of spot arrangements and spot melting sequences to tailor material and part properties. However, the reuse of thermal energy by melting subsequent lines is often missing. Therefore, higher total energy consumption is necessary to melt a layer, which increases the layer processing time. In order to increase the productivity of spot melting, the number of spots can be decreased by increasing the beam diameter close to millimeters. Due to the high-power electron beam guns, the dwell time can be kept constant, and the layer processing time reduces. The obvious disadvantages are bigger melt pools and a low spot density, leading to a worse surface resolution by introducing a staircase effect perpendicular to the build direction. Similarly to the staircase effect in build direction, which is more pronounced at a higher layer thickness leading to a worse surface resolution [2,3], the staircase effect perpendicular to the build direction worsens with a lower spot density. Consequently, the staircase effect is pronounced when spots are located on tetragonal lattices compared to hexagonal lattices.
The surface quality of PBF-EB parts can be increased in different ways. One classical way is to adapt the scan strategy by melting contours [4]. In line melting it is shown that the addition of contour lines can reduce the surface roughness compared to exclusively hatched samples [5]. There are different approaches for melting a contour line. The simplest solution is to melt a contour line with a single melt pool, for example used by Sullivan et al. [6]. This single melt pool can also be divided into several segments like in the approach from Wang et al. [7]. It is well known that the surface quality is increased for lower beam velocities [6,8]. In order to reduce the contour melting time, multiple coexisting melt pools are used to melt parts of the contour in parallel. This technique is implemented in Arcam’s Multibeam® method, for example described by Klingvall et al. [9] and Biffi et al. [10]. Wang et al. [11] compared the surface after applying a continuous contour against a Multibeam® contour. They reported a higher as-built surface roughness for the Multibeam® contour in favor of better dimensional accuracy. According to Pandian et al. [12], who used Arcam’s Multibeam® strategy, melting the contour before the hatch yields a lower surface roughness. For the continuous line contour, Sullivan et al. [6] achieved a lower surface roughness by melting the contour after the hatch. Another comparison between Multibeam® contour and continuous line contour is described by Zhao et al. [13]. The authors concluded that continuous contours melted with a high energy after hatching result in the best surface roughness. Their Multibeam® contour showed a higher defect density including porosity in the transition zone between contour and hatch. Karimi et al. [14] also reported a better surface quality for continuous line contours compared to contours created with their applied spot melting strategy. The sample with a spot melted contour shows a high distribution of defects in the contour and transition zone between contour and hatch, which is known to negatively impact the mechanical properties [15]. Roos et al. [16] described spot melting-based contours and the influence of parameters like dwell time, return time, and spot distance on the surface roughness of the vertical surfaces of cuboids.
In summary, the results described in the previous literature do not provide a consistent picture of the optimal contour strategy. Porosity in the transition area between the infill and contour [13,14] suggests that the contour needs to be coordinated with the infill area. However, prior studies focus almost exclusively on cuboid samples, creating a simplified scenario where the width of the transition area is approximately constant, which is not the case for complex geometries.
In this work, we address the challenge in utilizing spot melting for contours around a spot melted complex infill area. We focus on developing our own algorithm to create an optimal contour spot melting sequence that ensures defect-free contours, minimizes additional melting time, and reduces energy consumption. We achieve this by employing a novel graph-based method to arrange contour segments into a short path and mitigate the staircase effect by repositioning infill spots, while integrating these adjusted spots into the infill spot sequence. In the first section we present the spot sequence as well as the investigated spot arrangements, and the experimental setup for our demo part. After identifying the best performing spot arrangement, we showcase the transferability to complex geometries using a Ti-6Al-4V brake caliper (CAD-model from [17]).

2. Materials and Methods

In this work, we split the melt area into a contour and an infill area. Figure 1a displays the schematic principle. The contour area is defined as the area between the border of the geometry and a negative offset from the geometry border. Its width is equal to a multiple of the number of applied contour lines, which are offset lines of the geometry boundary. The infill area is the difference between the melt area and the contour area. In this work, we apply the graph-based spot melting strategy described in [18] for the infill area. There are two main principles behind this strategy. Firstly, the return time of the beam to neighboring spots is maximized. This is ensured by consecutively melting groups of points, which are created by applying a certain point skip. Secondly, the strategy targets short jumps with a narrow jump distance distribution, meaning all jumps from spot to spot should be short and as equal in length as possible. This avoids disadvantageous effects like spot dwell time losses due to traveling of the beam or jump accuracy issues. These general principles should also apply for the contour melting strategy.

2.1. Contour Sequence Planning Algorithm

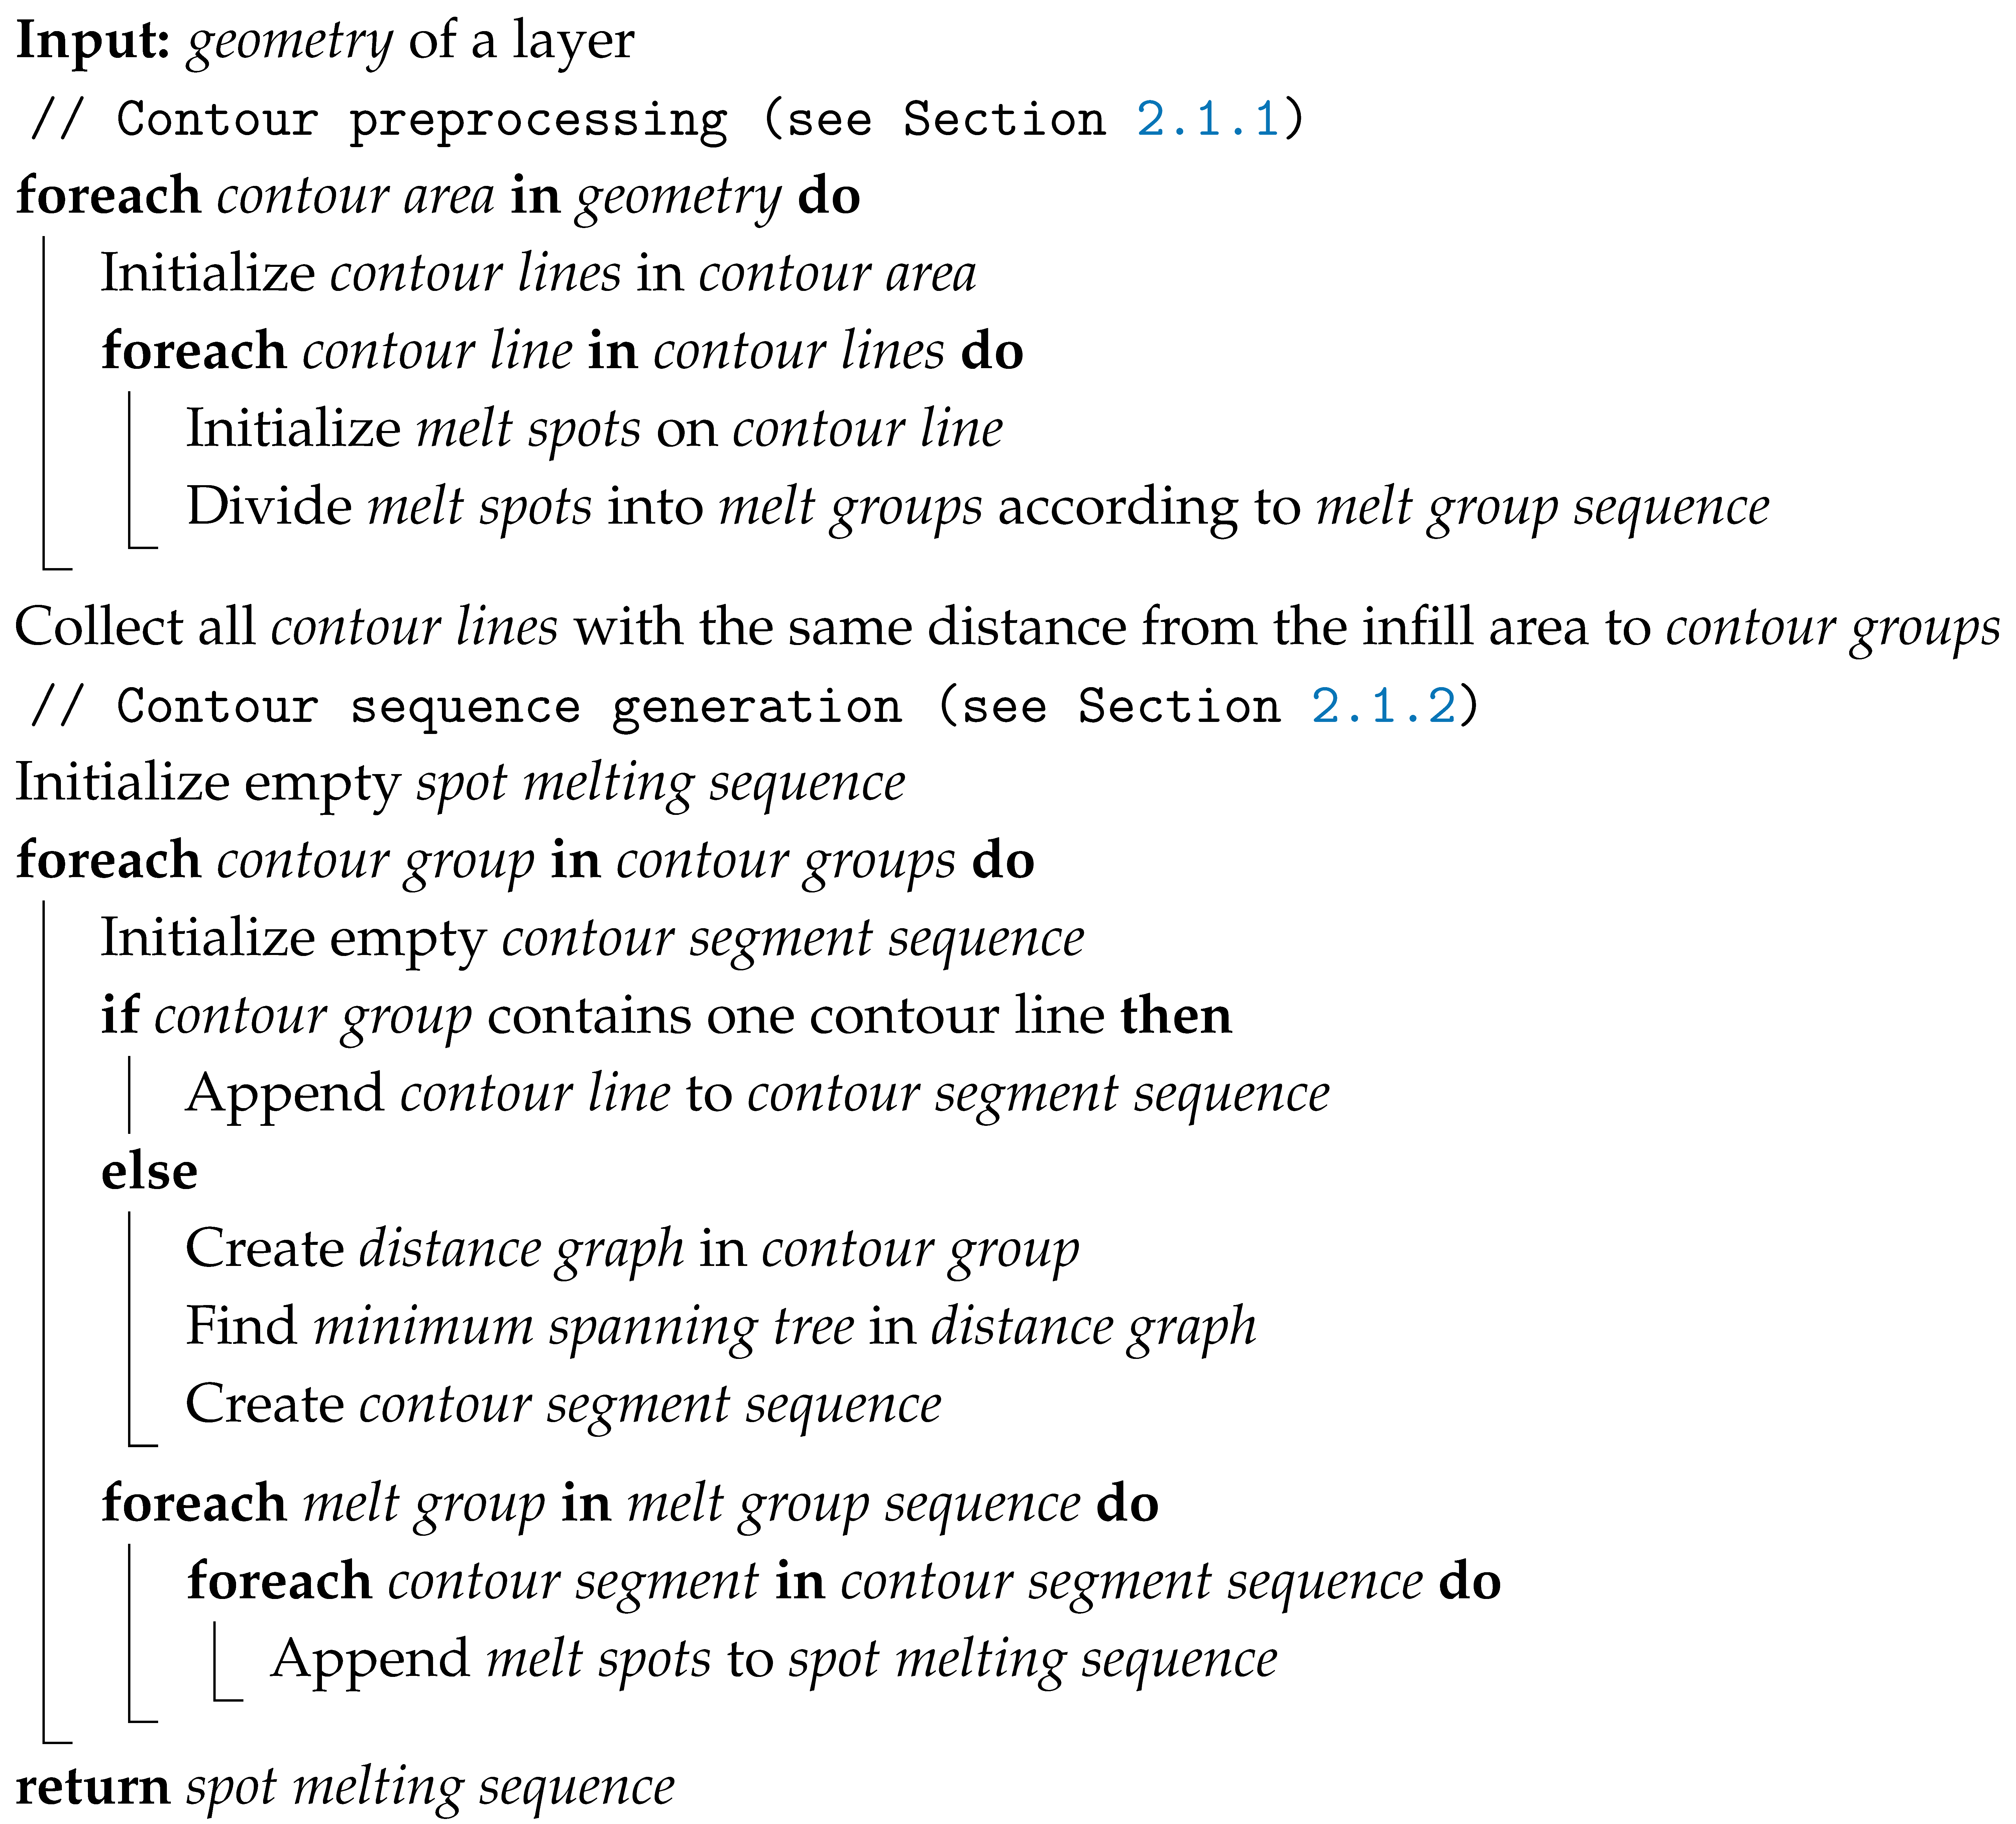
In general, the infill area is molten before the contour area. The contour sequence planning algorithm is split up into two parts. First, the contour area is preprocessed to create all melt spots according to individual contour lines. Second, all melt spots are ordered into a spot melting sequence. The whole algorithm is shown in Algorithm 1, whose individual parts are further explained in the following subsections.

2.1.1. Contour Preprocessing

As displayed in Figure 1a, the geometry is divided into an infill area (light-gray) and a contour area (dark-gray). The infill area is optimized for productivity, applying a spot spacing of 400 μ m with a large beam diameter and a high dwell time. The contour area includes smaller spots located along contour lines. The spacing between contour lines is 90 μ m . The spot spacing on the contour lines is approximately 100 μ m .
For simple geometries likes cubes and cylinders, each contour line in the contour area is connected. However, the hollow cylinder example already reveals two individual contour lines at the inner and outer geometry borders. Therefore, all contour lines with the same distance from the geometry border are collected into contour groups.
Inside the contour area, the contour groups are molten consecutively, starting with the one closest to the infill area (see Figure 1b, contour group 1). In addition, each contour group is divided into melt groups using a point skip [19], aiming for independent melt pools for contour spots combined with an even energy distribution throughout the whole contour area. Throughout this work, eight melt groups, ordered according to the melt group sequence displayed in Figure 1b, are applied to all geometries. In principle, the number of melt groups can vary, but eight melt groups seems to be a good compromise between having a high return time and maintaining a low number of groups to prevent skipping small contour segments. To prevent skipping contour lines in the contour melting sequence, the number of spots must be a multiple of the number of melt groups. If this requirement is not met for a particular contour line, the appropriate number of spots is achieved by slightly decreasing the spot spacing on that specific contour line.
Algorithm 1: Contour sequence planning algorithm.
Jmmp 09 00303 i001

2.1.2. Contour Melting Sequence

When a contour group consists of more than one contour line, an order in which the contour lines are melted is necessary. Creating a narrow jump distance distribution, a general principle of our spot melting approach, is especially important for contour melting due to the required high jump accuracy at the geometric surface. Additionally, due to the significantly shorter dwell time of contour spots, travel time accounts for a larger portion. Consequently, the travel distance should be as small as possible. For the hollow cylinder, this task is trivial, because the inner and outer contour areas are always separated by the same distance. However, the contour scan strategy should also be transferable to complex geometries in order to fabricate complex parts. Therefore, a more complex example is sketched in Figure 2a. Here, the geometry consists of three melt areas (gray), where one of them includes a hole. Consequently, each contour group consists of four individual contour lines. The aim is now to find a path through all contour lines with minimum jump distances between them. That is achieved using a Python implementation of the following three steps.
In the initial step, the network, or graph, containing all distances between contour lines is created. In this graph, each contour line within a contour group is represented by an element, which is called a vertex. The connections between two vertices are referred to as edges. Each edge is assigned a weight, equal to the minimum distance between the corresponding vertices (contour lines). Figure 2b shows the corresponding distance graph.
In the second step, the minimum spanning tree, the subgraph with the minimum total edge weight which connects all vertices, is determined using Kruskal’s algorithm [20]. In this work, the function ‘minimum_spanning_tree’ provided by the Python library NetworkX [21] is used. The algorithm begins by sorting all edges of the complete graph in ascending order by weight. It then initializes a subgraph containing only the contour line vertices and no edges. Each edge is evaluated in order: if adding it does not form a connecting tour, it is included in the subgraph. This process continues until no further edges can be added without forming a connecting tour. The resulting subgraph is the minimum spanning tree of the complete graph. The edges of the minimum spanning tree are marked in red in Figure 2c.
In the last step, the melting sequence of the spots inside the contour lines is determined. Therefore, the contour lines are split up into contour segments at the points of minimum distance between two contour lines (see Figure 2c). The contour segment sequence is created by starting at an arbitrary contour segment and following it (counter-)clockwise until an edge of the minimum spanning tree is reached. This edge is followed to the next contour segment, and the process is repeated until the starting spot is reached again. Upon reaching the starting point, the tour is repeated with the next melt group until all melt groups in one contour group are processed. The final spot melting sequence in a contour area is determined by iterating over all contour groups.

2.2. Spot Arrangement

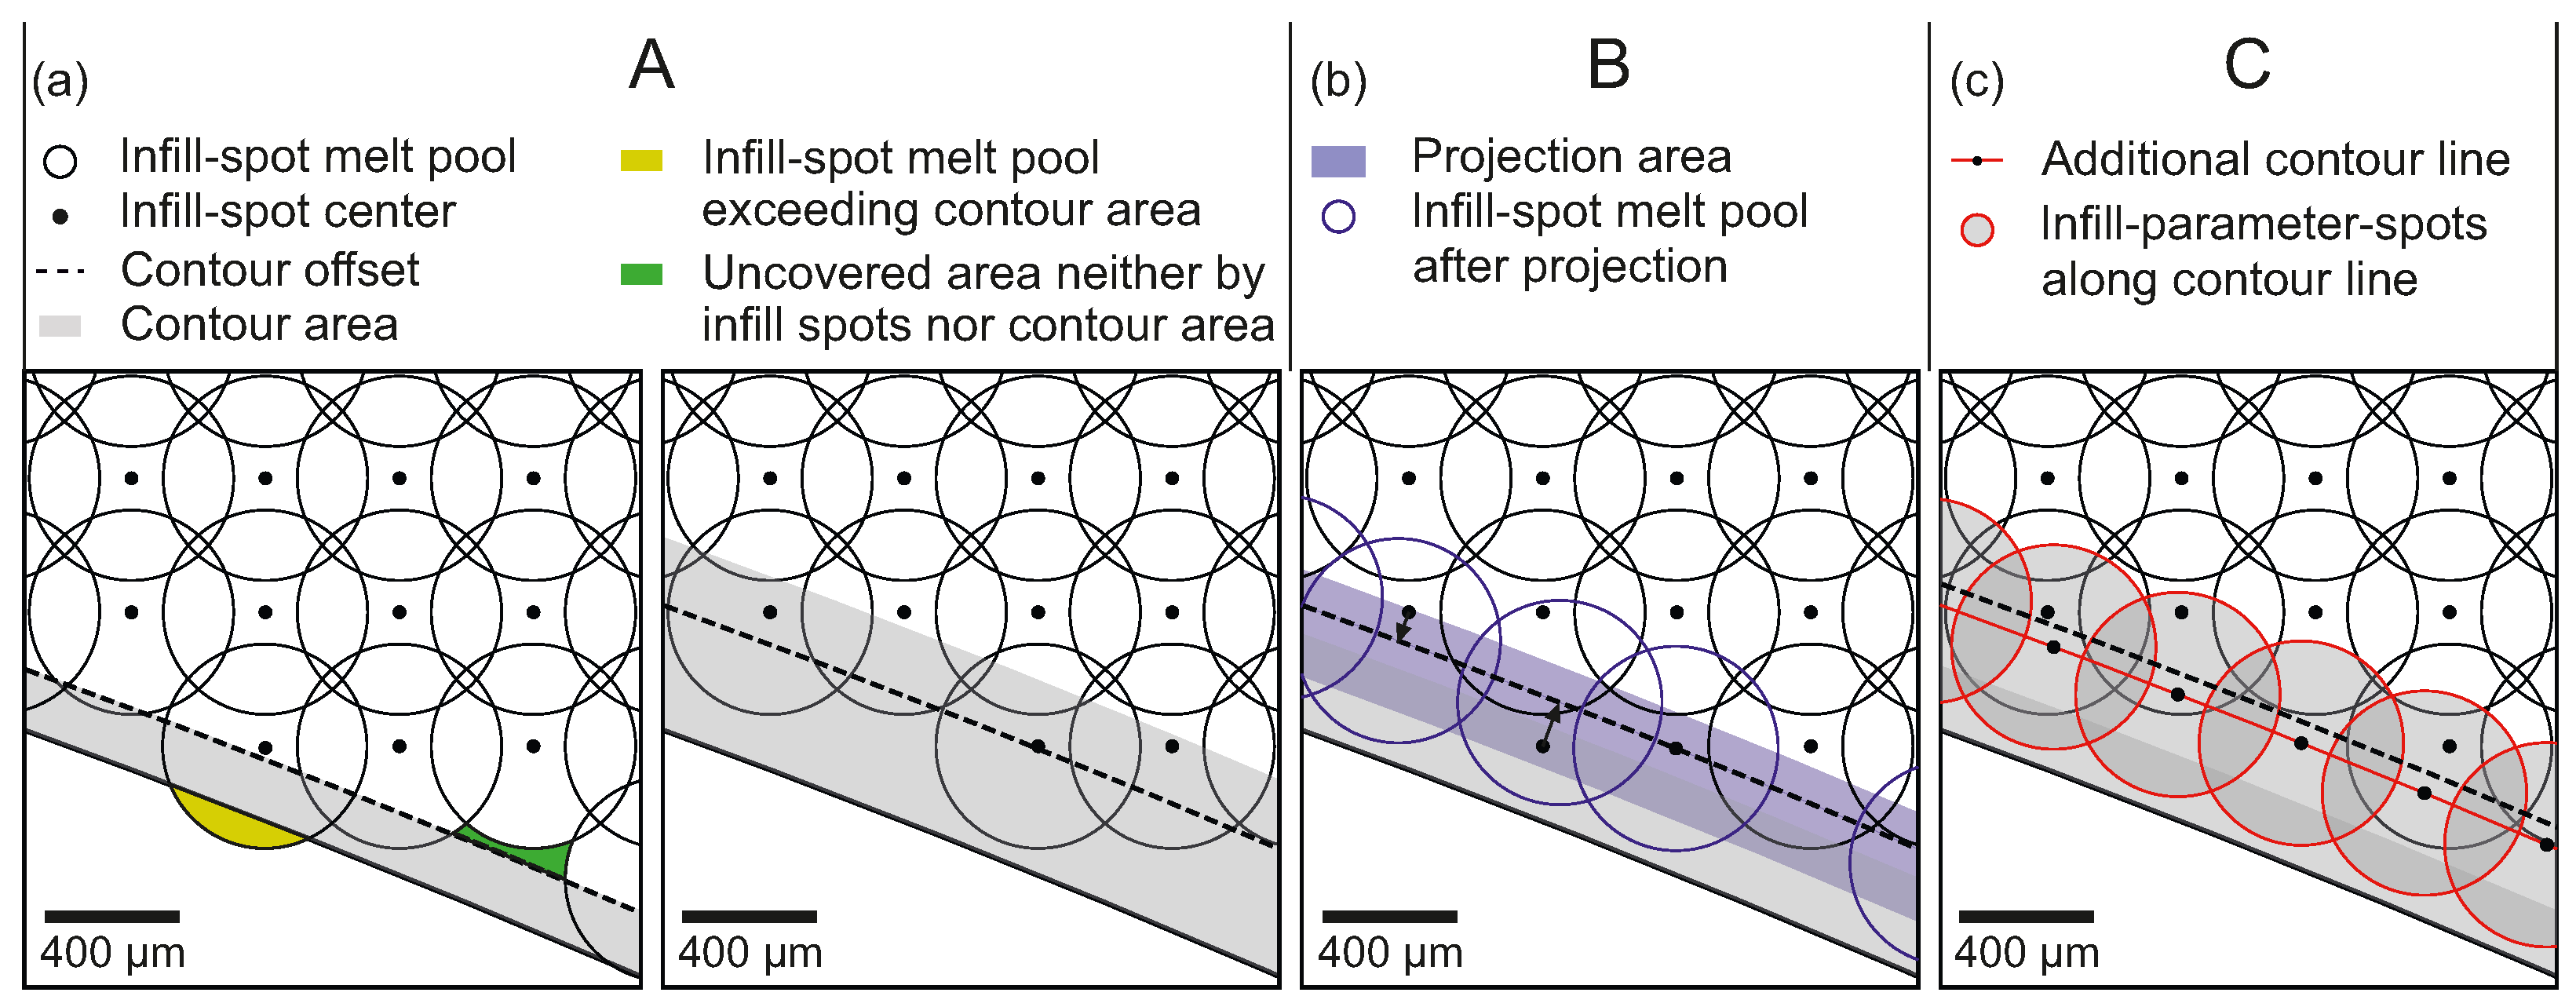
When applying a narrow contour area consisting of few contour lines combined with large, productivity-oriented infill spots, two issues exemplified in Figure 3a arise.
The averaged melt pool diameter, measured from infill spots at the surface, is 610 μ m , represented by black circles around the centers of the melt spots (black dots). The centers of the infill spots are located on a square lattice with size  400 μ m . The geometry boundary is indicated by a solid black line. The contour area, shown in gray and composed of three contour lines, each 90 μ m wide, starts at the geometry boundary and expands towards the infill area. The minimum distance between infill spot centers and geometry boundary is from now on labeled as the contour offset (dashed black line). The yellow area represents an overshoot, where an infill melt pool is visible on the outside of the surface. Between the contour and the infill area, the green area identifies a region, where no melting occurs, which is a possible source for porosity. In this section, three approaches are presented to overcome these issues.
Figure 3a illustrates the most simplistic approach (arrangement A), increasing the size of the contour area by adding more contour lines, thus moving from three contour groups to seven. The purpose of adding extra contour lines is to, firstly, increase the overlap between contour and infill, thereby eliminating porosity in the transition zone. Secondly, the additional contour lines allow adjustment of the contour offset towards the infill area to prevent overshoot. This approach results in a higher contour melting time as well as a higher total energy consumption.
The second approach (arrangement B) is based on a different concept, which is outlined in Figure 3b. Instead of increasing the width of the contour area to cover the overshoot issue, the aim is to reduce the staircase effect of the infill spot pattern. This is achieved by changing the spot locations in the infill area. The number of contour lines remains constant. A projection area (blue) is introduced with an inner boundary (towards the infill area) and an outer boundary (towards the contour area). Every infill spot whose center is located in the projection area is projected onto the contour offset. Thereby, potential overshoot spots are projected towards the infill, and slightly more infill spots are melted. The spots keep their position in the spot sequence of the infill area.
The third approach (arrangement C), outlined in Figure 3c, is designed to keep the energy and time consumption approximately equal to the hollow cylinder of Figure 1. In the contour group nearest to the infill area, the beam parameters are adjusted. Instead of contour spots, infill spots are melted with a distance of 400 μ m from each other, matching the lattice size of the infill spots. Additionally, the contour offset is adjusted towards the infill area to avoid overshoots.

2.3. Experimental Setups

2.3.1. Process Setup

All builds were carried out on a pro-beam EBM 30S with an acceleration voltage of 150 k V and Ti-6Al-4V Grade 23 powder from Tekna (Tekna Plasma Systems Inc., Sherbrooke, QC, Canada) with a powder size distribution between 45 μ m and 105 μ m . The build chamber was preheated with standard pro-beam preheating to a temperature of 1013 K . Each layer with a layer thickness of 50 μ m was split into a contour and an infill area. Spots in the infill area were positioned on a square grid with size 400 μ m and ordered in a sequence using the approach of Kupfer et al. [18]. The dwell time for infill spots was set to 333 μ s , and the beam current to 5.5   m A . The spots in the contour area were located on contour lines, which were separated from each other by 90 μ m . The spots along the contour lines were separated by approximately 100 μ m . Both parameter choices stem from previous in-house experiments, where they resulted in a contour area with adequate melt pool overlap. The dwell time for contour spots was set to 30 μ s and the beam current to 8 m A . The infill area was melted first. Afterwards, the contour lines were sorted regarding their distance to the infill area in ascending order and successively melted. After melting, one-layer electron optical (ELO) images with a side length of 200 m m , a hatch distance of 167 μ m , a velocity of 333 m   s 1 , and a power of 300 W were taken.

2.3.2. Hollow Cylinder

The first investigated part is the hollow cylinder sketched in Figure 1, which is built two times directly onto a stainless steel plate. The hollow cylinder has an inner diameter of 70 m m and an outer diameter of 80 m m .
The first time, the hollow cylinder was built using spot arrangement A from Figure 3a with three contour lines (270 μ m contour area width) and a contour offset of 270 μ m .
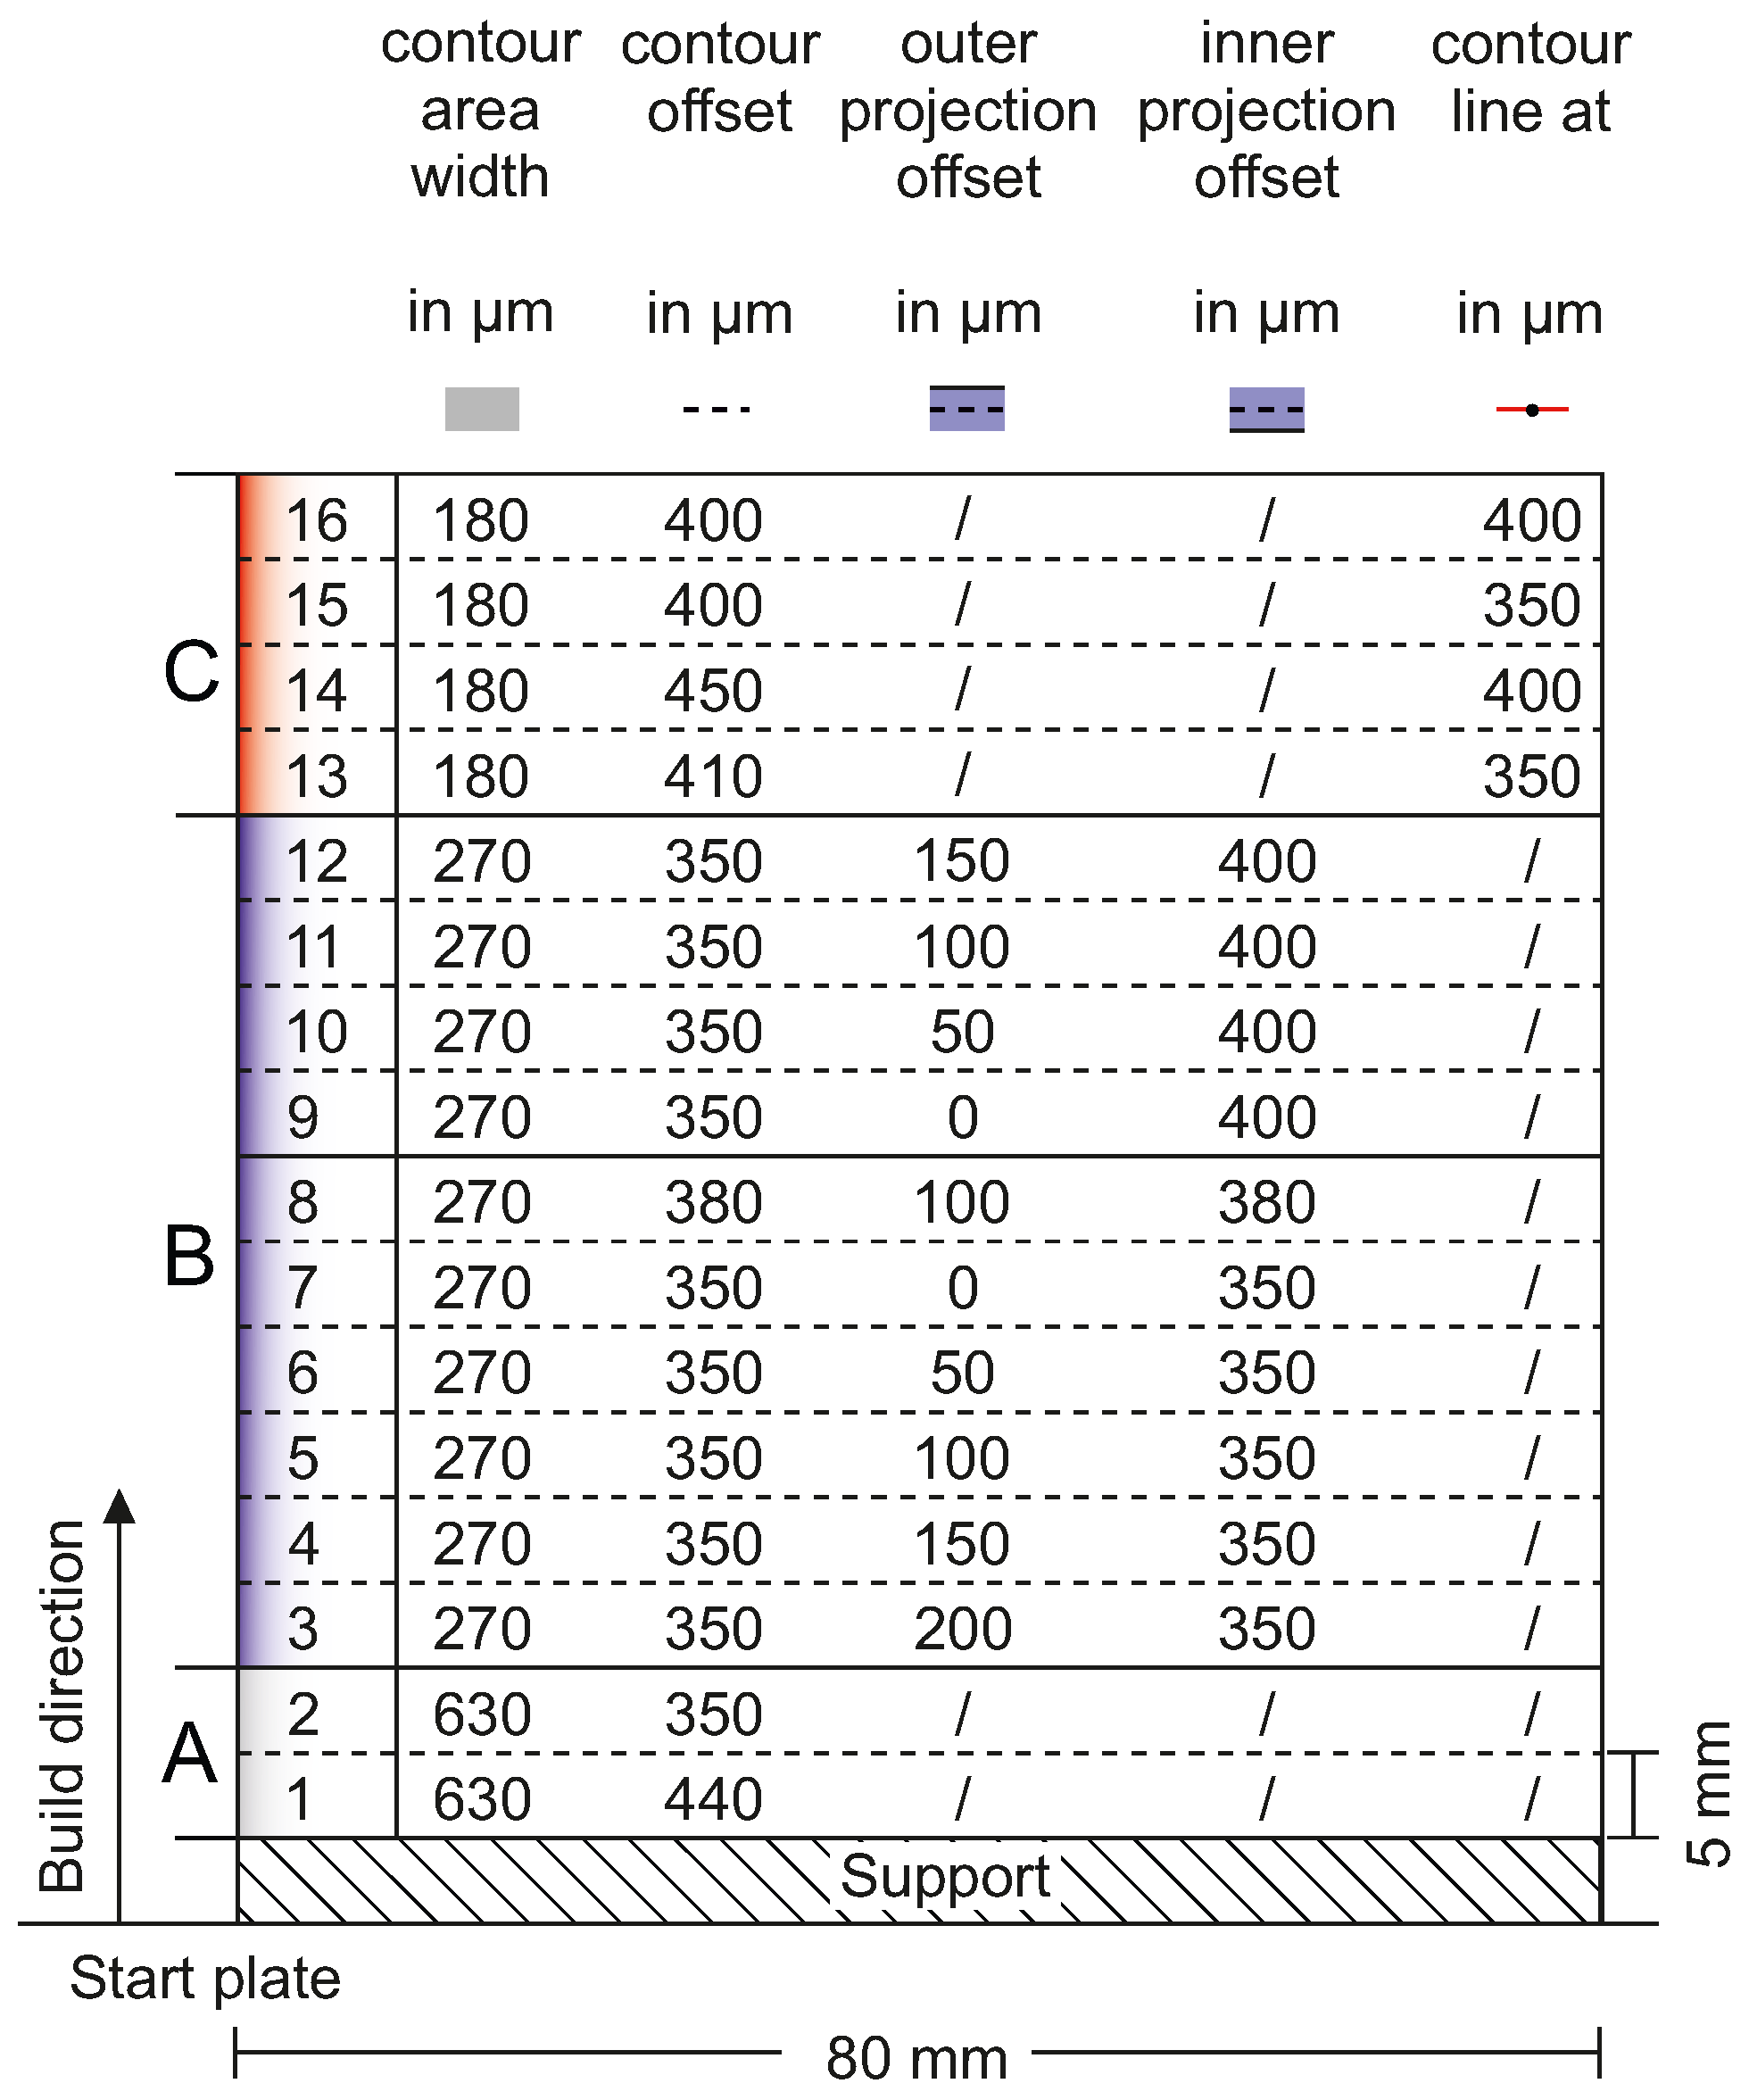
In the second build, different configurations of the proposed spot arrangement approaches were investigated. Therefore, the hollow cylinder was divided into 16 segments each 100 layers thick. In each segment, one configuration of the three approaches in Section 2.2 for the contour area was used. Figure 4 shows an overview of the segments and the used configurations. Starting at the start plate, the segments were built using different arrangements (A in 1 to 2, B in 3 to 12 and C from 13 to 16). In segments 3 to 8, the contour offset is at the same position as the inner border of the projection area, i.e., spots are only projected towards the infill area. In segments 9 to 12, this is not the case, i.e., spots from the infill area are also moved outwards to the contour area. In segments 13 to 16, the contour offset and the position of the additional contour line with infill-parameter-spots are varied.
Avoiding overshoots and achieving a dense transition area between contour and infill are the key aspects of this investigation. Overshoots are characterized by optical inspection. Defects in PBF-EB parts can be detected efficiently by analyzing ELO images [22,23]. The ELO images are binarized using the method ’threshold_otsu’ from the Python library scikit-image [24], a thresholding method based on the threshold selection method from Otsu [25]. Because only the porosity in the transition area is of interest, the ELO image is only evaluated inside the expected boundary of the CAD model.

2.3.3. Brake Caliper

A brake caliper (CAD model from [17]) was chosen (a.o. because of its varying cross sections with contour segments of different length) to extend the contour scan strategy to complex geometries. The spot arrangement of segment 6 in Figure 4 (B6: contour offset at 350 μ m and projection area from 50 μ m to 350 μ m ) was chosen for the contour area. It consists of three contour lines separated by 90 μ m each containing, depending on the melted layer, between 3160 and 44,408 individual spots. The spots in the contour lines are divided into melt groups (see Figure 1b) and then ordered using the concept described in Section 2.1.2.

3. Results

3.1. Hollow Cylinders

3.1.1. Main Challenges

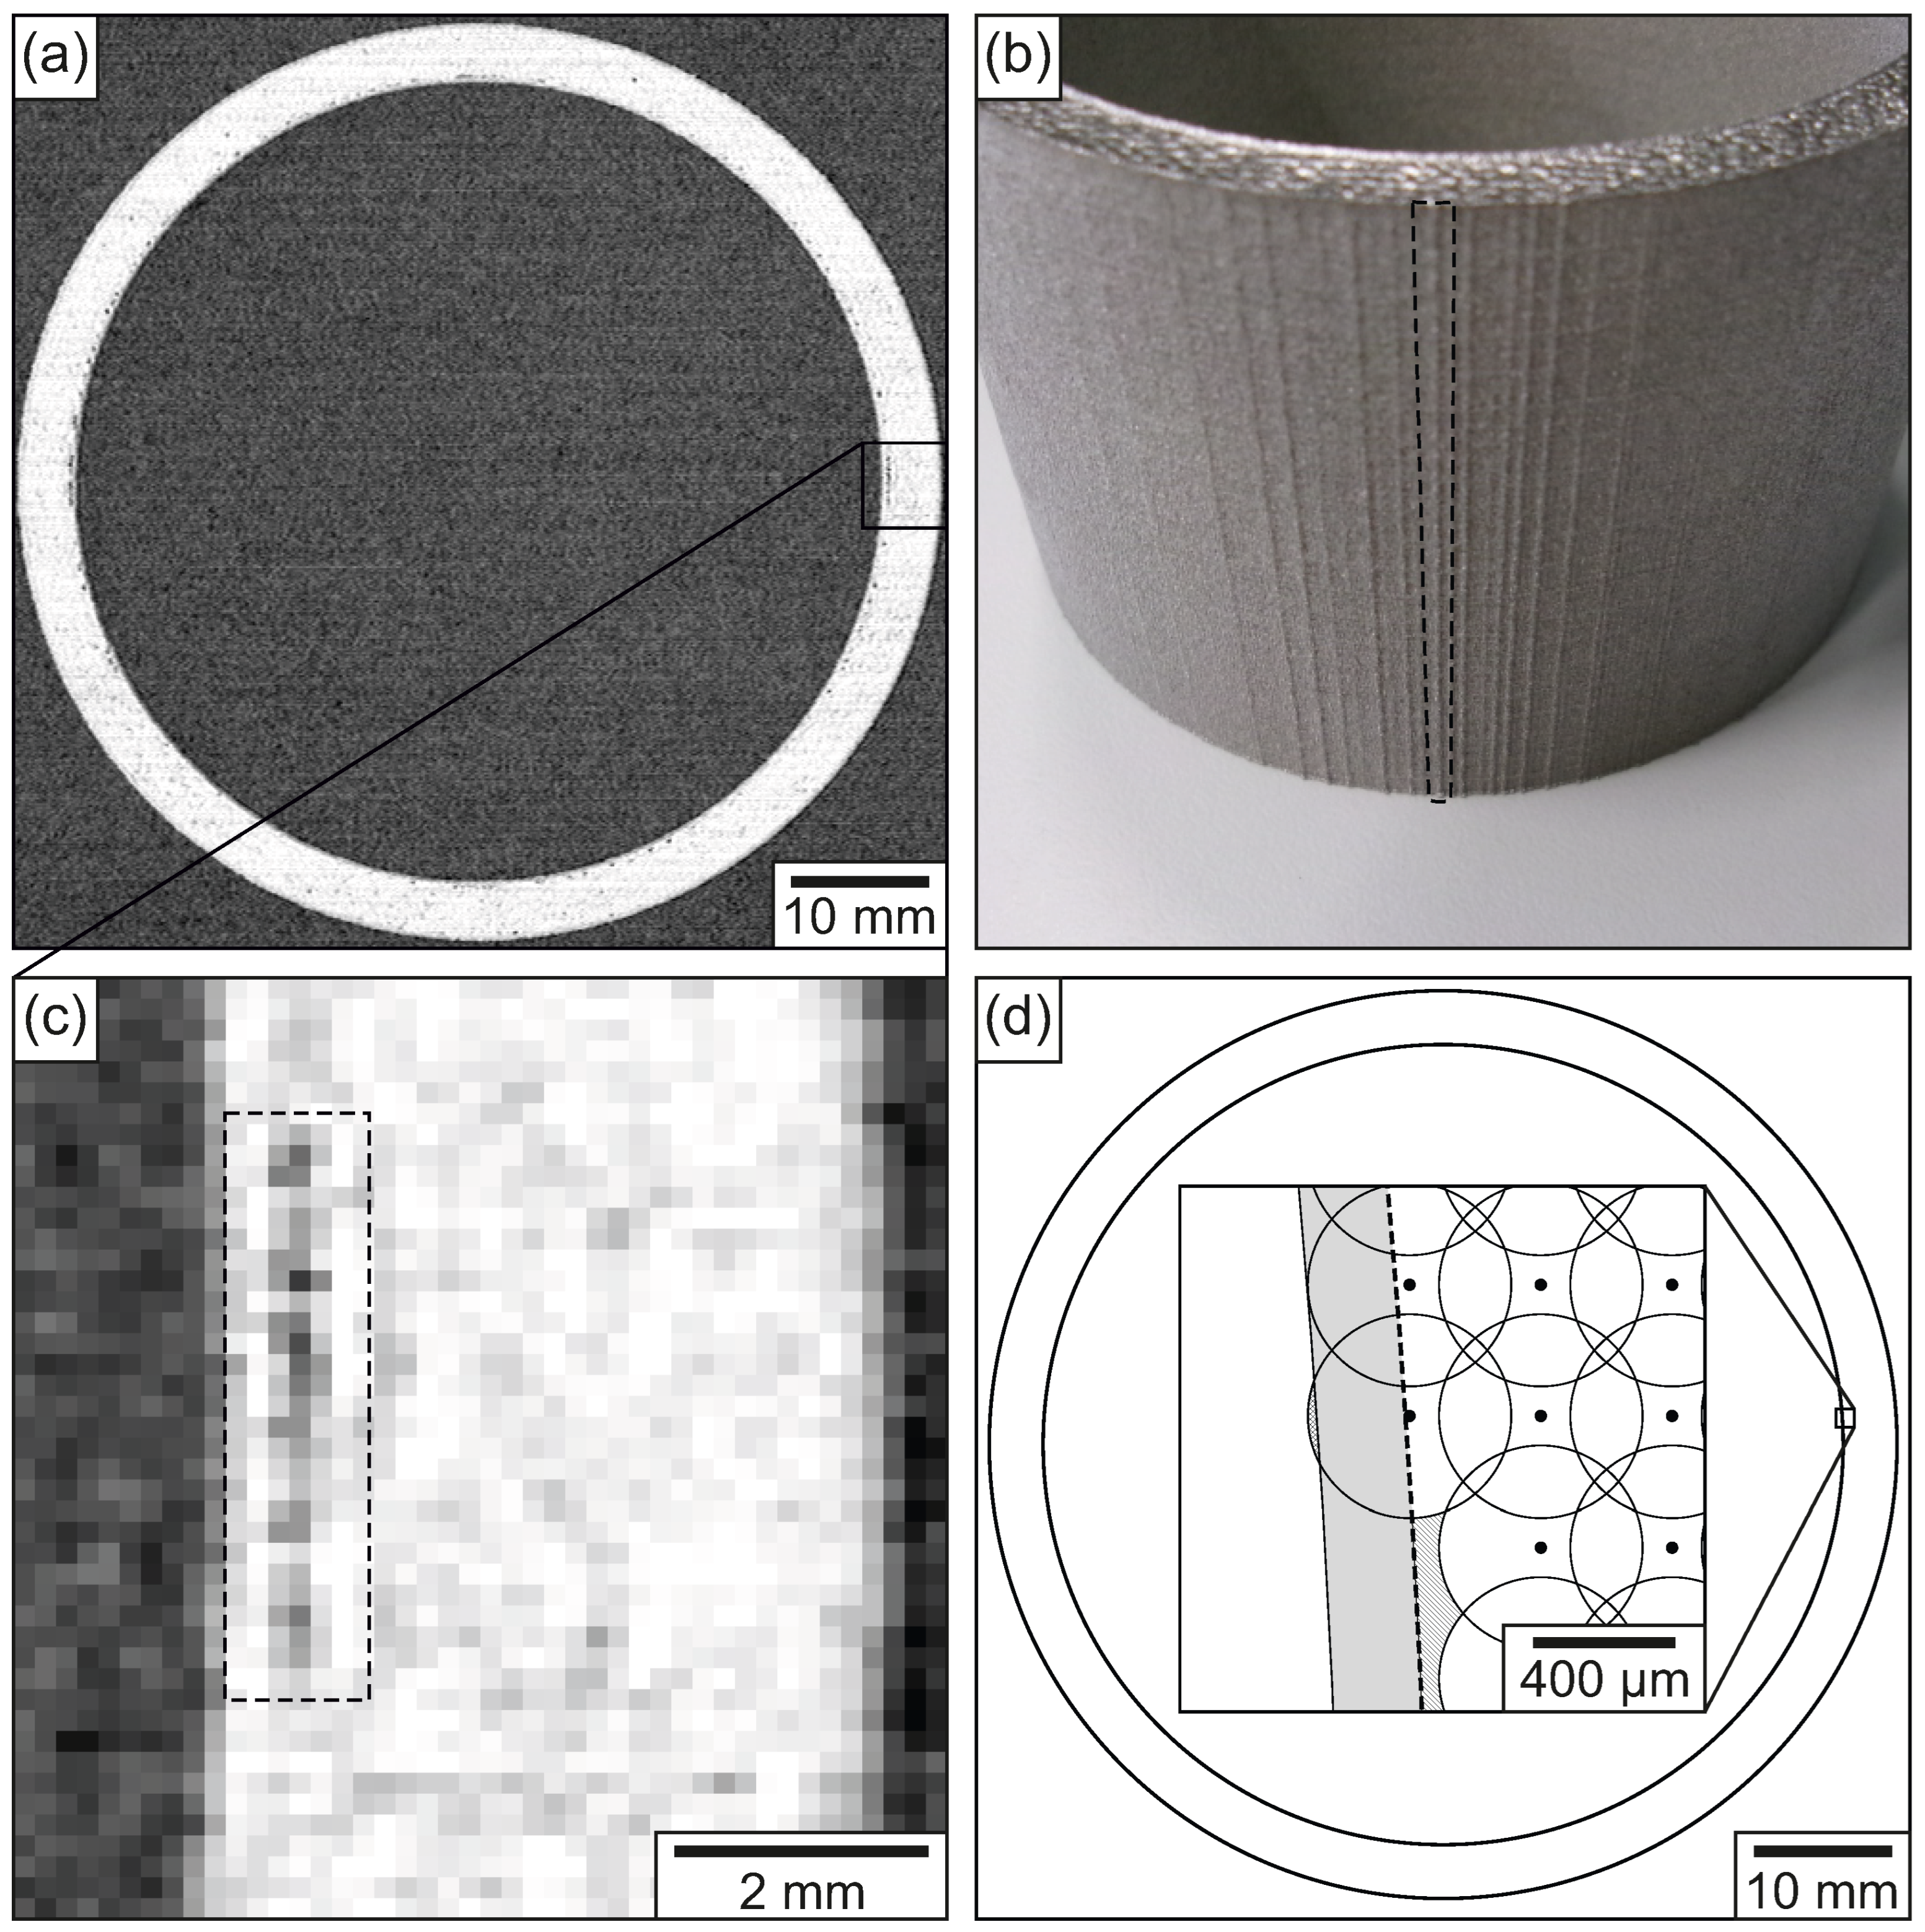
The first Ti-6-Al-4V hollow cylinder was built with spot arrangement A, a contour area width of 270 μ m (three contour line groups) and a contour offset of 270 μ m . Applying this contour strategy in combination with coarse infill spots reveals two main issues, which are displayed in Figure 5. Similarly to the samples from Karimi et al. [14] and Zhao et al. [13], defects in the transition zone are detectable. Figure 5a,b show an ELO image after completing layer number 345 of the hollow cylinder. The infill area is dense, but in the transition zone between contour area and infill area, dark spots indicating porosity are visible [22,23]. The average melt pool diameters of infill spots and the size of the contour area (gray) in Figure 5d reveal uncovered areas (shaded) in the transition zone between the infill and contour area. As a second issue, overshoots are visible as vertical lines at the surface as displayed in Figure 5b. This can be traced back to the position of the infill spots close to the geometry boundary, as Figure 5d shows that some infill-spot melt pools close to the surface exceed the contour area (cross-shaded).

3.1.2. Micrograph Analysis

The contour adaptations outlined in Figure 3 were applied to a segmented hollow cylinder with the goals of minimizing porosity in the transition area and preventing overshoots, while maintaining a low increase in energy per melted layer.
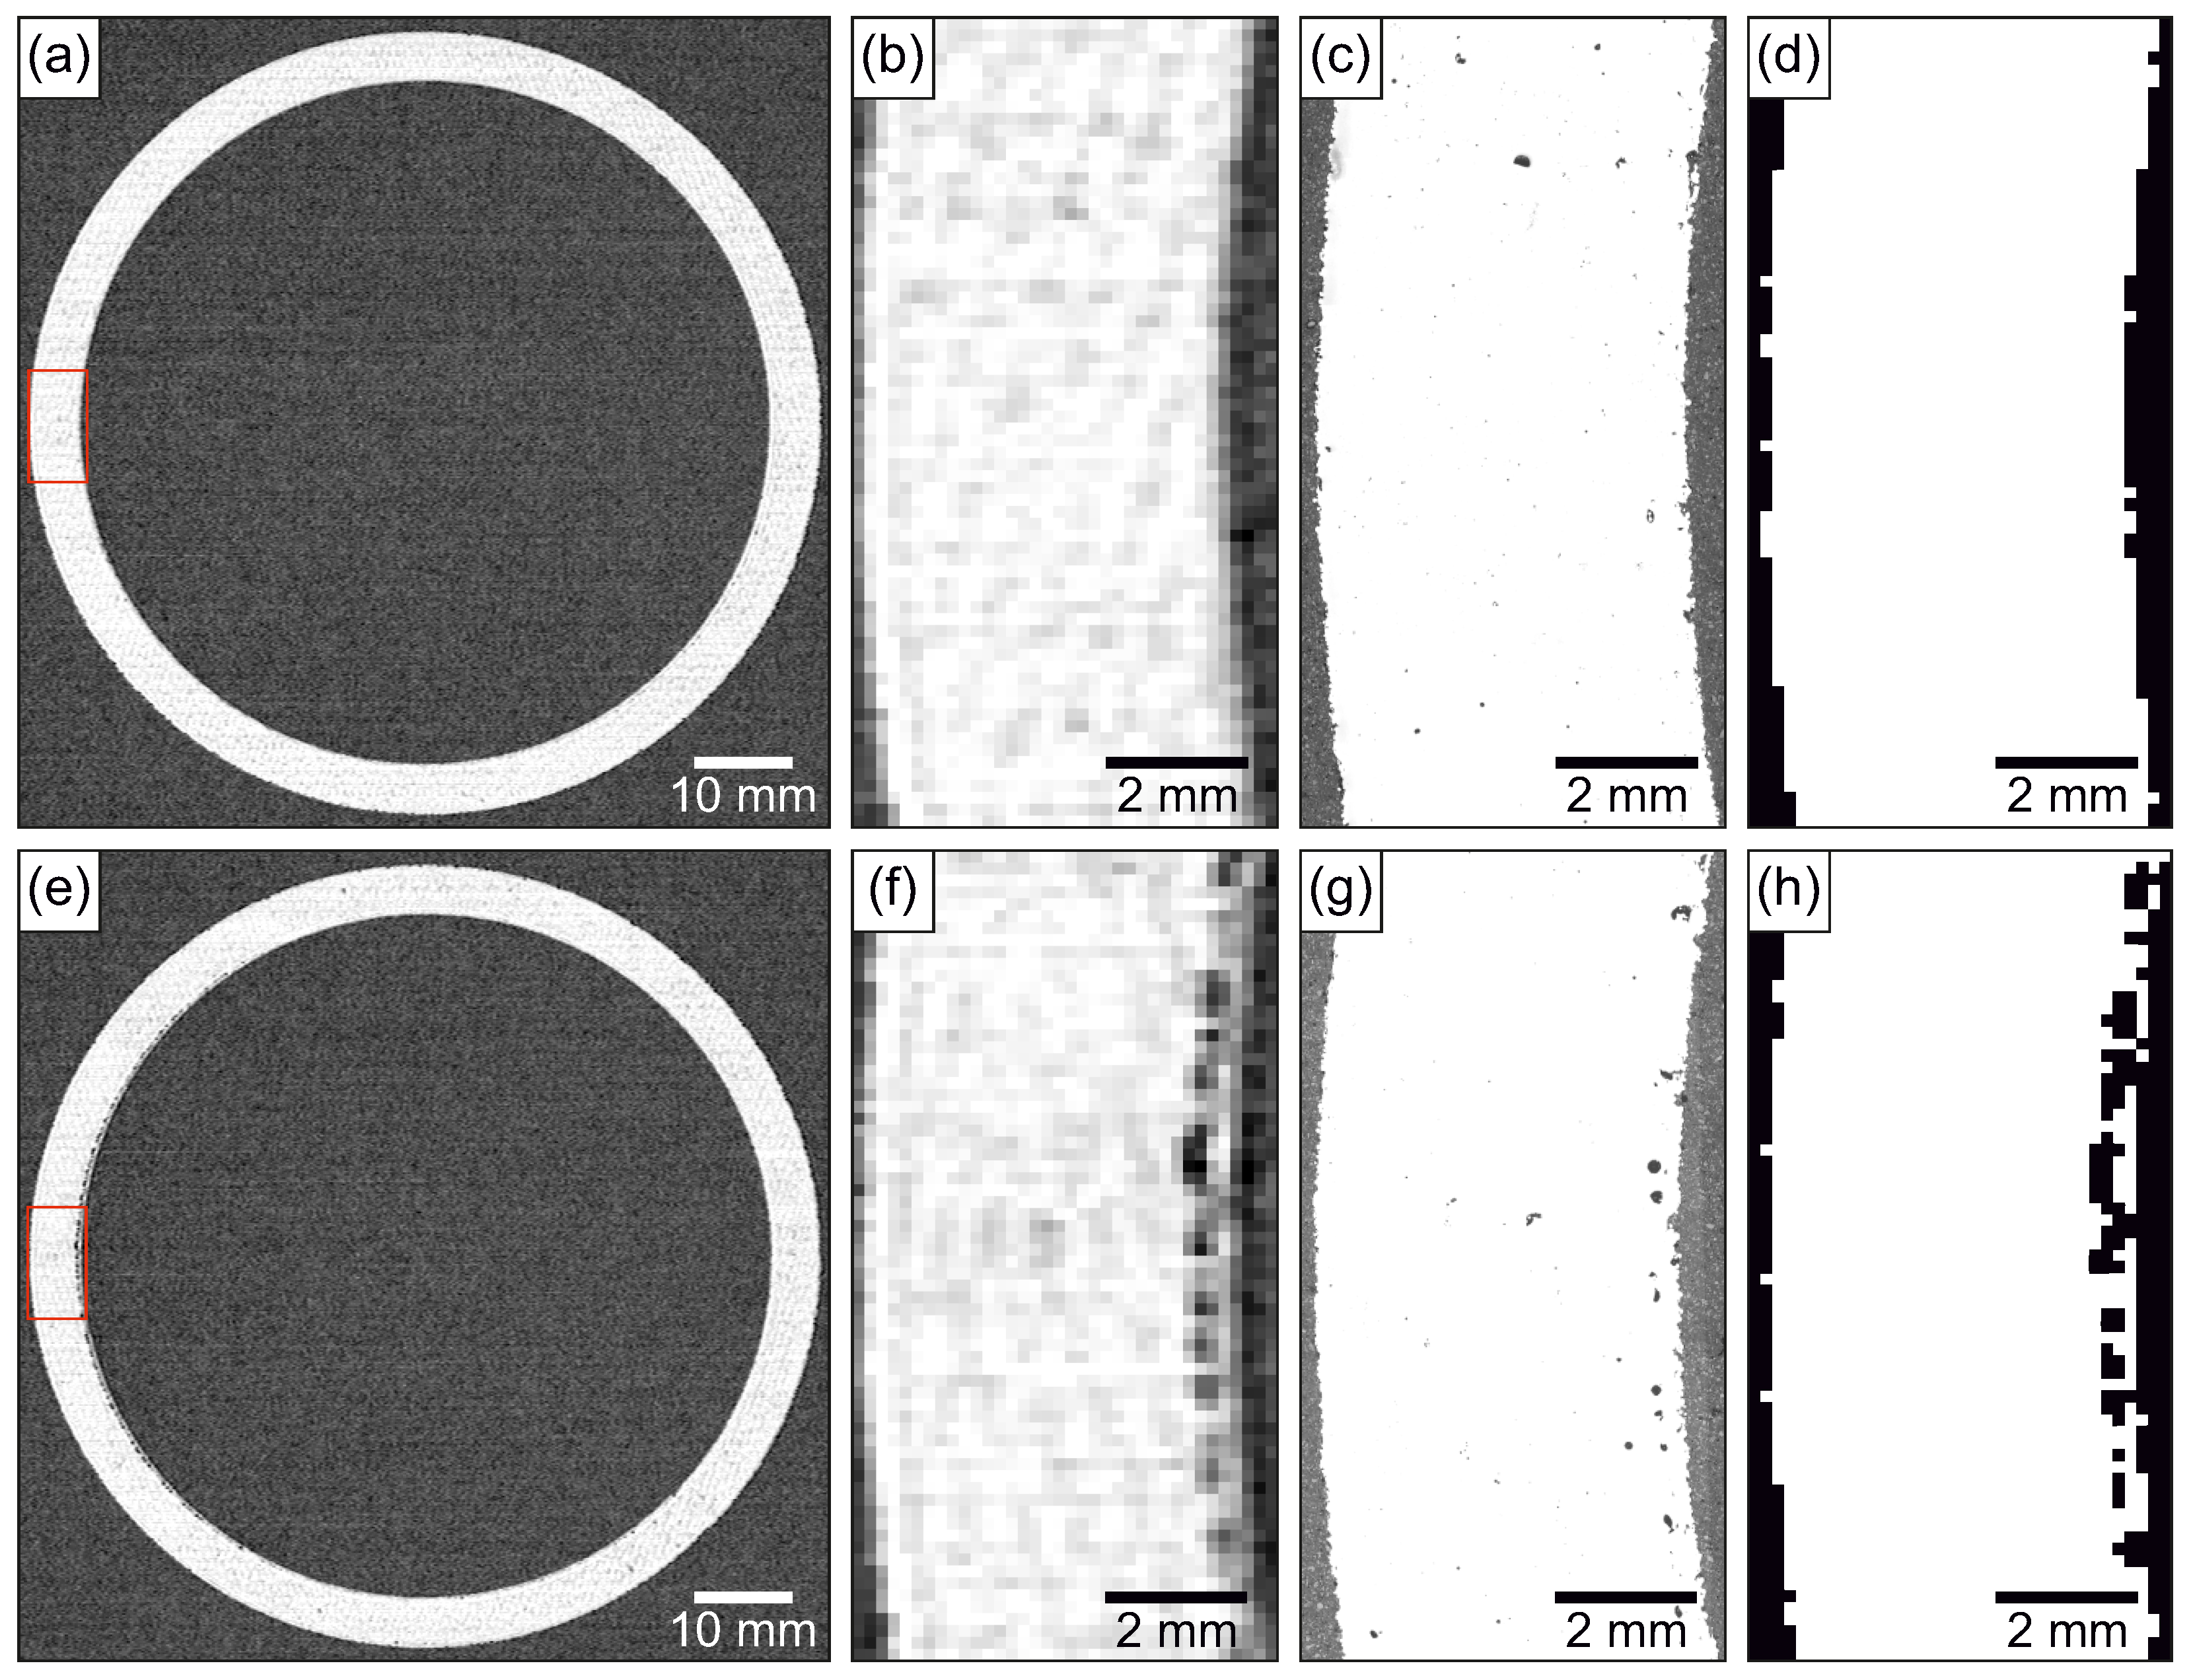
Figure 6 shows ELO images of layers corresponding to spot arrangement B in section 6 and spot arrangement C in section 14 alongside binarized ELO images and micrographs of the marked area.
The ELO images in Figure 6a,b depicting B6 exhibit almost no obvious defects in the transition area between the infill and contour area. Conversely, C14 in Figure 6e,f shows defects in the transition area, which are unevenly distributed across the cross-section. Most defects are concentrated near the inner boundary on the left side of the cross-section. Additionally, occasional dark pixels appear within the infill area in both spot arrangements. The binarized versions of the ELO images from Figure 6b,f are shown in Figure 6d,h. Micrographs corresponding to these sections, shown in Figure 6c,g, reveal the presence of porosity in the infill area. However, most pores are significantly smaller than the ELO image pixel size (167 μ m ), making them difficult to detect in the ELO image. Reducing the porosity in the infill area is beyond the scope of this study and remains the focus of ongoing research. The transition area between the infill and contour of spot arrangement B6 in Figure 6c does not exhibit more porosity than the infill area itself. In contrast, the transition area of spot arrangement C14, whose micrograph is displayed in Figure 6f, shows a concentration of porosity around a contour offset at approximately 400 μ m . The offset’s position aligns with the accumulation of dark pixels in the ELO image shown in Figure 6e, supporting the principal use of ELO images of each layer for comparative porosity evaluations across the different spot arrangements. For comparisons between the ELO images, X-ray computed tomography, and micrographs, the interested reader is referred to Arnold et al. [22].
Figure 5. (a) ELO image after melting layer number 345. Dark areas indicating porosity are visible in the transition zone between contour and infill area. (b) Picture of the hollow cylinder’s outer surface. Overshoots are visible as vertical lines. (c) Section of ELO image after melting layer number 345. (d) Contour area (gray) and measured melt-pool diameters of infill spots at the surface of the layer. Infill-spot melt pools exceeding the contour area (cross-shaded) and uncovered area neither by infill spots nor contour area (shaded) are visible.
Jmmp 09 00303 g005
Figure 6. Spot arrangement B6 with an (a) ELO image (b) enlarged ELO image (c) micrograph of the enlarged section and (d) binarized enlarged ELO image. Spot arrangement C14 with an (e) ELO image (f) enlarged ELO image (g) micrograph of the enlarged section and (h) binarized enlarged ELO image.
Jmmp 09 00303 g006
The exact cause of the uneven distribution of defects in Figure 6e remains unknown to the authors. Besides gaps between the infill and contour spots, it is possible that other factors contribute to the observed defects. For instance, the top surface of the hollow cylinder shows an elevated edge at the contour, which could cause issues during powder application. This could result in the accumulation of powder and, ultimately, defects due to insufficient energy density to fully consolidate the applied powder layer.

3.1.3. Segmented Hollow Cylinder

The different configurations of the presented approaches from Figure 4 are compared in three different categories: (I) Visible overshoots at the surface. (II) Porosity in the transition area between contour and infill area. (III) Additionally incorporated energy compared to the first build. The latter is closely related to the melt pool overlap, as more incorporated energy at a constant beam power means more melted spots and therefore a greater remelted area.
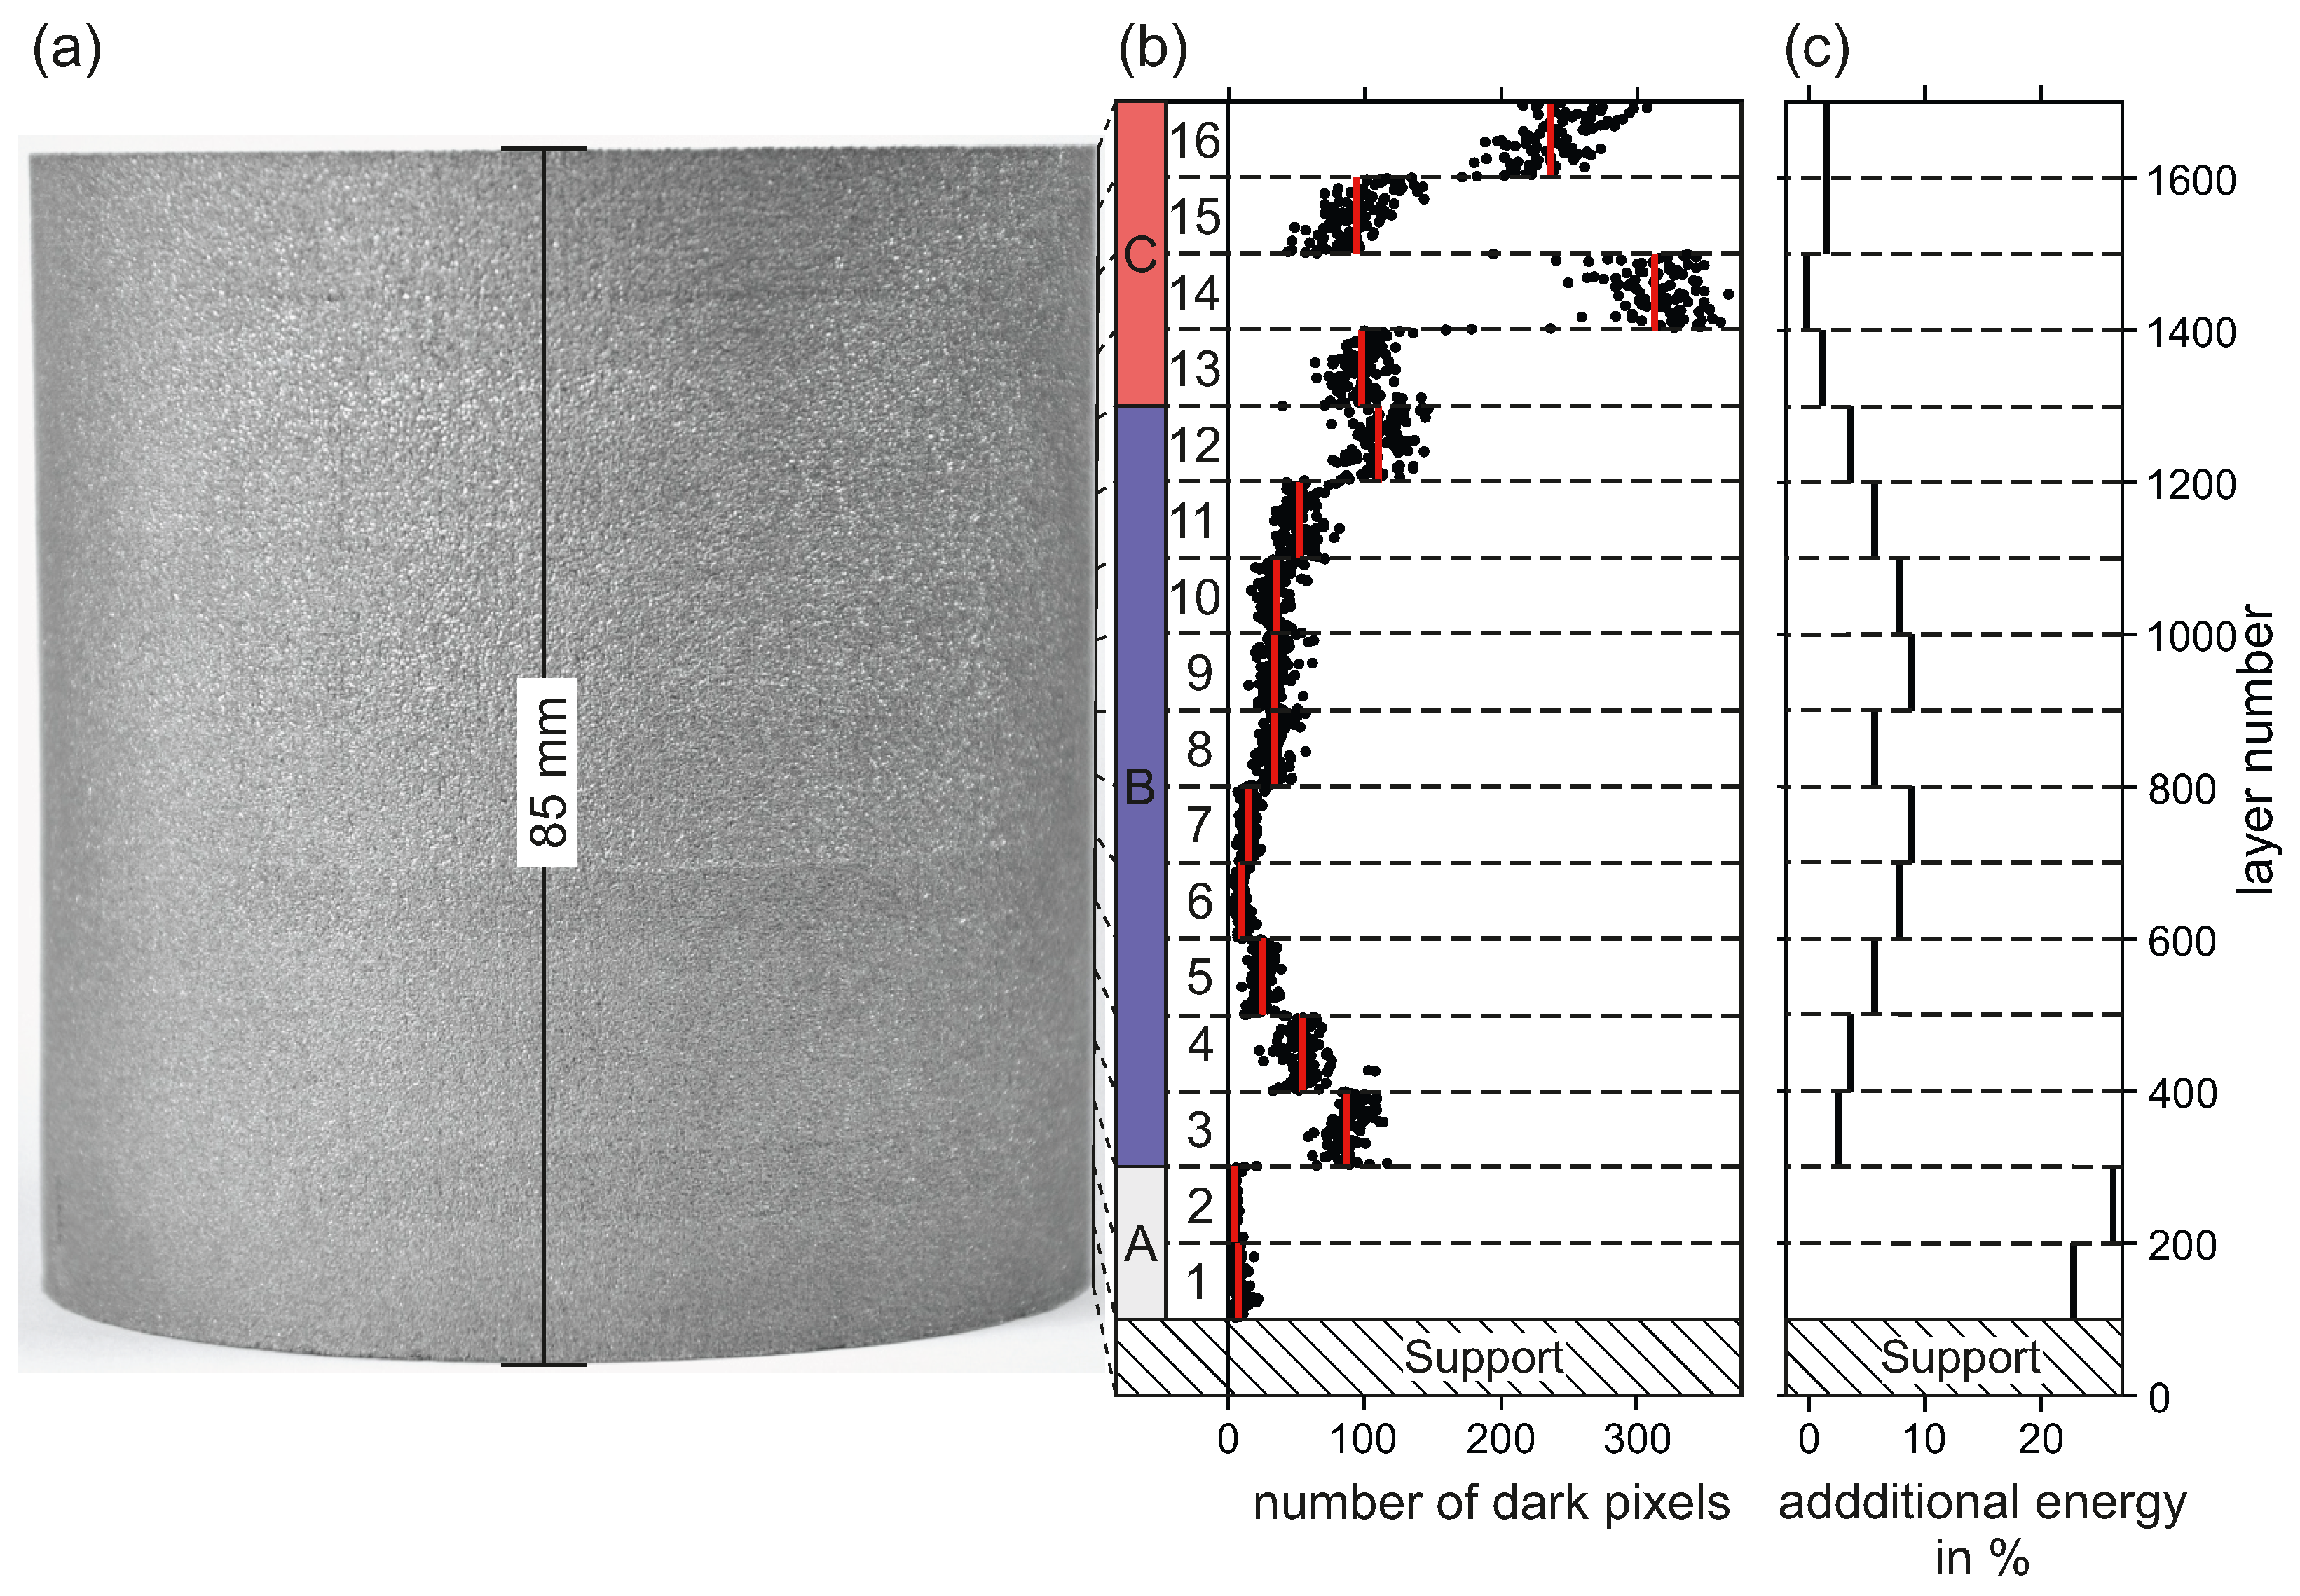
The side surface of the hollow cylinder in Figure 7a appears smooth. Detailed surface roughness measurements are the subject of future work. In contrast to the first hollow cylinder from Figure 5b, there are no overshoots visible. The segments from the different configurations, each spanning 5 m m , are slightly recognizable; however, all implemented configurations successfully cover the staircase effect from the tetragonal lattice of the infill spots.
Figure 7b displays the number of dark pixels per layer in the binarized ELO images that lie within the melted area defined by the CAD geometry. The size of one pixel is approximately 0.013 mm2. The mean value of the 100 layers of each configuration is marked with a red vertical line. The different segments are well distinguishable. The two configurations of spot arrangement A (gray) in segments A1 and A2 from layer number 100 to 300 show the smallest average numbers of dark pixels with 8 and 3, respectively. The small values indicate that both the increased defect density at the transition area and the overshoots are generally avoidable by simply increasing the width of the contour area. The configurations of arrangement B (blue) show low (10 in segment B6) to medium (110 in segment B12) mean numbers of dark pixels, whereas the configurations of spot arrangement C (red) show medium to high mean values ranging from 94 in segment C15 to 313 in segment C14. It would be expected that the addition of a third contour group for spot arrangement C would lead to a decrease in the relatively high number of dark pixels. The lowest mean number of dark pixels (10) out of spot arrangement B stems from section B6 with a contour offset of 350 μ m and a projection area between 50 μ m and 350 μ m applied in layer 600 to 700. The general trend for spot arrangement B is that as the outer projection offset approaches the geometry boundary, the number of dark pixels in the melted area decreases. This is reasonable because the position of the outer projection offset determines how many otherwise omitted infill spots are moved onto the contour offset. The closer the outer projection offset is to the boundary of the geometry, the more spots are additionally melted.
One consequence is reflected in Figure 7c, which shows the ratio of the additional energy input for each configuration to the total layer energy of the first hollow cylinder (spot arrangement A, contour offset 270 μ m , contour area width 270 μ m ). Looking at spot arrangement B, it is clear that a lower defect density tends to be accompanied by a higher energy input ranging from 2.6% in B4 to 8.8% for B7. B6 yields the best mean dark area value out of spot arrangement B and has an 7.8% increased energy input, which is equal to 656 additionally melted infill spots close to the contour area. The configurations of spot arrangement C all have a low additional energy input because only 2 contour groups were melted compared to the 3 (layer number 300 to 1300) or 7 (layer 100 to 300) contour groups in the other spot arrangements. The addition of one contour group (approximately 5000 contour spots) would result in around 8% additionally incorporated energy, which is approximately at the same level as B6. Spots along a contour line with a relatively high distance of 400 μ m from each other are expected to handle sharp edges, which are prevalent in complex geometries, worse than the other approaches. So extending the contour area to three contour groups for spot arrangement C is not considered. The addition of four contour groups in layer 100 to 300 leads to the highest additional energy input with 23% and 26%. An unnecessarily high energy input should be avoided, as it poses various risks, such as an increased risk of defect formation [14], and can potentially alter the alloy composition through selective evaporation [26]. Therefore, spot arrangement A with its high energy input is not the best choice for the contour strategy.
In summary, B6 shows a smooth surface combined with a very low defect density and medium additional energy input, and is therefore chosen as the contour scan strategy for the brake caliper.

3.2. Brake Caliper

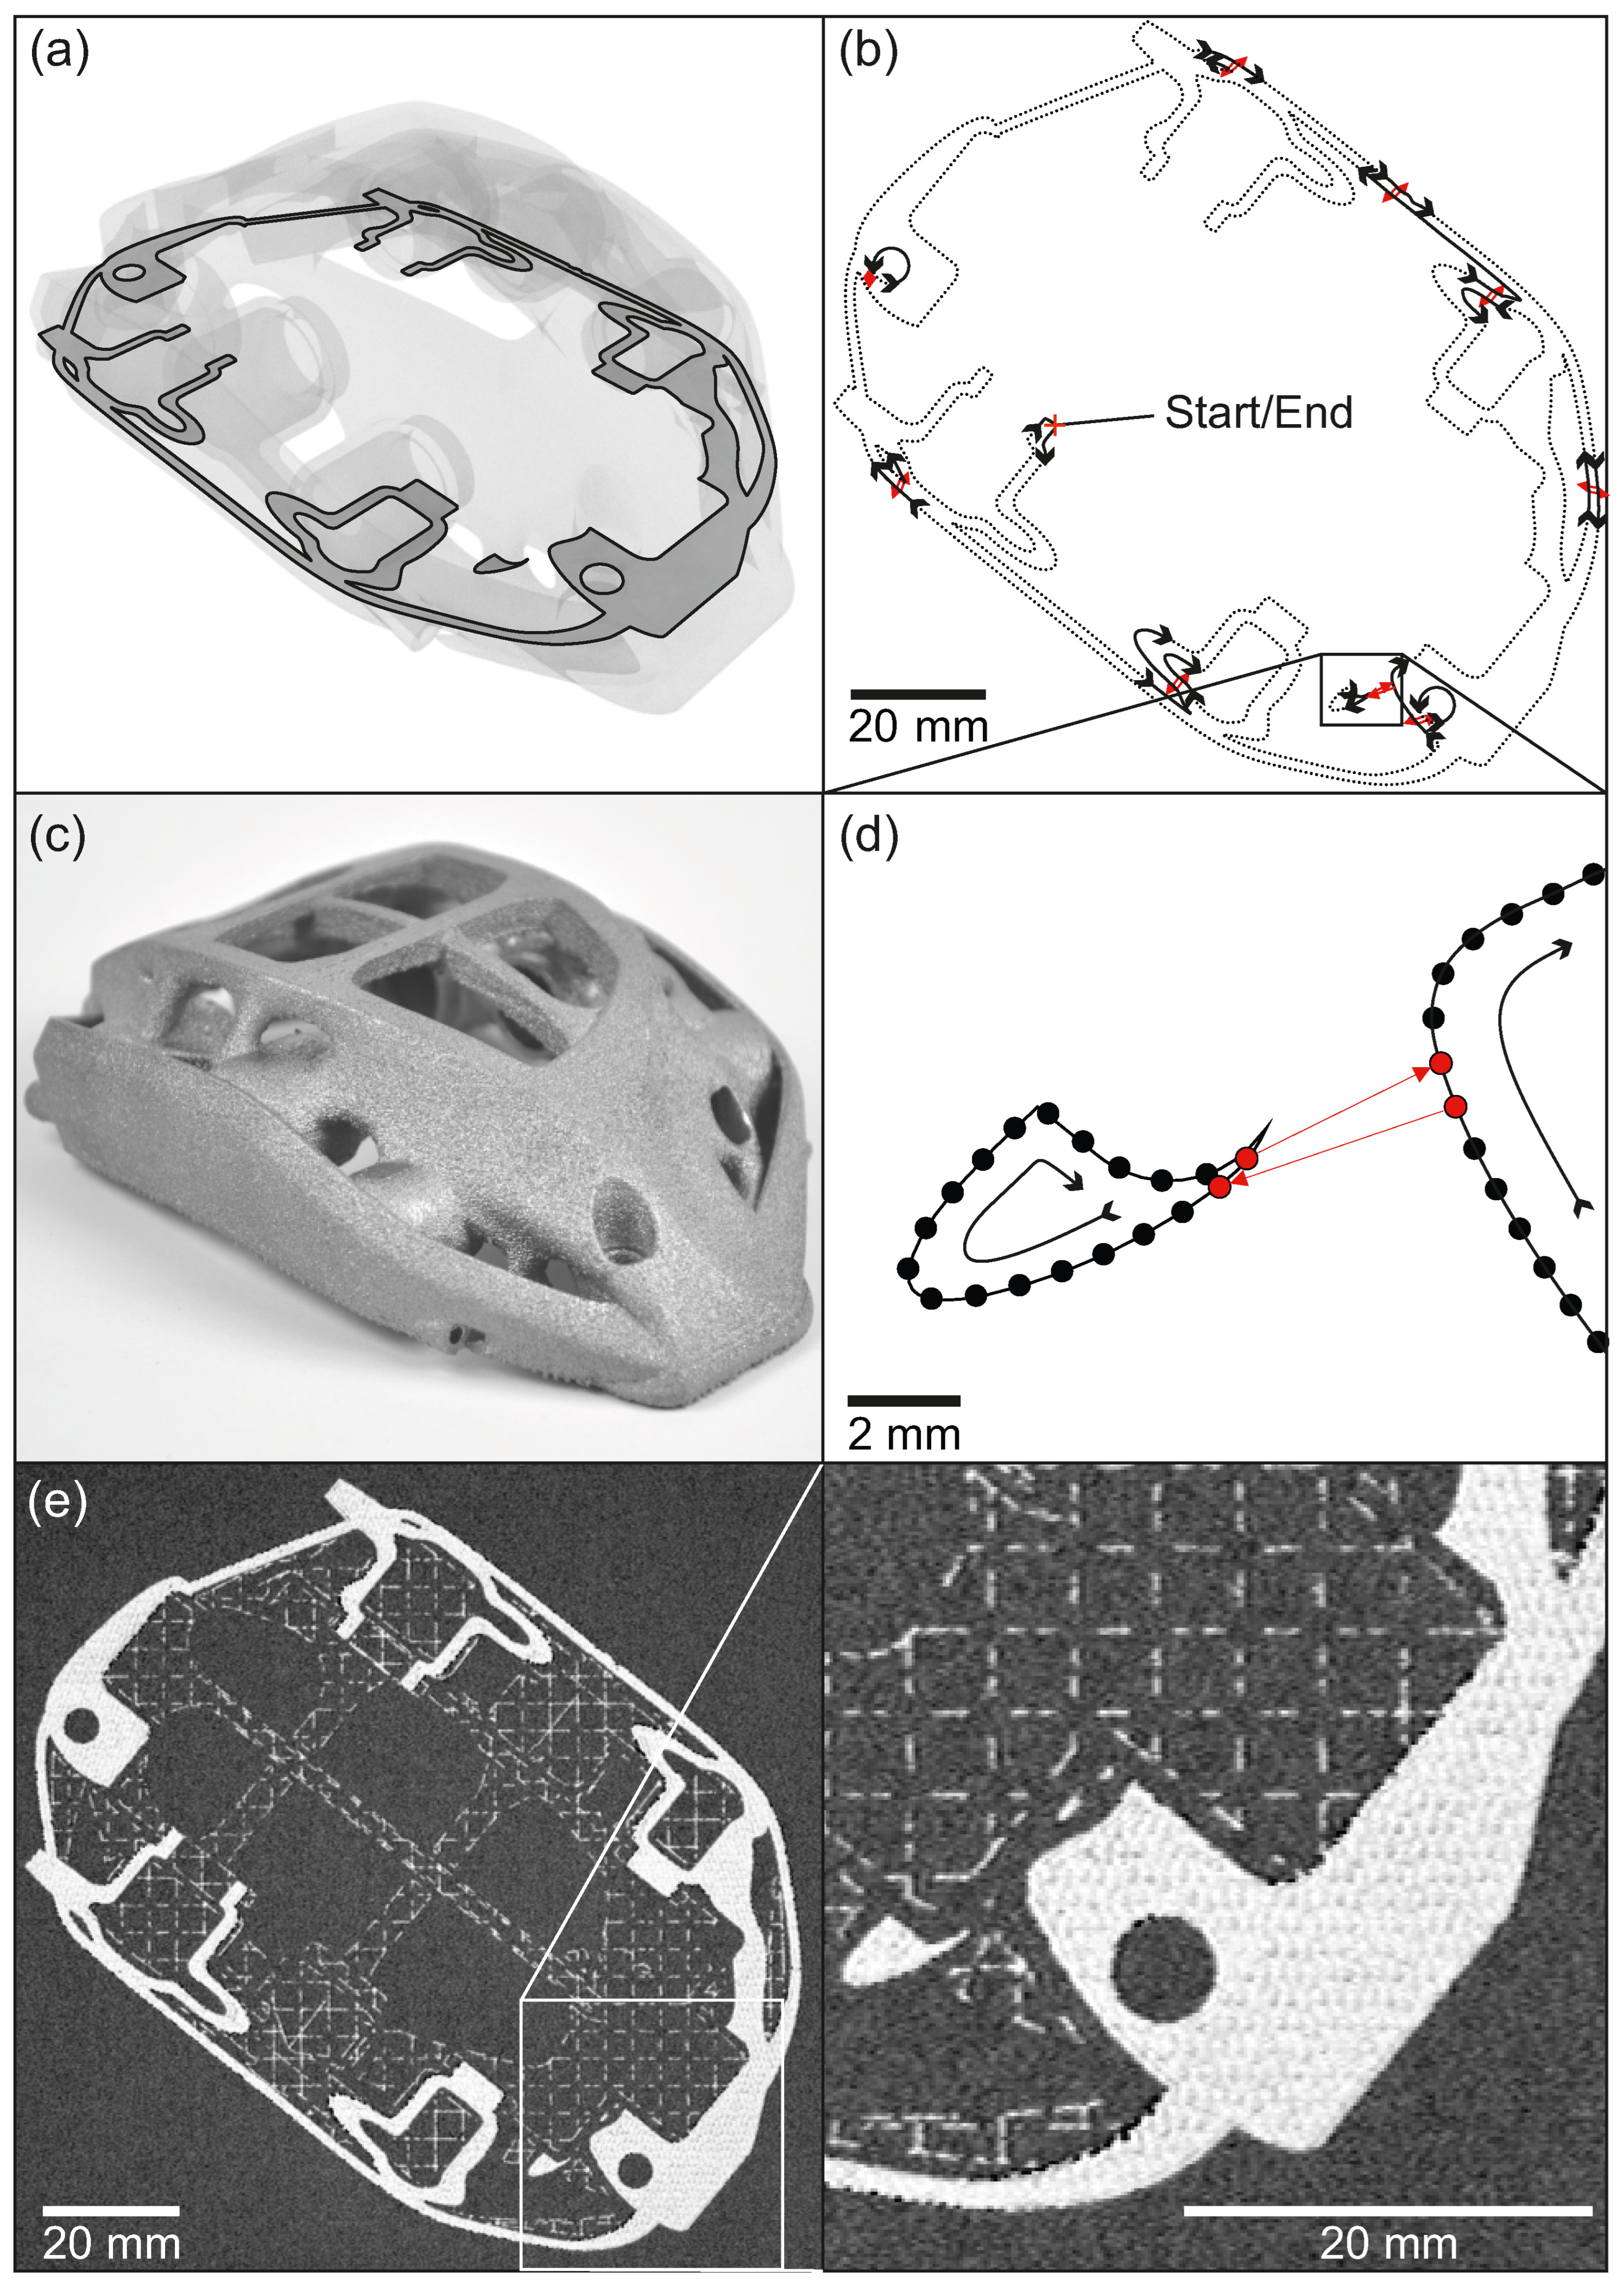
To demonstrate the applicability of the proposed approach for complex geometries, spot arrangement B6 from Figure 4 together with the algorithm for determining the contour melting sequence from Section 2.1.2 is transferred to the brake caliper. Determining the contour melting sequence for one example layer of the brake caliper (Figure 8a) is displayed in Figure 8b. It shows all spots of the first melt group as black dots for the first contour group in the respective layer.
The dots are located along contour lines. All spots in each contour line are sorted (counter-)clockwise along the respective contour line, which is indicated by black arrows. The edges of the minimum spanning tree mark the shortest jumps between contour lines. Red arrows indicate the available jump between contour lines, which is closest to the edge of the minimum spanning tree. Even though the start is marked in the figure, in practice, starting at an arbitrary spot is possible. Following the (counter-)clockwise order in contour lines and jumping between them at red arrows creates a tour of spots connected by short jumps.
This concept, although effective for complex geometries, has one minor weakness. Sharp edges, which are common in complex geometries, lead to short distances between spots on the same contour line as indicated in Figure 8d. This issue is inherent in aligning contour spots along a contour line. Therefore, occasional short distances between potentially consecutively melted spots cannot be completely avoided using contour lines.
The surface of the built brake caliper from Figure 8a is displayed in Figure 8c, demonstrating that the surface is free from obvious defects. The ELO image from the example layer in Figure 8e shows the absence of obvious defects in the transition area between the infill and contour area. This indicates the applicability of the proposed contour strategy to complex geometries. A more detailed analysis of the brake caliper is the subject of current investigations and will be the focus of future work.

4. Summary and Conclusions

Spot melting with productivity-oriented beam parameters and large beam diameters can cause staircase effects on the part’s surface. By adding a separate contour area with adjusted beam parameters, the surface quality can be improved. However, this introduces the challenge of creating a defect-free transition zone between the contour and infill areas.
The first part of this work develops an algorithm for a spot-based contour strategy that minimizes the travel distance while ensuring separate melt pools in complex geometries. This strategy relies on creating separate melt groups along contour lines generated by a defined point skip, ensuring individual melt pools. Additionally, the contour lines are divided into segments and connected into a sequence using a minimum spanning tree.
The second part explores three approaches to minimize defects in the transition zone. Increasing the number of contour lines (and thereby the contour width) can eliminate porosity and create a smoother surface. However, this requires significantly more energy, increasing the risk of defects or change in alloy composition. As demonstrated on a Ti-6Al-4V hollow cylinder, a transition zone free of obvious defects and with a smooth surface can also be achieved by adding infill spots projected onto a contour offset. These additional infill spots are easily integrated into the infill sequence and require less additional energy, making this method superior to simply increasing the number of contour lines.
The entire approach is applied to a Ti-6Al-4V brake caliper as a complex part. Initial optical inspections reveal promising surface properties similar to the hollow cylinder. Future work will focus on a detailed analysis of surface quality and defect density in the transition zone. Additionally, process parameters for this contour strategy have not yet been optimized. Future research will include a comprehensive parameter study, with detailed analysis of surface roughness and transition zone porosity.

Author Contributions

Conceptualization, T.K. and M.M.; methodology, T.K.; software, T.K.; validation, T.K.; formal analysis, T.K.; investigation, T.K., L.S. and S.P.; resources, L.S., S.P. and C.K.; data curation, T.K.; writing—original draft preparation, T.K. and M.M.; writing—review and editing, C.K. and M.M.; visualization, T.K.; supervision, C.K. and M.M.; project administration, M.M.; funding acquisition, M.M. All authors have read and agreed to the published version of the manuscript.

Funding

The authors gratefully acknowledge funding by the Deutsche Forschungsgemeinschaft (DFG, German Research Foundation)-Project ID 61375930-SFB 814-“Additive Manufacturing” TP T07.

Data Availability Statement

Data will be made available on request.

Acknowledgments

The authors would like to thank Herbert Reichelt, Annemone Alleborn and Kerstin Zinn (all: Chair of Materials Science and Engineering for Metals, Erlangen, Germany) for making the micrographs possible. The authors also would like to thank Thomas Rau (pro-beam additive GmbH, Gilching, Germany) for the technical support, for machine preparation and post-processing of buildjobs and Tobias Brunnhübner (pro-beam additive GmbH, Gilching, Germany) for providing the support structures for the brake caliper.

Conflicts of Interest

Author Lukas Spano and Sebastian Pohl was employed by the company pro-beam additive GmbH. The remaining authors declare that the research was conducted in the absence of any commercial or financial relationships that could be construed as a potential conflict of interest. The funders had no role in the design of the study; in the collection, analyses, or interpretation of data; in the writing of the manuscript; or in the decision to publish the results.

References

  1. Dehoff, R.R.; Kirka, M.M.; Sames, W.J.; Bilheux, H.; Tremsin, A.S.; Lowe, L.E.; Babu, S.S. Site specific control of crystallographic grain orientation through electron beam additive manufacturing. Mater. Sci. Technol. 2015, 31, 931–938. [Google Scholar] [CrossRef]
  2. Sabourin, E.; Houser, S.A.; Helge Bøhn, J. Adaptive slicing using stepwise uniform refinement. Rapid Prototyp. J. 1996, 2, 20–26. [Google Scholar] [CrossRef]
  3. Di Angelo, L.; Di Stefano, P.; Marzola, A. Surface quality prediction in FDM additive manufacturing. Int. J. Adv. Manuf. Technol. 2017, 93, 3655–3662. [Google Scholar] [CrossRef]
  4. Carolo, L.C.B.; Cooper O, R.E. A review on the influence of process variables on the surface roughness of Ti-6Al-4V by electron beam powder bed fusion. Addit. Manuf. 2022, 59, 103103. [Google Scholar] [CrossRef]
  5. Mallipeddi, D.; Hajali, T.; Rännar, L.E.; Bergström, A.; Hernandez, S.; Strandh, E.; Nyborg, L.; Krajnik, P. Surface Integrity of Machined Electron Beam Melted Ti6Al4V Alloy Manufactured with Different Contour Settings and Heat Treatment. Procedia CIRP 2020, 87, 327–332. [Google Scholar] [CrossRef]
  6. Sullivan, E.M.; Sharif Hedås, S.; Jerhamre Engström, M.; Lindwall, G. Effect of powder particle size distribution and contouring on build quality in electron beam powder bed fusion of a medium-C hot-work tool steel. Int. J. Adv. Manuf. Technol. 2023, 128, 2953–2967. [Google Scholar] [CrossRef]
  7. Wang, F.; Wu, C.; Liang, Y.; Liang, X.; Wu, H.; Liu, L.; Lin, F.; Kan, W.; Lin, J. A surface quality optimization strategy based on a dedicated melt-pool control via the dashed-scan contouring technique in electron beam powder bed fusion. J. Mater. Process. Technol. 2024, 330, 118445. [Google Scholar] [CrossRef]
  8. Safdar, A.; He, H.; Wei, L.Y.; Snis, A.; Chavez de Paz, L.E. Effect of process parameters settings and thickness on surface roughness of EBM produced Ti-6Al-4V. Rapid Prototyp. J. 2012, 18, 401–408. [Google Scholar] [CrossRef]
  9. Klingvall Ek, R.; Rännar, L.E.; Bäckstöm, M.; Carlsson, P. The effect of EBM process parameters upon surface roughness. Rapid Prototyp. J. 2016, 22, 495–503. [Google Scholar] [CrossRef]
  10. Biffi, C.A.; Fiocchi, J.; Ferrario, E.; Fornaci, A.; Riccio, M.; Romeo, M.; Tuissi, A. Effects of the scanning strategy on the microstructure and mechanical properties of a TiAl6V4 alloy produced by electron beam additive manufacturing. Int. J. Adv. Manuf. Technol. 2020, 107, 4913–4924. [Google Scholar] [CrossRef]
  11. Wang, P.; Sin, W.; Nai, M.; Wei, J. Effects of Processing Parameters on Surface Roughness of Additive Manufactured Ti-6Al-4V via Electron Beam Melting. Materials 2017, 10, 1121. [Google Scholar] [CrossRef]
  12. Thalavai Pandian, K.; Lindgren, E.; Roychowdhury, S.; Neikter, M.; Hansson, T.; Pederson, R. Characterization of surface asperities to understand its effect on fatigue life of electron beam powder bed fusion manufactured Ti-6Al-4 V. Int. J. Fatigue 2024, 188, 108516. [Google Scholar] [CrossRef]
  13. Zhao, X.; Dadbakhsh, S.; Rashid, A. Contouring strategies to improve the tensile properties and quality of EBM printed Inconel 625 parts. J. Manuf. Processes 2021, 62, 418–429. [Google Scholar] [CrossRef]
  14. Karimi, P.; Schnur, C.; Sadeghi, E.; Andersson, J. Contour design to improve topographical and microstructural characteristics of Alloy 718 manufactured by electron beam-powder bed fusion technique. Addit. Manuf. 2020, 32, 101014. [Google Scholar] [CrossRef]
  15. Deng, D.; Moverare, J.; Peng, R.L.; Söderberg, H. Microstructure and anisotropic mechanical properties of EBM manufactured Inconel 718 and effects of post heat treatments. Mater. Sci. Eng. A 2017, 693, 151–163. [Google Scholar] [CrossRef]
  16. Roos, S.; Rännar, L.E. Surface roughness reduction in electron beam powder bed fusion additive manufacturing of super duplex stainless steel 2507: Investigating optimisation techniques and face orientation-dependent irregularities. Prog. Addit. Manuf. 2024, 10, 2487–2503. [Google Scholar] [CrossRef]
  17. Amigo, A. Generative Design F1 Brake Caliper. 2018. Available online: https://grabcad.com/library/generative-design-f1-brake-caliper-1 (accessed on 1 July 2025).
  18. Kupfer, T.; Leimbach, S.; Spano, L.; Pohl, S.; Körner, C.; Markl, M. Spot melting sequences for complex geometries in electron beam powder bed fusion. Prog. Addit. Manuf. 2025. [Google Scholar] [CrossRef]
  19. Kirka, M.M.; Lee, Y.; Greeley, D.A.; Okello, A.; Goin, M.J.; Pearce, M.T.; Dehoff, R.R. Strategy for Texture Management in Metals Additive Manufacturing. JOM 2017, 69, 523–531. [Google Scholar] [CrossRef]
  20. Kruskal, J.B. On the shortest spanning subtree of a graph and the traveling salesman problem. Proc. Am. Math. Soc. 1956, 7, 48–50. [Google Scholar] [CrossRef]
  21. Hagberg, A.; Swart, P.J.; Schult, D.A. Exploring Network Structure, Dynamics, and Function Using NetworkX; Technical Report; Los Alamos National Laboratory (LANL): Los Alamos, NM, USA, 2008. [Google Scholar]
  22. Arnold, C.; Pobel, C.; Osmanlic, F.; Körner, C. Layerwise monitoring of electron beam melting via backscatter electron detection. Rapid Prototyp. J. 2018, 24, 1401–1406. [Google Scholar] [CrossRef]
  23. Franke, M.; Arnold, C.; Körner, C. In-situ quality assurance for electron-based additive manufacturing by electron optical observation. Prog. Addit. Manuf. 2023, 8, 55–60. [Google Scholar] [CrossRef]
  24. van der Walt, S.; Schönberger, J.L.; Nunez-Iglesias, J.; Boulogne, F.; Warner, J.D.; Yager, N.; Gouillart, E.; Yu, T. scikit-image: Image processing in Python. PeerJ 2014, 2, e453. [Google Scholar] [CrossRef]
  25. Otsu, N. A threshold selection method from gray-level histograms. Automatica 1975, 11, 23–27. [Google Scholar] [CrossRef]
  26. Juechter, V.; Scharowsky, T.; Singer, R.; Körner, C. Processing window and evaporation phenomena for Ti–6Al–4V produced by selective electron beam melting. Acta Mater. 2014, 76, 252–258. [Google Scholar] [CrossRef]
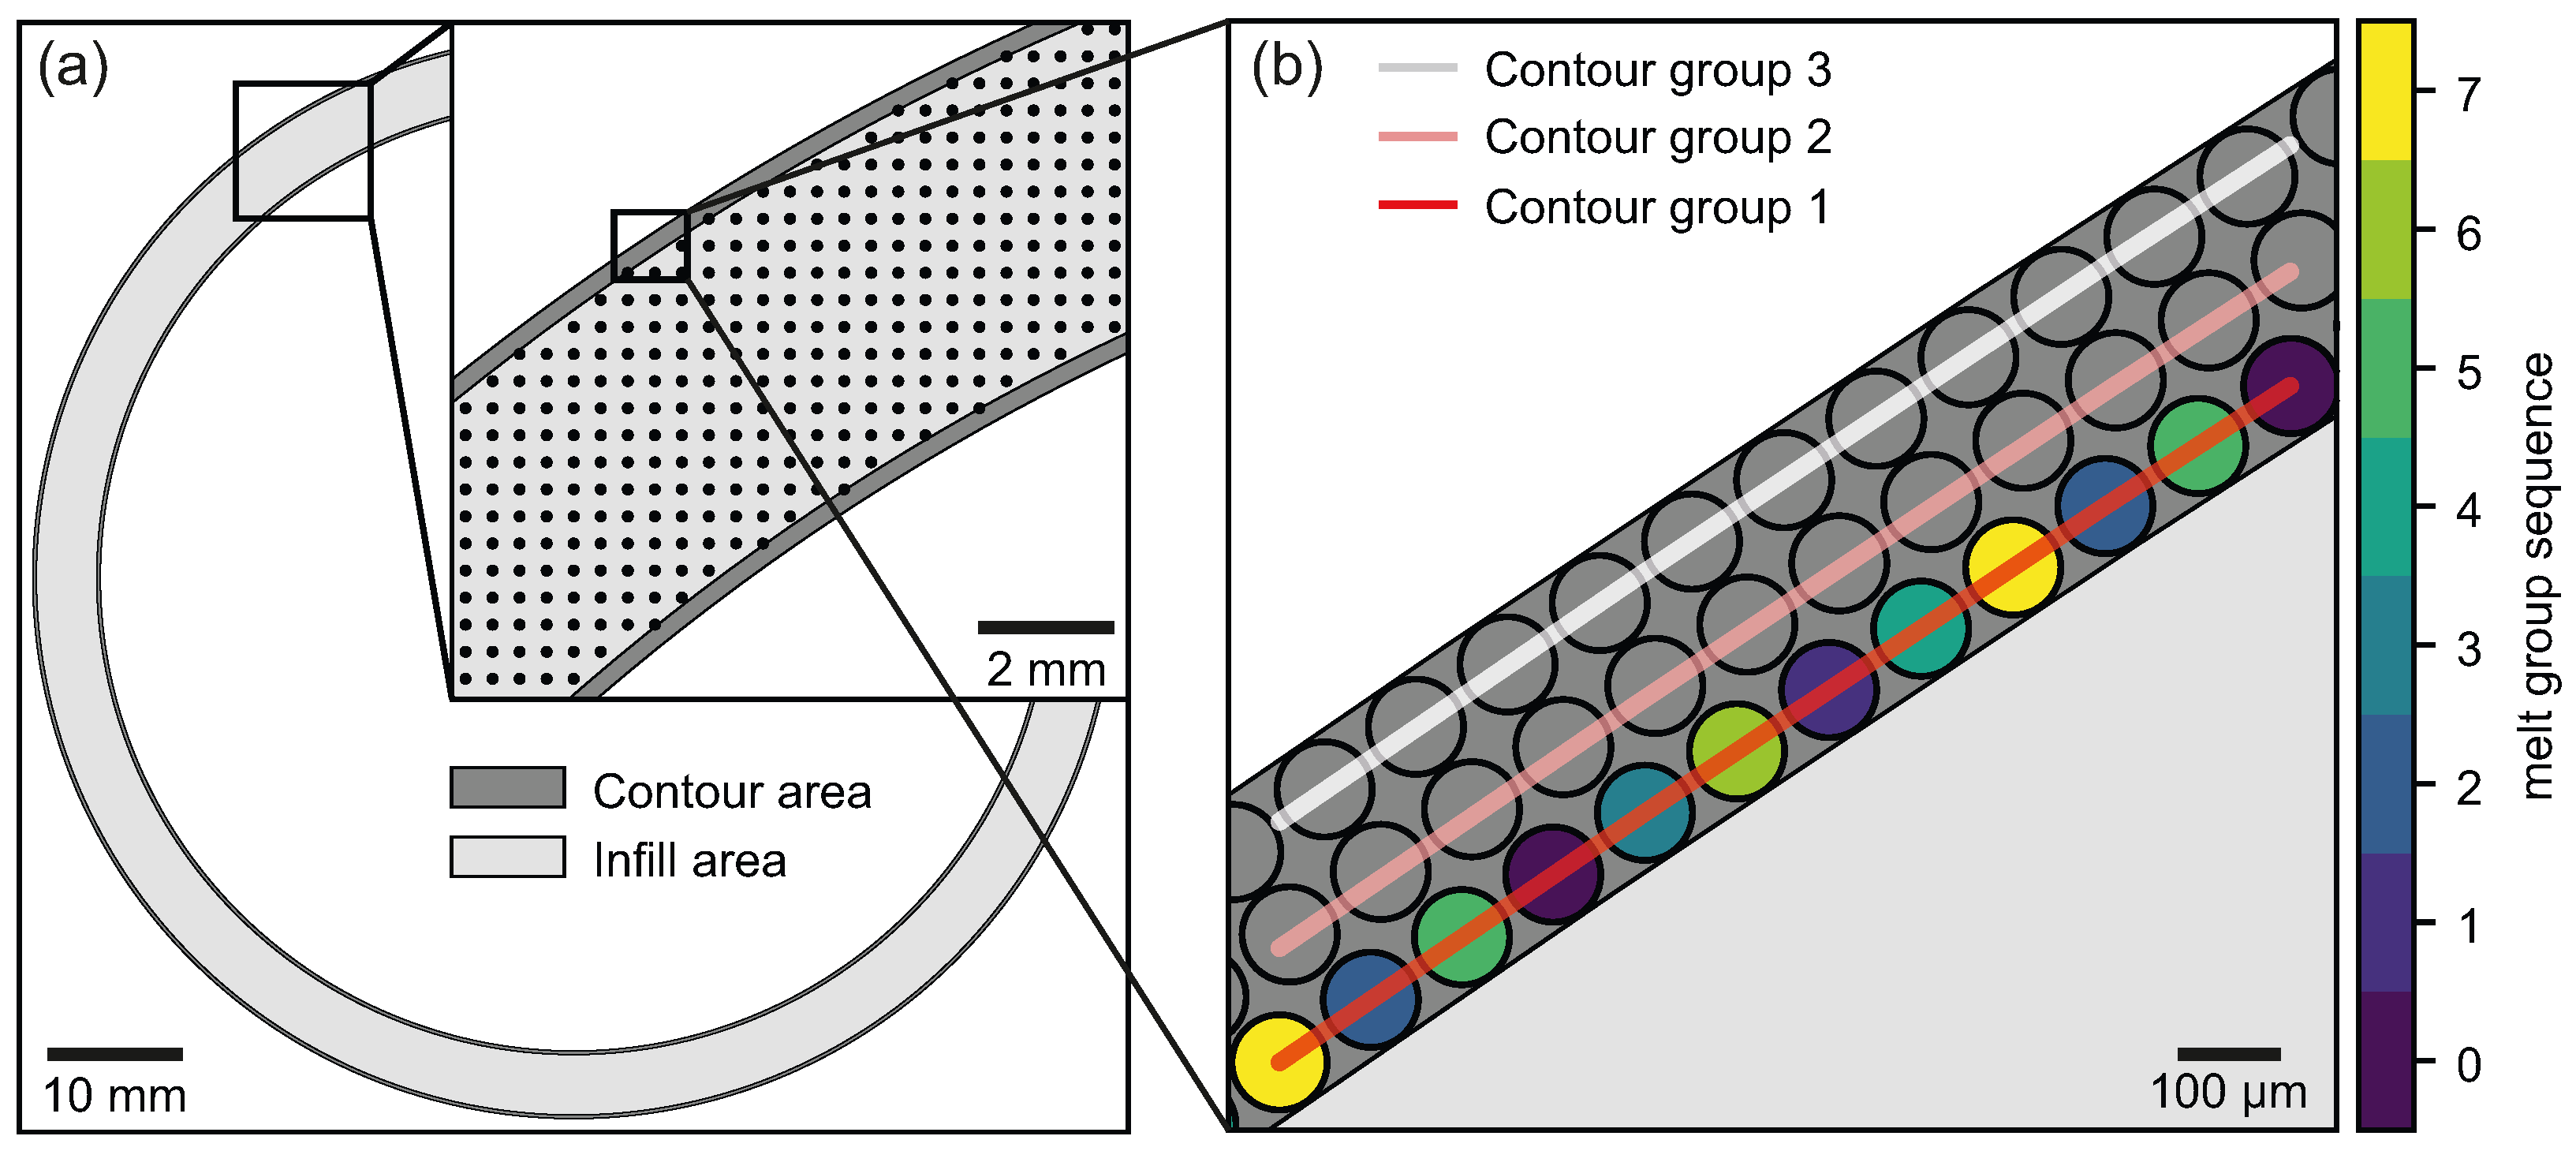
Figure 1. (a) Infill area (gray) with spots located on a square grid surrounded by a contour area (dark gray). (b) Contour area separated into three consecutively melted contour groups. The spots of each contour line are divided into 8 melt groups by applying a point skip along the contour line.
Jmmp 09 00303 g001
Figure 2. (a) Three disconnected melt areas (gray) result in four parts for each contour line (black). (b) Complete distance graph where vertices resemble the contour lines connected by edges (red) with the weight of the minimal distance (in mm) between two contour lines. (c) The minimum spanning tree connects all vertices (contour lines) by edges (red). The edges separate the contour lines into contour segments. The order within the contour segments is (counter-)clockwise, following the arrows with jumps between two contour segments at the shortest possible distance.
Jmmp 09 00303 g002
Figure 3. Different options to combine infill and contour areas. (a) A narrow contour area may lead to an overshoot of infill melt pools (yellow) or unmelted areas (green) between the infill and contour areas. The simplest solution is to increase the contour area (gray) as well as the contour offset (dashed line). (b) Introducing a projection area (blue). Infill spots located in the projection area are projected onto the contour-offset. (c) Melting an additional contour line (red) with infill-parameter-spots. Note: The contour offset is moved in each approach.
Jmmp 09 00303 g003
Figure 4. Schematic front view of the segmented hollow cylinder with different spot arrangements A, B, and C. The input parameters for each segment 1 to 16 are given in the respective rows.
Jmmp 09 00303 g004
Figure 7. (a) Smooth outer surface of the hollow cylinder. The sections are distinguishable but overshoots are visible. (b) Number of dark pixels per layer in the binarized ELO images that lie within the melted area defined by the CAD geometry. One pixel approximately covers 0.013 mm2 The mean value in each section is marked with a red line. (c) Additionally incorporated energy by the contour strategy compared to the previous hollow cylinder from Figure 5.
Jmmp 09 00303 g007
Figure 8. (a) Highlighted example layer of the brake caliper in the CAD-geometry at the example layer. The CAD file of the brake caliper [17] is under CC BY-NC-ND 4.0 license and has been scaled with the owner’s permission. (b) Spots of one melt group in one contour group. Black arrows indicate the (counter-)clockwise order in the respective contour line. Red arrows mark jumps between contour lines. (c) Ti-6Al-4V brake caliper built using the proposed contour strategy in combination with the infill approach from Kupfer et al. [18]. (d) Sharp edge leading to shorter distances between spots of the same contour line. (e) ELO image with an enlarged section of the example layer of the brake caliper.
Jmmp 09 00303 g008
Disclaimer/Publisher’s Note: The statements, opinions and data contained in all publications are solely those of the individual author(s) and contributor(s) and not of MDPI and/or the editor(s). MDPI and/or the editor(s) disclaim responsibility for any injury to people or property resulting from any ideas, methods, instructions or products referred to in the content.