Article

Adaptive Robotic Deburring of Molded Parts via 3D Vision and Tolerance-Constrained Non-Rigid Registration

1
Wolong Enapter (ZheJiang) Hydrogen Energy Technology Co., Ltd., Shaoxing 312300, China
2
Key Laboratory of Mechanism Theory and Equipment Design of Ministry of Education, Tianjin University, Tianjin 300354, China
3
International Institute for Innovative Design and Intelligent Manufacturing of Tianjin University in Zhejiang, Shaoxing 312000, China
*
Author to whom correspondence should be addressed.
J. Manuf. Mater. Process. 2025, 9(9), 294; https://doi.org/10.3390/jmmp9090294
Submission received: 25 July 2025 / Revised: 26 August 2025 / Accepted: 26 August 2025 / Published: 31 August 2025

Abstract

This paper introduces an innovative automatic trajectory generation method for the robotic deburring of molded parts, effectively addressing challenges posed by burr defects and workpiece deformation common in casting and injection molding processes. Existing offline trajectory planning methods often struggle with substantial burr sizes and complex surface deformations, resulting in compromised machining quality due to over-adaptation. To overcome these issues, the proposed approach utilizes 3D vision techniques to achieve precise burr localization. A novel burr point cloud segmentation method based on feature analysis, combined with a tolerance-constrained non-rigid registration algorithm, accurately identifies burr regions and optimizes trajectory positioning within defined manufacturing tolerances. Furthermore, the method employs quantitative burr height distribution analysis to dynamically adjust robotic feed rates, significantly enhancing processing efficiency. Experimental validations demonstrated that the proposed method reduces the deburring time by up to 68% compared to conventional techniques, achieving an average trajectory deviation of only 0.79 mm. This study provides a robust, efficient, and precise solution for automating deburring operations in complex molded components, highlighting its substantial potential for industrial applications.

1. Introduction

Burr formation on the surfaces of molded and cast parts represents a prevalent manufacturing challenge that negatively impacts product quality and mechanical integrity, thus necessitating burr removal as an indispensable post-processing step [1]. In plastic injection molding, burrs predominantly arise at the edges due to inadequate mold clamping forces or excessive injection pressures, whereas metal casting frequently results in burrs due to improper sealing of mold parting surfaces and suboptimal thermal or pressure controls [2,3]. These burrs not only impair surface esthetics but also degrade precision and structural integrity, underscoring the critical importance of reliable and effective deburring techniques [4].
Traditionally, burr removal has relied heavily on manual methods, which are labor-intensive, inefficient, inconsistent, and pose substantial health and safety risks to operators [5]. To address these shortcomings, automated deburring technologies have been introduced, employing CNC machining systems, specialized equipment, and robotic platforms. These systems typically utilize techniques such as laser ablation, electrochemical machining, ultrasonic vibrations, high-pressure jetting, or mechanical grinding [6,7,8,9]. Although automation significantly enhances efficiency and consistency, existing automated approaches often fall short in addressing complex workpiece geometries or substantial dimensional deformations [10,11].
Automated robotic deburring commonly employs offline programming, which depends on CAD models to generate machining trajectories [12,13]. However, inevitable discrepancies between ideal CAD-based paths and actual workpiece surfaces—arising from burr-induced distortions or dimensional variations, often compromise machining accuracy. To mitigate these discrepancies, sensor-based methods, including visual sensing systems, are increasingly integrated for capturing real-time surface data [14,15,16], allowing dynamic trajectory adjustments [17,18,19]. Recent advances in 3D vision, such as structured-light and laser scanning, further enhance surface reconstruction for accurate burr localization, while registration techniques have evolved from rigid Iterative Closest Point (ICP) to tolerance-constrained non-rigid methods, enabling adaptation to measured geometry without excessive deformation. These developments highlight the potential of combining 3D vision with tolerance-aware registration for more precise and reliable robotic deburring.
However, accurate burr detection and adaptive trajectory generation in response to real-world workpiece deviations remain significant research challenges [20]. Current methodologies predominantly involve trajectory optimization using rigid or non-rigid deformation based on offline CAD data. For instance, Kuss et al. [21] developed a tolerance-model-based method, which, however, assumes rigid deformation and struggles with non-uniform defect distributions. Huang et al. [5] addressed localized deformations via non-rigid registration but faced limitations in handling significant variations in burr size and distribution. Peng et al. [22] improved precision by incorporating burr morphology into non-rigid registration; however, their approach sacrificed processing efficiency. Xiong et al. [23,24] utilized local deformable template matching and threshold segmentation for speed adjustments but confined their applicability to two-dimensional scenarios. Existing solutions are summarized and categorized as illustrated in Figure 1.
Despite advancements, two notable limitations persist in contemporary approaches: first, inefficient trajectory generation that inadequately accounts for variations in burr size and distribution; second, susceptibility to over-adaptation resulting from sensor inaccuracies or errors during point cloud alignment, often exceeding manufacturing tolerances.
This paper proposes an innovative automatic deburring strategy employing 3D vision to overcome the aforementioned shortcomings. The method integrates feature-based burr point cloud segmentation with a tolerance-constrained non-rigid registration algorithm, optimizing trajectory accuracy. Additionally, the trajectory feed rate is dynamically adjusted according to burr distribution, significantly enhancing processing efficiency. Experimental validation demonstrates that this proposed approach effectively addresses limitations inherent in existing methods, providing a robust solution for automated deburring with improved precision and adaptability. The subsequent sections detail the proposed methodology, experimental validations, results, and conclusions.

2. Methods and Experimental Procedure

2.1. Methods

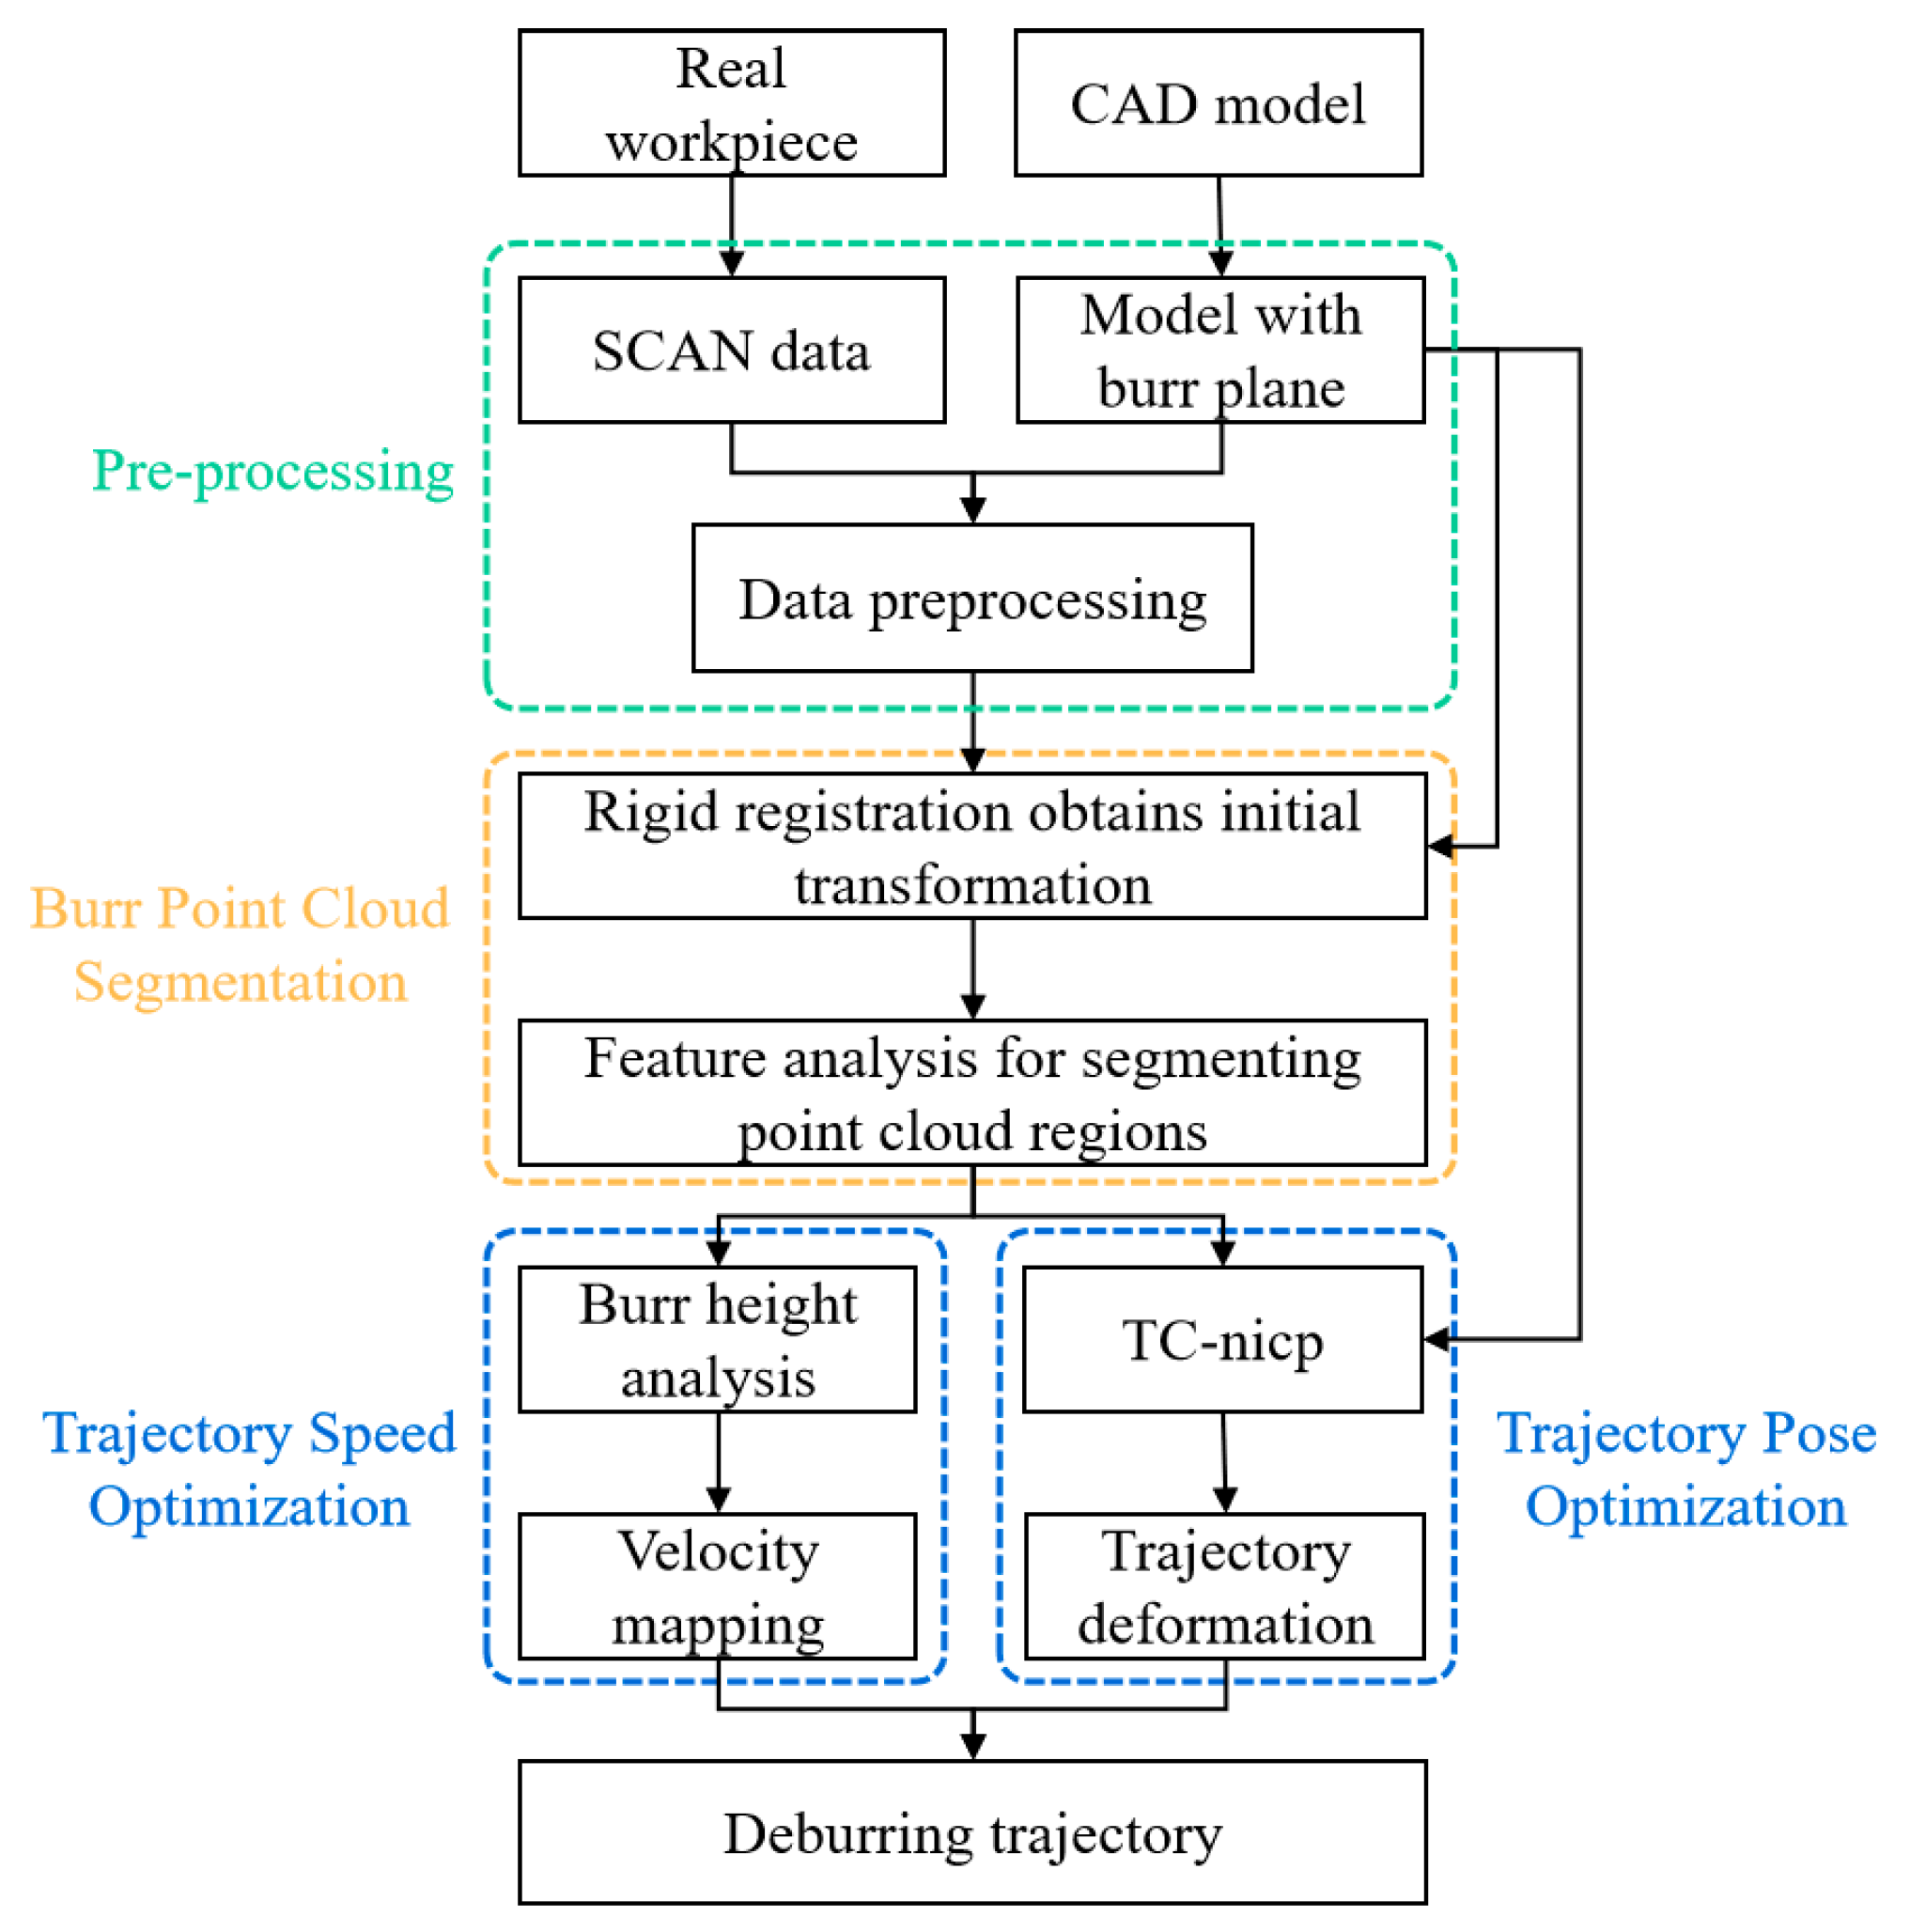
Figure 2 illustrates the workflow of the proposed automated deburring method leveraging 3D vision technology. The core concept involves optimizing deburring trajectories through precise burr identification, tolerance-constrained non-rigid registration, and dynamic feed rate adjustment based on burr distribution. The method consists of four primary stages detailed in subsequent sections.

2.1.1. Data Acquisition and Pre-Processing

Reliable data acquisition and preprocessing are essential to achieve accurate burr detection and effective trajectory planning. Since a single scan captures only a limited portion of the workpiece surface, multiple scans from different viewpoints are performed to capture the complete workpiece surface, and the resulting scans are merged into a unified coordinate system through a two-stage alignment procedure. First, manual alignment is conducted using CloudCompare (Version 2.13.2 Kharkiv) to obtain an approximate transformation, and then the Non-rigid ICP algorithm [25,26] refines the alignment. This workflow ensured accurate 3D reconstruction suitable for burr detection and trajectory planning.
To accurately segment burrs and optimize trajectories, distinctive geometric features, typically edge intersections, are identified manually on the parting surfaces. These feature points’ coordinates are recorded and subsequently used by the Random Sample Consensus (RANSAC) algorithm [27] to fit a precise burr growth plane. This process yields the accurate plane position and corresponding normal vector ( p plane , n plane ), providing a robust spatial reference framework for subsequent analysis.
Raw point cloud data typically contain noise, redundant points, or uneven distributions, which may negatively impact burr detection and trajectory planning accuracy. To mitigate these issues, voxel-based downsampling utilizing an octree partitioning method is implemented. For points within the same voxel, the centroid coordinates x i ,   y i ,   z i are calculated as representative points.
x d = 1 n i = 1 n x i y d = 1 n i = 1 n y i z d = 1 n i = 1 n z i
where n denotes the number of points within the voxel. By adjusting the voxel size, a balance is achieved between preserving geometric details and reducing data volume. As a core preprocessing step, this ensures accurate and efficient burr segmentation and trajectory planning.

2.1.2. Feature-Based Burr Point Cloud Segmentation

Based on the processed data obtained previously, this section first performs rigid registration between the scanned point cloud and CAD data to establish point correspondences, then conducts feature analysis on the corresponding points to segment the burr point cloud.
In this study, rigid registration aligns the scanned point cloud P = p 1 , . . . , p N with the CAD model point cloud Q = q 1 , . . . , q N , establishing point correspondences that serve as the foundation for burr segmentation. The process begins with coarse alignment using Fast Point Feature Histogram (FPFH) [28] descriptors, which characterize local geometric properties of the point cloud. Based on these descriptors, an initial transformation is computed to align the two sets of point clouds.
The ICP algorithm is then applied to refine the alignment by iteratively minimizing the distances between corresponding points. Rigid registration assumes that the workpiece is free of significant dimensional deformation, which may not hold true for parts subject to non-uniform cooling or manufacturing errors. Therefore, the results of rigid registration are used as an initial transformation for subsequent non-rigid registration and feature analysis. In each iteration, corresponding points are identified, an optimal rigid transformation is computed, and the source point cloud is updated. Iterations continue until convergence, such as when the change in error falls below a threshold or a maximum number of iterations is reached. The results of rigid registration are then used as the initial transformation for non-rigid registration and feature analysis.
Based on the rigid registration results, feature analysis is then performed on the corresponding points between the scanned point cloud P and CAD sampling point cloud Q to extract burr point clouds from the scanned data. Here, region partitioning is performed based on the burr growth plane, extracting point cloud data within a certain range on both sides of the burr growth plane   p plane , n plane . This portion of the point cloud serves as the potential burr region P potential for targeted burr processing. For points within the potential burr region, feature analysis is conducted based on rigid registration results. Let   p i be a point in the scanned point cloud and q i be its corresponding point in the CAD model point cloud. The following features are calculated:
(a)
Euclidean distance feature: f dist p i = p i q i
(b)
Normal vector difference feature: f normal p i = 1 n p i n q i
where n p i and n q i are unit normal vectors at points p i and q i , respectively. Combining these features, a burr point cloud extraction criterion function is defined:
B p i = ω 1 f dist p i + ω 2 f normal p i
where ω 1 and ω 2 are weight coefficients determined through experimental optimization. The burr point cloud will be extracted under the following rules (the B threshold parameter is obtained by experiment):
P burr = p i B p i > B threshold , p i P potential

2.1.3. Trajectory Pose Optimization Under Tolerance Constraints

Dimensional variations due to manufacturing tolerances necessitate adjustments to the trajectory to ensure accurate burr removal. A Tolerance-Constrained Non-rigid ICP (TC–NICP) algorithm is employed to handle these variations while maintaining compliance with manufacturing tolerances.
It is noticed that deburring trajectories based on rigid registration of offline paths cannot adapt to workpiece deformations, and thus non-rigid registration methods are commonly used to accommodate dimensional changes. However, non-rigid registration algorithms often neglect tolerance effects, leading to excessive deformation due to sensor and point cloud stitching errors exceeding tolerance ranges. For molded parts, the deformation will not exceed the specified process tolerance range. Therefore, this research proposes a Tolerance-Constrained Non-rigid ICP (TC–NICP) algorithm. While maintaining the basic NICP framework, this algorithm introduces a deformation constraint mechanism based on manufacturing tolerances, as shown in Figure 3, ensuring deformation magnitudes remain within reasonable ranges throughout the registration process.
The TC–NICP algorithm addresses this issue by introducing a deformation constraint based on tolerance limits. The optimization process minimizes an energy function composed of three terms:
(1)
Data term: E fit = α i = 1 N p i + v i q i 2 , measuring point cloud alignment error;
(2)
Regularization term: E reg = β i = 1 N v i v j 2 , constraining deformation field continuity;
(3)
Constraint term E cons = γ H v i τ , where τ is the deformation threshold based on manufacturing tolerances and H x is the Heaviside function used to penalize deformations exceeding the threshold.
The total energy function is expressed as:
E = E fit + E reg + E cons
For each point p i in the source point cloud, the deformation vector v i is iteratively optimized. If the magnitude of v i exceeds the tolerance τ , it is scaled back to satisfy the constraint:
v i = τ v i v i ,   while   v i > τ
After completing non-rigid registration of the point cloud, basic contact trajectory points are extracted from the CAD model, interpolated based on the aforementioned deformation field, and finally compensated using tool parameters to form the tool trajectory. The specific process is as follows:
First, update the trajectory position. Calculate the intersection point set x 1 , x 2 , . . . . x n between the burr growth plane and CAD data triangle mesh boundaries. These intersection points serve as basic contact trajectory points, with position vector denoted as x i and pose n determined by the burr growth plane normal vector. For any point x on the trajectory, this method employs K-nearest neighbor inverse distance weighted interpolation to calculate its deformation. First, find K-nearest neighbor points P i ( i = 1 , 2 , , K ) ), then calculate weights.
ω i = 1 d i j = 1 K 1 d
V x = i = 1 K ω i V p i / K
where d i is the distance from point x to its i-th nearest neighbor, and the displacement vector for trajectory points is obtained through weighted averaging. The deformation-compensated basic contact trajectory point is
x = x + V x
The trajectory posture also needs to be adjusted according to the deformation. The trajectory pose is updated by calculating the local deformation gradient matrix H :
H = i = 1 K ω i V p i p i x
where denotes the outer product operation. The updated normal vector n is obtained by solving the linear equation:
H T n = n
followed by normalization: n = n n .
To convert the workpiece surface contact trajectory into the actual tool center point trajectory, the geometric characteristics of the rotary file must be considered. In this method, the rotary file is simplified to a cylindrical model with key parameters including tool radius r and effective contact height h . The tool center point x c can be obtained through the following transformation:
x c = x + d n
where n is the surface normal vector at the contact point, and d is the offset distance from the tool center point to the contact point.
To ensure processing quality, tool pose adjustment and trajectory smoothness need to be considered. The tool axis vector should maintain a specific angle θ with the workpiece surface normal vector n . In this method, using a cylindrical rotary file, θ is set to 90°, ensuring appropriate contact between the rotary file and workpiece surface while avoiding excessive or insufficient cutting. For continuous trajectory points, cubic spline interpolation is employed for smooth processing of the tool center point trajectory to ensure process stability. Through these methods, the workpiece surface contact trajectory can be converted into an actual machining trajectory that considers tool geometric characteristics, ensuring ideal machining states during the deburring process.

2.1.4. Trajectory Speed Optimization Based on Point Cloud Mesh Analysis

Dynamic feed rate adjustments significantly impact the efficiency and quality of deburring processes. Existing research indicates that feed speed directly affects cutting forces [29]. Increased burr heights (cutting depth) elevate cutting forces, potentially causing tool deflection and incomplete burr removal. Consequently, reducing feed rate or increasing spindle speed becomes necessary. Conversely, when burr heights are smaller, the cutting forces are within safe operational limits, allowing for increased feed rates to enhance process efficiency. To realize this adaptive feed rate control, this method employs structured meshing of burr point clouds, converting discrete data into regular grid structures for consistent quantification of burr heights. Burr heights are systematically computed via contour dilation, creating a reliable mapping between burr height and optimal feed rate, experimentally determined to guide precise, real-time adjustments of robotic operating speeds.
Here, the objective of meshing is to transform discrete point cloud data into a regular grid structure, providing a unified reference framework for quantifying burr distribution characteristics.
First, project the burr point cloud p p P burr onto the burr growth plane p plane , n plane to obtain p :
p = p p p plane n plane n plane
Establish a two-dimensional grid system on the burr growth plane with grid size δ . For projected points p x , y , their grid indices are calculated as:
i   =   floor x x min δ j   =   floor y y min δ
where x min , y min represents the minimum boundary coordinate of the point cloud on the projection plane, and floor ( ) is the floor function. For each grid cell G i , j , the grid center coordinates x center , y center and a flag indicating the presence of burr point cloud data are recorded.
To eliminate noise generated during the meshing process, morphological post-processing operations are introduced, including hole filling based on closing operations and boundary smoothing based on Gaussian smoothing kernels.
During the burr height analysis process, this method proposes a burr height analysis method based on meshed data, as shown in Figure 4. The obtained deformation-adapted contact trajectory points are similarly projected onto the grid system. An improved K-dimensional tree nearest neighbor search algorithm is used to sort the contour points, obtaining the original contour C 0 . Iterative dilation operations are performed on the original contour C 0 to generate n equidistant outer contours C 1 , C 2 , . . . , C n . The distance between the k-th layer contour and the original contour is h k = k δ , where δ is the grid cell size and k is the contour layer number. All burr grids are traversed, and their distances h k are recorded.
Height analysis and calculations are then performed on the burrs in the trajectory grid data along the ordered pose point grid. The surface normal vectors of the trajectory are calculated, and the maximum number of burr grid layers along the normal vector direction is recorded. This value is then multiplied by the grid size δ to determine the burr height at the corresponding contour point. These height data at the trajectory points are used to adjust the speed settings for this trajectory.
In deburring trajectory planning, burr height directly affects the allocation of processing speed. To ensure both processing quality and efficiency, a trajectory velocity dynamic adjustment algorithm based on burr height is proposed. This method dynamically adjusts the robot feed rate based on previous burr height distribution results, ensuring smooth trajectory velocity and higher processing quality.
In this method’s deburring strategy, the concept of optimal feed rate is introduced, defined as: under the constraint of maximum cutting force F max , the maximum feed rate v max that can stably and completely remove burrs at the current cutting depth, multiplied by a safety factor α .
v = α v max
For each point on the trajectory, the quantified burr height has been calculated in the previous section. The optimal feed rate for this position is obtained through interpolation based on the mapping relationship between burr height and optimal feed rate, where this mapping relationship is determined experimentally as an important parameter. This allows the feed rate to adapt to local burr conditions, ensuring smooth transitions between consecutive trajectory points. Then, the robot and end-effector motion parameters are input to smooth the local trajectory velocity, ensuring optimal grinding trajectory generation with smooth and continuous velocity changes.

2.2. Experimental Procedure

2.2.1. Experimental Setup

The automated deburring system used in this research comprises a Revopoint Surface HD 50 (Revopoint 3D Technologies Inc., Shenzhen, China) infrared structured light 3D camera, an ABB IRC2600-20 industrial robot (ABB Ltd., Zurich, Switzerland), a compliant grinding unit (Hongyao FD08, Beijing Hongyao Technology Co., Ltd., Beijing, China), a PC (9th Gen Intel Core i5-9300H processor, 20 GB RAM, 64-bit Windows 10 system), an electrical control unit, a proportional valve, and an ABB IRC5 robot controller, as illustrated in Figure 5. The camera, mounted in an eye-in-hand configuration with hand-eye calibration via the Tsai–Lenz [30] method (reprojection error: 0.7 pixels), captures comprehensive point cloud data. The PC functions as the central hub for data processing, trajectory calculation, and communication. The electrical control unit coordinates device interactions, while the proportional valve modulates air pressure to control the grinding force of the compliant unit. The ABB controller precisely executes generated trajectory commands, enabling accurate robot joint movements for effective deburring operations. The Open3D library under Python 3.10 facilitates all point cloud processing.

2.2.2. Pre-Experiment for Parameter Determination

To optimize the adaptive burr removal performance, preliminary experiments were conducted to establish the correlation between burr height (cutting depth) and optimal feed rate, with other parameters held constant. Experimental materials included PLA 3D printed plates (100 mm × 50 mm × 2 mm) simulating a 2 mm burr thickness. Trials involved varying feed rates at fixed spindle speed (3000 r/min), grinding pressure (1 MPa), and rotary file diameter (12 mm). Processing outcomes were evaluated to determine the maximum feed rates achieving stable burr removal at various cutting depths. Five duplicates were conducted with varying cutting depths to obtain the mapping relationship.

2.2.3. Workpiece Deburring Experiment

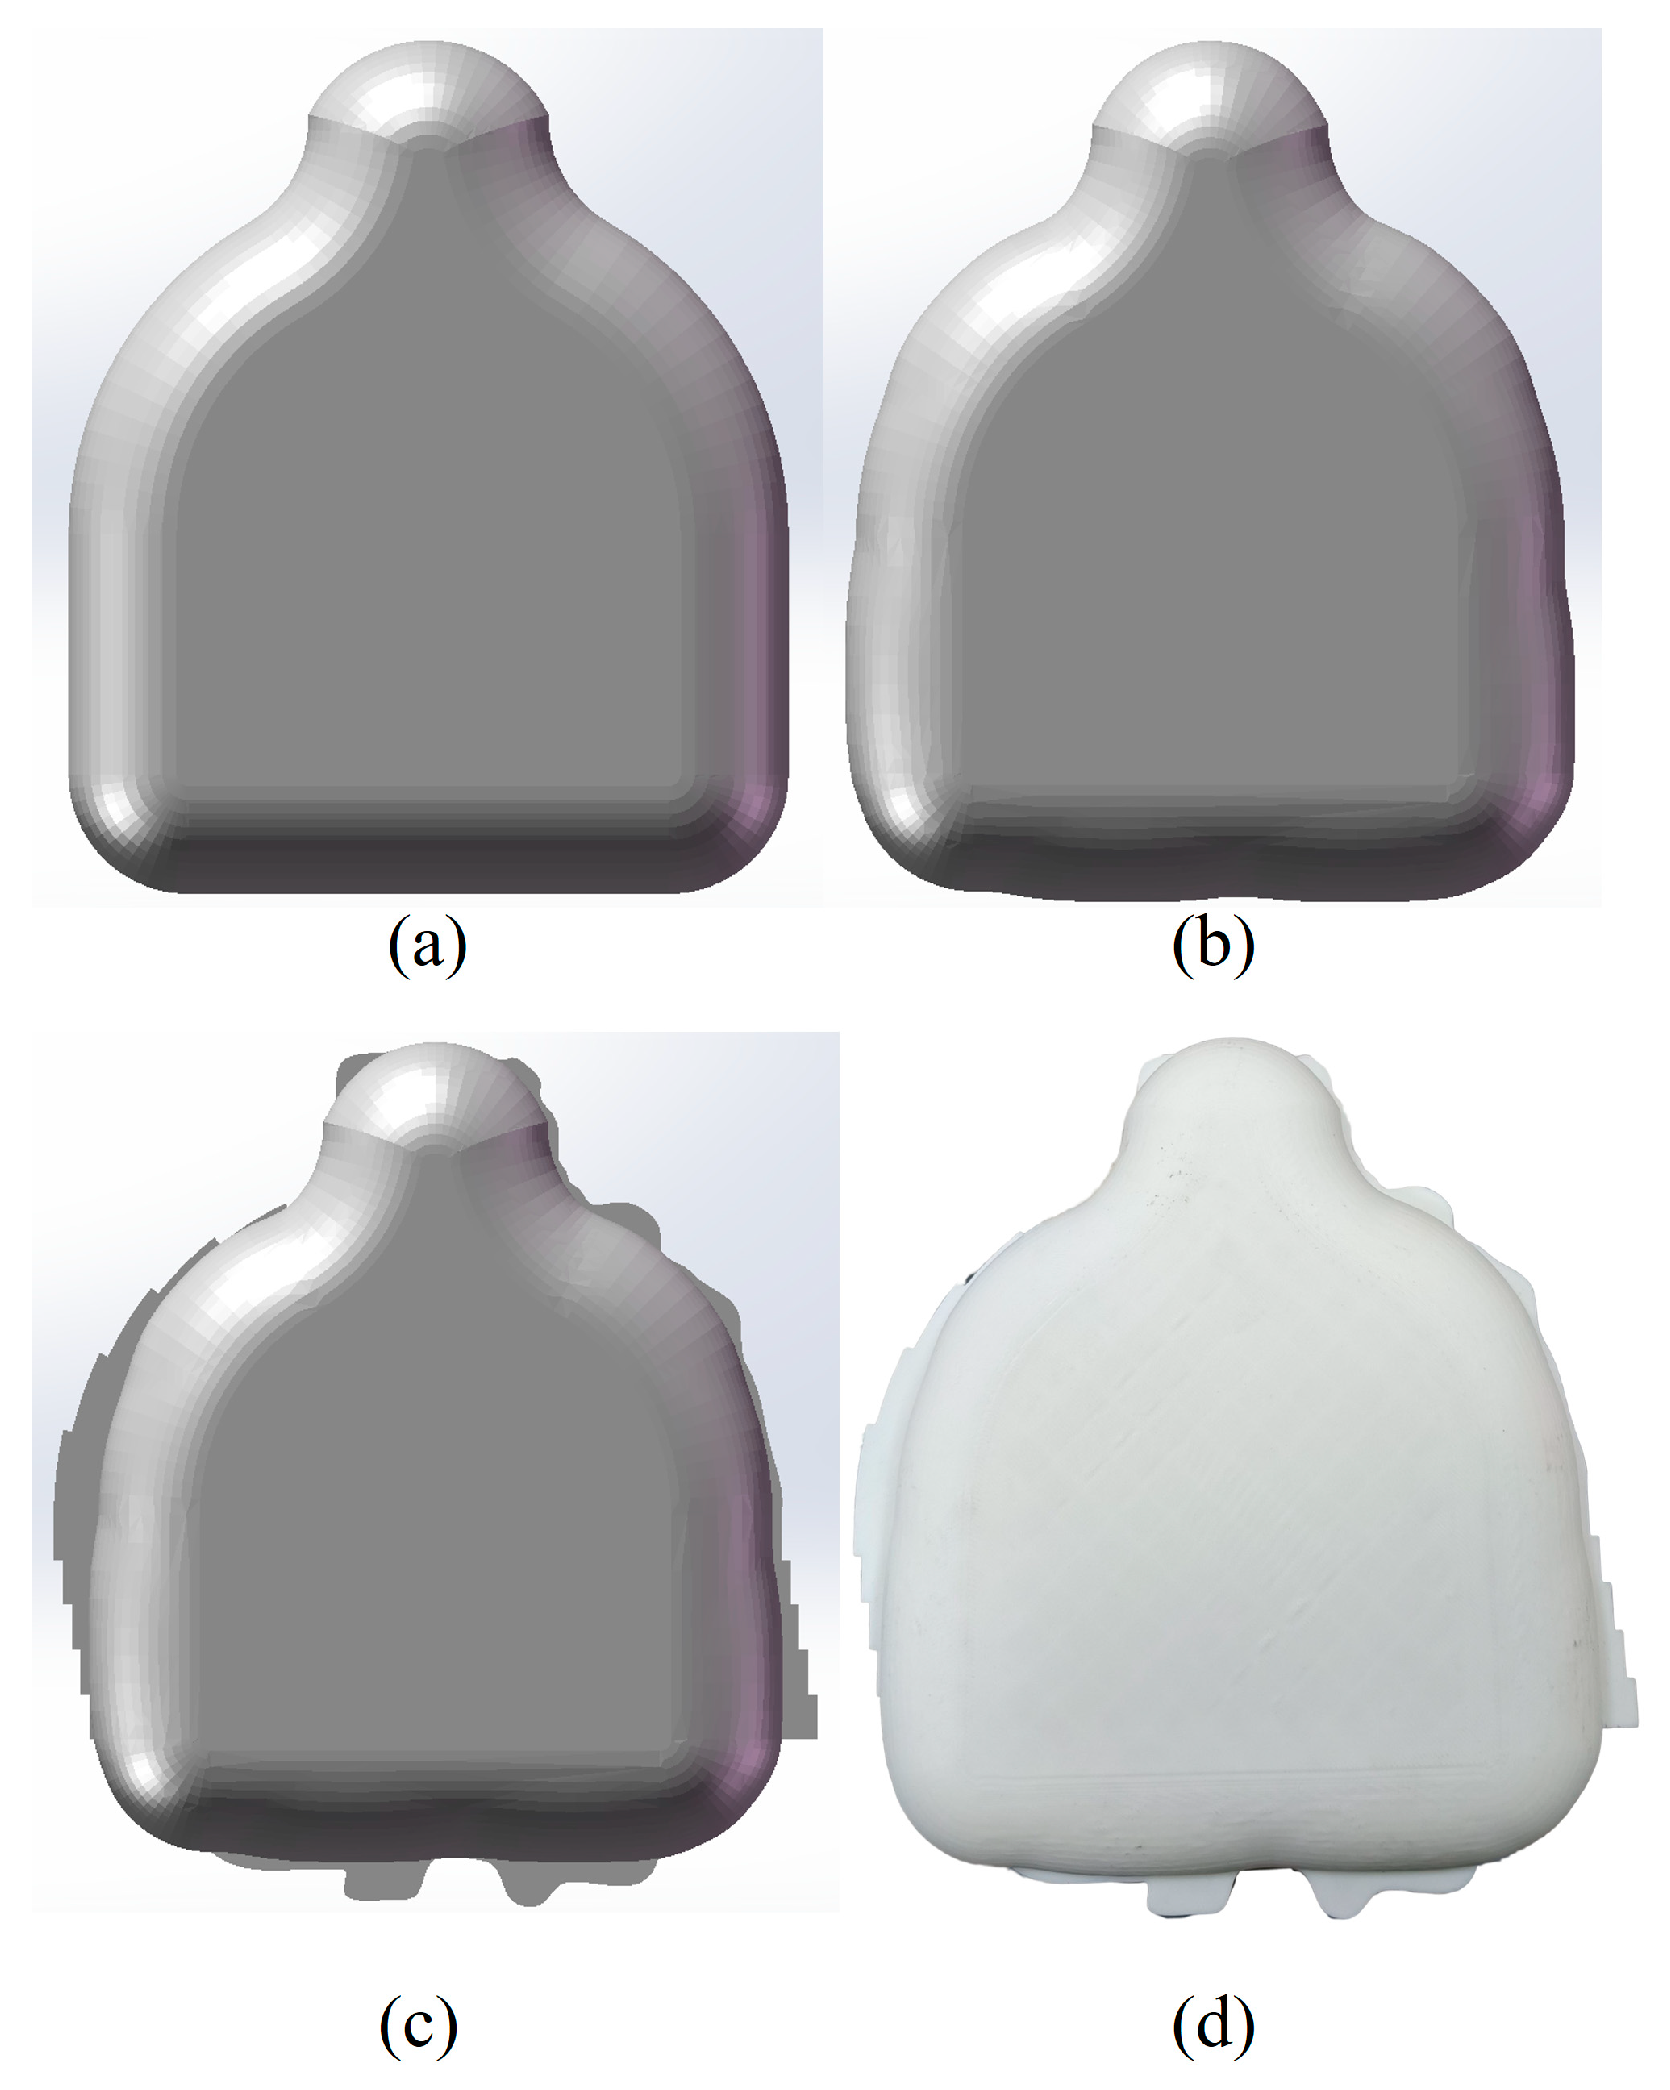
To evaluate the proposed deburring strategy, experiments were conducted using workpieces with artificially generated burrs on planar and curved surfaces (Figure 6). Initially, an ideal workpiece, denoted as C A D ideal (Figure 6a), was artificially modified with a 3% nominal dimensional error, denoted as C A D defor (Figure 6b). The burr growth plane was identified using CloudCompare (Version 2.13.2 Kharkiv), and a 2 mm thick simulated burr was applied, denoted as C A D defor-burr (Figure 6c). The modified workpiece was then 3D printed (Figure 6d), and multi-angle point cloud scans were conducted. Trajectories generated by the proposed method, rigid registration, and non-rigid registration methods were compared against the ground truth derived from the CAD model. Errors, trajectory execution times, and registration accuracy (RMSE) were analyzed and visualized, and the deburring quality was comparatively assessed to confirm the robustness and effectiveness of the proposed approach.

3. Results and Discussion

The experimental results establish a critical mapping relationship between burr height (cutting depth) and the optimal feed rate, which serves as a fundamental input parameter for the proposed method. As shown in Table 1, the maximum feed rate decreases significantly as the cutting depth increases, reflecting the mechanical limitations of maintaining stable burr removal under higher cutting forces. For instance, at a cutting depth of 2.0 mm, the maximum feed rate reaches 19.5 mm/s, which is the highest among all tested depths, ensuring efficient processing under minimal cutting force. However, when the cutting depth increases to 4.0 mm, the maximum feed rate drops sharply to 6.5 mm/s, reflecting the need to reduce feed speed to maintain stability and surface quality. This trend continues as the cutting depth increases; at 6.0 mm, the maximum feed rate decreases further to 5.5 mm/s, while at 8.0 mm and 10.0 mm, the feed rates are as low as 2.5 mm/s and 1.5 mm/s, respectively. These values emphasize the necessity of lower feed speeds for deeper burrs to ensure complete burr removal.
This relationship ensures stable and complete burr removal while maintaining surface quality across different burr heights. However, using PLA as the experimental material may not fully represent the cutting characteristics of metallic workpieces, and fixed parameters (e.g., spindle speed and grinding head pressure) may require adjustments for other materials. Future work could explore a wider range of materials and parameter settings to further refine the mapping model. Nevertheless, the established relationship provides a solid foundation for automating the deburring process, enabling real-time feed rate adjustments to balance efficiency and surface quality in industrial applications.
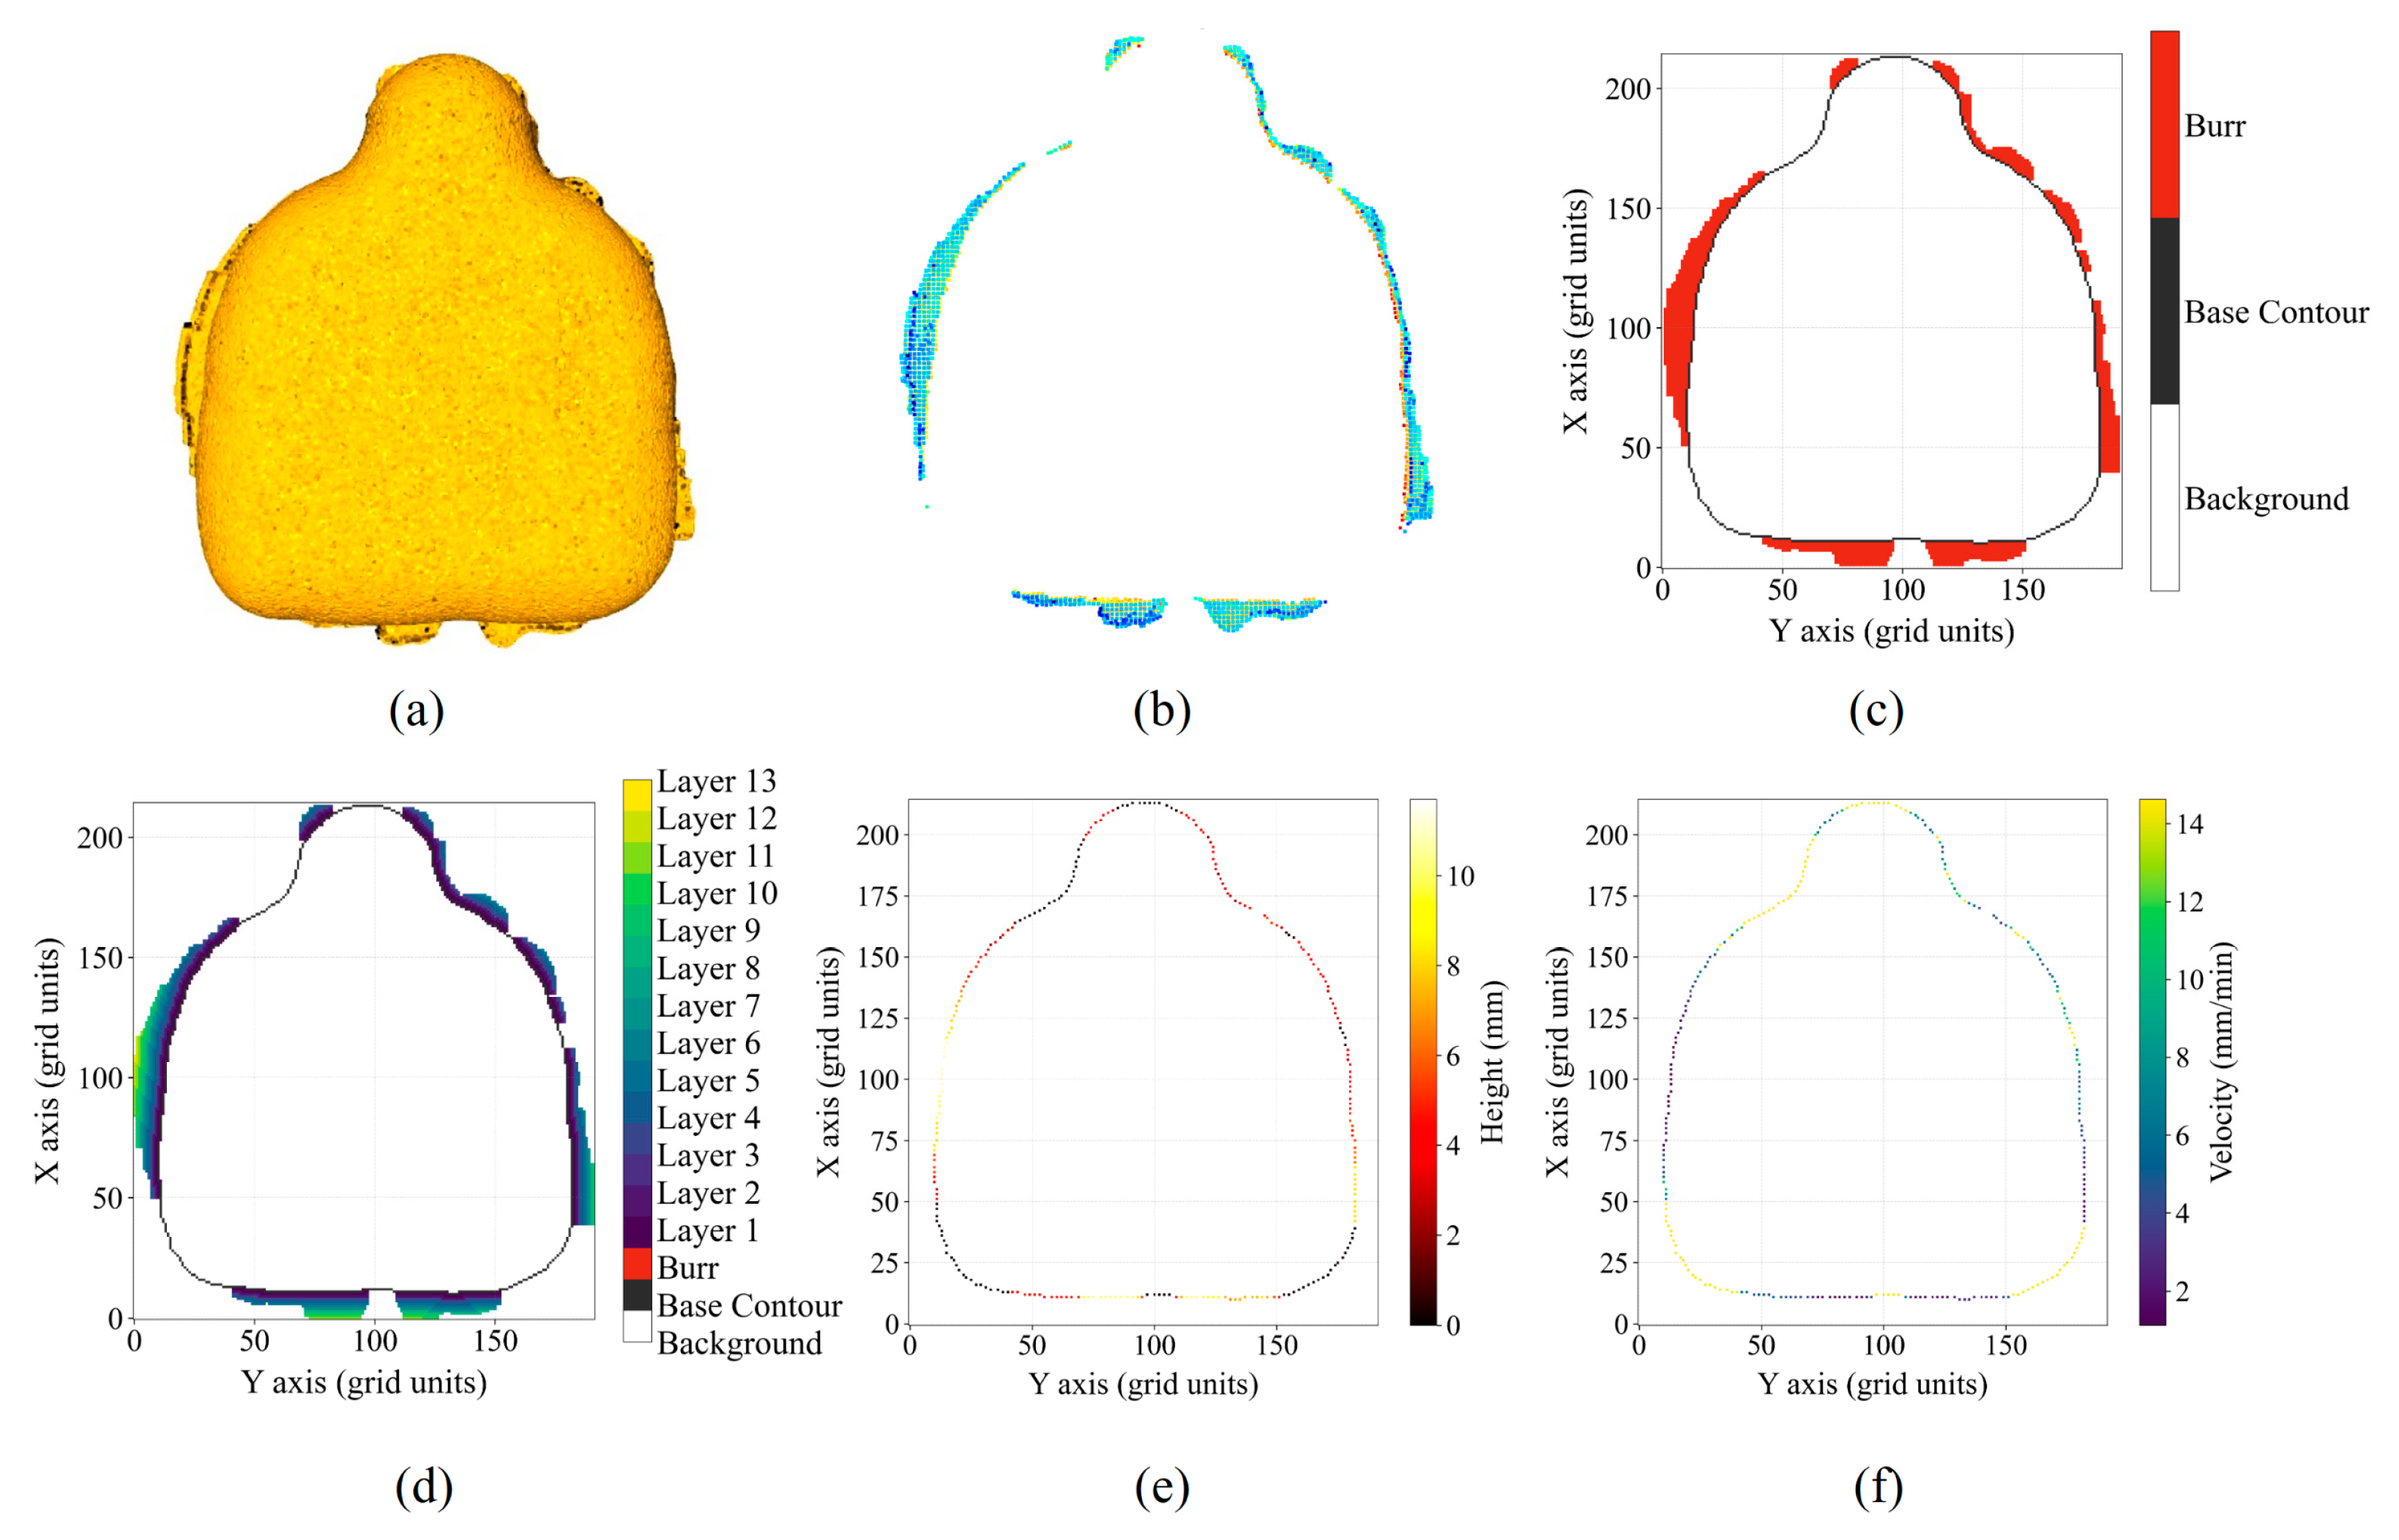
Figure 7 systematically illustrates the intermediate results and the final trajectory generated by the proposed method. As shown in Figure 7a, the stitched point cloud data of the workpiece is obtained through multi-angle scanning, providing the foundation for subsequent analysis. The feature-based segmentation in Figure 7b effectively identifies burr regions by analyzing geometric features, enabling precise trajectory planning while minimizing unnecessary processing of non-burr areas. In Figure 7c, the segmented burr point cloud is projected onto the burr growth plane for meshing analysis, generating a structured grid that serves as a consistent reference framework for quantifying burr height distribution. Figure 7d presents the layered analysis of burr heights based on the meshed point cloud. The results reveal clear variations in burr height across different regions. For example, high-burr regions contain up to 13 layers, with each layer corresponding to a grid cell size of 0.8 mm, resulting in a maximum burr height of approximately 10.4 mm. In contrast, low-burr regions exhibit fewer than 3 layers, corresponding to a height of less than 2.4 mm. These variations provide critical input data for trajectory velocity optimization. The quantitative characterization of burr distribution ensures precise feed rate control, where higher burr regions necessitate slower feed rates to ensure complete removal, while lower regions allow for higher feed rates to improve efficiency. Figure 7e demonstrates the result of indexing and recording burr heights near each trajectory point, facilitating the mapping of burr height data to specific trajectory points. Figure 7f illustrates the dynamic feed rate mapping based on burr height distribution. The velocity profile reflects significant variation corresponding to burr heights. For regions with burr heights exceeding 9 mm, the feed rate is reduced to as low as 1.5 mm/s to ensure cutting stability and prevent tool floating. Conversely, in regions with burr heights below 2.0 mm, the feed rate is increased to a maximum of 14.0 mm/s to enhance processing efficiency. Smooth transitions between feed rates are achieved, which avoids abrupt velocity changes that could compromise machining quality. This dynamic adjustment strategy achieves an optimal balance between deburring efficiency and surface quality, as evidenced by the significant reduction in processing time compared to traditional methods employing constant feed rates. Collectively, Figure 7d–f highlight the effectiveness of the proposed method in characterizing burr distribution and dynamically optimizing feed rates. While the proposed dynamic feed-rate adjustment improves processing efficiency, it has some limitations. Variations in workpiece material properties, extreme burr heights, or measurement errors could affect feed-rate optimization. To ensure safe operation, feed rates are constrained within ranges that prevent excessive tool deflection or surface damage, maintaining both processing quality and system reliability.
Table 2 shows the performance of the trajectories generated by the three methods in terms of point cloud, trajectory, and deburring time. In terms of trajectory pose optimization. Comparing the experimental data, proposed method achieved a point cloud registration root mean square error (RMSE) of 0.49 mm, surpassing the rigid registration approach (2.08 mm) due to its ability to identify and accommodate workpiece deformation, although not achieving the lower RMSE of the non-rigid registration method (0.06 mm). However, the final trajectory RMSE obtained through our method (0.79 mm) significantly outperforms both alternative approaches (i.e., 1.55 mm and 1.05 mm, respectively). This superior performance can be primarily attributed to the Tolerance-Constrained Non-rigid ICP (TC–NICP) algorithm. By incorporating a deformation constraint mechanism based on manufacturing tolerances, TC–NICP deliberately restricts complete point cloud matching rather than pursuing RMSE optimization as the sole objective. While this approach results in a relatively higher point cloud registration RMSE, it successfully mitigates the excessive deformation issues typically caused by sensor errors and point cloud stitching inaccuracies. This controlled approach enables more precise identification of workpiece dimensional variations, establishing a robust foundation for subsequent accurate trajectory generation. Consequently, the trajectory RMSE demonstrated a 25% improvement, ensuring enhanced trajectory precision.
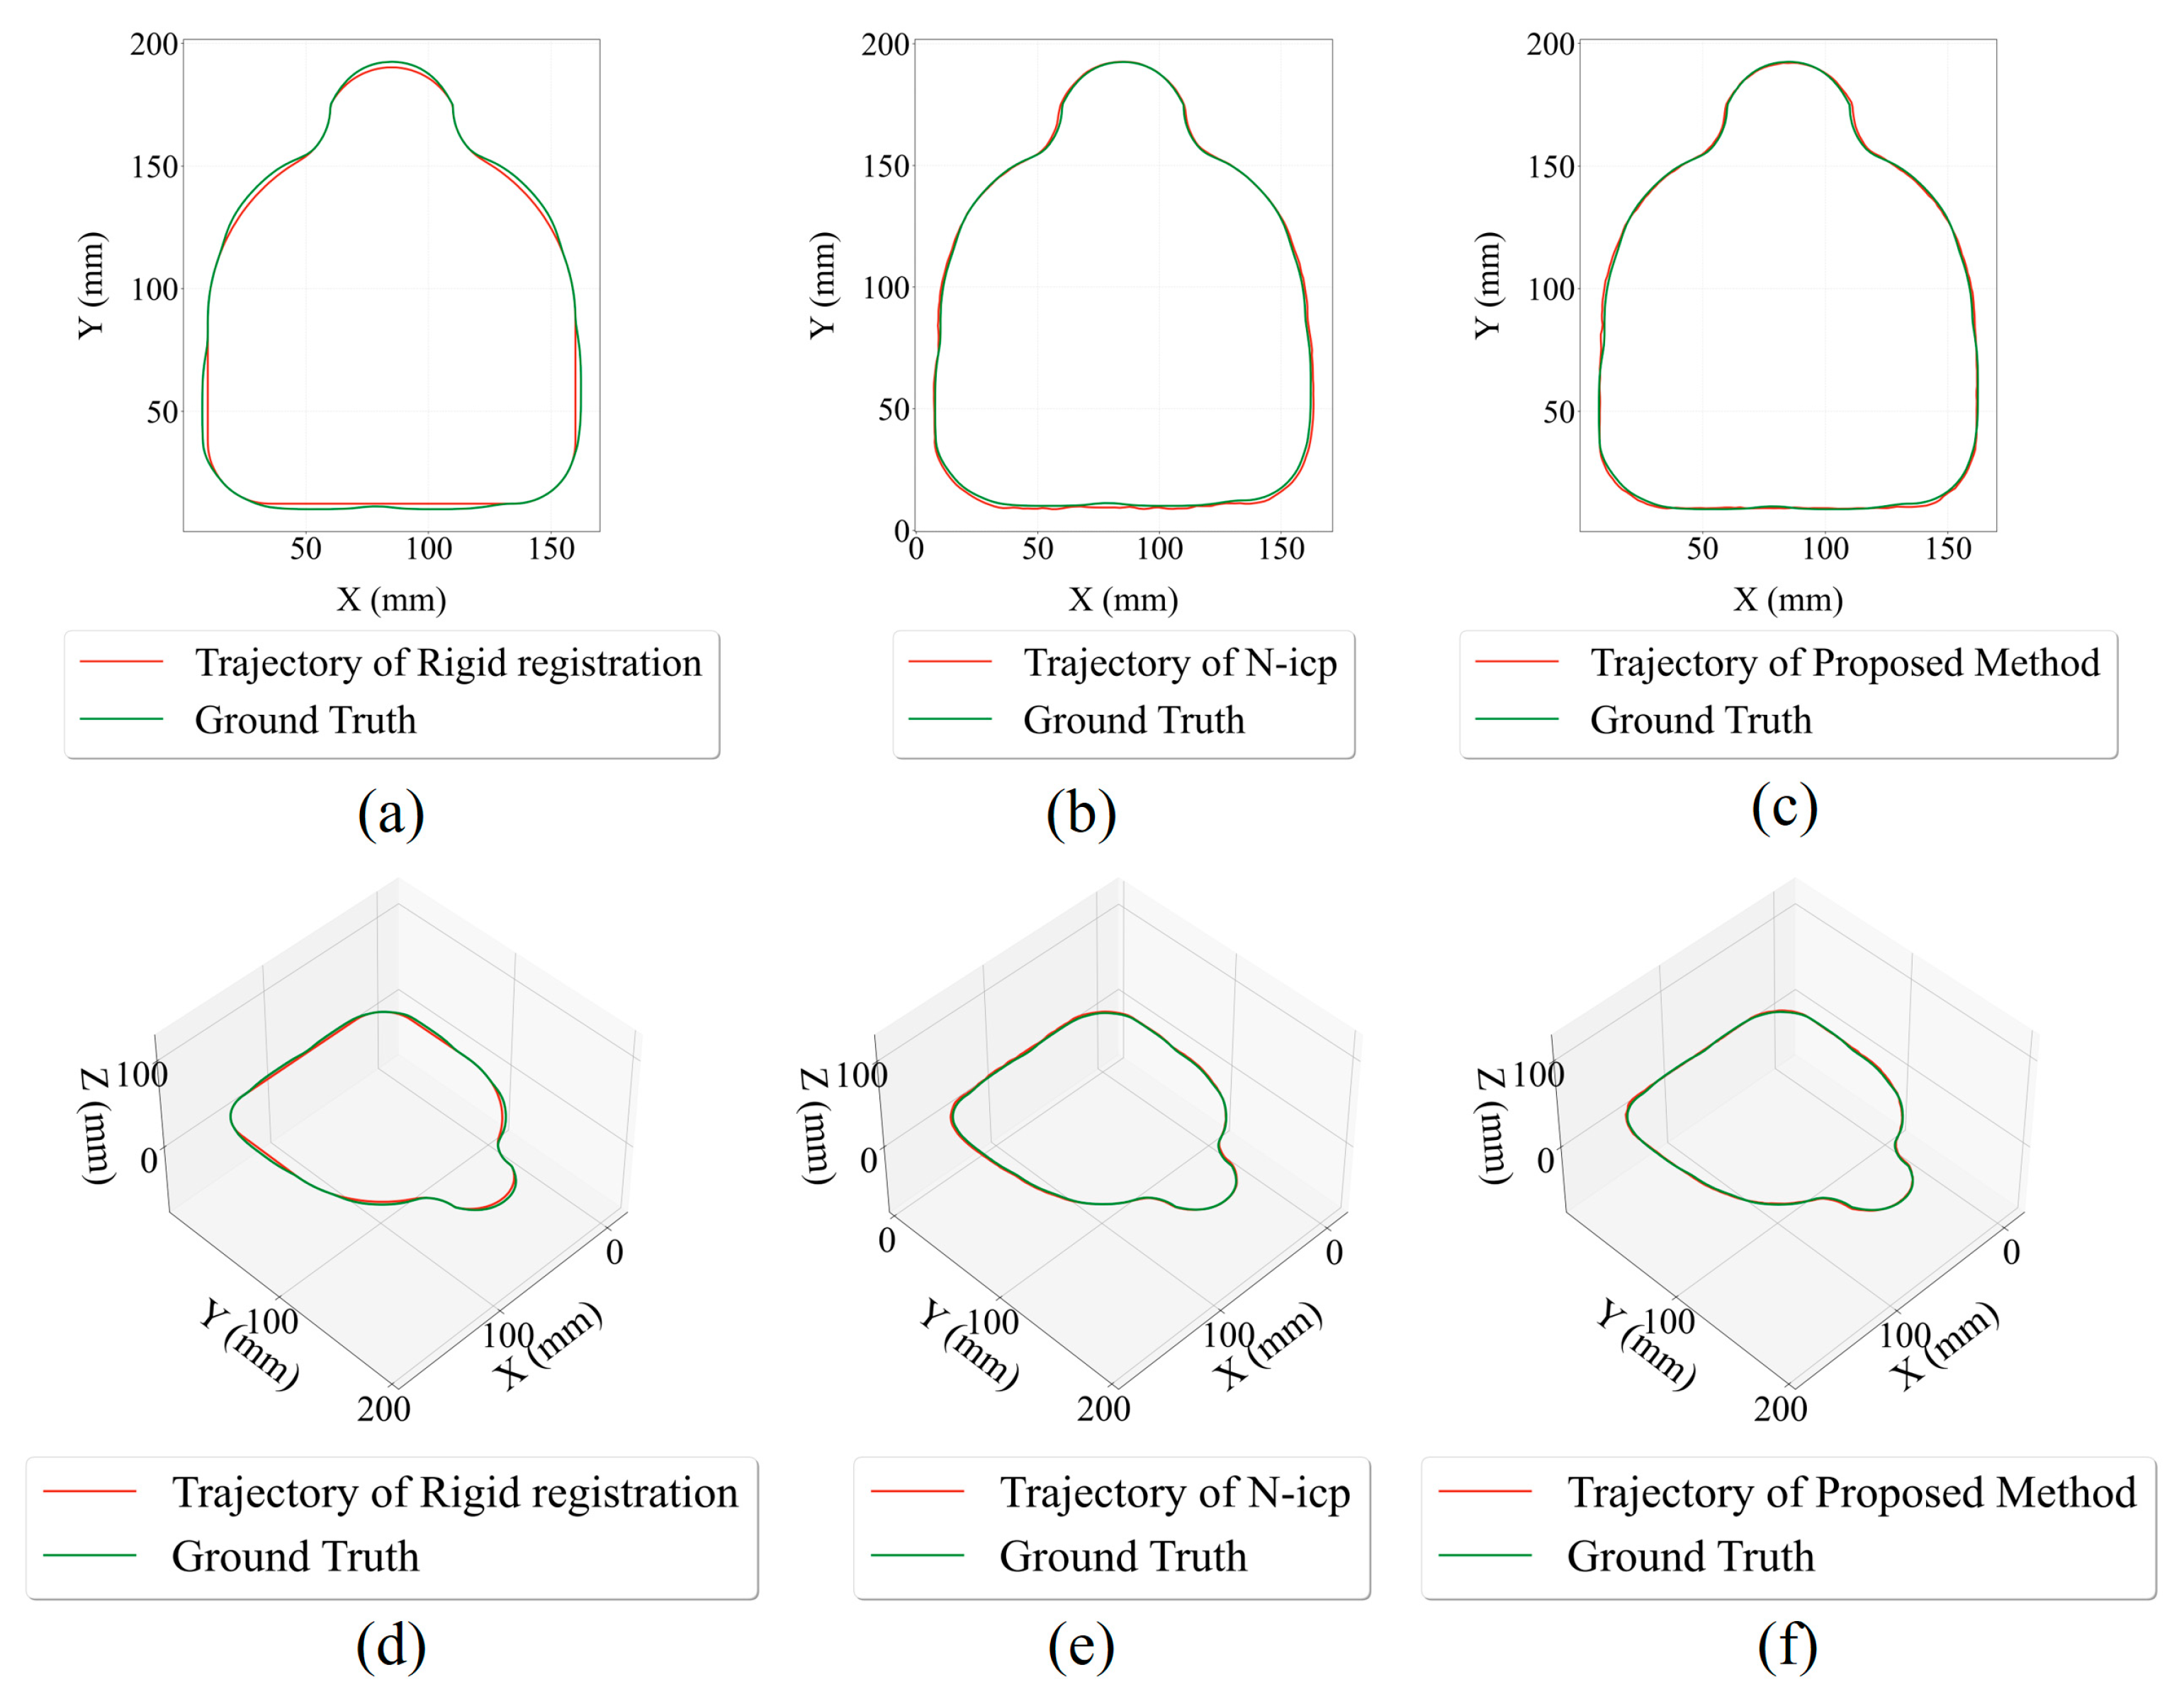
The trajectory visualization in Figure 8 demonstrates that the trajectory generated by the proposed method aligns more closely with the ground truth compared to the other two methods. The traditional rigid registration-based method fails to account for localized deformations of the workpiece, resulting in trajectories that significantly deviate from the ground truth. On the other hand, the conventional non-rigid registration-based method recognizes surface deformations; however, its generated trajectory often extends beyond the ground truth boundary. This over-adaptation issue arises from errors in the stitched scan point cloud and the method’s excessive reliance on the scan data, leading to unintended adjustments. In contrast, the proposed method effectively addresses the over-deformation problem of non-rigid registration by incorporating tolerance-based constraints, striking a balance between accuracy and adaptability.
For the two non-rigid registration methods, Figure 9 shows that the proposed method significantly improves trajectory accuracy, with a more concentrated error distribution compared to the traditional NICP method. The proposed method achieves tighter error distribution, with most errors concentrated within ±0.6 mm, while the NICP method exhibits a wider spread, with errors exceeding ±1.0 mm. This indicates better precision and reduced deviations in the proposed method. The proposed method minimizes large outliers by incorporating tolerance-constrained adjustments, avoiding over-deformation caused by excessive reliance on scan data. The frequency of large errors in the histogram is significantly lower for the proposed method.
In terms of trajectory velocity optimization, the strategy of dynamically adjusting feed rates based on burr height has demonstrated excellent results in improving processing efficiency. By analyzing burr height distribution through point cloud meshing and dynamically adjusting the feed rates, the method ensures that regions with thicker burrs are processed at slower speeds to maintain cutting stability, while regions with thinner burrs are processed at higher speeds to enhance efficiency. This targeted adjustment not only ensures consistent deburring quality but also significantly reduces unnecessary machining time. For the workpieces used in this study, the proposed method reduced the processing time by 68% compared to traditional methods that maintain a constant feed rate, regardless of burr height.
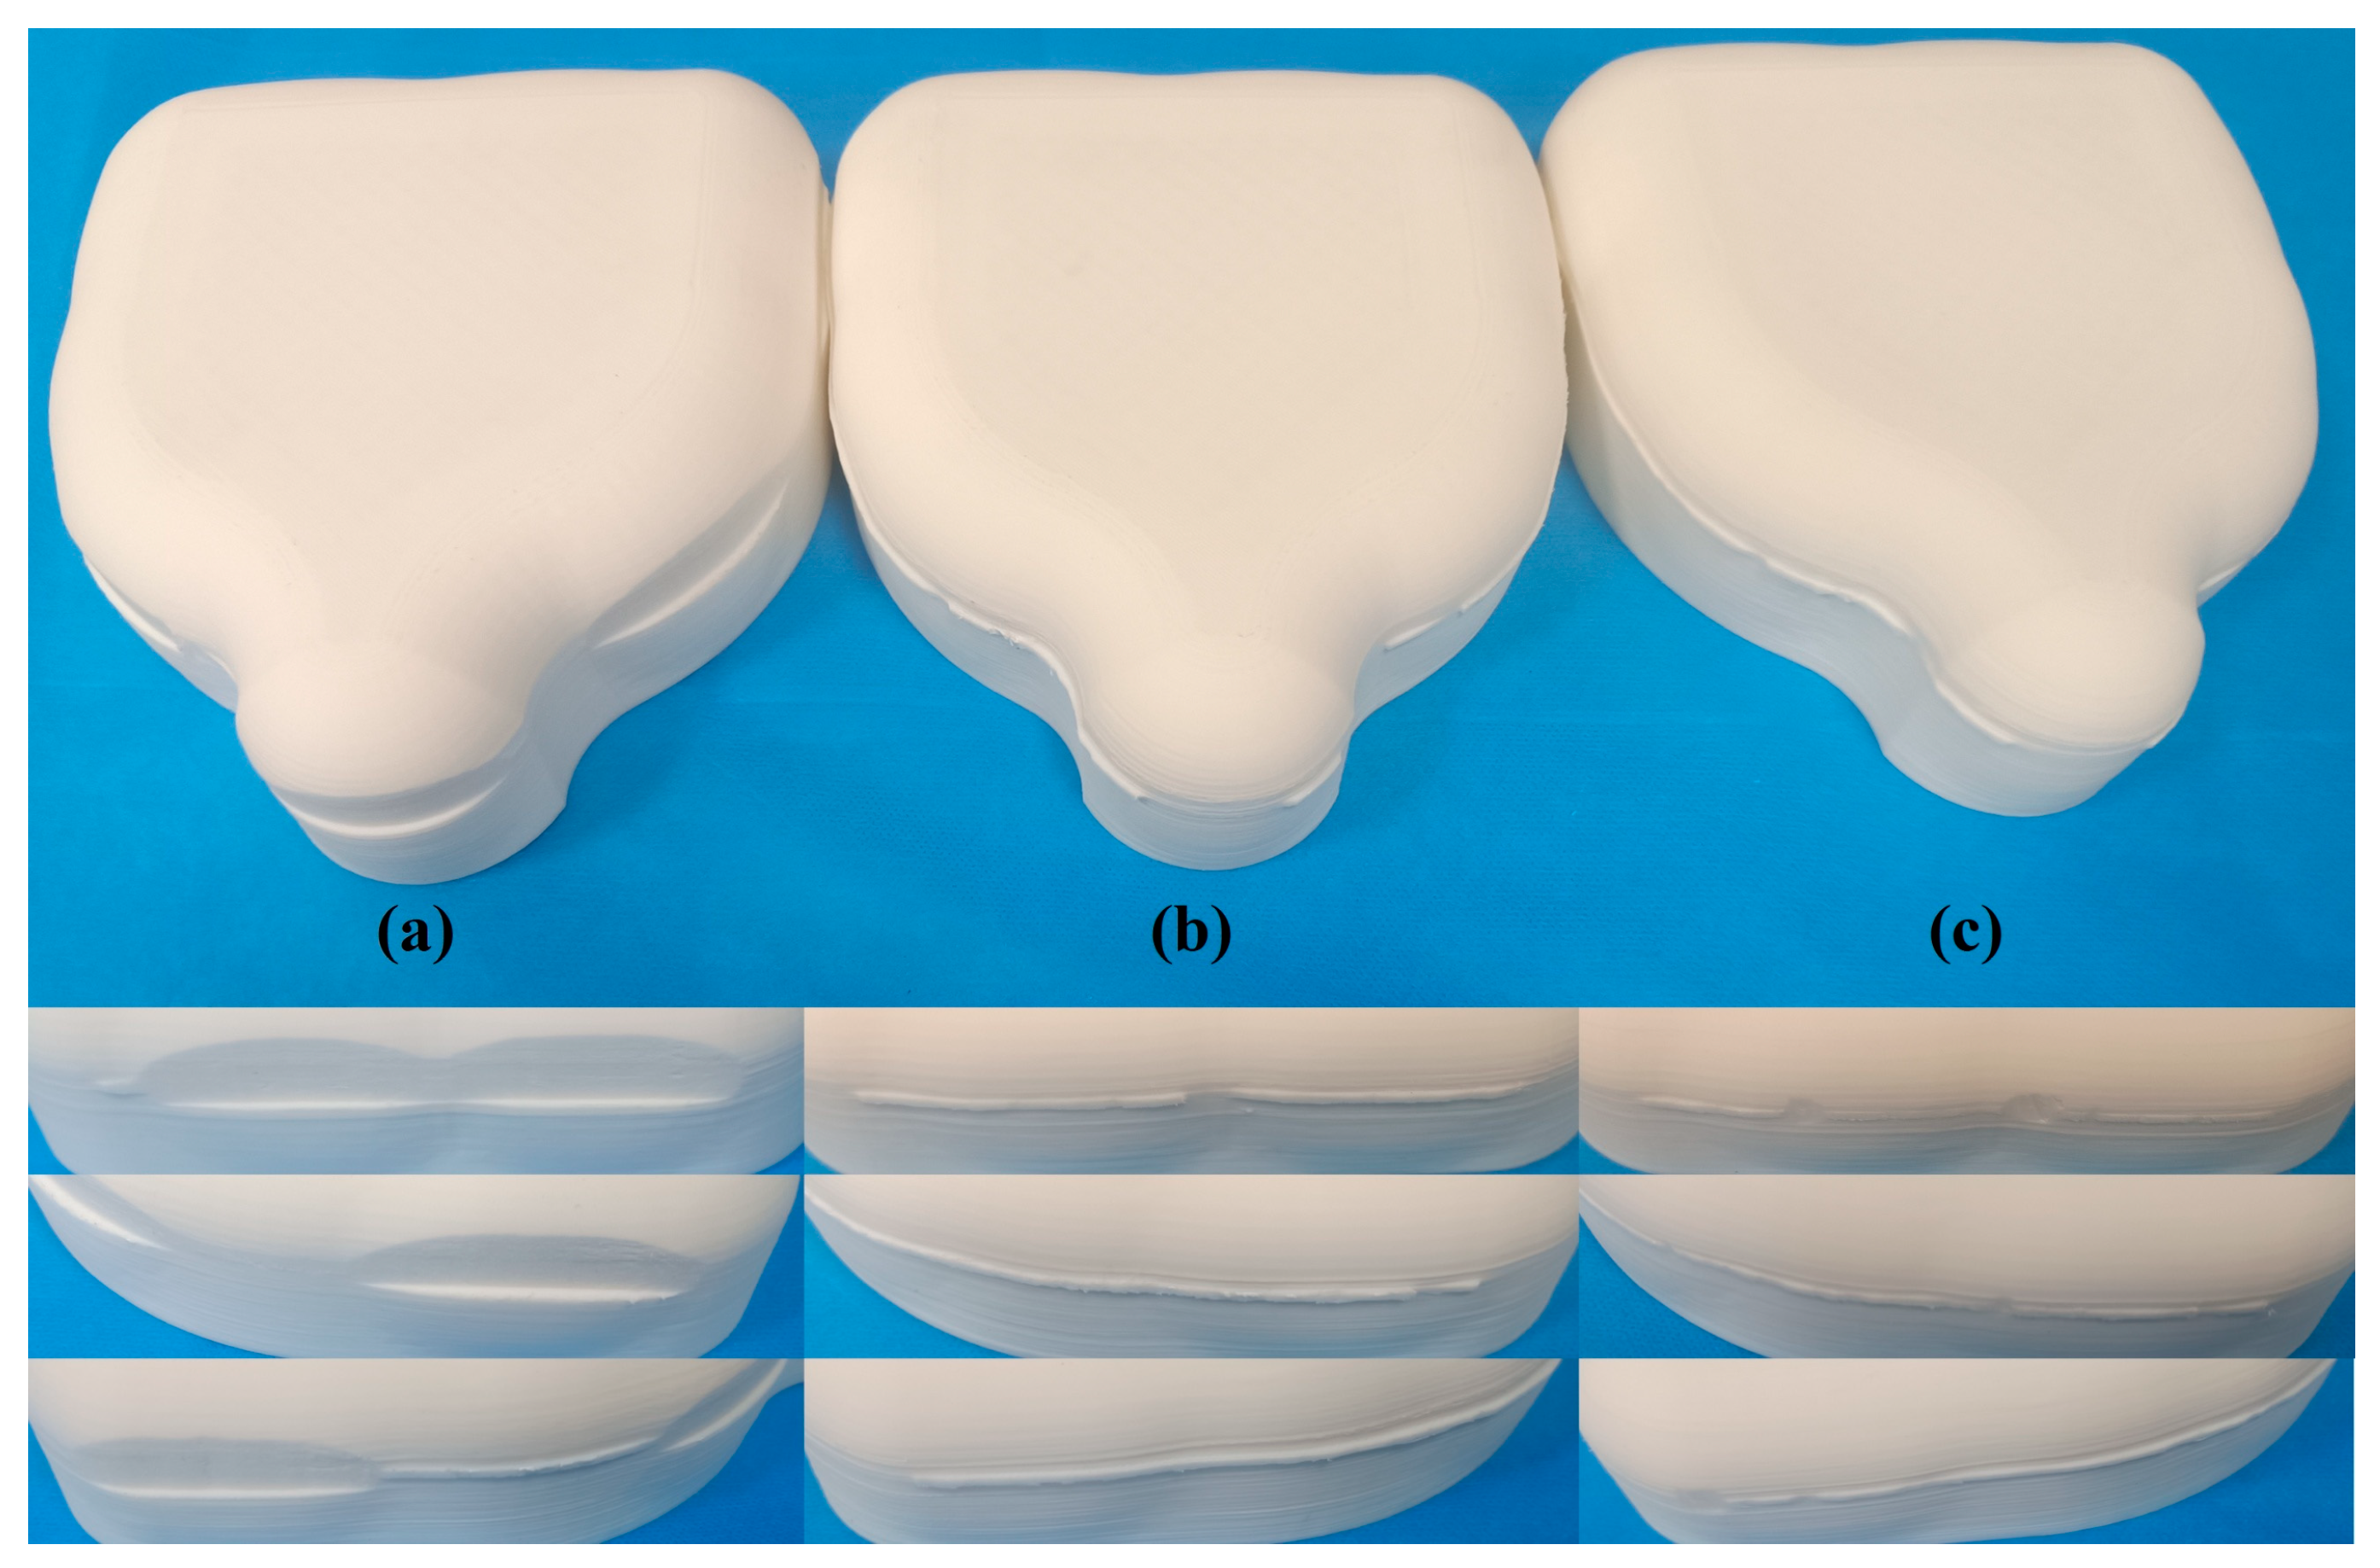
As shown in Figure 10, the deburred surface generated by the proposed method exhibits smoother and more uniform quality compared to the surfaces deburred by the other two methods. The rigid registration method, unable to account for localized deformations, results in severe over-cutting. In contrast, the conventional non-rigid registration method, while adapting to surface deformations, suffers from overcompensation issues, leading to under-cutting. The proposed method achieves an optimal balance by incorporating TC–NICP, ensuring precise burr removal without compromising surface integrity.

4. Conclusions

Through systematic development and rigorous experimental validation, this study has presented an innovative approach to automating robotic deburring of molded parts, addressing critical limitations of existing methods. The following conclusions summarize the key outcomes and contributions:
(1)
The proposed feature-based burr segmentation combined with a tolerance-constrained non-rigid registration algorithm effectively enables automatic trajectory generation under conditions involving workpiece deformation. Experimental results confirmed that this method achieves significantly higher accuracy in trajectory positioning compared to traditional rigid and non-rigid registration methods.
(2)
Dynamic trajectory speed optimization based on quantitative burr height analysis substantially enhanced deburring efficiency without compromising processing quality. By adjusting robot feed rates according to burr distribution characteristics, the proposed method demonstrated a 68% reduction in processing time compared to conventional constant-speed methods. This dynamic feed rate adjustment ensures an optimal balance between machining efficiency and surface quality.
(3)
The experimental validation revealed that the method provides a precise and efficient solution suitable for automated deburring of complex molded parts, showcasing promising potential for practical industrial applications. However, the current method’s effectiveness with more complex workpiece geometries remains to be explored further, suggesting potential research avenues for enhancing burr recognition accuracy and trajectory planning capabilities in more challenging scenarios.
Future research could expand the range of applicable materials, further refine parameter optimization techniques, and explore integration with other sensor modalities to enhance the robustness and versatility of robotic deburring systems.

Author Contributions

Conceptualization, Z.Z. and Z.S.; methodology, Z.Z. and P.L.; investigation, Z.Z. and P.L.; resources, Z.Z. and Z.S.; writing—original draft preparation, Z.Z.; writing—review and editing, Z.S. All authors have read and agreed to the published version of the manuscript.

Funding

This research received no external funding.

Institutional Review Board Statement

Not applicable.

Informed Consent Statement

Not applicable.

Data Availability Statement

All the data is provided.

Conflicts of Interest

Author Zuping Zhou was employed by the company Wolong Enapter (ZheJiang) Hydrogen Energy Technology Co., Ltd., The remaining authors declare that the research was conducted in the absence of any commercial or financial relationships that could be construed as a potential conflict of interest.

References

  1. Onstein, I.F.; Semeniuta, O.; Bjerkeng, M. Deburring Using Robot Manipulators: A Review. In Proceedings of the 2020 3rd International Symposium on Small-Scale Intelligent Manufacturing Systems (SIMS), Gjovik, Norway, 10–12 June 2020. IEEE Conference Proceedings. [Google Scholar] [CrossRef]
  2. Shin, H.; Park, E.S. Analysis of Incomplete Filling Defect for Injection-Molded Air Cleaner Cover Using Moldflow Simulation. J. Polym. 2013, 2013, 720209. [Google Scholar] [CrossRef]
  3. Sharma, S. Modeling and Optimization of Die Casting Process for ZAMAK Alloy. J. Eng. Technol. 2014, 4, 87. [Google Scholar] [CrossRef]
  4. Aurich, J.C.; Dornfeld, D.; Arrazola, P.J.; Franke, V.; Leitz, L.; Min, S. Burrs—Analysis, control and removal. CIRP Ann. 2009, 58, 519–542. [Google Scholar] [CrossRef]
  5. Huang, W.; Mei, X.; Jiang, G.; Hou, D.; Bi, Y.; Wang, Y. An on-machine tool path generation method based on hybrid and local point cloud registration for laser deburring of ceramic cores. J. Intell. Manuf. 2022, 33, 2223–2238. [Google Scholar] [CrossRef]
  6. Jin, S.Y.; Pramanik, A.; Basak, A.K.; Prakash, C.; Shankar, S.; Debnath, S. Burr formation and its treatments—A review. Int. J. Adv. Manuf. Technol. 2020, 107, 2189–2210. [Google Scholar] [CrossRef]
  7. Niknam, S.A.; Davoodi, B.; Davim, J.P.; Songmene, V. Mechanical deburring and edge-finishing processes for aluminum parts—A review. Int. J. Adv. Manuf. Technol. 2018, 95, 1101–1125. [Google Scholar] [CrossRef]
  8. Rodríguez, A.; Fernández, A.; López de Lacalle, L.N.; Sastoque Pinilla, L. Flexible abrasive tools for the deburring and finishing of holes in superalloys. J. Manuf. Mater. Process. 2018, 2, 82. [Google Scholar] [CrossRef]
  9. Falandys, K.; Kurc, K.; Burghardt, A.; Szybicki, D. Automation of the edge deburring process and analysis of the impact of selected parameters on forces and moments induced during the process. Appl. Sci. 2023, 13, 9646. [Google Scholar] [CrossRef]
  10. Liao, L.; Xi, F.F.; Liu, K. Modeling and control of automated polishing/deburring process using a dual-purpose compliant toolhead. Int. J. Mach. Tools Manuf. 2008, 48, 1454–1463. [Google Scholar] [CrossRef]
  11. Tellaeche, A.; Arana, R. Robust 3d object model reconstruction and matching for complex automated deburring operations. J. Imaging 2016, 2, 8. [Google Scholar] [CrossRef]
  12. Slavković, N.; Zivanovic, S.; Dimic, Z.; Kokotović, B. An advanced machining robot flexible programming methodology supported by verification in a virtual environment. Int. J. Comput. Integr. Manuf. 2024, 1–19. [Google Scholar] [CrossRef]
  13. Ting, C.C.; Huang, C.K.; Chiou, S.J.; Li, K.Y. The 3D Deburring Processing Trajectory Recognition Method and Its Application Base on Random Sample Consensus. Appl. Sci. 2022, 12, 4852. [Google Scholar] [CrossRef]
  14. Shen, S.; Ren, K.; Bao, Y.; Fu, M.; Li, Y. Machine vision—Based automatic planning for microdroplet coating trajectory on irregularly shaped regions of metal surfaces. J. Manuf. Process. 2023, 106, 117–129. [Google Scholar] [CrossRef]
  15. Xu, F.; Xu, Y.; Zhang, H.; Chen, S. Application of sensing technology in intelligent robotic arc welding: A review. J. Manuf. Process. 2022, 79, 854–880. [Google Scholar] [CrossRef]
  16. Nandagopal, A.; Beachy, J.; Acton, C.; Chen, X. A robotic surface inspection framework and machine—Learning based optimal segmentation for aerospace and precision manufacturing. J. Manuf. Process. 2025, 134, 146–157. [Google Scholar] [CrossRef]
  17. Wang, X.; Xie, Z.; Zhou, X.; Gao, J.; Li, F.; Gu, X. Adaptive path planning for the gantry welding robot system. J. Manuf. Process. 2022, 81, 386–395. [Google Scholar] [CrossRef]
  18. Wang, X.; Zhou, X.; Xia, Z.; Gu, X. A survey of welding robot intelligent path optimization. J. Manuf. Process. 2021, 63, 14–23. [Google Scholar] [CrossRef]
  19. Liu, J.; Liu, S.; Song, M.; Ren, H.; Ji, H. Time-Optimal Robotic Arm Trajectory Planning for Coating Machinery Based on a Dynamic Adaptive PSO Algorithm. Coatings 2024, 15, 2. [Google Scholar] [CrossRef]
  20. Liu, Z.; Guo, B.; Wu, F.; Han, T.; Zhang, L. An improved burr size prediction method based on the 1D-ResNet model and transfer learning. J. Manuf. Process. 2022, 84, 183–197. [Google Scholar] [CrossRef]
  21. Kuss, A.; Drust, M.; Verl, A. Detection of workpiece shape deviations for tool path adaptation in robotic deburring systems. Procedia CIRP 2016, 57, 545–550. [Google Scholar] [CrossRef]
  22. Peng, P.; Wu, C.; Yang, J.; Ding, H. Tool path correction for robotic deburring using local non-rigid 3D registration. Robot. Comput. Integr. Manuf. 2024, 89, 102745. [Google Scholar] [CrossRef]
  23. Xiong, R.; Lai, Z.; Guan, Y.; Yang, Y.; Cai, C. Local Deformable Template Matching in Robotic Deburring. In Proceedings of the 2018 IEEE International Conference on Robotics and Biomimetics (ROBIO), Kuala Lumpur, Malaysia, 12–15 December 2018. IEEE Conference Proceedings. [Google Scholar] [CrossRef]
  24. Lai, Z.; Xiong, R.; Wu, H.; Guan, Y. Integration of Visual Information and Robot Offline Programming System for Improving Automatic Deburring Process. In Proceedings of the 2018 IEEE International Conference on Robotics and Biomimetics (ROBIO), Kuala Lumpur, Malaysia, 12–15 December 2018. IEEE Conference Proceedings. [Google Scholar] [CrossRef]
  25. Besl, P.J.; McKay, N.D. A method for registration of 3-D shapes. IEEE Trans. Pattern Anal. Mach. Intell. 1992, 14, 239–256. [Google Scholar] [CrossRef]
  26. Rusinkiewicz, S.; Levoy, M. Efficient variants of the ICP algorithm. In Proceedings of the Third International Conference on 3-D Digital Imaging and Modeling, Quebec City, QC, Canada, 28 May–1 June 2001. IEEE Conference Proceedings. [Google Scholar] [CrossRef]
  27. Fischler, M.A.; Bolles, R.C. Random sample consensus: A paradigm for model fitting with applications to image analysis and automated cartography. Commun. ACM 1981, 24, 381–395. [Google Scholar] [CrossRef]
  28. Rusu, R.B.; Blodow, N.; Beetz, M. Fast point feature histograms (FPFH) for 3D registration. In Proceedings of the 2009 IEEE International Conference on Robotics and Automation, Kobe, Japan, 12–17 May 2009. IEEE Conference Proceedings. [Google Scholar] [CrossRef]
  29. Altintas, Y.; Engin, S. Generalized Modeling of Mechanics and Dynamics of Milling Cutters. CIRP Ann. 2001, 50, 25–30. [Google Scholar] [CrossRef]
  30. Tsai, R.Y.; Lenz, R.K. A new technique for fully autonomous and efficient 3D robotics hand/eye calibration. IEEE Trans. Robot. Autom. 1989, 5, 345–358. [Google Scholar] [CrossRef]
Figure 1. The development of deburring methods, where the red color represents the surface deformation or burr, and the green color represents the trajectory.
Jmmp 09 00294 g001
Figure 2. The operational process of the proposed method.
Jmmp 09 00294 g002
Figure 3. Non-rigid registration for point cloud under constraints, where the red points represent the template point cloud, the green points represent the target point cloud, and the blue points represent the deformed point cloud under constraints.
Jmmp 09 00294 g003
Figure 4. The analysis process consists of the following steps: (a) acquiring the original point cloud data of the workpiece, (b) projecting the burr point cloud onto the burr growth plane, (c) meshing the projected point cloud, and (d) performing layered analysis to measure burr heights.
Jmmp 09 00294 g004
Figure 5. Schematic of the robotic deburring system, where the rotary file is made of high-speed steel.
Jmmp 09 00294 g005
Figure 6. CAD data and point cloud data: (a) C A D ideal , (b) C A D defor , (c) C A D defor-burr , and (d) workpiece.
Jmmp 09 00294 g006
Figure 7. Results of burr segmentation and velocity mapping using the proposed method, where (a) illustrates the stitched point cloud of the workpiece, (b) presents the segmented burr point cloud, (c) depicts the projection of the burr point cloud onto the burr growth plane with meshing analysis, (d) represents the layer distribution of burrs, (e) displays the distribution of trajectory heights, and (f) demonstrates the velocity mapping based on burr height distribution.
Jmmp 09 00294 g007
Figure 8. Comparison of trajectories generated by different methods with ground truth. (ac) show the X–Y data of the trajectories generated by the three methods. (df) show the X–Y–Z data of the trajectories generated by the three methods.
Jmmp 09 00294 g008
Figure 9. Histogram of trajectory error distribution, where the blue dotted lines and the pink dotted lines represent the fitting results using the proposed method and N-icp registration, respectively.
Jmmp 09 00294 g009
Figure 10. Comparison of workpiece surfaces after deburring using three methods: (a) rigid registration method, (b) non-rigid registration method, and (c) proposed method.
Jmmp 09 00294 g010
Table 1. Maximum feed rate at different cutting depths.
Cutting Depth
(mm)
2.04.06.08.010.0
Max Feed Speed
(mm/s)
19.56.55.52.51.5
Table 2. Comparison of accuracy and time of three methods.
Proposed MethodRigid
Registration
Non-Rigid
Registration
Point cloud RMSE (mm)0.492.080.06
Trajectory RMSE (mm)0.791.551.05
deburring time (s)169.4525.5527.7
Disclaimer/Publisher’s Note: The statements, opinions and data contained in all publications are solely those of the individual author(s) and contributor(s) and not of MDPI and/or the editor(s). MDPI and/or the editor(s) disclaim responsibility for any injury to people or property resulting from any ideas, methods, instructions or products referred to in the content.