Article

Direct Ink Writing and Characterization of ZrC-Based Ceramic Pellets for Potential Nuclear Applications

by
Narges Malmir
1,
Guang Yang
2,
Thomas Poirier
3,
Nathaniel Cavanaugh
4,
Dong Zhao
4,
Brian Taylor
5,
Nikhil Churi
6,
Tiankai Yao
7,
Jie Lian
4,
James H. Edgar
3,
Dong Lin
8,* and
Shuting Lei
1,*
1
Department of Industrial and Manufacturing System Engineering, Kansas State University, Manhattan, KS 66506, USA
2
Manufacturing and Materials Research Laboratories, Purdue University, West Lafayette, IN 47906, USA
3
Tim Taylor Department of Chemical Engineering, Kansas State University, Manhattan, KS 66506, USA
4
Department of Mechanical, Aerospace & Nuclear Engineering, Rensselaer Polytechnic Institute, Troy, NY 12180, USA
5
NASA Marshall Space Flight Center, Advanced propulsion Systems, Huntsville, AL 35808, USA
6
Woodbury School of Business, Utah Valley University, Orem, UT 84058, USA
7
Idaho National Laboratory, Idaho Falls, ID 83415, USA
8
School of Mechanical, Industrial, and Manufacturing Engineering, Oregon State University, Corvallis, OR 97331, USA
*
Authors to whom correspondence should be addressed.
J. Manuf. Mater. Process. 2025, 9(8), 270; https://doi.org/10.3390/jmmp9080270
Submission received: 11 July 2025 / Revised: 6 August 2025 / Accepted: 7 August 2025 / Published: 11 August 2025

Abstract

Developing advanced nuclear fuel technologies is critical for high-performance applications such as nuclear thermal propulsion (NTP). This study explores the feasibility of direct ink writing (DIW) for fabricating ceramic pellets for potential nuclear applications. Zirconium carbide (ZrC) is used as a matrix material and vanadium carbide (VC) is used as a surrogate for uranium carbide (UC) in this study. A series of ink formulations were developed with varying concentrations of VC and nanocrystalline cellulose (NCC) to optimize the rheological properties for DIW processing. Post-sintering analysis revealed that conventionally sintered samples at 1750 °C exhibited high porosity (>60%), significantly reducing the compressive strength compared to dense ZrC ceramics. However, increasing VC content improved densification and mechanical properties, albeit at the cost of increased shrinkage and ink flow challenges. Spark plasma sintering (SPS) achieved near-theoretical density (~97%) but introduced geometric distortions and microcracking. Despite these challenges, this study demonstrates that DIW offers a viable route for fabricating ZrC-based ceramic structures, provided that sintering strategies and ink rheology are further optimized. These findings establish a baseline for DIW of ZrC-based materials and offer valuable insights into the porosity control, mechanical stability, and processing limitations of DIW for future nuclear fuel applications.

1. Introduction

Humanity has always been fascinated by space exploration, continually seeking methods to reduce the preparation time and cost while enhancing vehicle performance for missions to various interplanetary destinations. A critical technology in this endeavor is the nuclear thermal propulsion (NTP) system. It is comprised of tie tubes and fuel elements that form the reactor core [1], with the stability of high-temperature nuclear fuel being a significant factor.
Nuclear fuel pellets, primarily composed of uranium dioxide, serve as the fuel for nuclear reactions. Historically, they were produced using the dry process (powder metallurgy) and the sol-gel process. The dry process, initially developed by Siemens, involves hydrolyzing UF6 with steam, followed by reducing UO2F2 in a fluidized bed reactor with hydrogen and steam to produce UO2. The resulting powder is then calcined in a rotary kiln to remove residual fluoride and dry it. After converting UF6 gas into UO2 powder, pellet fabrication involves mixing UO2 with binders and lubricants, compacting it, sintering the pellets, and finishing with precision grinding [2].
The sol-gel process typically starts with uranyl nitrate or uranyl acetate as the uranium source, combined with a gelling agent like HMTA or urea. The sol undergoes controlled gelation through pH changes or temperature-induced precipitation, followed by aging, washing, and drying. Calcination in a reducing atmosphere (H2/Ar or CO/CO2) converts the gel into UO2 powder, which can be further processed into pellets or microspheres. This method ensures high purity, uniformity, and the ability to incorporate dopants while minimizing radioactive dust, making it ideal for advanced nuclear fuel fabrication [3,4]. While these traditional fabrication methods for fission energy are well understood and produce highly repeatable fuel performance, they limit the possibilities for incorporating tailored microstructures or other enhancements [5,6].
In pursuit of improved nuclear fuels, uranium carbide (UC) has been explored as an alternative to UO2 due to its higher temperature tolerance and radiation resistance, making it an ideal candidate for advanced reactor designs and long-duration space missions [7,8,9]. Despite these advantages, UC fabrication is more challenging than UO2 due to its reactivity with oxygen and moisture, necessitating stringent handling conditions [10]. Additionally, UC requires higher sintering temperatures to achieve full densification, leading to increased processing complexity and cost. The formation of secondary phases, such as uranium oxycarbides (UCO), further complicates UC processing, impacting its final microstructure and performance [11,12]. Taylor et al. [13] demonstrated the feasibility of using zirconium carbide (ZrC) in combination with other carbides, such as vanadium carbide (VC) and niobium carbide (NbC), to develop surrogate fuel materials for fabrication experiments. Zirconium carbide (ZrC) possesses a high melting temperature (~3520 °C), excellent hardness, low neutron absorption cross section, and good thermal conductivity, which makes it an ideal ceramic for ultra-high-temperature applications such as nuclear fuel. VC was used in Taylor et al.’s study as a UC surrogate because it forms a similar crystal structure as UC [13]. In addition, VC can be considered as a finer microstructure and act as a grain growth inhibitor by segregating at grain boundaries, restricting excessive coarsening [14,15]. Hence, ZrC and VC are used in the present study as the subject materials for the direct ink writing (DIW) of potential nuclear fuel pellets. The chosen VC quantities used in the experiments are determined based on our preliminary testing results, which demonstrate the effects of VC on the quality of the printed samples.
Fabricating NTP fuel pellets presents significant challenges when using conventional methods like powder pressing, sintering, and grinding. Powder metallurgy methods struggle to produce uniform porosity and precise internal structures, while high-temperature sintering can lead to undesirable grain growth and phase segregation. Furthermore, grinding is time consuming and often limited to simple geometries [16].
To overcome these limitations, additive manufacturing, particularly direct ink writing (DIW), has emerged as a promising technology for fabricating ceramic nuclear fuel pellets [17]. DIW is a versatile additive manufacturing technique that extrudes a ceramic-based ink through a nozzle to build structures layer by layer, enabling the creation of complex shapes that would be difficult to achieve through traditional manufacturing methods. Moreover, DIW allows for the incorporation of optimized microstructures such as uniform porosity, precise phase distribution, and tailored grain structure that enhance the thermal and mechanical properties of the pellets [18]. The layer-by-layer construction also minimizes material waste, making the process more sustainable.
Previous studies have explored additive manufacturing for nuclear fuel fabrication, demonstrating its potential to achieve high density and controlled microstructures. For instance, thorium dioxide was 3D printed and sintered to achieve approximately 90% of its theoretical density, without introducing impurities from the resin used in the stereolithography process [19]. However, Bergeron and Crigger encountered cracking in the corners of the structure after heating [19]. Schappel et al. [20] tested UN TRISO fuel particles at different energy levels within a silicon carbide (SiC) matrix, fabricated via a binder-jetting process, to assess whether the TRISO particles would fail (break apart) or if the SiC matrix would crack. To date, the application of additive manufacturing to nuclear fuel fabrication is still an emerging field. There have been no prior reports on using DIW to print ZrC and VC at the time of this paper’s preparation.
This study explores the feasibility of fabricating ZrC-based ceramic pellets using DIW with subsequent sintering to achieve high density. The effects of NCC and VC on the geometry, microstructure, and mechanical properties of the printed samples are investigated. NCC is a binder that controls the viscosity of the ink, and adding VC enhances the quality and structural integrity of the printed samples. Conventional sintering is performed using a high temperature furnace to consolidate the printed samples while preserving their geometric features. Moreover, because conventional sintering is time consuming and may face difficulty in achieving full densification, a more advanced sintering technique, spark plasma sintering (SPS), is attempted to demonstrate its capability of rapid densification at lower temperatures and shorter dwell times. The experimental procedure is described in Section 2, followed by results and discussion in Section 3. Conclusions are summarized in Section 4.

2. Experimental Procedure

2.1. Ink Preparation

As illustrated in Figure 1a, the ink is prepared by blending ZrC/VC powder in water, with 1 wt% Darvan C-N (Vanderbilt Minerals, Norwalk, CT, USA) as a dispersing agent. Nanocrystalline cellulose (NCC) was added as a binder and thickener, allowing precise control of the ink’s viscosity to ensure its suitability for printing. These cellulose nanocrystals are produced from natural resources and possess remarkable properties, including a high strength-to-weight ratio, due to their low density. Zirconium carbide powders (d50, 3−5 µm, Stanford Advanced Materials, Lake Forest, CA, USA) and vanadium carbide powders (average particle size ≤ 2 µm, Sigma-Aldrich, Saint Louis, MO, USA) were mixed with deionized water to achieve a total specified solid concentration. The blend was homogenized for 24 h using magnetic stirring at 350 rpm. Following this, NCC (CelluForce, Montreal, QC, Canada) was added to adjust the ink’s viscosity. The ink was stirred both magnetically at 350 rpm and mechanically at 800 rpm until the slurry was uniform.

2.2. Experimental Design

To examine the impact of NCC and VC as additives in the ZrC ink on the quality of the printed parts, a full factorial experimental design was employed, involving two factors (NCC and VC) with each at three levels, resulting in nine experimental conditions. These are detailed in Table 1. ZrC was adjusted based on VC concentration so that the total ceramic powder concentration remains about the same for all the inks. DC-N as fixed at 1 wt%. The water content varied slightly among groups with the same concentration of NCC within each group because the printed structures included small through holes, requiring inks with appropriate viscosity to accurately print these features.

2.3. Rheological Characterization of the ZrC Ink

2.3.1. Amplitude Sweep Test

The viscoelastic properties of the solutions were determined through amplitude sweep tests. In this test, a sweep of increasing shear amplitudes is applied at a constant frequency, which simultaneously implies an increasing shear rate. This fundamental rheological measurement determines the linear viscoelastic region (LVER) of a material and its yield stress.
The LVER is identified as the range of strain amplitudes where the storage modulus (G′) and loss modulus (G″) remain relatively constant. The storage and loss moduli represent the elastic (solid-like and liquid-like) behaviors of the material, respectively. At a higher stress, the material exhibits nonlinear behavior, and the yield point is identified to show the transition from predominantly elastic to predominantly viscous response. Understanding these properties is crucial for predicting the material’s performance in practical applications. The material’s response in terms of the storage modulus (G′) and loss modulus (G″) was recorded with a rotational rheometer (Anton-Paar MCR 92) using a 25 mm parallel plate with a gap of 500 µm. Both plates were sandblasted to avoid slipping. These properties were measured during an amplitude sweep test at a frequency of 1 Hz, with the temperature stabilized at 25 °C.

2.3.2. Three Interval Thixotropy Test

A critical method for evaluating whether an ink filament retains its shape after extrusion onto a surface is the three-interval thixotropy test (3ITT). This test assesses the material’s ability to quickly recover its structure and elasticity, which is essential for maintaining the filament’s integrity and preventing continuous flow after extrusion. The 3ITT involves three distinct phases. First, the material is subjected to a low shear rate (the rest phase) to establish a baseline viscosity and allow the structure to stabilize. Second, the shear rate is increased, causing the material to undergo shear thinning and break down its internal structure. This phase simulates the high shear conditions experienced during extrusion. Finally, in the recovery phase, the shear rate is returned to the initial low value, allowing the material to recover and rebuild its structure. During these intervals, the rheometer records the viscosity changes, providing a detailed profile of the material’s thixotropic behavior and its suitability for filament extrusion. This data is crucial for understanding how quickly the material can restore its elastic behavior, which helps avoid continuous flow and maintain its shape post-extrusion.

2.4. 3D Printing and Image Analysis

NTP fuel elements are typically hexagonal prisms containing multiple longitudinal coolant channels (rods) inside. This design maximizes fuel density, ensures even neutron flux distribution, and optimizes hydrogen coolant flow for efficient heat transfer and propulsion. The ceramic pellets designed for this study are small cylinders, 10 mm in diameter, each containing seven internal holes of 1.8 mm in diameter. DIW printing was done by loading the ink into a plunger and dispersing it under air pressure. The movement of the dispenser along the programmed X, Y, and Z axes was controlled by Cura software (version 4.20.14-mb). The flow rate was manually adjusted to ensure adequate material flow through the nozzle. The nozzle diameter for printing was 0.4 mm. A larger nozzle is incapable of printing a structure with seven small holes while using a smaller nozzle diameter for high-viscosity ink is impractical due to agglomeration issues at the nozzle tip. The recommended layer height in 3D printing ranges between 15 and 75% of the nozzle diameter, with the optimum layer height generally around the middle of this range. The best value for a line width is between 120 and 200% of the nozzle diameter. Additionally, to prevent cracks in the structure and to ensure a strong build, the infill direction parameter in the software was set to 90°. Another critical parameter was the hole horizontal expansion setting, which was selected to mitigate the shrinkage that occurs during drying.
A major challenge in this design was the noticeable reduction in the diameter of small circular holes as the printed height increased. Post-drying measurements showed that the hole diameters had decreased to approximately 1.3–1.4 mm. To address this issue, an optimal horizontal expansion of 0.15 mm was identified through process optimization and applied in the design stage. This adjustment effectively increased the printed hole diameter by about 0.3 mm, reaching approximately 1.9 mm before drying. After drying, the final hole diameter stabilized around 1.7–1.8 mm. This modification successfully compensated for the dimensional shrinkage and ensured consistent circular hole geometry throughout the printed structure. Table 2 summarizes the parameters used in this stage of the study.
After printing, the samples were dried for 12 h at room temperature. Prior to this drying stage, photographs of the specimens were taken, and the sample diameter, sample height, and the hole diameter were measured using ImageJ software (version 1.8.0_345). This provided a method to compare measurements before and after drying.
After drying, all samples were examined for shrinkage. The sample dimensions were measured using a caliper. The percentage shrinkage was calculated from the difference between the initial and final measurements and by dividing the difference by the initial value.

2.5. Sintering Process

The raw samples exhibited insufficient strength and were fragile. To enhance these characteristics, the samples were sintered in a furnace (Webb Red Devil Furnace model RDG-199 with graphite insulation). First, the system is evacuated of air to 5 × 10⁻² torr then backfilled to 862 torr with industrial grade argon (>99.9%). Once filled, the system is taken down to 5 × 10⁻⁵ torr to further purify the gas environment. Then the system is filled once more with the same argon to be purged to 5 × 10⁻³ torr. Finally, the system is brought to 862 torr with a flow of 500 sccm of argon while the temperature control is initiated. The furnace was gradually heated to 1450 °C at a rate of 10 °C per minute, monitored by a type C thermocouple, and then further increased to 1750 °C at 5 °C per minute under the pyrometer control. The nine distinct samples, printed using the nine different inks from the same batch, were placed in the center of the furnace chamber at 1750 °C for 2 h before being cooled to room temperature over a period of 6 h, thus completing the sintering process.

2.6. Microstructural Characterization and Materials Testing

The microstructure of the sintered samples was examined using a Hitachi scanning electron microscope (SEM). The samples were placed on SEM stubs using conductive double sided adhesive tape to ensure stability and obtain high-resolution images. The SEM was operated at an accelerating voltage of 20 kV.
The mechanical properties of the printed samples, including elastic modulus and compressive strength were compressively tested. The compressive tests were conducted using a compact tabletop universal tester (Shimadzu, Kyoto, Japan). The samples were polished with P120 sandpaper (ISO 6344-2:2021; Coated abrasives- Determination and designation of grain size distribution: Macrogrit sizes P120. International organization for standardization: Geneva, Switzerland, 2021.), secured in a specialized holder, and compressed at a rate of 1 mm/min until failure.

3. Results and Discussion

3.1. Ink Rheological Properties

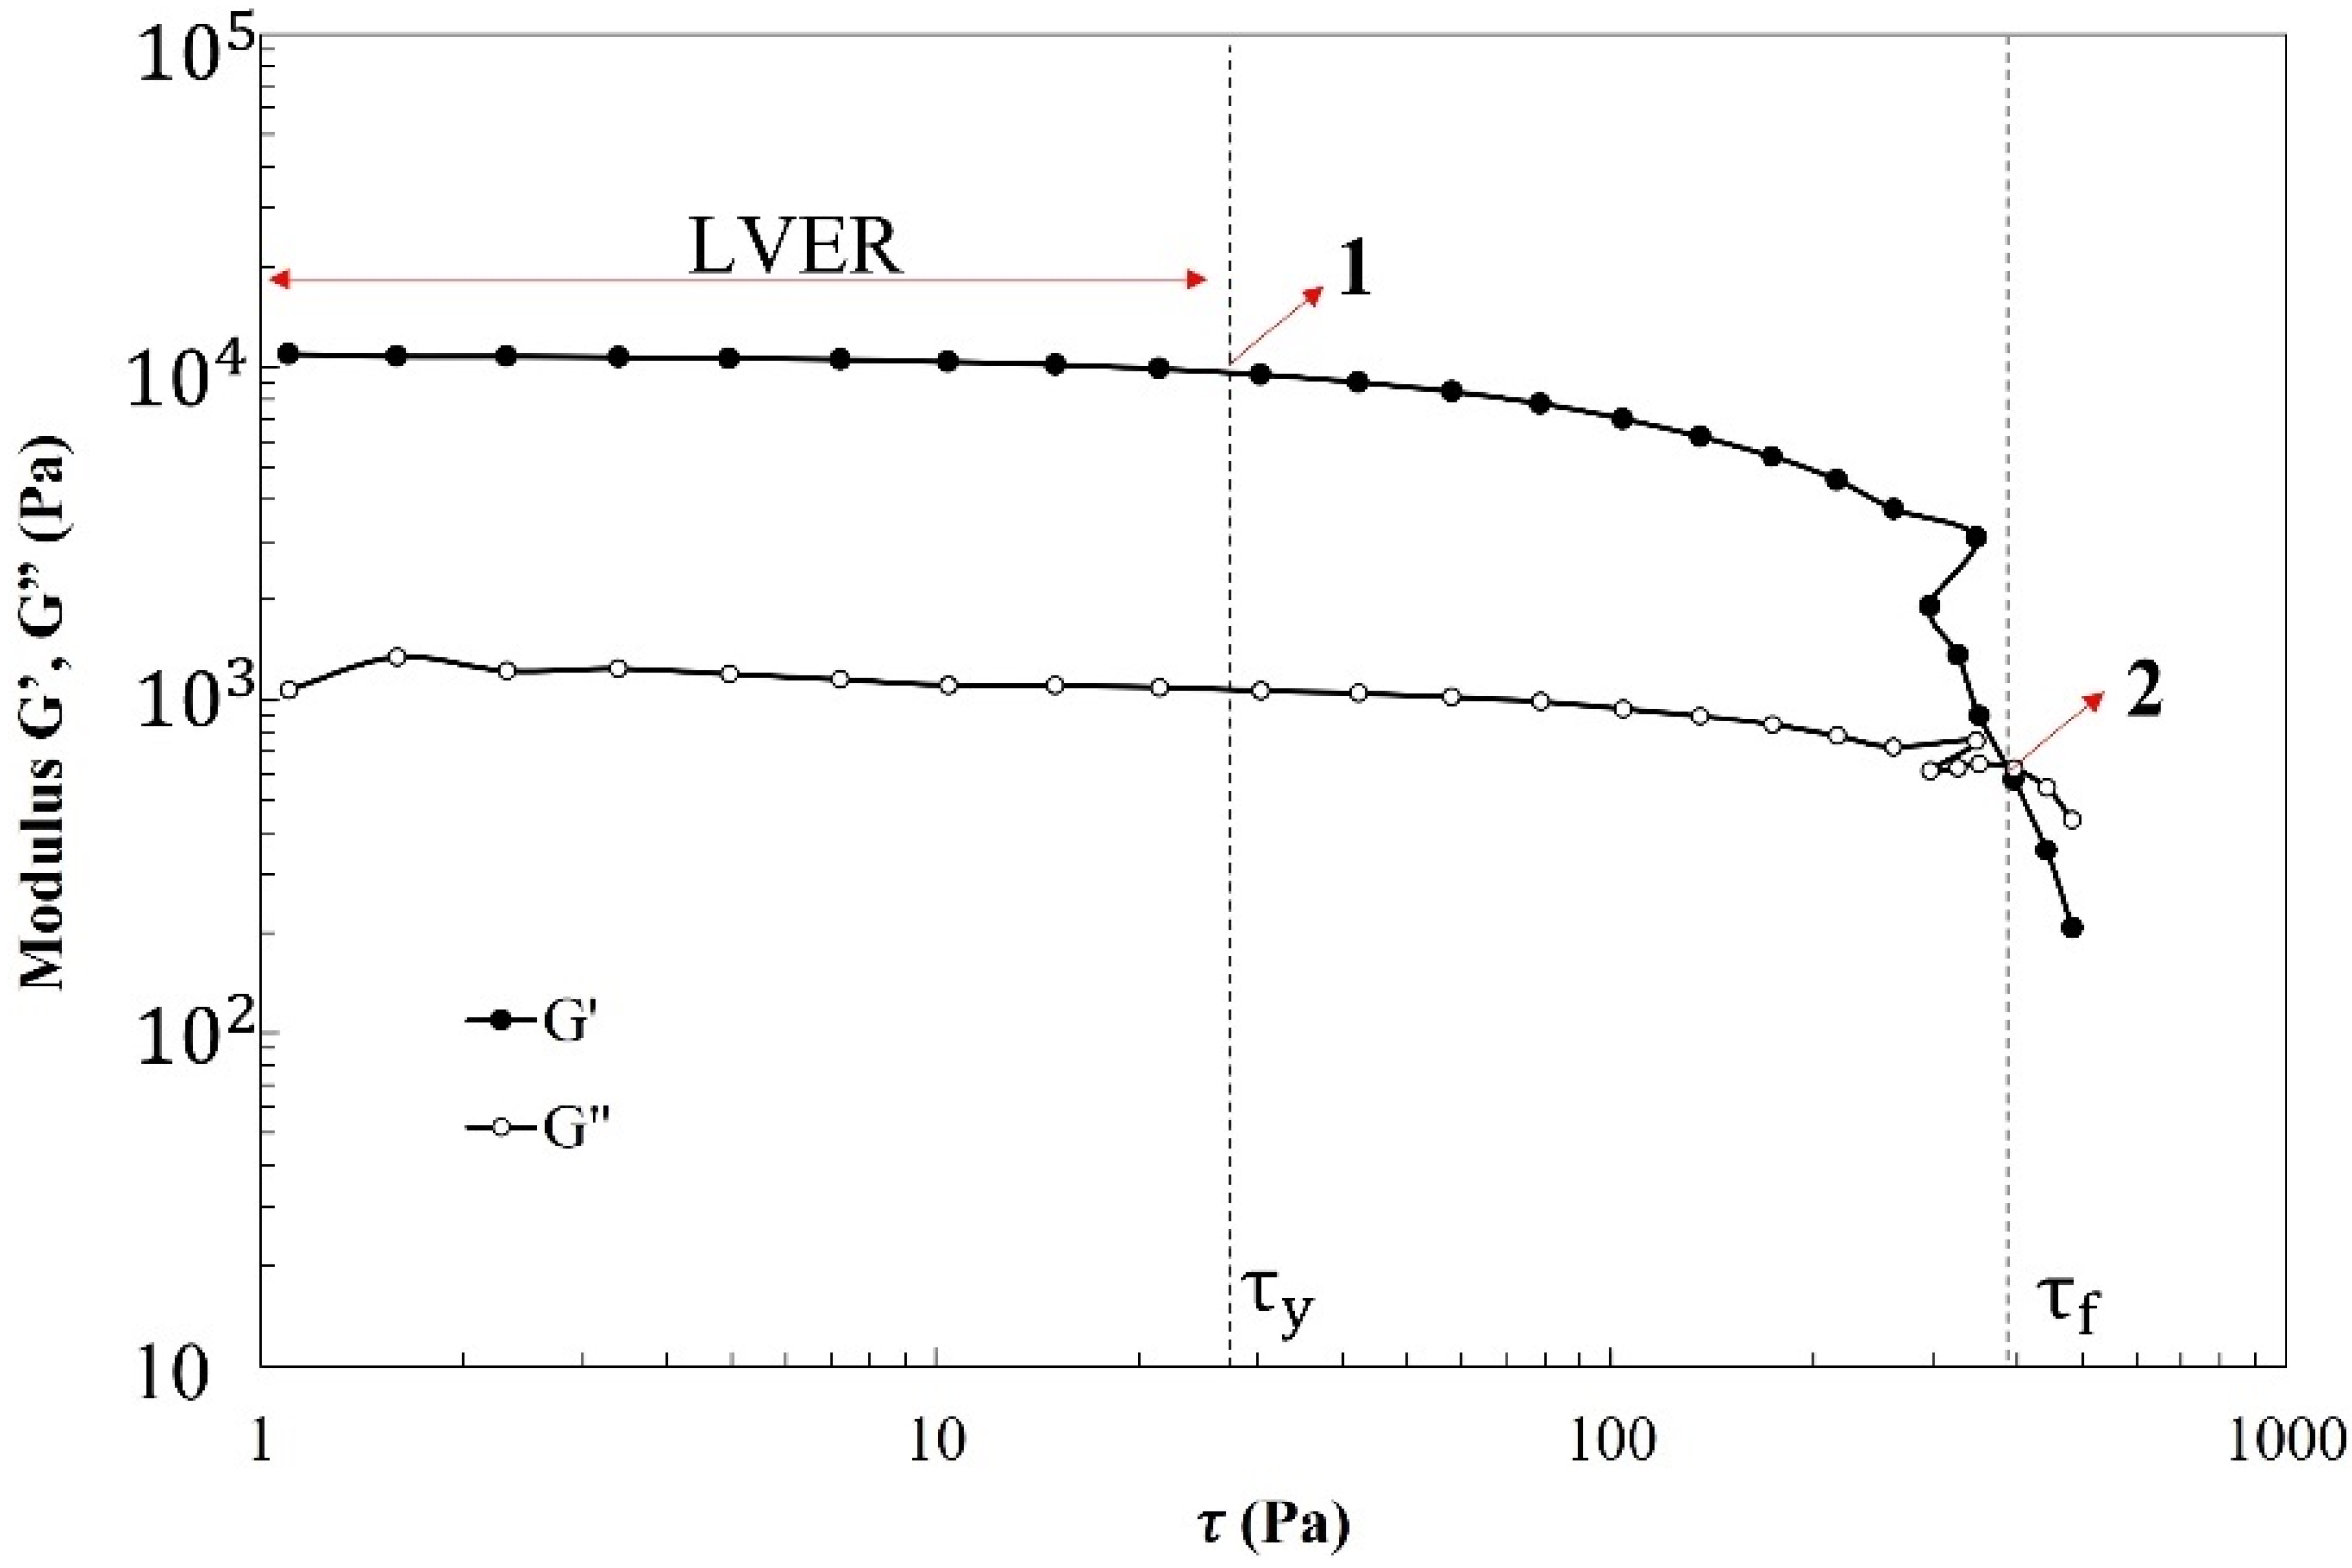
A typical oscillatory amplitude assessment for Ink 1 is illustrated in Figure 2, where the first zone is the linear viscoelastic region (LVER), and the endpoint of the LVER is known as the yield point (point 1, τy = 28 Pa), marking the transition from elastic to plastic behavior. At this point, the internal structure begins to break down, leading to deformation. The second zone lies between the yield point and the intersection of G′ and G″, known as the flow point (point 2, τf = 400 Pa). Until this point, G′ is still larger than G″. Beyond the flow point, into the third zone, the ink exhibits liquid-like behavior, with a rapid drop of both moduli, and the loss modulus (G″) becomes larger than the storage modulus (G′).
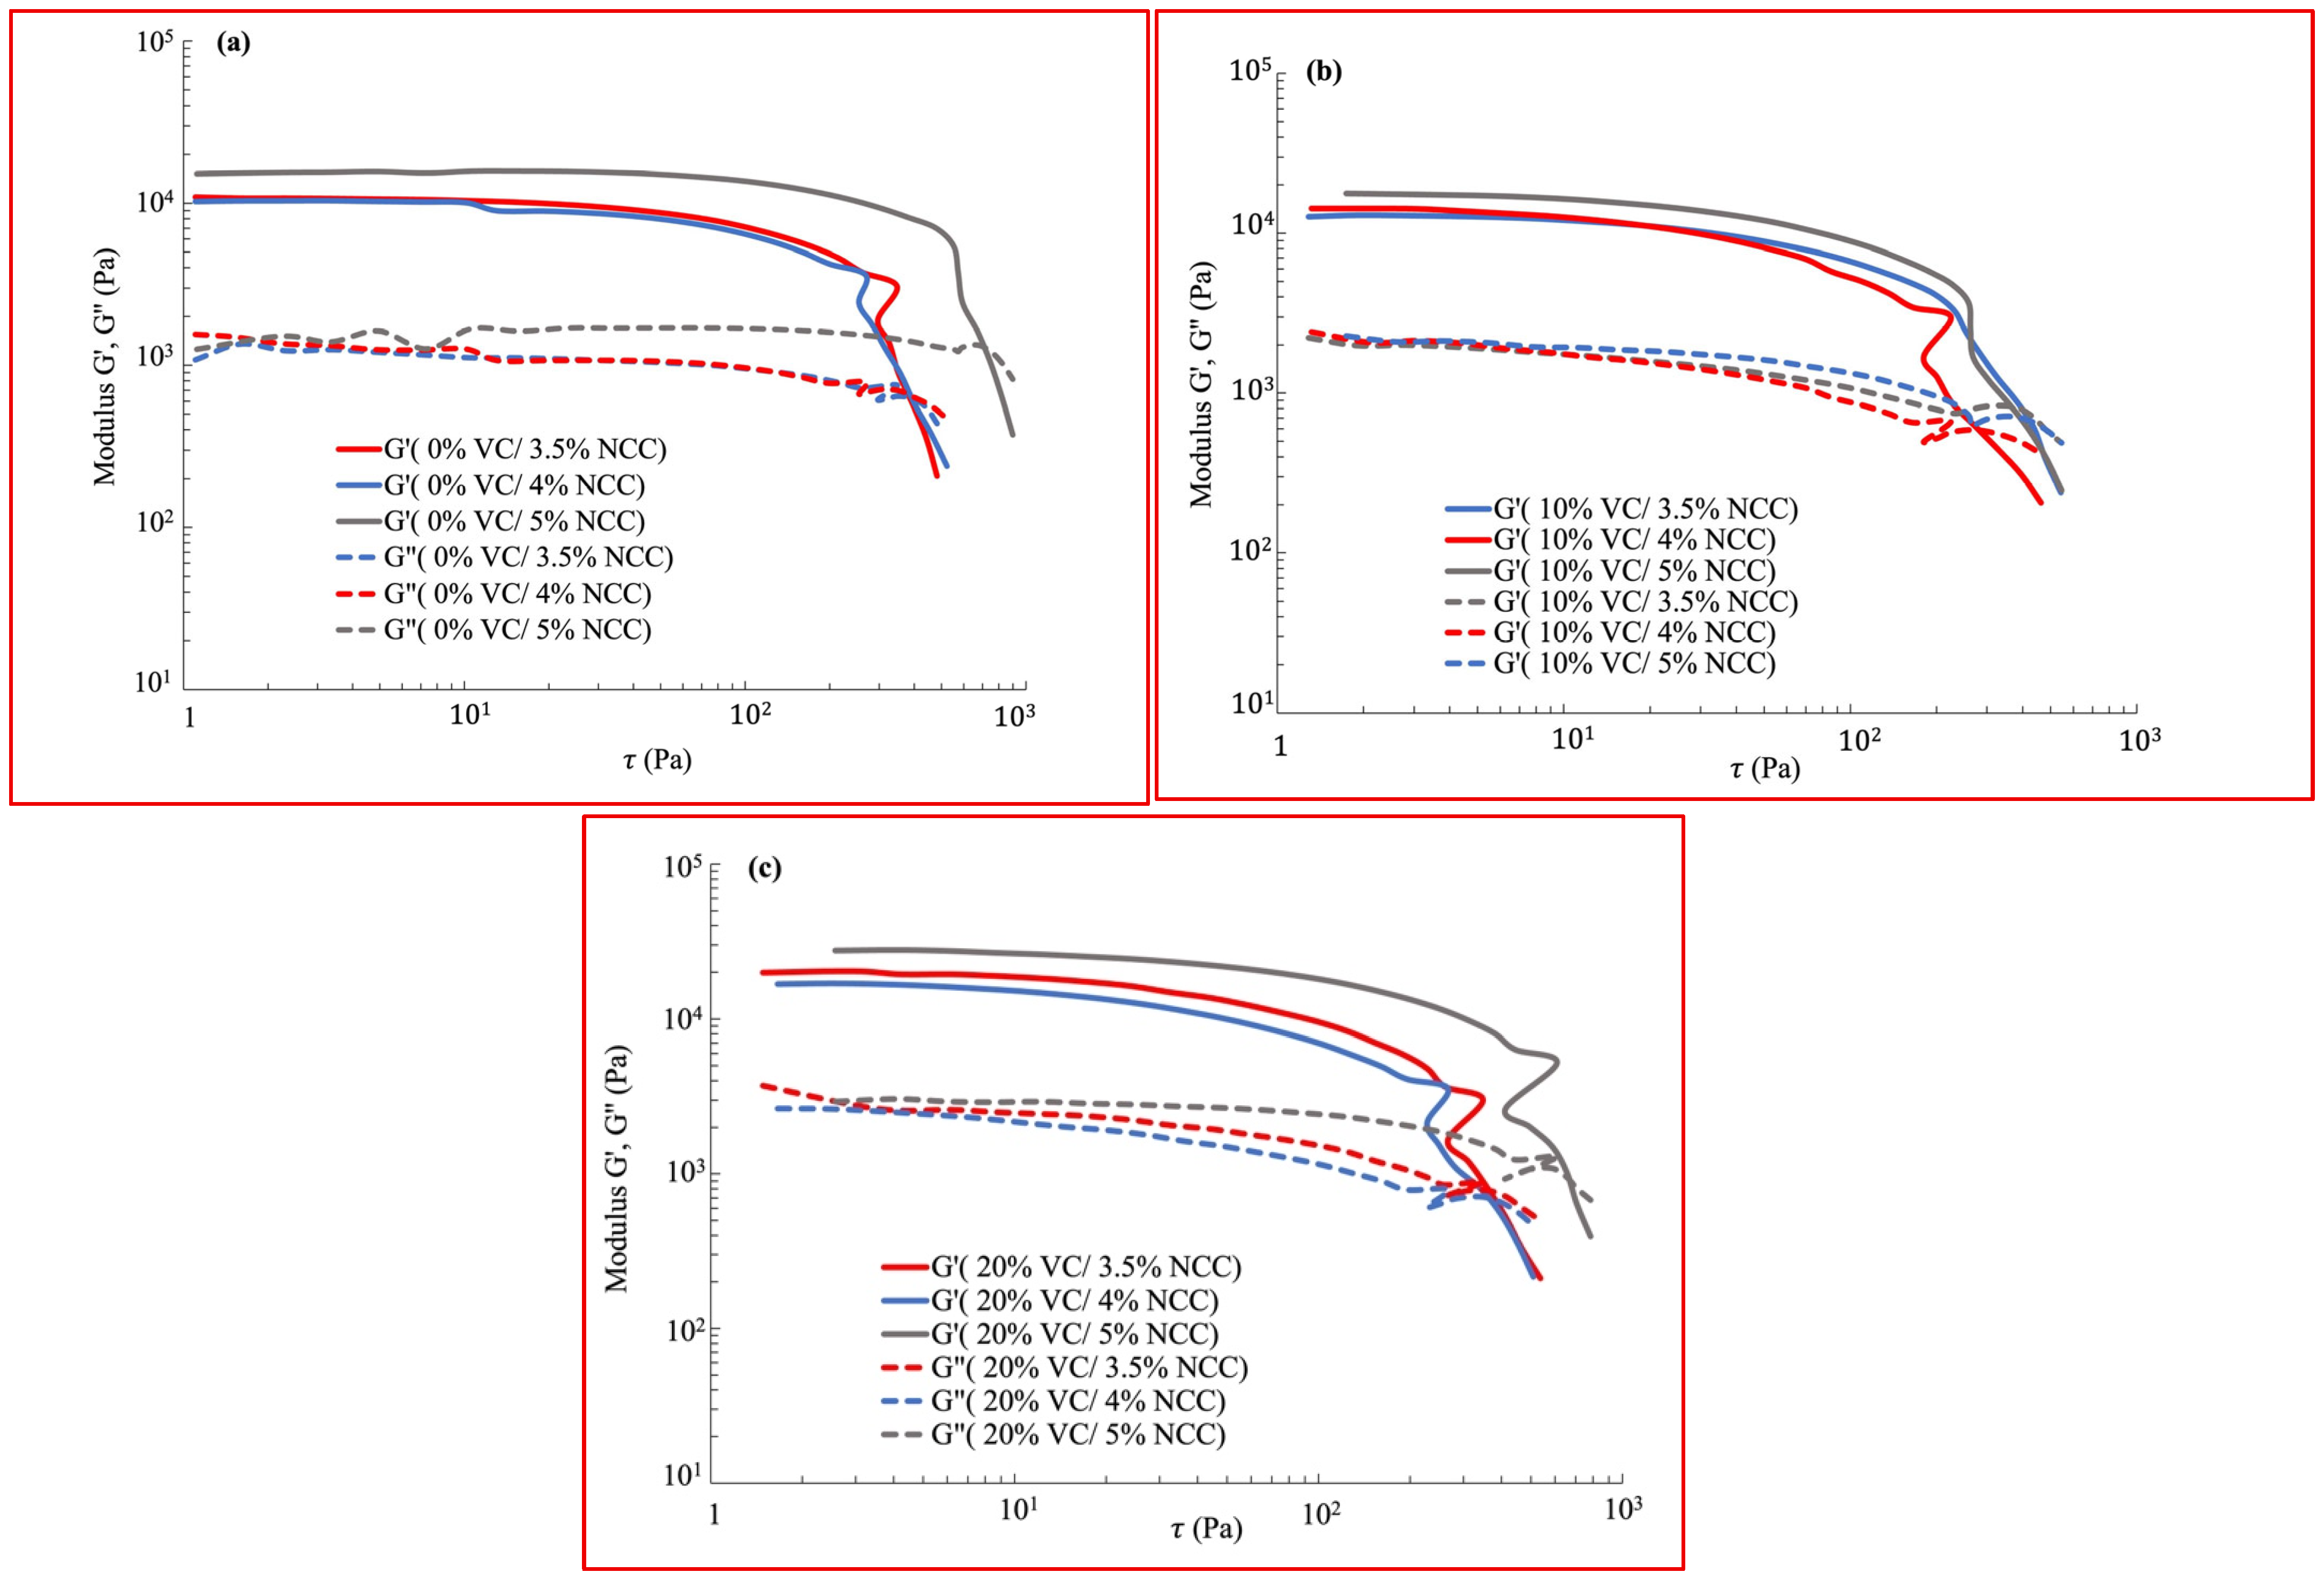
In Figure 3, the effects of VC on the storage and loss modulus of different inks at three NCC concentrations are compared. Figure 3a illustrates three distinct regions for the inks with the lowest quantity of NCC. Each ink exhibits a quasi-linear behavior at low shear stresses, and after reaching the yield point, the storage modulus starts to decrease, indicating the ink’s transition from a solid-like to a more liquid-like state. Inks 1 to 3 have the same NCC content but different VC quantities. Increasing the VC increases both the storage and loss moduli. The presence of a linear region in each ink’s amplitude sweep curve is critical, as it defines the range over which the ink can withstand applied forces without structural failure. Additionally, the yield point, which marks the transition from elastic to plastic deformation, provides key insights into the ink’s mechanical stability. A similar effect of VC on storage and loss modulus is also shown in Figure 3b,c. In addition, the flow point is affected by VC concentration, especially at the two higher NCC levels, although no clear trend can be identified.
On the other hand, investigating the effects of NCC in inks with the same VC content is challenging due to the simultaneous increase in water content. However, because of the small change in water (<10%) compared to the change in NCC (>14%), the effects are mostly due to NCC. Since NCC functions as both a binder and a viscosifier, increasing its concentration leads to higher viscosity. Comparing the three inks in Figure 4a, Ink 7 (the highest NCC content and 0 wt% VC) exhibits a higher storage modulus, loss modulus, and yield point when compared to the other inks.
Further examination of the plots in Figure 4 confirms that the gray curve, representing the ink with the highest NCC content, had a high yield point, which could facilitate the formation of tall structures [21]. Note that as viscosity increases, the flow stress (τf) shifts to the right, leading to a higher yield point. This trend is clear for Inks 7, 8, and 9 (the highest NCC content and 0, 10, and 20 wt% VC, respectively) in Figure 4a, 4b, and 4c, respectively, affirming the effect of NCC on the inks.
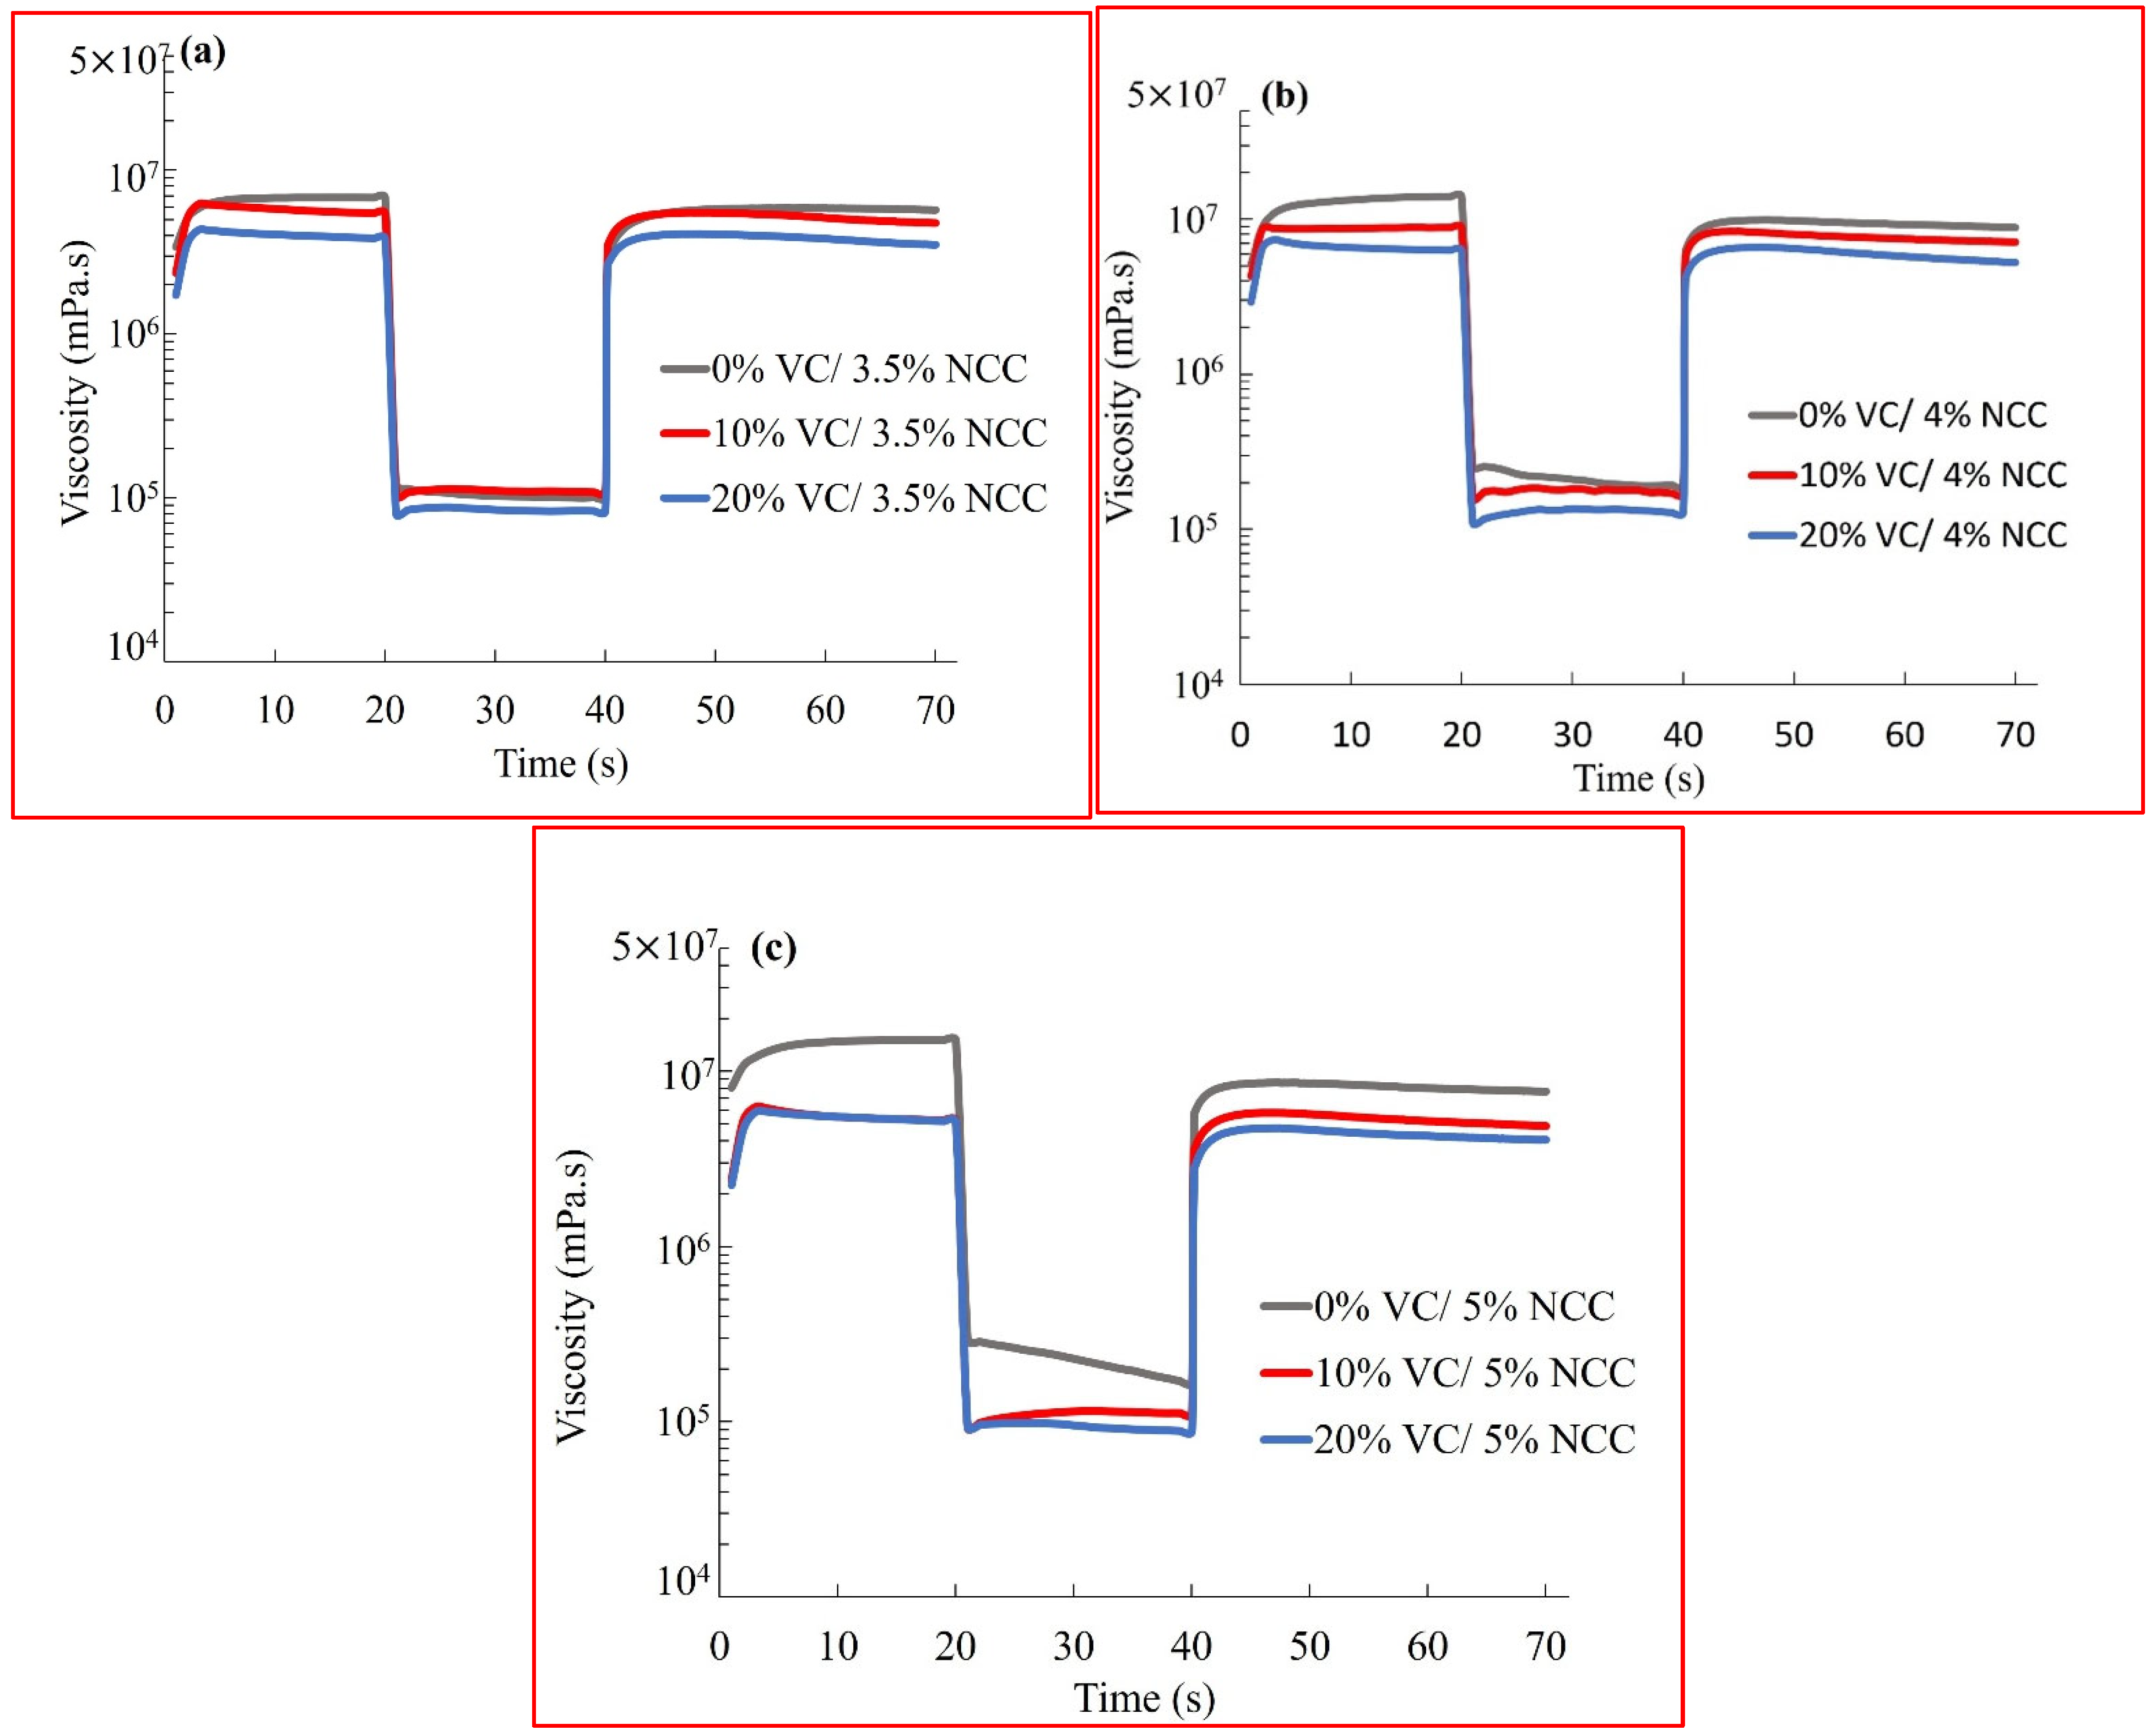
The 3ITT results for the nine inks are shown in Figure 5. The first interval corresponds to the resting period when the ink is inside the syringe. During this phase, there is no pressure applied to the ink, and it exhibits the highest viscosity. In the second interval, the ink is being extruded onto the surface, resulting in the lowest viscosity. This behavior is typical for viscoelastic materials, as increasing the shear rate causes a decrease in viscosity. The force applied to the syringe increases the shear rate, explaining the sudden decrease in viscosity in the second interval of the 3ITT. The third interval is the most important section of this test because it determines the printability of an ink. Figure 5 illustrates that the needed time for recovery from the second to the third interval is just few seconds.
Despite the similarities in the general behavior for all the inks, as seen in Figure 5, the effect of VC on the viscosity is obvious. Increasing the VC concentration decreases the ink’s viscosity in all the three regions, independent of the NCC concentration. The small VC particles are more readily dispersed in the ink, resulting in less agglomeration and easier flowability. The underlying reason for this behavior is polydispersity, where the particle-size distribution becomes less uniform, with a mix of small and large particles, leading to lower viscosity [22]. In contrast, there is no definitive effect of NCC on the ink’s viscosity when the VC concentration is fixed. This is perhaps due to the small change in NCC levels as well as the simultaneous change in water quantity. The effect may be too small to be separated from measurement uncertainties.
The samples with the highest VC content recover the fastest [23]. Figure 5a presents the results of the 3ITT test for Inks 1, 2, and 3, all containing the same amount of NCC but varying levels of VC. During the first interval, representing the resting phase, Ink 1 (the lowest NCC content and no VC) exhibits the highest viscosity compared to the other inks. As force is applied to the syringe and the shear rate increases, the ink begins to flow, decreasing the viscosity as expected based on their viscoelastic properties. Increasing the VC content while maintaining the same NCC level reduces viscosity. The same trends are seen in Figure 5b,c. Another significant point in Figure 5 is the fast recovery time, which is crucial for evaluating the ink’s ability to maintain a solid-like state. To determine the recovery time, the average value from the first interval was calculated. The time required in the third interval to reach 85% of the average viscosity is referred as the recovery time in this study. Table 3 shows these results, highlighting that lower flow points correlate with shorter recovery times. Inks with a higher viscosity require more shear stress to be extruded, and the results show that these inks also need more time to recover.

3.2. Shrinkage of Printed Samples

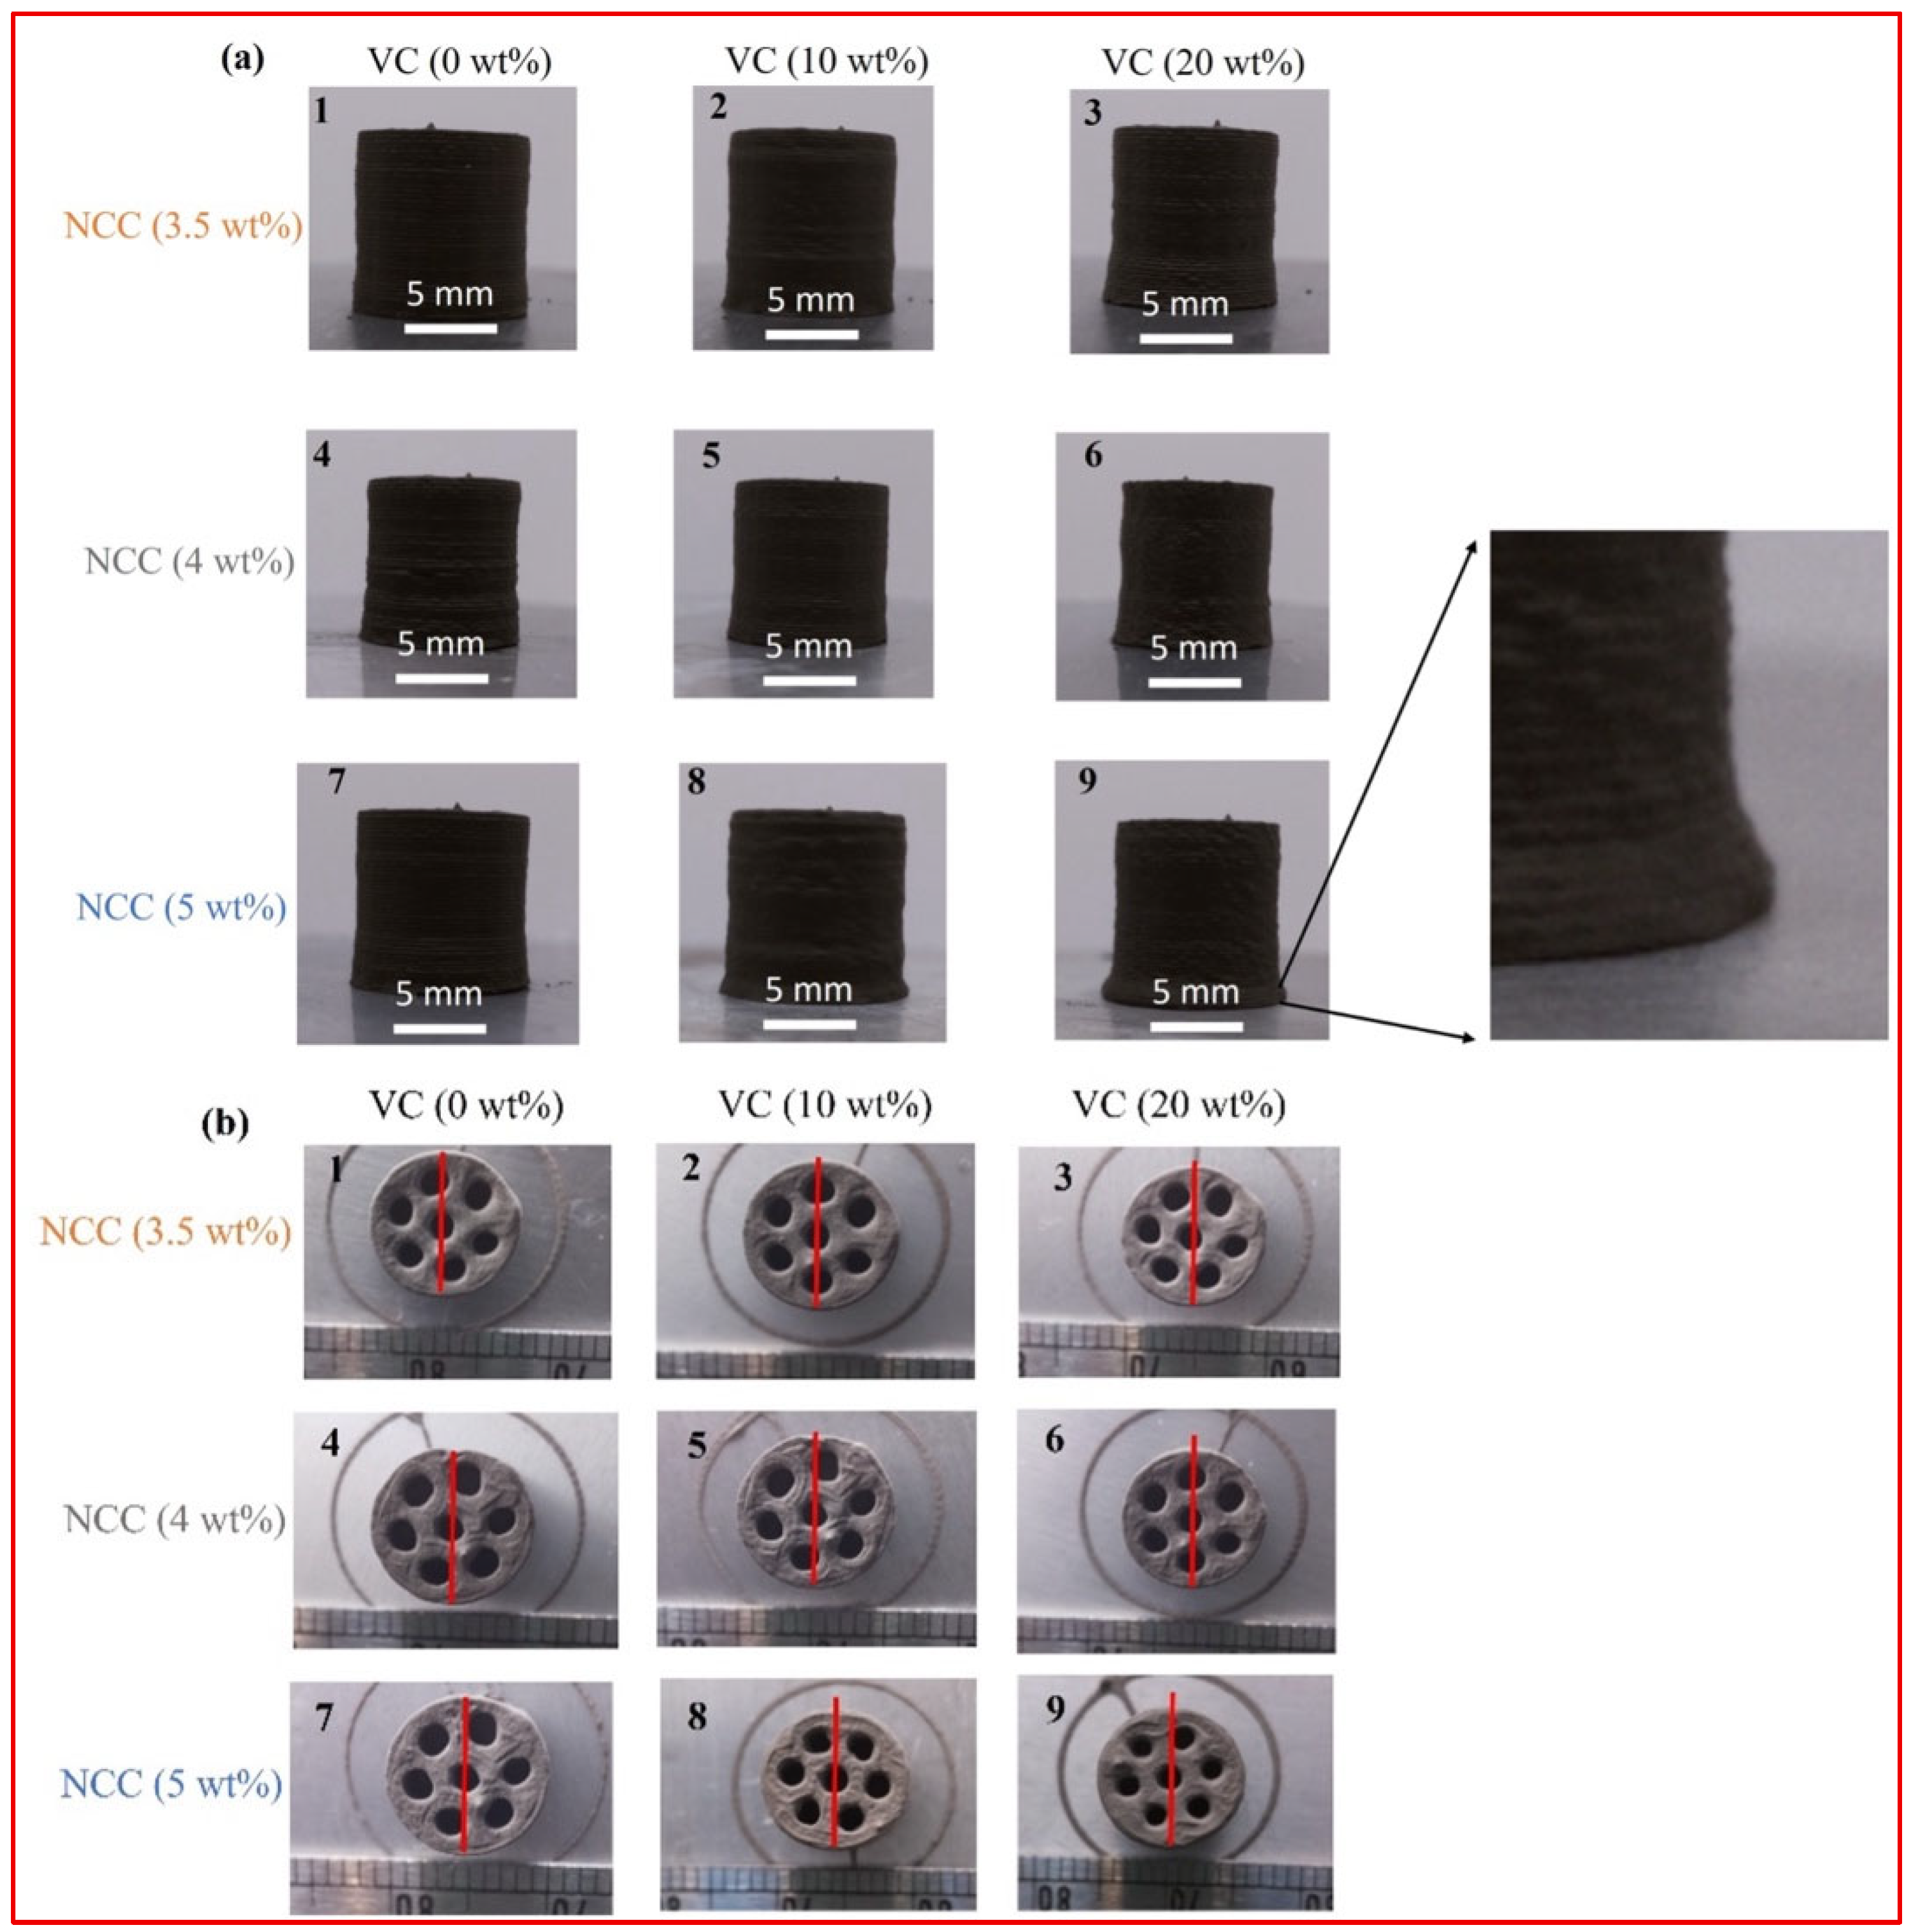
The dimensional stability of the printed structures was evaluated to understand how different material compositions and processing parameters influence shrinkage, deformation, and overall geometric accuracy. This assessment is crucial for ensuring the reliability of printed components, particularly in applications requiring precise structural integrity. To achieve this, sample dimensions were measured after drying from the side and top views, as illustrated in Figure 6. Each row in the figure corresponds to inks with the same quantity of NCC. Clearly, when the ink composition consists only of ZrC (1, 4, and 7, slurries without VC), the walls are straight, and the curvature at the bottom is negligible. The radius of curvature and standard deviation were calculated for all nine samples after drying, based on three replicates per condition. The results are presented in Table 4.
Sample 3, however, shows noticeable deformation at the bottom of the cylinder. This deformation can be analyzed in relation to the 3ITT results in Figure 5a, where Ink 1 (the lowest NCC content and no VC), with the highest viscosity in the third interval, experiences less deformation compared to Inks 2 and 3 (the lowest NCC content and 10, 20 wt% VC, respectively). This observation can be generalized to other groups with the same NCC content: inks with higher viscosities tend to resist deformation more effectively across the samples. In the second and third rows of Figure 6a, Samples 6 and 9 noticeably deform after drying. This deformation can be attributed to lower viscosities after printing, as shown in the 3ITT results (Figure 5b,c) compared to Samples 4 and 7, respectively.
Additionally, as seen in Figure 6, Samples 1, 4, and 7, which exhibit longer recovery times, are slightly rougher in texture compared to the other samples. This is directly related to the recovery time: inks with short recovery times tend to produce smooth surfaces, while those with longer recovery times result in a rougher surface.
Figure 6b shows the top view of the nine samples. In each row, a red reference line indicates the diameter of the sample with the lowest level of VC. It is evident that the diameter of the cylinders decreases from left to right. A similar trend is observed in the average diameter of the small holes, as shown in Figure 7a. The 3ITT results, as shown in Figure 5, indicate that Inks 3, 6, and 9 (the highest VC content) exhibit the lowest viscosities. The lowest viscosity results in the most deformation and shrinkage, as observed in both the side and top views of Figure 6.
The effects of VC and NCC were calculated for four sample features before and after drying: sample height, top diameter, bottom diameter, and hole diameter. Since physically measuring the samples while wet is not feasible, photographs were taken to accurately measure their dimensions by ImageJ software. Dried samples were measured using a caliper.
Figure 7 shows the effects of VC and NCC on the shrinkage of the four quantities for the nine samples. Each subfigure contains three distinct groups, and within each group the NCC quantity is constant. As a general observation, sample height and top diameter exhibit a similar percentage shrinkage ranging from 7 to 16%. The hole diameters shrink the most from 12% to 24%. The small size of the holes may be the reason for the large percentage of shrinkage. Sample bottom diameter shrinks the least, from 3 to 8%. The friction of the printing plate may retard the contraction of the material at the bottom of the samples.
For all four measured quantities, increasing NCC concentration increases the percentage of shrinkage, independent of the VC concentration level. This behavior may be attributed to the simultaneous increase in water content as NCC concentration is increased. In contrast, the effect of VC on the percentage of shrinkage is more complicated in that not all four quantities follow the same trend. While the percentage of shrinkage for sample height, top diameter, and hole diameter all increases with VC concentration regardless of the NCC content (Figure 7a–c), the opposite is true for that of the bottom diameter, as shown in Figure 7d. To interpret this, the side views of the samples in Figure 6 may provide some clues. The images in each row correspond to inks with the same amount of NCC. As VC concentration increases, a curvature at the bottom of the sample begins to develop, most likely due to the friction at the contact with the support plate that resists shrinking at the bottom. The development of such curvature with increasing VC concentration seems to be related to the decrease in viscosity with VC.
As previously mentioned, the third sample in each row exhibits the most curvature at the bottom. When calculating shrinkage, two values are important: the initial bottom diameter after printing (approximately 10 mm when wet) and the bottom diameter after drying, which varies for each sample because of different NCC, VC, and water content. Structures with a higher VC content are more deformed, leading to a larger bottom diameter. As this diameter increases, the difference between the initial (10 mm) and dried diameters decreases. As a result, Figure 7d shows a downward trend in each group due to this smaller residual difference.

3.3. Microstructure and Porosity

SEM provides detailed images of the microstructure, offering insights into the distribution of NCC in the samples. During sintering, the NCC burns off, leaving behind some voids and the desired structural components.
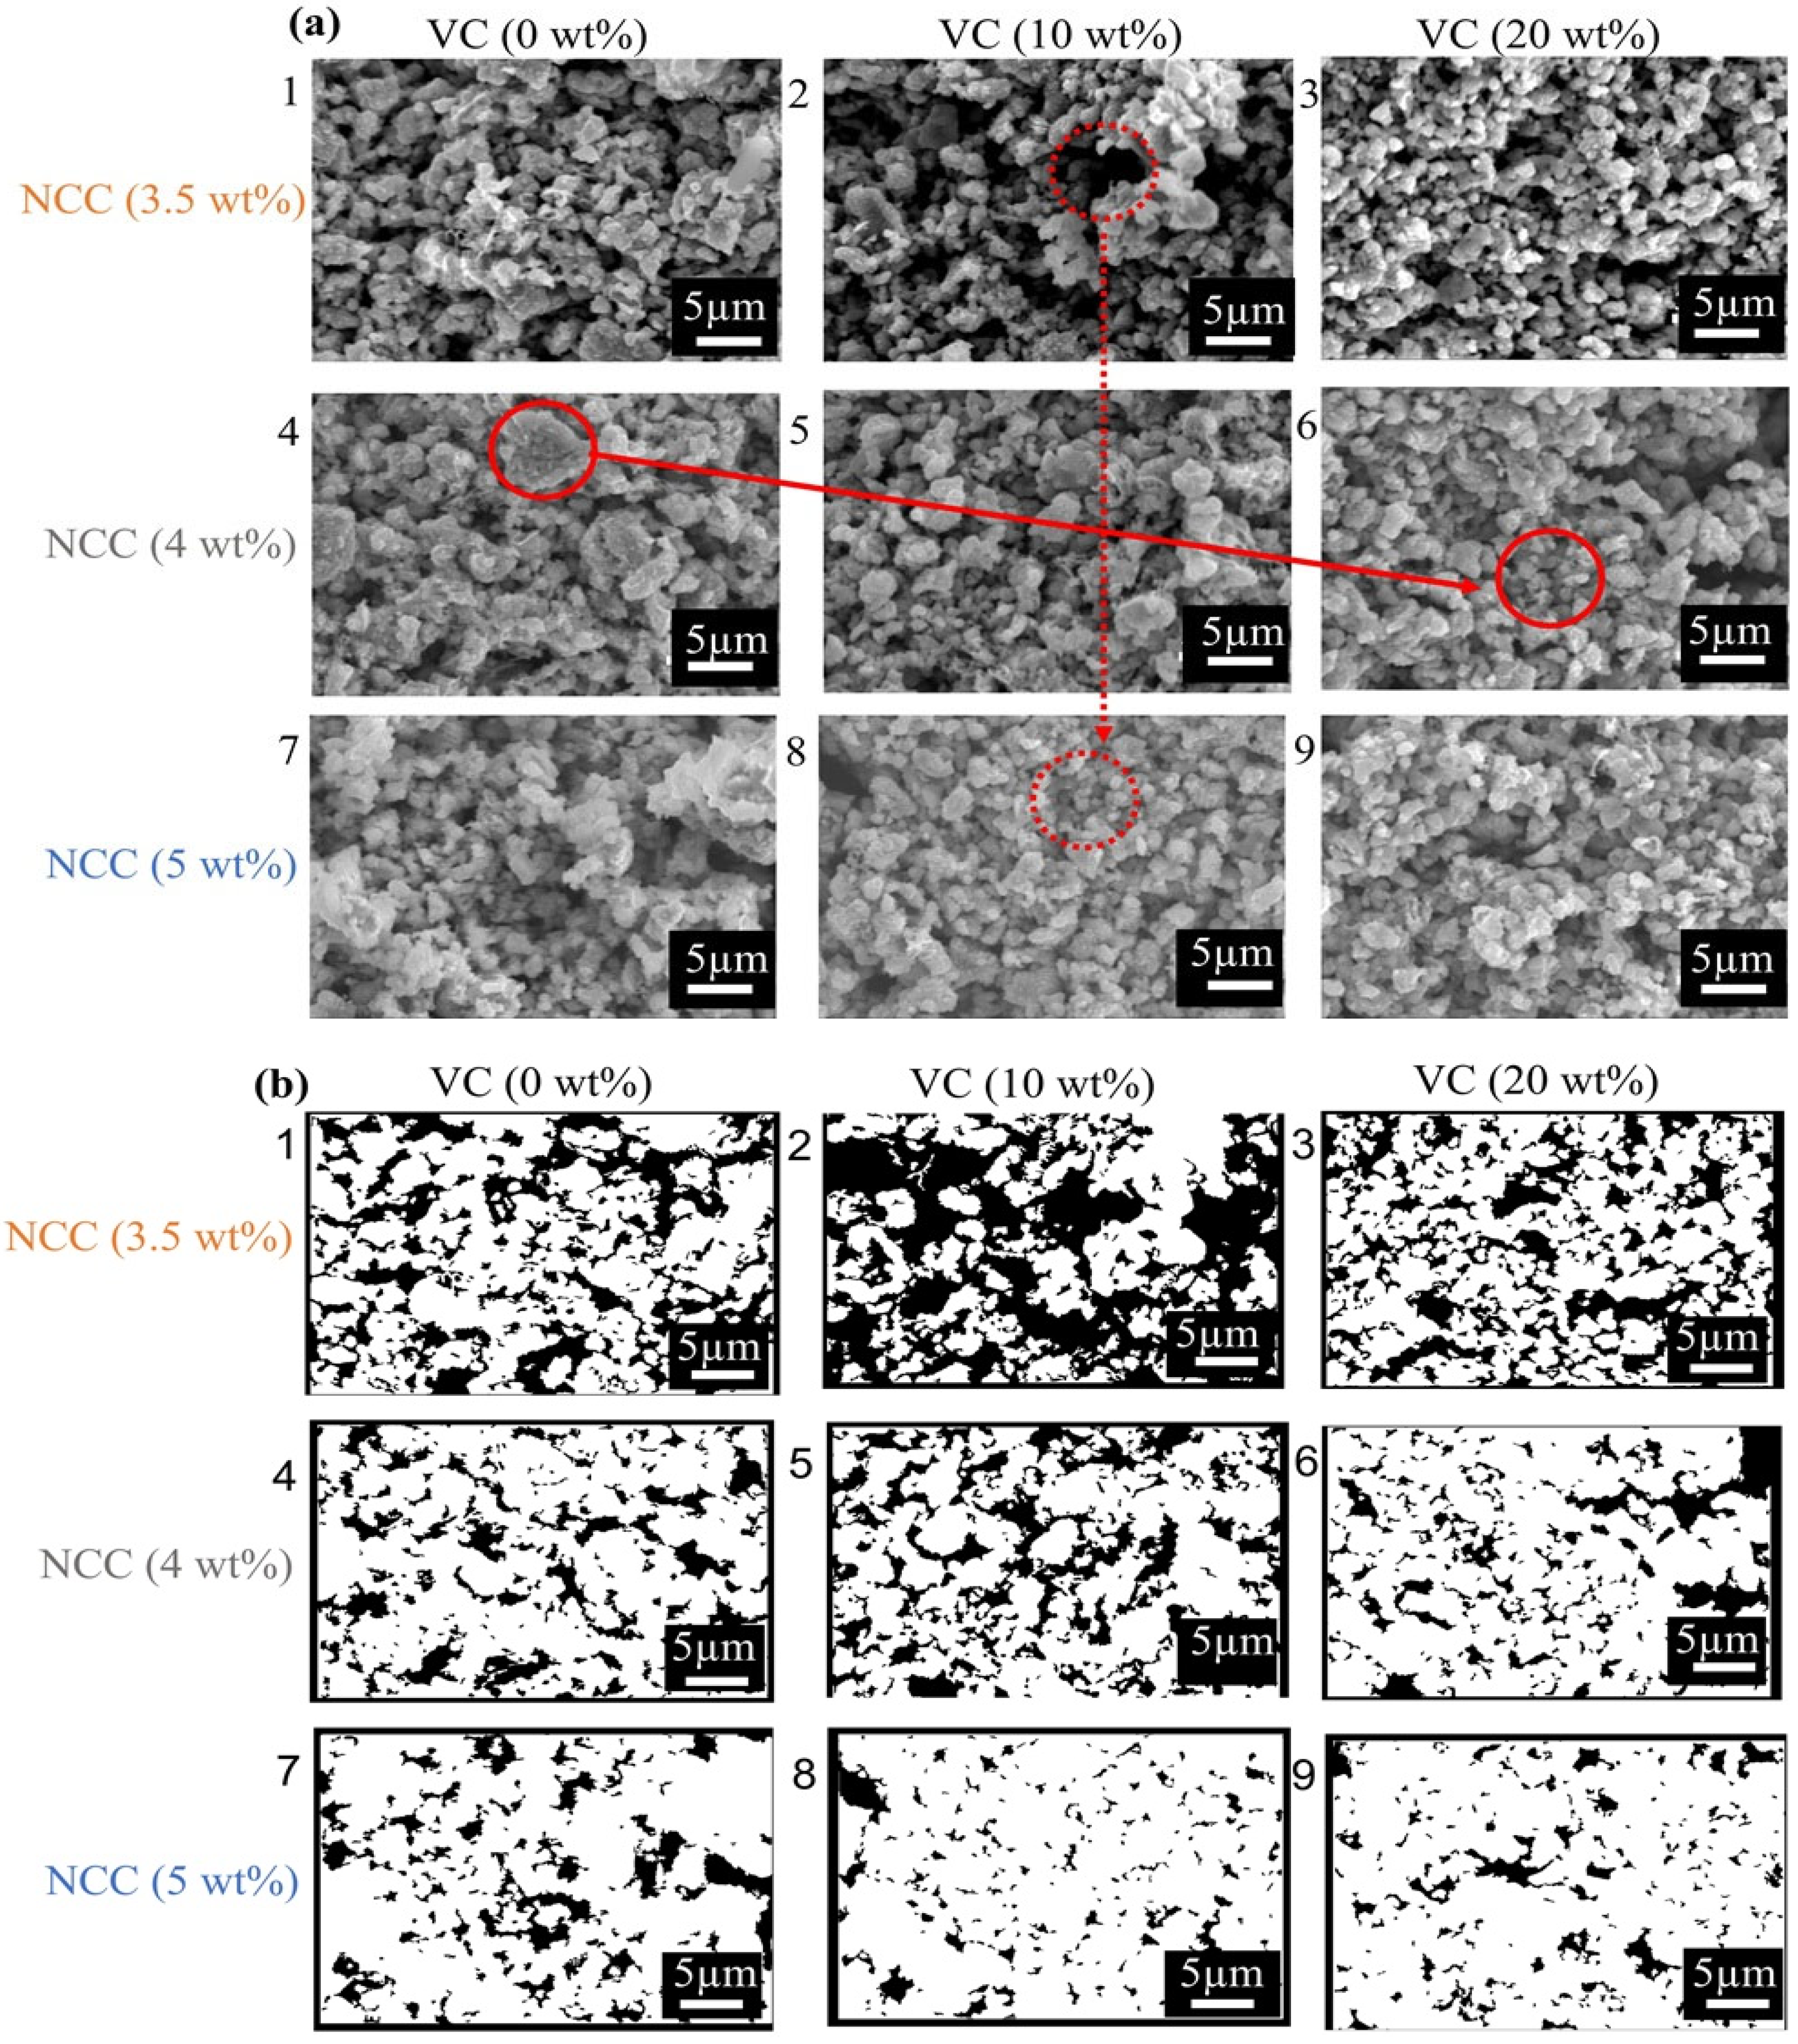
Figure 8a illustrates the microstructure of the nine samples created according to Table 1. Each row shows the internal structure of samples with the same quantity of NCC, while each column represents samples with the same VC content. At first glance, all samples appear similar, consisting of microparticles and clusters bonded together, with numerous microvoids distributed across the surface. In this figure, dashed red circles are used to highlight representative pore locations as illustrative examples. However, a closer examination reveals certain trends. At constant NCC content, increasing VC concentration (from left to right) leads to a more refined microstructure with grain sizes decreasing, voids becoming smaller, and the overall distribution becoming more uniform.
To support the above argument, the average grain size was quantified using automated image analysis (ImageJ) and listed in Table 5. Representative grains are marked with solid circles in selected SEM images to visually demonstrate the trend. The results show a consistent decrease in grain size with increasing VC content (left to right in each row), accompanied by enhanced uniformity at 20 wt% VC. This refinement is attributed to the smaller particle size of VC, which promotes diffusion and hinders grain growth by pinning ZrC grain boundaries.
As the VC content increases, the void size decreases, likely due to the finer grain size of VC compared to ZrC. These small grains interlock with the larger ZrC particles, filling interstitial spaces and reducing microvoids. Moreover, VC’s presence at the grain boundaries helps limit grain boundary sliding and migration during sintering, leading to denser particle packing. This ultimately enhances mechanical strength and reduce porosity in the final material.
The black voids visible in the SEM images represent pores. Comparing images 2, 5, and 8 in the same column shows that void size decreases as water and NCC content increase. This suggests that increasing water content helps prevent NCC from aggregating at specific points. Moreover, NCC aids in dispersing both ZrC and VC particles, reducing particle agglomeration and promoting a more uniform particle distribution throughout the matrix. This results in a more homogeneous composite structure, visible in the SEM images as a more consistent microstructure with fewer large voids.
To validate these observations, Figure 8b shows binarized versions of the SEM images, where pore areas are displayed in black and solid matrix regions in white. These binary masks were generated using ImageJ through automated thresholding. The visual patterns in the masks confirm the previously discussed trends: pore size decreases with increasing NCC at fixed VC level.
Volumetric porosity (Pt) was calculated because SEM images only provide surface-level information, which may not be entirely reliable for determining the overall porosity. In this study, porosity was determined using a volumetric method rather than the Archimedes method due to the presence of both open and closed pores in the samples. To estimate porosity, we first calculated the volume of the main cylindrical structure and then subtracted the volume of the smaller cylindrical rods. This approach allowed us to obtain a more precise estimation of the total porosity. Calculating the bulk density (ρB) is the first step. Bulk density is the ratio of mass (M) to volume (Vt) as in Equation (1), where mass is defined as the combination of all ingredients’ mass in a sample and h represents the height of the main cylindrical body. After that, pore volume (Vp) is defined by Equation (2). Finally, the ratio of pore volume to the total volume is defined as volumetric porosity in Equation (3).
ρ B = M V t = M π r c y l i n d e r 2 i = 1 7 r h o l e i 2 h
V p = M ρ B M ρ M
P t = V p V t
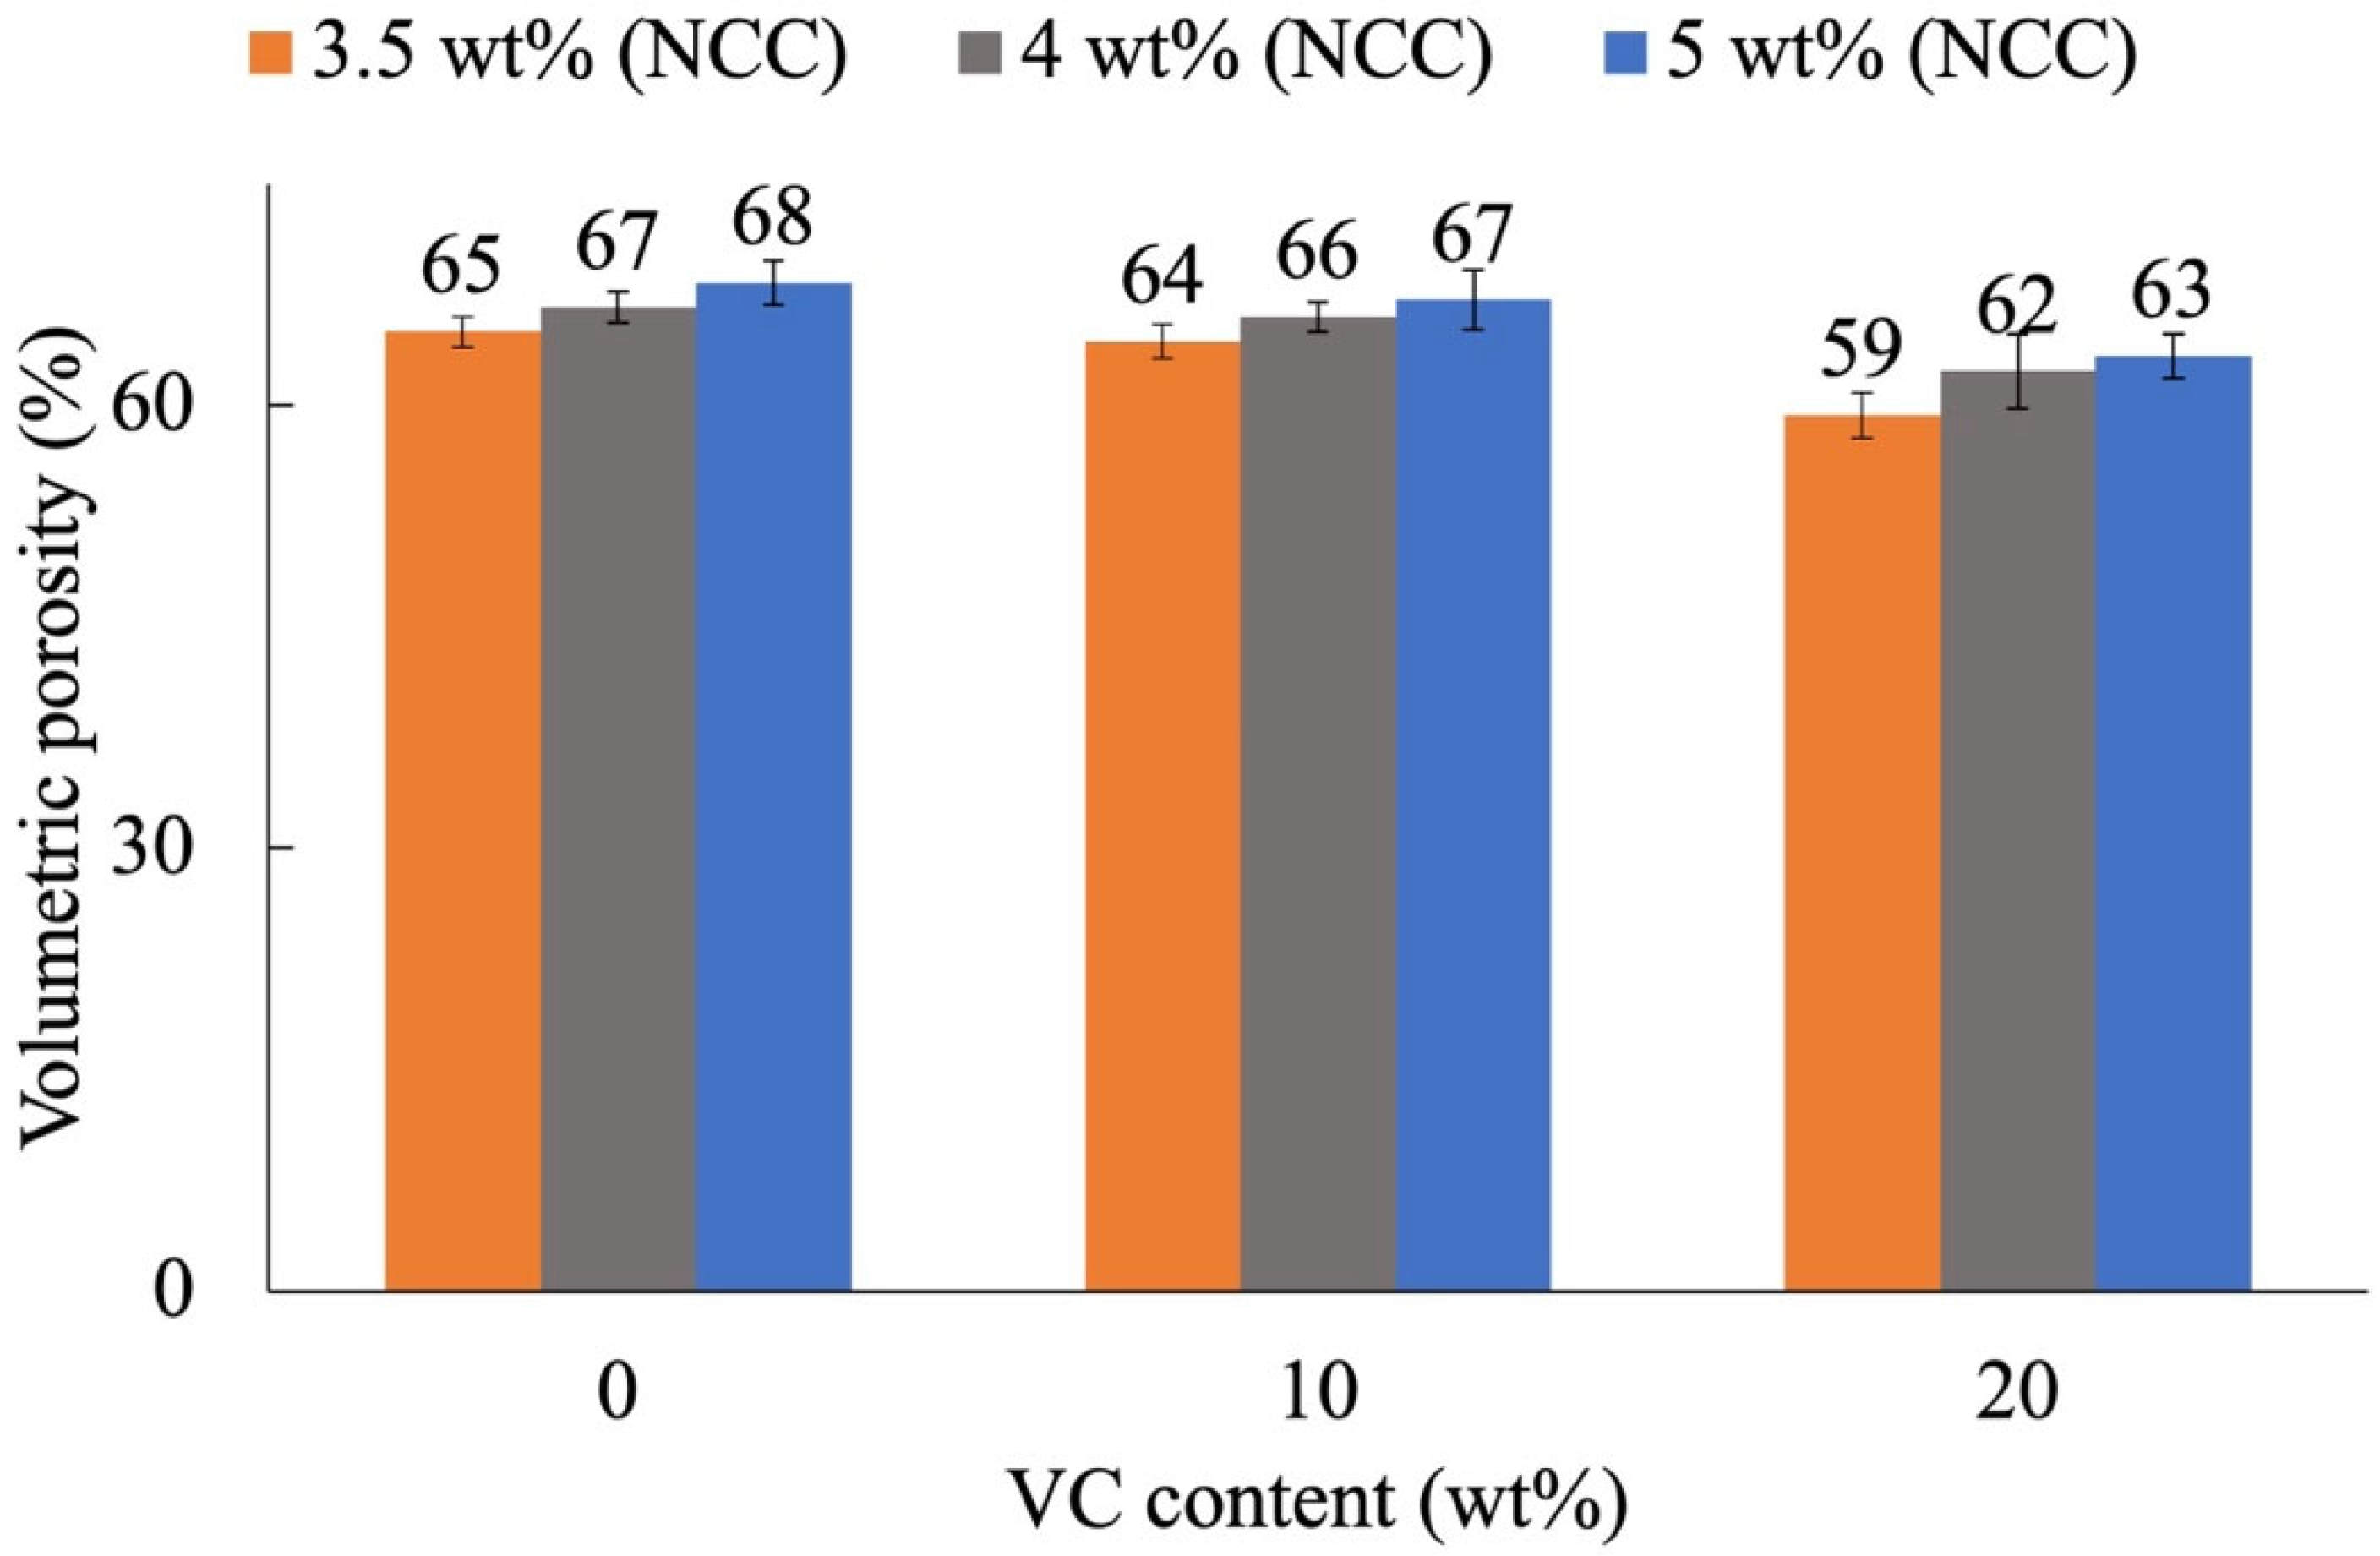
Figure 9 shows the calculated porosity for each sample made with different inks. The results indicate relatively high porosity, which poses a challenge in achieving the desired material density. In each section where the VC content is constant, porosity increases with NCC concentration. This behavior is reasonable because increasing the NCC content leads to a higher density of voids. Increasing the VC concentration in each group, while keeping the NCC quantity constant, reduces the porosity. This occurs because the smaller VC particles can fill voids formed from the larger ZrC particles, leading to a denser and more uniform microstructure. Given the high porosity observed in these samples, spark plasma sintering (SPS) may be a suitable post-processing technique to enhance densification and improve the final material properties [24].
In comparison with previous studies, Sabata et al. [25] used direct ink writing to fabricate ZrC samples and achieved a theoretical density (TD) of 90% after sintering at 2000 °C for 2 h. Remarkably, in the present study, the first slurry formulation (with the lowest NCC and no VC content) already achieved a TD of 90% at a significantly lower sintering temperature of 1750 °C for the same duration. Notably, this result corresponds to the sample with the highest porosity in our set, based on binary SEM data. This underscores the potential for further densification by optimizing slurry formulation and sintering conditions.

3.4. Mechanical Properties

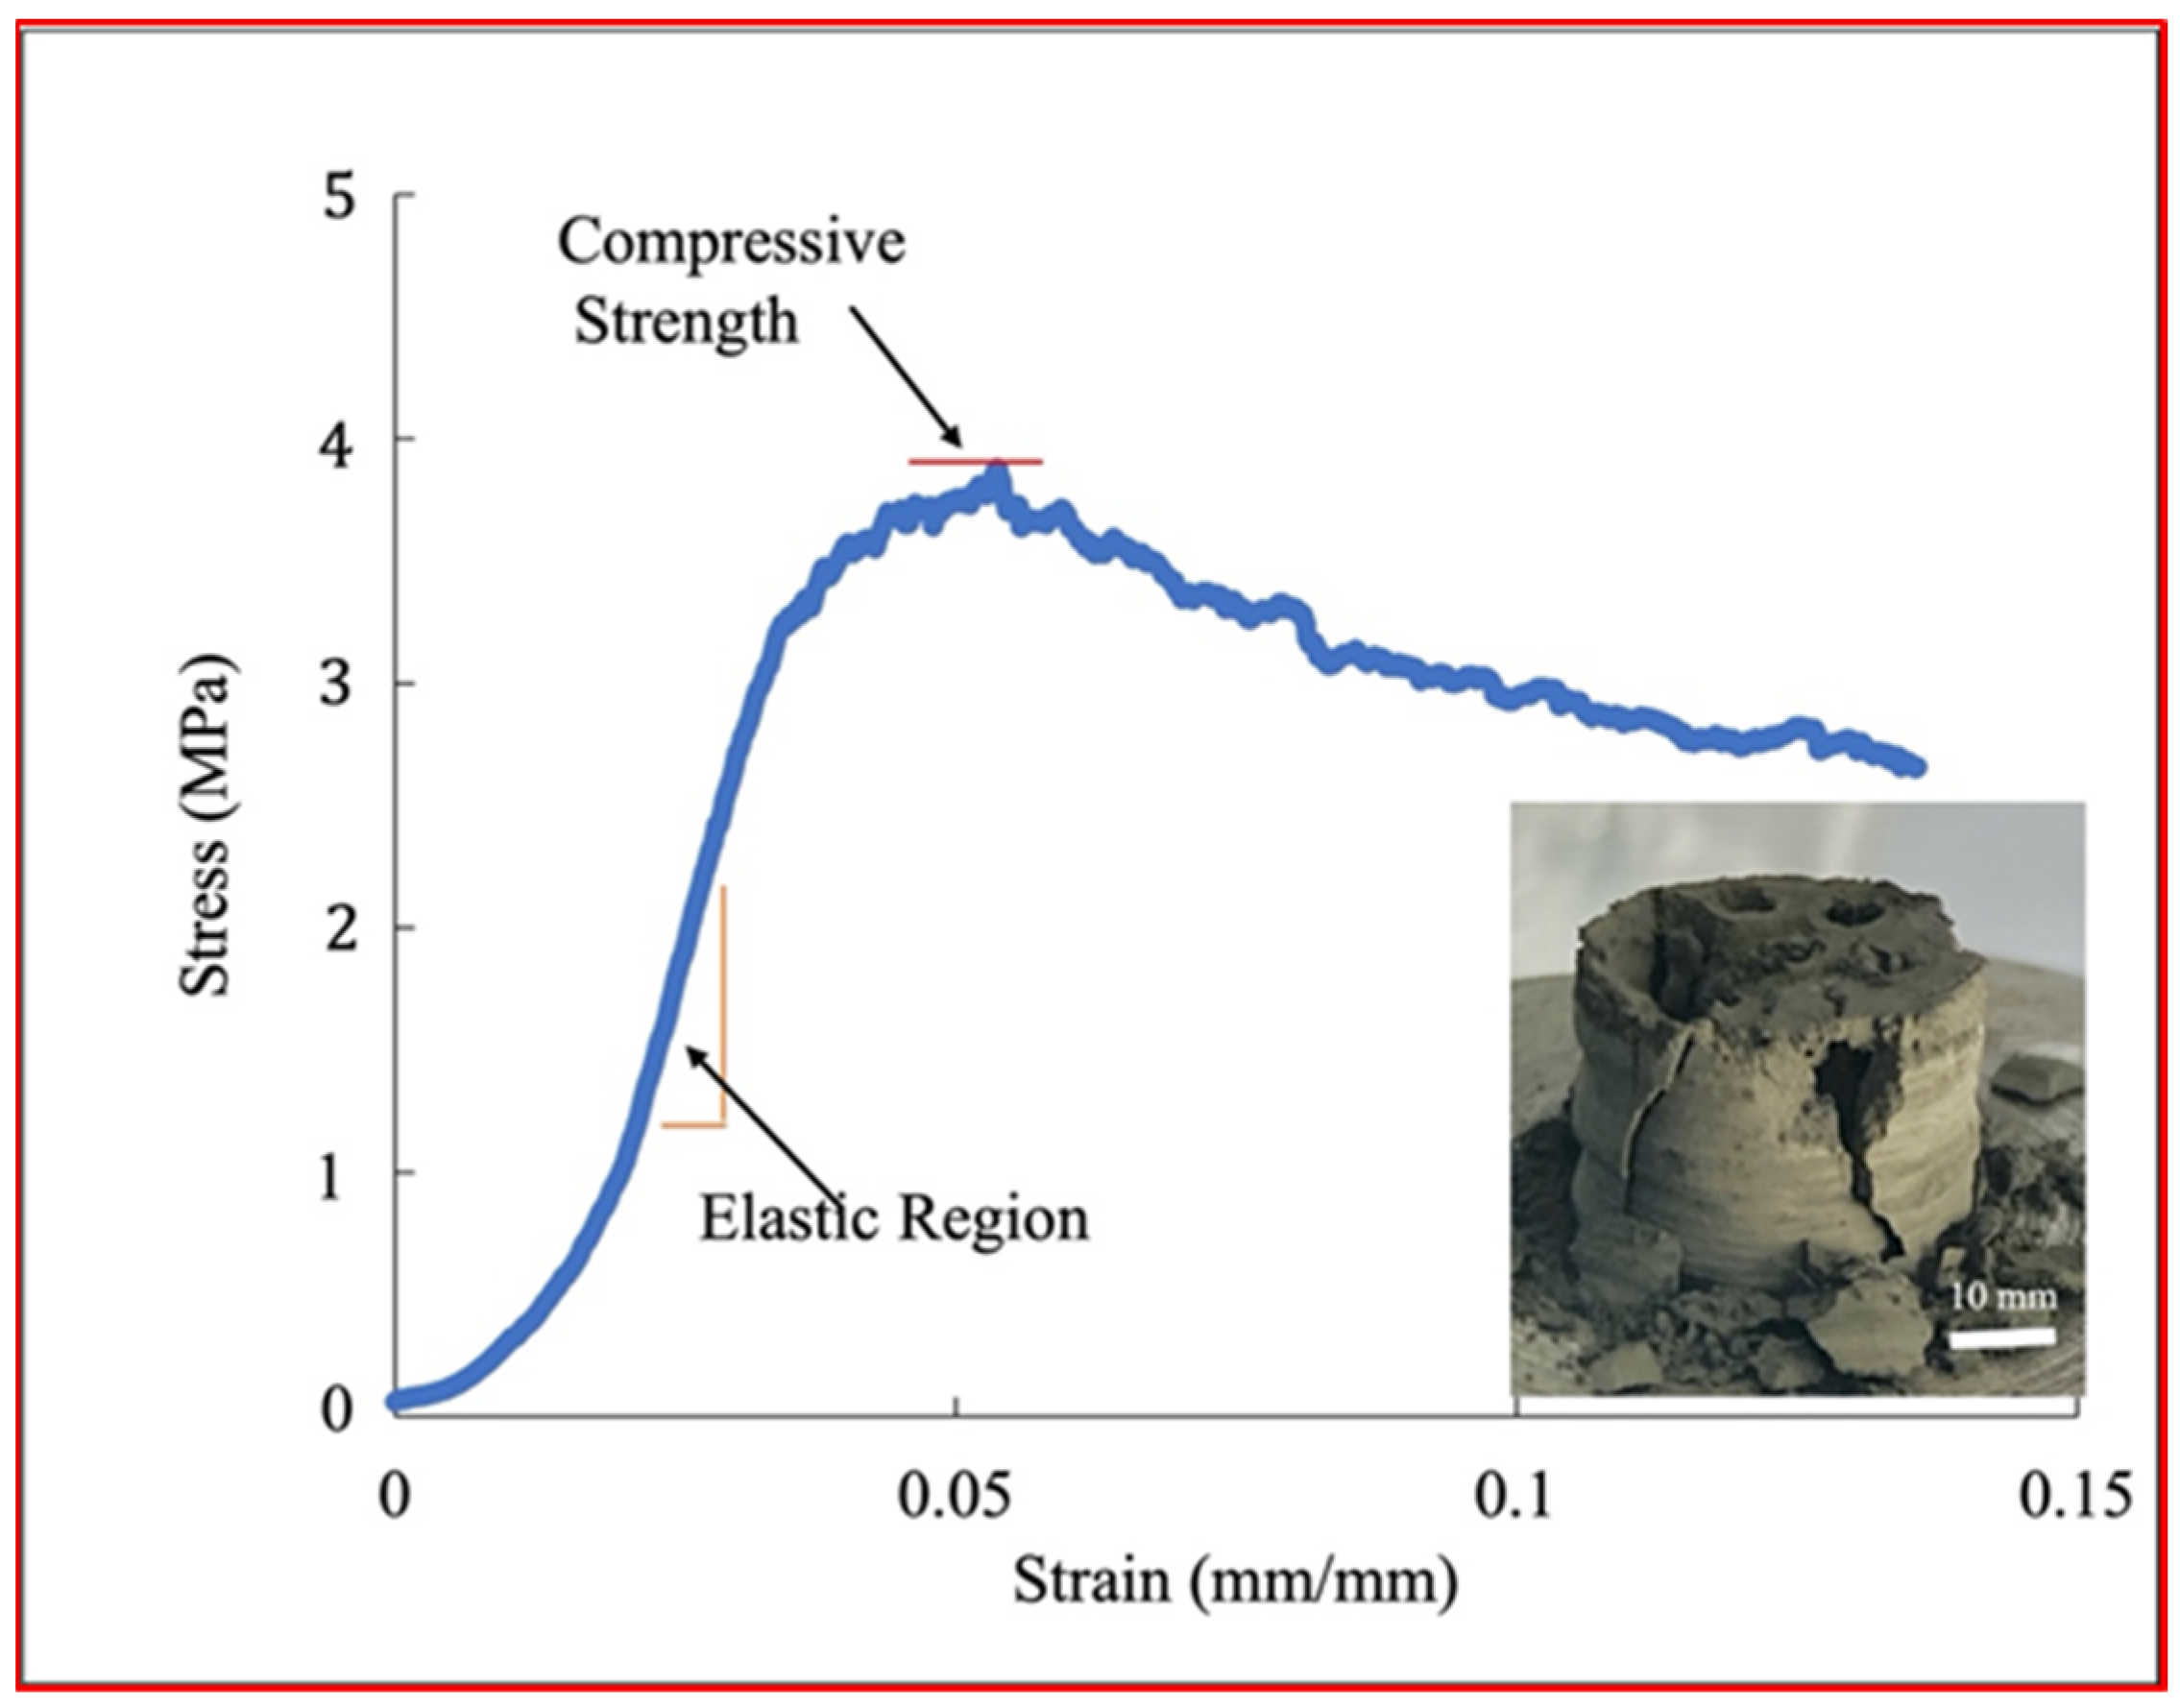
Figure 10 shows a typical stress-strain curve for a sintered sample from a uniaxial compressive test. This stress-strain curve is a graphical representation of how a material behaves under load, showing the relationship between the applied stress and the resulting strain. At the start of the test, stress increases slowly with strain in a nonlinear fashion due to the less-than-ideal contact between the sample and loading element. After that, the linear elastic region begins and stress becomes directly proportional to strain. The slope in this region is the elastic modulus. Beyond the elastic region the material starts to yield due to internal damage until the peak stress is reached. Stress continues to drop after the peak with large cracks and broken pieces appearing as seen in the inset of Figure 10. The maximum stress the sample can withstand before it starts to fail is the compressive strength.
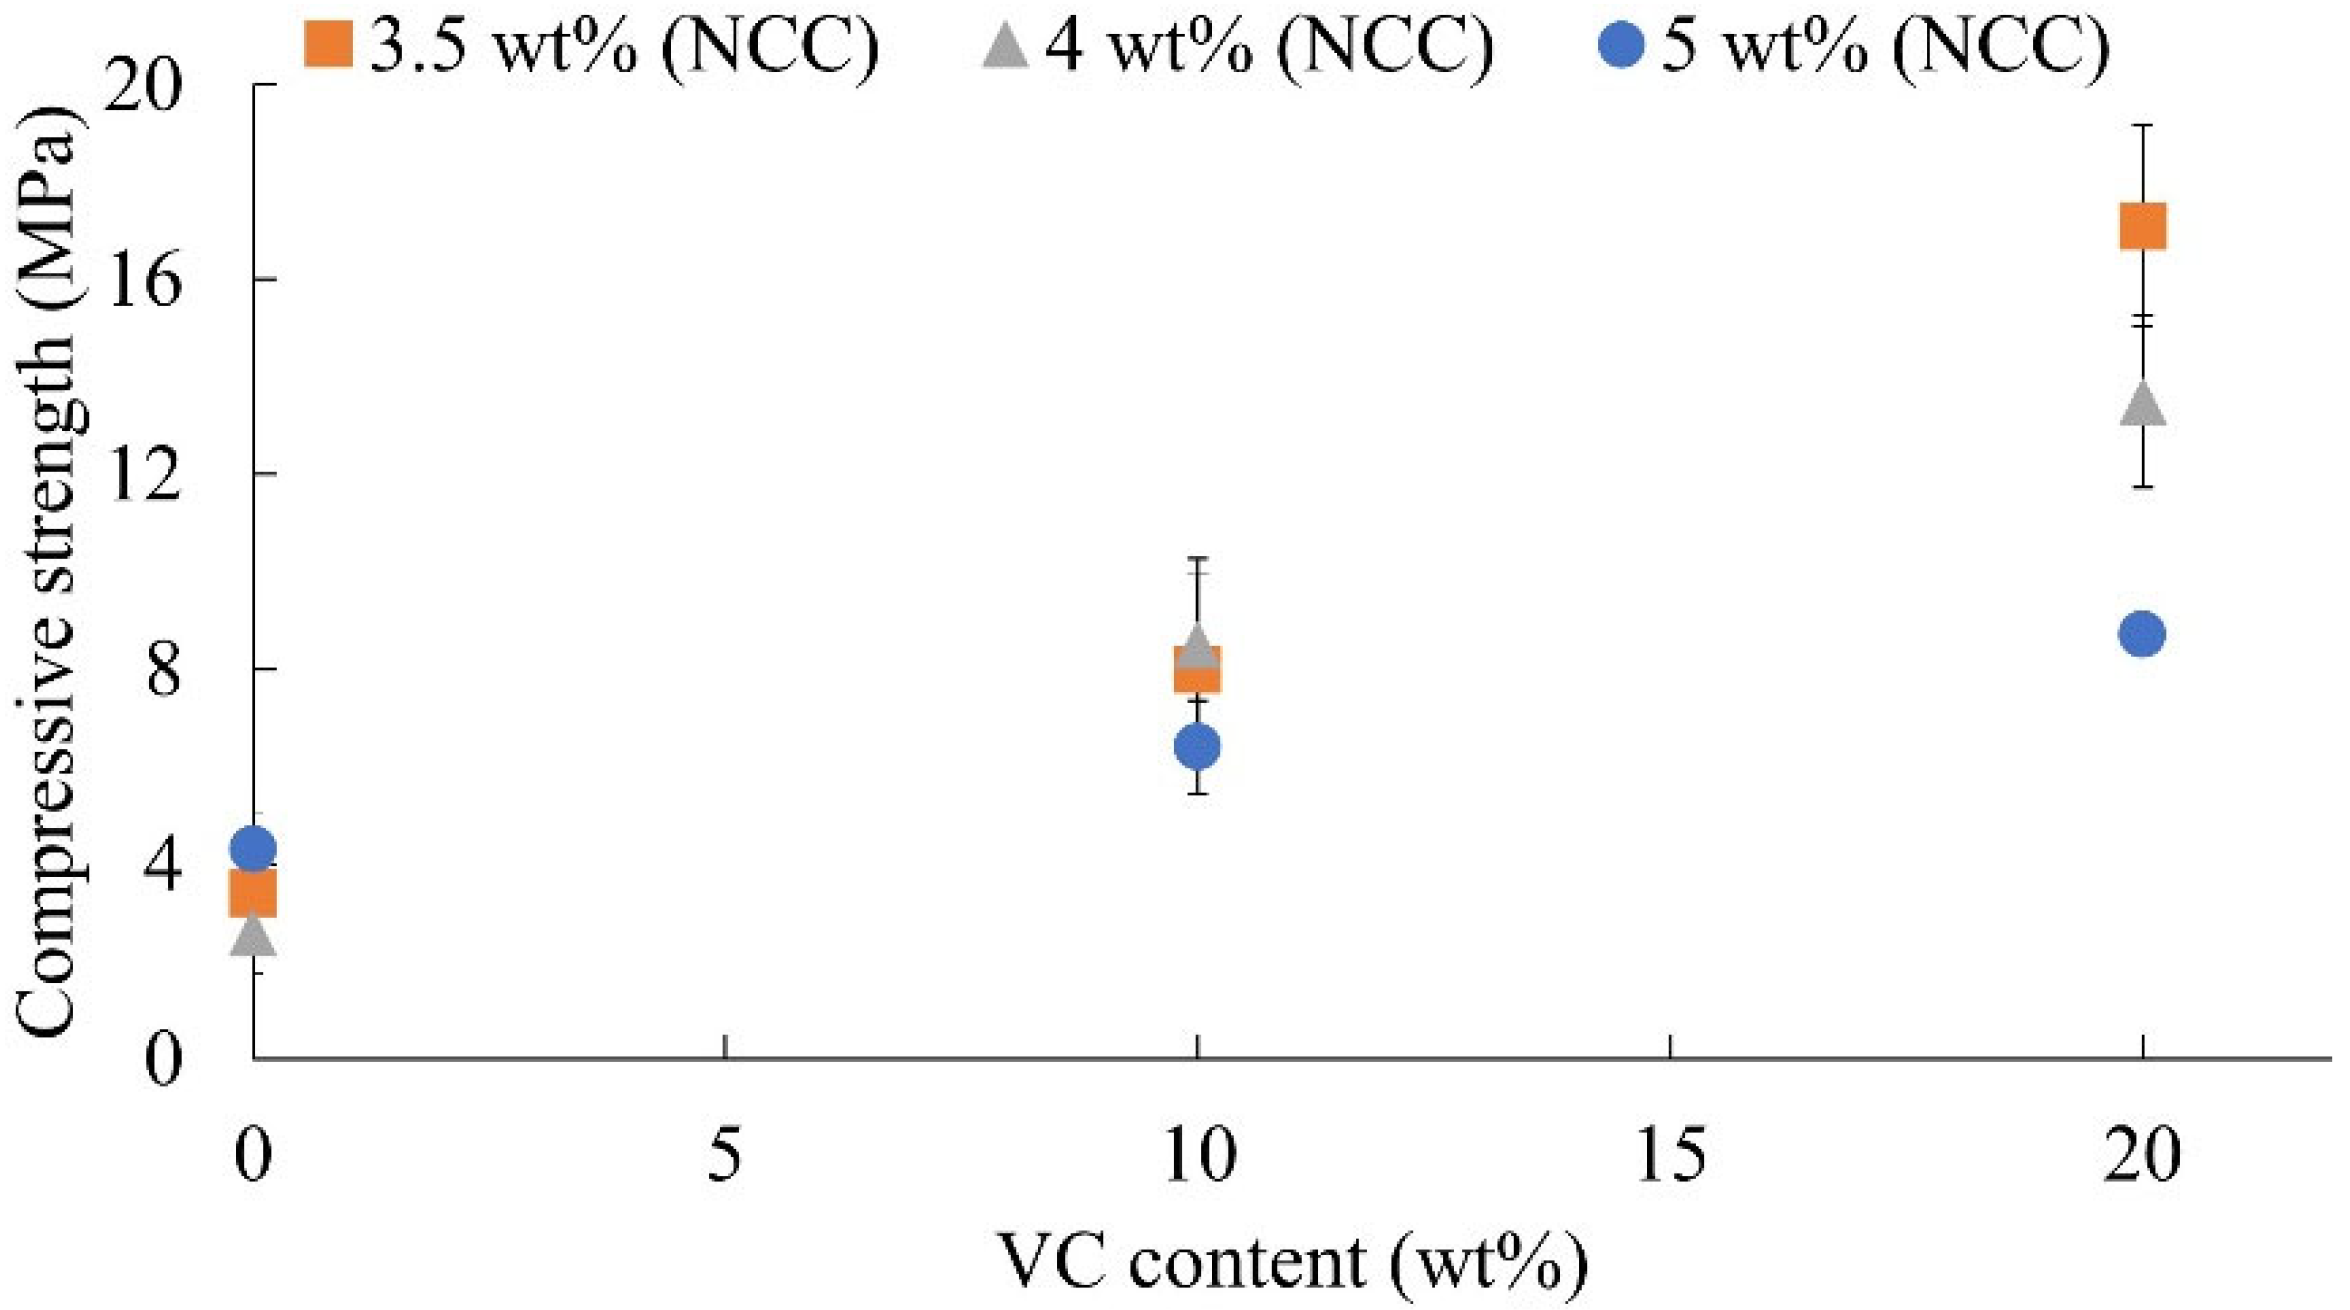
Figure 11 shows the effects of VC and NCC on the compressive strength of the nine sintered samples. Each test was conducted on three samples, resulting in a total of 27 samples across the nine different inks. The error bars shown in Figure 11 represent the standard deviation, calculated based on the variability observed among the three replicates for each condition. At a constant NCC concentration, compressive strength increases almost linearly with VC concentration, which is consistent with the earlier discussion on porosity. The volumetric porosity analysis indicates a downward trend with VC concentration as the NCC content remains constant, suggesting that as the VC content increases, the samples become denser. Consequently, a higher force is required to break these denser samples. However, because of the high volumetric porosity, the compressive strength for the sintered samples is 2–3 orders of magnitude lower than that of a dense ZrC ceramic. In contrast, the effect of NCC concentration on compressive strength is mixed. Large scatter in measured compressive strength and small variations in porosity with NCC may be responsible for this outcome.
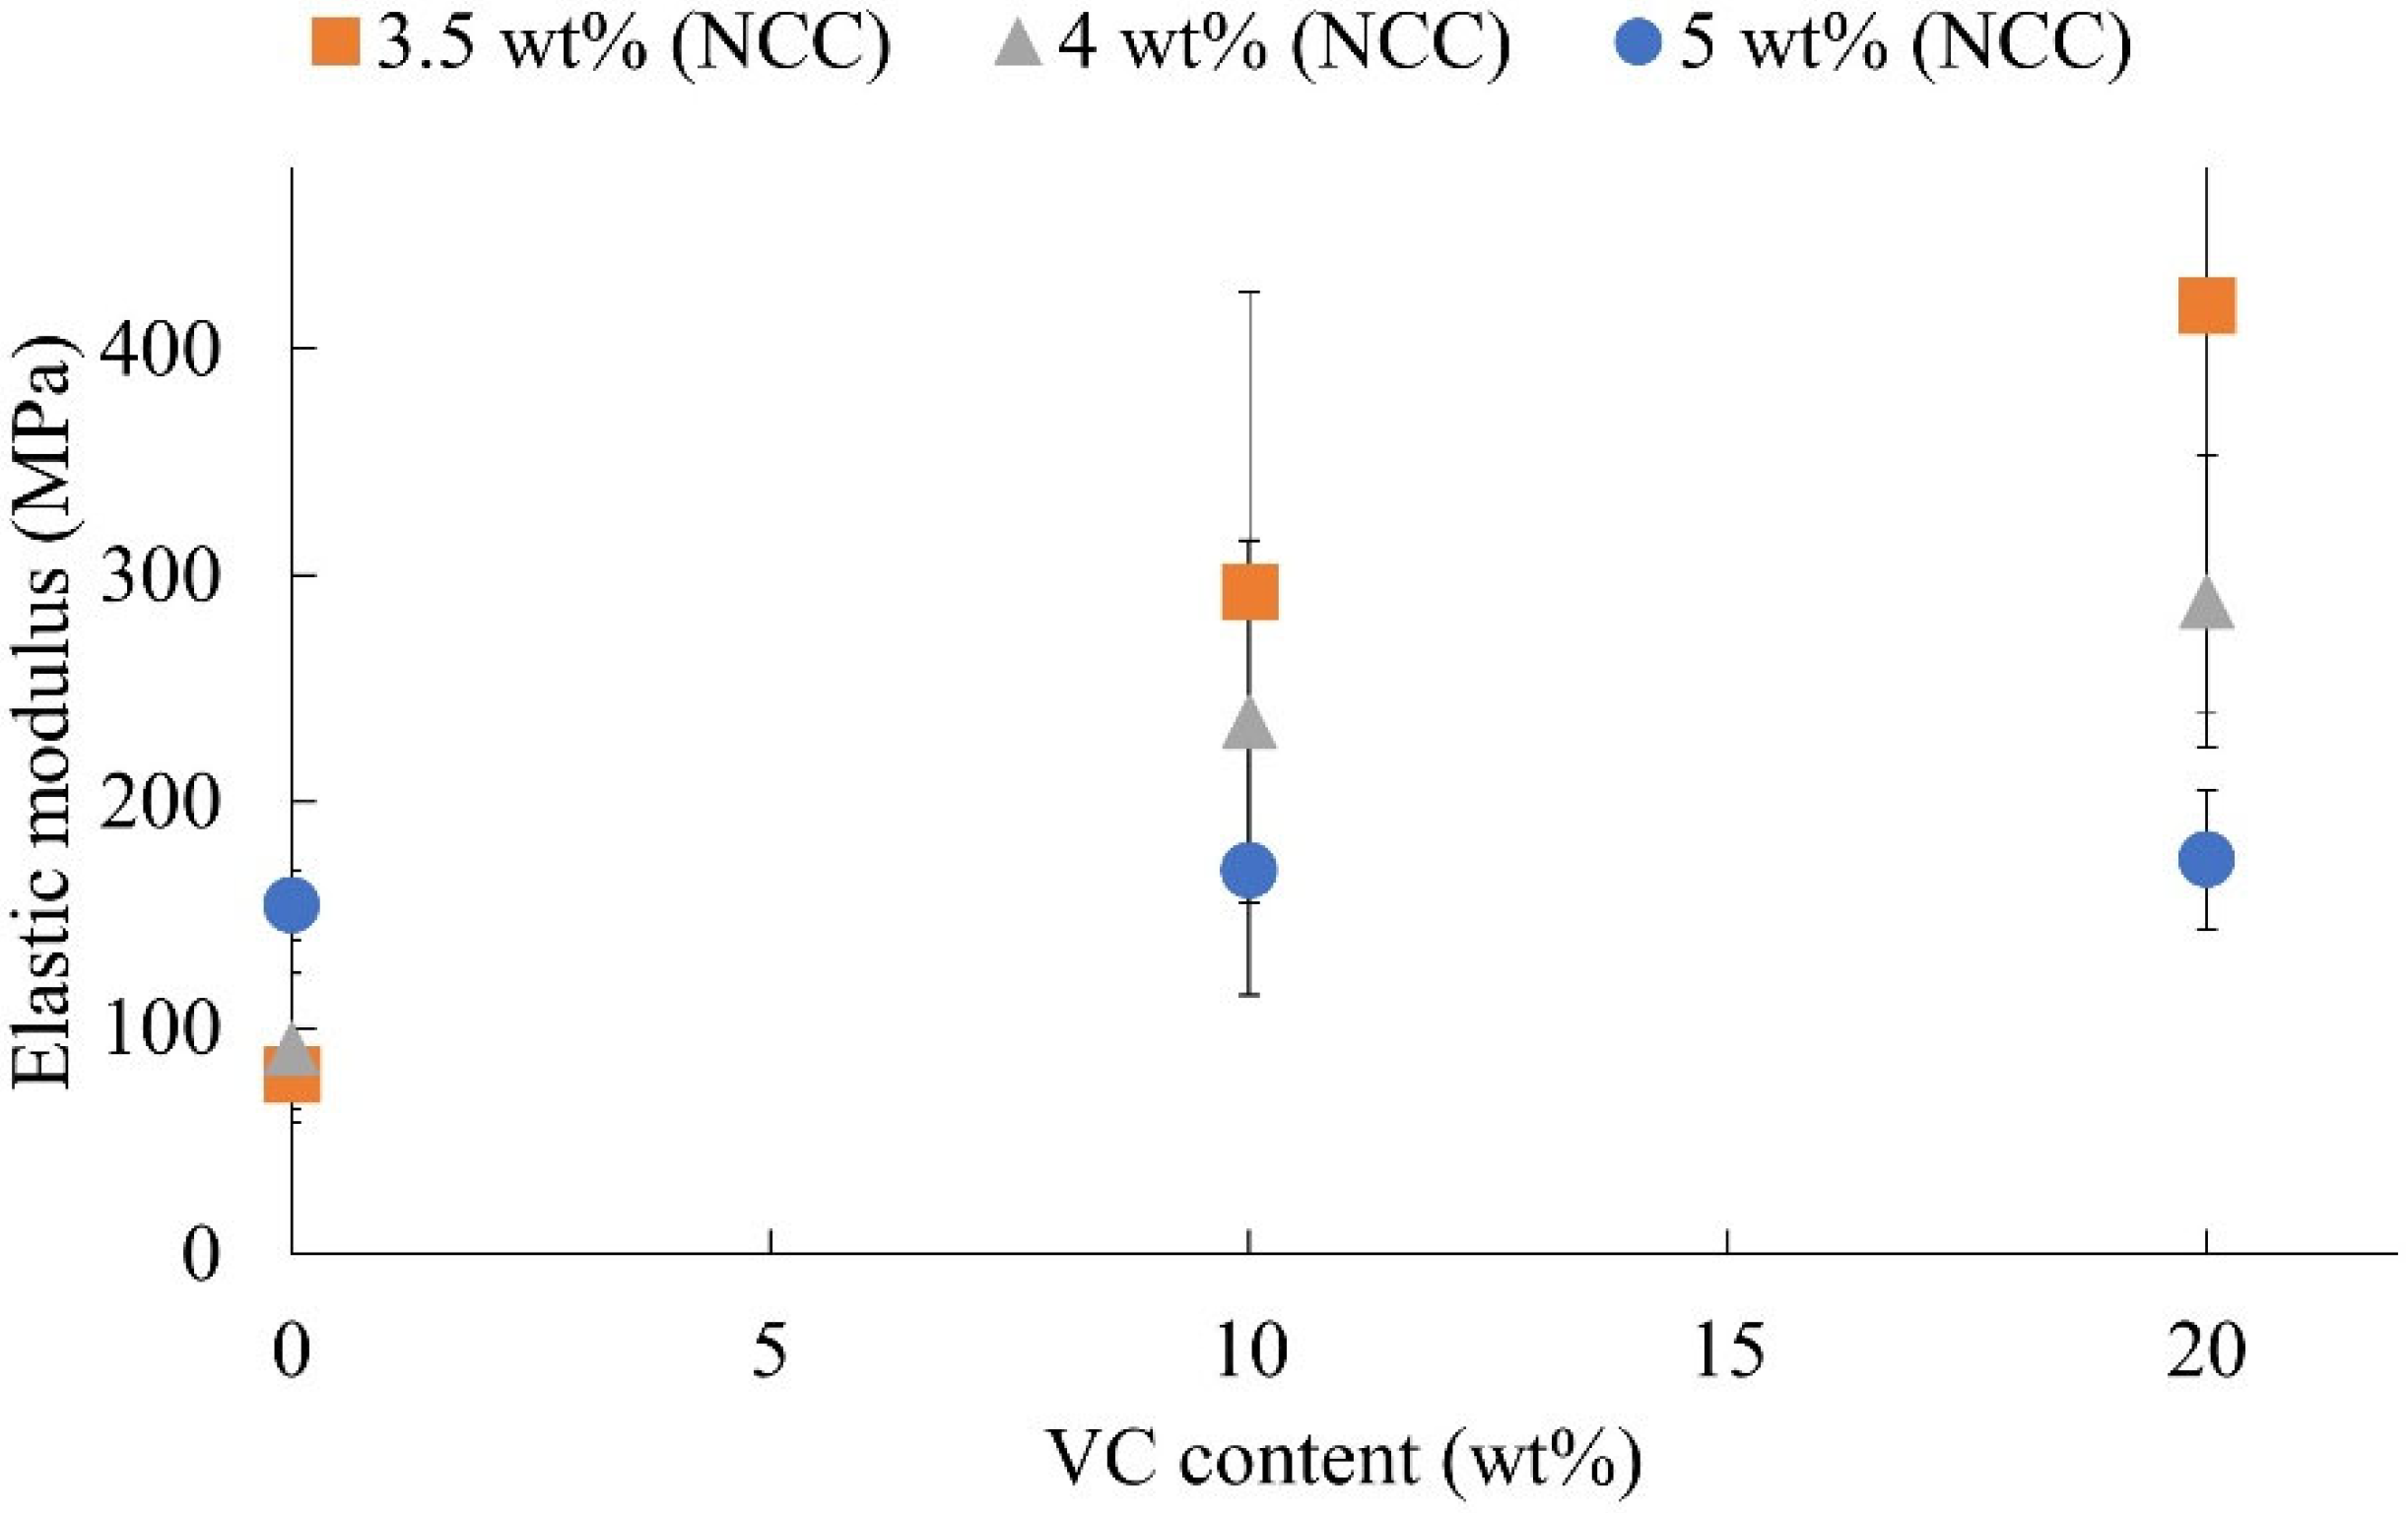
The effects of VC and NCC on the elastic modulus of the nine sintered samples are shown in Figure 12. At constant NCC, the elastic modulus increases with VC concentration because of reduced porosity in the samples with increasing VC. In Figure 3, which compares the storage modulus for the nine inks in groups with the same quantity of NCC, the highest storage modulus corresponds to the inks with the highest quantity of VC. Thus, there is a positive relationship between the storage modulus of an ink and the elastic modulus of the printed sample. When VC is added to an ink, i.e., at 10 or 20 wt%, increasing NCC causes a decrease in elastic modulus. This effect can be attributed to the formation of more pores, but with a more uniform distribution due to the increased water content in the ink. According to Figure 12, the maximum elastic modulus corresponding to the lowest quantity of NCC and the highest quantity of VC is about 400 MPa. Qian et al. [26] reported an elastic modulus of 360 GPa for a ZrC sample with 8% porosity, whereas the current study demonstrated a higher value of 400 GPa for a through-hole structure. At this level, the elastic modulus is about three orders of magnitude lower than that of a dense ZrC ceramic. Hence, the high porosity of the printed samples has a significant impact on their mechanical properties.

3.5. High-Temperature Spark Plasma Sintering

To achieve a high density (e.g., >95% of theoretical density) through rapid sintering of the printed samples, spark plasma sintering (SPS) was attempted to study its feasibility for this purpose. SPS is an efficient sintering technique and utilizes microscopic electrical discharges between particles under pressure, enabling rapid densification to nearly theoretical density [27].
In this study, two samples were made from Ink 1 (the lowest NCC and VC), and one sample was made from Ink 2 (the lowest NCC and 10 wt% VC), all of which were processed using SPS. Initially, every sample was placed inside the SPS chamber. The temperature was ramped at a rate of 100 °C per minute until it reached 700 °C, where the sample was held for 5 min at 15 MPa. This dwell was designed to allow the sample to fully debind. Following this, the temperature ramped again at 100 °C per minute until the final dwell temperature was achieved. Once the sample reached the final dwell temperature, the pressure was loaded to 50 MPa at a rate of 7 MPa/min, and the sample was held under these conditions for an additional 5 min. The pressure loading at the final dwell temperature was applied to maximize the pellet strength before completing the process. Both debinding and sintering were carried out under vacuum. A high DC pulse was applied between the graphite electrodes, while axial pressure was applied simultaneously from the start of the sintering cycle. To prevent the closure of holes in the samples due to the high pressure used in this method, a pencil lead made from 55% graphite and 45% clay was employed. Finally, to soften and remove these pencil leads from the holes, isothermal annealing was performed at 500 or 700 °C for 5 h. The sintering conditions for the three samples are given in Table 6. Figure 13 shows the top, bottom, and side views of the sintered samples after isothermal annealing to remove the pencil leads.
All the three samples largely maintained their geometric integrity after experiencing a significant reduction in height during SPS sintering (Figure 13). Edge chipping occurred, most severely toward the bottom of the samples. A few microcracks are visible on the top surface of Sample 2. These microcracks as well as oxidation occurred during isothermal annealing due to the elevated temperature. The microcracks were likely caused by thermal expansion coefficient mismatch between the graphite in the pencil lead and the sample. A lower annealing temperature was used for the remaining samples to mitigate these issues. Damage to the small holes varies in size and circularity, from a near perfect round to oval/irregular shape. The side view indicates caving in the middle portion, probably due to the friction at the top and bottom contact with the mold.
The linear shrinkage for the four geometric features of the three sintered samples is shown in Figure 14a. The sample height shrank by more than 50%, confirming the previous porosity calculation results. A comparison between Samples 1a and 1b demonstrates that increasing temperature positively impacted shrinkage in overall dimensions due to pore reduction and the formation of close bonds at a higher temperature. The effect of VC on shrinkage can be seen when comparing Samples 1a and 2, with Sample 2 (containing 10 wt% VC) showing greater shrinkage than the pure ZrC sample. The positive impact of VC on sample consolidation after SPS sintering aligns with the shrinkage trend observed in Figure 7 just after drying.
Figure 14b presents the density of the three samples, calculated using Archimedes’ principle and plotted against sintering temperature. Using Sample 1a as a reference, Sample 1b achieved a slightly higher theoretical density (TD) in comparison, due to its higher sintering temperature. In this case, an 8% increase in temperature resulted in a 2% increase in TD, as a higher temperature enhances diffusion at the grain boundaries and thus densification of the sample. A significant increase in TD from 88% to 97% was achieved for Sample 2 with the addition of 10 wt% VC. Since the particle size of VC is smaller than that of ZrC powder, it facilitates rapid diffusion and bonding between VC particles, thus contributing to enhanced consolidation. While Boren et al. [28] reported a maximum TD of 94% for pure ZrC sintered at 2000 °C under 40 MPa, our study achieved a comparable TD of 97% at a lower temperature for Sample 2 with the addition of 10 wt% VC, further emphasizing the role of VC in enhancing densification when incorporated into the slurry formulation.

4. Conclusions

A feasibility study on DIW of ceramic pellets was conducted using ZrC as a matrix material and VC as an additive. The main findings from this work are summarized below.
  • Printing complex structures with multiple holes in a small area requires ink with acceptable printability. Balancing the water and NCC content addressed this issue in this study. While adding VC reduces the recovery time by decreasing both the viscosity and flow point, it also causes deformation, especially in samples with the highest VC content.
  • Increasing VC decreases the ink viscosity and increases linear shrinkage. After drying, the sample height changes the most, and this trend is expected to continue after sintering.
  • Microstructural analysis confirms that increasing both NCC and water content leads to smaller pores. In samples with VC powders, the small particle size of VC filled the interstitial spaces, reducing void size, and consequently improving the mechanical properties. Results from compressive testing revealed that the addition of VC has a beneficial effect on the compressive strength and elastic modulus of the sintered samples.
  • The porosity level remained high for all the nine samples after conventional furnace sintering at 1750 °C. High temperature SPS helps increase the density of the ZrC/VC ceramic structures while maintaining the shape integrity. Achieving a densified structure with a final height of less than 40% of the initial height through spark plasma sintering validates the volumetric porosity calculations, which indicates porosity exceeding 60%.
  • While this study demonstrated the feasibility of DIW of ZrC based ceramic pellets, further research is needed in all aspects of the printing process to show its capacity to produce structurally sound ceramic pallets as well as its economic viability. Also, future efforts will focus on enhanced sintering protocols and radiation stability testing to advance DIW for practical nuclear applications.

Author Contributions

Conceptualization, D.L., T.Y. and S.L.; methodology, D.L. and S.L.; formal analysis, N.M., G.Y. and N.C. (Nathaniel Cavanaugh); investigation, N.M., G.Y., T.P., N.C. (Nathaniel Cavanaugh) and D.Z.; resources, J.L. and J.H.E.; data curation, N.M. and N.C. (Nathaniel Cavanaugh); writing—N.M., G.Y. and N.C. (Nathaniel Cavanaugh); writing—review and editing, J.H.E., N.C. (Nathaniel Cavanaugh), D.L. and S.L.; supervision, B.T., N.C. (Nikhil Churi), T.Y., D.L. and S.L.; project administration, S.L.; funding acquisition, D.L. and S.L. All authors have read and agreed to the published version of the manuscript.

Funding

This material is based upon work supported by National Aeronautics and Space Administration under Cooperative Agreement No. 80NSSC22M0261 and 80NSSC22M0221. Additional support was provided through NASA and Oregon Space Grant Consortium under cooperative agreement No. 80NSSC20M0035.

Data Availability Statement

Relevant data obtained in this study are presented in this article.

Acknowledgments

The authors gratefully acknowledge the use of the Webb Red Devil Furnace (Model RDG-199) with graphite insulation, made available by the Department of Chemical Engineering at Kansas State University, for its critical role in facilitating the experimental work conducted in this study. The purchase of this furnace was made possible by a grant from the Air Force Office of Scientific Research, Award No. FA9550-22-1-0125.

Conflicts of Interest

The authors declare no conflicts of interest.

References

  1. Cárdenas, R.C.A.; Collazos Morales, C.A.; Amaya, J.C.; Castro, F.C.; Mora, C.E.; Gonzalez, R.E.; Simancas-García, J.L.; Meléndez Pertuz, F.A. Review on Nuclear Thermal Propulsion Analysis of Fuel Element and Simulation Methods. In Lecture Notes in Computer Science (Including Subseries Lecture Notes in Artificial Intelligence and Lecture Notes in Bioinformatics); Springer: Berlin/Heidelberg, Germany, 2023. [Google Scholar] [CrossRef]
  2. Supko, E. Nuclear fuel fabrication. In Uranium for Nuclear Power: Resources, Mining and Transformation to Fuel; Woodhead Publishing: Cambridge, UK, 2016. [Google Scholar] [CrossRef]
  3. Hao, S.; Ma, J.; Zhao, X.; Wang, Y.; Zhou, X.; Deng, C. Large-scale production of UO2 kernels by sol–gel process at INET. Nucl. Eng. Des. 2014, 271, 158–161. [Google Scholar] [CrossRef]
  4. Nagarajan, K.; Vaidya, V.N. Sol-gel processes for nuclear fuel fabrication. In Sol-Gel Processing for Conventional and Alternative Energy; Springer: Boston, MA, USA, 2012. [Google Scholar] [CrossRef]
  5. Nelson, A.T. Prospects for additive manufacturing of nuclear fuel forms. Prog. Nucl. Energy 2023, 155, 104493. [Google Scholar] [CrossRef]
  6. Andersson, D.A.; Stanek, C.R.; Matthews, C.; Uberuaga, B.P. The past, present, and future of nuclear fuel. MRS Bull. 2023, 48, 1154–1162. [Google Scholar] [CrossRef]
  7. Guillon, O. Advanced Ceramics for Energy Conversion and Storage; Elsevier: Amsterdam, The Netherlands, 2019. [Google Scholar] [CrossRef]
  8. Marra, J. Advanced ceramic materials for next-generation nuclear applications. In IOP Conference Series: Materials Science and Engineering; IOP Publishing: Bristol, UK, 2011. [Google Scholar] [CrossRef]
  9. Lee, W.E.; Gilbert, M.; Murphy, S.T.; Grimes, R.W.; Green, D.J. Opportunities for Advanced Ceramics and Composites in the Nuclear Sector. J. Am. Ceram. Soc. 2013, 96, 2005–2030. [Google Scholar] [CrossRef]
  10. Watkins, J.K.; Wagner, A.R.; Gonzales, A.; Jaques, B.J.; Sooby, E.S. Challenges and opportunities to alloyed and composite fuel architectures to mitigate high uranium density fuel oxidation: Uranium diboride and uranium carbide. J. Nucl. Mater. 2022, 560, 153502. [Google Scholar] [CrossRef]
  11. Frost, R.T. The carbides of uranium. J. Nucl. Mater. 1963, 10, 265–300. [Google Scholar] [CrossRef]
  12. Greenough, M.M.; Griffiths, R.J.; Ferrier, M.G.; Childs, B.C.; Silva, C.M.; Di Pietro, S.A.; Swift, A.J.; Burks, J.N.; Martin, A.A.; Holliday, K.S.; et al. Formation of uranium oxy-carbide and uranium carbide via conversion of polymer covered uranium dioxide by laser-based thermal processing. J. Nucl. Mater. 2024, 592, 154946. [Google Scholar] [CrossRef]
  13. Taylor, B.; Emrich, B.; Tucker, D.; Barnes, M.; Donders, N.; Benensky, K. Study of a tricarbide grooved ring fuel element for nuclear thermal propulsion. In Nuclear and Emerging Technologies for Space; The American Nuclear Society: Downers Grove, IL, USA, 2016; NETS 2018. [Google Scholar]
  14. Kumar, D.; Singh, K. High hardness-high toughness WC-20Co nanocomposites: Effect of VC variation and sintering temperature. Mater. Sci. Eng. A 2016, 663, 21–28. [Google Scholar] [CrossRef]
  15. Roy, R. New Processes as Drivers for Revolutions in Materials Research. In Materials Science and Engineering Serving Society; Elsevier Science BV: Amsterdam, The Netherlands, 1998. [Google Scholar] [CrossRef]
  16. Nelson, A.T. Features that Further Performance Limits of Nuclear Fuel Fabrication: Opportunities for Additive Manufacturing of Nuclear Fuels; Oak Ridge National Laboratory (ORNL): Oak Ridge, TN, USA, 2019. Available online: http://www.osti.gov/biblio/1669784 (accessed on 3 November 2024).
  17. Chen, Z.; Li, Z.; Li, J.; Liu, C.; Lao, C.; Fu, Y.; Liu, C.; Li, Y.; Wang, P.; He, Y. 3D printing of ceramics: A review. J. Eur. Ceram. Soc. 2019, 39, 661–687. [Google Scholar] [CrossRef]
  18. Saadi, M.A.S.R.; Maguire, A.; Pottackal, N.T.; Thakur, S.H.; Ikram, M.M.; Hart, A.J.; Ajayan, P.M.; Rahman, M.M. Direct Ink Writing: A 3D Printing Technology for Diverse Materials. Adv. Mater. 2022, 34, e2108855. [Google Scholar] [CrossRef] [PubMed]
  19. Bergeron, A.; Crigger, J. Early progress on additive manufacturing of nuclear fuel materials. J. Nucl. Mater. 2018, 508, 344–347. [Google Scholar] [CrossRef]
  20. Schappel, D.; Linton, K.D.; Helmreich, G.W.; Keever, T.J.; Petrie, C.M. Failure analysis of nuclear transient-tested UN tristructural isotropic fuel particles in a 3D printed SiC matrix. J. Nucl. Mater. 2023, 586, 154691. [Google Scholar] [CrossRef]
  21. Rau, D.A.; Williams, C.B.; Bortner, M.J. Rheology and printability: A survey of critical relationships for direct ink write materials design. Prog. Mater. Sci. 2023, 140, 101188. [Google Scholar] [CrossRef]
  22. Duffy, J. The physical characteristics of dispersed particles have a large impact on overall rheological properties. Chem. Eng. 2015, 122, 34–39. [Google Scholar]
  23. Del-Mazo-Barbara, L.; Ginebra, M.-P. Rheological characterisation of ceramic inks for 3D direct ink writing: A review. J. Eur. Ceram. Soc. 2021, 41, 18–33. [Google Scholar] [CrossRef]
  24. Li, W.; Olevsky, E.A.; Khasanov, O.L.; Back, C.A.; Izhvanov, O.; Opperman, J.; Khalifa, H.E. Spark plasma sintering of agglomerated vanadium carbide powder. Ceram. Int. 2015, 41, 3748–3759. [Google Scholar] [CrossRef]
  25. Sabata, C.; Martin, A.J.; Watts, J.L.; Hilmas, G.E. Development of a highly loaded zirconium carbide paste for material extrusion additive manufacturing. J. Eur. Ceram. Soc. 2025, 45, 116881. [Google Scholar] [CrossRef]
  26. Qian, J.; Wu, C.-Y.; Gong, H.-R. Phase transition, thermodynamic and elastic properties of ZrC. Trans. Nonferrous Met. Soc. China 2018, 28, 2520–2527. [Google Scholar] [CrossRef]
  27. Yamazaki, K.; Risbud, S.; Aoyama, H.; Shoda, K. PAS (Plasma activated sintering): Transient sintering process control for rapid consolidation of powders. J. Mech. Work. Technol. 1996, 56, 955–965. [Google Scholar] [CrossRef]
  28. Ke, B.; Ji, W.; Zou, J.; Wang, W.; Fu, Z. Densification mechanism, microstructure and mechanical properties of ZrC ceramics prepared by high-pressure spark plasma sintering. J. Eur. Ceram. Soc. 2023, 43, 3053–3061. [Google Scholar] [CrossRef]
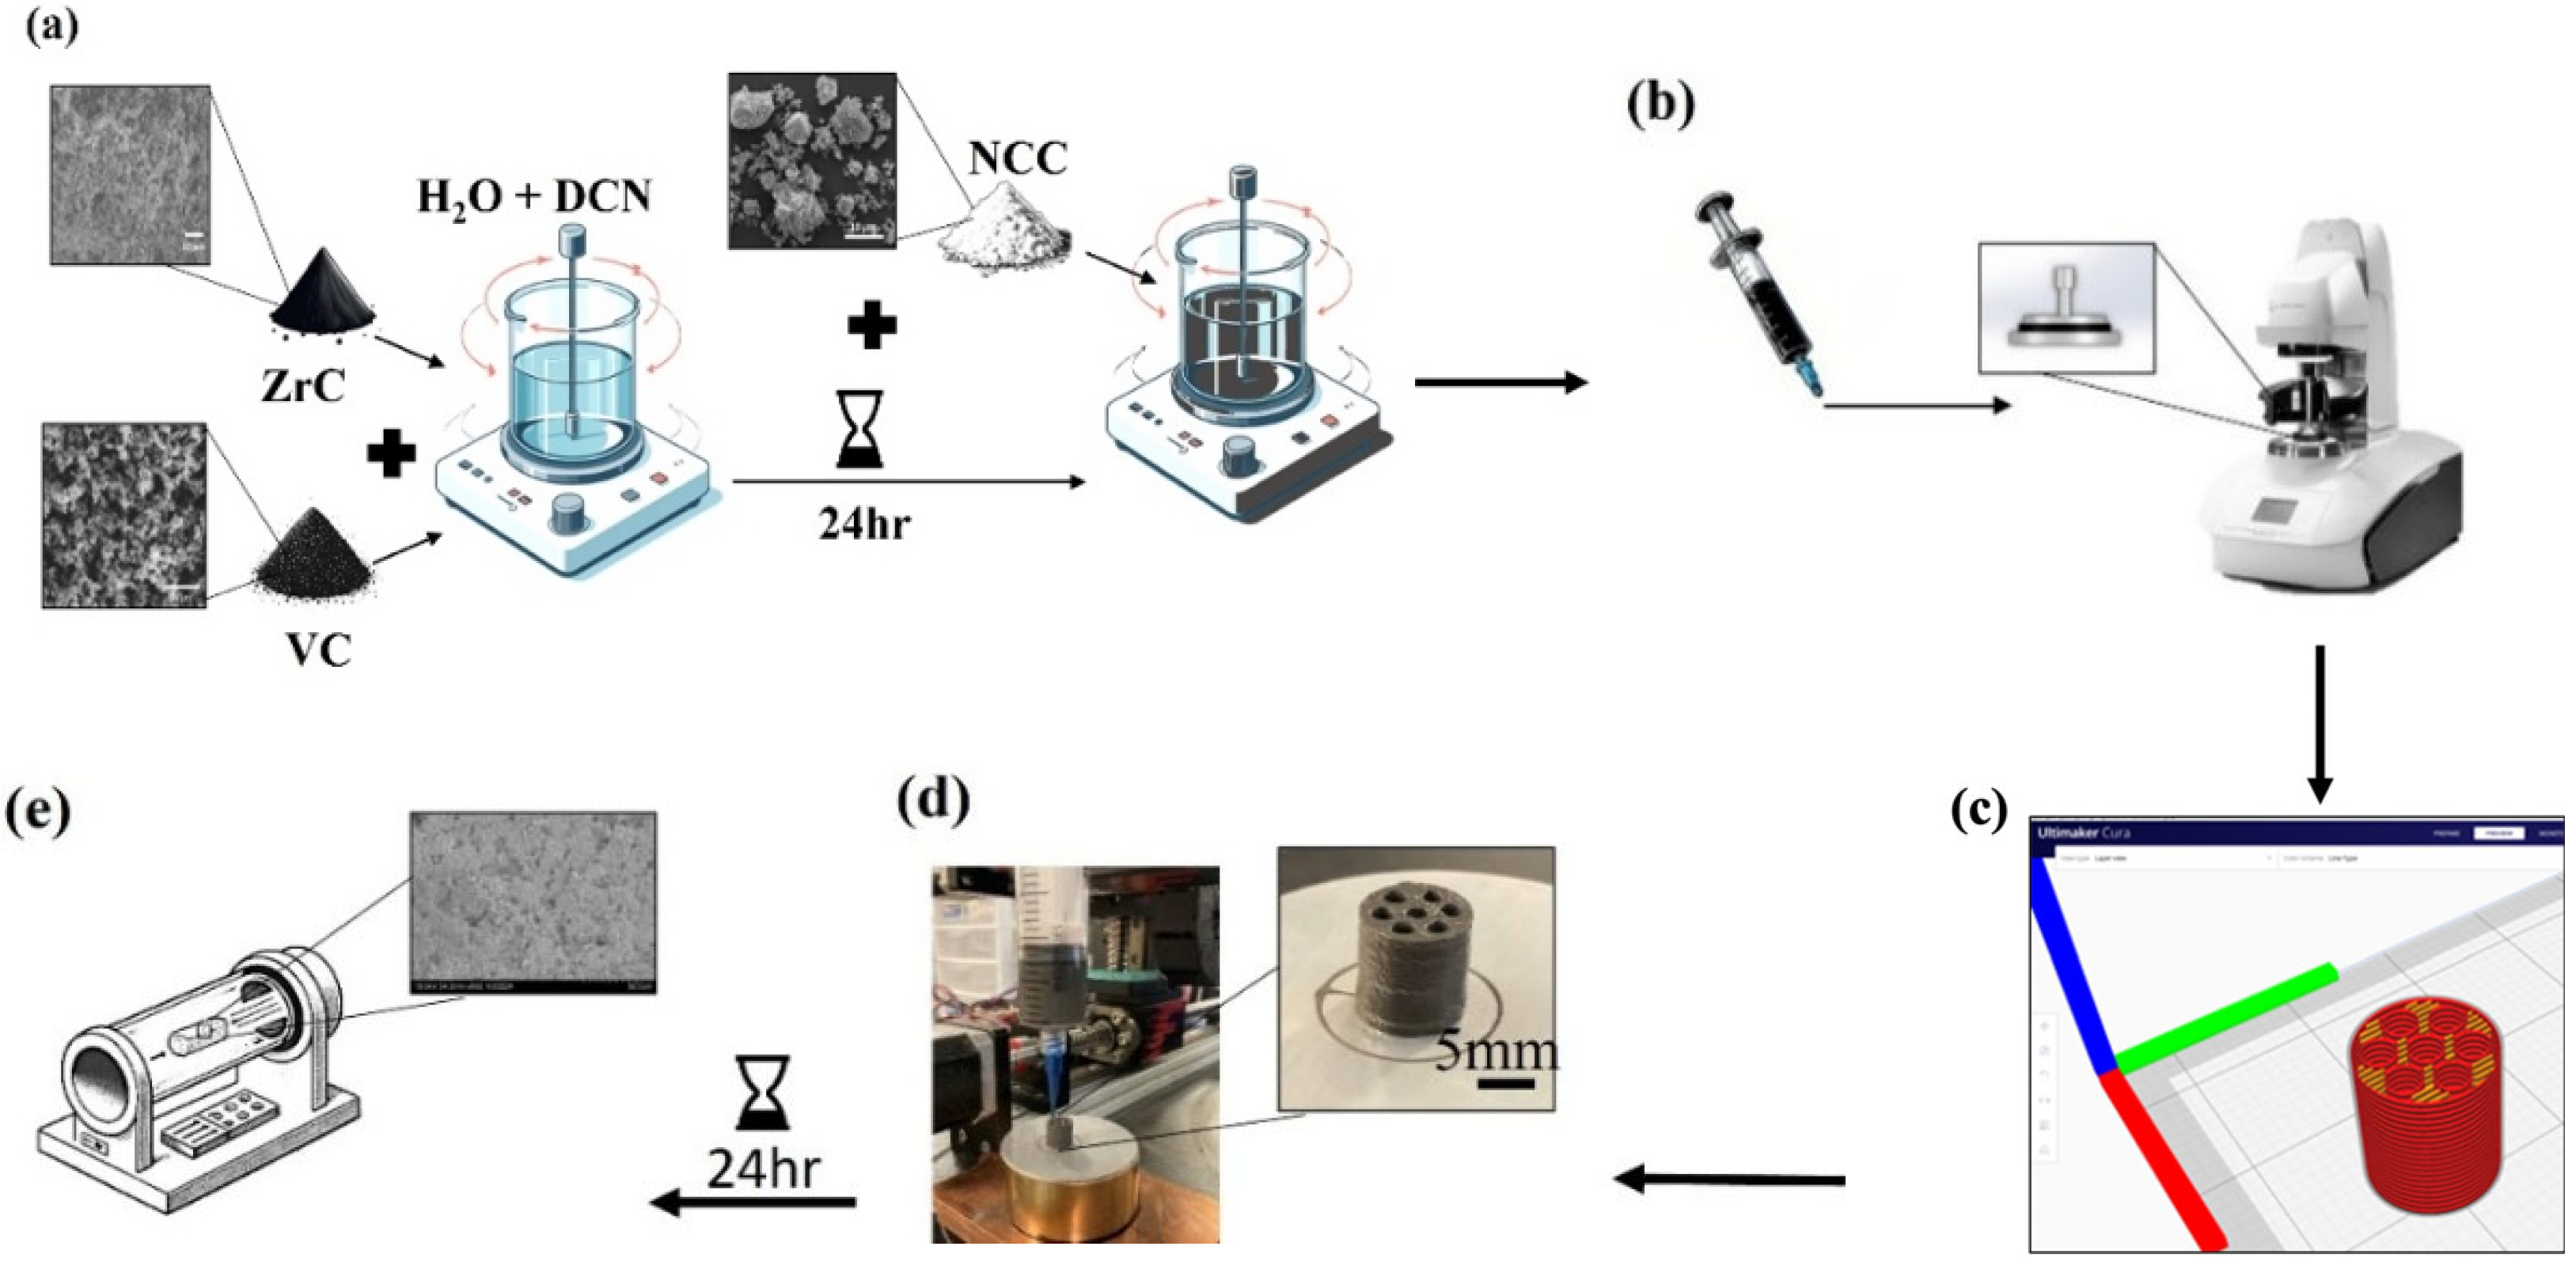
Figure 1. Direct ink writing (DIW)-based ceramic pellet fabrication process: (a) Ink preparation. (b) Ink evaluation. (c) Structural design. (d) 3D printing. (e) Sintering.
Jmmp 09 00270 g001
Figure 2. Three different regions for Ink 1 (lowest NCC and VC content), identified using an amplitude sweep test.
Jmmp 09 00270 g002
Figure 3. Effect of VC on the storage modulus and loss modulus of different inks: (a) 3.5 wt% NCC. (b) 4 wt% NCC. (c) 5 wt% NCC.
Jmmp 09 00270 g003
Figure 4. Effect of NCC on the storage modulus and loss modulus of different inks: (a) 0 wt% VC. (b) 10 wt% VC. (c) 20 wt% VC.
Jmmp 09 00270 g004
Figure 5. Results of the 3ITT test for the different inks: (a) 3.5 wt% NCC. (b) 4 wt% NCC. (c) 5 wt% NCC.
Jmmp 09 00270 g005
Figure 6. Optical images of the nine printed samples after drying at room temperature: (a) Side view. (b) Top view. The numbers indicate the samples associated with each slurry.
Jmmp 09 00270 g006
Figure 7. Shrinkage calculated for the nine samples: (a) Height shrinkage. (b) Top diameter shrinkage. (c) Hole diameter shrinkage. (d) Bottom diameter shrinkage.
Jmmp 09 00270 g007
Figure 8. (a) SEM images of the nine different samples. The dashed circle indicates a reduction in pores size associated with increasing NCC and water content. The solid circle highlights grain size, showing that the increase in VC improved uniformity and reduced the grain size. (b) Binary pore masks derived from the SEM micrographs in (a).
Jmmp 09 00270 g008
Figure 9. Volumetric porosity for various ink conditions.
Jmmp 09 00270 g009
Figure 10. Stress-strain curve from uniaxial compressive test for Sample 1 (lowest NCC and VC content).
Jmmp 09 00270 g010
Figure 11. Compressive strength of different ink conditions.
Jmmp 09 00270 g011
Figure 12. Elastic modulus of various ink conditions.
Jmmp 09 00270 g012
Figure 13. Optical images of three samples after SPS sintering and pencil lead removal, showing top, bottom, and side views from left to right, respectively. (a) Sample 1a sintered under 1800 °C. (b) Sample 1b sintered under 1950 °C. (c) Sample 2 sintered under 1800 °C.
Jmmp 09 00270 g013
Figure 14. (a) Shrinkage and (b) TD calculated for the three samples.
Jmmp 09 00270 g014
Table 1. Nine distinct inks with changing additives.
Ink #ZrC (wt%)NCC (wt%)VC (wt%)DC_N(wt%)Water (wt%)
1683.50128
2583.510128
3483.520128
46640129
556410129
646420129
76350131
853510131
943520131
Table 2. Parameters set for the DIW printing process.
ParametersValue
Layer height0.25 mm
Line width0.5 mm
Infill density99%
Nozzle diameter0.41 mm
Infill direction90°
Hole horizontal expansion0.15 mm
Table 3. Flow point and recovery time gained from the amplitude sweep test and 3ITT test for each of the nine different inks.
Ink NumberFlow Point (Pa)Recovery Time (s)
3.5 wt% NCC & 0 wt% VC3906.7
3.5 wt% NCC & 10 wt% VC3601.2
3.5 wt% NCC & 20 wt% VC3651.6
4 wt% NCC & 0 wt% VC4002.6
4 wt% NCC & 10 wt% VC3001.2
4 wt% NCC & 20 wt% VC4001.5
5 wt% NCC & 0 wt% VC7503.8
5 wt% NCC & 10 wt% VC4202.1
5 wt% NCC & 20 wt% VC6603.1
Table 4. Radius of curvature and standard deviations for nine distinct samples.
Ink NumberRadius of Curvature (mm)STD
3.5 wt% NCC & 0 wt% VC4.650.27
3.5 wt% NCC & 10 wt% VC4.80.25
3.5 wt% NCC & 20 wt% VC5.20.45
4 wt% NCC & 0 wt% VC4.70.35
4 wt% NCC & 10 wt% VC5.00.41
4 wt% NCC & 20 wt% VC5.20.52
5 wt% NCC & 0 wt% VC4.80.48
5 wt% NCC & 10 wt% VC5.00.41
5 wt% NCC & 20 wt% VC5.20.55
Table 5. Average grain size (µm) as a function of NCC and VC content in the sintered samples.
NCC (wt%)VC (0 wt%) VC (10 wt%)VC (20 wt%)
3.553.853.7
46.245.741.12
53.83.51.28
Table 6. Spark plasma sintering conditions.
SampleMaterialSinteringAnnealing Condition
Temperature (°C)Pressure (MPa)Time
(min)
Temperature
(°C)
Time
(h)
1aZrC + 3.5 wt% NCC18005055005
1bZrC + 3.5 wt% NCC19505055005
2ZrC + 10 wt% VC + 3.5 wt% NCC18005057005
Disclaimer/Publisher’s Note: The statements, opinions and data contained in all publications are solely those of the individual author(s) and contributor(s) and not of MDPI and/or the editor(s). MDPI and/or the editor(s) disclaim responsibility for any injury to people or property resulting from any ideas, methods, instructions or products referred to in the content.