Article

Effects of Ultrasonic Vibration Intensity and Initial Powder Amount in the Hopper on Powder Dispensing Rate in Binder Jetting Additive Manufacturing

1
Department of Industrial & Systems Engineering, Texas A&M University, College Station, TX 77843, USA
2
Saint-Gobain Research North America, Northborough, MA 01532, USA
*
Author to whom correspondence should be addressed.
J. Manuf. Mater. Process. 2025, 9(8), 268; https://doi.org/10.3390/jmmp9080268 (registering DOI)
Submission received: 7 July 2025 / Revised: 5 August 2025 / Accepted: 7 August 2025 / Published: 9 August 2025

Abstract

In binder jetting additive manufacturing (BJAM), parts are fabricated layer by layer by depositing a liquid binder on selected regions of the powder bed. Powder particles in the hopper of the printer are dispensed onto the powder bed to form a layer of powder. Powder dispensing rate affects material usage and print quality. Too high dispensing rates can cause excessive powder dispensing, increasing powder waste, while too low dispensing rates may result in incomplete layer formation, leading to reduced density of printed parts. The present study investigates how ultrasonic vibration intensity and initial powder amount in the hopper affect powder dispensing rate in BJAM when using a bimodal powder. A set of experiments with full factorial design were conducted using three levels of ultrasonic vibration intensity (50%, 75%, and 100%) and three levels of initial powder amount (600 g, 1000 g, and 1400 g) in the hopper. The results show that both ultrasonic vibration intensity and initial powder amount, as well as their interaction, significantly influence powder dispensing rate. Powder dispensing rate was higher when ultrasonic vibration intensity was higher or initial powder amount was smaller. Increasing initial powder amount from 600 to 1400 g, resulted in a much bigger decrease in powder dispensing rate when ultrasonic vibration intensity was 50% than when ultrasonic vibration intensity was 100%.

1. Introduction

In binder jetting additive manufacturing (BJAM), a liquid binder is used to selectively create bonds between adjacent particles of the powder bed to print green parts [1,2]. It can fabricate parts from a wide range of materials, including polymer, metal, ceramic, and composite materials [3,4]. Compared with subtractive methods, BJAM minimizes material waste that typically results from cutting away some bulk material [5]. In comparison with other powder bed additive manufacturing technologies (such as powder bed fusion), BJAM operates at the room temperature without the need for high-energy beams and consumes lower energy [6,7].
The basic steps (powder dispensing, powder spreading, and depositing liquid binder) of binder jetting with a hopper-based powder dispensing system assisted by ultrasonic vibration are described in a previously published paper [8]. Powder dispensing and powder spreading are performed simultaneously in the printer used for the experiment [2]. In the powder dispensing step, feedstock powder is dispensed from the hopper onto the build platform to prepare a new layer of powder. At the bottom of the hopper is attached a screen through which powder is dispensed [9]. Ultrasonic vibration is applied on the hopper to promote continuous dispensing [10,11,12]. During the powder spreading step, a roller spreads the dispensed powder across the build platform and pushes any extra powder (that is above the pre-determined layer thickness) to the side of the build platform [9].
Too high dispensing rates may result in excessive powder dispensing and cause unnecessary powder to be spread across the build platform [9,13]. Although this powder is typically collected and reused, additional processing steps (such as powder retrieval, sieving, and re-blending) and additional cost are needed to maintain flowability and uniformity of the powder for re-use. This problem is magnified when dealing with expensive feedstock powders (such as diamond, silicon carbide, and titanium) or bimodal powders (mixed powders containing two types of particles of different sizes and/or properties) [5]. On the other hand, too low dispensing rates may cause an insufficient amount of powder in front of the roller, resulting in incomplete or uneven layer formation [6,14], which can cause low density and defects (such as cracks) in printed parts. Therefore, maintaining proper dispensing rate is essential to balance print quality and powder utilization.
Reported relevant studies have investigated the effects of powder dispensing variables on the quality of powder bed and properties (including green density and mechanical strength) of printed parts [14,15]. However, in these investigations, neither powder dispensing rate nor the actual amount of dispensed powder was directly measured. One reported study investigated the effects of ultrasonic mode, intensity, and initial powder amount on powder dispense rate using a commercial ultrasonic hopper system [9]. However, in this reported study, one variable was changed at a time rather than employing a full factorial design, unable to reveal interaction effects of these variables. The present study aims to fill the knowledge gap in the literature by investigating the effects of ultrasonic vibration intensity and initial powder amount on powder dispensing rate, including the interaction effect between these two variables, through experiments with a full factorial design using a bimodal powder.
This paper starts with an introduction, followed by Section 2, which outlines the materials and methods utilized in this study. Section 3 presents the main effects and interaction effect of ultrasonic vibration intensity and initial powder amount on dispensing rate. Finally, Section 4 summarizes key conclusions derived from the study.

2. Materials and Methods

2.1. Feedstock Powder

In this study, a mixture of Powder A and Powder B (with a weight ratio of 7:3) was used. Table 1 contains information regarding Powder A and Powder B. Other information (including SEM images) about Powder A and Powder B can be found in a previously published paper [16].

2.2. Design of Experiments

In this study, 32 (two variables, three levels, and nine conditions) full factorial design was used. Many reported studies have employed full-factorial designs to evaluate both the main effects and interaction effects of input variables on response variables [16,17]. In this study, the two input variables were ultrasonic vibration intensity and initial powder amount in the hopper. Table 2 displays the values of the variables at each level. Three replications were conducted under each experimental condition. Minitab software (version 2022) was used to create the randomized run order. Table 3 shows the matrix of experiments with experimental data. “Experiment order” refers to the sequence in which experimental conditions appear in the table according to the full factorial design matrix, while “Run order” represents the randomized sequence in which the experiments were conducted. The coded values (−1, 0, +1) indicate the low, medium, and high levels of the two input variables (ultrasonic vibration intensity and initial feedstock powder amount).

2.3. Experimental Procedure of Dispensing Feedstock Powder from the Hopper

The ExOne Innovent+ binder jetting 3D printer was used, which has a hopper-based powder dispensing system assisted by ultrasonic vibration. Figure 1 shows the geometry and dimensions of the customized hopper made from plastics.
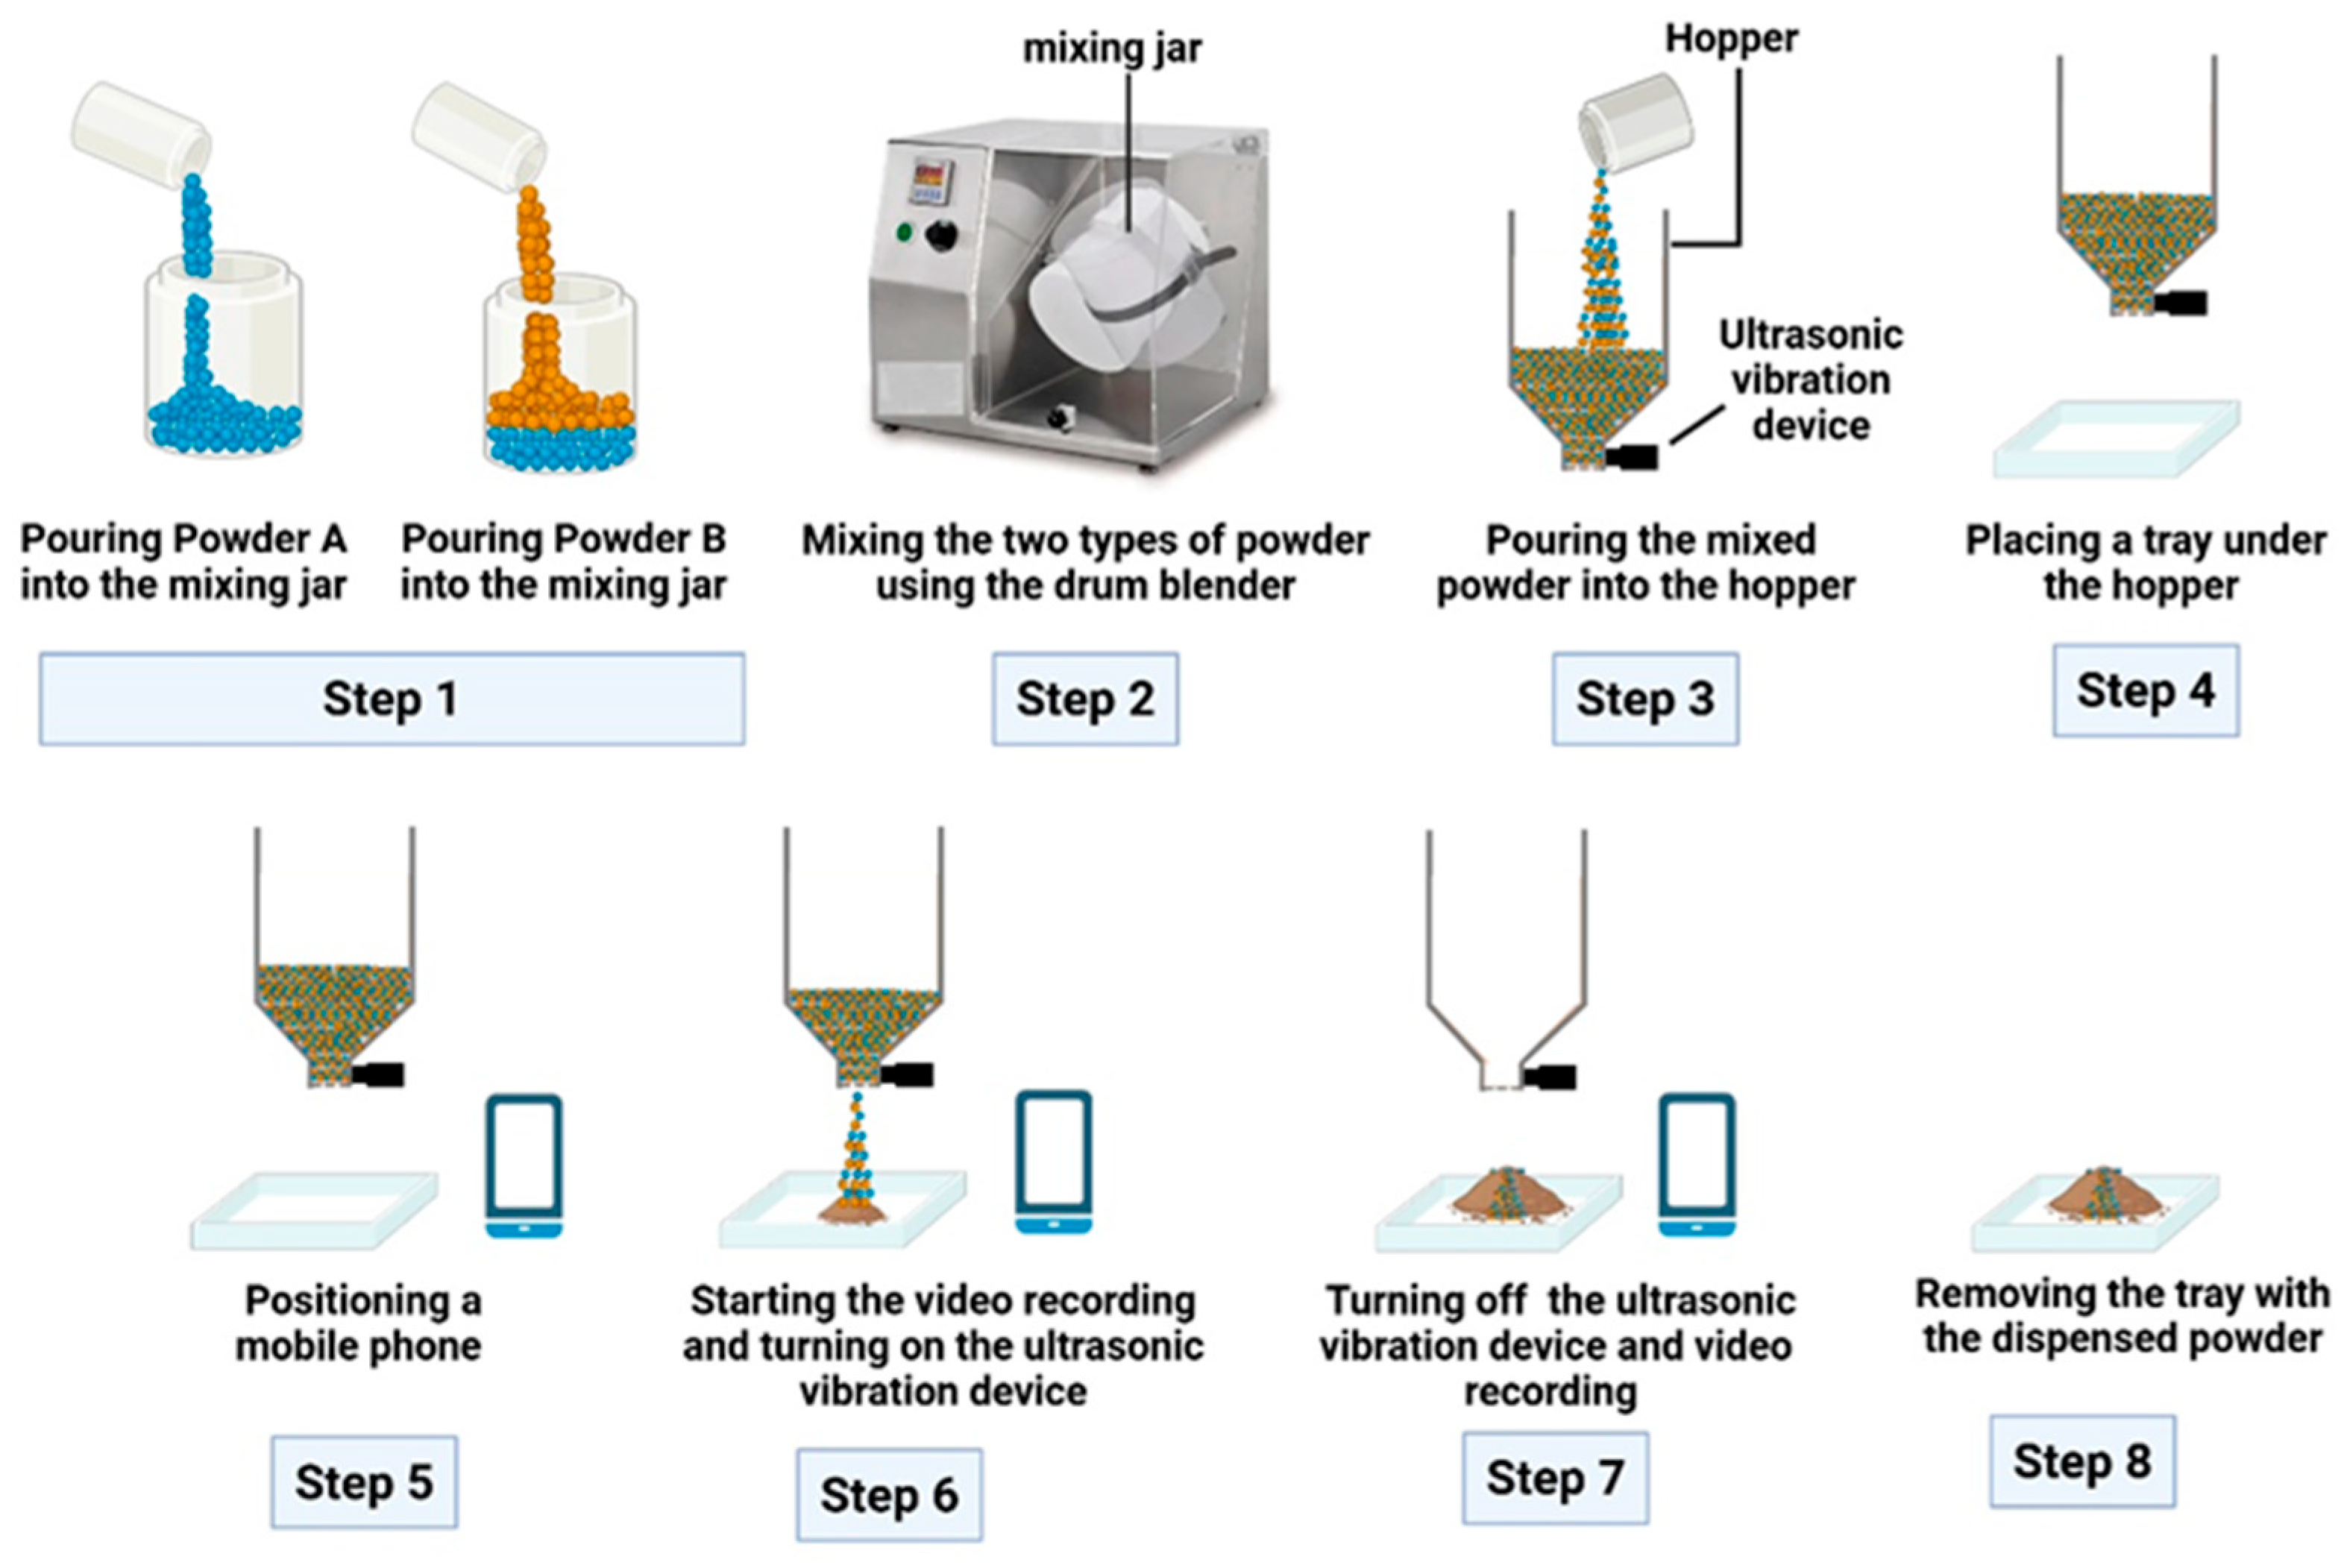
The step-by-step experimental procedure is illustrated in Figure 2 and described below.
Step 1: An amount of 980 g of Powder A and 420 g of Powder B (with a weight ratio of 7:3) were added to a mixing jar of the drum blender (Mixomat mini, Fuchs Maschinen AG, Granges-Paccot, Switzerland). Then, the mixing jar was placed inside the drum blender.
Step 2: Two types of powder were mixed for 10 min using the drum blender at a mixing speed of 80 rpm. After mixing, the mixing jar was gently removed from the drum blender without causing any disturbance to the mixed powder.
Step 3: The entire amount of mixed powder was carefully poured into the hopper.
Step 4: A tray (12′′L × 8′′W × 1′′D) was placed under the hopper to collect the dispensed powder during the dispensing process.
Step 5: A mobile phone was positioned to record the powder dispensing operation.
Step 6: The video recording was started, followed by turning on the ultrasonic vibration device of the hopper set at 100% intensity to initiate powder dispensing.
Step 7: After dispensing all powder into the tray, the ultrasonic vibration device was turned off, and the video recording was stopped.
Step 8: The tray was removed from the bottom of the hopper.
The above steps were repeated for other conditions listed in Table 2. Dispensing time was measured using a video recorded by a smartphone at 30 frames per second, providing a time resolution of 0.033 s per frame. Start time and end time were determined by visually identifying the starting and ending of powder flow. The estimated measurement uncertainty was ±1 frame (±0.033 s). No external calibration was performed, but internal timestamps and frame counts were consistent, ensuring sufficient accuracy for this study.

2.4. Measurement of Dispensing Rate

The dispensing rate (Rd) was calculated by dividing the initial powder amount (Pi) by the measured dispensing time (t), using Equation (1).
R d = P i t
The dispensing time was determined from the video (recorded following the procedure described in the previous section), measured as the duration between the beginning (first visible powder dispensed) and the end of the dispensing process. The values of dispensing time used in the calculation were rounded up to 0.001 s, and the values of dispensed amount of powder were rounded up to 0.01 g. Potential sources of error include balance accuracy (±0.01 g), timing precision (±0.1 s), and residual powder or powder loss during transfer.

3. Results and Discussion

Statistical analysis was conducted using the data presented in Table 3. To evaluate whether the data followed a normal distribution, the Shapiro–Wilk test was applied. The test result indicated that the data were normally distributed. Based on this, a two-way ANOVA was conducted. Table 4 shows the ANOVA table. At the significance level of 0.05 (α = 0.05), the effects of ultrasonic vibration intensity and initial powder amount are statistically significant. Moreover, the interaction effect of ultrasonic vibration intensity and initial powder amount is significant at the significance level of 0.05. Tukey’s Honestly Significant Difference (HSD) test was used as the mean pair comparison to evaluate the statistical significance of the differences between variable levels. Table 5 and Table 6 present the p-values from the mean pair comparison test for the effects of ultrasonic vibration intensity and the effects of initial powder amount, respectively. For the significance level of 0.05, a p-value less than 0.05 indicates a statistically significant difference between the means.
The OriginPro software, version 2024b, was used to generate both the main effect plots and the interaction effect plot.

3.1. Main Effect of Ultrasonic Vibration Intensity

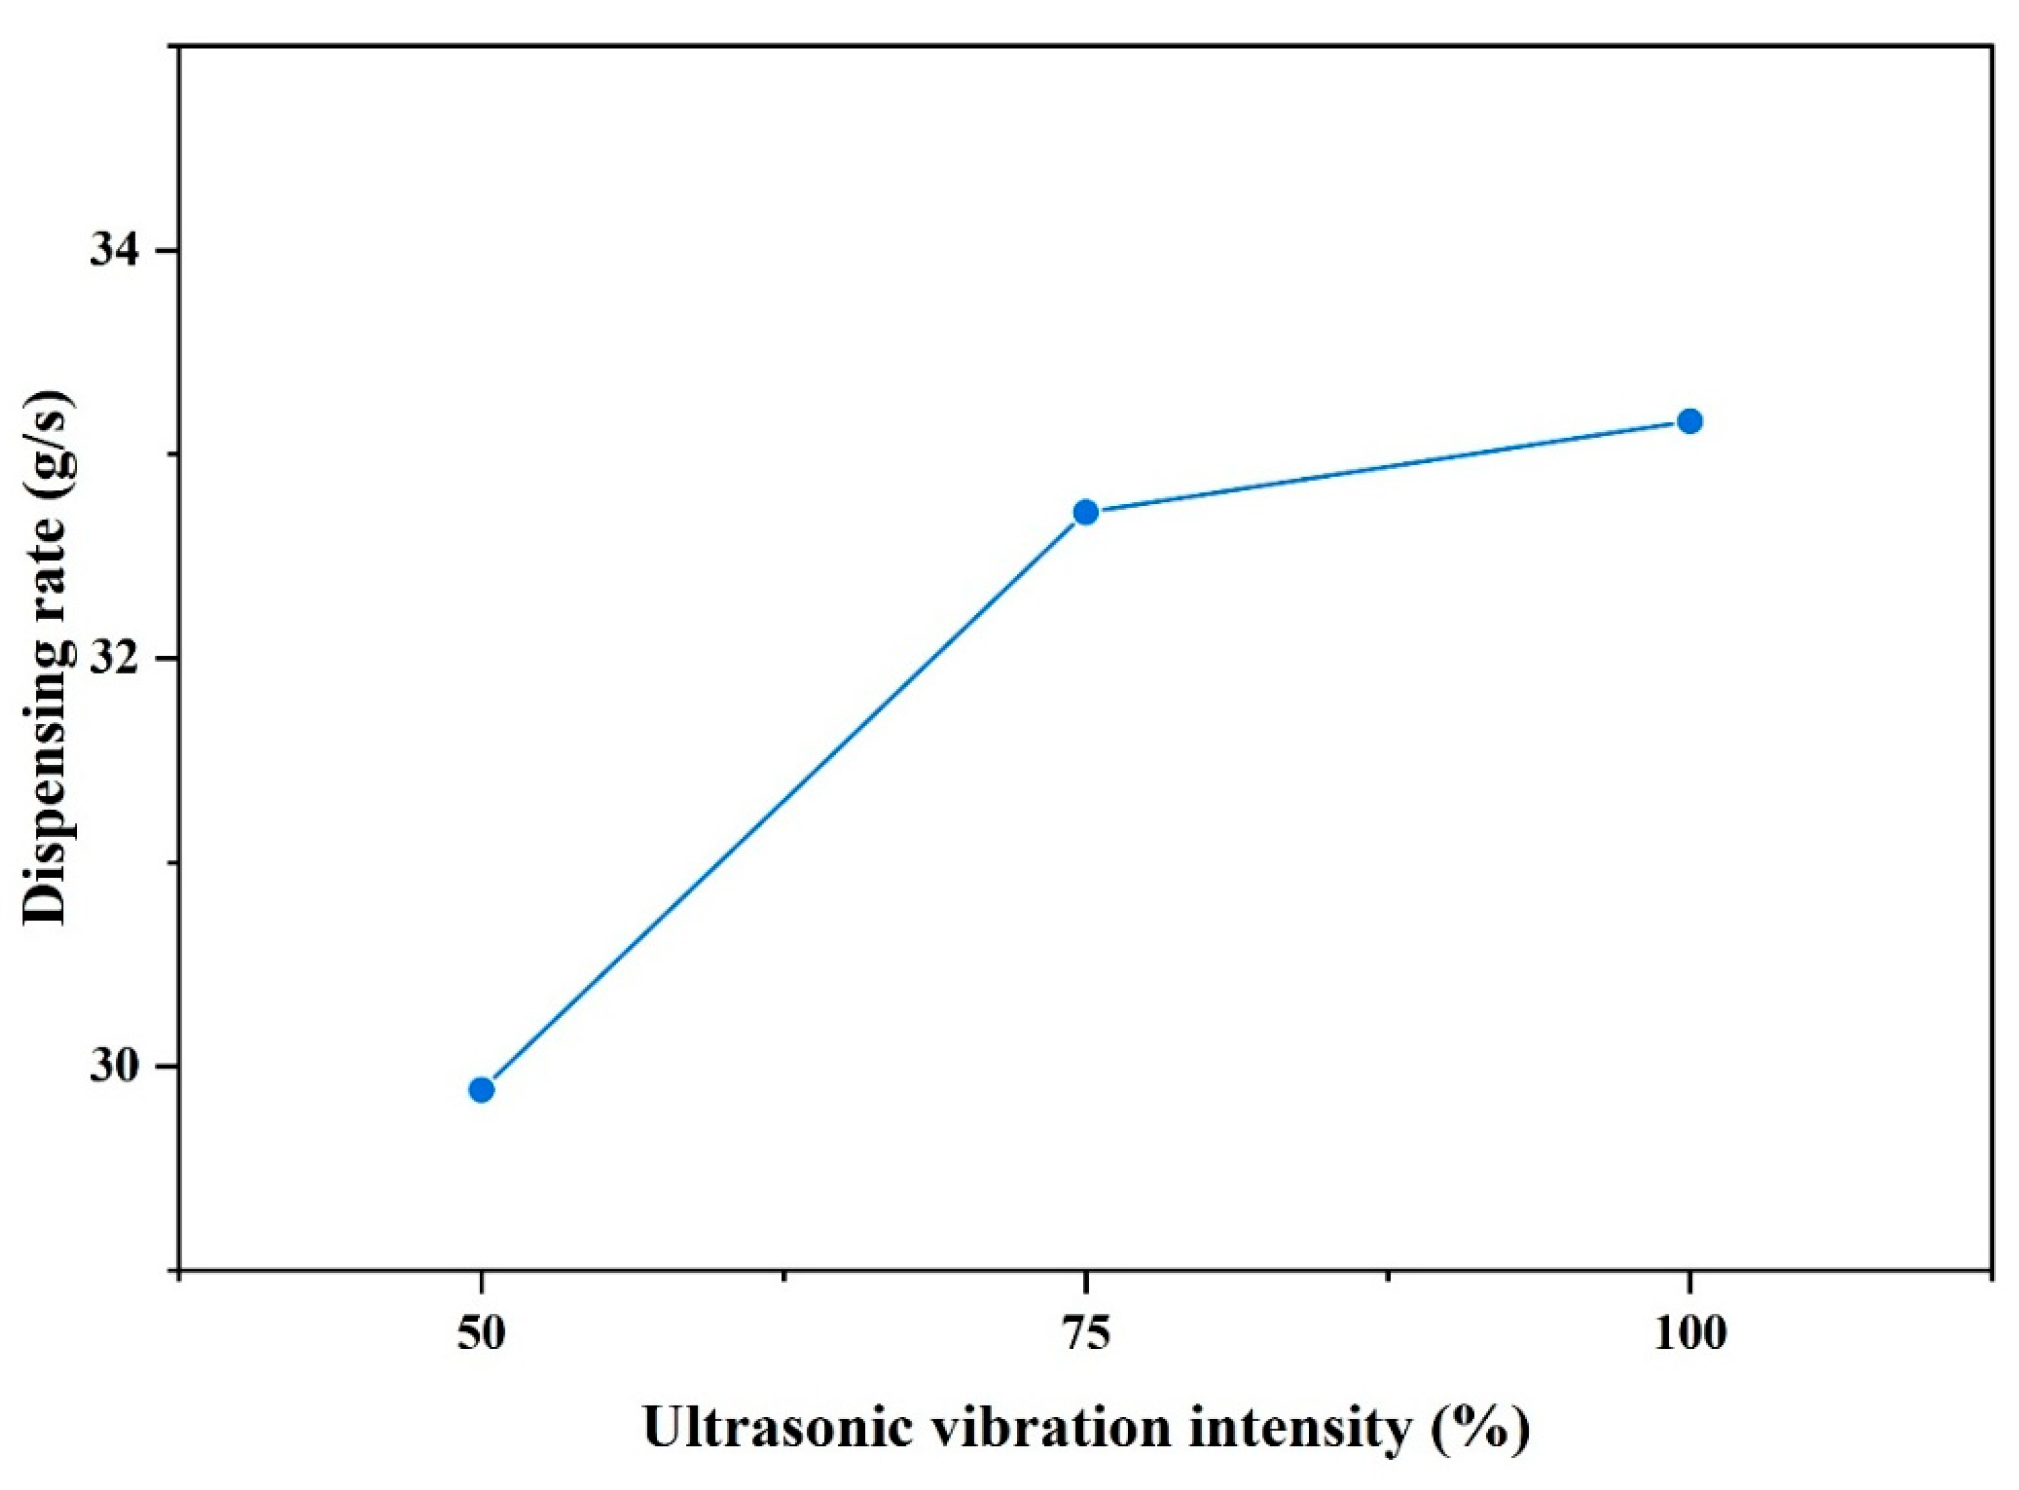
Figure 3 shows the main effect plot of ultrasonic vibration intensity. It can be observed that the powder dispensing rate was higher at a high level of ultrasonic vibration intensity. Specifically, dispensing rate was increased from 30 to 33 g/s as ultrasonic vibration intensity was raised from 50% to 100%. The trend observed from this study is consistent with the trend reported by Wei et al. [9].
Wei et al. observed a higher dispensing rate as ultrasonic vibration intensity increased from 25% to 100% [9]. Comparing the conditions in the current study with the work by Wei et al., the key differences lie in powder material, particle size, material density, and screen size of the hopper. Wei et al. used a unimodal stainless steel 316L (SS316L) powder with an average particle size of 10 µm, a true density of approximately 7.9 g/cm3, and a screen size of 170 µm. In contrast, the current study employed a bimodal powder mixture with an average particle size of 118 µm (Powder A) and 230 µm (Powder B), differing true densities of 7.93 g/cm3 for Powder A and 3.86 g/cm3 for Powder B, and a larger screen size of 305 µm [9]. Also, Wei et al. conducted experiments by changing one variable at a time while keeping the other process variables constant. The current study employed a full factorial design.

3.2. Main Effect of Initial Powder Amount

Figure 4 shows the main effect plot of initial powder amount. It can be observed that powder dispensing rate was lower at the high level of initial powder amount. Specifically, dispensing rate decreased from 35 to 30 g/s as initial powder amount was raised from 600 to 1400 g. The trend observed from this study is consistent with the observation made by Wei et al. [9].
Wei et al. observed a lower dispensing rate as initial powder amount increased from 2000 to 8000 g. They mentioned that the feedstock powder density in the lower part of the hopper was higher at the high level of initial powder amount. As it was more difficult for densely packed particles to pass through the screen (when other conditions are the same), higher initial powder amounts caused lower dispensing rates [9].

3.3. Interaction Effect of Ultrasonic Vibration Intensity and Initial Powder Amount

Figure 5 shows the interaction effect plot of ultrasonic vibration intensity and initial powder amount. Three levels of ultrasonic vibration intensity (50%, 75%, and 100%) are represented by the blue, red, and black lines, respectively. The plot reveals the obvious interaction effect between ultrasonic vibration intensity and initial powder amount. For all three levels of initial powder amount, high levels of ultrasonic vibration intensity increased dispensing rate. However, at the low level of ultrasonic intensity (50%), increasing initial powder amount resulted in a much steeper decrease in dispensing rate. For the ultrasonic intensity levels of 75% and 100%, decreasing trends are observed, but the reduction is less steep. The results highlight that the effect of initial powder amount on dispensing rate varies depending on the ultrasonic vibration intensity level.

4. Conclusions

In this study, a full factorial design was used to investigate the main and interaction effects of ultrasonic vibration intensity and initial powder amount on dispensing rate in binder jetting additive manufacturing. The key findings are given below:
  • Both ultrasonic vibration intensity and initial powder amount in the hopper had significant effects on powder dispensing rate at the significant level of 0.05.
  • Powder dispensing rate was higher when ultrasonic vibration intensity was higher, or initial powder amount was smaller.
  • The interaction effect of ultrasonic vibration intensity and initial powder amount was statistically significant at the significant level of 0.05.
  • Increasing initial powder amount from 600 to 1400 g resulted in a much bigger decrease in powder dispensing rate when ultrasonic vibration intensity was 50% than when ultrasonic vibration intensity was 100%.
These findings offer insight into how process variables influence powder dispensing rate in BJAM when using bimodal powder. However, as the study was conducted using one BJAM printer with a specific hopper, the conclusions should be interpreted within the context of these constraints. Future research should explore a wider range of equipment configurations and investigate the effects of additional variables such as feedstock powder temperature and hopper design. Future research should also investigate the mechanisms behind vibration-induced powder flow, including the role of interparticle forces and the effect of powder density on the transfer of vibration energy. Further work should also include analyzing the packing behavior of bimodal powders and comparing it with that of unimodal powders. The authors also plan to study how different powder ratios influence powder flowability, agglomeration behavior, and dispensing rate.

Author Contributions

Conceptualization, M.M.P. and Z.P.; methodology, M.M.P. and Z.P.; formal analysis, M.M.P.; experiment, M.M.P.; resources, M.M.P. and Z.P.; data curation, M.M.P., Y.-T.K. and Z.P.; writing—original draft preparation, M.M.P.; writing—review and editing, Z.P., M.M.P., Y.-T.K. and K.D. All authors have read and agreed to the published version of the manuscript.

Funding

This research received no external funding.

Data Availability Statement

The original data in this study are included in the article. Further inquiries can be directed to the corresponding author.

Conflicts of Interest

The authors declare that the research was conducted in the absence of any commercial or financial relationships that could be construed as potential conflicts of interest.

References

  1. Khan, F.; Arman, M.S.; Sanders, J.; Pasha, M.M.; Rahman, A.M.; Pei, Z.; Dong, T. Binder Jetting 3D Printing Utilizing Waste Algae Powder: A Feasibility Study. Intell. Sustain. Manuf. 2024, 1, 10016. [Google Scholar] [CrossRef]
  2. Khan, F.; Sanders, J.; Arman, M.S.; Pasha, M.M.; Kachur, S.; Pei, Z. Fabrication of SiC–Aluminum Composites via Binder Jetting 3D Printing and Infiltration: A Feasibility Study. J. Compos. Sci. 2025, 9, 111. [Google Scholar] [CrossRef]
  3. Lores, A.; Azurmendi, N.; Agote, I.; Zuza, E. A review on recent developments in binder jetting metal additive manufacturing: Materials and process characteristics. Powder Metall. 2019, 62, 267–296. [Google Scholar] [CrossRef]
  4. Mostafaei, A.; Elliott, A.M.; Barnes, J.E.; Li, F.; Tan, W.; Cramer, C.L.; Nandwana, P.; Chmielus, M. Binder jet 3D printing—Process parameters, materials, properties, modeling, and challenges. Prog. Mater. Sci. 2021, 119, 100707. [Google Scholar] [CrossRef]
  5. Du, W.; Singh, M.; Singh, D. Binder jetting additive manufacturing of silicon carbide ceramics: Development of bimodal powder feedstocks by modeling and experimental methods. Ceram. Int. 2020, 46, 19701–19707. [Google Scholar] [CrossRef]
  6. Pasha, M.M.; Arman, M.S.; Khan, F.; Pei, Z.; Kachur, S. Effects of Layer Thickness and Compaction Thickness on Green Part Density in Binder Jetting Additive Manufacturing of Silicon Carbide: Designed Experiments. J. Manuf. Mater. Process. 2024, 8, 148. [Google Scholar] [CrossRef]
  7. Mostafaei, A.; De Vecchis, P.R.; Kimes, K.A.; Elhassid, D.; Chmielus, M. Effect of binder saturation and drying time on microstructure and resulting properties of sinter-HIP binder-jet 3D-printed WC-Co composites. Addit. Manuf. 2021, 46, 102128. [Google Scholar] [CrossRef]
  8. Pasha, M.M.; Arman, M.S.; Pei, Z.; Khan, F.; Sanders, J.; Kachur, S. Effects of Compaction Thickness on Density, Integrity, and Microstructure of Green Parts in Binder Jetting Additive Manufacturing of Silicon Carbide. J. Manuf. Mater. Process. 2025, 9, 136. [Google Scholar] [CrossRef]
  9. Wei, X.; Moghadasi, M.; Du, W.; Ma, C.; Pei, Z. Experimental investigation on ultrasonic hopper dispensing system in powder bed additive manufacturing. J. Manuf. Process. 2021, 71, 106–112. [Google Scholar] [CrossRef]
  10. Dunst, P.; Bornmann, P.; Hemsel, T.; Sextro, W. Vibration-assisted handling of dry fine powders. Actuators 2018, 7, 18. [Google Scholar] [CrossRef]
  11. Kollmann, T.; Tomas, J. Effect of applied vibration on silo hopper design. Part. Sci. Technol. 2002, 20, 15–31. [Google Scholar] [CrossRef]
  12. Roberts, A. Vibration of fine powders and its application. In Handbook of Powder Science & Technology; Springer: Singapore, 1997; pp. 146–201. [Google Scholar]
  13. Miyanaji, H.; Rahman, K.M.; Da, M.; Williams, C.B. Effect of fine powder particles on quality of binder jetting parts. Addit. Manuf. 2020, 36, 101587. [Google Scholar] [CrossRef]
  14. Myers, K.; Paterson, A.; Iizuka, T.; Klein, A. The Effect of Print Speed on Surface Roughness and Density Uniformity of Parts Produced Using Binder Jet 3D Printing; University of Texas at Austin: Austin, TX, USA, 2019. [Google Scholar] [CrossRef]
  15. Shrestha, S.; Manogharan, G. Optimization of binder jetting using Taguchi method. Jom 2017, 69, 491–497. [Google Scholar] [CrossRef]
  16. Pasha, M.M.; Pei, Z.; Arman, M.S.; Gasdaska, C.J.; Kao, Y.-T. Effects of Mixing Speed and Mixing Time on Powder Segregation During Powder Mixing for Binder Jetting Additive Manufacturing: An Experimental Study. J. Manuf. Mater. Process. 2025, 9, 117. [Google Scholar] [CrossRef]
  17. Rahman, T.T.; Arman, M.S.; Perez, V.; Xu, B.; Li, J. Analysis of the operating conditions of pulse electric field–assisted EHD for sodium alginate printing using design of experiment approach. Int. J. Adv. Manuf. Technol. 2021, 115, 2037–2047. [Google Scholar] [CrossRef]
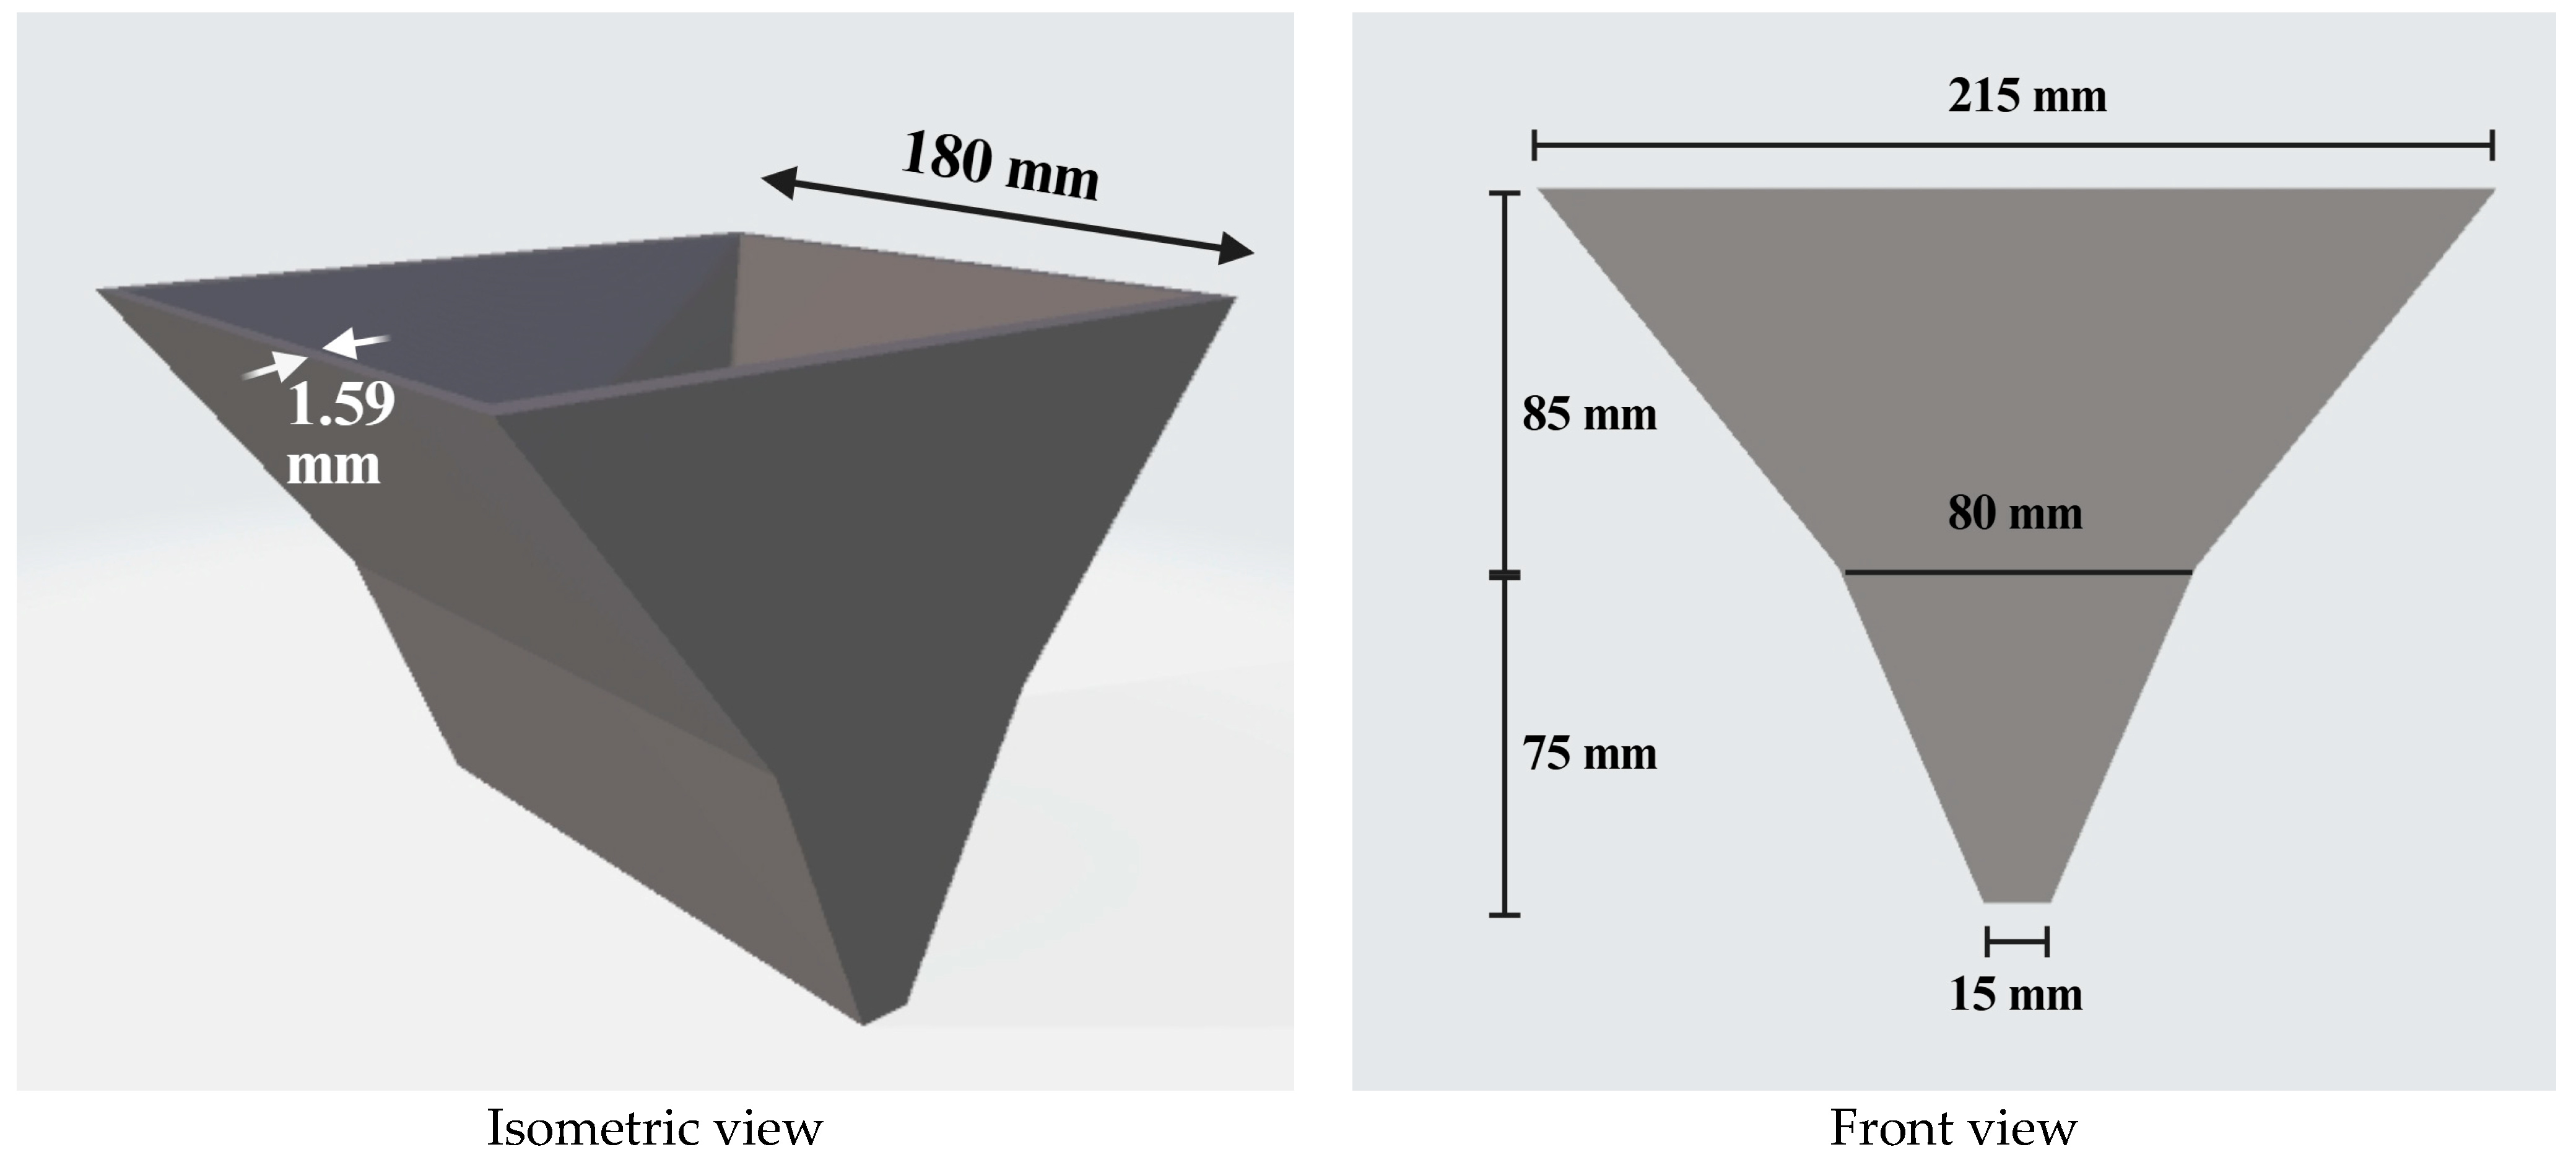
Figure 1. Geometry and dimensions of the customized hopper used in the experiment.
Jmmp 09 00268 g001
Figure 2. Experimental procedure of dispensing feedstock powder from the hopper.
Jmmp 09 00268 g002
Figure 3. Main effect of ultrasonic vibration intensity.
Jmmp 09 00268 g003
Figure 4. Main effect of initial powder amount.
Jmmp 09 00268 g004
Figure 5. Interaction effect of ultrasonic vibration intensity and initial powder amount.
Jmmp 09 00268 g005
Table 1. Information regarding Powder A and Powder B.
Powder APowder B
Material typeMetalCeramic
Average particle size (µm)118230
Particle shape IrregularDiamond
True density (g/cm3)7.93 3.86
Table 2. Values of variables at each level.
VariableLevel 1 (−1)Level 2 (0)Level 3 (+1)
Ultrasonic vibration intensity (%)5075100
Initial powder amount (g)60010001400
Table 3. Matrix of experiments with experimental data.
Experiment OrderRun OrderUltrasonic Vibration IntensityInitial Feedstock PowderDispensing Rate (g/s)
124−1−131.6
210−1031.3
33−1125.9
4220−133.3
5110031.3
6160131.8
7261−135.3
8131033.3
971131.8
101−1−135.3
116−1030.3
1225−1125.5
1340−135.3
1450032.3
15210131.8
16121−137.5
17201032.3
1821132.6
1927−1−133.3
2023−1029.4
218−1126.4
22190−135.3
23150032.3
2490131.1
25171−133.3
26141031.3
27181131.1
Table 4. ANOVA table for effects of ultrasonic vibration intensity and initial powder amount on dispensing rate.
Source of VarianceDFSum of SquaresMean SquareF Valuep-Value
Ultrasonic vibration intensity256.8328.4120.84<0.0001
Initial powder amount2101.3550.6737.16<0.0001
Interaction422.435.604.110.0154
Model8180.6122.5716.55<0.0001
Error1824.541.36
Table 5. p-values from mean pair-comparison tests on dispensing rate data between two levels of ultrasonic vibration intensity.
Pair-Comparison (Ultrasonic Vibration Intensity)p-Value
75% vs. 50%0.0002
100% vs. 50%<0.0001
100% vs. 75%0.7008
Table 6. p-values from mean pair-comparison tests on dispensing rate data between two levels of initial powder amount.
Pair-Comparison (Initial Powder Amount)p-Value
1000 g vs. 600 g0.0001
1400 g vs. 600 g<0.0001
1400 g vs. 1000 g0.0149
Disclaimer/Publisher’s Note: The statements, opinions and data contained in all publications are solely those of the individual author(s) and contributor(s) and not of MDPI and/or the editor(s). MDPI and/or the editor(s) disclaim responsibility for any injury to people or property resulting from any ideas, methods, instructions or products referred to in the content.