Article

Experimental and Numerical Analyses of Diameter Reduction via Laser Turning with Respect to Laser Parameters

Department of Mechanical Engineering, Istanbul Technical University, Gumussuyu, Beyoglu, Istanbul 34437, Türkiye
*
Author to whom correspondence should be addressed.
J. Manuf. Mater. Process. 2025, 9(8), 258; https://doi.org/10.3390/jmmp9080258
Submission received: 6 June 2025 / Revised: 27 July 2025 / Accepted: 31 July 2025 / Published: 1 August 2025

Abstract

In this study, a novel direct laser beam turning (DLBT) approach is proposed for the precision machining of AISI 308L austenitic stainless steel, which eliminates the need for cutting tools and thereby eradicates tool wear and vibration-induced surface irregularities. A nanosecond-pulsed Nd:YAG fiber laser (λ = 1064 nm, spot size = 0.05 mm) was used, and Ø1.6 mm × 20 mm cylindrical rods were processed under ambient conditions without auxiliary cooling. The experimental framework systematically evaluated the influence of scanning speed, pulse frequency, and the number of laser passes on dimensional accuracy and material removal efficiency. The results indicate that a maximum diameter reduction of 0.271 mm was achieved at a scanning speed of 3200 mm/s and 50 kHz, whereas 0.195 mm was attained at 6400 mm/s and 200 kHz. A robust second-order polynomial correlation (R2 = 0.99) was established between diameter reduction and the number of passes, revealing the high predictability of the process. Crucially, when the scanning speed was doubled, the effective fluence was halved, considerably influencing the ablation characteristics. Despite the low fluence, evidence of material evaporation at elevated frequencies due to the incubation effect underscores the complex photothermal dynamics governing the process. This work constitutes the first comprehensive quantification of pass-dependent diameter modulation in DLBT and introduces a transformative, noncontact micromachining strategy for hard-to-machine alloys. The demonstrated precision, repeatability, and thermal control position DLBT as a promising candidate for next-generation manufacturing of high-performance miniaturized components.

1. Introduction

The static and dynamic characteristics of machining systems in conventional machining play a critical role in the dimensional accuracy of machined components [1,2]. Common issues associated with difficult-to-machine materials include excessive tool wear, elevated cutting forces and temperatures, and undesirable burr formation, all of which can adversely affect process efficiency and surface integrity [3]. To overcome these challenges, researchers have developed advanced manufacturing processes aimed at improving the machinability of challenging materials. Among these processes, laser-based machining has emerged as a prominent technique [4,5,6]. The continuous evolution of pulsed laser-based machining positions it as a critical enabling technology, facilitating high-resolution, high-precision, high-speed, and flexible manufacturing. Its primary advantages lie in its versatility across a wide range of materials, as well as the elimination of tool wear, cutting forces, and chattering [7,8]. This technique can be applied to processes such as etching, welding, cutting, drilling, and turning [9,10].
Laser-assisted turning (LAT) is an advanced hybrid machining process that integrates conventional turning with a focused laser beam to augment the material removal mechanism. In this process, a high-power laser is precisely directed onto the workpiece surface during the turning operation, locally heating the material. This localized heating reduces the hardness of the material, facilitating cutting and, consequently, leading to a reduction in cutting forces, a decrease in tool wear, and an increase in surface finish quality [11]. Many researchers have conducted studies on laser-assisted turning [12,13,14]. The use of laser beam assistance has led to noticeable improvements in the machining performance of stainless steels characterized by low thermal conductivity and a high tendency for work hardening [15,16,17]. Furthermore, promising outcomes have been achieved in the turning of composite materials [18,19,20,21].
Direct laser turning (DLT) is a turning process that integrates laser technology to enhance material removal and surface quality. Although substantial literature exists on laser-assisted turning (LAT), investigations specifically addressing DLT are still relatively scarce. Direct laser turning represents a noncontact subtractive manufacturing process that uses highly focused laser energy to thermally ablate material from the surface of a rotating workpiece with high precision. This technique has attracted increasing attention in micromanufacturing and hard material processes because it can mitigate tool wear and provide superior control over surface integrity.
In light of this information, the fundamental differences between the two methods can be summarized. Laser-assisted turning (LAT) is a turning method developed by simply integrating a laser source into the conventional turning process. The primary function of the added laser is to preheat the material, thereby facilitating easier chip removal by the cutting tool. In contrast, direct laser turning (DLT) involves no cutting tool or physical contact; material removal is achieved through thermal ablation as the workpiece is exposed to the focused laser beam. Therefore, although understanding the effect of material preheating on the turning operation is sufficient in laser-assisted turning, direct laser turning involves fundamentally different mechanisms, where material removal occurs without any tool contact, solely through the interaction of laser beams with the material surface.
Material removal from the surface via laser processing can be performed with various types of lasers, depending on the properties of the material being processed. Lasers used for material ablation can be classified on the basis of their pulse duration, such as nanosecond, picosecond, and femtosecond lasers [22]. Although nanosecond, picosecond, and femtosecond lasers are suitable for material ablation, femtosecond lasers achieve lower cutting depths during laser turning operations [23]. In operations utilizing nanosecond lasers, the longer pulse duration allows for greater laser penetration than picosecond or femtosecond lasers do, which in turn enables a higher rate of material removal [24,25,26].
Another common method for classifying laser systems is based on their operating wavelength. Ultraviolet (UV), infrared (IR), and near-infrared (NIR) lasers can be effectively employed in laser-based material processing operations [23,27,28]. In this study, a near-infrared nanosecond laser was employed because of its cost-effectiveness and ability to achieve greater cutting depths in a shorter amount of time.
While laser ablation from flat surfaces is based on more predictable geometric and physical effects, achieving controlled ablation from a rotational or cylindrical workpiece introduces more complex interactions and structural challenges. Ensuring the desired ablation outcomes and fully understanding the process for such geometries requires addressing these additional complexities [29,30,31]. Nevertheless, laser turning can still be applied to rotational parts with predictable results and within narrow tolerances [27,32]. In addition, the ability to perform laser turning on a wide range of materials—such as tungsten carbide, alumina, and fused silica—makes this process worthy of further investigation [30,33,34].
During laser turning, especially at high frequencies or in multi-pass operations, improper selection of the laser fluence range can lead to the formation of microcracks due to thermal cycling effects or keyhole-induced pores resembling microcracks caused by the recoil pressure. These microcracks can adversely affect the mechanical strength of a component. Such defects can be prevented or minimized with or without additional hardware interventions.
Laser turning operations performed at low frequencies with a minimal number of passes exemplify processes that can be performed without additional hardware measures. Alternatively, innovative methods such as postprocess hot isostatic pressing (HIP) or the application of modulated magnetic fields during processing—without changing the existing laser parameters—can help eliminate or prevent the formation of cracks and keyholes [35,36].
In laser ablation studies, calculations are generally based on energy and fluence parameters. In our study, laser fluence values were used as the main parameter. Therefore, additional explanations and calculations have been added to the relevant section of our study. The aim of this study is to produce parts with a new production technology using laser power, spot size, laser scanning speed, and frequency values that can be directly controlled on the laser rather than secondary parameters (pulse overlap, volumetric energy density, peak laser power, total energy per pass).
In this study, to our knowledge, for the first time, the relationship between diameter reduction in a cylindrical workpiece and the number of passes during the laser turning process of AISI 308L austenitic stainless steel has been established. Furthermore, the effects of the frequency and scanning speed on this relationship were investigated.

2. Materials and Methods

The material selected for the laser turning process via the Nd:YAG fiber laser was AISI 308L austenitic stainless steel, which was provided by Gitanjali Industrial Mart Pvt. The workpieces were straight cylindrical rods with dimensions of Ø1.6 mm in diameter and 20 mm in length, as shown in Figure 1. The chemical composition of the 308L austenitic stainless steel is detailed in Table 1, whereas its mechanical properties are presented in Table 2.
Nanosecond-pulsed lasers are widely used in material processing, and their operating principle is based on delivering temporally confined, high-energy short pulses to the material surface. Unlike continuous-wave lasers, they emit brief yet intense pulses of energy on the nanosecond scale. When each pulse is focused onto the target material, it delivers a high energy density within an extremely short time frame. This rapid energy deposition leads to a sudden increase in temperature at the localized surface region, resulting in melting or vaporization of the material. Material removal via laser processing can be achieved through two primary mechanisms: melt ejection and vaporization. It can be inferred that these two mechanisms contribute to thermal ablation. In the melt ejection process, the laser fluence is sufficient to locally melt the surface layer of the material, which is then expelled from the interaction zone because of the recoil pressure. This pressure causes the ejected material to scatter over specific regions of the surface. In contrast, vaporization involves the direct transformation of the material from the solid (or molten) state into vapor, thereby removing it from the surface through intense localized heating. This phenomenon is illustrated as the laser–material interaction in Figure 2, and the experimental setup is shown in Figure 3.
The laser turning process was performed via a Raycus QB50 pulsed Nd:YAG fiber laser system. A schematic of the direct laser turning setup is shown in Figure 4. The laser operates at a wavelength of 1064 nm with pulse durations in the nanosecond range, and it produces a spot diameter of 0.05 mm. The detailed specifications of the laser source are listed in Table 3. During the experimental procedure, the workpiece was rotated at a constant speed of 2 rpm via a servo motor.
During the experiments, the power value was set to 100%. A total of 24 sample groups were formed in the experiments. To ensure repeatability, each set of experiments was conducted three times per sample group, and the arithmetic mean of the measured diameter reduction values was calculated. After the laser turning operations, the reduction in diameter values was measured using an Insize 3203-25A (Suzhou, China) outside micrometer.
Information on the laser scanning speeds selected during the laser turning operation of cylindrical materials is provided in Table 4.
The pulse frequency refers to the number of laser pulses emitted per unit time, typically measured in kHz. Pulsed laser processing plays a critical role in determining the amount of energy delivered to a material over time, directly influencing the thermal effects, material removal rate, and overall process efficiency. The number of passes indicates how many times the rod has been subjected to a diameter reduction process. In other words, the number of passes during laser processing refers to the total number of times the laser beam is scanned or traversed over the same area of the material. This parameter considerably influences the depth of material removal, heat accumulation, and quality of the processed surface. Multiple passes are often used when a single pass is insufficient to achieve the desired modification, particularly in cases involving hard materials or when controlled, gradual material removal is needed.
The effective fluence is a key input parameter that considerably influences the cutting depth in direct laser turning processes. As defined in the literature [38], the effective fluence (η) in units of J/mm2 is governed primarily by the laser scanning speed (v, mm/s) and secondarily by the laser spot diameter (d, mm) and the average laser output power (Pav, W). The relationship is mathematically expressed in Equation (1). On the basis of experimental observations, a correlation was established between the scanning speed, effective fluence, and resulting cutting depth.
η = P a v v · d
In the experiments conducted within the scope of this study, the parameters Pav and d were kept constant (Pav = 50 watts, d = 50 µm), while the laser scanning speed v was varied. As can be inferred from the relevant formula, an increase in v leads to a decrease in the laser fluence. A lower laser fluence results in a reduced amount of energy delivered per unit volume, thereby decreasing the volume of material removed from the surface. Consequently, as the laser scanning speed v increases, the η value decreases, and the diameter reduction also diminishes.
The fluence values used in this study were 31.250 J/cm2 and 15.625 J/cm2 for 3200 and 6400 mm/s speed values, respectively. In the calculations, the thermophysical properties of the AISI 316L stainless steel material were used instead of those of the AISI 308L material, whose thermophysical properties are unclear, and the required threshold ablation value for this material was taken from the literature as 1–3 J/cm2.

3. Results and Discussion

In this section, polynomial surface regression plots are presented to visualize the relationships between diameter reduction and three key variables: the number of passes, scanning speed, and frequency. All corresponding graphs are included. Additionally, the ratio of the reduction in diameter to the number of passes, which is not directly dependent on the laser parameters, was analyzed. The sample image of the laser-turned specimen is given in Figure 5.
In Figure 6a–c, the diameter reduction values are plotted against the number of passes for a scanning speed of 3200 mm/s and various fixed frequency values. For a scanning speed of 3200 mm/s, the minimum diameter reduction is 0.004 mm (@1 pass), and the maximum diameter reduction is 0.271 mm (@32 passes), with processing achievable at a frequency of 50 kHz. For all the frequency values, as the number of passes increases, the material removal increases, consequently leading to a greater reduction in diameter. A linear relationship exists between the diameter reduction values and the number of passes. The reliability of this linear relationship is quite strong (R2min = 0.9685).
Graphs of the diameter reduction values versus the number of passes at a scanning speed of 6400 mm/s and within the frequency range of 50–100–200 kHz are also presented in Figure 6d–f. For the 6400 mm/s scanning speed, the minimum diameter reduction is 0.002 mm (@1 pass) at a frequency of 50 kHz, and the maximum diameter reduction is 0.195 mm (@32 passes), with processing achievable at a frequency of 200 kHz. For all frequency values, as the number of passes increases, material removal increases, resulting in greater diameter reduction. The relationship between these two parameters is linear and has exceptionally high reliability (R2min = 0.9529).
At a constant scanning speed and fixed frequency, the linear relationship between diameter reduction and the number of passes with high reliability suggests that during laser turning operations, material removal inhibition mechanisms such as plasma shielding are minimal. This finding indicates that the process has high precision and repeatability.
Figure 6 shows a strong linear relationship between diameter reduction and the number of passes, independent of frequency and laser scanning speed (R2 = 0.99). Therefore, in the laser turning operation, diameter reduction can be considered a directly controllable process parameter through the number of passes.
Figure 7 shows the variation in diameter reduction with respect to scanning speed at certain frequency values. The analysis is conducted for pass counts of 1, 4, 16, and 32.
A graph highlighting the relationship between scanning speed and diameter reduction at a frequency of 50 kHz is shown in Figure 7a. The observed trend can be attributed to the decreasing effective fluence at higher scanning speeds. During the laser turning operation at a scanning speed of 3200 mm/s, the diameter reductions are 0.004 mm for 1 pass, 0.032 mm for 4 passes, 0.150 mm for 16 passes, and 0.271 mm for 32 passes.
At the same frequency, when the scanning speed is increased to 6400 mm/s, the diameter reductions are 0.002 mm for 1 pass, 0.013 mm for 4 passes, 0.058 mm for 16 passes, and 0.122 mm for 32 passes.
For the 3200 mm/s scanning speed, the diameter reduction ranged from a minimum of 0.004 mm to a maximum of 0.271 mm. When the scanning speed is increased to 6400 mm/s, the minimum and maximum diameter reductions are 0.002 mm and 0.122 mm, respectively.
Figure 7b presents the correlation between the scanning speed and diameter reduction at a fixed frequency of 100 kHz. During the laser turning operation conducted at a frequency of 100 kHz and a scanning speed of 3200 mm/s, the observed diameter reductions are 0.004 mm for 1 pass, 0.027 mm for 4 passes, 0.100 mm for 16 passes, and 0.222 mm for 32 passes.
At the same frequency, when the scanning speed is increased to 6400 mm/s, the diameter reductions are 0.003 mm for 1 pass, 0.011 mm for 4 passes, 0.060 mm for 16 passes, and 0.111 mm for 32 passes.
The relationship between the scanning speed and diameter reduction at a constant frequency of 200 kHz is illustrated in Figure 7c. When the frequency is held at 200 kHz, an increase in the scanning speed leads to a decrease in diameter reduction. This behavior can be attributed to the reduction in the effective fluence at greater speeds.
During the laser turning operation performed at a scanning speed of 3200 mm/s, the observed diameter reductions are 0.008 mm for 1 pass, 0.022 mm for 4 passes, 0.115 mm for 16 passes, and 0.223 mm for 32 passes.
At the same frequency, when the scanning speed is increased to 6400 mm/s, the diameter reductions are 0.004 mm for 1 pass, 0.010 mm for 4 passes, 0.063 mm for 16 passes, and 0.195 mm for 32 passes.
At the 3200 mm/s scanning speed, the diameter reduction ranged between 0.008 mm and 0.223 mm. When the scanning speed is increased to 6400 mm/s, the minimum and maximum diameter reductions are 0.004 mm and 0.195 mm, respectively.
Figure 7 shows a strong linear relationship between diameter reduction and laser scanning speed under a constant number of passes and a fixed pulse frequency (R2 = 0.99). In laser turning operations, diameter reduction is therefore a directly controllable independent process parameter through the laser scanning speed.
For the 3200 mm/s scanning speed, the diameter reduction ranged from a minimum of 0.004 mm to a maximum of 0.222 mm (Figure 8a). When the scanning speed is increased to 6400 mm/s (Figure 8b), the minimum and maximum diameter reductions are 0.003 mm and 0.111 mm, respectively.
Figure 8a shows the relationship between the diameter reduction and frequency for various pass counts at a fixed scanning speed of 3200 mm/s. For a single pass, at a frequency of 50 kHz, the diameter reduction is 0.004 mm. This value remains unchanged at a frequency of 100 kHz but increases to 0.008 mm at 200 kHz.
For the four-pass operation, the diameter reduction values were measured as 0.032 mm at 50 kHz, 0.027 mm at 100 kHz, and 0.022 mm at 200 kHz, indicating a decreasing trend with increasing frequency.
In the case of 16 passes, the diameter reduction reached 0.150 mm at 50 kHz, but declined to 0.100 mm and 0.115 mm at 100 kHz and 200 kHz, respectively.
Similarly, for the 32-pass operation, the maximum diameter reduction was observed at 50 kHz (0.271 mm), while reductions at higher frequencies were comparatively lower, with 0.222 mm at 100 kHz and 0.223 mm at 200 kHz.
For a scanning speed of 3200 mm/s, the diameter reduction increases with frequency for a single pass, whereas for a four-pass operation, a decreasing trend is observed. For 16 and 32 passes, the trend initially decreases and then increases.
Figure 8b shows the relationship between varying frequency values and diameter reduction for different numbers of passes at a fixed scanning speed of 6400 mm/s. For a single pass, the diameter reduction is 0.002 mm at 50 kHz, increasing to 0.003 mm at 100 kHz and reaching 0.004 mm at 200 kHz.
During the four-pass operation, the diameter reduction is 0.013 mm at 50 kHz, slightly decreases to 0.011 mm at 100 kHz, and further decreases to 0.010 mm at 200 kHz. During the 16-pass condition, the diameter reduction values are 0.058 mm at 50 kHz, 0.060 mm at 100 kHz, and 0.063 mm at 200 kHz, indicating a gradual increase with frequency.
In the case of 32 passes, the diameter reduction is 0.122 mm at 50 kHz, decreases to 0.111 mm at 100 kHz, but then increases considerably to 0.195 mm at 200 kHz.
For a scanning speed of 6400 mm/s, an increasing trend in diameter reduction with increasing frequency is observed only for operations with 1 and 16 passes. In contrast, a decreasing trend is observed during the four-pass operation. For 32 passes, the diameter reduction initially decreases but then increases with frequency.
Figure 8 reveals a nonlinear relationship between diameter reduction and pulse frequency, independent of the number of passes and laser scanning speed. Therefore, in laser turning operations, diameter reduction cannot be considered a fully controllable independent parameter through frequency adjustment alone.
This nonlinearity is a vital indicator for achieving a controlled material removal rate and represents an important topic for investigation in future studies. This finding also suggests that additional physical phenomena—such as plasma shielding and boiling—may be involved in the observed nonlinear behavior.
Across all the frequency ranges examined, a linear relationship was observed between the scanning speed and the amount of material removed in terms of diameter reduction. As the scanning speed increases, the amount of removed material, and consequently, the diameter reduction, decreases. This trend can be explained by the reduction in the effective fluence associated with higher scanning speeds.
When the ratio V1/V2 = 0.5 V is held constant, the corresponding effective fluence ratio is also 0.5. Under these conditions, the diameter reduction ratio is theoretically expected to be 0.5. However, in practical material removal processes, factors other than the effective fluence, such as the frequency and number of passes, may influence the effective fluence-to-material removal efficiency. To investigate these effects, the relationships between the number of laser passes and the diameter reduction ratios at frequencies of 50 kHz, 100 kHz, and 200 kHz are examined, as shown in Figure 9, Figure 10 and Figure 11, respectively. The equations of fitted polynomials are also provided in Table 5.
Figure 9, Figure 10 and Figure 11 were developed to compare the influence of the frequency parameter—which induces nonlinear effects—with other independently controllable parameters on diameter reduction. According to the energy fluence formula, the expected ideal diameter reduction ratio is 0.5 (as the laser scanning speed increases from 3200 mm/s to 6400 mm/s). However, the graph shows that this ratio varies, and a strong second-order nonlinear relationship (R2 = 0.99) is established under different frequency and pass count conditions. This finding indicates the following:
1.
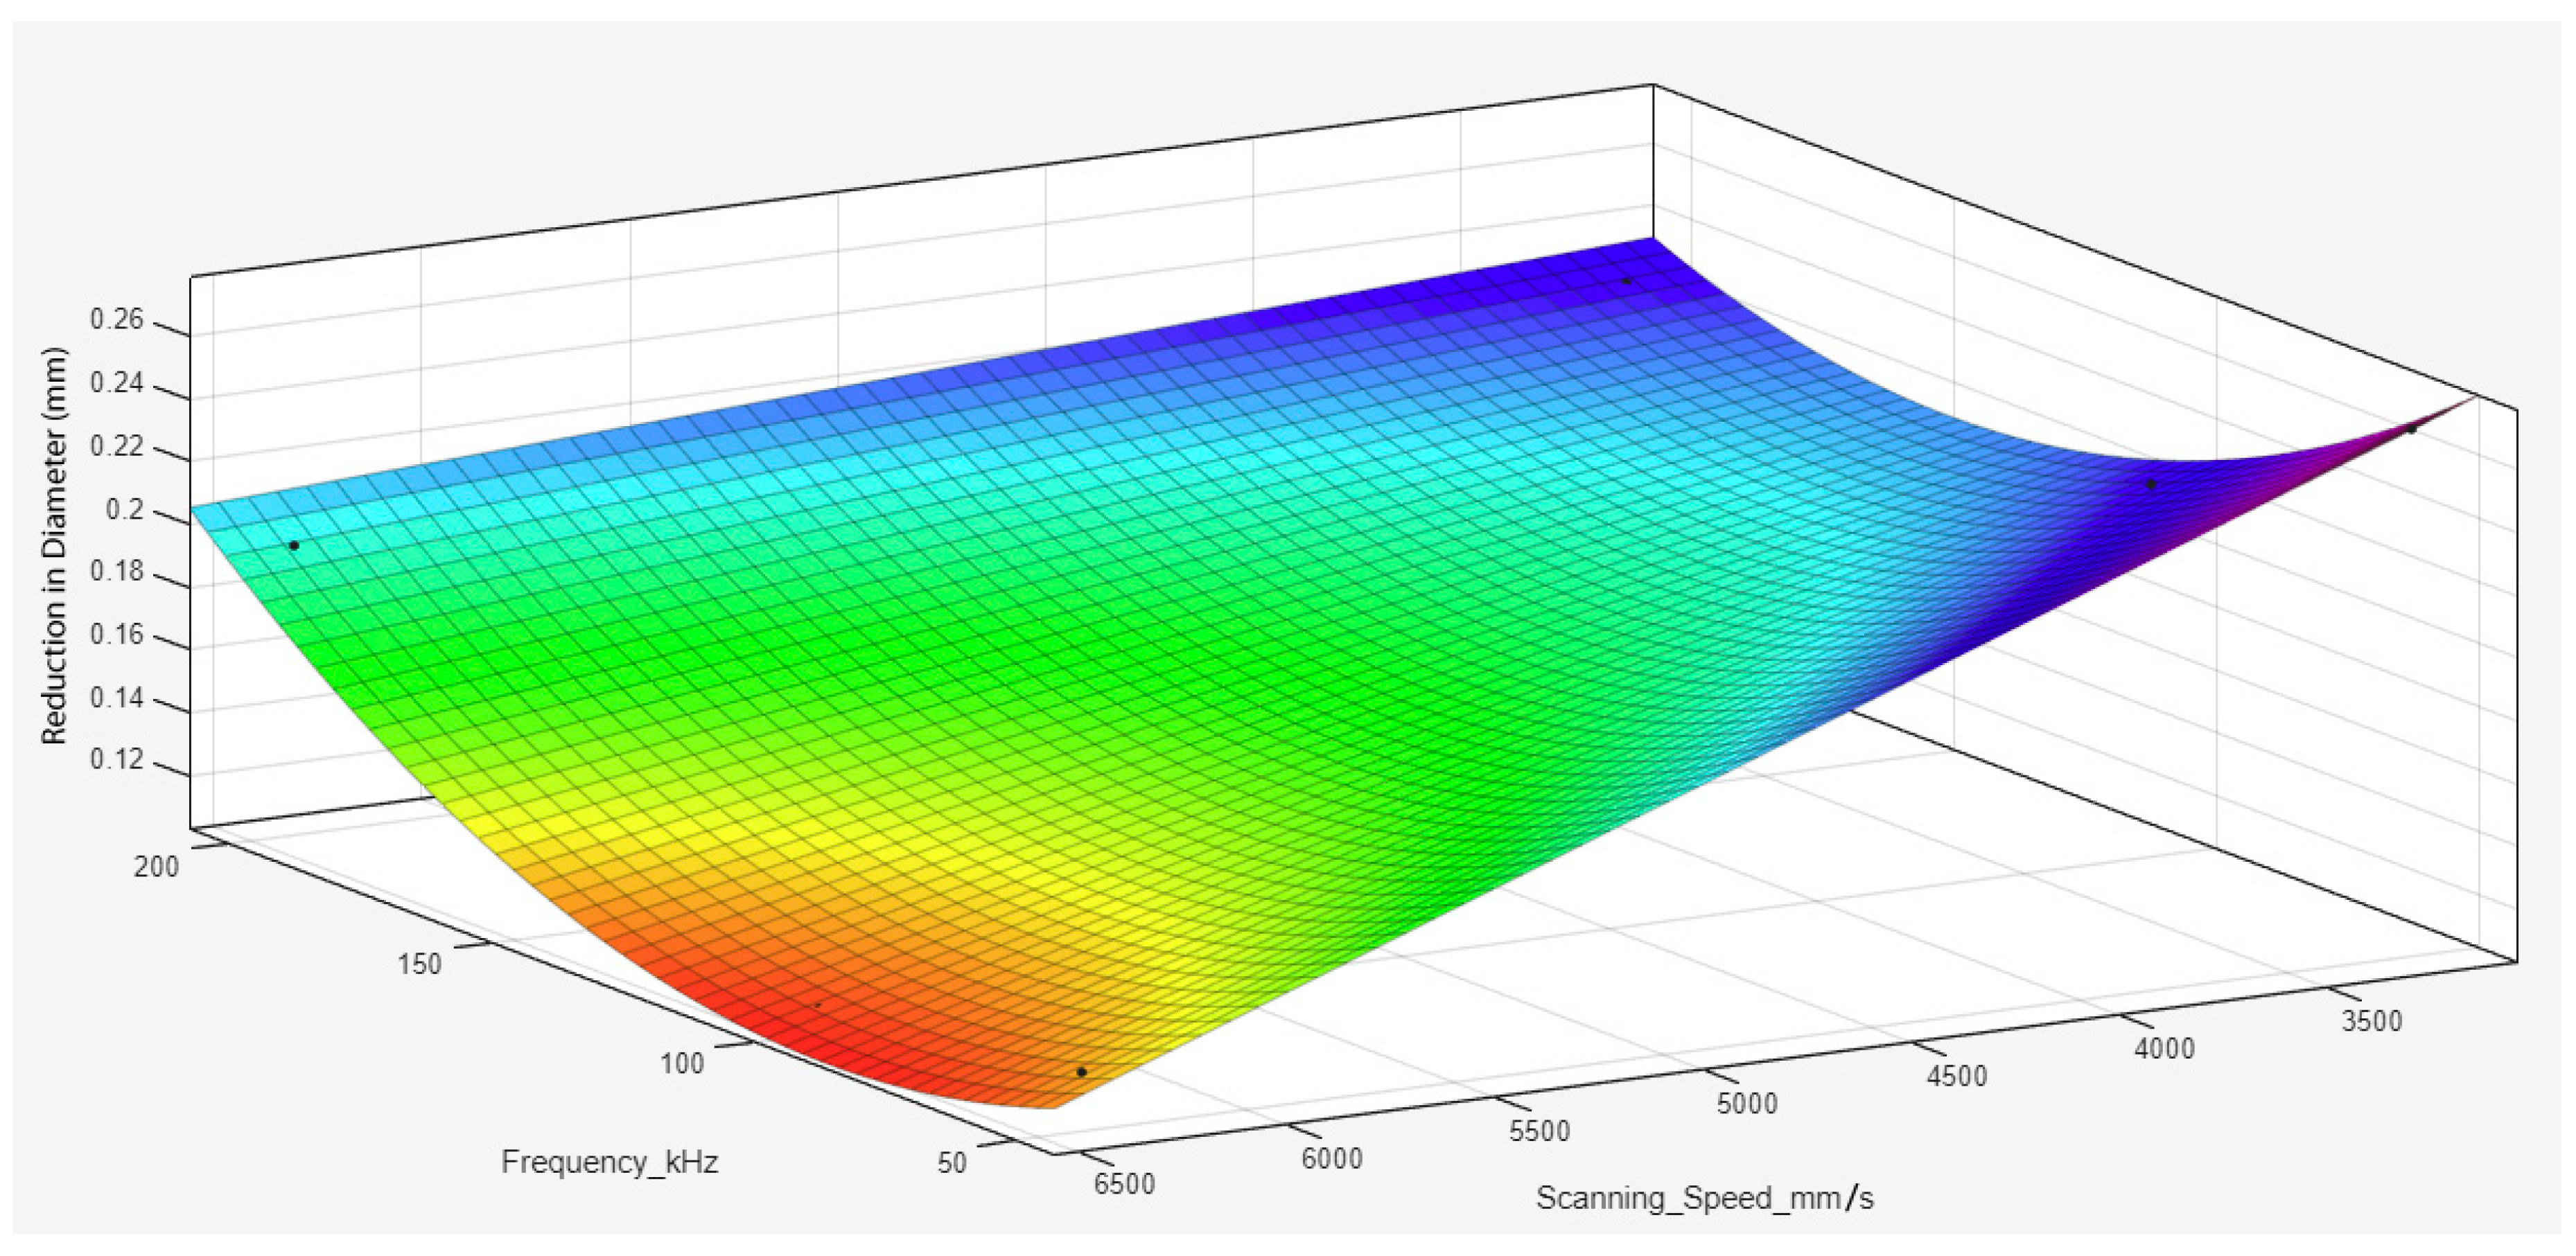
The frequency parameter introduces a considerable nonlinear effect in the process, suggesting that certain frequency values may give rise to currently unidentified physical phenomena.
2.
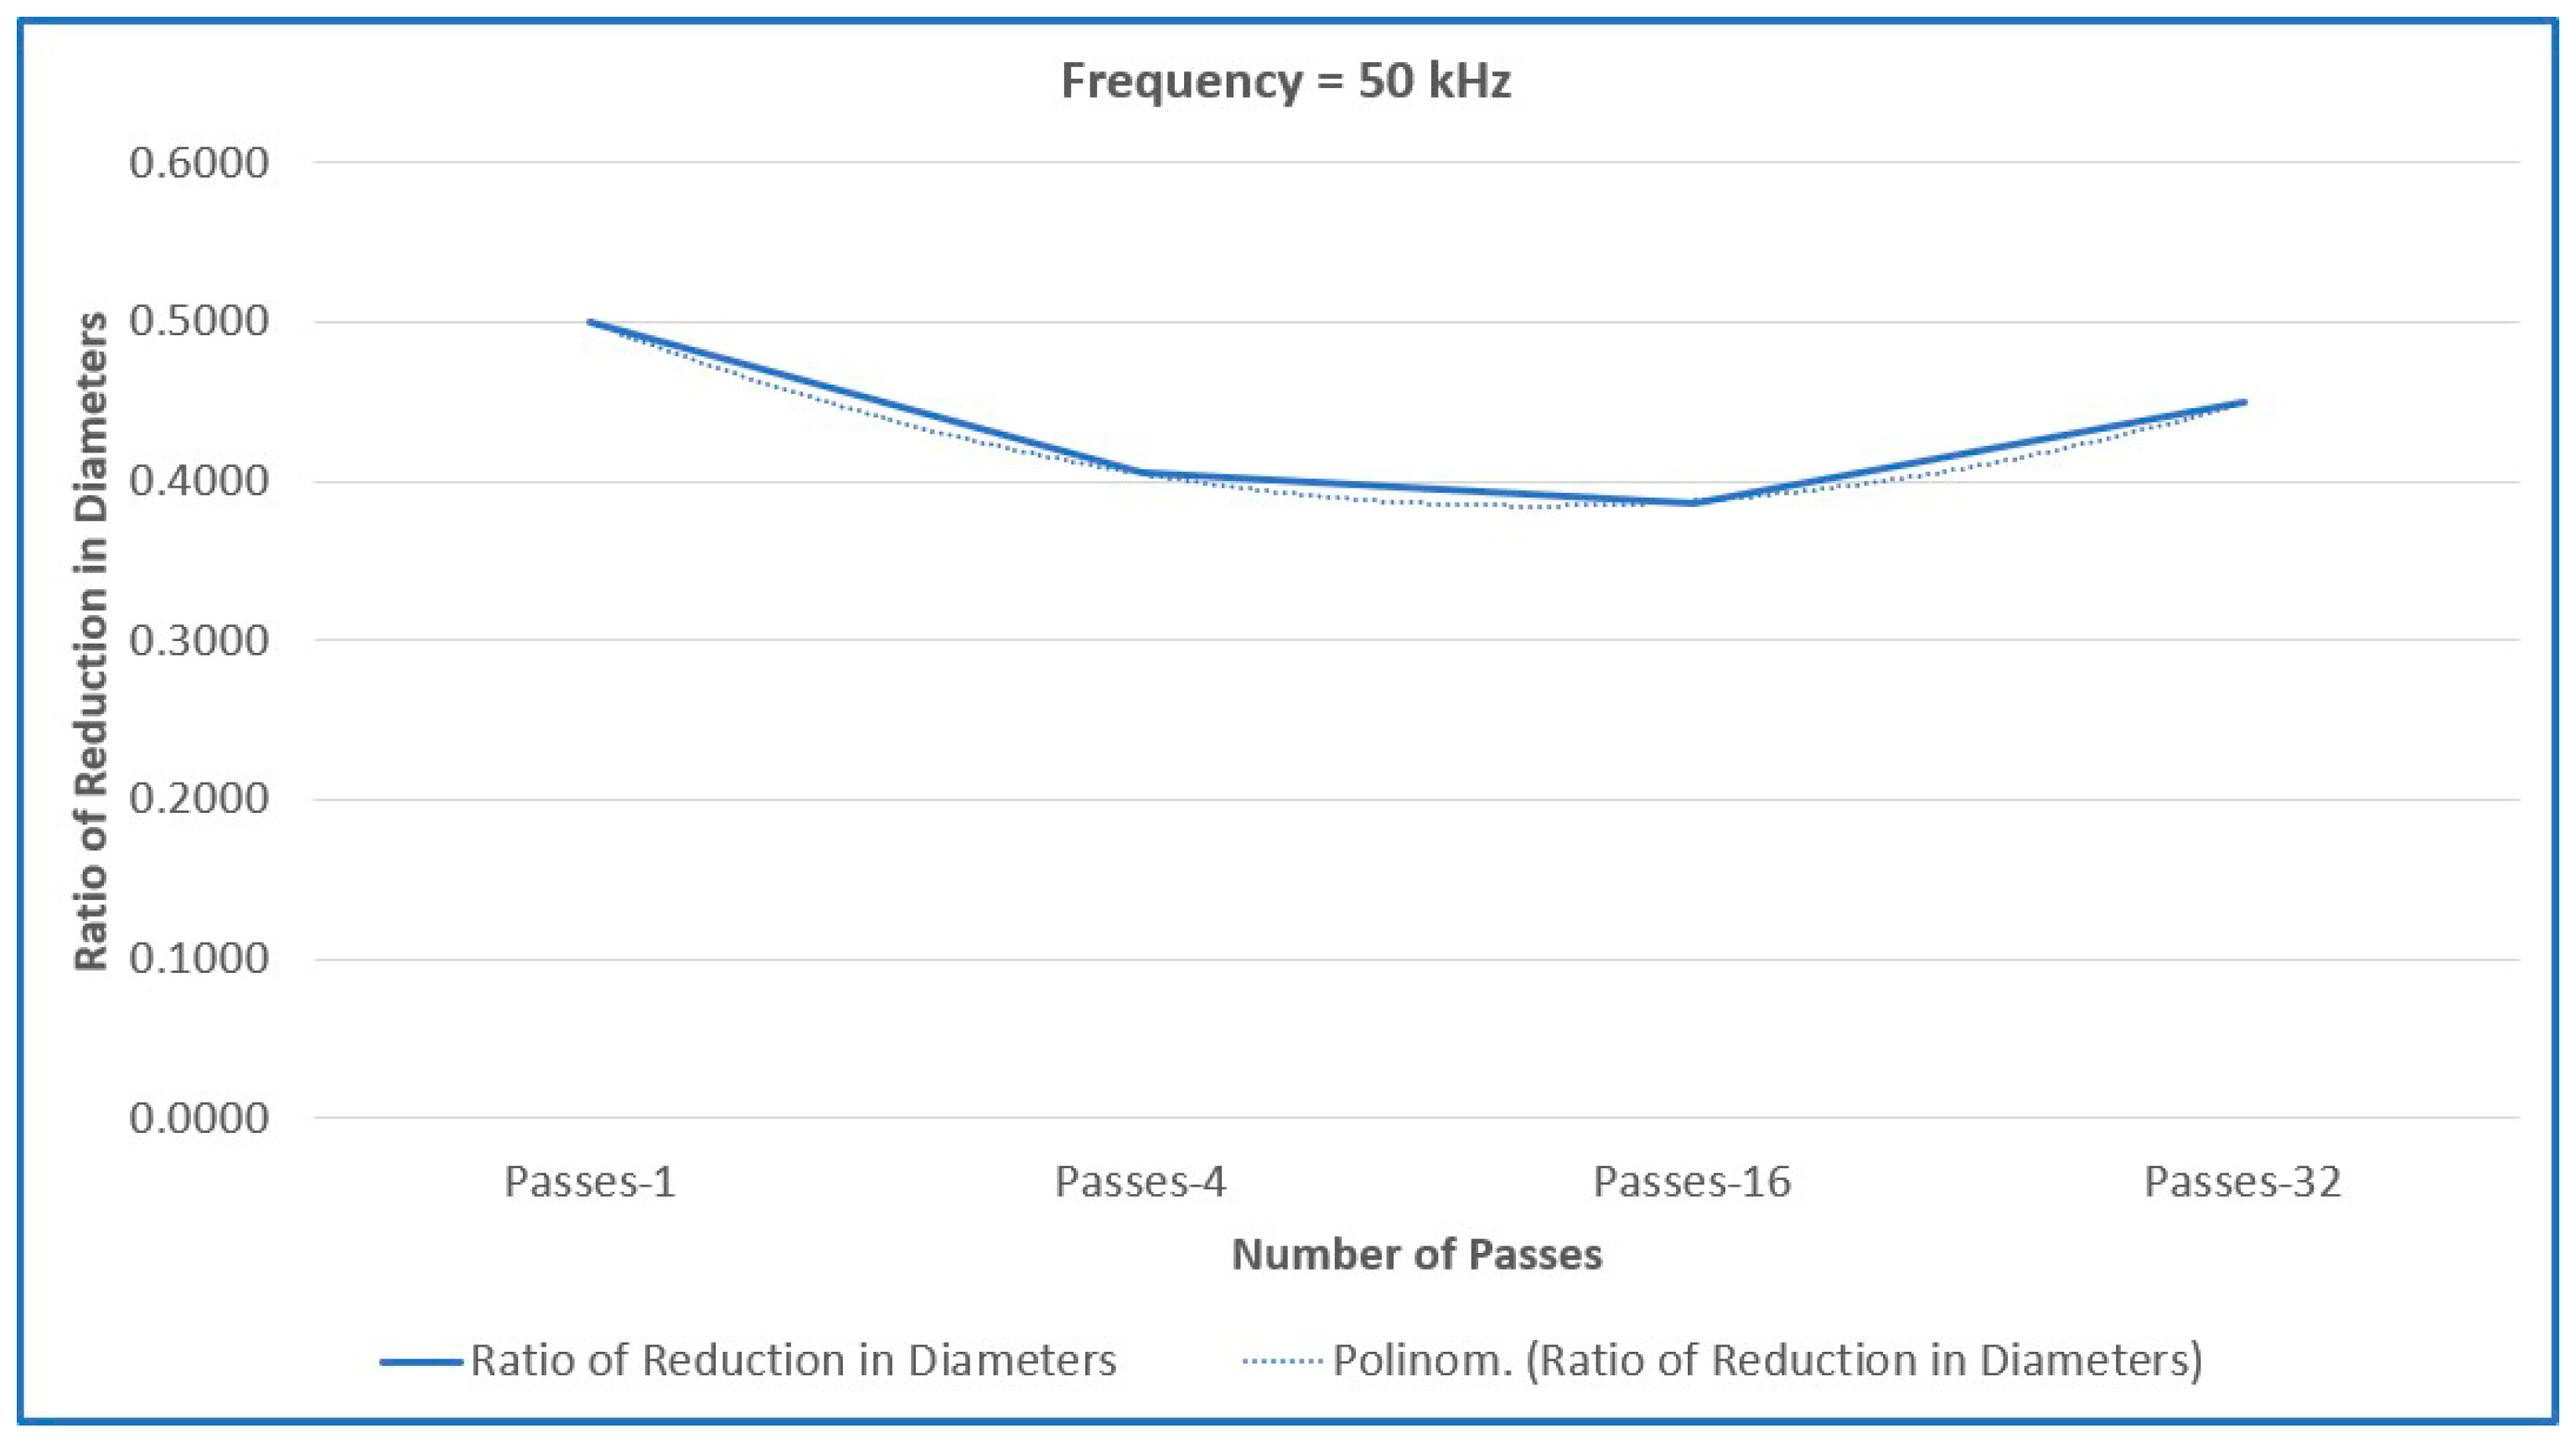
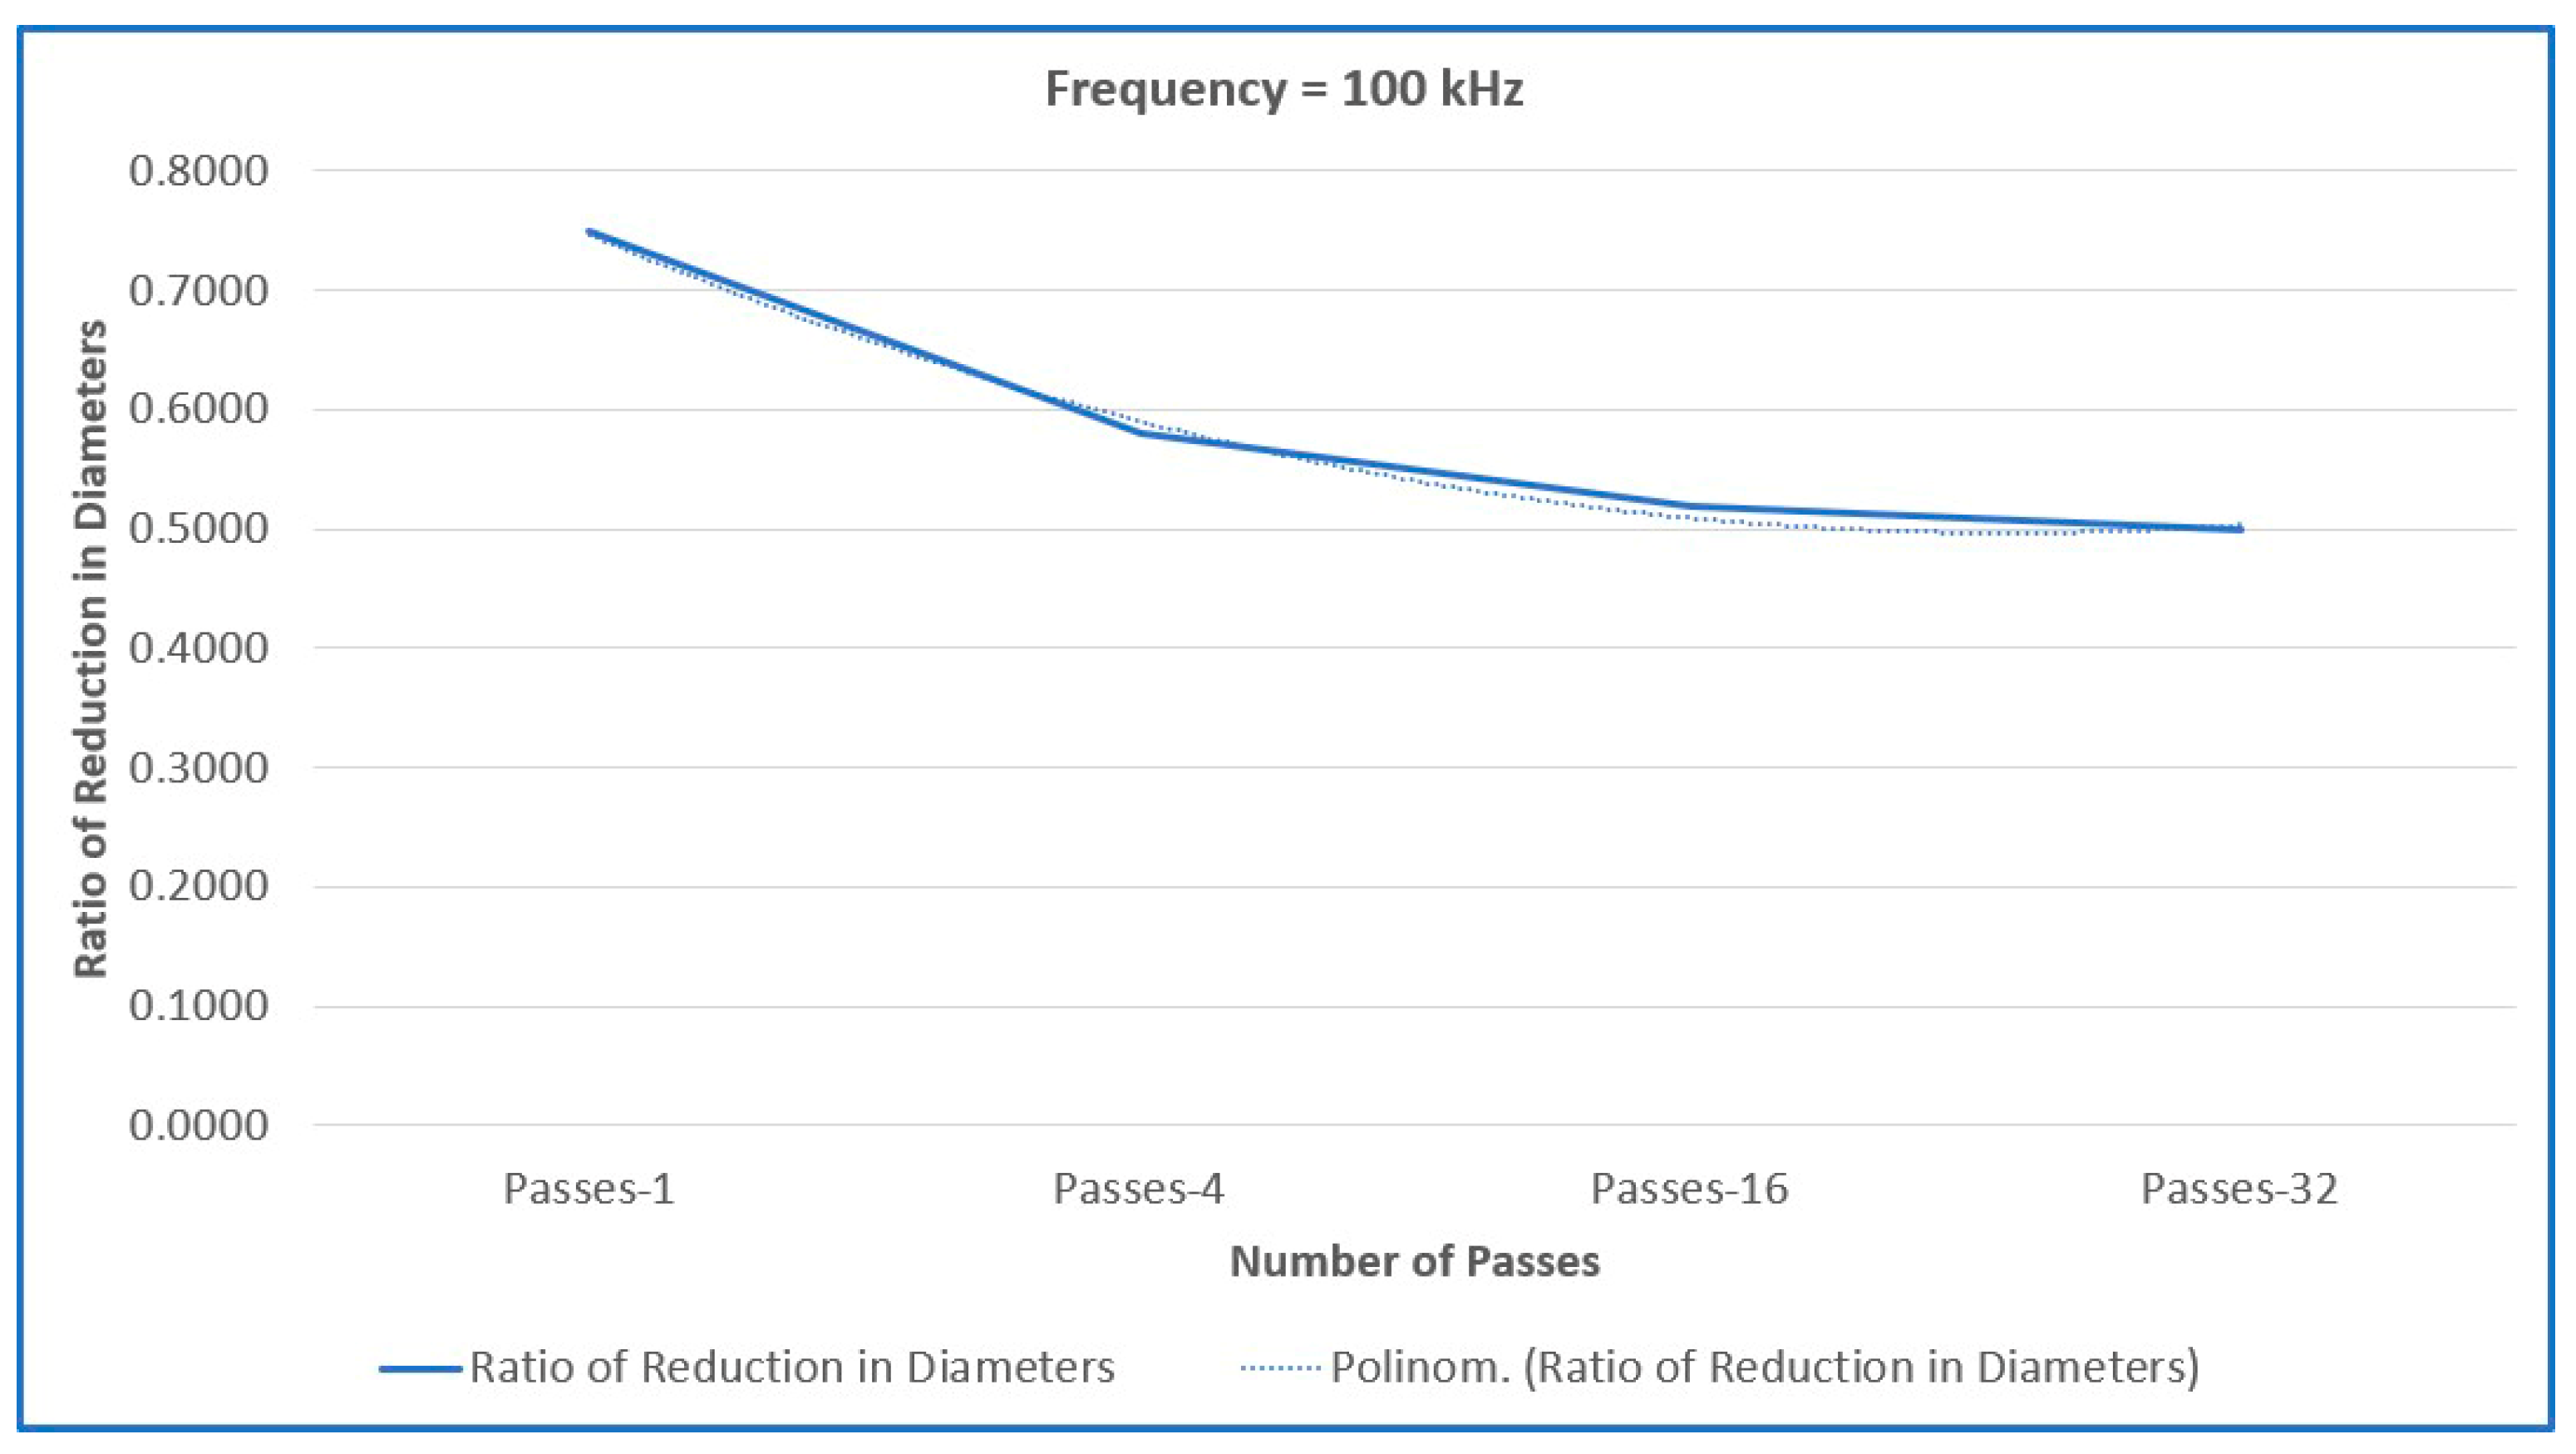
Although the number of passes may have a linear influence on diameter reduction when all other parameters are held constant, its effect becomes nonlinear under varying frequencies. The reduction ratio fluctuates around the expected 0.5—exceeding it in some regions and falling below it in others. This behavior is hypothesized to result from an interaction between increasing pass count and frequency:
  • In regions where the ratio exceeds 0.5, the incubation effect may be dominant.
  • In regions where the ratio is less than 0.5, plasma shielding likely contributes to reduced effectiveness.
At a fixed frequency of 50 kHz, the diameter reduction ratio for a single pass is 0.5, which is consistent with theoretical expectations. In multi-pass operations, this ratio initially decreases as the number of passes increases but subsequently begins to rise.
At 100 kHz, the single-pass diameter reduction ratio is approximately 0.7, exceeding the theoretically predicted value. As the number of passes increases, the ratio gradually declines, approaching the expected theoretical level.
At 200 kHz, the single-pass ratio returns to approximately 0.5, again aligning well with theoretical predictions. Similar to the behavior observed at 50 kHz, multi-pass operations initially exhibit a decrease in the diameter reduction ratio, followed by an increasing trend as the number of passes continues to grow.
A consistent quadratic relationship with a high degree of reliability (R2min = 0.99) is observed between diameter reduction and the number of passes across all frequency values. The effect of varying numbers of passes on material removal depends on the frequency, enhancing the removal efficiency in some cases but reducing it in others.
In summary, at frequencies of 50 kHz and 100 kHz, increasing the number of passes does not appear to have a positive effect on material removal. However, at 150 kHz, the positive influence of increasing the number of passes on material removal becomes apparent after four passes.
A second-degree polynomial surface regression analysis was also conducted to evaluate the reduction in diameter. This second-degree polynomial surface regression program was written in MATLAB (R2024b). The second-degree polynomial surface regression analysis conducted in this study is an effective curve-fitting technique for modeling the relationships among the laser frequency (x), laser scanning speed (y), and reduction in diameter (f):
  • where the input and output variables are as follows:
  • x: Frequency (kHz);
  • y: Scanning speed (mm/s);
  • f: Reduction in diameter (mm).
A custom MATLAB program was written to perform the regression analysis. The reduction in diameter data for each number of passes was substituted into the model, and the above polynomial equation was fitted to the data points via least squares estimation, thereby minimizing the overall error between the model results and actual data.
The surface plots displaying the relationships among the frequency, scanning speed, and diameter reduction for a one-pass operation are shown in Figure 12. Additionally, the polynomial equation corresponding to the surface plot for the one-pass condition is provided below in Equation (2). According to this surface model, the minimum diameter reduction occurs at the coordinate point corresponding to a scanning speed of 6400 mm/s and a frequency of 50 kHz. Conversely, the maximum diameter reduction is observed at a scanning speed of 3200 mm/s and a frequency of 200 kHz.
f x , y = 0.00382 + 0.00004 x 0.00002 y + 0.00002 x 2 0.00003 x y ,
The surface plots showing the relationships among frequency, scanning speed, and diameter reduction for the four-pass operation are presented in Figure 13. Additionally, the polynomial equation corresponding to the surface model for the four-pass condition is provided below in Equation (3). According to this model, the minimum diameter reduction occurs at a scanning speed of 6400 mm/s and a frequency of 150 kHz. Combined with the experimental study, although the results for 50, 100, and 200 kHz are examined, the numerical analysis reveals that the minimum value is obtained at a frequency of 150 kHz. In contrast, the maximum diameter reduction is observed at a scanning speed of 3200 mm/s and a frequency of 50 kHz.
f x , y = 0.0588 0.0002 x + 0.000006 y + 0.000002 x 2 0.000009 x y ,
The surface plots presenting the relationships among the frequency, scanning speed, and diameter reduction for the 16-pass operation are presented in Figure 14. Additionally, the polynomial equation corresponding to the surface model for the 16-pass condition is provided below in Equation (4). According to this model, the minimum diameter reduction occurs at a scanning speed of 6400 mm/s and a frequency of 50 kHz, whereas the maximum diameter reduction is observed at 3200 mm/s and 50 kHz.
f x , y = 0.276 + 0.0014 x 0.000067 y + 0.000004 x 2 0.00001 x y ,
The surface plots displaying the relationships among frequency, scanning speed, and diameter reduction for the 32-pass operation are presented in Figure 15. Additionally, the polynomial equation corresponding to the surface model for the 32-pass operation is provided below in Equation (5). According to this model, the minimum diameter reduction across the entire surface occurs at a scanning speed of 6400 mm/s and a frequency of 100 kHz, whereas the maximum diameter reduction is observed at 3200 mm/s and 50 kHz.
f x , y = 0.5464 0.0028 x 0.0001 y + 0.00002 x 2 0.00007 x y
As given in Table 6:
F: frequency (kHz);
F2: square of frequency (kHz);
V: scanning speed (mm/s); and variables are defined. Table 6 includes the numerical analysis values for detailed interpretation.
Interpretation of the fitted surface plots:
The fitted surface plots allow for simultaneous visualization of the effects of all the parameters on diameter reduction as the number of passes increases. While the previous graphs examined the interaction between individual parameters and diameter reduction through pairwise relationships, the constructed surface plots provide insights into the combined and interdependent effects of all the parameters. This comprehensive perspective provides a valuable foundation for achieving controlled material removal and guiding the direction of future scientific studies.
An examination of all the diameter reduction equations reveals that the following parameters are present in the models:
  • A constant term;
  • Frequency;
  • Laser scanning speed;
  • Interaction term between the frequency and laser scanning speed.
Effects on laser turning operation:
Effect of the constant term:
  • The constant term tends to increase steadily with the number of passes. As the number of passes increases, its effect initially increases geometrically between 1 and 4 passes and then increases linearly from 4 to 32 passes. The geometric increase in the constant term observed between one and four passes is presumed to be associated with the incubation effect.
Effect of frequency:
  • The effect of frequency increases linearly with the number of passes. Additionally, the presence of a second-order (quadratic) term related to frequency has been observed. With an increasing number of passes, the influence of this quadratic term first decreases but then increases again, indicating nonmonotonic behavior.
Effect of the laser scanning speed:
  • As the number of passes increases, the effect of the laser scanning speed on diameter reduction initially increases geometrically but then decreases geometrically. The absence of a second-order term for the laser scanning speed confirms that its direct influence on diameter reduction is linear. However, the observed trend suggests the existence of a nonlinear interaction between the laser scanning speed and the number of passes.
Effect of the interaction term between frequency and laser scanning speed:
  • With an increasing number of passes, the interaction term initially decreases but then increases. This behavior indicates a nonlinear interaction between the interaction term and the number of passes. To fully interpret this relationship, the nonlinear behavior associated with the frequency term must be understood first, as it plays a central role in shaping the overall interaction.

4. Conclusions and Future Work

This study presented a comprehensive investigation into the direct laser turning (DLT) of AISI 308L austenitic stainless steel without the use of forced cooling, with a particular focus on understanding how laser parameters affect diameter reduction. The key findings are summarized below:
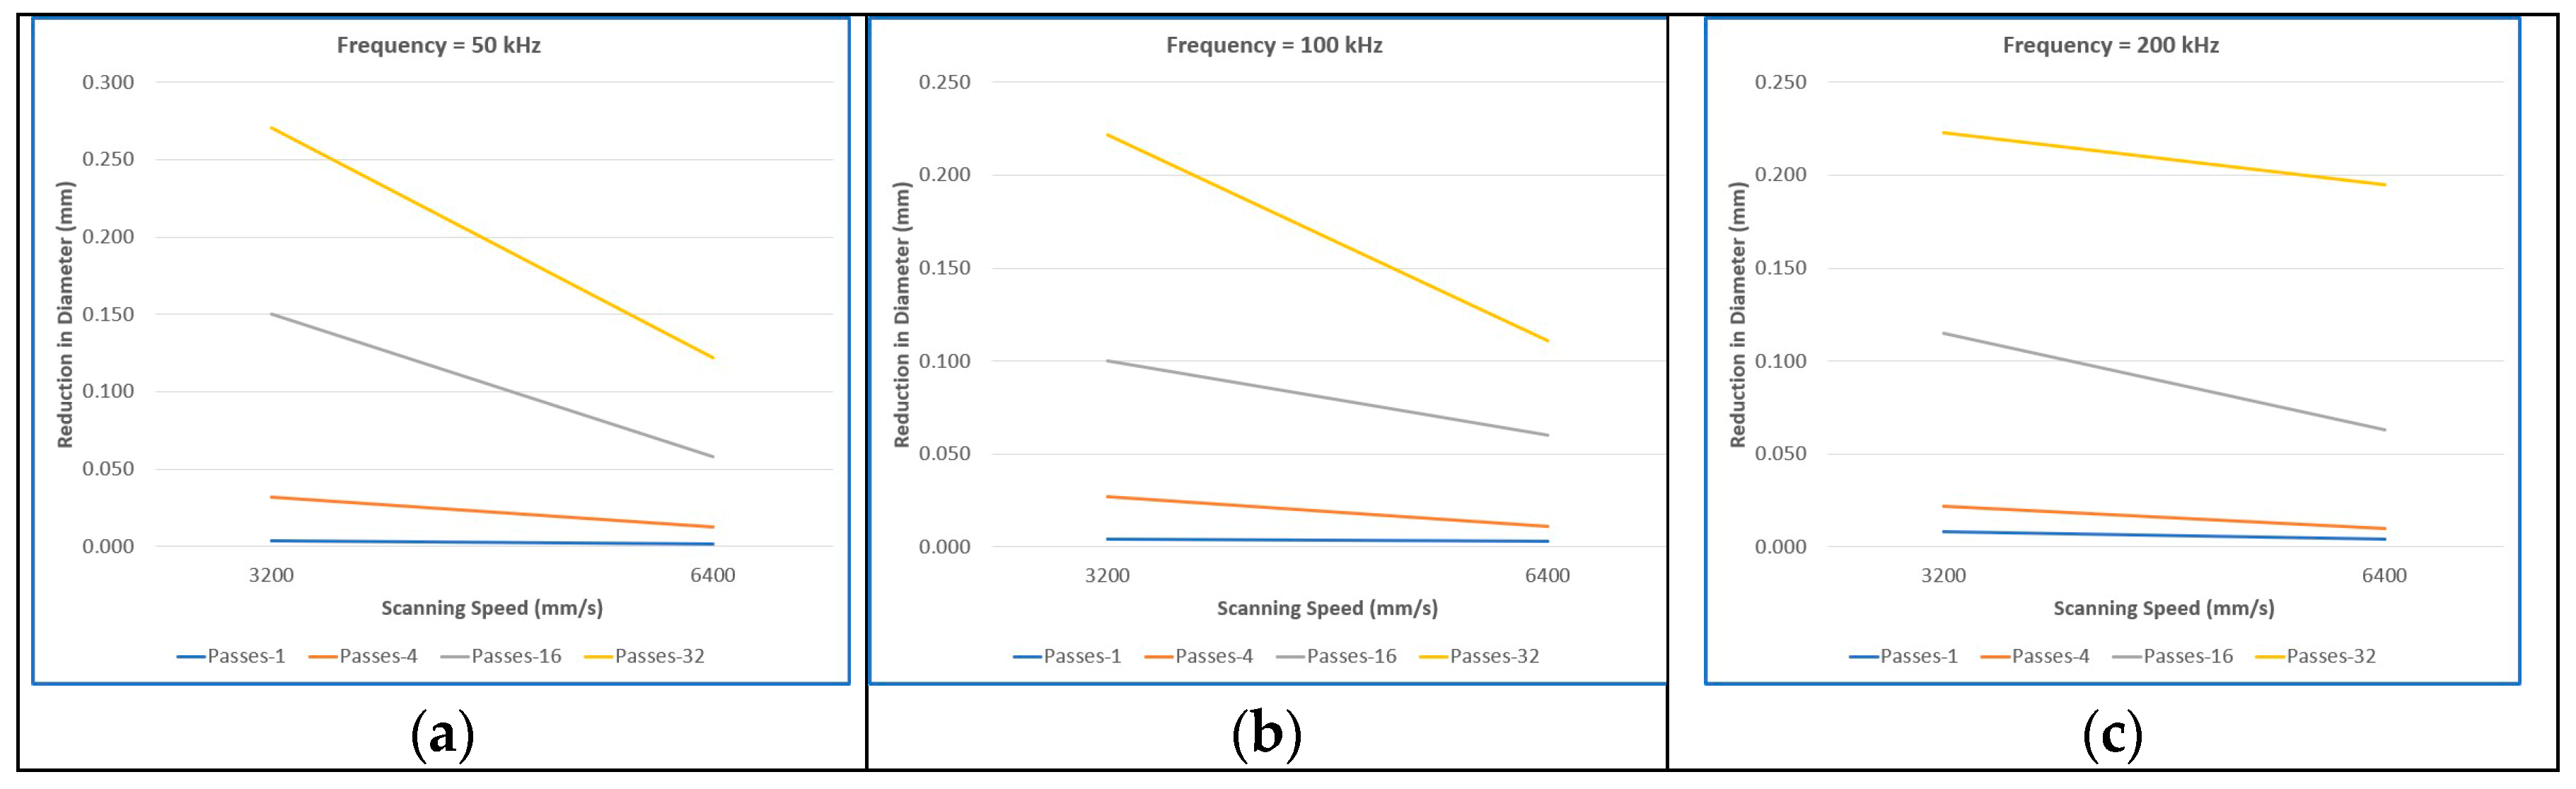
  • The DLT process yielded measurable reductions in diameter under scanning speeds of 3200 mm/s and 6400 mm/s. The maximum diameter reduction was observed to be 0.271 mm at 3200 mm/s and 50 kHz, while a reduction of 0.195 mm was achieved at 6400 mm/s and 200 kHz.
  • Increasing the scanning speed from 3200 mm/s to 6400 mm/s, especially when coupled with a higher number of passes, led to a significant decrease in the extent of diameter reduction.
  • At a constant frequency, diameter reduction exhibited a linear increase with the number of passes. A robust correlation (R2 = 0.99) between pass count and diameter reduction underscores the process’s high predictability.
  • At a fixed scanning speed of 3200 mm/s, diameter reduction increased with frequency during single-pass operations. However, for multi-pass conditions, a reverse trend was noted, with reductions generally decreasing as frequency increased. A similar inconsistency was observed at 6400 mm/s, where no clear trend emerged across different pass numbers, suggesting complex frequency-dependent behavior.
  • When the average laser power was held constant and the scanning speed was doubled, the effective fluence was halved, yielding a fluence ratio of 0.5. This consistent ratio enabled an original analysis of how fluence reduction influences diameter reduction as a function of pass count. A second-order parabolic relationship was confirmed between diameter reduction and pass number, with an exceptionally high R2 of 0.99. Notably, at high frequencies, even at reduced fluence levels, the onset of material evaporation due to the incubation effect was observed.
  • Analysis of polynomial regression terms revealed that the constant term significantly contributes to diameter reduction. It increased linearly with the number of passes but exhibited a geometric rise between one and four passes, indicating a cumulative thermal effect in the early stages of processing.
  • The effect of laser frequency on diameter reduction was shown to be nonlinear. First-order terms varied linearly with pass count, while second-order terms revealed complex, nonmonotonic behaviors, suggesting that frequency exerts a compound physical influence on the ablation process, which warrants further investigation.
  • Scanning speed generally had a linearly controllable impact on diameter reduction, with increases in pass count amplifying material removal. However, an anomalous interaction was noted at four passes, pointing to a unique physical interplay between scanning speed and pass count under this condition.
In conclusion, while scanning speed, frequency, and number of passes serve as viable control parameters for precision diameter reduction in DLT, the presence of nonlinear and interaction effects highlights the need for deeper exploration. The complex interplay between thermal accumulation, incubation effects, and laser–material interactions suggests that fully predictive control over the DLT process requires further mechanistic understanding.
Future studies will expand upon this work by incorporating detailed surface characterization and metallurgical analyses to assess microstructural changes, phase transitions, and surface integrity. Advanced tools such as scanning electron microscopy (SEM), atomic force microscopy (AFM), X-ray diffraction (XRD), energy-dispersive X-ray spectroscopy (EDS), and microhardness testing will be employed. These investigations aim to establish a comprehensive understanding of how laser parameters influence both dimensional accuracy and material properties, ultimately enabling the optimization of DLT for high-precision, high-performance manufacturing applications.

Author Contributions

E.O.B., the corresponding author of the paper, and B.O.B. conducted the experiments and obtained the experimental results. H.A.T. was the supervisor of the entire project. A.Y. took responsibility for writing the paper and performing the numerical analyses. All authors have read and agreed to the published version of the manuscript.

Funding

This work was financially supported by the Istanbul Technical University Scientific Research Projects Coordination Unit (ITU BAP Koordinasyon Birimi, No. MGA-2023-45222).

Data Availability Statement

The original contributions presented in this study are included in the article. Further inquiries can be directed to the corresponding author.

Conflicts of Interest

The authors declare that they have no conflicts of interest.

References

  1. Sofuoglu, M.A.; Orak, S. Prediction of stable cutting depths in turning operation using soft computing methods. Appl. Soft Comput. 2016, 38, 907–921. [Google Scholar] [CrossRef]
  2. Srivastava, A.K.; Mofakkirul Islam, M. Prediction of tool wear and surface finish using ANFIS modelling during turning of Carbon Fiber Reinforced Plastic (CFRP) composites. Manuf. Lett. 2024, 41, 658–669. [Google Scholar] [CrossRef]
  3. Kadivar, M.; Azrhoushang, B.; Zahedi, A.; Müller, C. Laser-assisted micro-milling of austenitic stainless steel X5CrNi18-10. J. Manuf. Process. 2019, 48, 174–184. [Google Scholar] [CrossRef]
  4. Parandoush, P.; Hossain, A. A review of modeling and simulation of laser beam machining. Int. J. Mach. Tools Manuf. 2014, 85, 135–145. [Google Scholar] [CrossRef]
  5. Wei, Y.; Park, C.; Park, S.S. Experimental evaluation of direct laser assisted turning through a sapphire tool. Procedia Manuf. 2017, 10, 546–556. [Google Scholar] [CrossRef]
  6. Chen, K.; Yao, Y.L. Process optimisation in pulsed laser micromachining with applications in medical device manufacturing. Int. J. Adv. Manuf. Technol. 2000, 16, 243–249. [Google Scholar] [CrossRef]
  7. Choi, W.C.; Chryssolouris, G. Analysis of the laser grooving and cutting processes. J. Phys. D Appl. Phys. 1995, 28, 873–878. [Google Scholar] [CrossRef]
  8. Booth, H.J. Recent applications of pulsed lasers in advanced materials processing. Thin Solid Films 2004, 453, 450–457. [Google Scholar] [CrossRef]
  9. Lendner, F. Smart ultrafast laser processing with rotating beam–Laser micro drilling, cutting and turning. In 12th Mittweidaer Lasertagung; Hochschule: Mittweida, Germany, 2021; pp. 83–86. [Google Scholar]
  10. Meijer, J. Laser beam machining (LBM), state of the art and new opportunities. J. Mater. Process. Technol. 2004, 149, 2–17. [Google Scholar] [CrossRef]
  11. Zhao, F.; Bernstein, W.Z.; Naik, G.; Cheng, G.J. Environmental assessment of laser assisted manufacturing: Case studies on laser shock peening and laser assisted turning. J. Clean. Prod. 2010, 18, 1311–1319. [Google Scholar] [CrossRef]
  12. Khatir, F.A.; Sadeghi, M.H.; Akar, S. Investigation of surface roughness in laser-assisted hard turning of AISI 4340. Mater. Today Proc. 2021, 38, 3085–3090. [Google Scholar] [CrossRef]
  13. You, K.; Liu, G.; Wang, W.; Fang, F. Laser assisted diamond turning of silicon freeform surface. J. Mater. Process. Technol. 2023, 322, 118172. [Google Scholar] [CrossRef]
  14. Deswal, N.; Kant, R. Machinability and surface integrity analysis of magnesium AZ31B alloy during laser assisted turning. J. Manuf. Process. 2023, 101, 527–545. [Google Scholar] [CrossRef]
  15. Naresh, C.; Bose, P.S.C.; Suryaprakash Rao, C.; Selvaraj, N. Prediction of cutting force of AISI 304 stainless steel during laser-assisted turning process using ANFIS. Mater. Today Proc. 2021, 38, 2366–2371. [Google Scholar] [CrossRef]
  16. Yasmin, F.; Tamrin, K.F.; Sheikh, N.A.; Barroy, P.; Yassin, A.; Khan, A.A.; Mohamaddan, S. Laser-assisted high speed machining of 316 stainless steel: The effect of water-soluble sago starch based cutting fluid on surface roughness and tool wear. Materials 2021, 14, 1311. [Google Scholar] [CrossRef]
  17. Szymański, M.; Kukliński, M. Geometrical structure of surface after turning of 316L stainless steel in laser assisted conditions. Arch. Mech. Technol. Mater. 2019, 39, 66–73. [Google Scholar] [CrossRef]
  18. Wei, C.; Guo, W.; Gao, B.; Wang, Y.; Sun, Z.; Li, L. Understanding the behaviour of workpieces’ bulk temperature during laser-assisted turning of Ti6Al4V alloy and heating of Al-SiC metal-matrix composite rods. Opt. Laser Technol. 2021, 139, 106951. [Google Scholar] [CrossRef]
  19. Przestacki, D. Conventional and laser assisted machining of composite A359/20SiCp. Procedia CIRP 2014, 14, 229–233. [Google Scholar] [CrossRef]
  20. Abedinzadeh, R.; Norouzi, E.; Toghraie, D. Study on machining characteristics of SiC–Al2O3 reinforced aluminum hybrid nanocomposite in conventional and laser-assisted turning. Ceram. Int. 2022, 48, 29205–29216. [Google Scholar] [CrossRef]
  21. Bejjani, R.; Shi, B.; Attia, H.; Balazinski, M. Laser assisted turning of Titanium metal matrix composite. CIRP Ann. 2011, 60, 61–64. [Google Scholar] [CrossRef]
  22. Chichkov, B.N.; Momma, C.; Nolte, S.; von Alvensleben, F.; Tünnermann, A. Femtosecond, picosecond and nanosecond laser ablation of solids. Appl. Phys. A Mater. Sci. Process. 1996, 63, 109–115. [Google Scholar] [CrossRef]
  23. Yokotani, A.; Kawahara, K.; Kurogi, Y.; Matsuo, N.; Sawada, H.; Kurosawa, K. Development of laser turning using femtosecond laser ablation. In Second International Symposium on Laser Precision Microfabrication; SPIE: California, CA, USA, 2002; pp. 90–93. [Google Scholar]
  24. Kibria, G.; Doloi, B.; Bhattacharyya, B. Experimental analysis on Nd:YAG laser micro-turning of alumina ceramic. Int. J. Adv. Manuf. Technol. 2010, 50, 643–650. [Google Scholar] [CrossRef]
  25. Sriram, D.; Jayaprakash, G.; Arulkirubakaran, D.; Prabu, M.; Ajithkumar, A. Laser turning of alumina (Al2O3) ceramic by Nd:YAG laser technique. Mater. Today Proc. 2021, 39, 731–735. [Google Scholar] [CrossRef]
  26. Kibria, G.; Doloi, B.; Bhattacharyya, B. Predictive model and process parameters optimization of Nd:YAG laser micro-turning of ceramics. Int. J. Adv. Manuf. Technol. 2012, 65, 213–229. [Google Scholar] [CrossRef]
  27. Dhupal, D.; Doloi, B.; Bhattacharyya, B. Pulsed Nd:YAG laser turning of micro-groove on aluminum oxide ceramic (Al2O3). Int. J. Mach. Tools Manuf. 2008, 48, 236–248. [Google Scholar] [CrossRef]
  28. Zettl, J.; Bischoff, K.; Esen, C.; Hellmann, R. Laser turning of PMMA with ultrashort laser pulses using UV and IR. In Proceedings of the Laser-Based Micro-and Nanoprocessing XVIII, San Francisco, CA, USA, 29 January–1 February 2024; SPIE: Bellingham, WA, USA, 2024; pp. 297–304. [Google Scholar]
  29. Kibria, G.; Doloi, B.; Bhattacharyya, B. Experimental investigation and multi-objective optimization of Nd:YAG laser micro-turning process of alumina ceramic using orthogonal array and grey relational analysis. Opt. Laser Technol. 2013, 48, 16–27. [Google Scholar] [CrossRef]
  30. Zettl, J.; Rung, S.; Esen, C.; Hellmann, R. Tangential laser turning of fused silica using ultra-short laser pulses. J. Laser Micro Nanoeng. 2021, 16, 42–46. [Google Scholar] [CrossRef]
  31. Zettl, J.; Klar, M.; Rung, S.; Esen, C.; Hellmann, R. Laser turning with ultrashort laser pulses. J. Manuf. Process. 2021, 68, 1562–1568. [Google Scholar] [CrossRef]
  32. Dhupal, D.; Doloi, B.; Bhattacharyya, B. Modeling and optimization on Nd:YAG laser turned micro-grooving of cylindrical ceramic material. Opt. Lasers Eng. 2009, 47, 917–925. [Google Scholar] [CrossRef]
  33. Kibria, G.; Doloi, B.; Bhattacharyya, B. Investigation into the effect of overlap factors and process parameters on surface roughness and machined depth during micro-turning process with Nd:YAG laser. Opt. Laser Technol. 2014, 60, 90–98. [Google Scholar] [CrossRef]
  34. Zettl, J.; Esen, C.; Hellmann, R. Fundamental considerations and analysis of the energy distribution in laser turning with ultrashort laser pulses. Micromachines 2023, 14, 1838. [Google Scholar] [CrossRef] [PubMed]
  35. Fan, X.; Fleming, T.G.; Clark, S.J.; Fezzaa, K.; Getley, A.C.M.; Marussi, S.; Wang, H.; Leung, C.L.A.; Kao, A.; Lee, P.D. Magnetic modulation of keyhole instability during laser welding and additive manufacturing. Science 2025, 387, 864–869. [Google Scholar] [CrossRef] [PubMed]
  36. Wang, Y.; Guo, W.; Li, H.; Xie, Y.; Shi, J.; Liang, Z.; Han, P.; Li, S.; Zhang, H. Nano-scale microstructural evolution and mechanical property enhancement mechanism during crack inhibition in nickel-based superalloys fabricated by laser powder bed fusion. Addit. Manuf. 2025, 100, 104685. [Google Scholar] [CrossRef]
  37. Shannon, G.; Hypsh, S. Femtosecond Lasers Improve Processing of Metal, Plastic Parts. Available online: https://www.assemblymag.com/articles/93059-femtosecond-lasers-improve-processing-of-metal-plastic-parts (accessed on 21 May 2025).
  38. Sun, S.; Brandt, M. Laser beam machining. In Nontraditional Machining Processes: Research Advances; Davim, J.P., Ed.; Springer: London, UK, 2013; pp. 35–96. [Google Scholar]
Figure 1. AISI 308L austenitic stainless steel sample rods with d = 1.6 mm and l = 22.5 mm before and after the laser microturning operation.
Jmmp 09 00258 g001
Figure 2. Nanosecond-pulsed laser–material interaction [37].
Jmmp 09 00258 g002
Figure 3. The experimental setup used for laser turning operations.
Jmmp 09 00258 g003
Figure 4. Schematic of the direct laser turning operation.
Jmmp 09 00258 g004
Figure 5. The laser-turned specimen at a scanning speed of 3200 mm/s and a frequency of 50 kHz.
Jmmp 09 00258 g005
Figure 6. Reduction in diameter with respect to the number of passes for 50, 100, and 200 kHz frequencies at 3200 mm/s (ac) and 6400 mm/s (df).
Jmmp 09 00258 g006
Figure 7. Measured diameter reductions for 1, 4, 16, and 32 passes at laser frequencies of 50 kHz (a), 100 kHz (b), and 200 kHz (c).
Jmmp 09 00258 g007
Figure 8. Measured diameter reductions for 1, 4, 16, and 32 passes at scanning speeds 3200 mm/s (a) and 6400 mm/s (b).
Jmmp 09 00258 g008
Figure 9. Ratio of reduction in diameter at a frequency of 50 kHz.
Jmmp 09 00258 g009
Figure 10. Ratio of reduction in diameter at a frequency of 100 kHz.
Jmmp 09 00258 g010
Figure 11. Ratio of reduction in diameter at a frequency of 200 kHz.
Jmmp 09 00258 g011
Figure 12. Polynomial surface regression plot for a 1-pass operation.
Jmmp 09 00258 g012
Figure 13. Polynomial surface regression plot for a 4-pass operation.
Jmmp 09 00258 g013
Figure 14. Polynomial surface regression plot for a 16-pass operation.
Jmmp 09 00258 g014
Figure 15. Polynomial surface regression plot for a 32-pass operation.
Jmmp 09 00258 g015
Table 1. Chemical composition of AISI 308L austenitic stainless steel as provided by the manufacturer.
ElementFeCrNiMnSiCPS
Min. (%)63.819.5910.25---
Max. (%)70.522112.50.60.0800.0300.030
Table 2. Mechanical properties of AISI 308L austenitic stainless steel as provided by the manufacturer.
Tensile Strength (MPa)Yield Strength (MPa)Modulus of Elasticity (GPa)Poisson’s RatioElongation (%)
593207190–2100.27–0.3048
Table 3. Technical specifications of the Nd:YAG fiber laser.
Laser TypeNanosecond Laser
Average output power (W)50
Wavelength (nm)1060~1085
Pulse duration (ns)120~150@50 kHz
Table 4. The experimental matrix designed based on different values of the number of passes, frequency, and laser scanning speed.
Sample GroupNumber of PassesFrequency (kHz)Scanning Speed (mm/s)
11506400
24506400
316506400
432506400
511006400
641006400
7161006400
8321006400
912006400
1042006400
11162006400
12322006400
131503200
144503200
1516503200
1632503200
1711003200
1841003200
19161003200
20321003200
2112003200
2242003200
23162003200
24322003200
Table 5. Curve fitting values of polynomial regressions at 50, 100, and 200 kHz.
FrequencyFitted CurveR2
50 kHz y = 0.0393 x 2 0.2135 x + 0.6746 0.9995
100 kHz y = 0.0375 x 2 0.2685 x + ( 0.9775 ) 0.9937
200 kHz y = 0.093 x 2 0.3434 x + ( 0.7551 ) 0.9959
Table 6. Numerical analysis coefficients of fitted polynomial surface regression plots and variations in coefficients with respect to the band of passes.
NUMBER OF PASSESCOEFFICIENTS
CONSTANT NUMBERFVF2F.V
1+0.00382+0.00004−0.000020+0.000020−0.000030
4+0.0588−0.00020+ 0.000006+0.000002−0.000009
16+0.2760−0.00140−0.000067+0.000004−0.000010
32+0.5464−0.00280−0.000100+0.000020−0.000070
BAND OF PASSESΔNΔCΔVΔF/ΔF2Δ(F.V)
1–4+4+15.39+1.3+6/−0.9−0.9
4–16+4+4.69+12.16+6/+2+0.1
16–32+2+2.085+1.49+2/+4+6
Disclaimer/Publisher’s Note: The statements, opinions and data contained in all publications are solely those of the individual author(s) and contributor(s) and not of MDPI and/or the editor(s). MDPI and/or the editor(s) disclaim responsibility for any injury to people or property resulting from any ideas, methods, instructions or products referred to in the content.

