

Additively Produced Ti-6Al-4V Osteosynthesis Devices Meet the Requirements for Tensile Strength and Fatigue

 ,
,  ,
, 
 and
and 
Abstract
1. Introduction
2. Materials and Methods
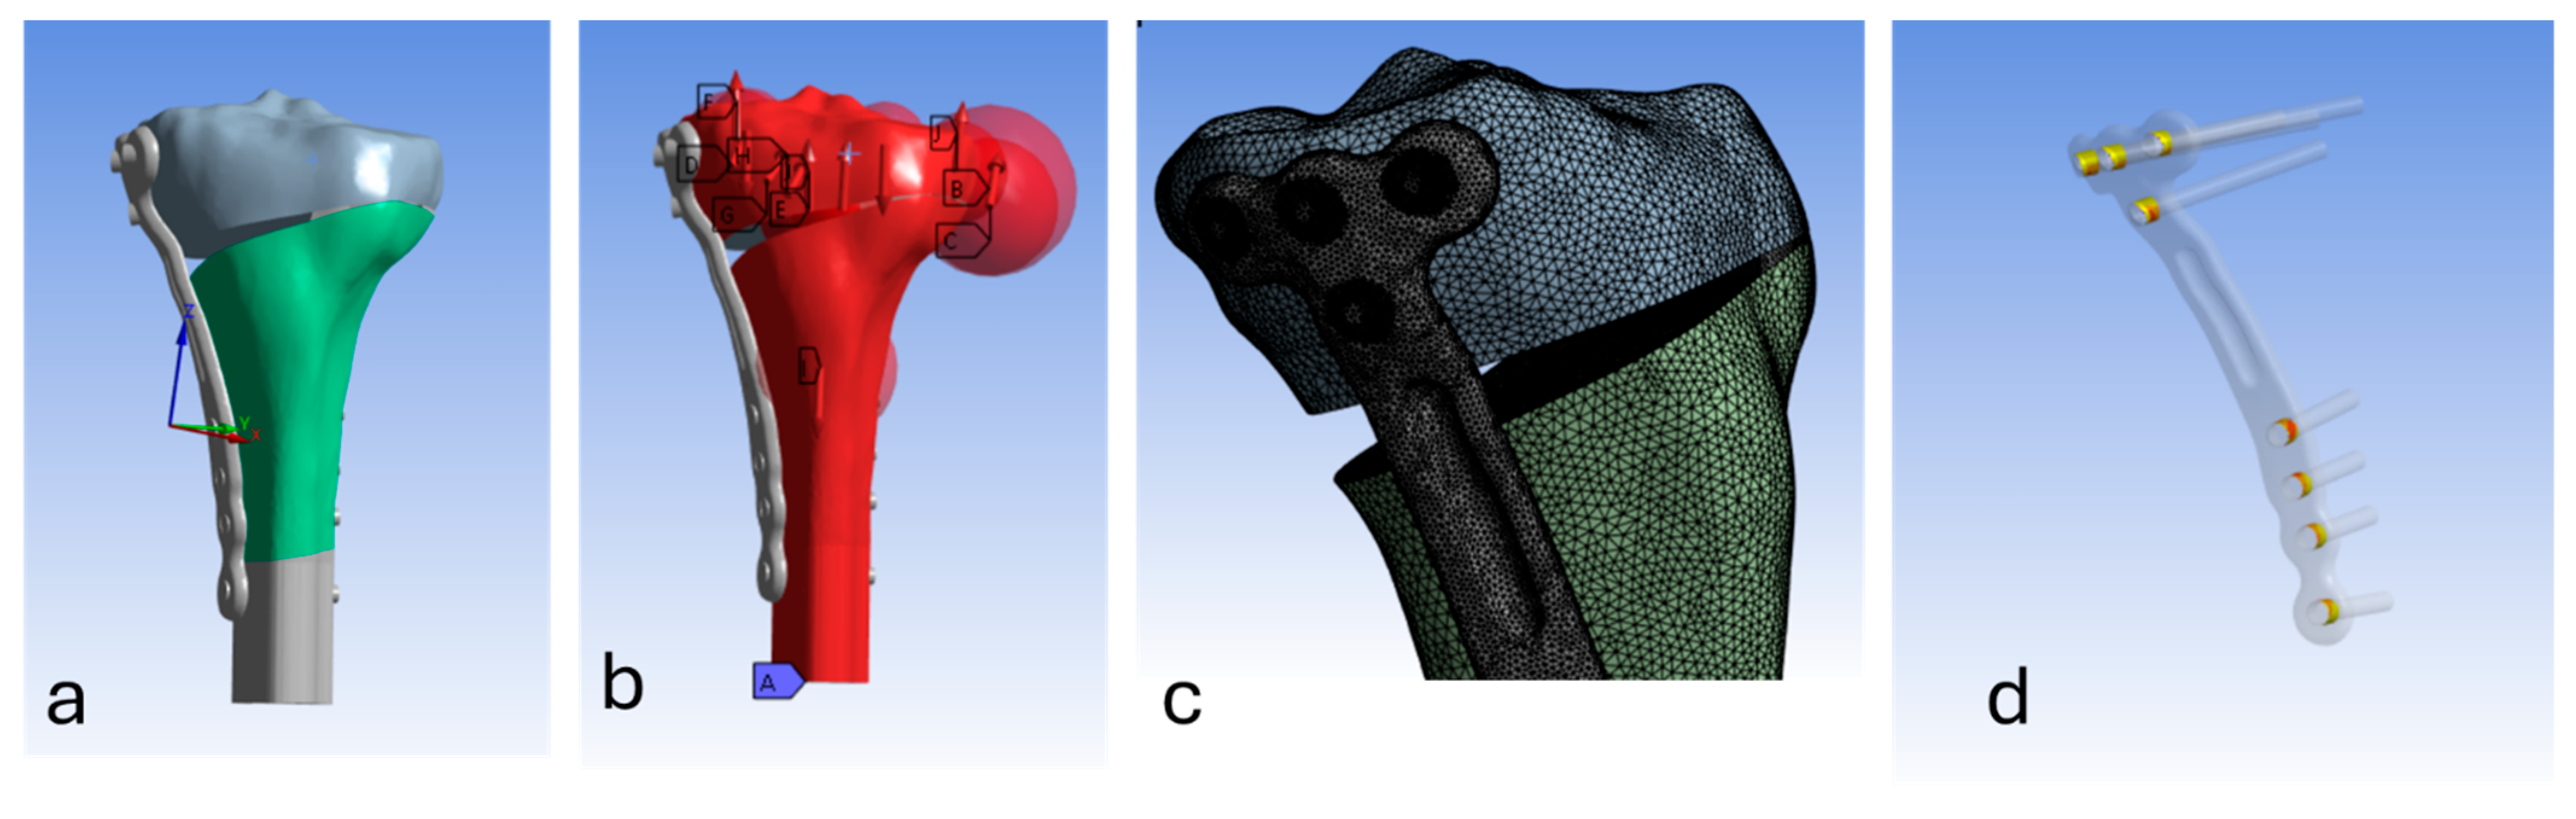
2.1. Finite Element (FE) Modelling
2.1.1. Geometries and Meshing
2.1.2. Material Properties
2.1.3. Contact Interactions
2.1.4. Loading & Boundary Conditions
2.1.5. Solver/Solution
2.2. Production of Tensile Test Specimens
2.3. Tensile Testing
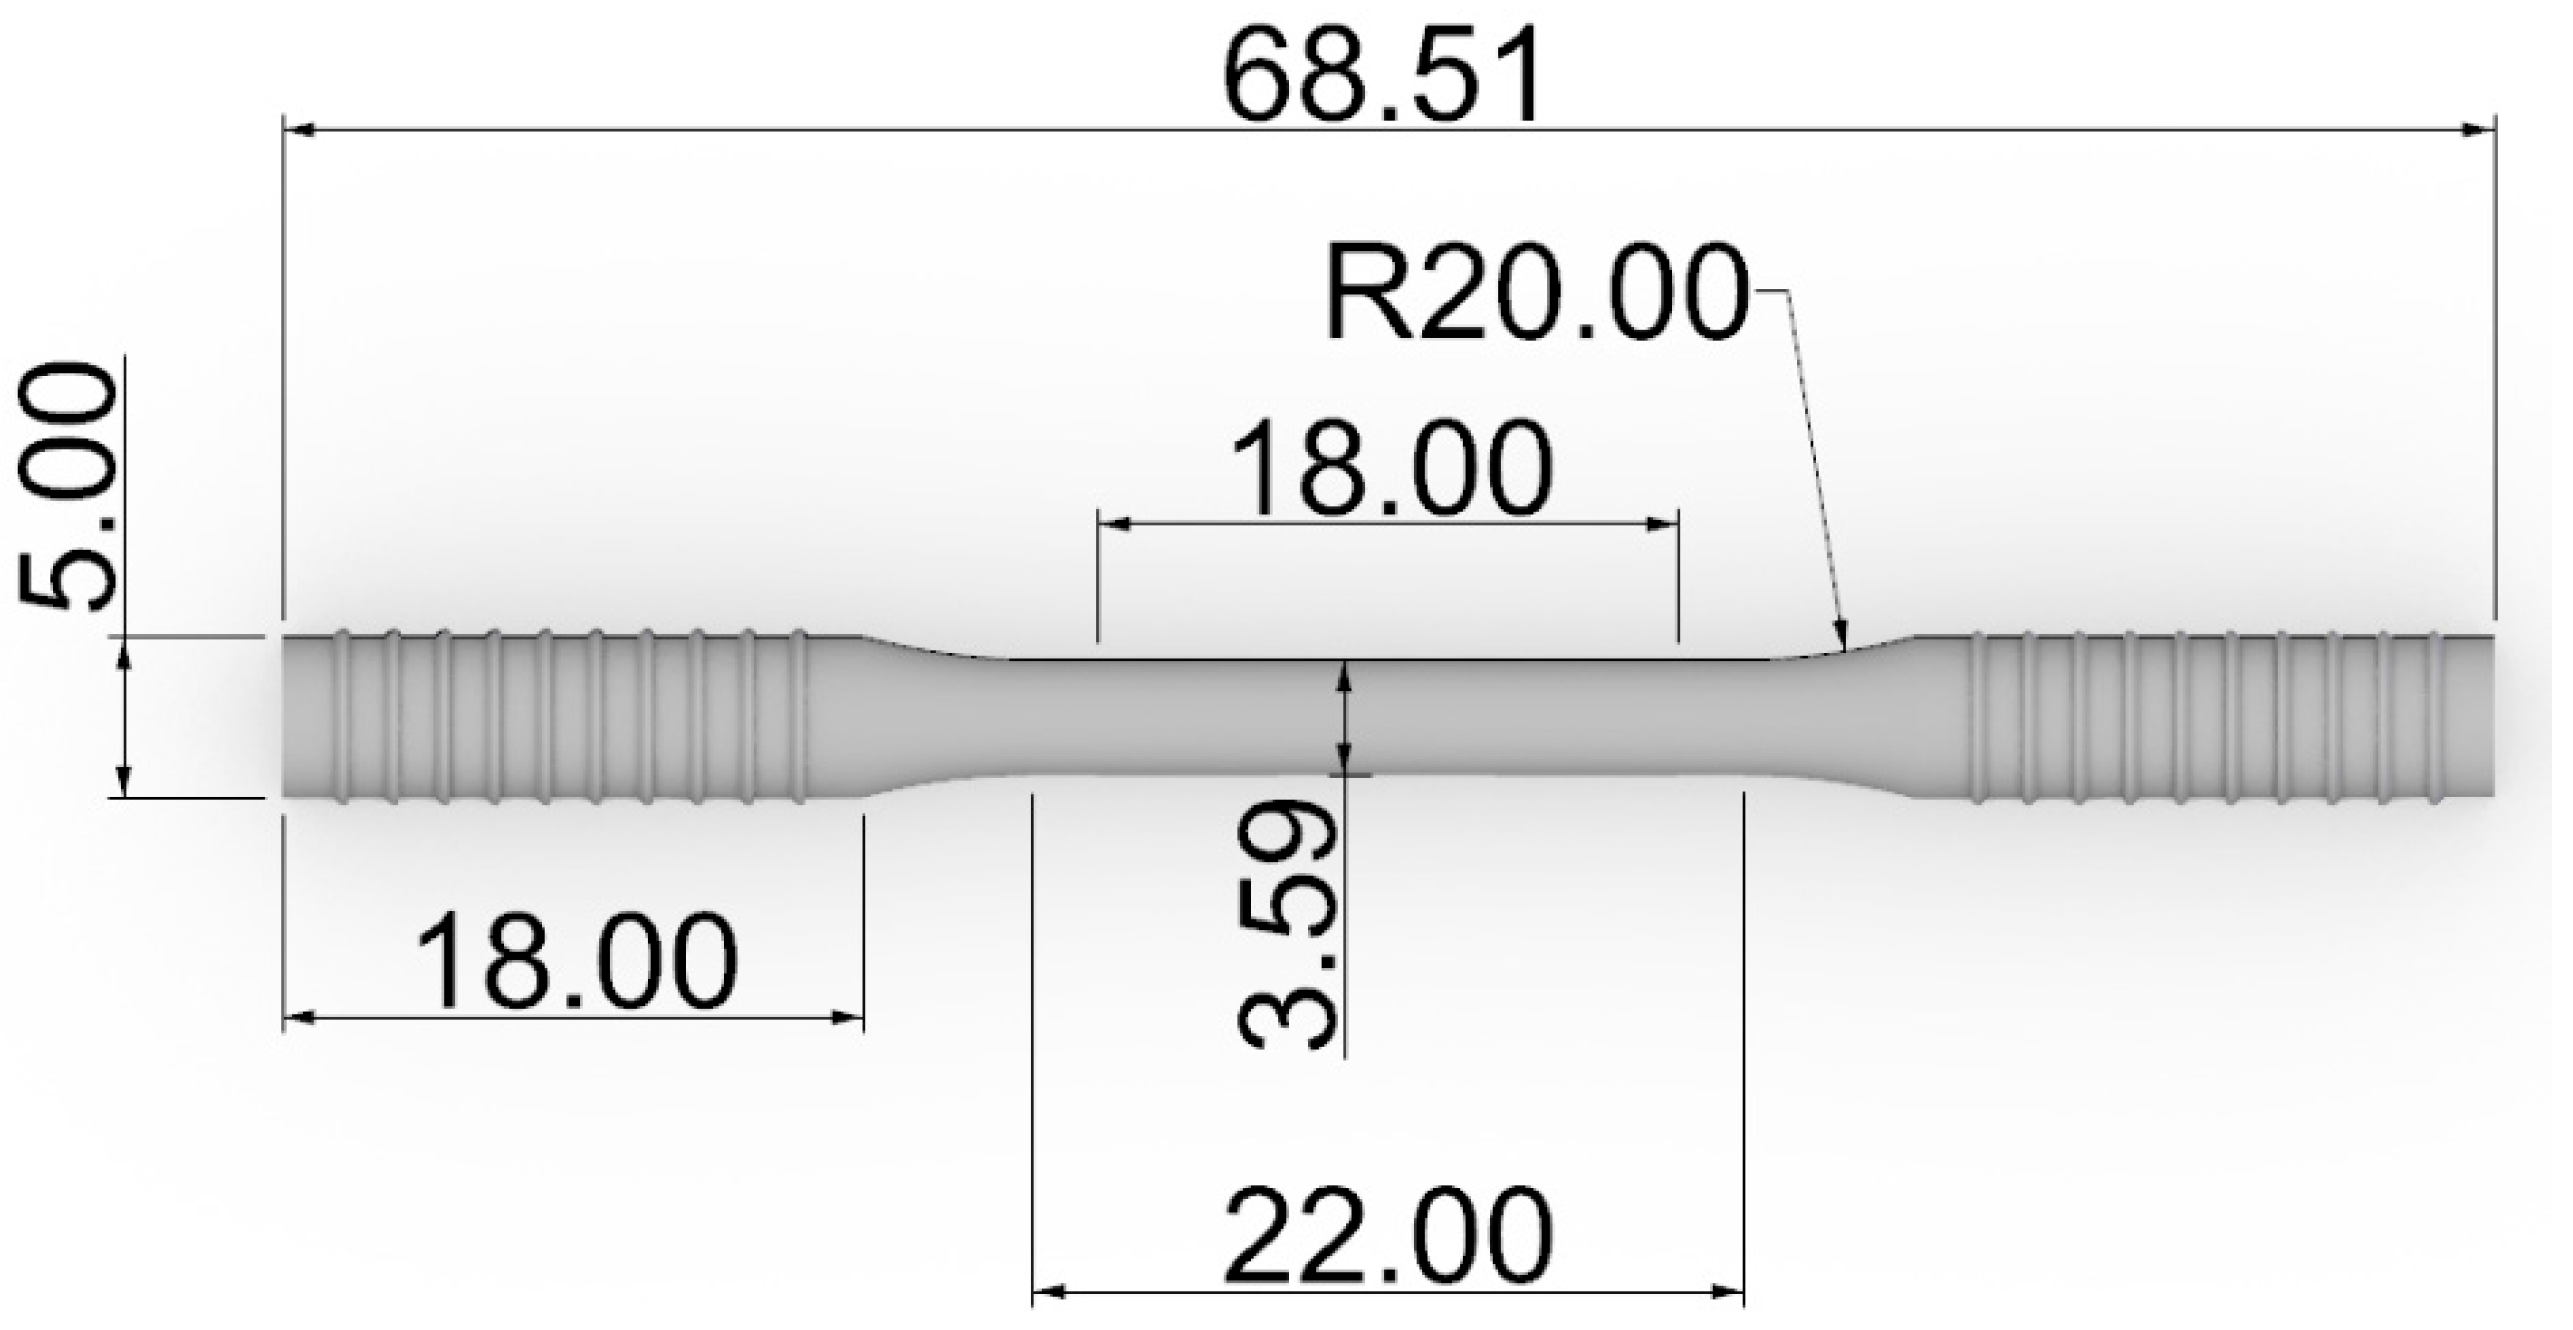
2.4. Fatigue Test Specimens
2.5. Fatigue Testing
2.6. Microscopy
2.7. Nano-Indentation
2.8. Scanning Electron Microscopy (SEM)
3. Results
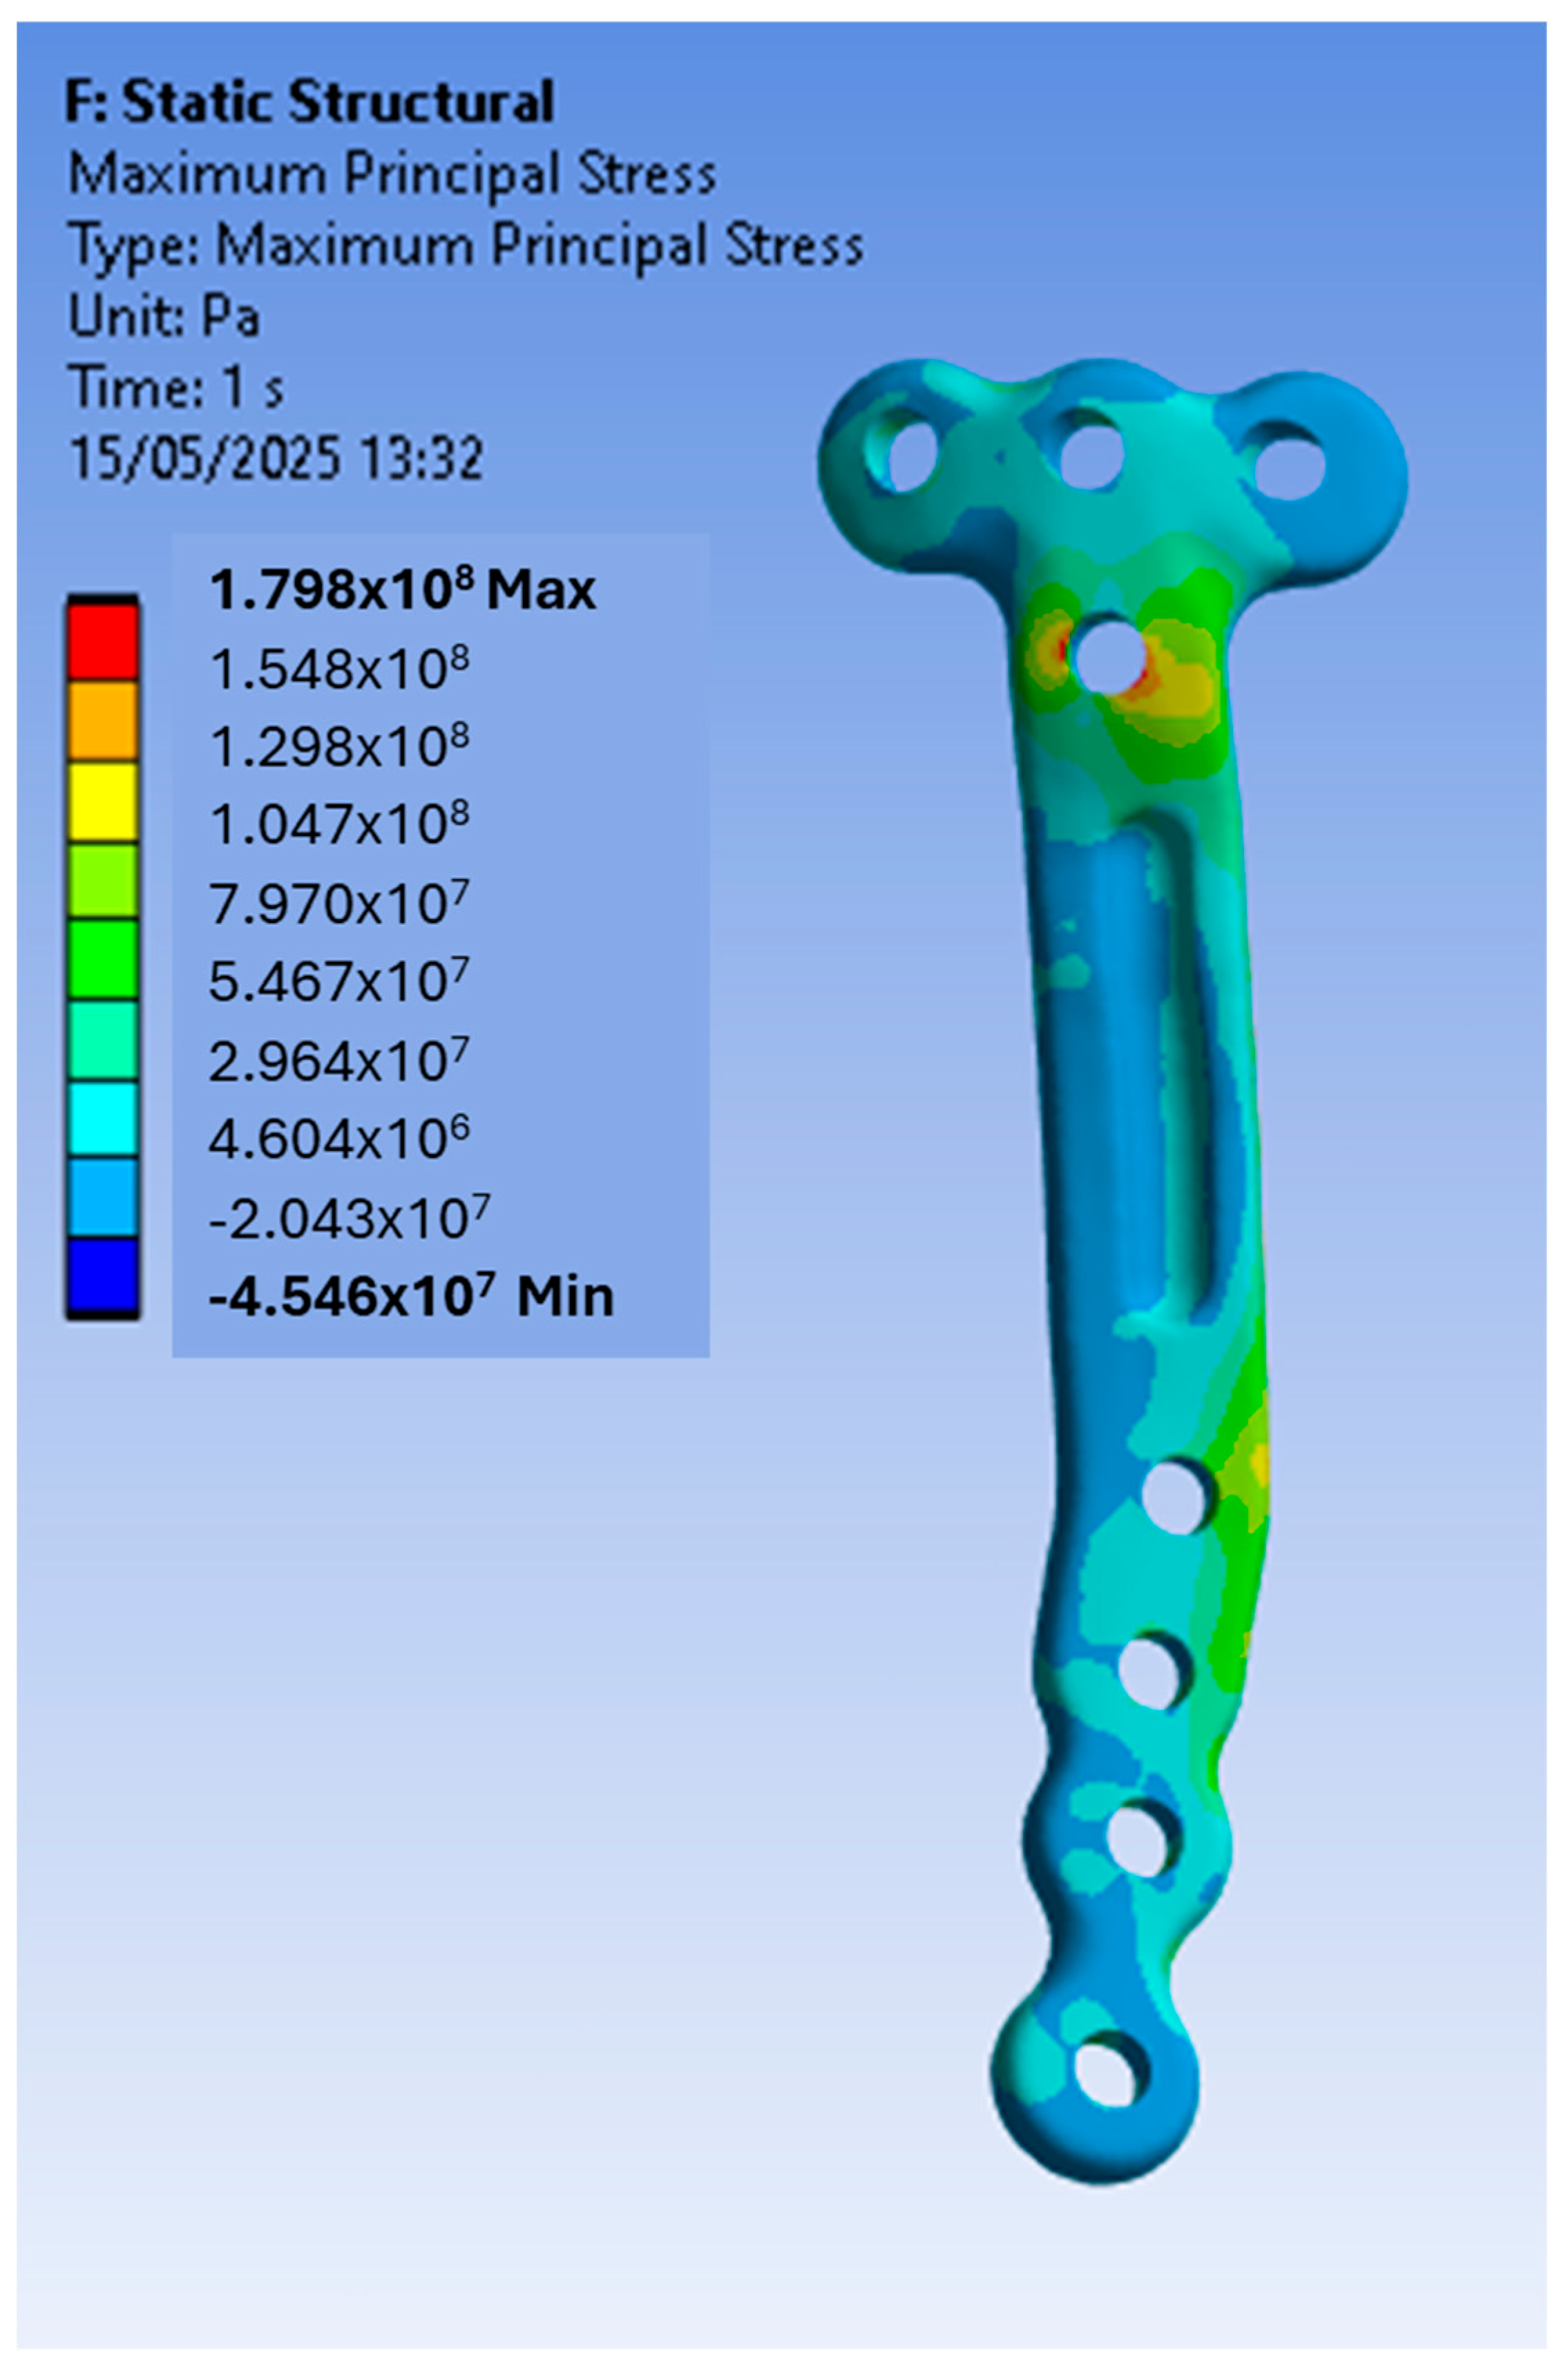
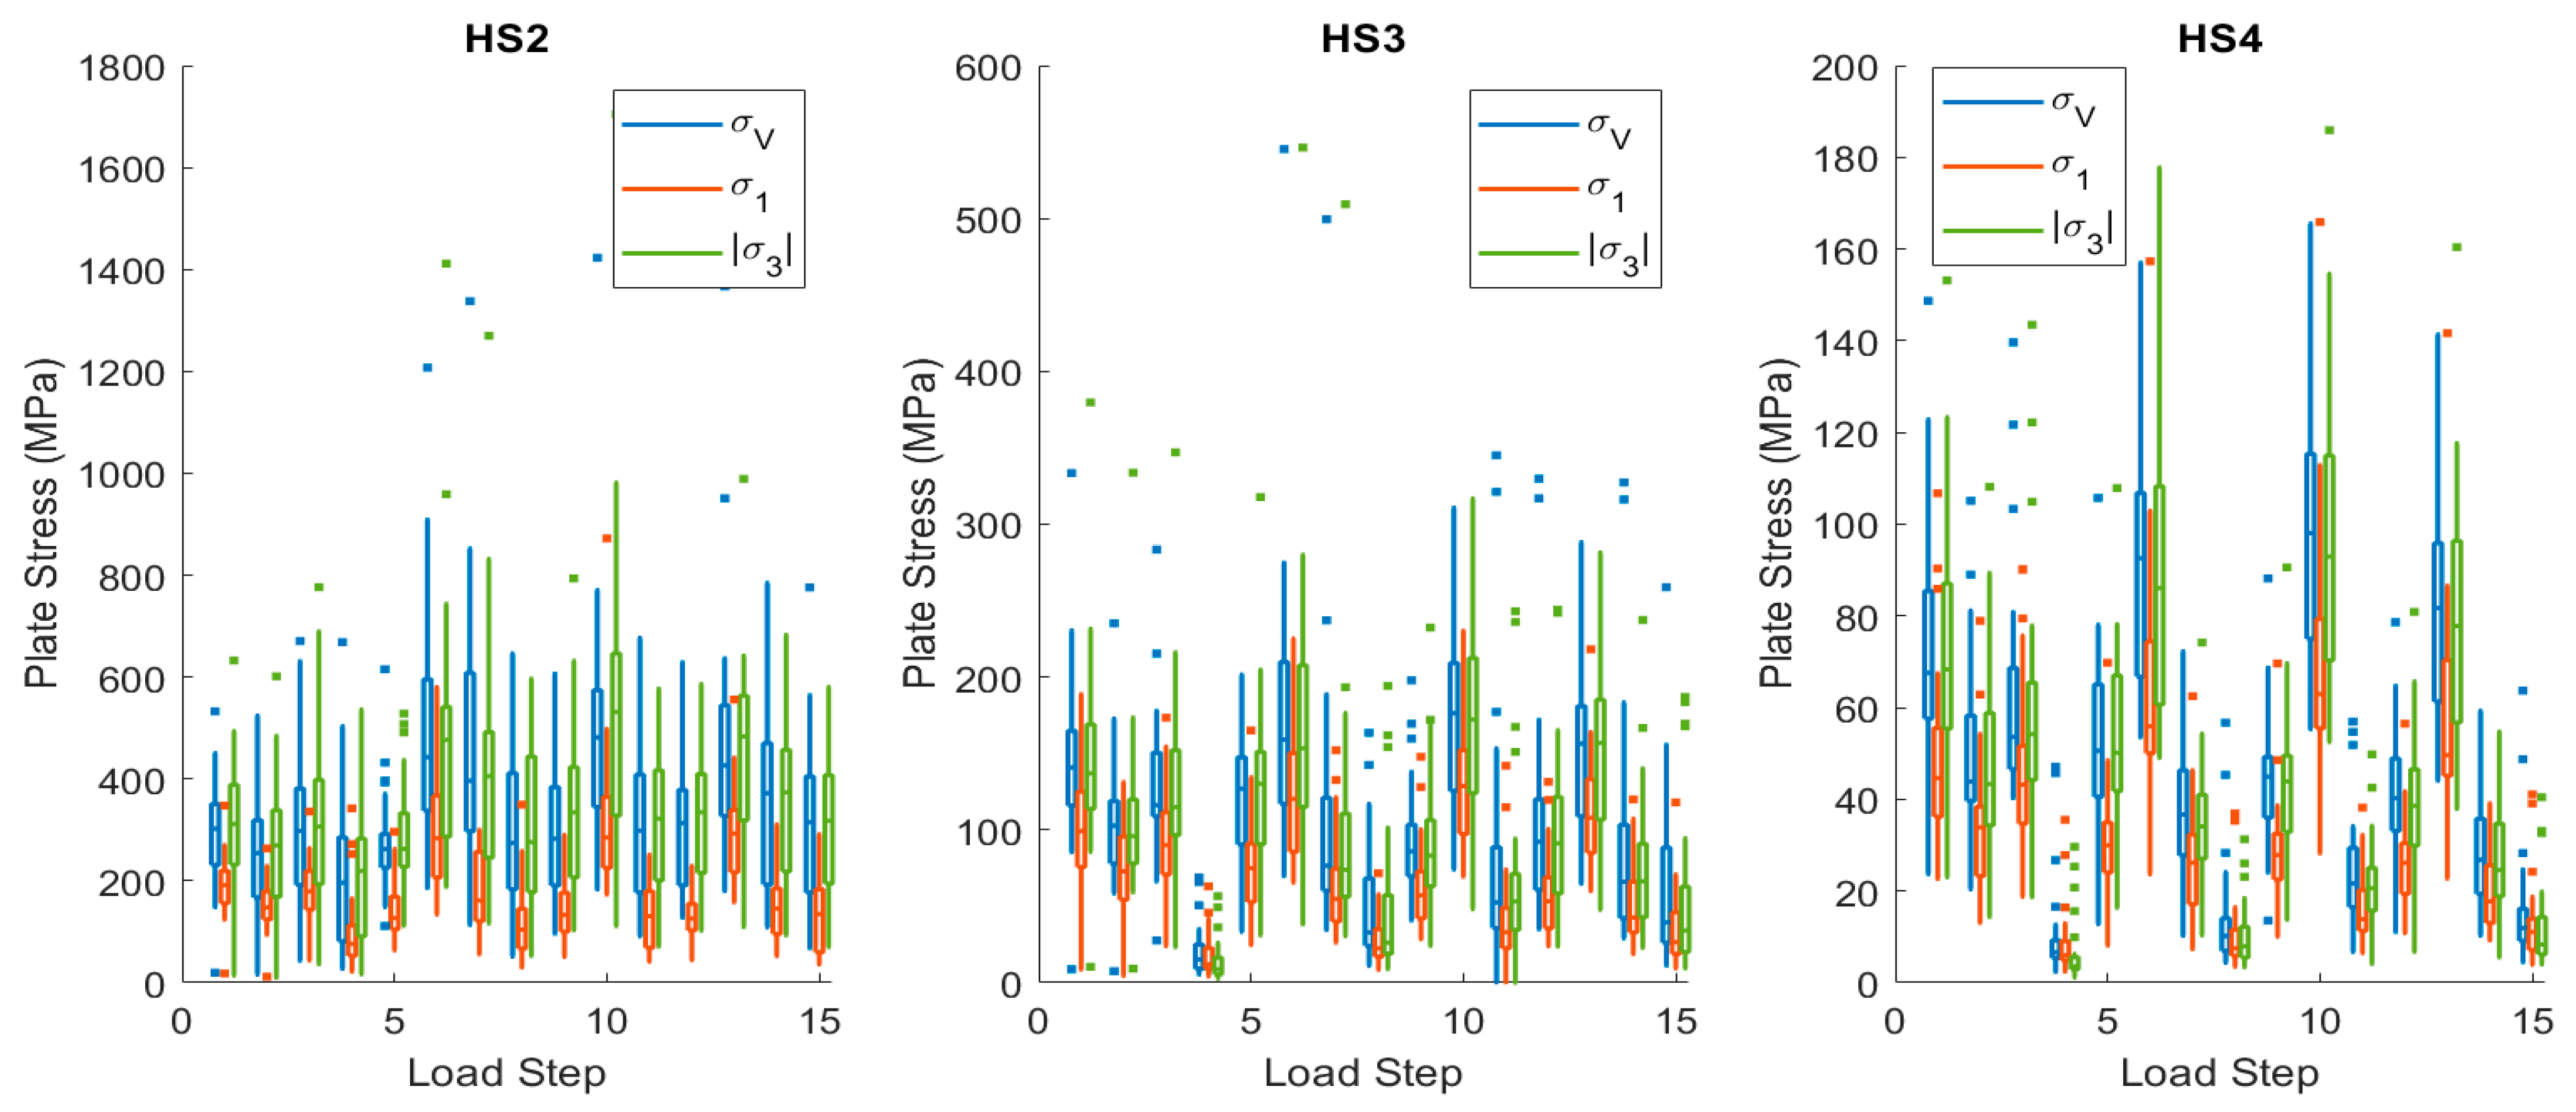
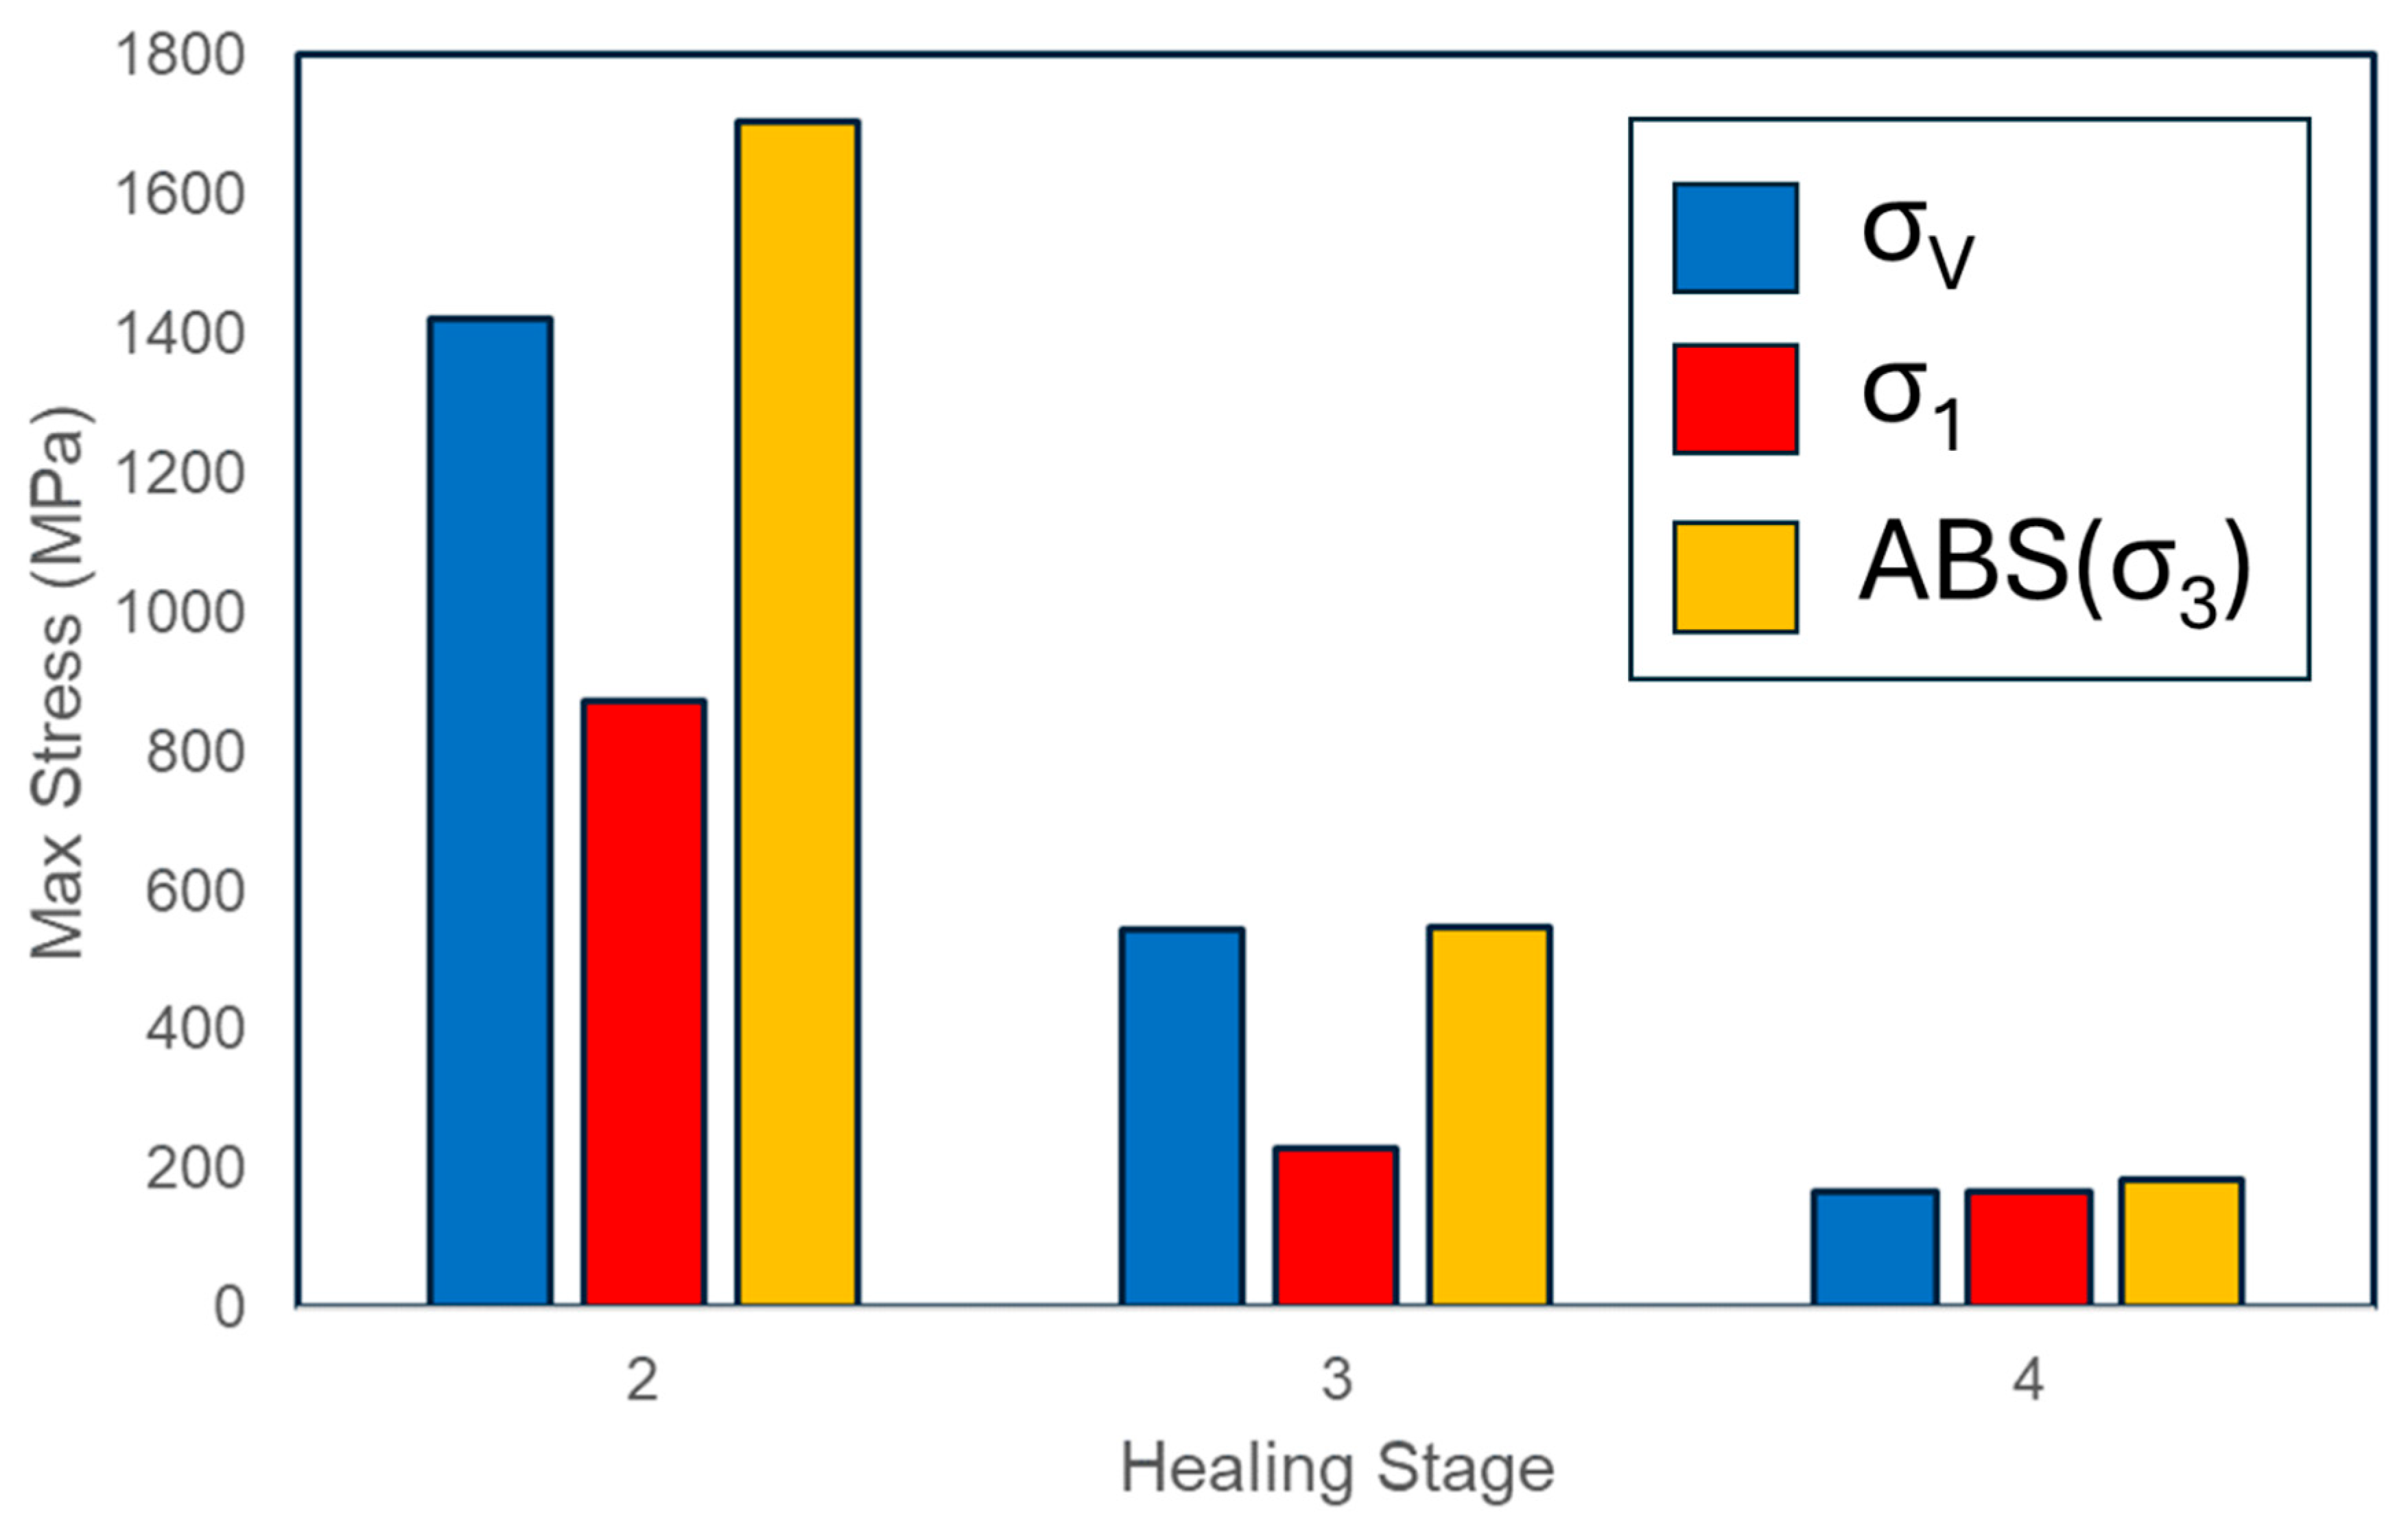
3.1. Finite Element Modelling
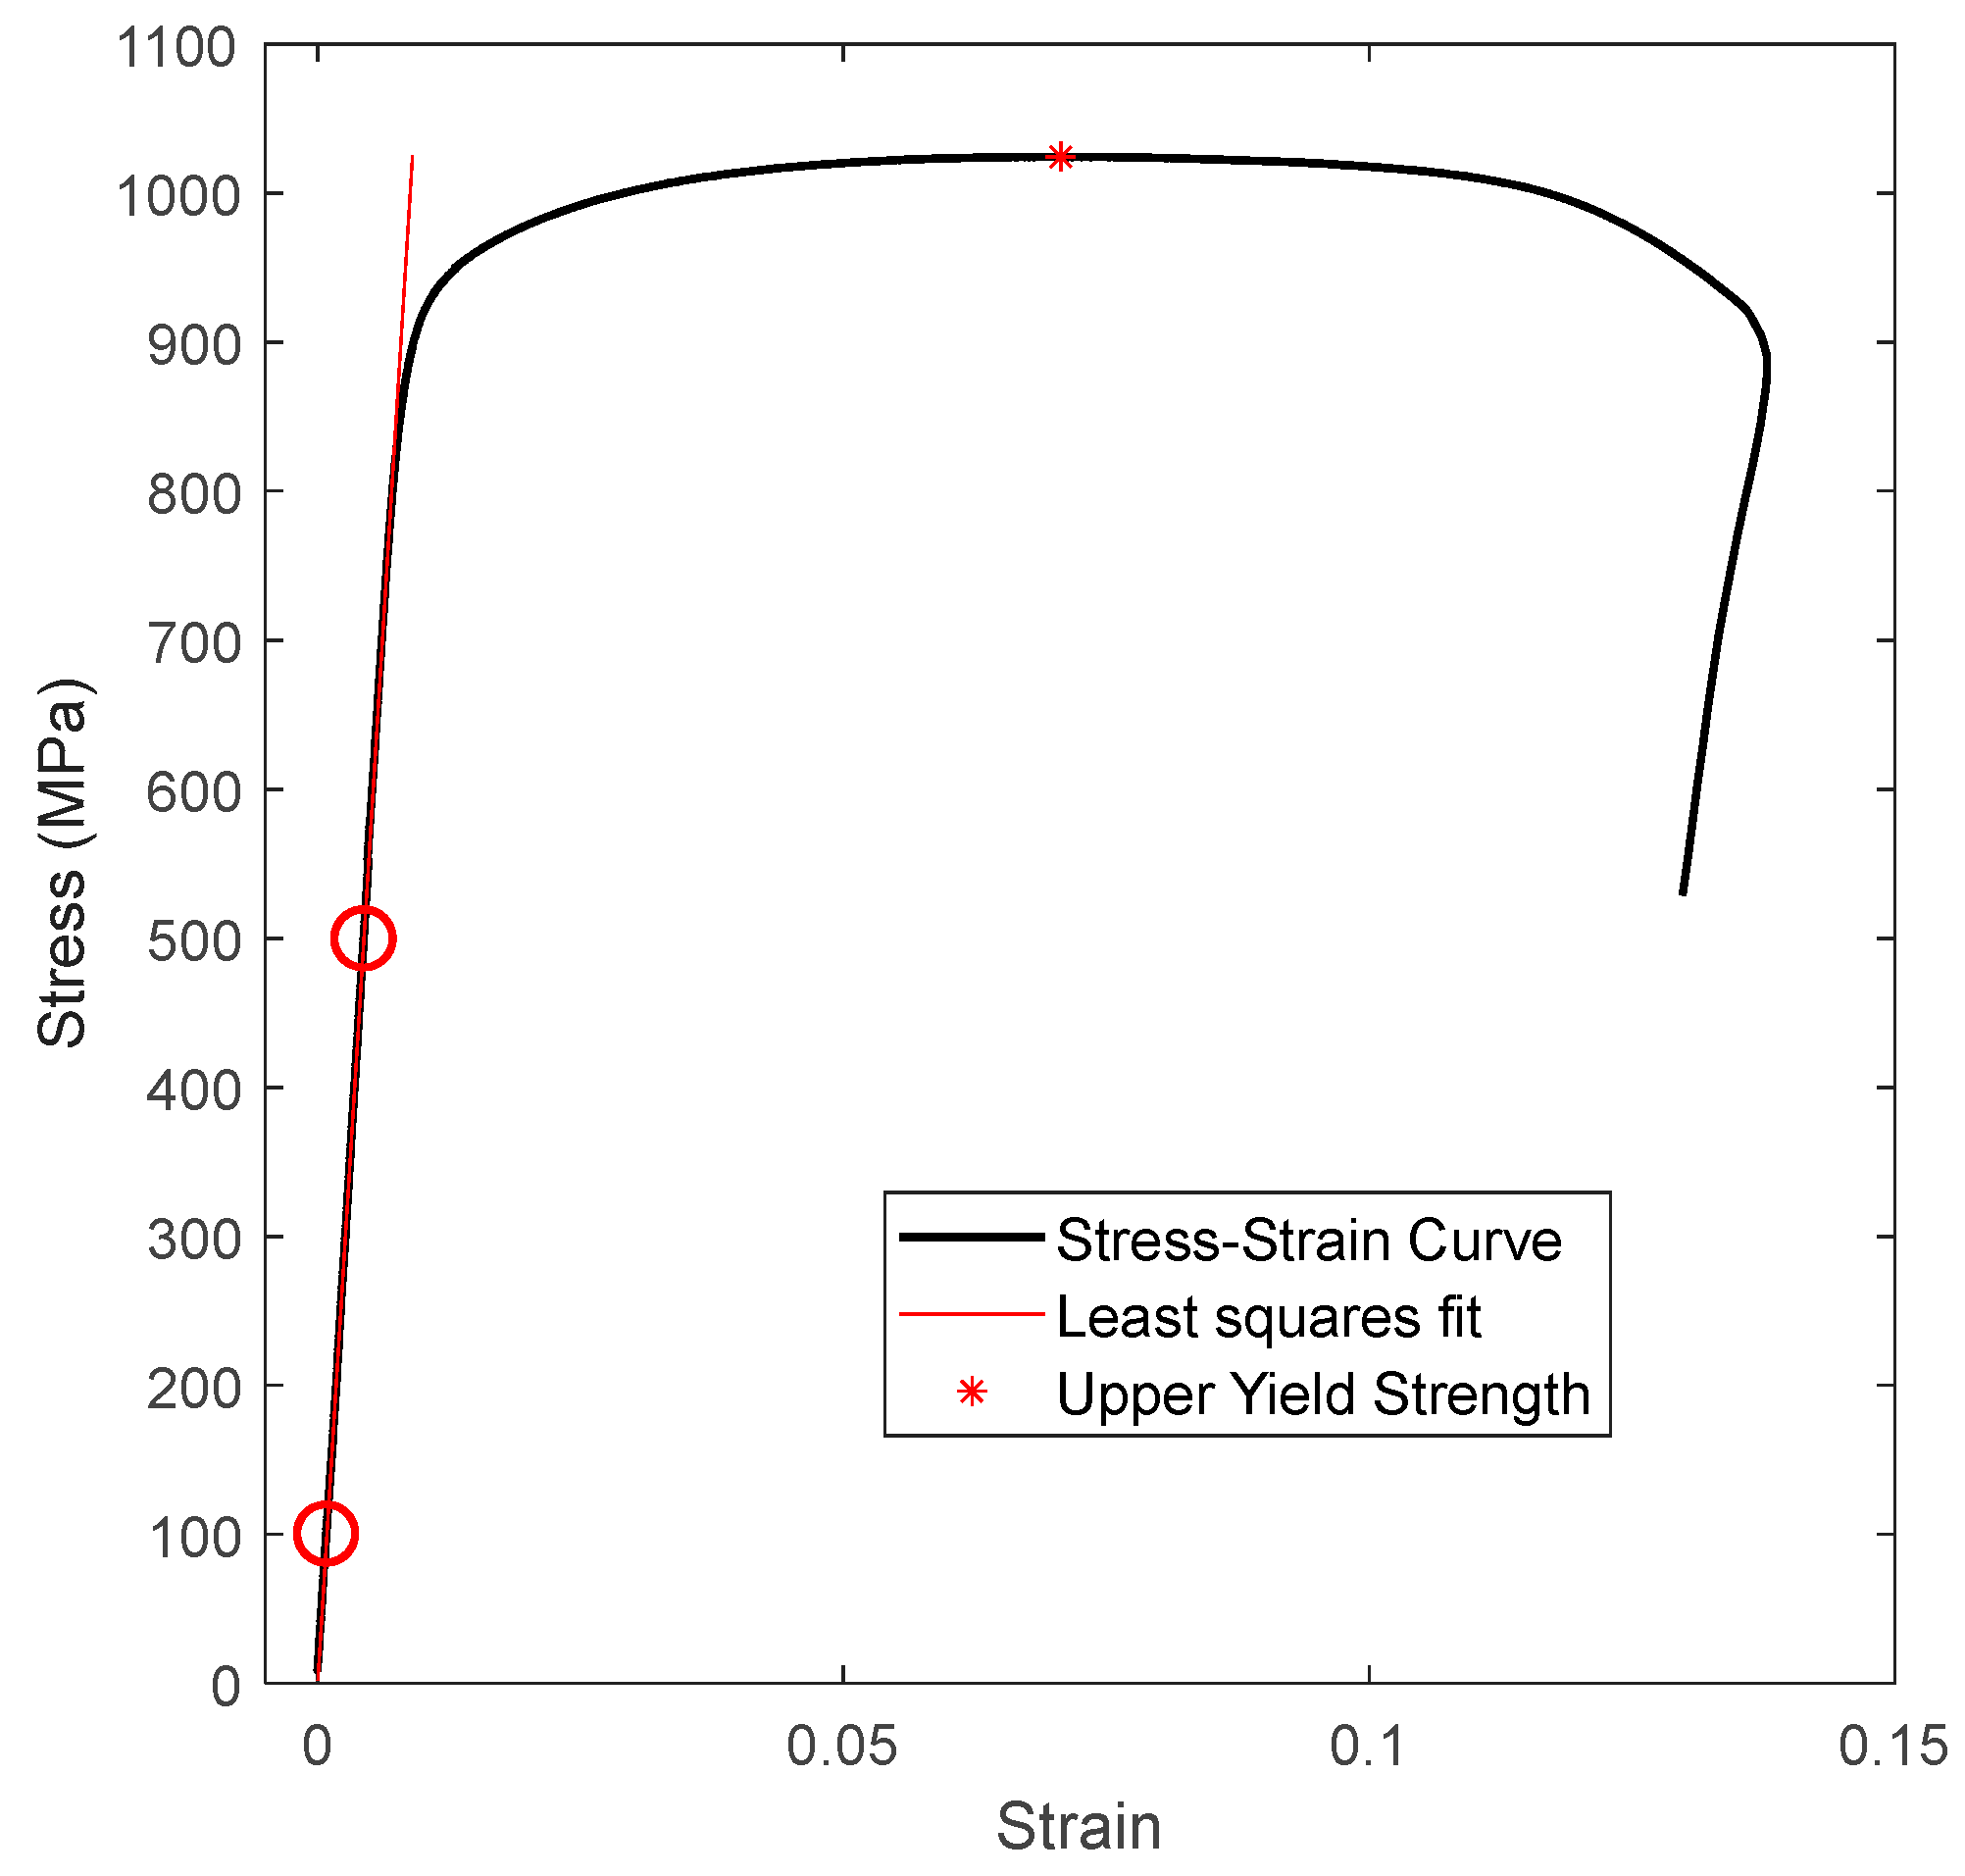
3.2. Tensile Tests
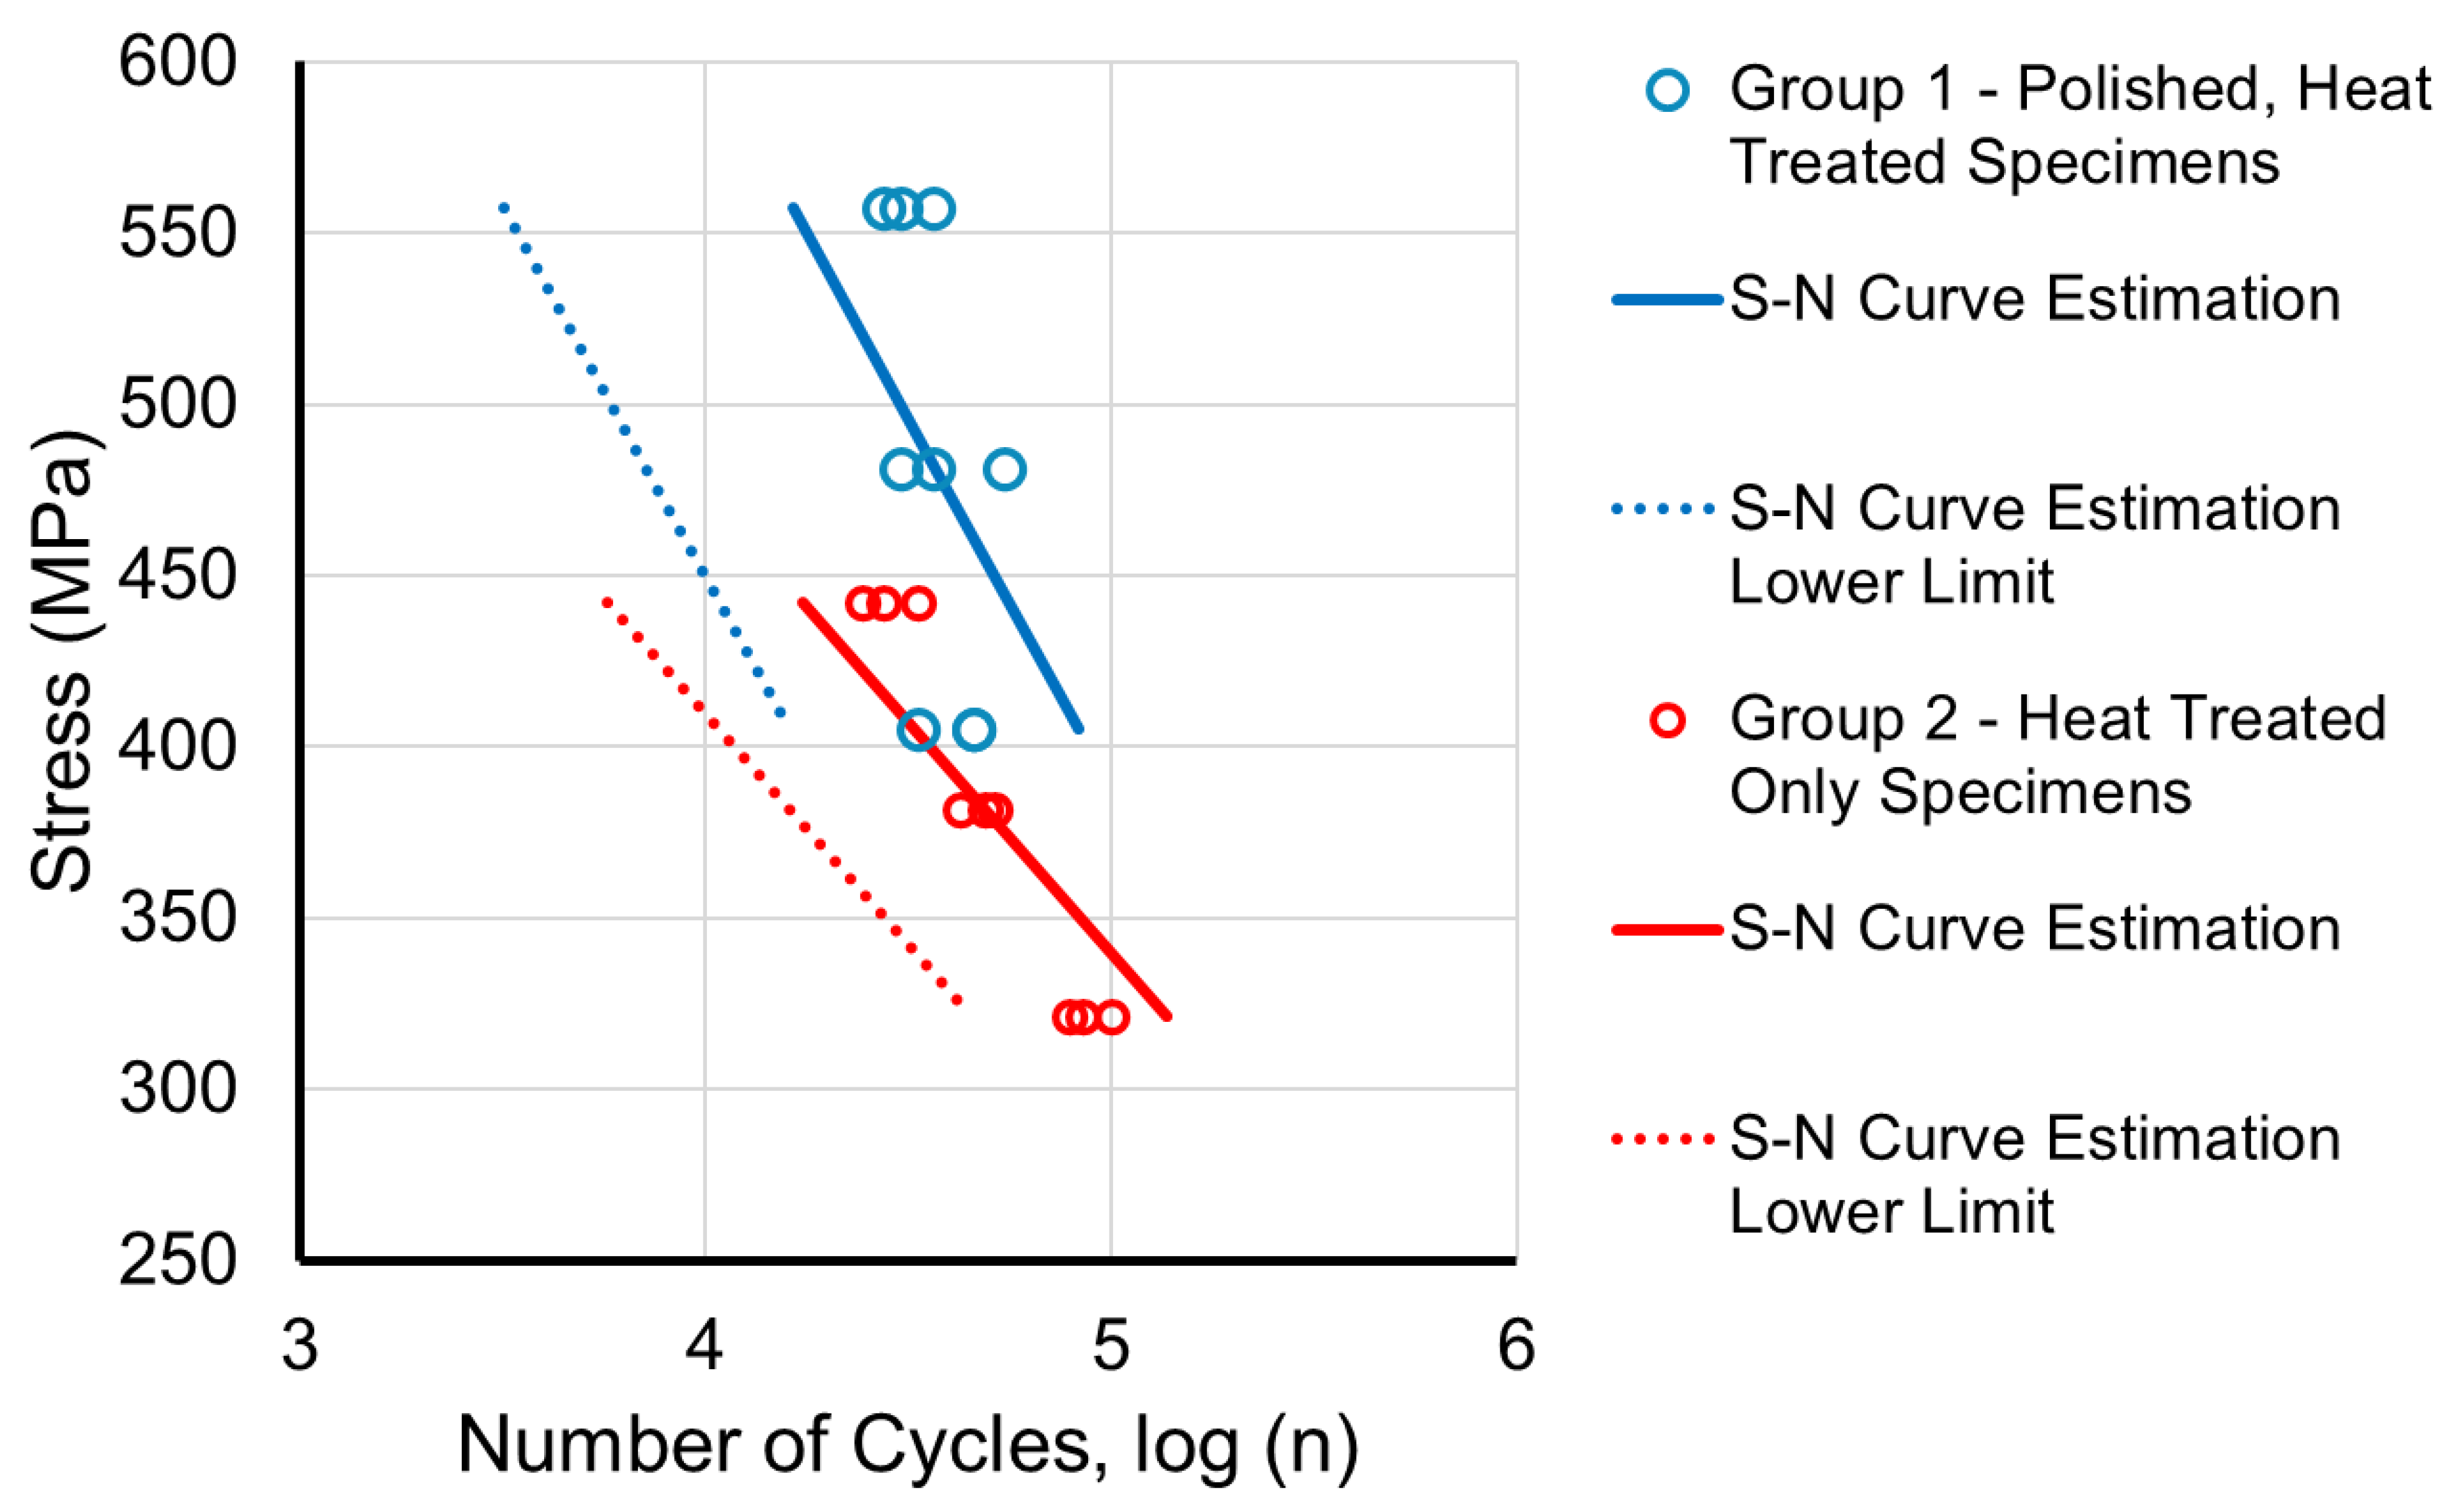
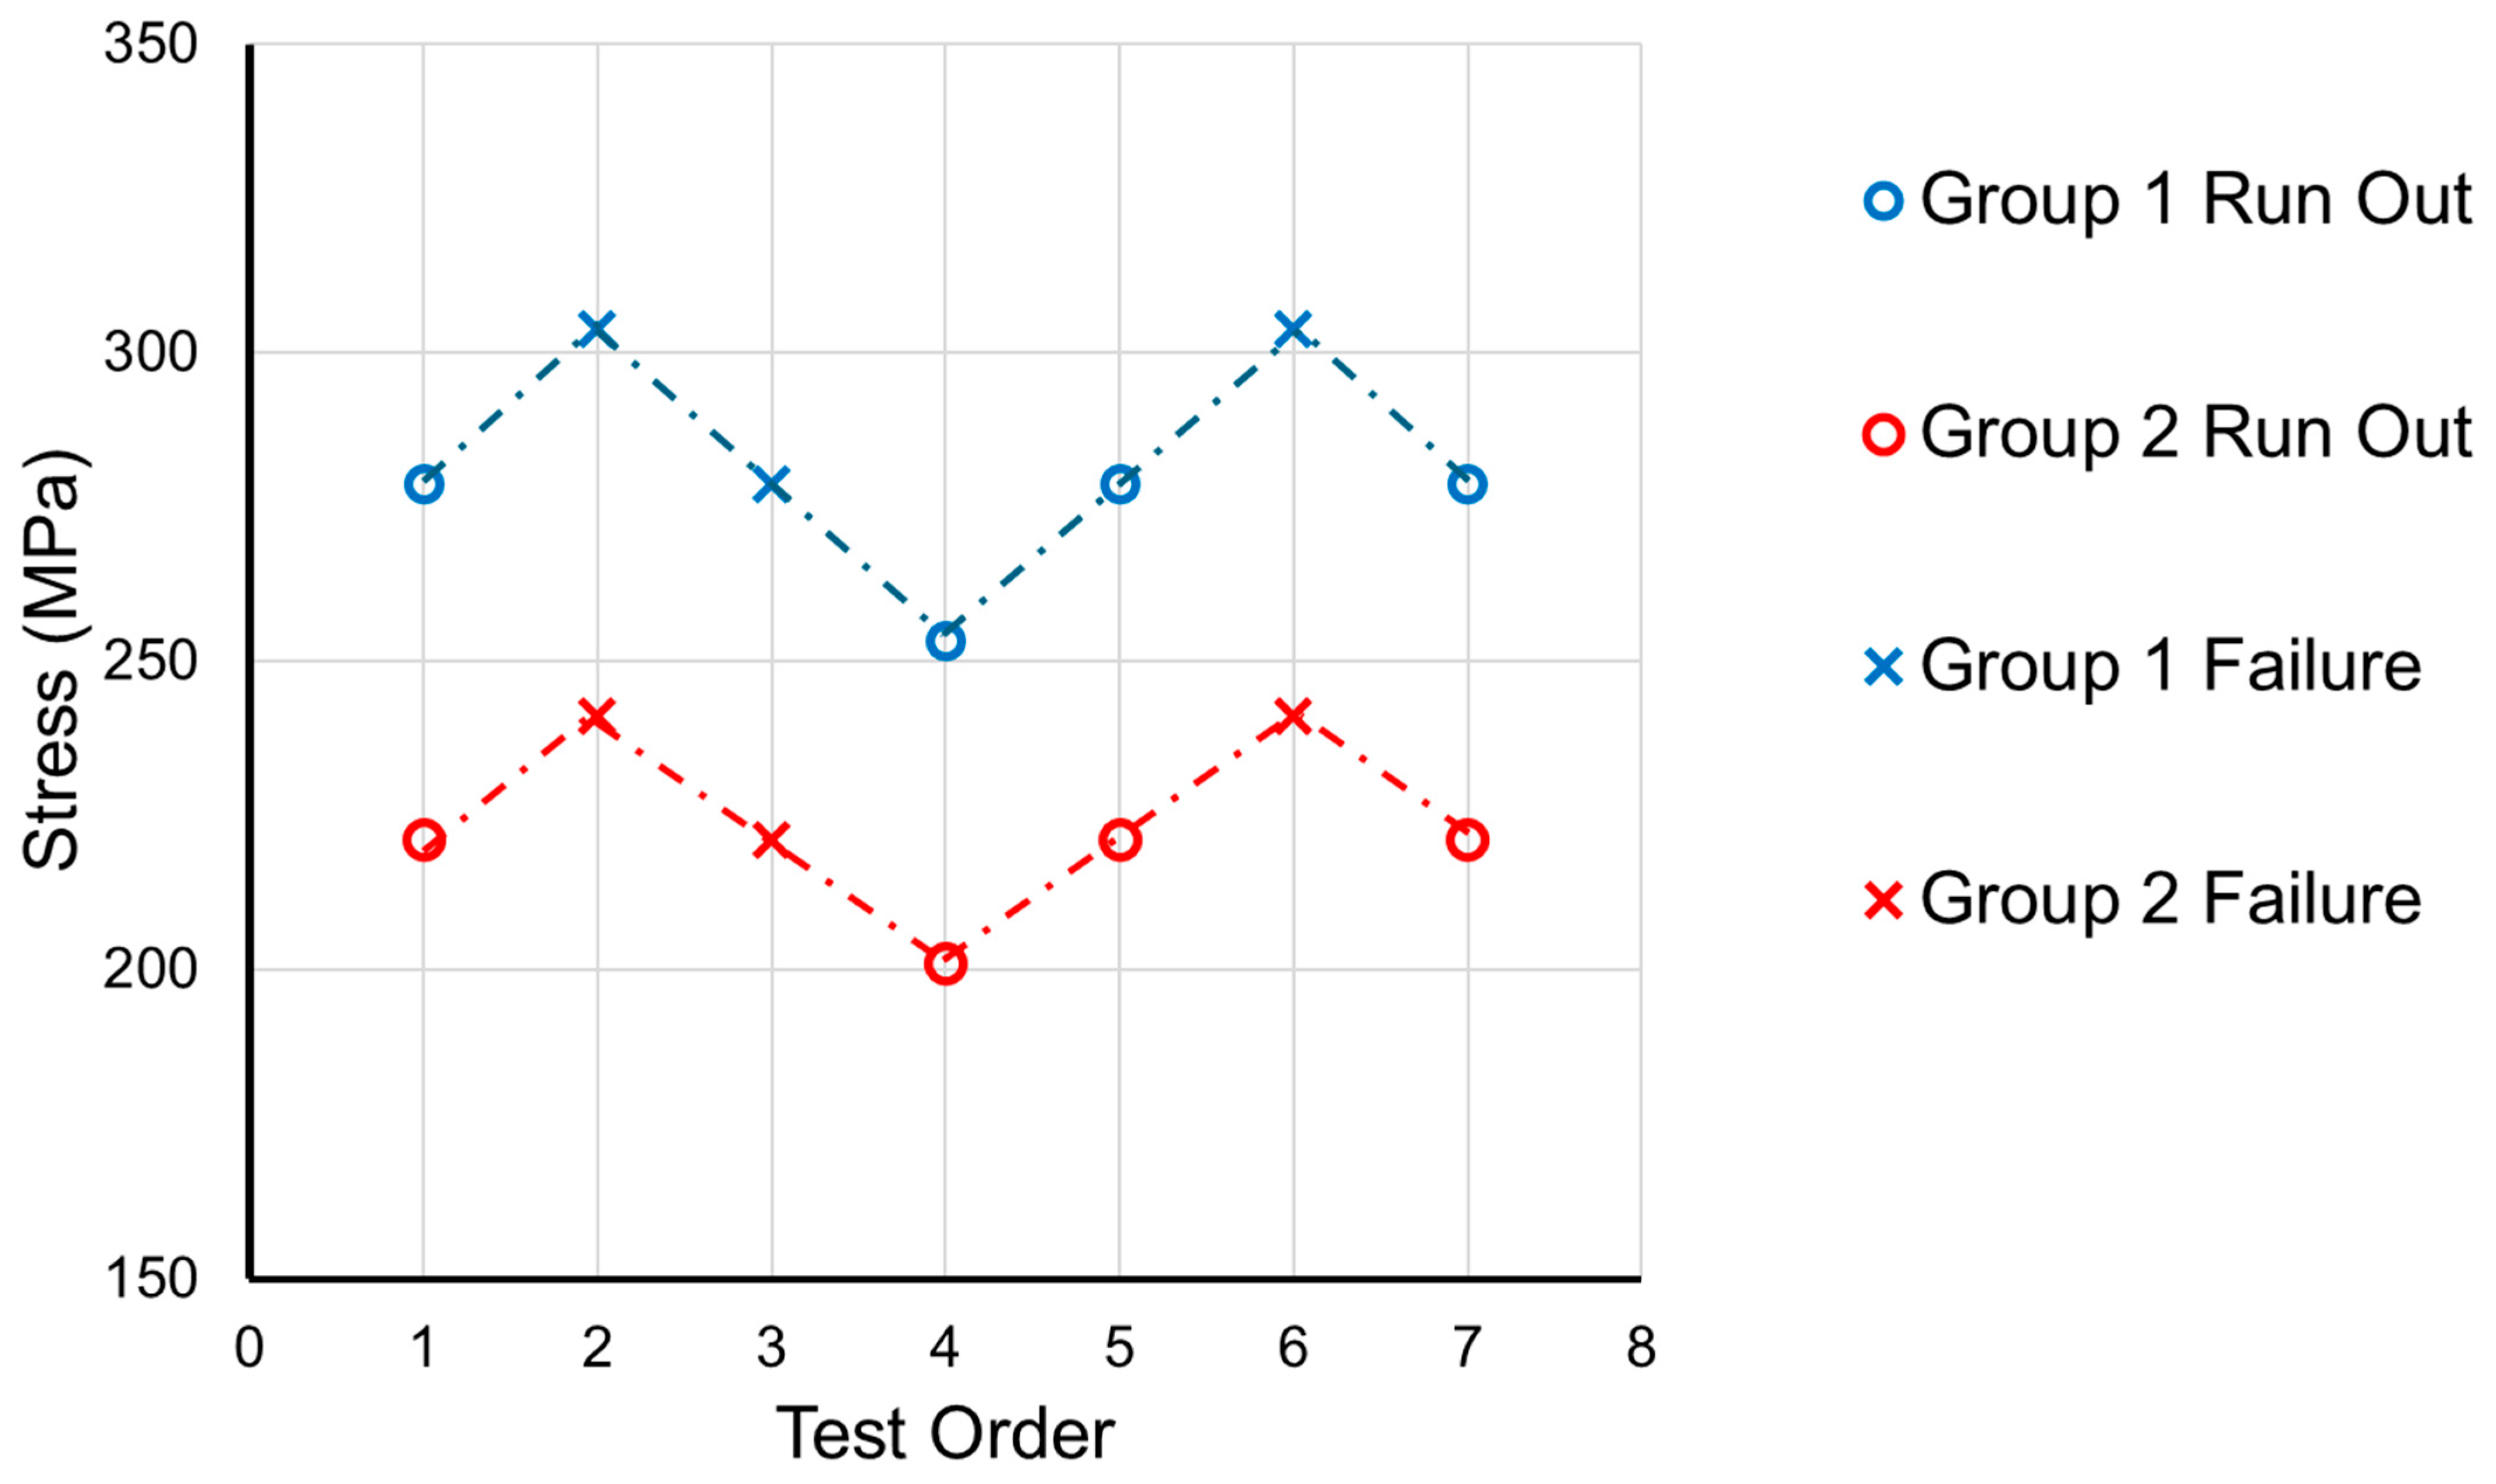
3.3. Fatigue Tests
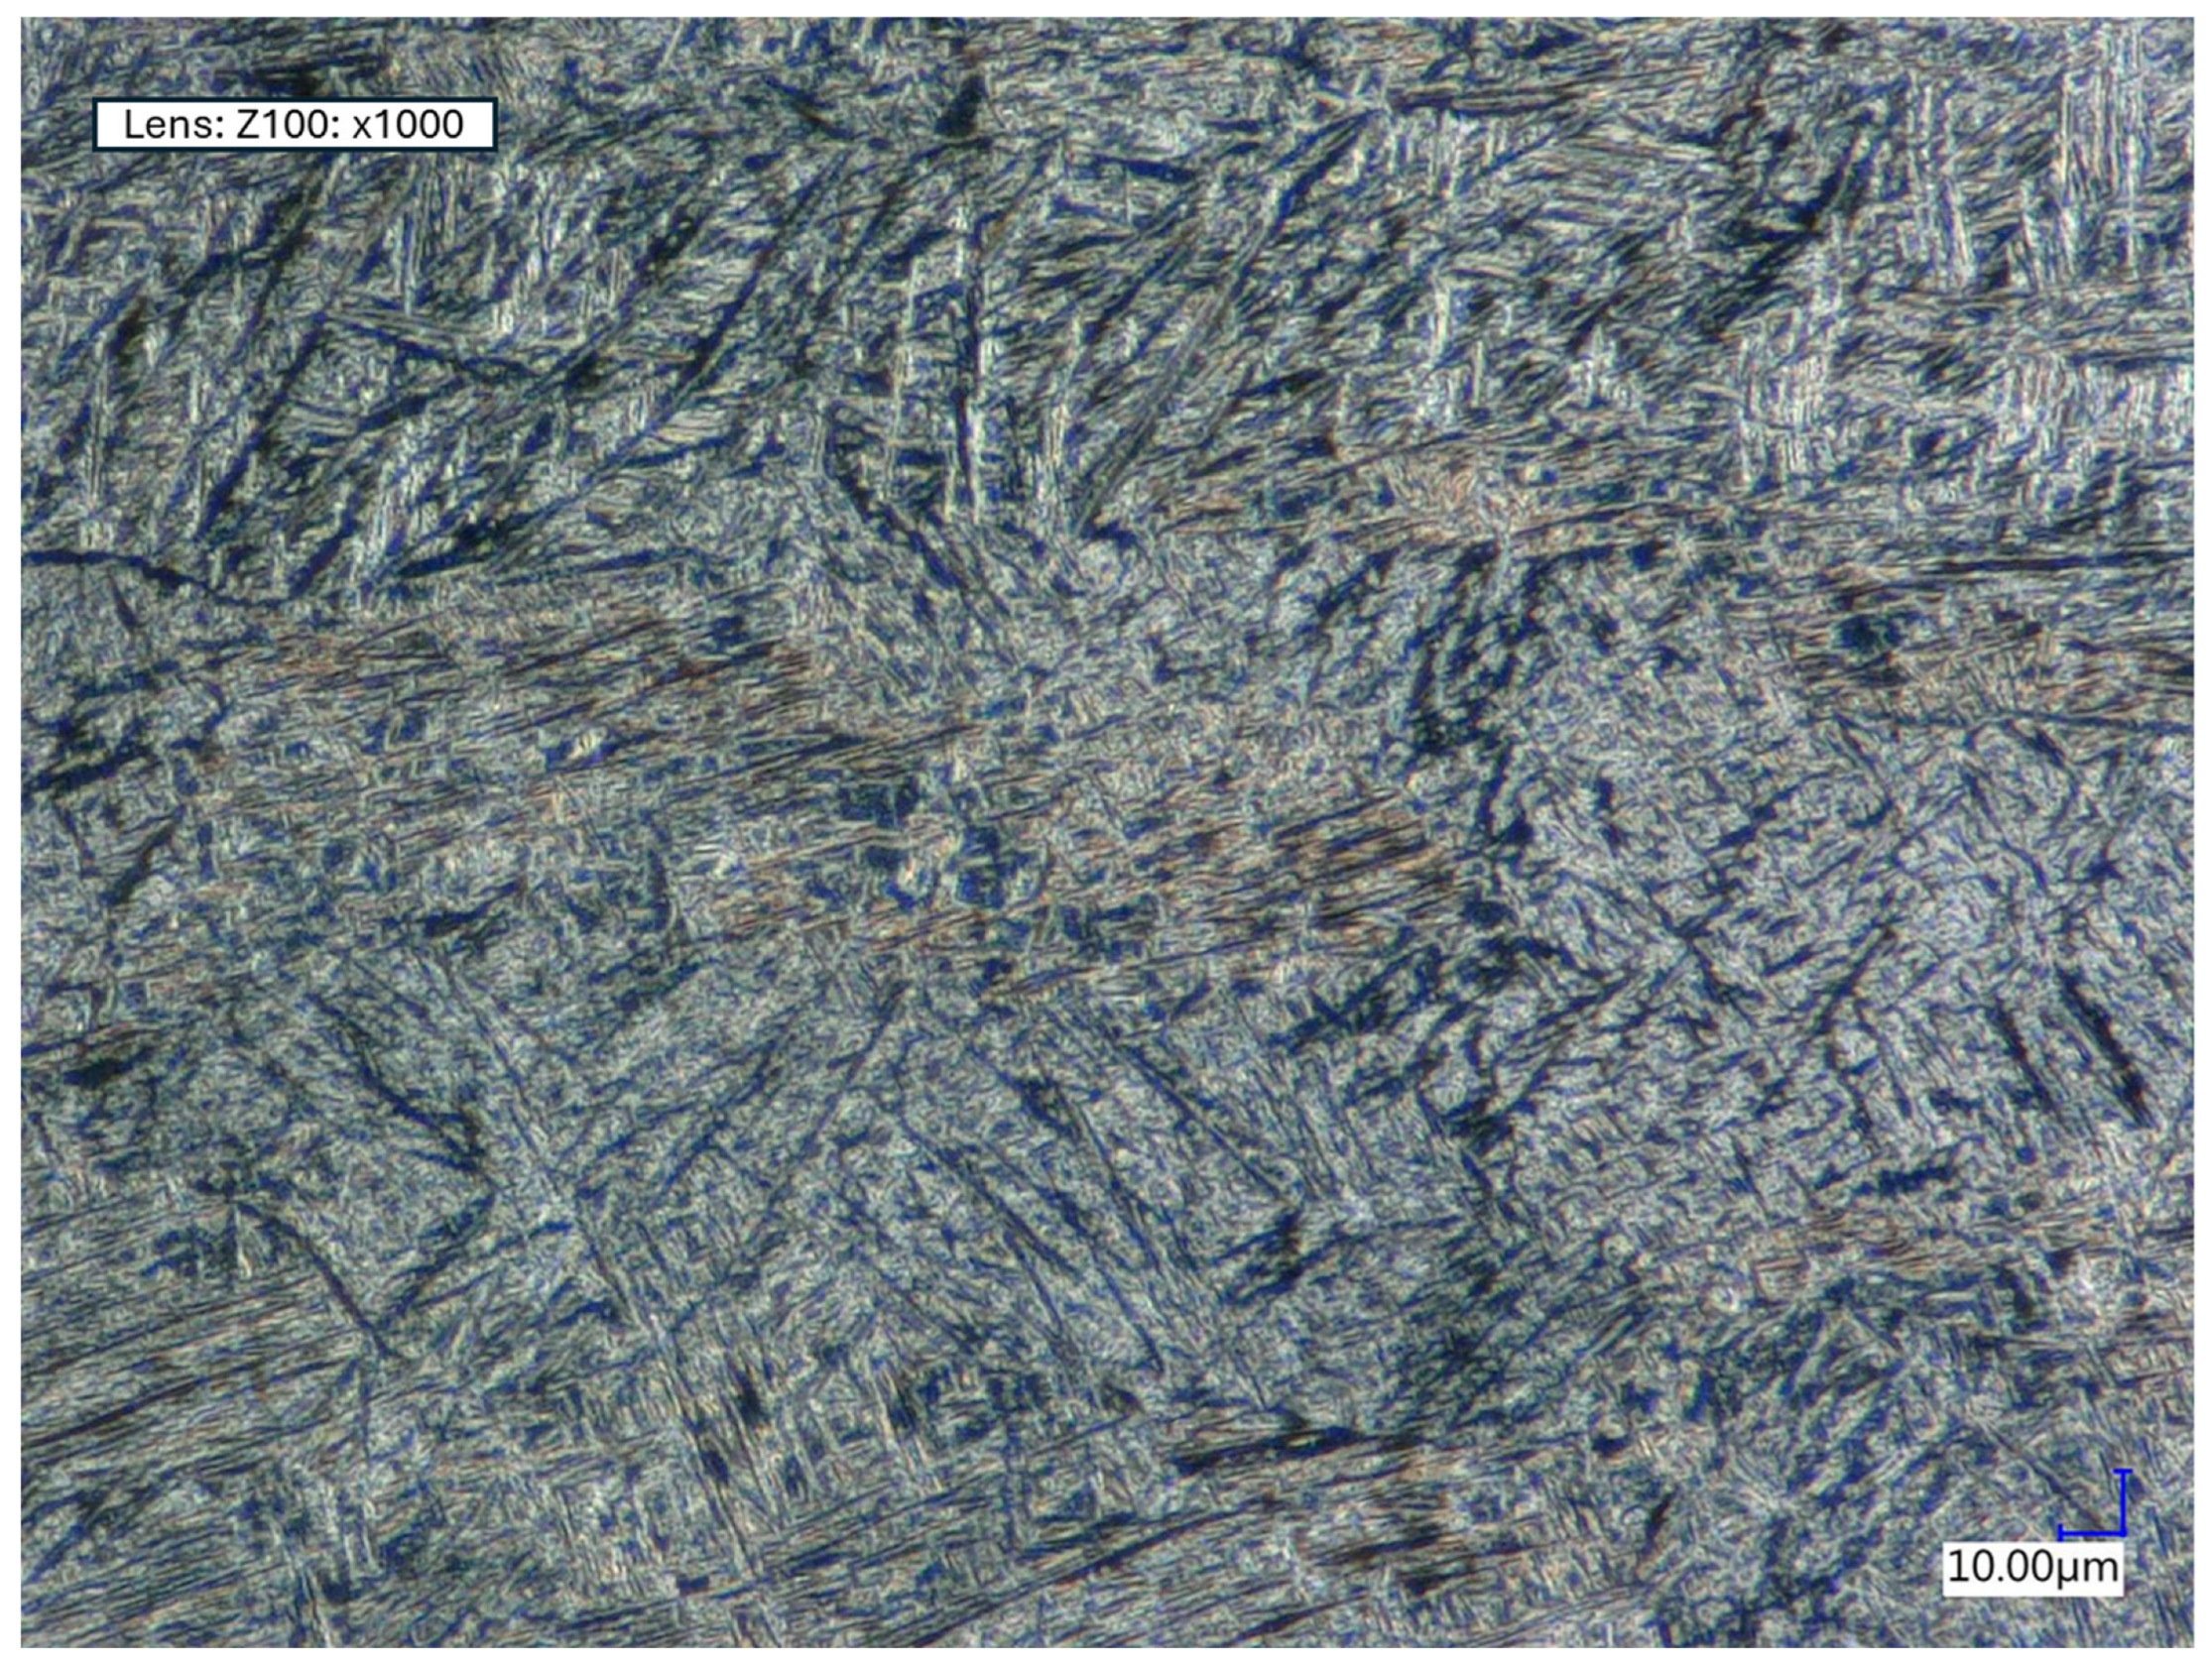
3.4. Microstructural Analysis
3.5. Nano-Indentation
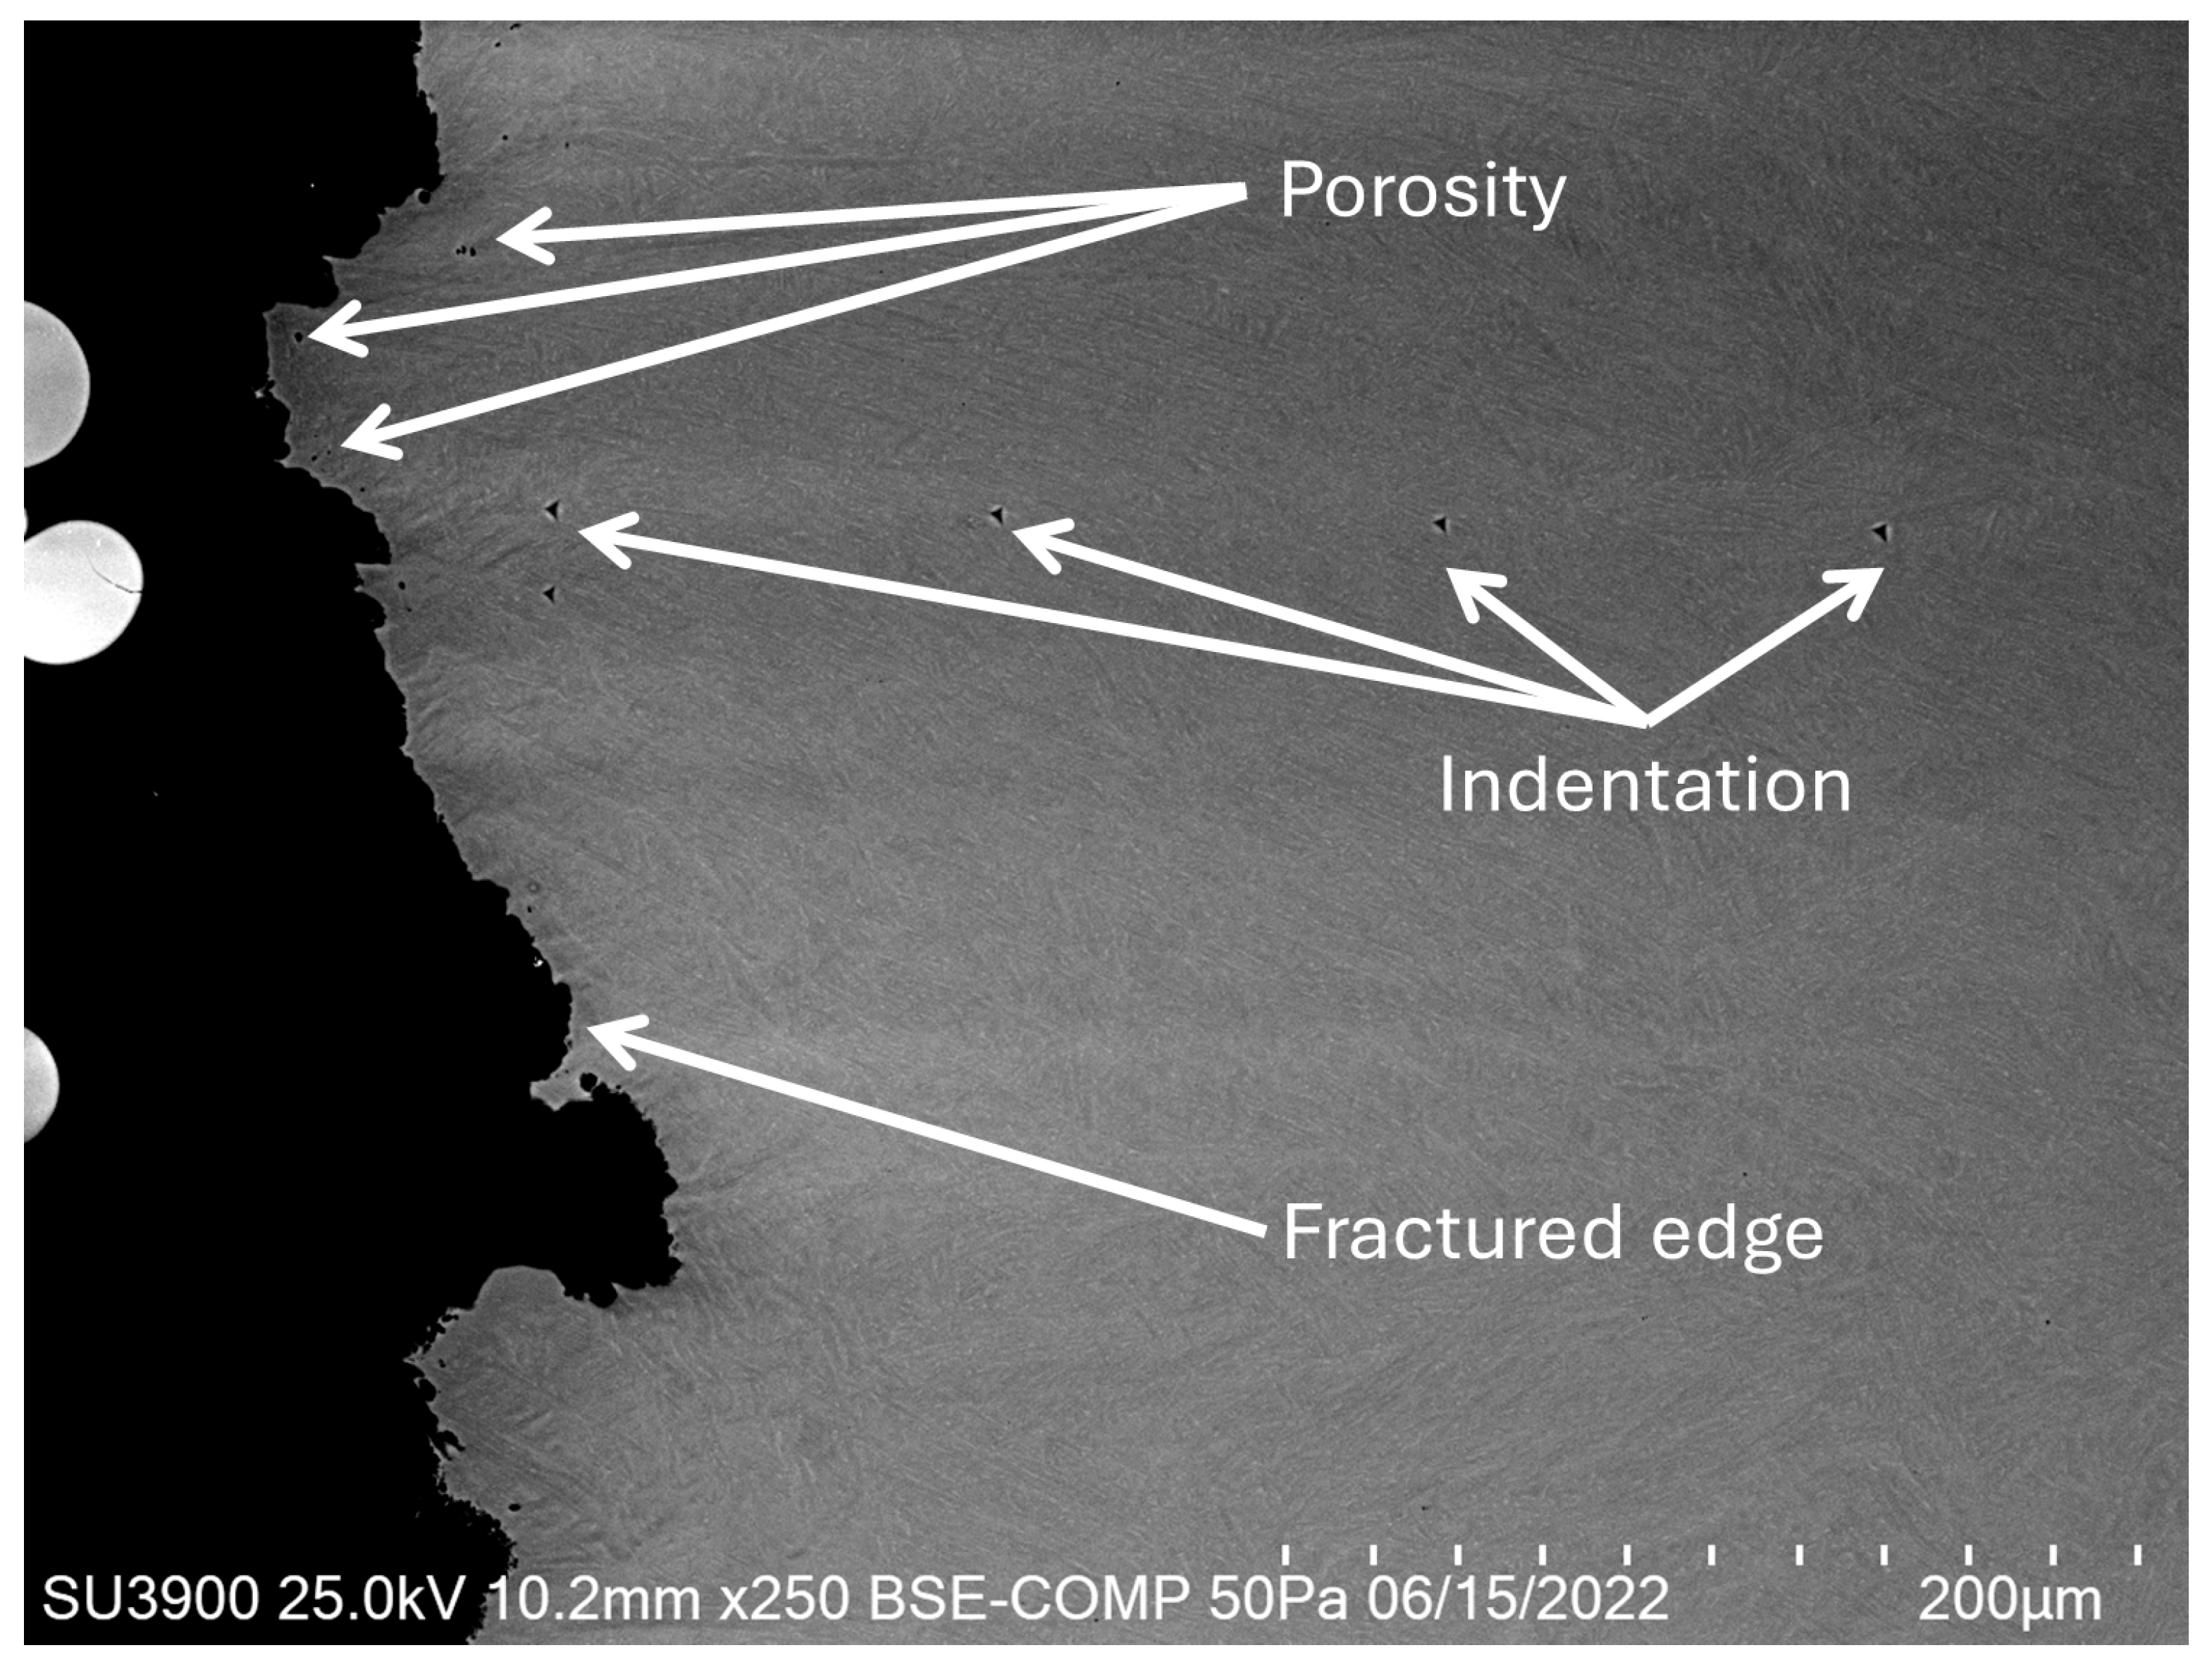
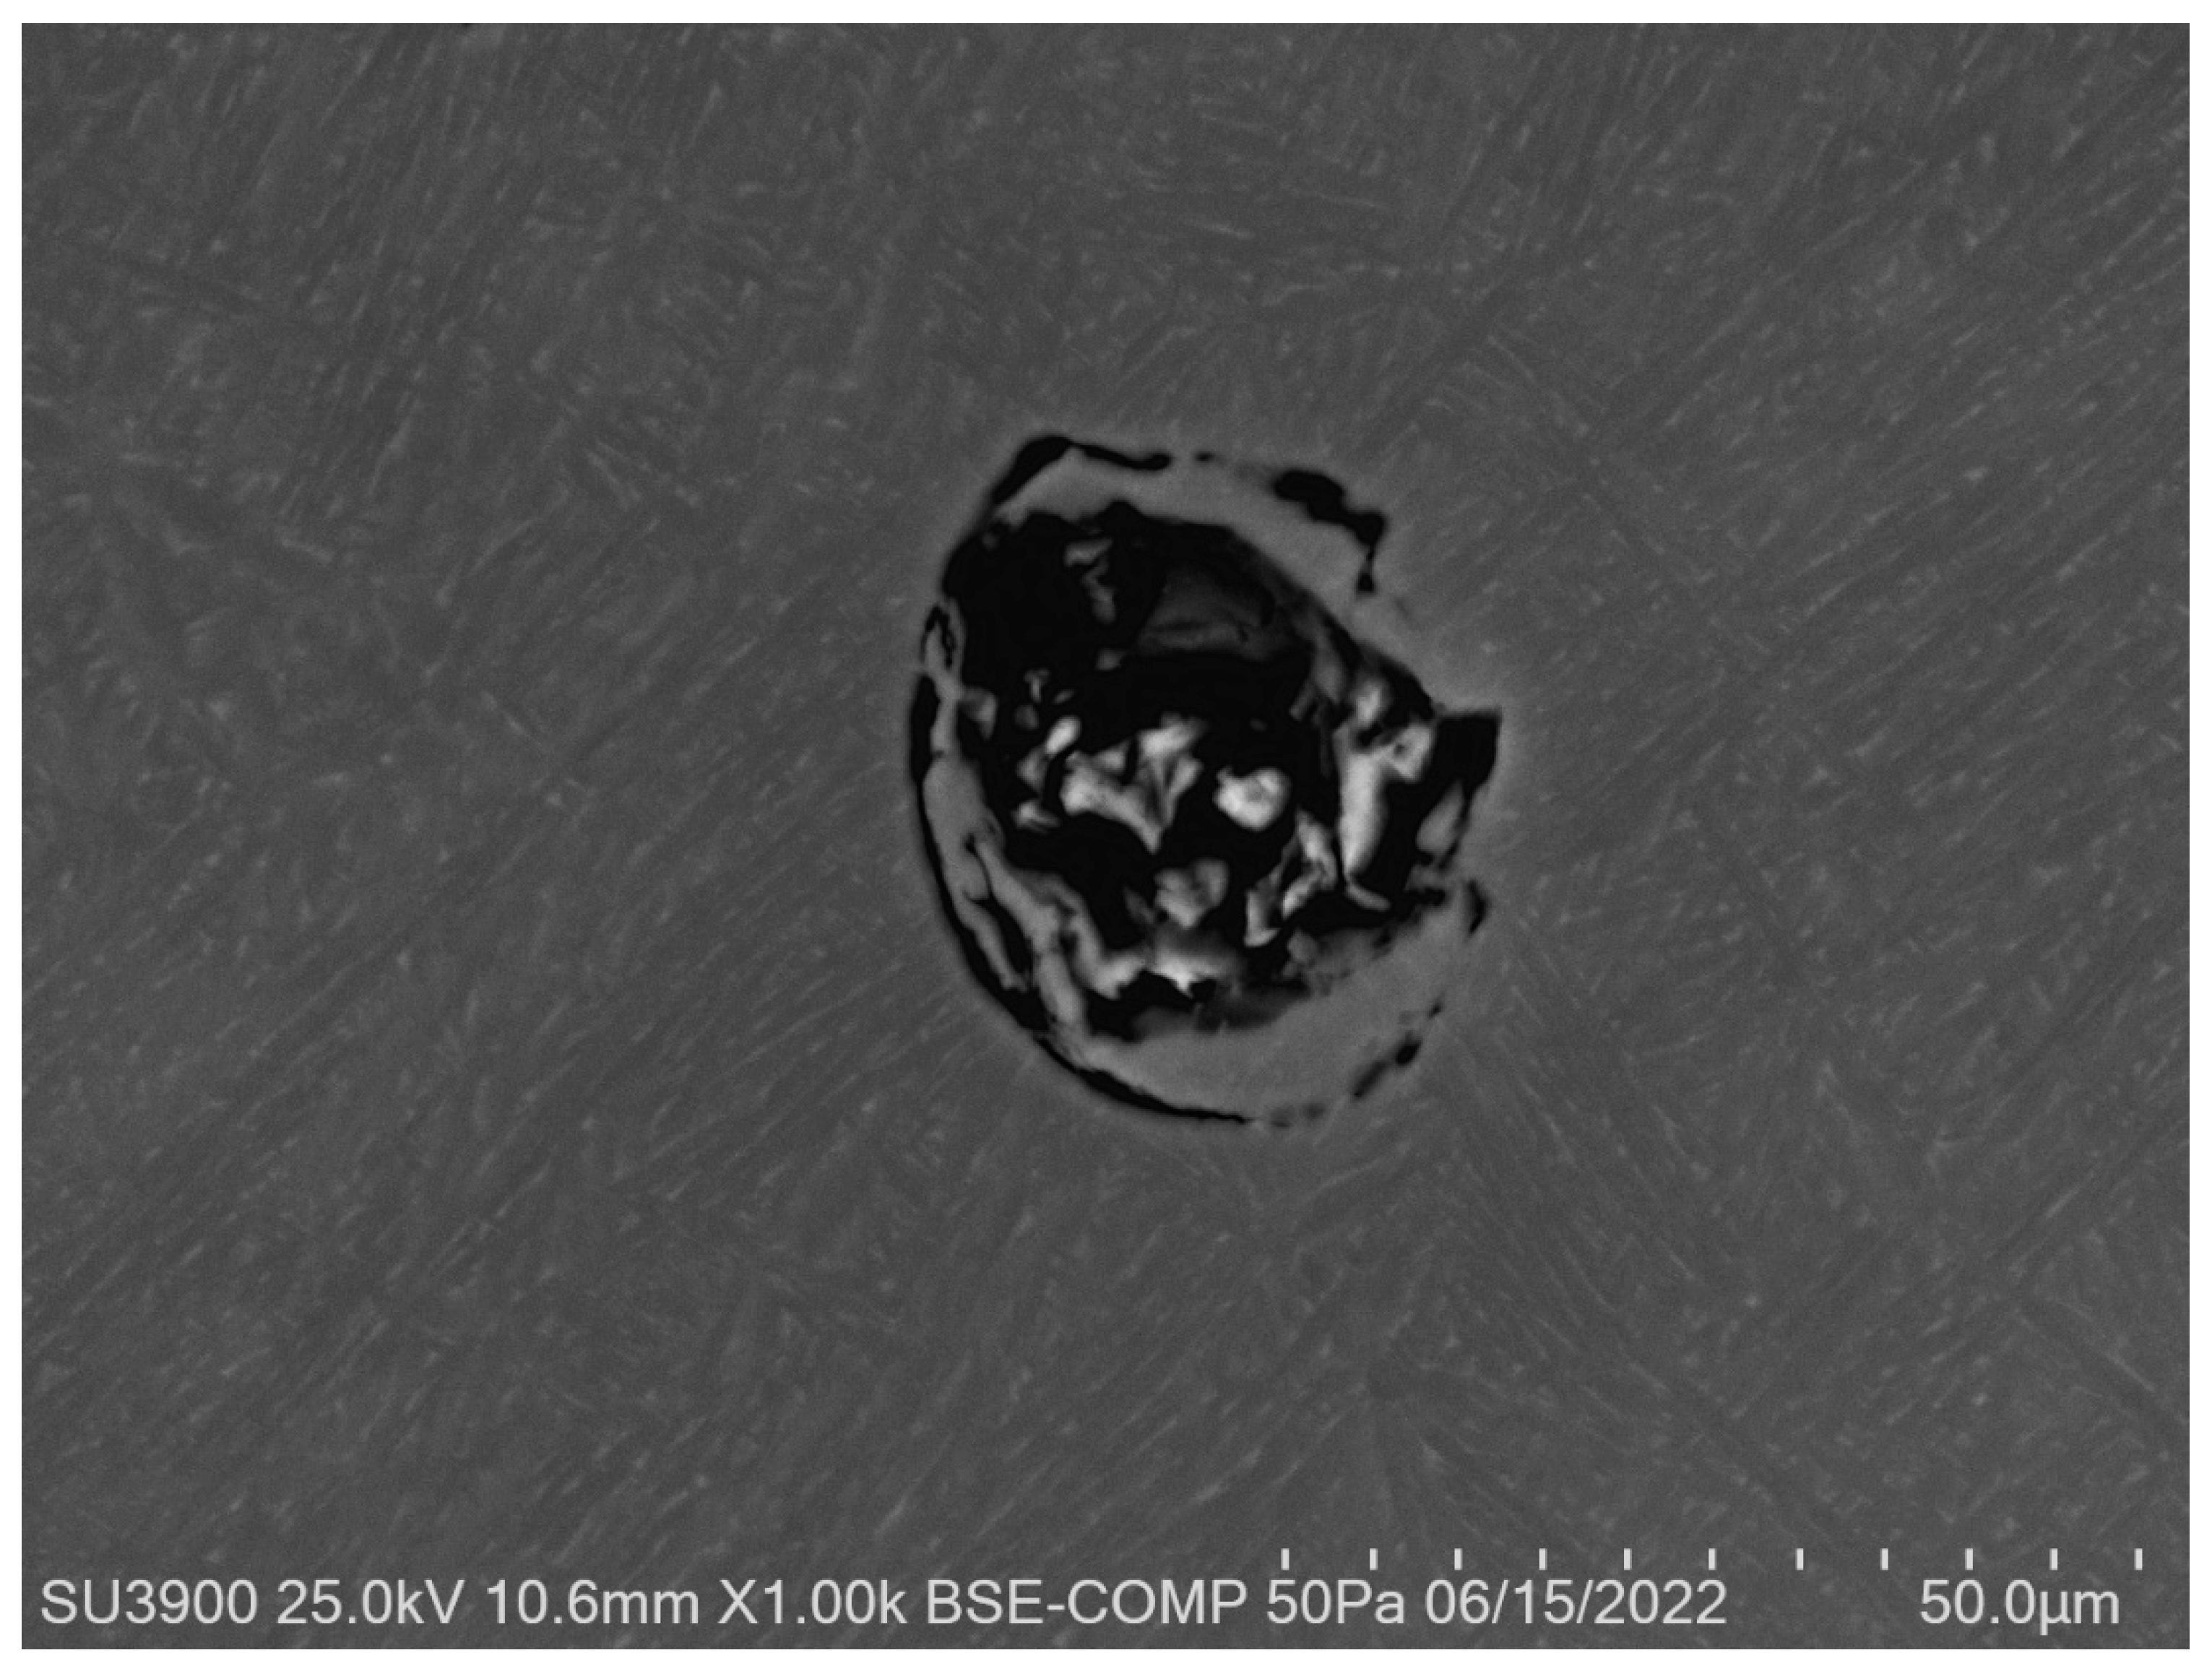
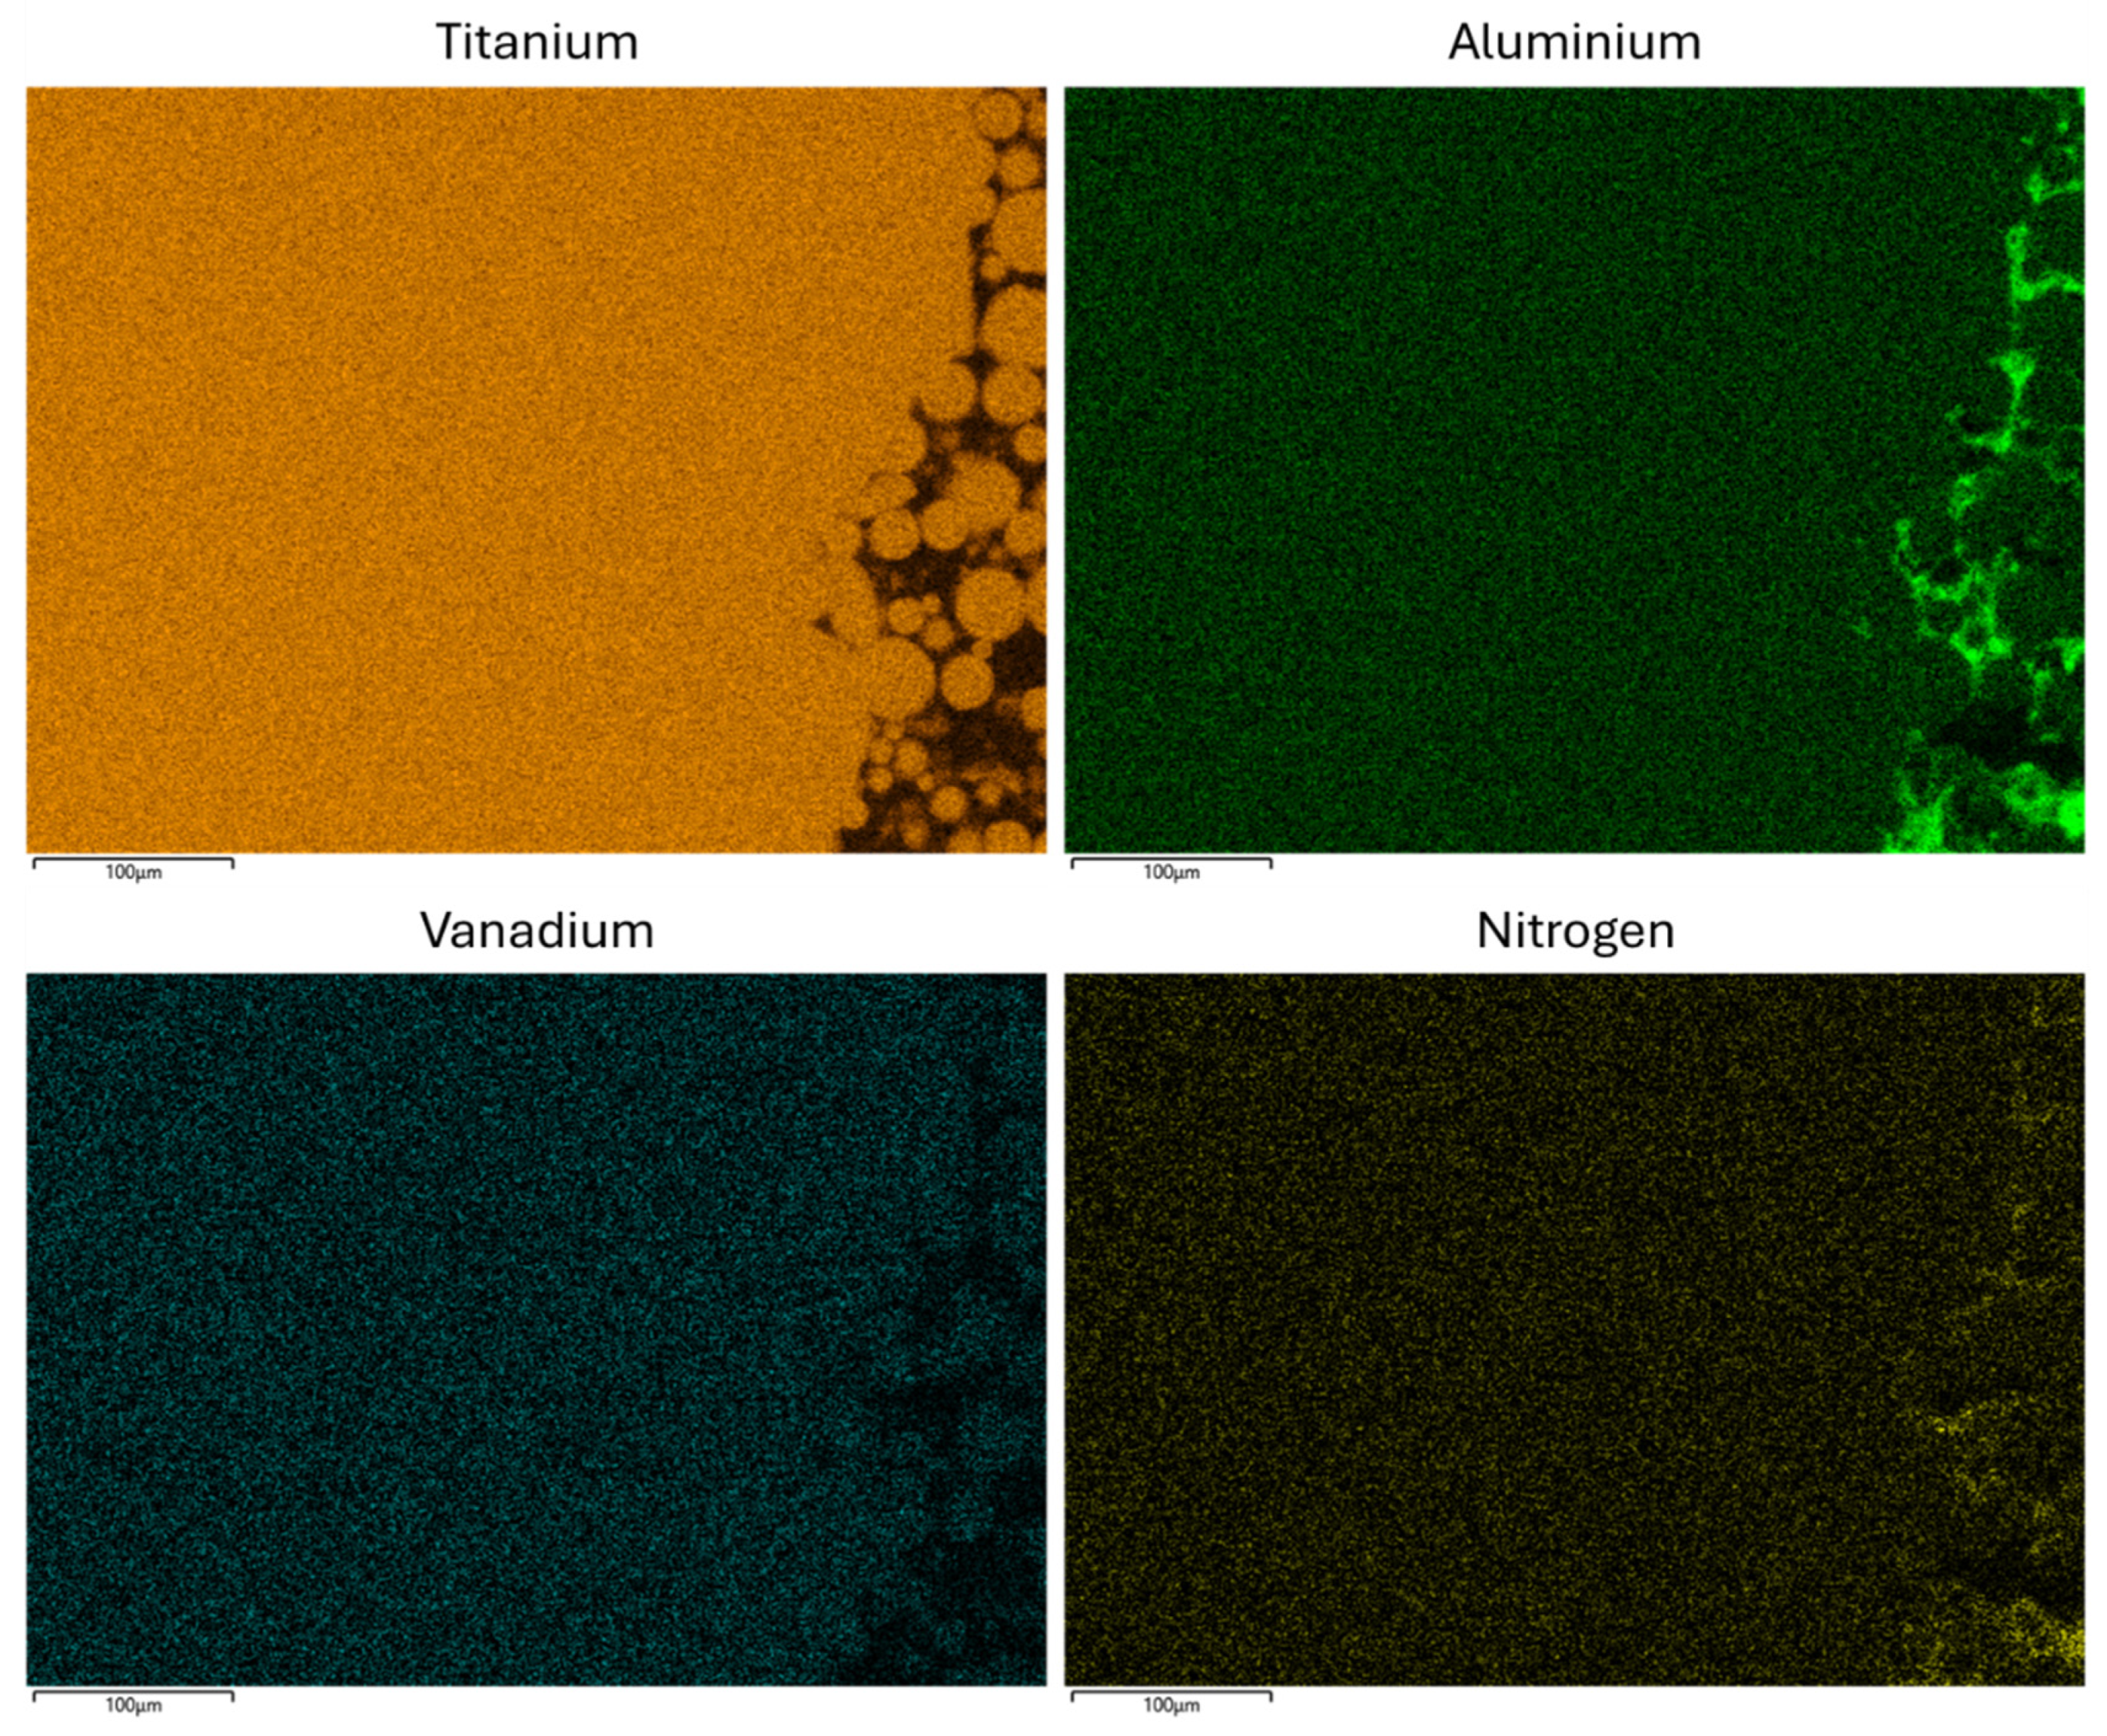
3.6. Scanning Electron Microscopy (SEM)
4. Discussion
5. Conclusions
Author Contributions
Funding
Data Availability Statement
Conflicts of Interest
Appendix A

| Specimen | Pre Average Diameter (mm) | Post Average Diameter (mm) | Difference (mm) | Percentage Difference (%) |
|---|---|---|---|---|
| 1 | 3.46 | 3.28 | −0.17 | −5.01 |
| 2 | 3.47 | 3.25 | −0.22 | −6.35 |
| 3 | 3.45 | 3.27 | −0.18 | −5.31 |
| 4 | 3.50 | 3.35 | −0.15 | −4.29 |
| 5 | 3.46 | 3.31 | −0.15 | −4.43 |
| 6 | 3.46 | 3.27 | −0.19 | −5.49 |
| 7 | 3.46 | 3.25 | −0.21 | −6.17 |
| 8 | 3.44 | 3.24 | −0.20 | −5.72 |
| 9 | 3.45 | 3.30 | −0.14 | −4.16 |
| 10 | 3.45 | 3.31 | −0.14 | −4.06 |
| Average | 3.46 | 3.28 | −0.18 | −5.10 |
| Specimen | Peak Force (MPa) | Peak Stress (MPa) | Youngs Modulus, E (MPa) | Initial Gauge Length (mm) | Maximum Extension (mm) | Maximum Extension (%) |
|---|---|---|---|---|---|---|
| 1 | 9551 | 1015 | 112,679 | 19.90 | 2.74 | 13.78 |
| 2 | 9563 | 1011 | 107,801 | 20.50 | 2.92 | 14.23 |
| 3 | 9373 | 1003 | 110,616 | 21.49 | 3.09 | 14.38 |
| 4 | 9353 | 972 | 112,737 | 21.64 | 2.48 | 11.47 |
| 5 | 9382 | 998 | 111,863 | 20.91 | 2.76 | 13.20 |
| 6 | 9624 | 1024 | 111,321 | 21.50 | 2.54 | 11.80 |
| 7 | 9423 | 1002 | 108,416 | 20.75 | 3.20 | 15.41 |
| 8 | 9696 | 1043 | 113,196 | 21.02 | 3.04 | 14.47 |
| 9 | 9566 | 1023 | 110,096 | 20.87 | 3.00 | 14.38 |
| 10 | 9656 | 1033 | 112,079 | 21.55 | 2.94 | 13.66 |
| Mean | 9519 | 1012 | 111,080 | 21.01 | 2.87 | 13.68 |
| SD | 120 | 19 | 1746 | 0.52 | 0.22 | 1.16 |
| Number of Cycles to Failure | ||||||
|---|---|---|---|---|---|---|
| Repetition Number | ||||||
| Group | Stress (MPa) | 1 | 2 | 3 | Mean | SD |
| 1 | 557 | 27,351 | 36,468 | 30,390 | 31,403 | 4642 |
| 481 | 36,468 | 30,390 | 54,702 | 40,520 | 12,652 | |
| 405 | 45,585 | 45,585 | 33,429 | 41,533 | 7018 | |
| 2 | 442 | 33,429 | 27,351 | 24,312 | 28,364 | 4642 |
| 382 | 48,624 | 51,663 | 42,546 | 47,611 | 4642 | |
| 321 | 100,287 | 85,092 | 79,014 | 88,131 | 10,957 | |
References
- Auricchio, F.; Marconi, S. 3D printing: Clinical applications in orthopaedics and traumatology. EFORT Open Rev. 2016, 1, 121–127. [Google Scholar] [CrossRef] [PubMed]
- Mulford, J.S.; Babazadeh, S.; Mackay, N. Three-dimensional printing in orthopaedic surgery: Review of current and future applications. ANZ J. Surg. 2016, 86, 648–653. [Google Scholar] [CrossRef] [PubMed]
- Mumith, A.; Thomas, M.; Shah, Z.; Coathup, M.; Blunn, G. Additive manufacturing: Current concepts, future trends. Bone Jt. J. 2018, 100-B, 455–460. [Google Scholar] [CrossRef] [PubMed]
- Zhong, S.; Shi, Q.; Van Dessel, J.; Gu, Y.; Sun, Y.; Yang, S.; Constantinus, P. Biomechanical validation of structural optimized patient-specific mandibular reconstruction plate orienting additive manufacturing. Comput. Methods Programs Biomed. 2022, 224, 107023. [Google Scholar] [CrossRef]
- Robinson, D.L.; Bucknill, A.; Ferragina, A.; Campbell, C.; Lee, P.V.S. Fixation of pelvic acetabular fractures using 3D-printed fracture plates: A cadaver study. J. Orthop. Surg. Res. 2023, 18, 360. [Google Scholar] [CrossRef]
- Sun, H.; Hu, C.; Zhou, C.; Wu, L.; Sun, J.; Zhou, X.; Xing, F.; Long, C.; Kong, Q.; Liang, J.; et al. 3D printing of calcium phosphate scaffolds with controlled release of antibacterial functions for jaw bone repair. Mater. Des. 2020, 189, 108540. [Google Scholar] [CrossRef]
- Wong, K.C.; Kumta, S.M.; Geel, N.V.; Demol, J. One-step reconstruction with a 3D-printed, biomechanically evaluated custom implant after complex pelvic tumor resection. Comput. Aided Surg. 2015, 20, 14–23. [Google Scholar] [CrossRef]
- Wong, K.C. 3D-printed patient-specific applications in orthopedics. Orthop. Res. Rev. 2016, 8, 57–66. [Google Scholar] [CrossRef]
- Perticarini, L.; Zanon, G.; Rossi, S.M.; Benazzo, F.M. Clinical and radiographic outcomes of a trabecular titanium acetabular component in hip arthroplasty: Results at minimum 5 years follow-up. BMC Musculoskelet. Disord. 2015, 16, 375. [Google Scholar] [CrossRef]
- De Meo, F.; Cacciola, G.; Bellotti, V.; Bruschetta, A.; Cavaliere, P. Trabecular Titanium acetabular cups in hip revision surgery: Mid-term clinical and radiological outcomes. Hip Int. 2018, 28, 61–65. [Google Scholar] [CrossRef]
- Faizan, A.; Bhowmik-Stoker, M.; Alipit, V.; Kirk, A.E.; Krebs, V.E.; Harwin, S.F.; Meneghini, R.M. Development and Verification of Novel Porous Titanium Metaphyseal Cones for Revision Total Knee Arthroplasty. J. Arthroplast. 2017, 32, 1946–1953. [Google Scholar] [CrossRef]
- Li, Z.; Luo, Y.; Lu, M.; Wang, Y.; Gong, T.; Hu, X.; He, X.; Zhou, Y.; Min, L.; Tu, C. 3D-printed Personalized Porous Acetabular Component to Reconstruct Extensive Acetabular Bone Defects in Primary Hip Arthroplasty. Orthop. Surg. 2024, 16, 1642–1647. [Google Scholar] [CrossRef] [PubMed]
- Geetha, M.; Singh, A.K.; Asokamani, R.; Gogia, A.K. Ti based biomaterials, the ultimate choice for orthopaedic implants – A review. Progress. Mater. Sci. 2009, 54, 397–425. [Google Scholar] [CrossRef]
- ASTM F136-13; Standard Specification for Wrought Titanium-6Aluminum-4Vanadium ELI (Extra Low Interstitial) Alloy for Surgical Implant Applications (UNS R56401). ASTM International: West Conshohocken, PA, USA, 2013. [CrossRef]
- ASTM F3001-14; Standard Specification for Additive Manufacturing Titanium-6 Aluminum-4 Vanadium ELI (Extra Low Interstitial) with Powder Bed Fusion. ASTM International: West Conshohocken, PA, USA, 2014. [CrossRef]
- ISO 5832-3:2016; Implants for Surgery—Metallic Materials. Part 3: Wrought Titanium 6-aluminium 4-vanadium Alloy. ISO: Geneva, Switzerland, 2016.
- Hollander, D.A.; Wirtz, T.; von Walter, M.; Linker, R.; Schultheis, A.; Paar, O. Development of IndividualThree-Dimensional Bone Substitutes Using “Selective LaserMelting”. Eur. J. Trauma. 2003, 29, 228–234. [Google Scholar] [CrossRef]
- Haslauer, C.M.; Springer, J.C.; Harrysson, O.L.; Loboa, E.G.; Monteiro-Riviere, N.A.; Marcellin-Little, D.J. In vitro biocompatibility of titanium alloy discs made using direct metal fabrication. Med. Eng. Phys. 2010, 32, 645–652. [Google Scholar] [CrossRef]
- Sidambe, A.T. Biocompatibility of Advanced Manufactured Titanium Implants—A Review. Materials 2014, 7, 8168–8188. [Google Scholar] [CrossRef]
- Lin, X.; Xiao, X.; Wang, Y.; Gu, C.; Wang, C.; Chen, J.; Liu, H.; Luo, J.; Li, T.; Wang, D.; et al. Biocompatibility of Bespoke 3D-Printed Titanium Alloy Plates for Treating Acetabular Fractures. Biomed. Res. Int. 2018, 2018, 2053486. [Google Scholar] [CrossRef] [PubMed]
- Liang, H.; Yang, Y.; Xie, D.; Li, L.; Mao, N.; Wang, C.; Tian, Z.; Jiang, Q.; Shen, L. Trabecular-like Ti-6Al-4V scaffolds for orthopedic: Fabrication by selective laser melting and in vitro biocompatibility. J. Mater. Sci. Technol. 2019, 35, 1284–1297. [Google Scholar] [CrossRef]
- Tuomi, J.T.; Björkstrand, R.V.; Pernu, M.L.; Salmi, M.V.J.; Huotilainen, E.I.; Wolff, J.E.H.; Vallittu, P.K.; Mäkitie, A.A. In vitro cytotoxicity and surface topography evaluation of additive manufacturing titanium implant materials. J. Mater. Sci. Mater. Med. 2017, 28, 53. [Google Scholar] [CrossRef]
- Jennison, T.; Brinsden, M. Fracture admission trends in England over a ten-year period. Ann. R. Coll. Surg. Engl. 2019, 101, 208–214. [Google Scholar] [CrossRef]
- Banerjee, S.; Kulesha, G.; Kester, M.; Mont, M.A. Emerging technologies in arthroplasty: Additive manufacturing. J. Knee Surg. 2014, 27, 185–191. [Google Scholar] [CrossRef]
- Chen, X.; Possel, J.K.; Wacongne, C.; van Ham, A.F.; Klink, P.C.; Roelfsema, P.R. 3D printing and modelling of customized implants and surgical guides for non-human primates. J. Neurosci. Methods 2017, 286, 38–55. [Google Scholar] [CrossRef]
- Bayliss, L.E.; Culliford, D.; Monk, A.P.; Glyn-Jones, S.; Prieto-Alhambra, D.; Judge, A.; Cooper, C.; Carr, A.J.; Arden, N.K.; Beard, D.J.; et al. The effect of patient age at intervention on risk of implant revision after total replacement of the hip or knee: A population-based cohort study. Lancet 2017, 389, 1424–1430. [Google Scholar] [CrossRef] [PubMed]
- Wainwright, C.; Theis, J.C.; Garneti, N.; Melloh, M. Age at hip or knee joint replacement surgery predicts likelihood of revision surgery. J. Bone Jt. Surg. Br. 2011, 93, 1411–1415. [Google Scholar] [CrossRef] [PubMed]
- Murray, R.; Winkler, P.W.; Shaikh, H.S.; Musahl, V. High Tibial Osteotomy for Varus Deformity of the Knee. J. Am. Acad. Orthop. Surg. Glob. Res. Rev. 2021, 5, e1. [Google Scholar] [CrossRef]
- Bergmann, G.; Bender, A.; Dymke, J.; Duda, G.; Damm, P. Standardized Loads Acting in Hip Implants. PLoS ONE 2016, 11, e0155612. [Google Scholar] [CrossRef] [PubMed]
- Bergmann, G.; Bender, A.; Graichen, F.; Dymke, J.; Rohlmann, A.; Trepczynski, A.; Heller, M.O.; Kutzner, I. Standardized loads acting in knee implants. PLoS ONE 2014, 9, e86035. [Google Scholar] [CrossRef]
- Schorler, H.; Capanni, F.; Gaashan, M.; Wendlandt, R.; Jurgens, C.; Schulz, A.P. Bone plates for osteosynthesis - a systematic review of test methods and parameters for biomechanical testing. Biomed. Tech. 2017, 62, 235–243. [Google Scholar] [CrossRef]
- MacLeod, A.R.; Pankaj, P. Pre-operative planning for fracture fixation using locking plates: Device configuration and other considerations. Injury 2018, 49 (Suppl. S1), S12–S18. [Google Scholar] [CrossRef]
- MacLeod, A.R.; Serrancoli, G.; Fregly, B.J.; Toms, A.D.; Gill, H.S. The effect of plate design, bridging span, and fracture healing on the performance of high tibial osteotomy plates: An experimental and finite element study. Bone Jt. Res. 2018, 7, 639–649. [Google Scholar] [CrossRef]
- Hu, Y.N.; Wu, S.C.; Withers, P.J.; Zhang, J.; Bao, H.Y.X.; Fu, Y.N.; Kang, G.Z. The effect of manufacturing defects on the fatigue life of selective laser melted Ti-6Al-4V structures. Mater. Des. 2020, 192, 108708. [Google Scholar] [CrossRef]
- Chen, G.; Schmutz, B.; Wullschleger, M.; Pearcy, M.J.; Schuetz, M.A. Computational investigations of mechanical failures of internal plate fixation. Proc. Inst. Mech. Eng. H. 2010, 224, 119–126. [Google Scholar] [CrossRef] [PubMed]
- Nica, M.; Cretu, B.; Ene, D.; Antoniac, I.; Gheorghita, D.; Ene, R. Failure Analysis of Retrieved Osteosynthesis Implants. Materials 2020, 13, 1201. [Google Scholar] [CrossRef]
- MacLeod, A.; Peckham, N.; Serrancolí, G.; Rombach, I.; Hourigan, P.; Mandalia, V.I.; Toms, A.D.; Fregly, B.J.; Gill, H.S. Personalised high tibial osteotomy has mechanical safety equivalent to generic device in a case-control in silico clinical trial. Commun. Med. 2021, 1, 6. [Google Scholar] [CrossRef]
- Mohammed, M.M. Fundamental Drivers of Metal Fatigue Failure and Performance. Multidiscip. Mater. Chron. 2024, 1, 49–61. [Google Scholar] [CrossRef]
- Sabzevari, S.; Ebrahimpour, A.; Roudi, M.K.; Kachooei, A.R. High Tibial Osteotomy: A Systematic Review and Current Concept. Arch. Bone Jt. Surg. 2016, 4, 204–212. [Google Scholar]
- Taddei, F. Bonemat. Available online: https://bonemat.ior.it/en (accessed on 14 May 2025).
- Taddei, F.; Pancanti, A.; Viceconti, M. An improved method for the automatic mapping of computed tomography numbers onto finite element models. Med. Eng. Phys. 2004, 26, 61–69. [Google Scholar] [CrossRef] [PubMed]
- Isaksson, H.; Wilson, W.; van Donkelaar, C.C.; Huiskes, R.; Ito, K. Comparison of biophysical stimuli for mechano-regulation of tissue differentiation during fracture healing. J. Biomech. 2006, 39, 1507–1516. [Google Scholar] [CrossRef]
- Steiner, M.; Claes, L.; Ignatius, A.; Niemeyer, F.; Simon, U.; Wehner, T. Prediction of fracture healing under axial loading, shear loading and bending is possible using distortional and dilatational strains as determining mechanical stimuli. J. R. Soc. Interface 2013, 10, 20130389. [Google Scholar] [CrossRef]
- MacLeod, A.R.; Pankaj, P.; Simpson, A.H. Does screw-bone interface modelling matter in finite element analyses? J. Biomech. 2012, 45, 1712–1716. [Google Scholar] [CrossRef]
- Serrancoli, G.; Kinney, A.L.; Fregly, B.J.; Font-Llagunes, J.M. Neuromusculoskeletal Model Calibration Significantly Affects Predicted Knee Contact Forces for Walking. J. Biomech. Eng. 2016, 138, 0810011. [Google Scholar] [CrossRef] [PubMed]
- Renishaw plc. Datasheet: Ti6Al4V ELI-0406 Powder for Additive Manufacturing; Renishaw plc: Wotton-under-Edge, UK, 2017. [Google Scholar]
- Xiao, Z.; Chen, C.; Zhu, H.; Hu, Z.; Nagarajan, B.; Guo, L.; Zeng, X. Study of residual stress in selective laser melting of Ti6Al4V. Mater. Des. 2020, 193, 108846. [Google Scholar] [CrossRef]
- ISO 6892-1:2019; Metallic materials—Tensile testing. Part 1: Method. of test at room temperature. ISO: Geneva, Switzerland, 2019.
- Guilherme, A.S.; Henriques, G.E.; Zavanelli, R.A.; Mesquita, M.F. Surface roughness and fatigue performance of commercially pure titanium and Ti-6Al-4V alloy after different polishing protocols. J. Prosthet. Dent. 2005, 93, 378–385. [Google Scholar] [CrossRef] [PubMed]
- ISO 12107:2012; Metallic materials—Fatigue testing. Statistical planning and analysis of data. ISO: Geneva, Switzerland, 2012.
- Vander Voort, G.F. Metallography: Principles and Practice; ASM International: Materials Park, OH, USA, 1984. [Google Scholar]
- Tong, J.; Bowen, C.R.; Persson, J.; Plummer, A. Mechanical properties of titanium-based Ti–6Al–4V alloys manufactured by powder bed additive manufacture. Mater. Sci. Technol. 2017, 33, 138–148. [Google Scholar] [CrossRef]
- Vrancken, B.; Thijs, L.; Kruth, J.-P.; Van Humbeeck, J. Heat treatment of Ti6Al4V produced by Selective Laser Melting: Microstructure and mechanical properties. J. Alloys Compd. 2012, 541, 177–185. [Google Scholar] [CrossRef]
- Titanium Metals Corporation. Datasheet: TIMETAL 6-4, 6-4 ELI & 6-4-.1R U Medium to High Strength General-Purpose Alloys; Titanium Metals Corporation: Warrensville Heights, OH, USA, 2000. [Google Scholar]
- Alcisto, J.; Enriquez, A.; Garcia, H.; Hinkson, S.; Steelman, T.; Silverman, E.; Valdovino, P.; Gigerenzer, H.; Foyos, J.; Ogren, J.; et al. Tensile Properties and Microstructures of Laser-Formed Ti-6Al-4V. J. Mater. Eng. Perform. 2011, 20, 203–212. [Google Scholar] [CrossRef]
- Zhang, S.; Lin, X.; Chen, J.; Huang, W. Heat-treated microstructure and mechanical properties of laser solid forming Ti-6Al-4V alloy. Rare Met. 2009, 28, 537–544. [Google Scholar] [CrossRef]
- Kaletsch, A.; Qin, S.; Herzog, S.; Broeckmann, C. Influence of high initial porosity introduced by laser powder bed fusion on the fatigue strength of Inconel 718 after post-processing with hot isostatic pressing. Addit. Manuf. 2021, 47, 102331. [Google Scholar] [CrossRef]
- Pessard, E.; Lavialle, M.; Laheurte, P.; Didier, P.; Brochu, M. High-cycle fatigue behavior of a laser powder bed fusion additive manufactured Ti-6Al-4V titanium: Effect of pores and tested volume size. Int. J. Fatigue 2021, 149, 106206. [Google Scholar] [CrossRef]
- Du, C.; Zhao, Y.; Jiang, J.; Wang, Q.; Wang, H.; Li, N.; Sun, J. Pore defects in Laser Powder Bed Fusion: Formation mechanism, control method, and perspectives. J. Alloys Compd. 2023, 944, 169215. [Google Scholar] [CrossRef]
- Silva, M.; Shepherd, E.F.; Jackson, W.O.; Dorey, F.J.; Schmalzried, T.P. Average patient walking activity approaches 2 million cycles per year: Pedometers under-record walking activity. J. Arthroplast. 2002, 17, 693–697. [Google Scholar] [CrossRef] [PubMed]
- Ganse, B.; Yang, P.F.; Gardlo, J.; Gauger, P.; Kriechbaumer, A.; Pape, H.C.; Koy, T.; Muller, L.P.; Rittweger, J. Partial weight bearing of the tibia. Injury 2016, 47, 1777–1782. [Google Scholar] [CrossRef] [PubMed]
- Takahara, Y.; Furumatsu, T.; Nakashima, H.; Itani, S.; Nakamura, M.; Uchida, Y.; Kato, H.; Tsujimura, Y.; Iwasaki, Y.; Ochi, N. Time to Bone Union after Hybrid Closed-Wedge High Tibial Osteotomy. Acta Med. Okayama 2019, 73, 511–516. [Google Scholar] [CrossRef]
- Brinkman, J.M.; Luites, J.W.; Wymenga, A.B.; van Heerwaarden, R.J. Early full weight bearing is safe in open-wedge high tibial osteotomy. Acta Orthop. 2010, 81, 193–198. [Google Scholar] [CrossRef] [PubMed]


| Bending Moment (Nm) | Group 1 Bending Stress (MPa) | Group 2 Bending Stress (MPa) | Number of Repeats |
|---|---|---|---|
| 2.2 | 557.3 | 442.0 | 3 |
| 1.9 | 481.3 | 381.8 | 3 |
| 1.6 | 405.3 | 321.5 | 3 |
Disclaimer/Publisher’s Note: The statements, opinions and data contained in all publications are solely those of the individual author(s) and contributor(s) and not of MDPI and/or the editor(s). MDPI and/or the editor(s) disclaim responsibility for any injury to people or property resulting from any ideas, methods, instructions or products referred to in the content. |
© 2025 by the authors. Licensee MDPI, Basel, Switzerland. This article is an open access article distributed under the terms and conditions of the Creative Commons Attribution (CC BY) license (https://creativecommons.org/licenses/by/4.0/).
Share and Cite
MacLeod, A.R.; Bishop, M.; Longo, A.C.; Shokrani, A.; Bowen, C.R.; Gill, H.S. Additively Produced Ti-6Al-4V Osteosynthesis Devices Meet the Requirements for Tensile Strength and Fatigue. J. Manuf. Mater. Process. 2025, 9, 227. https://doi.org/10.3390/jmmp9070227
MacLeod AR, Bishop M, Longo AC, Shokrani A, Bowen CR, Gill HS. Additively Produced Ti-6Al-4V Osteosynthesis Devices Meet the Requirements for Tensile Strength and Fatigue. Journal of Manufacturing and Materials Processing. 2025; 9(7):227. https://doi.org/10.3390/jmmp9070227
Chicago/Turabian StyleMacLeod, Alisdair R., Matthew Bishop, Alberto Casonato Longo, Alborz Shokrani, Chris Rhys Bowen, and Harinderjit Singh Gill. 2025. "Additively Produced Ti-6Al-4V Osteosynthesis Devices Meet the Requirements for Tensile Strength and Fatigue" Journal of Manufacturing and Materials Processing 9, no. 7: 227. https://doi.org/10.3390/jmmp9070227
APA StyleMacLeod, A. R., Bishop, M., Longo, A. C., Shokrani, A., Bowen, C. R., & Gill, H. S. (2025). Additively Produced Ti-6Al-4V Osteosynthesis Devices Meet the Requirements for Tensile Strength and Fatigue. Journal of Manufacturing and Materials Processing, 9(7), 227. https://doi.org/10.3390/jmmp9070227