1. Introduction
Decarbonization has become a top priority across all economic sectors as the window for limiting average global temperature rise to below 1.5 °C from preindustrial levels continues to narrow [
1]. In particular, the U.S. Department of Energy (DOE) has prioritized the decarbonization of industry due to its size and the extreme variety of industrial processes and emission sources. In 2022, the industrial sector made up approximately 28% of all U.S. carbon dioxide emissions, representing 1360 million metric tons of annual CO
2 emissions [
2]. Apart from transportation (37%), the industrial sector is responsible for the largest portion of U.S. total CO
2 emissions compared with 19% from the residential and 16% from the commercial sectors. The industrial sector, specifically manufacturing, will, therefore, play a large role in preserving global energy resources and drastically reducing emissions because of its large footprint.
The industrial sector is often considered difficult to decarbonize due to the wide array of feedstocks, energy sources, and manufacturing processes [
3]. For example, temperatures required for thermal systems span an order of magnitude from below 300 to over 3000 degrees Fahrenheit (150–1650 °C), spanning processes like paper drying and iron ore blast furnaces, highlighting the diversity in intensity and applications. This complexity is in addition to increased demand for manufactured products from a growing population exerting pressure to consume more energy and emit more greenhouse gases (GHGs) [
4]. To meet these challenges, research and development should focus on transformational rather than incremental change in the industrial sector, including shifting towards a life cycle approach to manufacturing and new technologies that are more energy and resource-efficient, like additive manufacturing. For the largest and most immediate impact, most Industrial Decarbonization (ID) roadmaps start by focusing on energy-intensive sectors while looking to identify and develop cross-cutting decarbonization technologies that can be applied more broadly [
5,
6,
7].
There are many pathways for achieving lower energy consumption and carbon emissions in the manufacturing sector. To understand these pathways, the U.S. DOE published a detailed ID roadmap with the goal of rapidly phasing out all GHG emissions from industrial processes without affecting global competitiveness [
5]. The roadmap outlines four key decarbonization pillars with energy efficiency (EE) at its foundation. One crucial component of the EE pillar is the emergence of data-driven manufacturing, known as Industry 4.0, which covers smart manufacturing solutions like artificial intelligence as well as advanced manufacturing technologies like additive manufacturing. Example applications include predictive maintenance at a steel plant to detect anomalies in pressure cylinders with 20 days lead time [
8] or optimizing paint shop buffers at an automotive plant to reduce the number of required color changes [
9]. Implementation of smart manufacturing alone could unlock a 10–30% increase in production throughput and a 10–20% improvement in the cost of quality [
10].
Additive manufacturing (AM) is a fast-developing technology within Industry 4.0 that can enable smarter production of manufactured parts and improved material efficiency. AM is a fabrication method that builds successive layers of material to make a part, rather than removing material from stock, as with conventional manufacturing (CM) techniques. The AM process has many benefits, including significantly less material waste, unique designs that are not achievable via CM techniques, the ability to lightweight designs while maintaining overall strength, consolidation of assembly parts, and repair of existing parts [
11]. The American Society for Testing and Materials (ASTM) defines seven categories of AM [
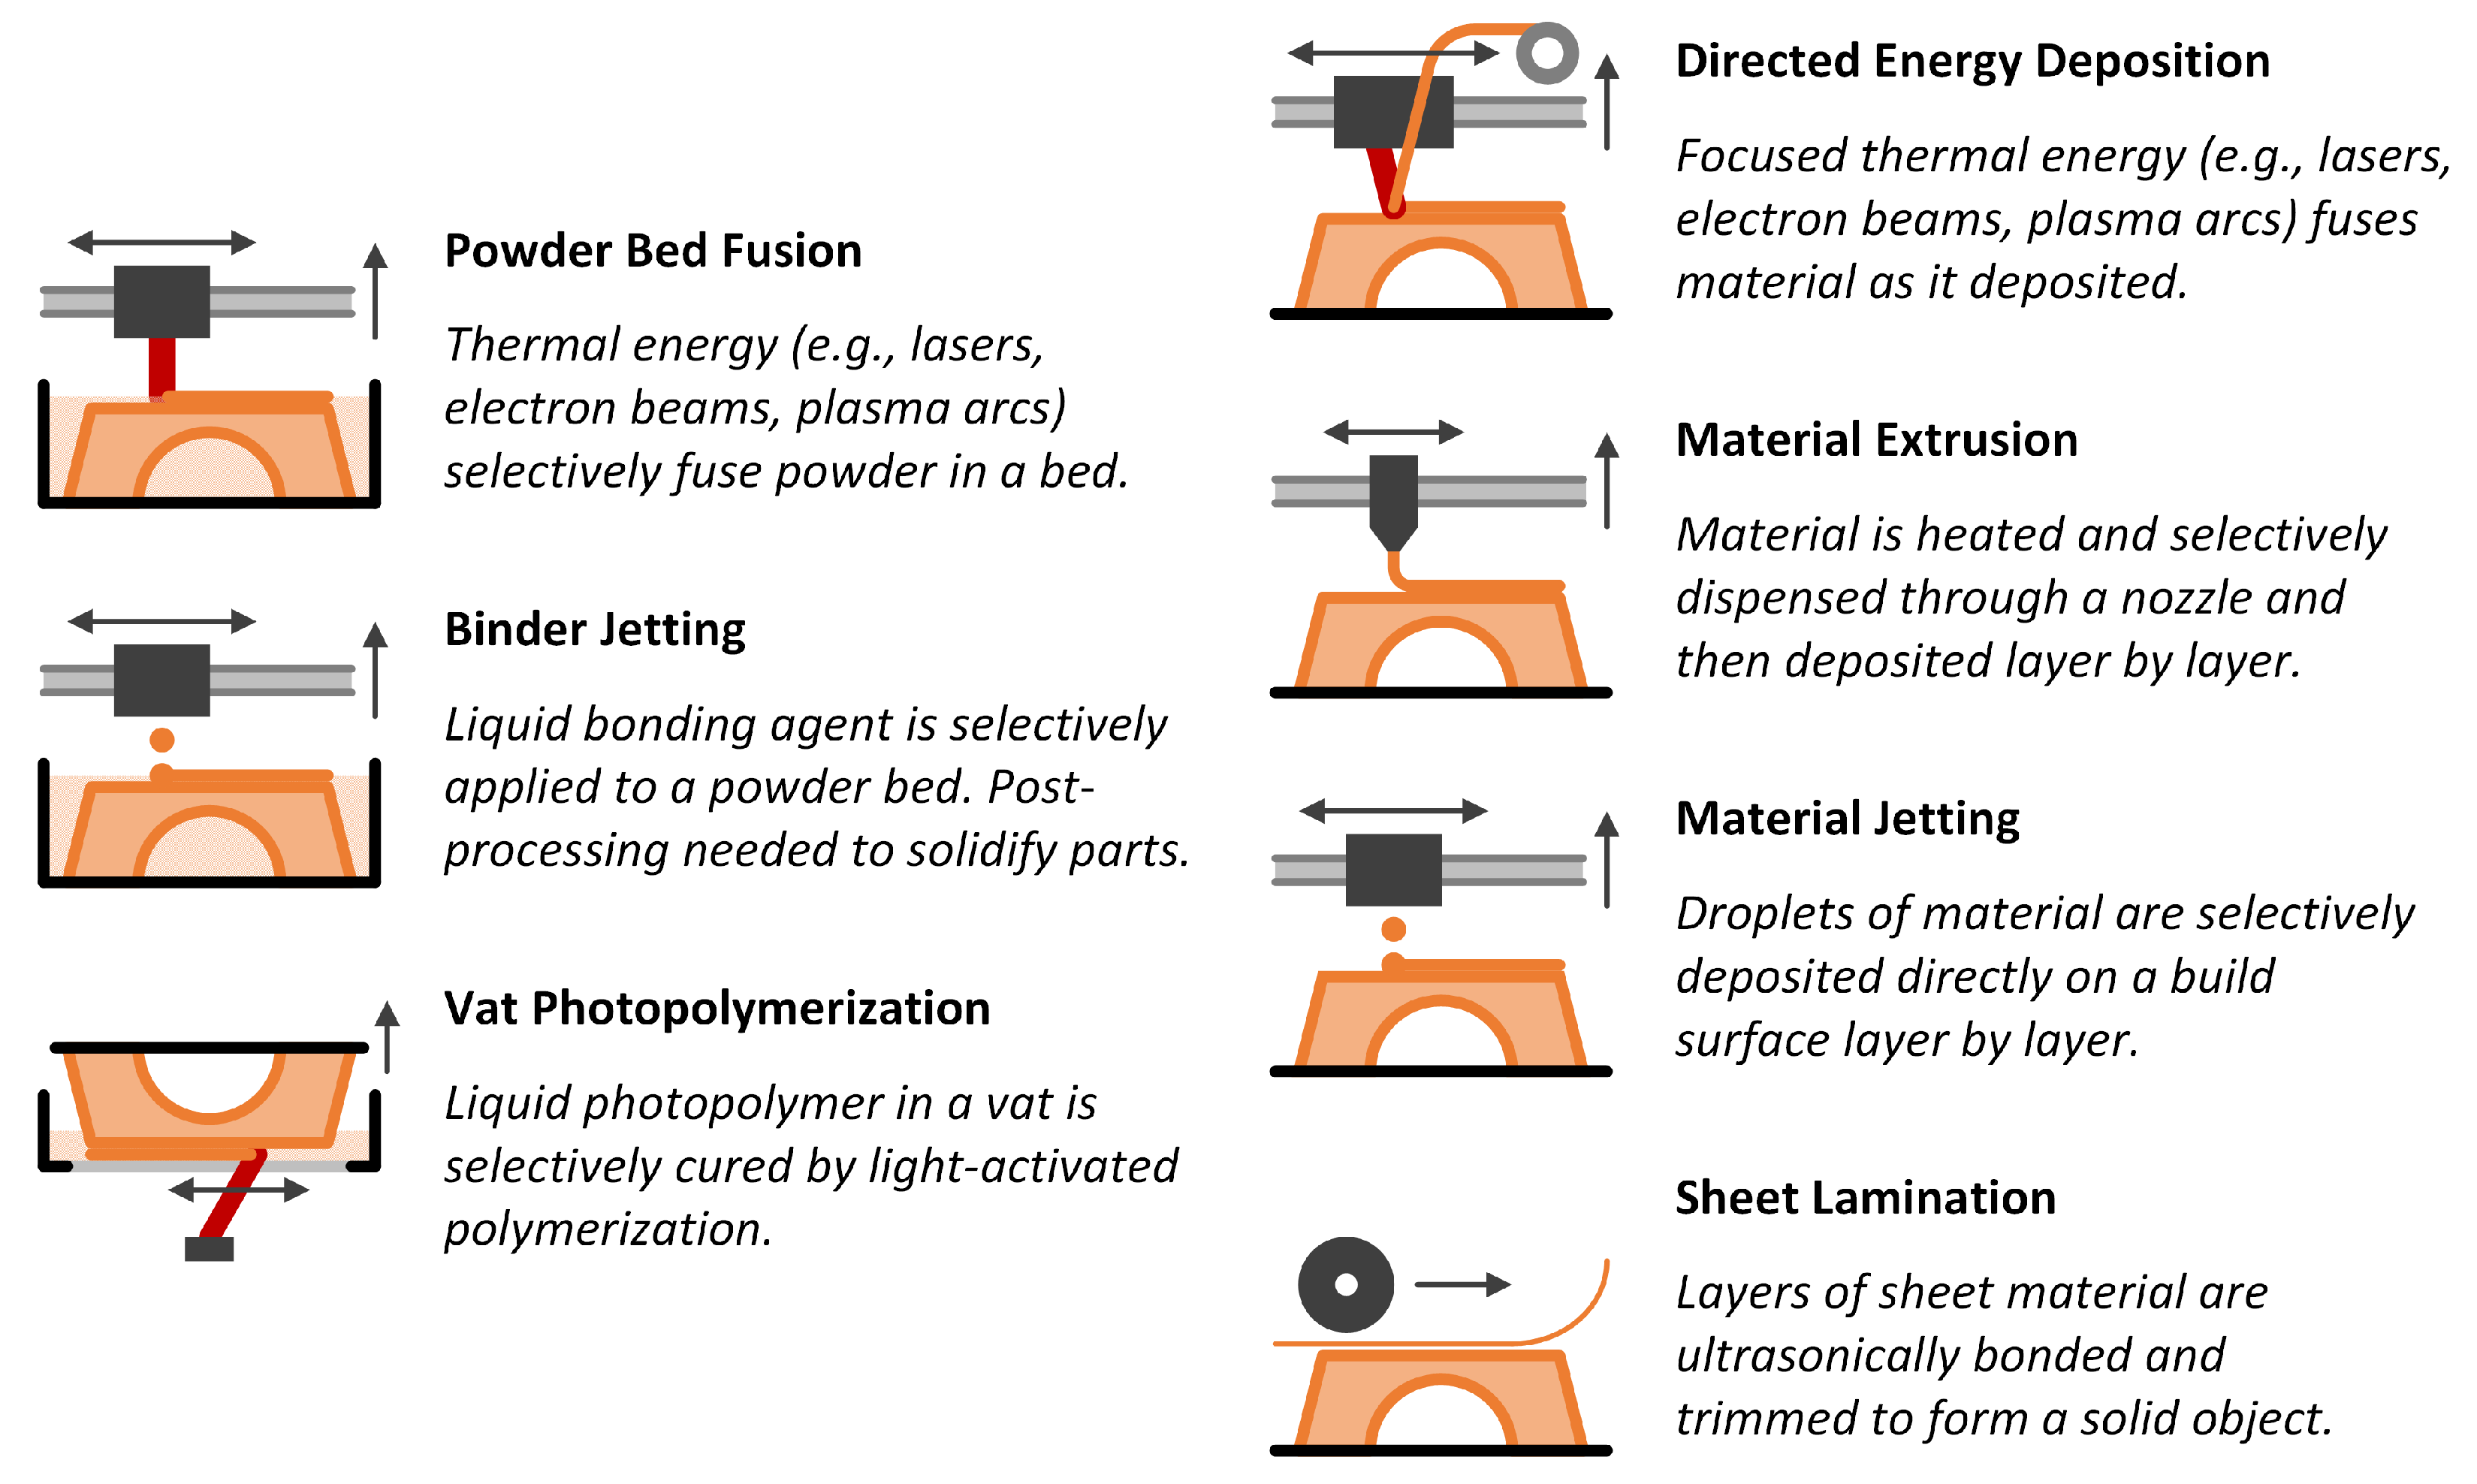
12]. Material bed techniques selectively melt, glue, cure, or weld cross sections of a part in a prepared layer of material (see the left column of
Figure 1). This process is repeated until the entire part is built, after which excess powder can be sifted and removed. Deposition techniques directly build layers of material on top of each other or trace paths in 3D space (see the right column of
Figure 1). Powder bed technologies tend to be slower but more precise when compared with deposition technologies. AM technologies exist to print many kinds of materials, including metals, polymers, and ceramics.
There are numerous environmental benefits associated with the wide adoption of AM in the manufacturing sector [
11]. AM production uses up to 90% less overall material, especially when parts are redesigned for additive techniques. This usually results in a net decrease in embodied energy and carbon emissions despite some additional energy required to produce raw materials for AM and special handling to avoid contamination or explosion risk (e.g., metal powder). Lightweight AM designs mean less mineral extraction, lower disposal/waste costs, and cheaper transportation costs. Supply chains can be simplified by printing parts on-site, reducing the amount of shipping required and lead time, especially for specialty or low-volume parts [
13,
14]. Reductions in use-phase energy consumption are also possible, such as with lightweight aerospace parts that lead to less fuel consumption [
15] or novel heat exchanger designs not possible with CM techniques that allow for more efficient heat transfer [
16]. AM can even improve the circularity of manufacturing such as with improved reuse and recycling of precast concrete molds [
17] and glass bottle molds [
18]. Quantifying all the life cycle carbon emission benefits is critical to making a complete business case for the adoption of AM, particularly for reticent manufacturers with low risk tolerance.
Despite the enormous promise of AM for manufacturing and recent advances in build volume, product quality, and material selection, there are still major barriers to widespread adoption beyond rapid prototyping [
19]. AM parts tend to have lower strength properties compared with CM alternatives, usually due to inconsistent layer adhesion. Additionally, the layer-by-layer nature of most techniques tends to make AM slow and renders scaling for mass production difficult. Purchasing many machines for parallel production is a solution but is often cost- and space-prohibitive. AM parts also tend to have issues with repeatability as parts printed with the same settings can have significant differences in quality and strength. Predictive algorithms are in development to make in situ changes during the printing process to lower such variability and improve overall quality but are not yet widely available [
20]. While material selection has been an issue in the past, new materials and processes are rapidly being developed and made available, such as high-strength, high-temperature metal alloys (e.g., titanium and Inconel). Similarly, build volumes are growing much larger [
21]. A lack of agreed-upon standards for certifying AM parts to replace CM parts also contributes to making adoption difficult for many manufacturers.
Ultimately, the biggest barrier to AM adoption is the cost. CM is usually the cheapest and easiest option due to its near ubiquity in manufacturing and established infrastructure. Overcoming this barrier requires not only redesigning parts to take advantage of the AM process but also the development of a strong business case for AM adoption to counteract risks and production inertia associated with the implementation of new manufacturing technology. Empowering manufacturers with simple analysis tools to capture a more complete picture of AM’s life cycle benefits and key cost drivers will help simplify the creation of compelling business cases for AM.
This paper outlines the development of two analysis tools to help manufacturers assess the feasibility of AM production technologies. The first tool (AMECIA) can be used to estimate and compare the life cycle energy and carbon impacts of producing a part via different techniques, such as CM vs. AM or two different AM scenarios. The second tool (AMCAC) allows manufacturers to estimate the costs associated with different aspects of AM, including printing, heat treatment, machining, labor, capital, and interest, as well as any time bottlenecks during production. Both tools have widespread application in industry and R&D spaces and have the goal of helping to lower the barriers to AM adoption by enabling simplified life cycle energy and GHG analysis and economic assessments. A case study of a lightweight aircraft bracket highlights how the tools can be used toward these goals.
2. Analysis Tools Background
A life cycle assessment (LCA) is a method for analyzing the environmental and energy impacts of a process, product, or material throughout a product’s life cycle from cradle to grave [
22]. Analysis usually follows the production process, stepping from material extraction through to production, distribution, use phase, end of life, and recovery/disposal. LCA can assess various aspects of production, including energy usage, total emissions, water usage, and a variety of other metrics for environmental impact. Results help stakeholders make responsible business and design decisions with the least impact on the environment. Outcomes also help to identify opportunities for closing the production cycle (using open- and closed-loop recycling), making for a more circular manufacturing process.
Similarly, techno-economic analysis (TEA) is a framework for estimating the economic performance of a technology or process [
23]. TEA helps manufacturers weigh the costs and benefits of technologies or projects through detailed projections of capital, operational costs, and technical capabilities. The analysis includes the development of detailed process models, identification of required equipment and personnel, and interviews with stakeholders and operators. While TEA is often only an educated estimation, it does help to establish boundaries of uncertainty for decision-makers. TEAs can also be used to identify areas for further research and analysis through sensitivity analysis and scenario modeling.
The energy consumption and carbon emissions associated with AM have typically been assessed with bottom–up LCA studies [
17,
24,
25,
26]. These have usually focused on specific case studies, have been based on experimental data or life cycle inventories from commercial datasets (e.g., Ecoinvent [
27]), or utilized commercial software programs (e.g., Sphera 2025.1 [formerly GaBi] [
28], SimaPro Craft 10.2 [
29], Granta Eco Audit 3 [
30]). Since underlying data are usually specific to individual case studies, their use for more generalized LCA of emerging AM technologies or for other applications can be limited. Most TEA analyses have utilized commercially available software tools, such as Aspen Plus V15 , or have developed bespoke calculation tools. A recent analysis of literature related to LCA of AM also identified several shortcomings [
31]. These gaps include an over-emphasis on powder bed and extrusion techniques, missing analysis on the economic feasibility of AM production, exclusion of part quality and mechanical characterization, less focus on post-production life-cycle phases, and the impacts of production variables like material selection, part size, or batch optimization.
To help companies apply for grants or better understand LCA and TEA, the DOE developed the TECHTEST tool, which helps users implement a benchmark LCA and cost analysis and encourages a standardized way of estimating energy, GHGs, and cost impacts [
32]. However, a deep understanding of LCA and TEA methodology is necessary to conduct this type of bottom–up analysis with most software programs. Additionally, when conducting a study based on experimental data, scale-up values will be required for comparison with conventional processes that are of higher technology readiness. Data on key parameters for conducting an AM-specific LCA or TEA also might not be easily available, such as deposition rate and power consumption of AM equipment.
While demand for environmental LCA tools has steadily increased, first for energy savings and now for emissions reductions, there is a lack of simplified tools available for early decision-makers in the AM field that include detailed materials and process data [
15]. Software tools like OpenLCA 2.1 and SimaPro Craft 10.2 are excellent options for building a robust life cycle inventory (LCI) for the embodied impacts of feedstocks; however, they do not have detailed machining or AM printing data for robust comparisons between AM and CM. Additionally, many companies lack the knowledge or personnel required to complete an analysis with these tools. Likewise, manufacturing costing tools are often too specific for conducting an easy TEA analysis (e.g., [
33]), leading to more custom-built tools. One solution is using AI-based tools such as those reviewed in [
34] or expansive frameworks like in [
35], but there is still a steep learning curve for effective use. No simple tools for estimating the complete cost of AM are widely available, including post-processing and machining. Such tools could be used as part of research proposals or justification for more detailed studies when assessing new production methods. Development of simple yet standardized LCA and TEA screening tools (like those in this paper) that are usable by both manufacturers and LCA experts will greatly facilitate the adoption of AM; such frameworks may not incorporate all variables that affect the energy, carbon, and cost of manufacturing but would account for the majority thereof.
3. Additive Manufacturing Tools Development
The following section discusses the development and process flow for two simplified tools assessing the environmental and cost impacts of AM production. Details on assumptions and important calculations are also discussed. A previous version of the additive manufacturing energy and carbon impacts assessment tool (AMECIA) was released in 2014 [
15], which performed a cumulative energy demand-focused LCA and included a database of materials and processes that was current at the time. Since its release, there have been substantial advances in both materials and 3D printing technology; therefore, an overhaul of the tool was completed as part of this work with new capabilities and improved algorithms, including updates to the life cycle inventory and underlying methodologies. New features were also added, including embodied carbon analysis as well as new calculators for estimating post-process material treatment and post-print machining. The AM cost assessment calculator (AMCAC) is an entirely new tool developed to address the economic feasibility gap in AM analysis tools. It builds upon simplified models of 3D printing processes widely available in the literature and combines them with estimations of post-processing and machining time, cost, labor, and capital. The tool directly addresses the gap in analysis tools for addressing the economic feasibility of AM production. Both tools are open source (under the MIT software license), available on GitHub at
http://github.com/ORNL-AM-Analysis-Tools (accessed on 7 June 2025).
3.1. AM Energy and Carbon Impacts Assessment Tool (AMECIA)
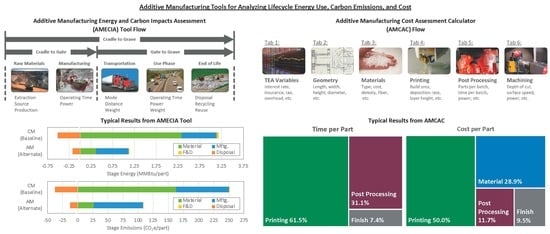
The AMECIA tool was originally developed by the Oak Ridge National Laboratory (ORNL) in 2014 to help researchers compare the embodied energy of CM and AM parts. The tool consists of Microsoft Excel macros for the user interface (UI) and interactive calculator modules, dropdown menus, and free entry fields. While initially conceived for researchers, the tool was also designed for use by manufacturers with limited LCA experience to help spur wider AM adoption. The structure of the tool guides users through the major steps of a standard LCA process with multiple levels of analysis. Several new calculator modules have been added to the 2014 “AM Energy Impacts Tool” using Excel forms to provide off-sheet help in calculating input values along with new calculators for assessment of life cycle carbon impacts. Help text is provided in the sheet for each piece of data entry and in each section. The tool addresses several LCA gaps, including a detailed focus on post-production life-cycle phases, including post-processing, machining, and disposal.
The AMECIA tool contains several simple databases for embodied impact estimation. A raw materials database utilizes an energy and carbon impacts data set for more than 50 different materials in primary (virgin), secondary (recycled), and market mix forms. Higher heating values (HHVs), percent carbon, and market recycling fraction are also included. A second materials data set provides embodied impacts of the forming stage for raw materials (e.g., ingots, powder, chopped fibers). A third materials database provides mass-based embodied impact information for conventional manufacturing processes. All three material databases include a range of values to help users find reasonable values for their analysis. A transportation phase database provides energy and carbon impacts on a distance-weight basis, and a use-phase database provides similar data for estimating the impacts of parts used in transportation equipment. An end-of-life (EoL) phase database also provides the impacts of landfilling.
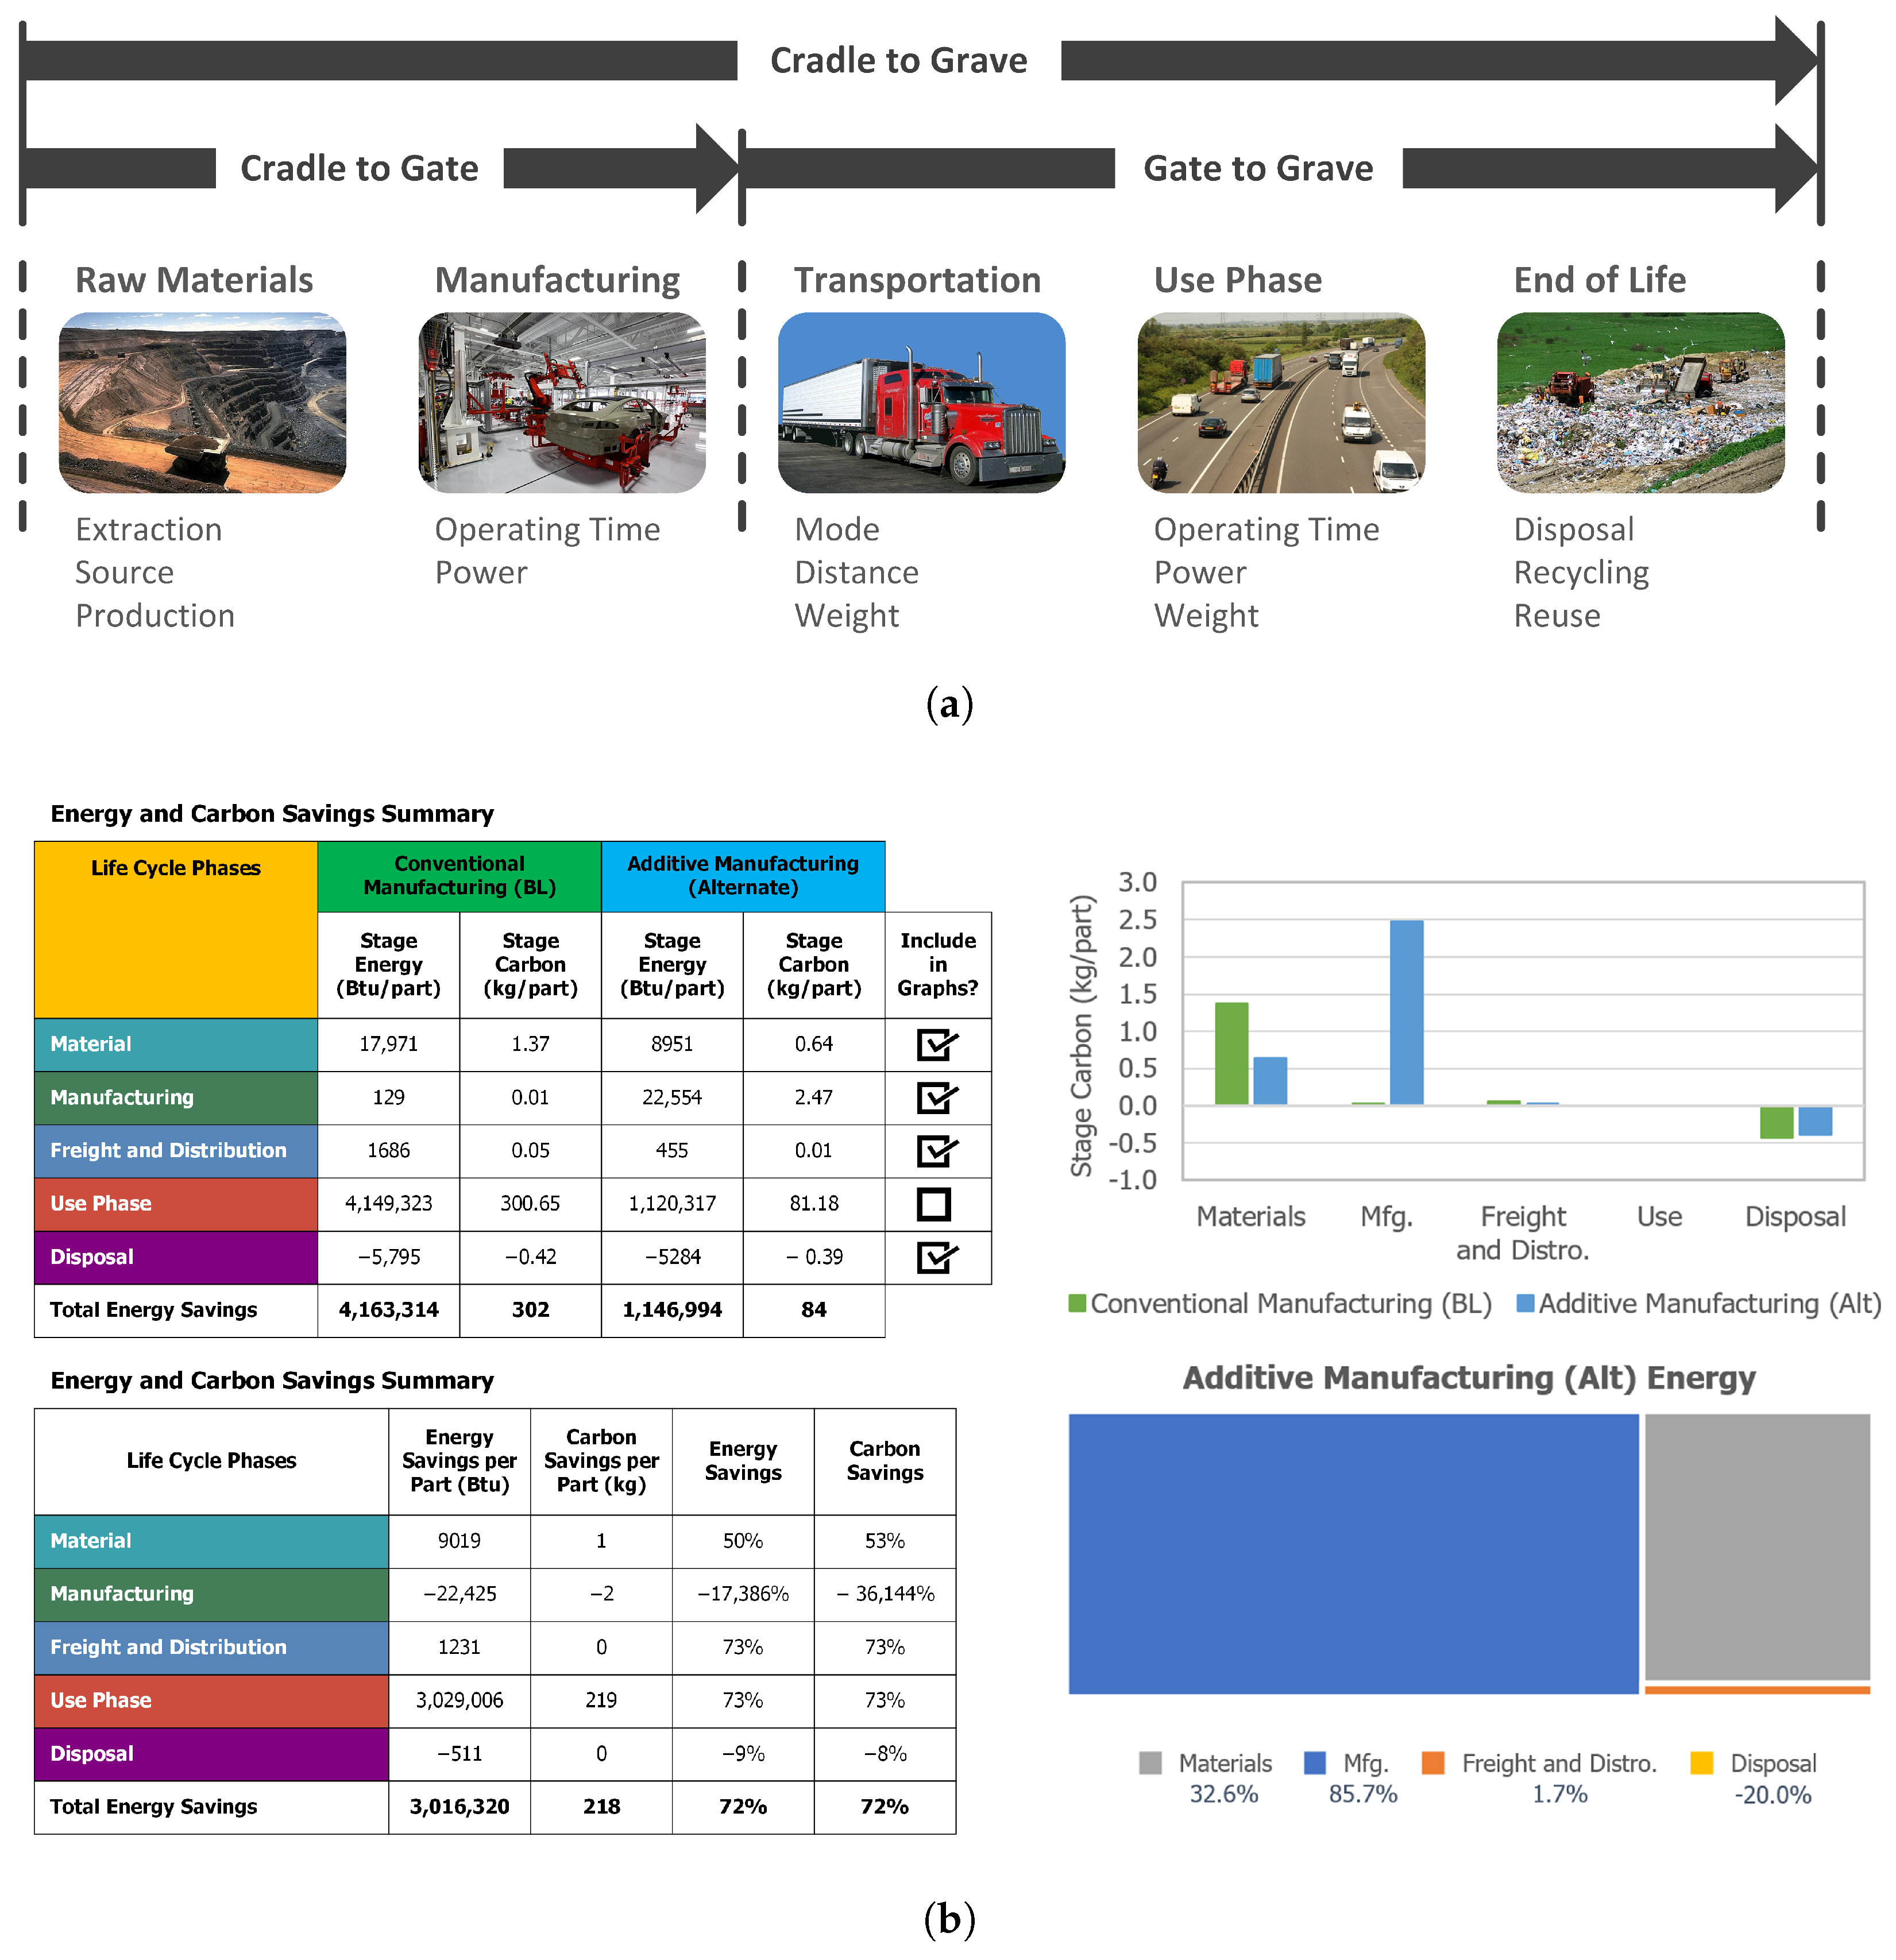
The analysis flow of the AMECIA tool follows the steps of a typical LCA (
Figure 2a). Information on the types of materials used (primary and secondary), starting and final mass, and material recycling allows for the calculation of scrap rates and the embodied energy and carbon of raw materials. Users must input the embodied energy for each material, with ranges of suitable values provided by the inbuilt raw materials database. The manufacturing stage for both CM and AM analysis has three parts. Primary shaping (1) describes how the rough part is made via CM (e.g., casting, forging, extrusion) or is printed via AM. For CM, the impact of primary shaping is estimated using per-mass, specific energy estimations. AM primary shaping is calculated from more basic estimations with three complexity levels. “Simple” and “Intermediate” both use printing time and power consumption data to estimate energy usage and associated indirect GHG emissions. “Simple” calculations estimate print time using average deposition, rate while “Intermediate” uses estimated print time directly. “Advanced” uses similar parameters but estimates print time using basic models of the specific AM technology. Secondary shaping and finishing (2) outline additional CM processes that may be needed to achieve the final, to-spec part for either AM or CM (e.g., machining, joining, surface finishing, heat treatment). Tooling (3) captures the embodied impacts of the tools used to produce the part. Users input the embodied impacts of the selected processes/tools and can use the provided database ranges for guidance. However, the contribution of tooling impacts is often small and can usually be assumed as negligible. For the last two steps (secondary processing and tooling), new calculators were added for both CM and AM to help users estimate values and allow stacking of multiple processes (e.g., painting, fastening, milling).
The transportation and use-phase stages are both relatively simple to complete. Users can enter up to two transportation modes (e.g., truck, train, boat) and the total distance traveled, depending on the chosen complexity level. Embodied impact calculations use mass from the materials stage and an energy per mass–mile value from the transportation database for the selected modes. In the use-phase stage, users specify if the manufactured part’s end use is in a transportation system (where its mass can impact fuel/energy consumed) or if the part affects the energy use of the system it is in (where a change in efficiency can impact energy consumed). For either case, users input details such as expected lifespan, distance traveled per day, and annual energy usage.
EoL analysis allows users to model two disposal pathways for each material. Impacts can be entered directly, or the newly developed calculators can be used to model different scenarios, including landfilling, combustion, open- or closed-loop recycling, and abandonment in place. Users can also model material recovery (both for the original materials and newly derived materials), energy recovery, and any additional resources consumed in the EoL process. Each of these options requires substantial user input, for which the tool provides guidance from databases and previously entered data.
While completing each stage within the AMECIA tool can be data- and time-intensive, users can skip portions without affecting the functionality of the tool to limit the scope of the analysis. Once all LCA stages have been either completed or skipped, each model tab (Baseline CM or AM and AM alternate) ends with model-specific results with details on impacts for each stage and visuals. The “Results” tab focuses on comparing models over each stage (
Figure 2b). Users can see more detailed comparisons by excluding smaller stages from the graphics (e.g., excluding use-phase impacts, which are often the largest contributor). Results can be used to identify research gaps, showcase the advantages of changes to parts/production, and promote the more widespread adoption of AM by making a more compelling, data-driven environmental and business case.
As with all tools, results from the AMECIA should be used with healthy scientific skepticism. LCA is both an art and a science, necessarily making many assumptions and generalizations. Not all aspects of the life cycle impacts are considered (e.g., environmental toxicity, water use impacts) that may be important to assessing the true life cycle benefits of AM in certain applications. Also, results are limited by the accuracy and uncertainty of the inputs used for the analysis. However, the AMECIA does provide a more understandable, approachable, and general framework for initial LCA screening than other tools currently available.
3.2. AM Cost Assessment Calculator
The Additive Manufacturing Cost Assessment Calculator (AMCAC) is a new tool developed by ORNL to help manufacturers assess the technical and economic feasibility of AM for generic parts. The calculator uses Microsoft Excel macros to enable the UI, including three levels of cost analysis and consists of dropdown menus and free entry fields. The tool is designed for use by TEA experts as well as manufacturers with limited experience in doing such detailed studies. The structure of the tool guides users through the AM production process and provides guidance on the types of economic and technical inputs required. The calculator provides detailed results on each part analyzed while allowing for multiple scenarios to be saved and compared.
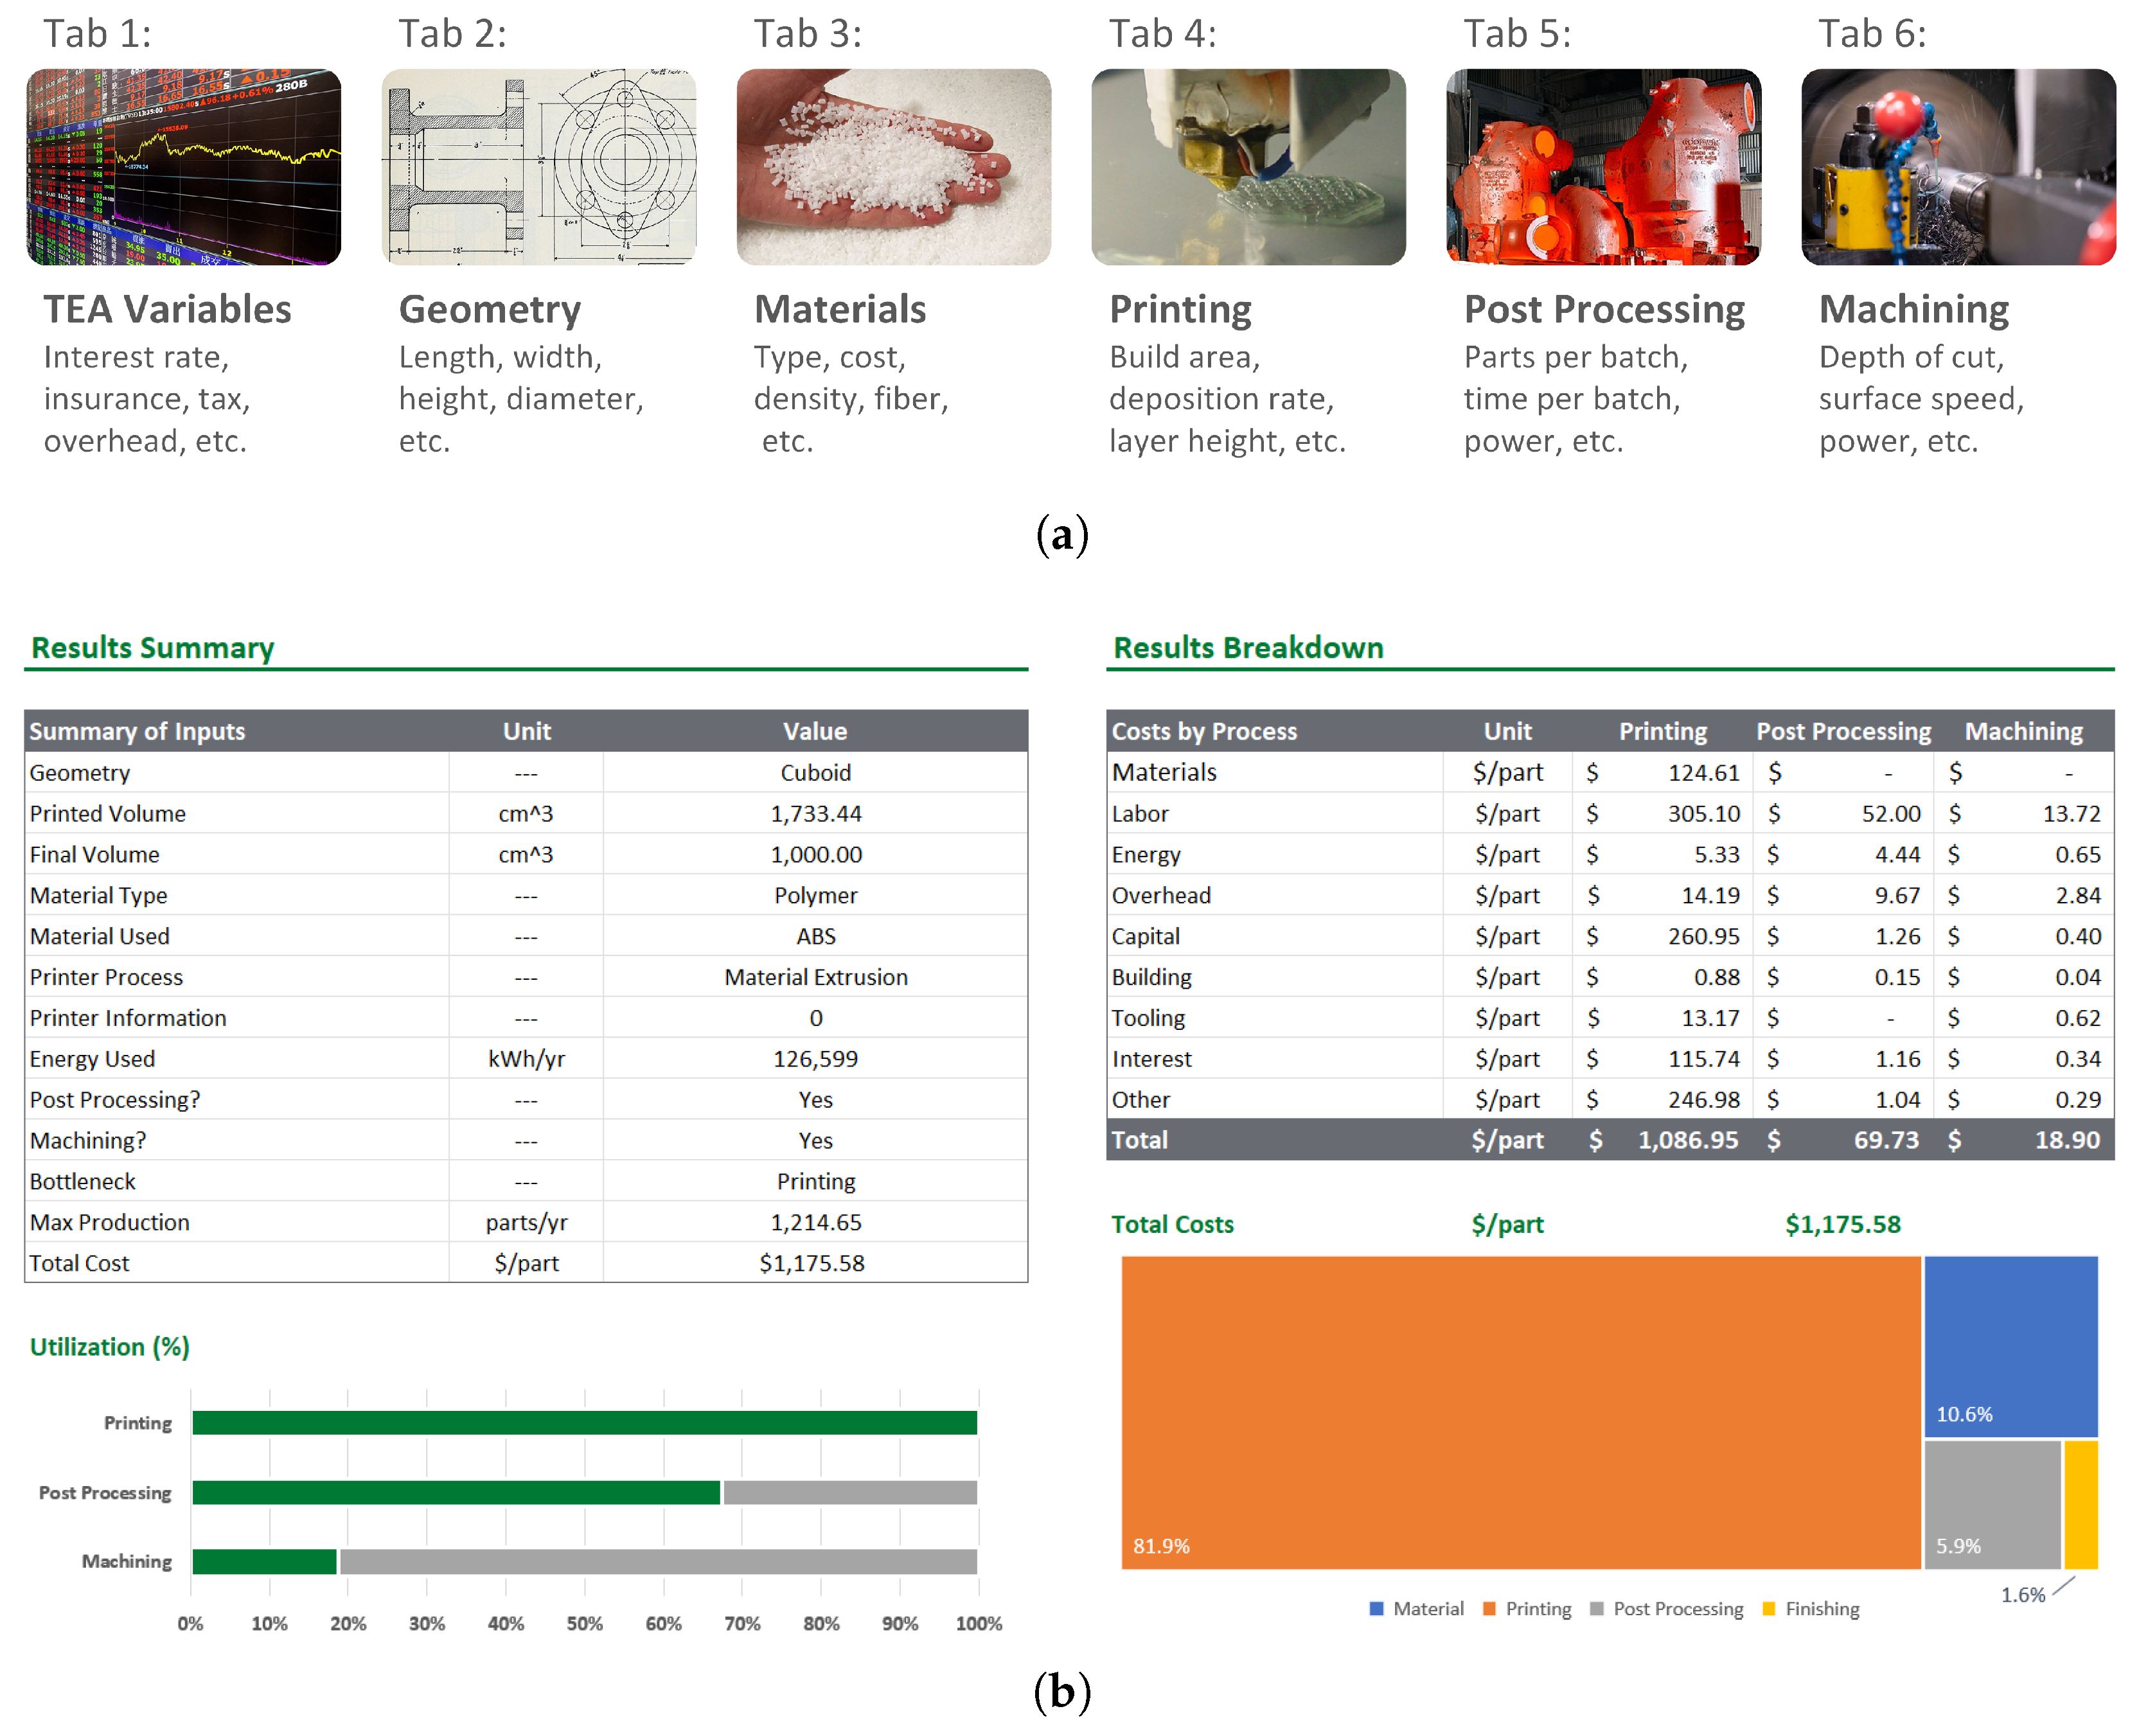
The AMCAC tool analysis follows the six steps outlined in
Figure 3a. In “Step 1—TEA Variables”, users select from three levels of cost analysis. In “Default” mode, the analysis uses a set of default values for cost variables (e.g., interest rate, energy cost, labor cost) from literature and previous studies, which are applied to all production steps. In “Intermediate” mode, users can edit these default values, and in “Advanced” mode, users can set different values for each production step. In “Step 2—Geometry” and “Step 3—Material”, users specify part characteristics, including the basic shape, material type, and material cost. In “Step 4—Printing”, users choose between four types of printing processes (binder jetting, material extrusion, material jetting, and vat polymerization) and set machine and operational parameters (e.g., operating hours, capital cost, and setup time). Similarly, in “Step 5—Post Processing” and “Step 6—Machining”, the user specifies aspects of any required post-processing (e.g., sintering, heat treatment, UV curing) or subtractive machining (milling or turning depending on part geometry) required to meet final part specifications.
To help users of all TEA skill levels, the tool incorporates a simple database of materials and printers. The materials data set provides ranges for density and cost of 17 metal powder types (including aluminum, copper, and stainless-steel alloys), 10 types of plastics, and four types of composite fibers. Users can directly use upper and lower values or input their own custom values. Similarly, a simplified AM printer data set provides ranges for common machine properties, including build volume, deposition rate, and capital cost, based on information in the public Senvol database [
36].
The remaining AMCAC tabs are for displaying results and comparing scenarios. For each process step (printing, post-processing, and machining), a detailed analysis of time and cost is provided, like those in
Figure 3b. Breakdowns for the total production process are also provided, including summary tables with information on materials, labor, energy, overhead, capital, tooling, interest, and other costs. Additionally, utilization analysis (e.g., the percent of time a step or process is operating compared with its theoretical maximum) helps to identify production bottlenecks that limit overall throughput. The tool can store results for up to ten scenarios and compare two of them side-by-side in the “Comparison” tab.
Results from the tool can be used to help manufacturers and researchers identify areas in AM production that represent the largest barrier toward adoption. The bottleneck analysis highlights the limiting step of the production process, prompting further analysis of part design and specifications. Redesigned parts can significantly reduce lead time and, therefore also, labor, overhead, and tooling costs. Breakdowns of time and cost provide an understanding of where efforts should be focused to reduce costs within each step and for the process overall. The tool, therefore, provides insight into the economic feasibility of AM, incorporating issues such as product quality through yield rate specification and how production variables like material selection and batch size affect overall cost.
4. Case Study: AM Optimized Aerospace Bracket
This case study builds upon analysis from [
15] using the improved AMECIA tool and the new AMCAC tool. Previous energy life cycle results are reanalyzed with the improved AMECIA methodology, and a new life cycle carbon emissions analysis is presented. A new cost assessment for AM production of the aerospace bracket is also discussed. Data are based on information from the original case study, interviews with machinists and industry experts, and typical ranges seen in the industry. Files for both case studies are provided in the Data Availability Statement, along with blank versions of both tools.
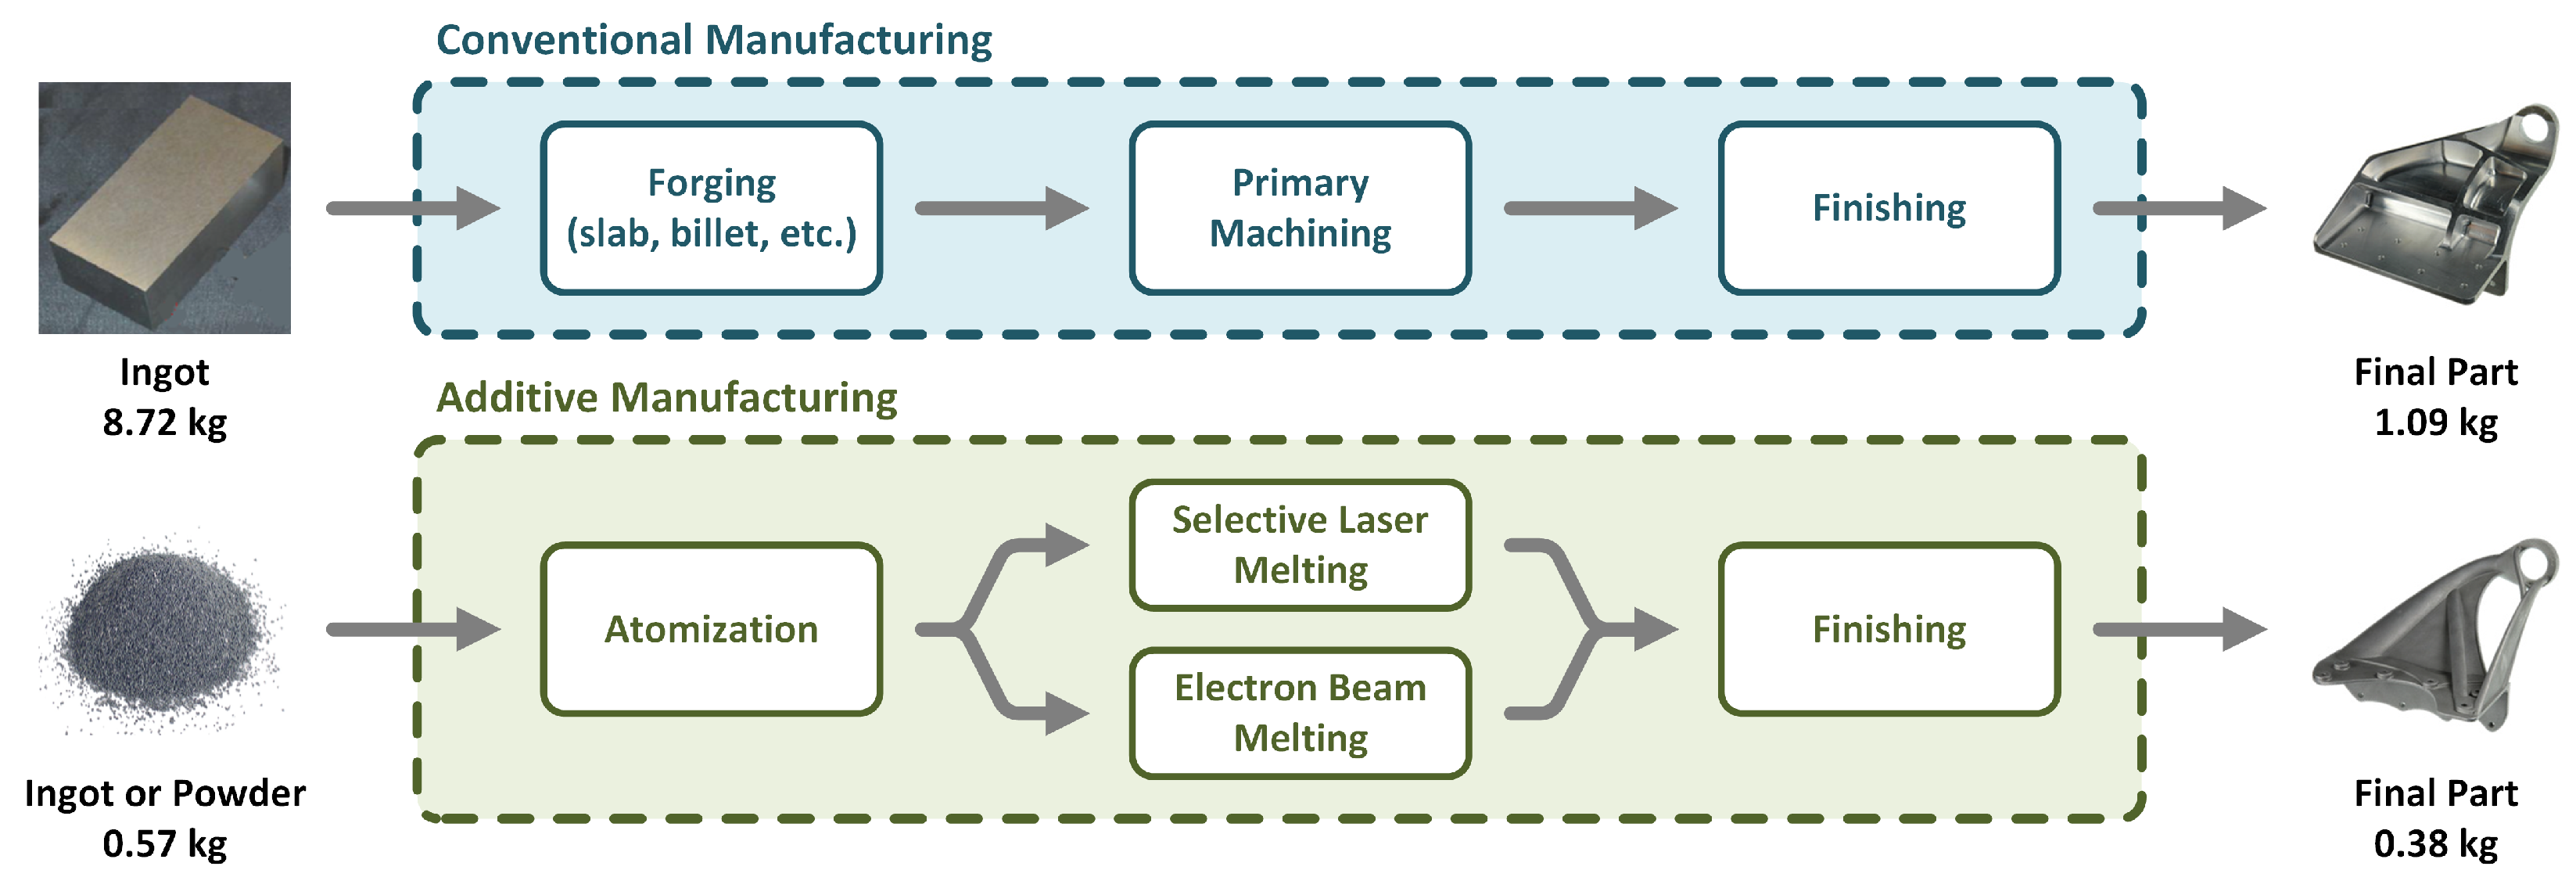
The bracket shown in
Figure 4 is used to hold various airplane cabin structures in place (e.g., kitchens, lavatories, and galleys). When this part is made conventionally, approximately 87.5% of stock material from a rectangular ingot of titanium alloy is removed. Therefore, the “buy-to-fly ratio” (the ratio of the starting ingot to the final part) is approximately 8:1. As these parts are made from an expensive titanium alloy, this scrap rate represents a significant portion of the overall manufacturing cost. An AM-optimized design reduces the bracket weight by 65% while also reducing the buy-to-fly ratio to just 1.5:1 using an electron beam powder bed fusion AM process. Reductions in embodied energy and carbon for the AM-optimized design mainly stem from this significant reduction in raw material as well as lower use-phase and EoL impacts from the optimized, lightweight design.
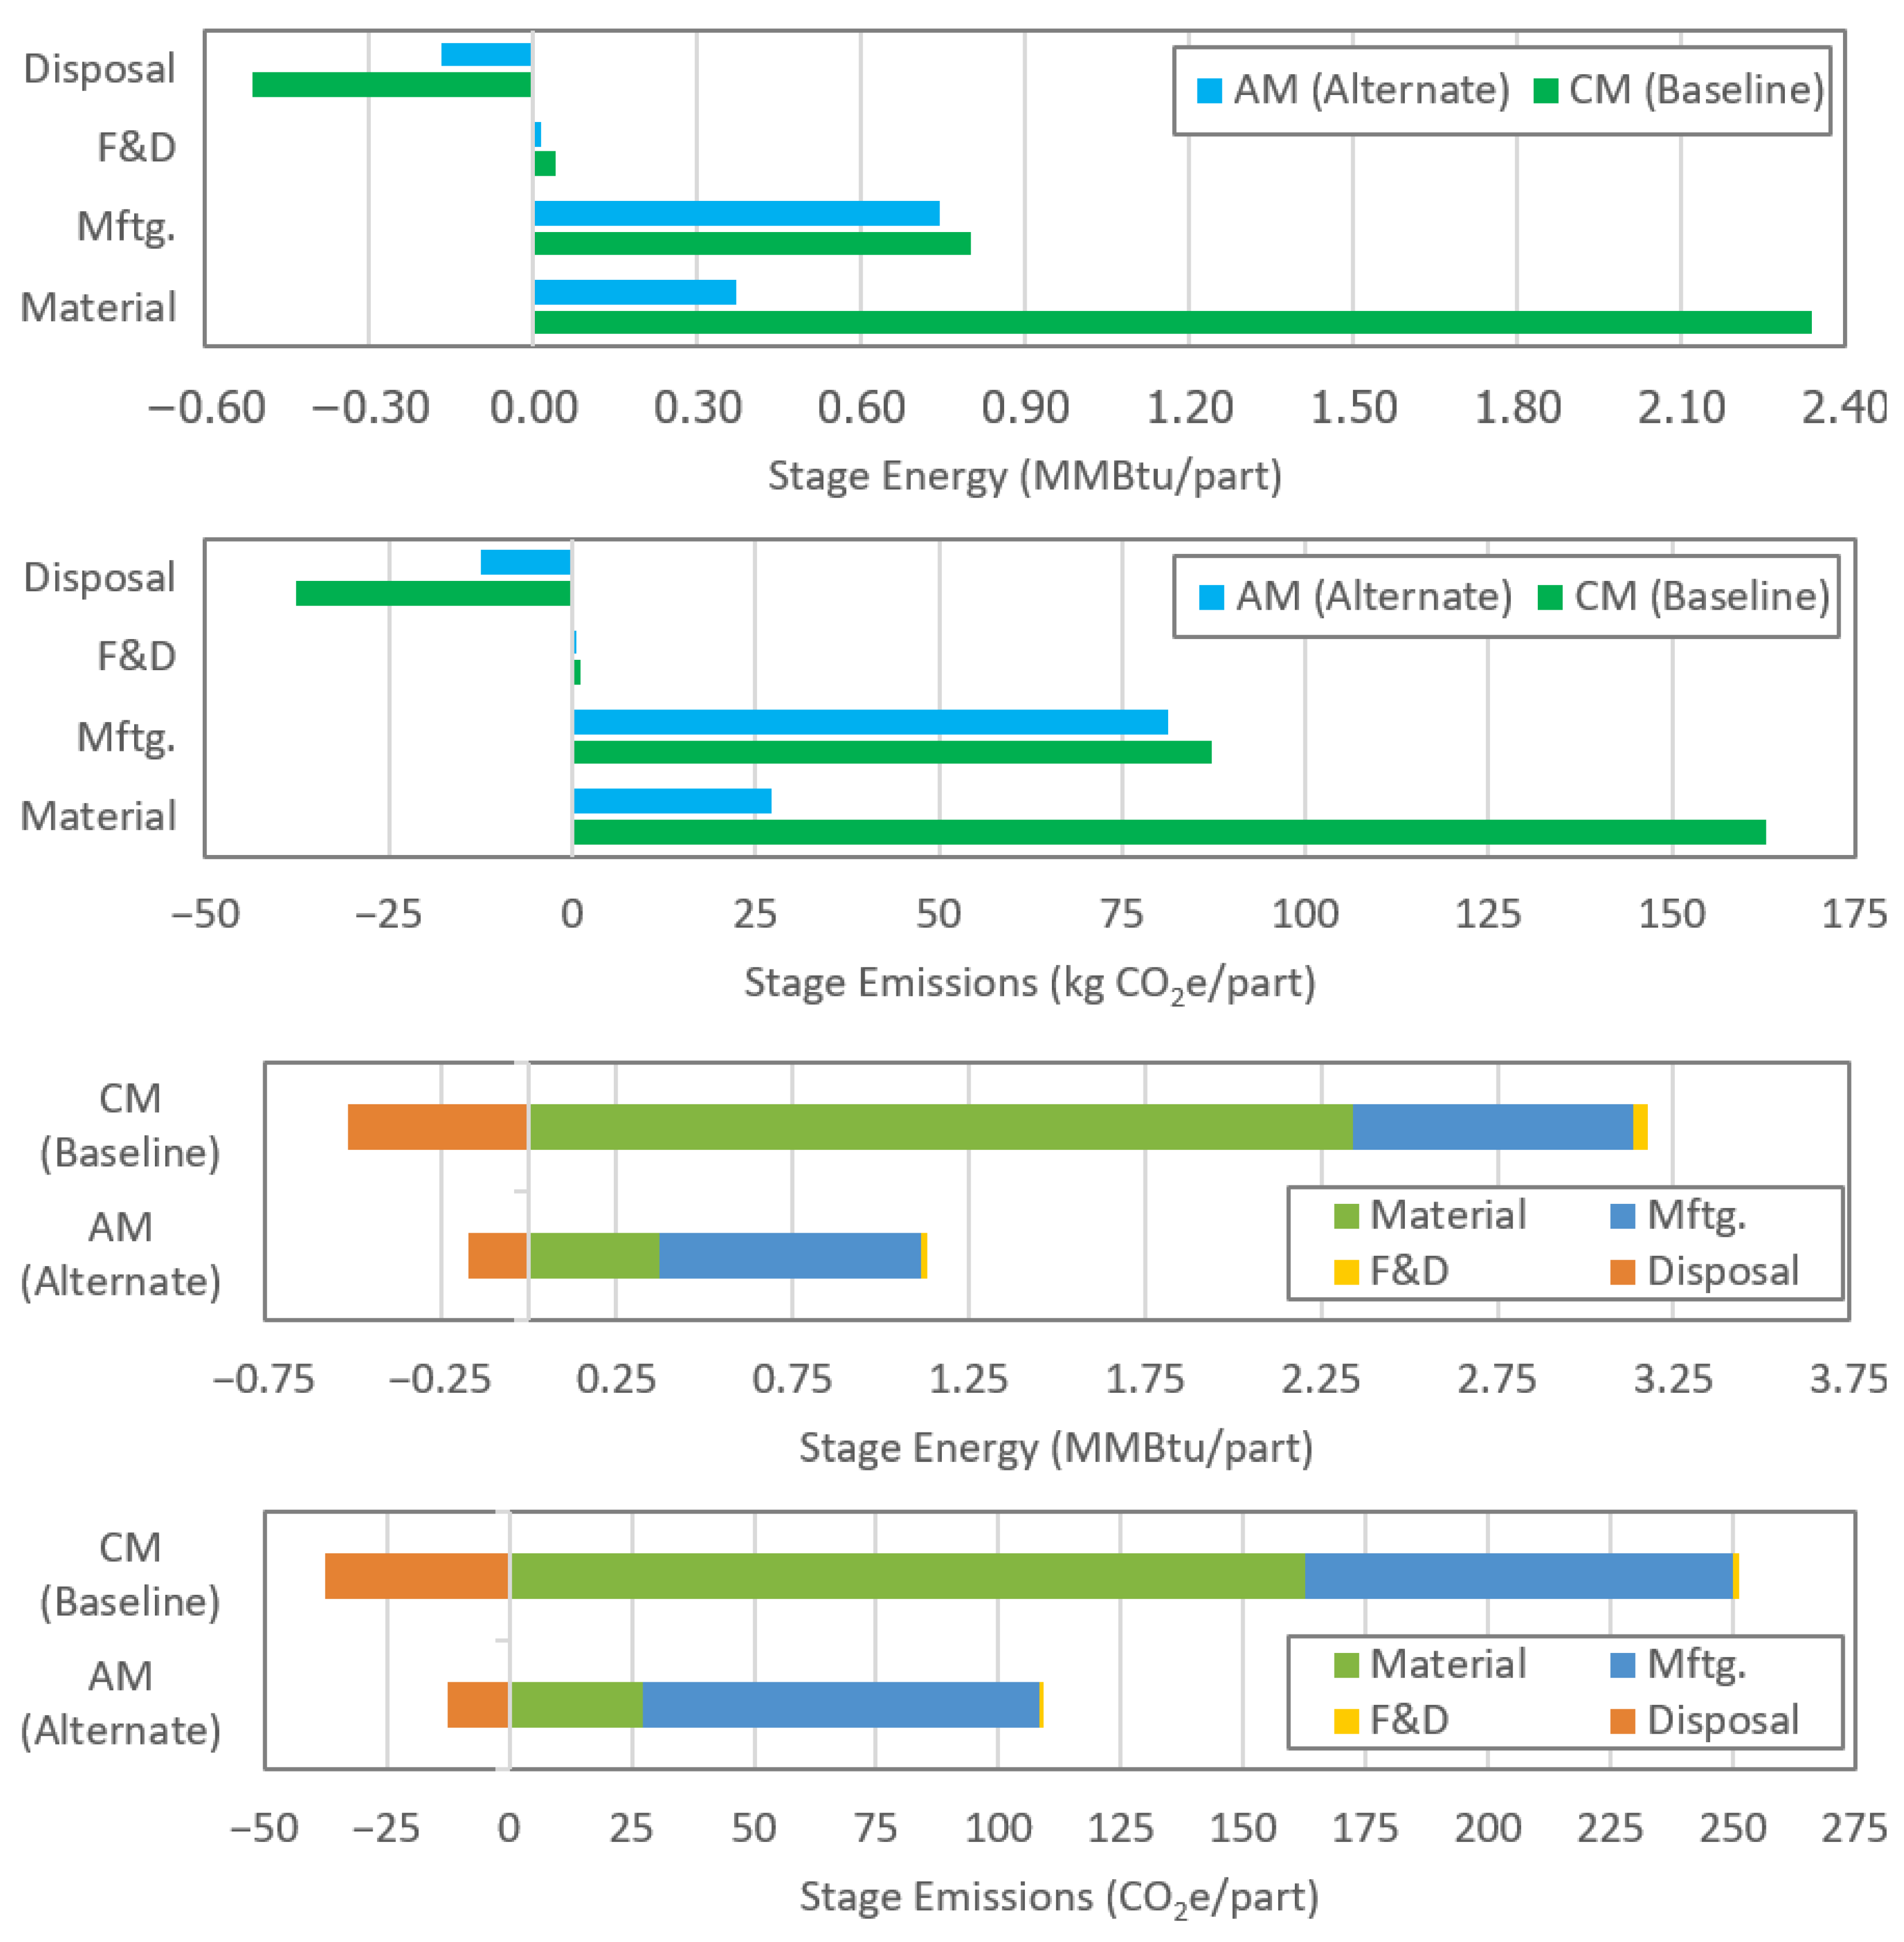
AMECIA tool results (
Table 1 and
Figure 5) show that for both CM and AM, nearly all life cycle energy and GHG emissions associated with the bracket occur in the use phase (approximately 97%). The lighter-weight, AM-optimized part reduces use-phase energy and GHG emissions, as well as freight and distribution energy and emissions, by 65%. The embodied energy of the raw materials was the next largest energy and emissions source, requiring over 2.3 MMBTU for each CM part, resulting in around 160 kg CO
2e or 2% of the life cycle impact, but only 0.37 MMBTU for the AM part, resulting in less than 30 kg CO
2e, or less than 1%. This is due to the substantial decrease in material needs (AM requires 93% less primary material) resulting in an over 80% decrease in material embodied energy and carbon. If the part is recycled at EoL, the CM part can offset its material impact by over 20% and the AM part by over 45%. CM manufacturing requires about 0.80 MMBtu per part due to its heavy machining (estimated to be over 30 h); conversely, the AM part only requires about 0.74 MMBtu due to the high efficiency of the directed energy deposition (DED) process and substantially reduced machining. Overall, the AM part used 93% less material and required 65% less energy, with a corresponding emissions reduction of 65%.
Embodied energy results from the updated AMECIA tool are similar to those from the previous version. While the calculations for the freight and distribution and use-phase stages are identical, the databases of material embodied energies and minor changes to the algorithm for primary material processing resulted in a moderate increase in material embodied energy (approximately 16% for CM and 19% for AM) for the analysis with the updated tool. The manufacturing stage had substantial changes to its algorithm for both CM and AM, resulting in a more robust understanding of processing energies and leading to an increase of over 500% for CM and nearly 200% for AM. The original tool and case study relied on databases of specific energy for the manufacturing stage, whereas the updated tool emphasizes estimating energy demand via machine power and processing time, lowering the reliance on potentially out-of-date studies and bringing focus to what is being produced. Similarly, the EoL phase also had changes to its algorithm, shifting focus from a specific energy database toward bottom–up analysis for better estimation of the energy and emissions needed to process EoL materials. These changes led to an almost 20% increase in embodied energy recovery for CM and just over a 10% increase for AM.
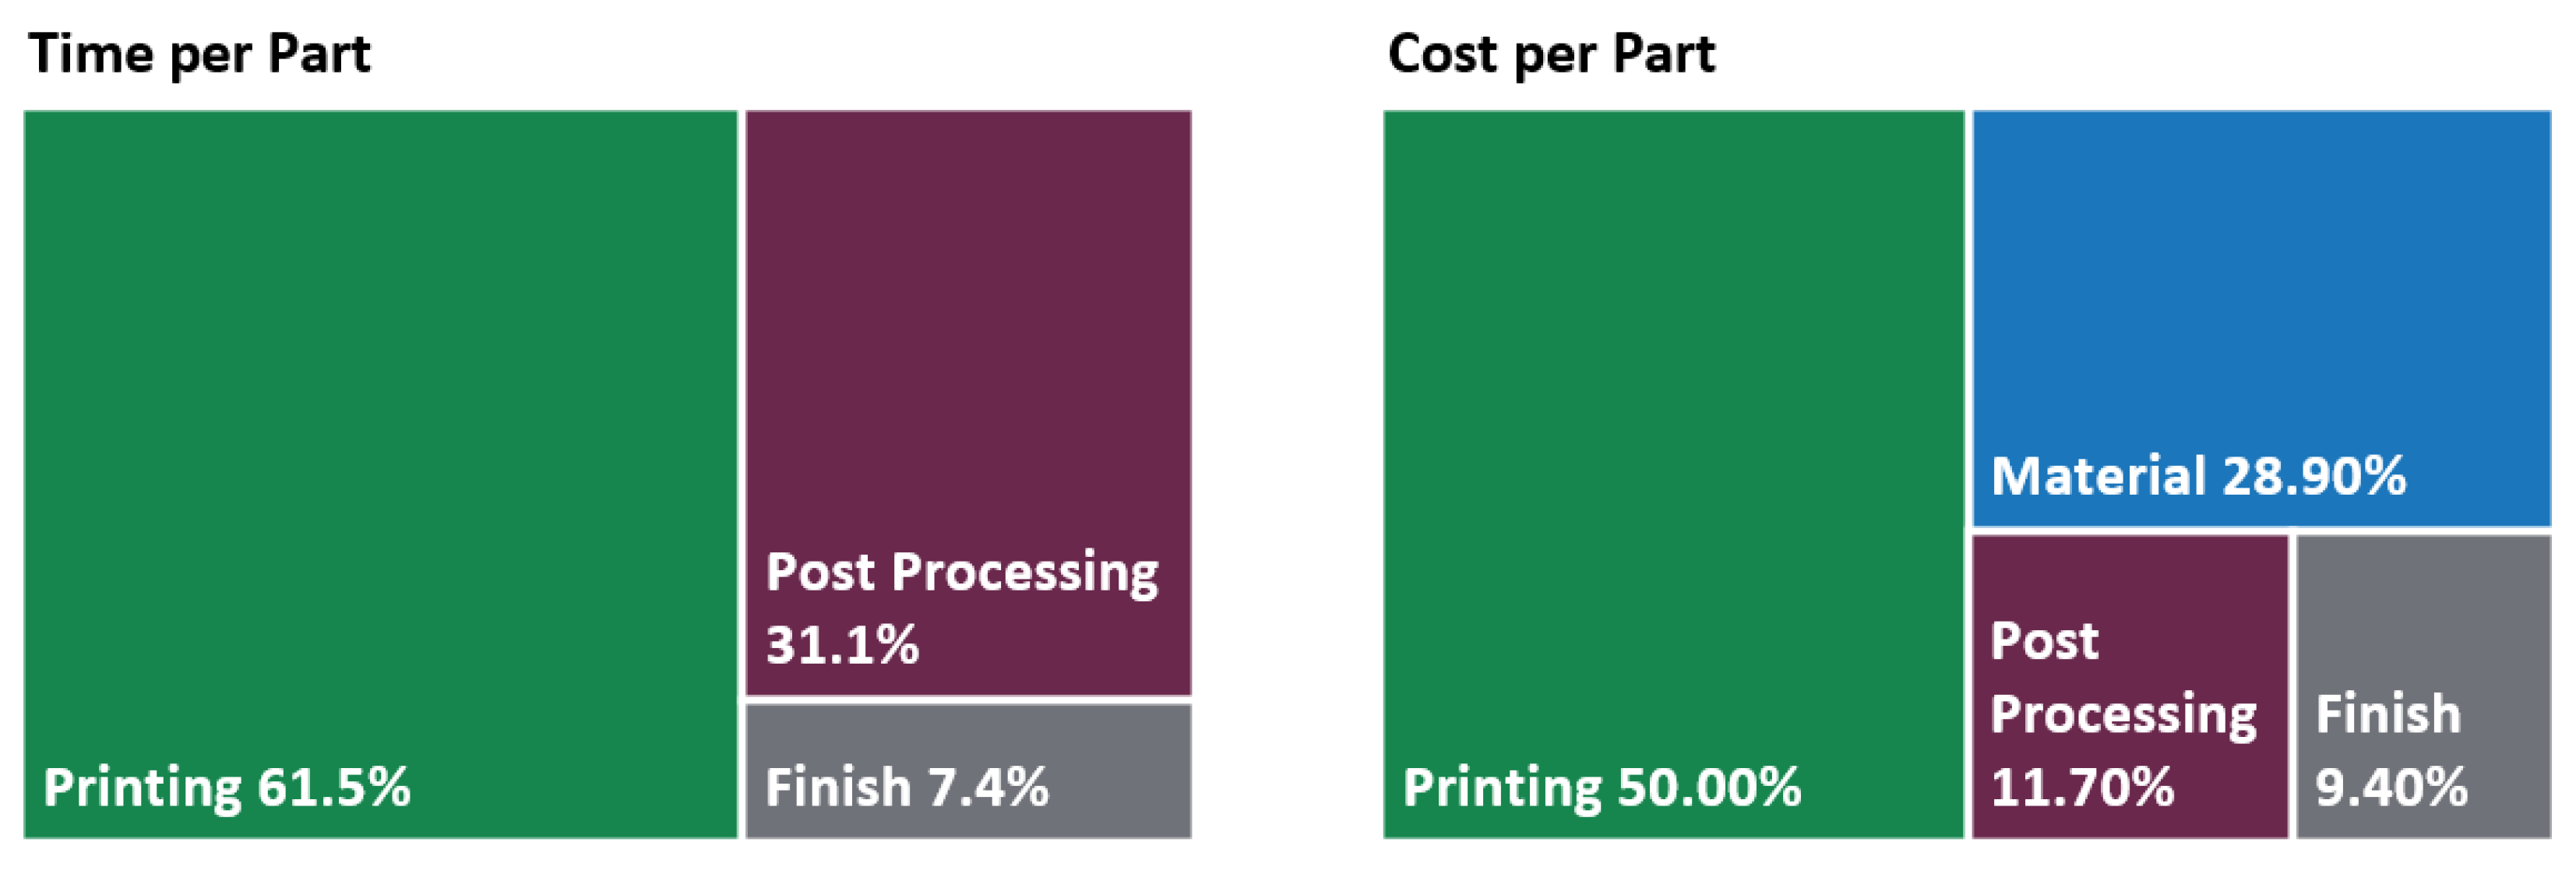
Using the AMCAC tool, the largest time and cost contributor for AM production is the printing process at 61.5% and 50%, respectively (
Table 2 and
Figure 6). Raw material, although significantly reduced in the lightweight bracket design, still accounts for approximately 28.9% of the overall cost. Printing costs should, therefore, decrease significantly as metal printing becomes more widespread and titanium alloy powders become less expensive. Lowering the cost of titanium powder (currently around
$300/kg) to the cost of a more common metal powder such as stainless steel (around
$50/kg) and reduces total part cost by almost 20%, from
$2010 to just
$1625/part. Post-printing material processing (e.g., hot isostatic pressing, or HIPing) and finish machining account for the remaining 21.1% of the cost. For the machining process, labor and tooling costs make up most of the process costs at around 80% combined. Of the remaining manufacturing time, post-processing accounts for approximately 31.1% and finish machining 7.4%.
For printing and post-processing, the significant cost drivers are capital and other costs (e.g., insurance and maintenance) at around 65% and 78% of step costs, respectively. These costs could be defrayed in a couple of ways. Firstly, the throughput of each process could be improved, thereby spreading capital costs over more overall parts. Secondly, the HIPing system runs less than 10% of its theoretical operating time (
Table 1). Using the HIPing system for other projects when not processing bracket parts (i.e., 90% of facility operating hours) would defray capital costs to other projects, resulting in a 9.2% reduction in total cost to
$1825/part. Similarly, the analysis also shows that the process bottleneck is printing (i.e., 100% utilization), followed by finish machining (63.5%). Further optimization of the AM bracket design to increase throughput for printing and reduce required machining could lower overall time and cost by reducing required material and time to print/finish and spreading capital/other costs over more produced brackets or other manufactured parts.


 ,
, 
