Abstract
Parameters of EPFM are used as relevant parameters in structural integrity assessments. In this research, the fracture toughness of armoured steel was determined. The resulting resistance curves and KJIC obtained according to the ASTM E1820 standard with normalization, compliance and multi-specimen methods were compared. Also, the KIC was verified according to the ASTM E399 standard as the most precise method for obtaining the KIC, which also requires a lot of knowledge. For the experiment, the multi-specimen method was used, which is the most expensive and most accurate method, where the least assumption and crack size is measured on the specimen. A fractographic analysis was also presented, and this heat-treated high-strength steel, which is used for anti-ballistic protection, was fully characterized.
1. Introduction
Fracture mechanics deals with the analysis of stresses and deformations around the crack as well as the determination of the values of the parameters that define the critical states [1]. It is divided into linear-elastic LEFM and elastic–plastic EPFM fracture mechanics. In LEFM, the material’s resistance to cracks is expressed by the critical value of the KIC factor, also called the fracture toughness during plane deformation. Fracture toughness is an important material property and characterizes the material’s ability to resist fracture [2]. When using LEFM, one should keep in mind the limitations set by the standard during experimental testing, and the primary limitation is a relatively small plastic deformation zone compared to the dimensions of the component and the size of the crack [3]. Since a large zone of plastic deformation develops around the tip of a crack in most structural materials, elastic–plastic fracture mechanics is used to analyse the plastic behaviour of materials with a crack. The EPFM parameters are crack tip opening displacement δ and the critical value of the J–integral, which are the main parameters on which the fracture control is based [4,5,6]. In order to determine the critical value of the J–integral and the crack tip opening displacement δ, the ASTM E1820 standard [7] was adopted. According to the standard, there are several ways to consider the material’s plasticity in the assessment of structural integrity, which boil down to the application of the crack tip opening and the J–integral as relevant parameters of elastic–plastic fracture mechanics. Also, it should be used as a fracture criterion when the fracture is preceded by a larger plastic deformation of the material at the top of the crack [8,9].
As with all types of steel and anti–ballistic steels, which have high strength, fracture toughness is very important when assessing structural integrity [10]. One of the similar tests in this area involving armoured and high-strength steel was carried out on the material Armox 500T and on a welded joint. The behaviour of dynamic toughness with three distinct assessment techniques was evaluated and compared [11]. In one of the papers [12] on the topic of Protac 500, a combination of experimental and numerical tests was carried out, where the parameters of the material were determined for the Johnson–Cook strength and fracture model. However, the most used methods for steels are the normalization method and the compliance method. The normalization method is the most practical method, but there is also a need to assess its accuracy [13]. Various scientists have been involved in comparing these two methods on different configurations and specimens’ thicknesses as well as on different material strengths. The comparison of these two methods and the impact on the different results is explained in the article by Hui Gao et al. [13]. Table 1 shows a review of work comparing these two methods.

Table 1.
Materials on which the normalization method and compliance method were compared [13].
Recently, anti-ballistic and high-strength steels have become a very common subject of the testing and determination of fracture toughness and resistance curves. The aim of this work is to clarify the examination of fracture mechanics with an initiated crack as the most dangerous fault in construction. In addition, other aims are to present three test methods, and to compare the obtained results and resistance curves on the ultra-high strength armoured base material used in special and military purposes, for which the fracture mechanics parameters are very important.
2. Materials and Methods
2.1. Material Protac 500
Armoured steels are developed to provide high resistance to penetration and protection against explosion. Numerous types of such steels have been developed so far. Some armour steel groups are known in Europe: the Russian steel group, the French group with the commercial name Mars (manufactured by Creusot Liore Industrie, Le Creusot, France) and the Swedish group Armox (manufactured by SSAB Oxelösund, Oxelösund, Sweden). When choosing and developing such a material, a compromise must be reached between the required mechanical properties and the price of the material [18]. Armox (500T AND 600T), with its extraordinary combination of high hardness and toughness, is certainly one of the most famous and tested armour steels. Various experiments and publications were performed and described it: material characterization, fracture properties, numerical analyses, welding, ballistics tests, etc., [19,20,21]. Also, Mars (TM300, TM500, TM600, TM650) is a high-strength and high–hardness steel intended for ballistic protection. Many ballistic and other experiments were performed on this material [22,23,24].
Steel Protac 500 is a material produced in the Slovenian ironworks SIJ Acroni Jesenice (Jesenice, Slovenia). It belongs to the group of steels with anti-ballistic protection. It also belongs to the group of steels with ultra-high strength, high hardness and good ductility. It is used to build objects and vehicles that need anti-ballistic protection. The primary function of Protac 500 steel is to repel the bullet, deform the bullet, absorb the bullet’s energy or a combination of the previous three ways [25,26]. While bulletproof vests are made of composites (limited to low-velocity projectiles vi < 600 m/s), armoured vehicles are made of steel materials (high impact velocities vi > 700 m/s, e.g., bullet caliber 7.62 mm) [27]. Armoured steels are still the leading steels on the market for which impact and explosion protection is of utmost importance. They serve as additional armour or as a structural element in the construction of armoured vehicles. They are intended for work in extreme conditions that include high impact speeds and explosions. Knowledge of fracture properties is of great importance for armoured steels [20]. There are also standards to production sheets metal that have an anti-ballistic function, where the mechanical properties must be the following: hardness > 500 HB, yield strength >1200 MPa, ultimate tensile strength > 1600 MPa, elongation at room temperature > 6%, and impact energy at −40 °C > 15 J. By applying proper heat treatment, these values can be achieved [28]. The chemical composition of the tested steel is given in Table 2, and the basic minimum mechanical properties are given in Table 3.

Table 2.
Chemical composition of Protac 500 [26].

Table 3.
Guaranteed minimum mechanical properties of Protac 500 by steel producer [26].
2.2. Heat Treatment and Mechanical Properties Testing
The material that was tested was heat-treated Protac 500 steel. The heat treatment was performed so that the material was tempered to a temperature of AC3 900 °C, then to a low temperature, tempered at a temperature of 220 °C, where it was held for 3 h; Figure 1. The material’s tempered martensitic structure was obtained by low temperature tempering; Figure 2.
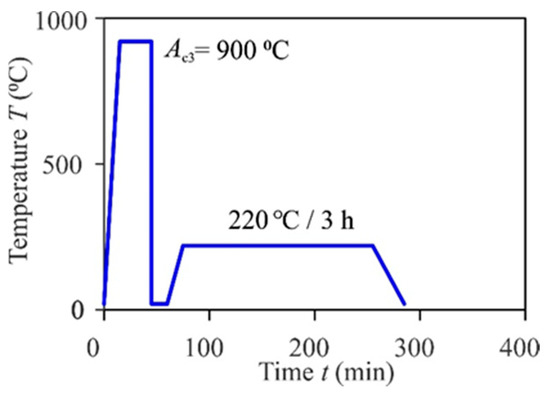
Figure 1.
Heat treatment of Protac 500 steel.
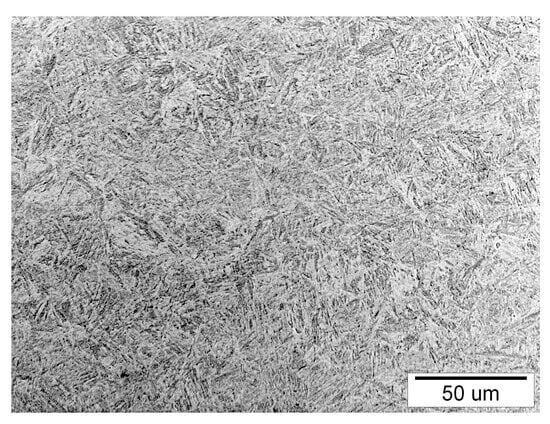
Figure 2.
Tempered martensite microstructure.
The new mechanical properties of this heat-treated material were obtained through mechanical tests: tensile test, instrumented Charpy test and hardness measurement. The tensile test was performed according to standard EN ISO 6892-1:2019 by using method B [29] on the servo hydraulic Amsler 559/594 universal testing machine (Amsler Prüfmaschinen A.G., Merishausen, Switzerland—now Amsler Prüfsysteme, Neftenbach, Switzerland), and cylindrical specimens were prepared according to Figure 3. The hardness was measured on Roell-Zwick Z600 (Zwick Roell Group, Ulm, Germany) using a Vickers pyramid according to EN ISO 6507-4:2005 [30], with a load of 98.1 N at three different locations. For the Charpy impact tests, an instrumented Charpy pendulum Amsler RPK300 (Amsler Prufsysteme, Neftenbach, Switzerland) was used, according to ISO 148-1 [31], with the geometry of the specimens ISO V-notch, according to Figure 4. All experiments were performed at room temperature +20 °C.
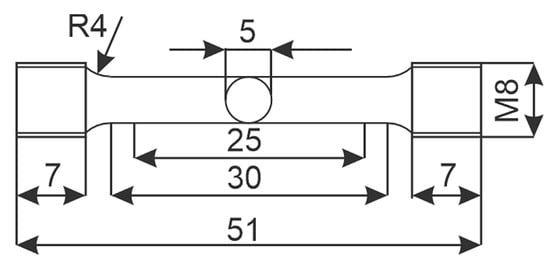
Figure 3.
Tensile test specimen.
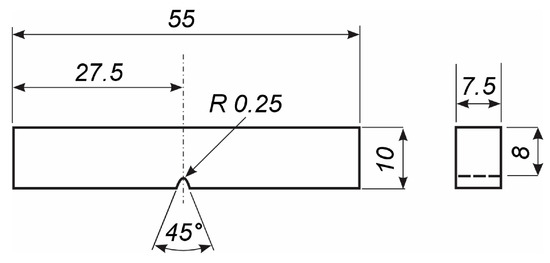
Figure 4.
Charpy specimen.
2.3. Methods for Determining Fracture Toughness
There are different types of standards according to which the fracture toughness of materials is determined. In this paper, the JIC and KIC values were obtained using the ASTM E1820 standard (three methods from that standard: normalization, compliance and multi-specimen method) and ASTM E399. Also, according to the ASTM E1820 standard, the material resistance curves J-R and δ-R will be presented. The resistance curves represent how the energy required for crack propagation increases with its growth. They are obtained by interpolating the points of the experiment in the diagram (J integral-crack extension for the J-R resistance curve and CTOD-crack extension for the δ-R resistance curve) for each specimen and each method separately. In the discussion, the results of these methods were compared and differences in the small scattering of values and curves were described.
2.3.1. Normalization Method
The normalization method can be used in cases to obtain the J-R curve directly from the force-crack mouth opening displacement record (P-CMOD), taken together with the initial and final crack length measurements from the fracture surface of the specimen. The method is the most used for cases where high load rates are used or where high temperatures or aggressive environments are used [7]. It is to be used for statically loaded samples if the standard’s requirements are met. The normalization method is not applicable for low-toughness materials tested in large specimens where large crack propagation may occur without a measurable displacement of the plastic load line. The normalization method is used quite often, especially when determining resistance curves to crack growth in steel for pressure vessels. It has been proven that it is suitable for determining the fracture toughness of a ductile crack [32].
2.3.2. Compliance Method
The compliance method is where the crack size propagation (∆a) is registered with the slope of individual unloading during the test in the P-CMOD curve. As a rule, crack development occurs when the Pm force in the P-CMOD diagram is exceeded; Equation (1). In this method, two quantities (applied load and specimen deformation) are connected to obtain the crack length. Simply put, compliance is the ratio of the deflection of the specimen to the applied load. By increasing the length of the crack, the elasticity of the sample also increases because the deflection for an applied load is increased. This method is widely used for isotropic and elastic materials [33]. The test procedure is reflected in obtaining the resistance curve J-∆a, where each obtained point for the curve represents one compliance. The most used methods for determining fracture toughness are the normalization method and compliance method. A big advantage of these two methods over the multi-specimen method is economy, because you do not need to make more specimens. Comparisons between these two methods are often made, i.e., comparison between the obtained J resistance curves, both on the base material and on the welded joints. The average difference or conformity is detected, and conclusions are adopted, based on which method to use depending on whether the material is brittle or ductile [34].
2.3.3. Multi-Specimen Method
The multi-specimen method requires four or more specimens, which makes it one of the most expensive and most accurate methods. Each specimen is separately loaded to the selected load level and unloaded to obtain the increase in crack length ∆ap. Each specimen is then broken to reveal the surface of the crack. The multi-specimen method follows the compliance method so that the values of the last points are taken from the resistance curves J-R and δ-R from the compliance method. Based on these last points, a new or the most accurate J-R and δ-R resistance curve is drawn [7]. Sometimes the parameters obtained from previous methods are not the most reliable because the test was performed on one or two specimens. For this reason, the multi-specimen method gives the most accurate parameters, takes into account several specimens, and is, therefore, applied to all materials where it is very important to determine the fracture toughness [35]. In addition to the ASTM E1820 standard, there are many other standards for determining fracture toughness (ASTM E1921, ASTM E399, etc.) [36].
All methods were tested on SENB specimens on a three–point bending test. The specimens were first subjected to a prefatigued load to form a pre-crack at the tip of the notch, then loaded slowly quasi-statically to determine J as a function of crack growth. The test procedure was reflected in obtaining the resistance curves towards the crack, the J-∆a curve and the δ-∆a curve [7]. These tests were performed on a material used in dedicated industries and it was essential that the results of toughness and fracture resistance met all criteria and standards of armoured steels [37].
The determination of the nominal limit force Pm is defined by Equation (1) [7]:
where B—thickness of specimen; bo—remaining ligament (Equation (2)); σy—mean value of yield stress Rp0.2 and ultimate tensile strength Rm (Equation (3)); and S—support span [7].
The value of the J-integral is determined as the sum of the values of the elastic and plastic J-integrals (Equation (4)) [7]:
For characteristic points on the force–displacement diagram with coordinates Pi, vi, the J integral is calculated by Equation (5) [7]:
where Ki—stress intensity factor in the calculated step; ν—Poisson’s ratio; E—Young’s modulus of elasticity; and the bending specimen Jpl,i is calculated by Equation (6) [7]:
Apl—the area bounded by the P—CMOD curve and the line of relief; i—point on the P—CMOD curve.
Based on the obtained data, a J-∆a curve diagram was constructed on which the fitting line is constructed according to the ASTM E1820 standard. JIC was obtained from the intersection of the parallel line with the construction shifted by 0.2 ∆a and fitted J-∆a curve. From the size of the critical JIC integral, the value of the critical stress intensity factor or the fracture toughness at straight deformation KJIC can be calculated using the dependence (Equation (7)) [7]:
The value of δ is calculated as the sum of the elastic and plastic components [1,7] (Equation (8)) [7]:
where is the elastic part of δ (Equation (9)) and is the plastic part of δ (Equation (10)) [7].
where r—distance to the rotation point; W—specimen width; a0—origin crack size; νp—plastic part of δ; z—the thickness of the support knives placed at the location of CMOD measurements, ν—Poisson ratio; E—Young modulus, and Rp0.2—yield stress. Based on Equations (6)–(8), we get Equation (11) [7]:
where B—specimen thickness, and —crack’s shape function, which can be in the case of the SENB specimen calculated by Equation (12) [7].
Fracture mechanics tests are very complex. To obtain the most accurate results, all test phases were precisely defined and all requirements regarding the validity of the results must be met.
2.3.4. Determination of KJIC According to the ASTM E399 Standard
Another standard for determining the fracture toughness of materials is the ASTM E399 standard [38]. The stress intensity factor can be considered as a stress-based estimate of fracture toughness. Depending on this parameter, plane strain fracture toughness under plane strain and small-scale yielding conditions for most metallic materials can be predicted according to the ASTM E399 standard [39]. This method has been used in numerous studies with the aim of calculating KIC. There are also explanations that this method underestimates the KIC values if the material has a large area of plasticity [40]. According to the standard, for the specimen to be valid, the following conditions (specimen size) should be met according to the ASTM E399 standard. Therefore, all specimen dimensions should be greater than the value in Equation (13) [7], especially the remaining ligament b0 = (W − a0) [41,42].
2.4. Fractography Analysis
Fractography analysis has been used for many years (approximately half a century) as a post-mortem tool to determine fracture patterns and to assess the fracture toughness of brittle or ductile components [43]. The scientist’s task is usually to inspect the fracture surface with the naked eye, then make a microscopic or fractographic analysis. With fractographic analysis, it is possible to recognize whether the shape of the crack shows some correlation with the fault in the structure or whether the crack spreads along the grain or through the grain [44,45]. In this experiment, scanning electron microscopy was used, which helps additionally in the description of the behaviour of the material and complements the analysis of the path of the crack inside the microstructure [46]. The scanning Microscope Quanta 200 3D (FEI Company, Hillsboro, OR, USA), Figure 5a, was used for the fractography analysis. The preparation of specimen P03 before putting it into the chamber of the scanning microscope is shown in Figure 5b,c.
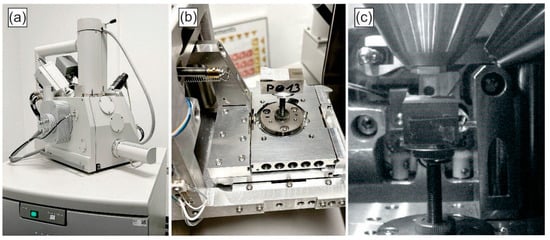
Figure 5.
SEM microscope (FEI Company, Hillsboro, OR, USA) and preparation of the specimen P03; (a) Quanta 200 3D; (b) fixing the specimen; (c) SEM chamber with P03 specimen.
2.5. Testing Device and SENB Specimen
In order to obtain the critical values of the J integral and δ according to the ASTM E1820 standard, the experimental part (pre-fatigue, test and post-fatigue) was performed on resonant Vibrophore 100 tensile machine manufactured by Zwick Roell company (Zwick Roell Group, Ulm, Germany), Figure 6a, at the Faculty of Mechanical Engineering in Maribor. Also, Figure 6b shows the configuration of the sample on the machine. The SENB specimens, shown in Figure 7a,b, were used for the experiment, and the dimensions of the specimens are in Table 4. The experiment was performed at room temperature.
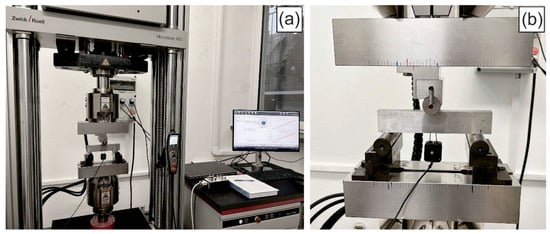
Figure 6.
(a) Vibrophore 100 testing device manufactured by Zwick Roell. (b) Sample configuration during the test.

Figure 7.
(a) SENB specimen geometry. (b) Specimen used for fracture toughness testing.

Table 4.
Dimensions of SENB specimens.
3. Results
3.1. Results of Tensile Test, Charpy Impact Test and Hardness Measurement
The heat-treated material, by low-temperature tempering, Protac 500, acquired new mechanical properties. By tensile testing, we obtained the tensile strength of the material, yield stress, and the elongation and contraction of the cross-section, and the results are shown in Table 5. By instrumented Charpy testing, we obtained the impact toughness of the material and the impact energy absorbed by the material and its distribution into the energy required for crack initiation and the energy required for crack propagation. The results of the Charpy test are shown in Table 6. The results of Vickers HV10 hardness measurements are shown in Table 7.

Table 5.
Tensile test results.

Table 6.
Charpy impact test results.

Table 7.
Hardness measurement results.
3.2. Results of Fracture Toughness and Resistance Curve
Five specimens were used to determine the fracture toughness of the base material Protac 500.
The experiment is divided into three parts according to the standard, pre-fatigue, fatigue and post-fatigue.
For pre-fatigue crack to occur, it is necessary to respect the standard. According to the standard, the final length of the pre-fatigue crack must be within the values according to Equation (14) [7]:
The standard also prescribes the maximum permissible deviation of the length of the pre-fatigue crack, i.e., the straightness of the crack front; Equation (15) [7]. The importance is reflected in the fact that if the crack front is irregular (not equal on both sides of specimen), it means that the stress distribution is not uniform. This can result in falsely high or low JIC and KJIC values, proving that the ASTM standard pays special attention to specimen geometry to ensure repeatability and data validity.
The following Table 8 shows the obtained values, which shows that all the required conditions according to the standard for pre-fatigue crack are met.

Table 8.
Pre-fatigue values.
The load during the main part of the experiment (fatigue) was performed according to the standard. The calculated force Pm, which is defined for the compliance method, tells us what load we have to apply for the first three times with unloading to half the value of that force. With the first three loadings and unloadings, it is very important that we are in the elastic zone of the material, and that there is no plastic deformation, because these slopes are taken as reference and in relation to them, the further progress of the crack growth is measured. Each subsequent loading was performed with a CMOD step of 0.2 mm and a speed of 0.010 mm/s. The experiment continues until the P-CMOD curve drops slightly after the maximum force that the material can withstand.
Fatigue after the experiment (post-fatigue) is used to mark the part of the crack where it had stable growth. Post-fatigue to the final failure is performed with half the maximum force that the specimen endured during fatigue.
3.2.1. Results of the Normalization Method
The measured values of P-CMOD for P01 to P04 are shown in the diagram in Figure 8. The normalization method for crack growth monitoring according to the ASTM E1820 standard is shown in Figure 9 (the normalization performed on the P03 specimen was taken as an example). The displacement value-CMOD in relation to the force is measured for each specimen. Then, the fracture of the specimen follows, and the crack and the remaining ligament are measured. The results are obtained based on the J-∆a and δ-∆a resistance curves, which are drawn as shown in Figure 10 and Figure 11 (for example, the J-∆a and δ-∆a resistance curves for specimen P04 are taken). Engineering critical values are calculated as intersections of the resistance curves and the parallel offset of the construction line ∆a = 0.2 mm, representing the crack’s blunting and expansion for 0.2 mm. The maximum value is limited to Jmax, because at the condition J > Jmax, the plastic deformation becomes significant, so the crack’s behaviour does not depend on the material but on the remaining ligament. The results of the normalization method are shown in Table 9. For specimen P05, it was not possible to perform the normalization process due to the too short crack propagation.
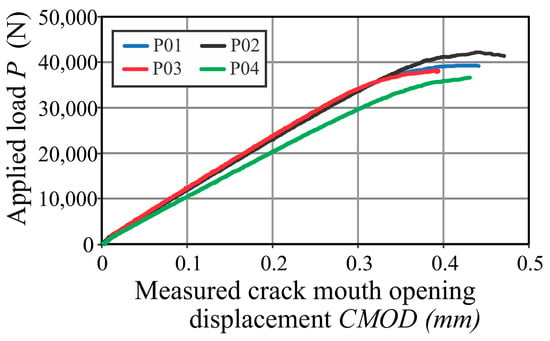
Figure 8.
Measurement of P-CMOD values for specimens P01–P04.
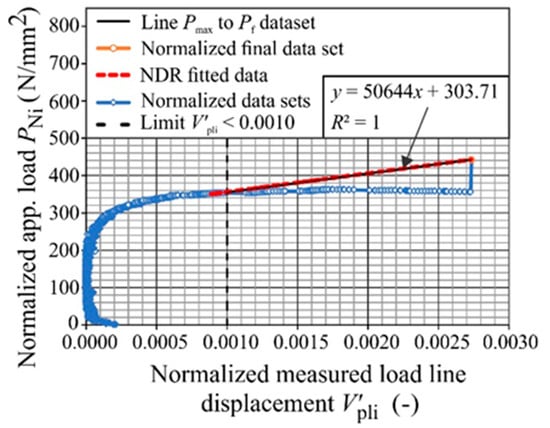
Figure 9.
Normalization method for specimen P03.
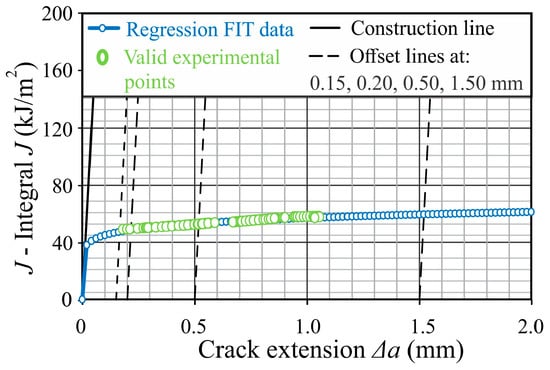
Figure 10.
J-∆a resistance curve for P03 specimen.
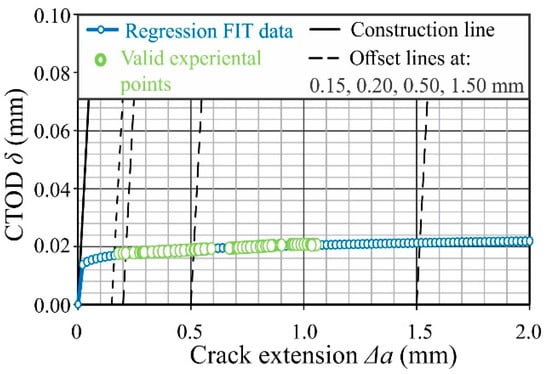
Figure 11.
δ-∆a resistance curve for P03 specimen.

Table 9.
Results of the normalization method.
For the calculation of fracture toughness according to the normalization method, which includes factors, such as the geometry of the specimen (height, width, length of the premachined notch) and material characteristics (yield strength, tensile strength, Young’s modulus of elasticity, Poisson’s ratio), everything starts from the so-called “raw” experimental data F-CMOD (blue circles shown in Figure 9). The other drawn lines serve us for the correct selection of the points that we need to take and normalize. The orange circle shown in Figure 9 represents the normalized final data set as a subset of the data that was filtered from the original set, used in the linear part of the curve, and used to calculate the J-integral. The data for the normalized final data set meet the condition of the standard v′pl > 0.0010, which means that they are above the values that indicate stable crack growth, and all data for which v′pl < 0.0010 (black dashed construction line in Figure 9) are rejected because they do not satisfy the criterion for a valid evaluation of toughness. The fitted data are represented by a red line in Figure 9; they are NDR fitted data (Normalized Data Regression), which represent a regression/approximation line through a set of normalized points to show the perfect agreement between the fitted line and the data (the equation of the regression line and the coefficient of determination is always given next to the line). For validation and comparison with NDR fitted data, the data between the maximum force Pmax and the final force Pf (black line in Figure 9) are used, which defines the part of the load where unstable crack growth occurs. The importance of the diagram shown in Figure 9 is that it shows how valid ones (orange data) are extracted from the experimental data (blue data), then regression analysis (NDR fitting) is applied to them, and the result is used for further calculations of fracture toughness.
3.2.2. Results of the Compliance Method
This method is tested on five specimens (P01–P05) that are successively partially unloaded. Unloading is performed on half of the calculated force Pm, which is calculated for each specimen separately; Table 10. The P-CMOD graph for the compliance method is given in Figure 12 (just for the specimen P03). At each unloading, based on the compliance, the current length of the crack ap/W = f(C) is determined and the crack length ∆ap = ap − a0 and the corresponding value of the J-Integral are calculated. The resistance curves obtained by the compliance method (shown only for the specimen P03) are given in Figure 13 and Figure 14, and the results for all specimens are given in Table 11.

Table 10.
Calculated force Pm.
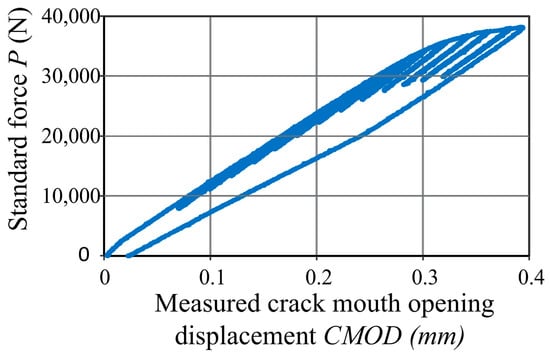
Figure 12.
P-CMOD graph for specimen P03.
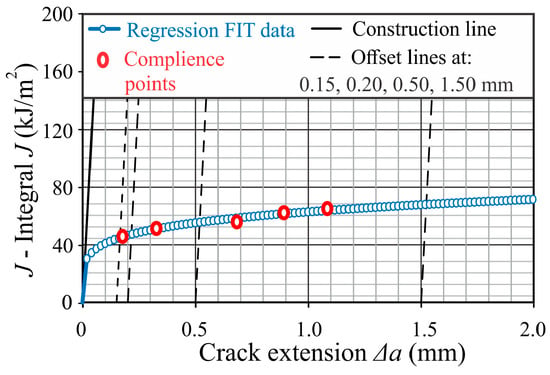
Figure 13.
J-∆a resistance curve for P03 specimen.
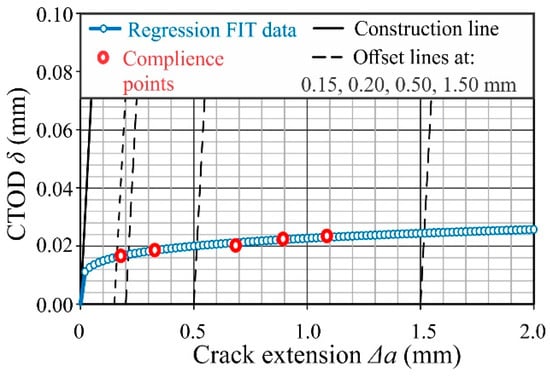
Figure 14.
δ-∆a resistance curve for P03 specimen.

Table 11.
Results of the compliance method.
3.2.3. Results of the Multi-Specimen Method
We carried out this method on five specimens P01–P05. Based on the last point from each of the five resistance curves J-∆a and δ-∆a from the compliance method, we obtained a new curve, which consists of these points in the diagram J-∆a and δ-∆a. These curves, Figure 15 and Figure 16, represent the most accurate resistance curves of the material. Thus, we determined the parameters of EPFM using the multi-specimen method. The results are shown in Table 12.
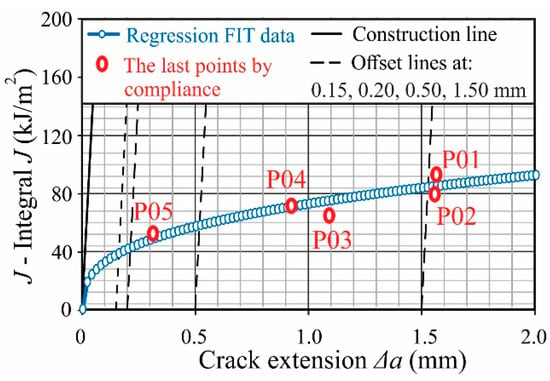
Figure 15.
J-∆a resistant curve by multi-specimen method.
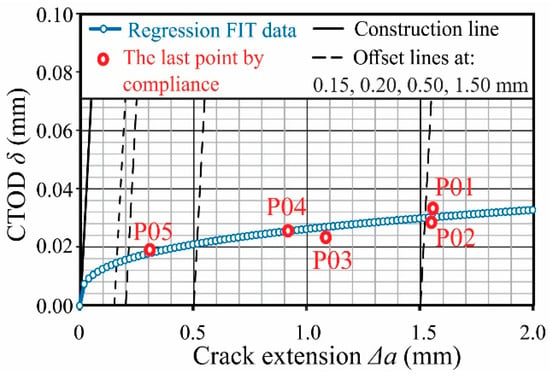
Figure 16.
δ-∆a resistant curve by multi-specimen method.

Table 12.
Results of multi-specimen method.
3.2.4. Determination of KIC According to the ASTM E399 Standard
Only the last specimen P05 was tested according to this standard by using obtained test experience by tested specimens P01–P04 with other methods. These data enable us to stop the test at the right moment, to not go too far to the plastic region that LEFM conditions are fulfilled. The conditional value PQ is determined by drawing the secant line OB, (see Figure 17) through the origin (point O) of the test record with a slope (P/V—blue line) equal to 0.95 (P/V—red line), where (P/V—blue line) is the slope of the tangent OA to the initial linear portion of the record. Then the value is 2.5 (KQ/σYS); where σYS is the 0.2% offset yield strength in tension Rp0.2.
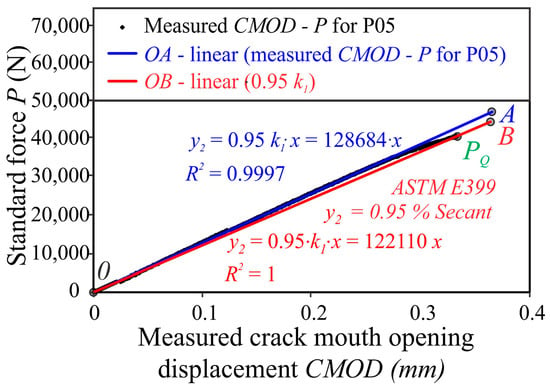
Figure 17.
Determination PQ for KIC evaluation according to ASTM E399 standard for P05 specimen.
The stress intensity factor was determined for specimen P05, which was the last tested specimen and meets all requirements (Equation (13)) according to the ASTM E399 standard. The validity of the KIC value determined by this test method depends upon establishing a sharp-crack condition at the tip of the fatigue crack in a specimen with an adequate size to ensure predominantly linear-elastic, plane–strain conditions. To establish the suitable crack-tip condition, the stress intensity factor level at which specimen fatigue pre-cracking is conducted is limited to a relatively low value. Results of specimen P05 fracture toughness are given in Table 13. For KIC evaluation, according to ASTM E399, stopping the experiment at the right moment is essential, especially when the material is ductile or quasi-brittle, like in our case. The reason is that the test does not go too long into a stable crack growth regime. For that purpose, test data on specimens P01–P04 were used and helped us to decide to stop the experiment at the right point to fulfil the requirements of the ASTM E399 standard.

Table 13.
Results of fracture toughness by ASTM E399 standard.
3.3. Crack Measurement and Fractography of the Fracture Surfaces
The crack measurements were needed for each specimen to evaluate KJIC or KIC at all SENB tests after they were broken with post-fatigue marking. According to standard ASTM E1820 and ASTM E399, the origin fatigue crack a0 and final physical crack size ap must be determined by the particular procedure for crack measurement. Each crack needed to be measured in nine pre-defined points. The averaged crack lengths are calculated according to Equations (16) and (17) [7], where side crack measurements contribute to just half the value of the average crack length.
The procedures of the origin crack measurement (red) and physical crack measurement (blue) are shown in Figure 18.
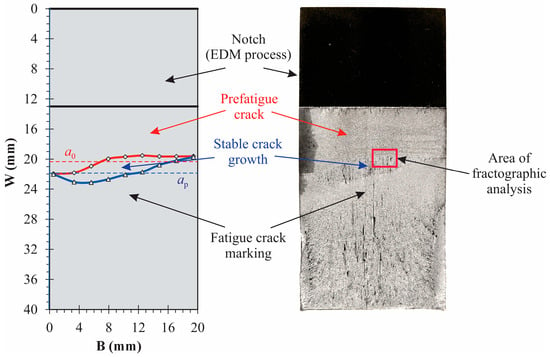
Figure 18.
Crack measurement procedures for specimen P02 specimen; (red) origin crack length a0, and (blue) physical crack length ap.
All images of the fracture surfaces from different specimens (P01–P05) were taken at different magnifications for extensive fractography analysis. Here is an example of specimen P02, which is shown in Figure 19 (the area of fractographic analysis is marked in Figure 18). Figure 19a shows the crack initiation area at the origin crack front where the brittle area (area of the brittle facets) becomes more extensive when the crack propagates in a deep direction. The pre-fatigued crack area (see mark 1 in Figure 19a,b) is shown on the upper side of the crack origin front. Further, during the test, blunting happens in this crack front (see mark 2 in Figure 19a,b). The crack initiation starts in mark 3 in Figure 19a, where brittle facets from crack initiation become wider when the crack propagates into a deeper area. This happens near the minor double-layer defects already existing in the material. In the other areas at the blunting front of the fracture surface, when the crack starts propagating, the fracture is predominantly ductile with many small ductile dimples (Figure 19b mark 3).
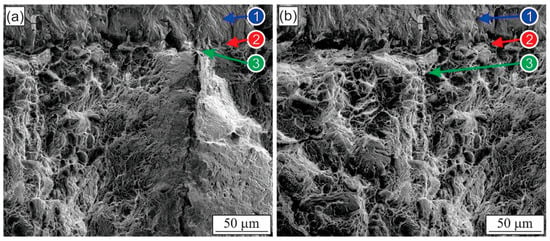
Figure 19.
Fracture surfaces of specimen P02; (a) crack initiation area, (b) ductile area at the beginning of the stable crack growth, (1) pre-fatigued crack area, (2) blunting area, and (3) stable crack area.
By analysing and measuring the dimples on the fracture surfaces, we can conclude what kind of fracture we are talking about. In the diagram presented in Figure 20, we see the dimples divided into bins (ranges) and presented according to the frequency of occurrence. Dimples are characteristic for ductile fracture, while shiny and granular surfaces are characteristic for brittle fracture. The predominance of small and shallow dimples (visible from the diagram) indicates a certain degree of ductility, but the matrix is no longer capable of significant plastic deformation before cracking and is close to transition into a brittle fracture.
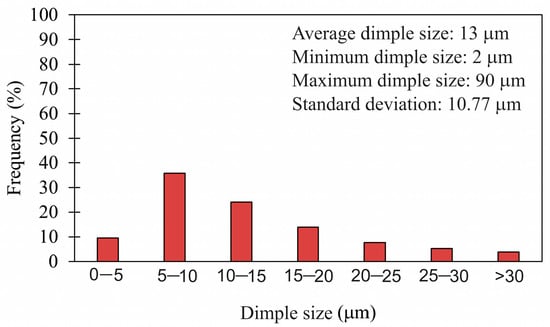
Figure 20.
Size distribution of dimples and frequency of occurrence.
4. Discussion
The aim of this article was to demonstrate different methods for determining fracture toughness. In doing so, we have used two standards to determine fracture toughness. The first standard, ASTM E1820, is used on more tough materials, while the second standard, ASTM E399, is used on more brittle materials, even in cases where there are limited locally brittle regions in the materials and limited small local instability—POP Ins occur during the test. ASTM E399 is used for the evaluation by LEFM, which means that the plastic zone at the crack tip must be small enough (ry < 0.02 a0). In that case, it can be neglected and not affect the determination of the fracture toughness of the KIC. However, before the result becomes a fracture toughness, in addition to a sufficiently large constraint, i.e., the plane deformation state at the crack front is needed. In that case, even a tough material can break brittle. Another condition that needs to be fulfilled is the geometric independence of the test piece on the test. This means that the dimensions must be big enough, particularly the remaining ligament b0, so that the crack propagation in the test is not affected by dimensions of the test piece that are too small (see Equation (13)). If these conditions are met, we have determined the fracture toughness of the KIC, which is a material property, otherwise the geometry of the test piece has affected the result and we have not been able to determine a minimum value for the material intensity factor, which in this case, is the fracture toughness. Problems that may arise are an oversized plastic area at the crack tip when performing the test, and in this case, it will be necessary to use EPFM as LEFM tools are insufficient. This problem tends to occur on more tough materials where it is necessary to use ASTM E1820 and the principles of EPFM; when used instead of KIC, it is possible to specify a critical J-Integral JIC or a critical δIC. One can even determine the KJIC via the J-integral or δ using the resulting material resistance curves. This allows us to determine the fracture toughness on even more ductile materials where ASTM E399 fails because it is impossible to make test specimens large enough to satisfy the conditions in Equation (13), i.e., the material has deformed too plastically during the test.
Several methods are available in the very comprehensive ASTM E1820 standard, and we have used most of them. The multi-specimen method is one of the most expensive and accurate methods for determining a material’s fracture toughness and resistance curve. This method uses the least number of assumptions, since one experiment is carried out for each point on the resistance curve, and the condition that the points are of different crack growth must be satisfied to construct a resistance curve from the resulting points. This requires several experiments to be carried out in which the initial and final crack lengths must be measured. This way, things are clear without unnecessary assumptions about how the crack progresses during the experiment.
Another possible method of determination is the single specimen method, where only one test specimen is used but certain assumptions must be made about how the crack propagates. The crack should propagate as evenly as possible along the crack front without the unnecessary so-called tunnel effect where the crack propagates faster in the centre than at the edge. The recommendations of the standard must be strictly followed to meet these conditions. Therefore, we want to have a crack front that is as straight as possible and that the crack propagates as uniformly as possible along the entire crack front.
In the case of normalization, we first determine the test, then perform the calculation without taking crack propagation into account at the start. In this case, the crack is first only a0 long, and we determine the KQ and J integral, then measure the crack ap, and take this into account at the endpoint of the experiment, where the larger crack and smaller remaining ligament b0 make the material more load bearing. This is followed by normalization, where we assume that the crack has propagated uniformly during the experiment from the point of blunting to the final length ap. This can be a significant obstacle in specific tests and may even lead to an overestimation or underestimation of KJIC. If all the conditions are met, the critical value of the stress intensity factor KJIC can be determined from the resistance curve. The problem can arise in heterogeneous materials where the crack does not propagate uniformly, for example, in different zones of the weld joint (HAZ/BM, HAZ/Weld metal, or in the weld metal itself when we have multi-pass welding).
The single specimen method is evaluated by compliance, partial unloading of the material during the test and re-loading as the crack length propagates. First, the unloading is carried out at a point Pm, which is determined before the experiment, and here, we have the initial slope of the unloading curve corresponding to the crack length a0. As the crack propagates, the unloading slope changes due to the smaller remaining ligament. This leads to a larger reduction of the remaining ligament. This continues throughout the crack propagation during the experiment. The final slope corresponds to the crack length ap measured after the marking and breaking of the specimen. This somehow calibrates the initial slope the initial crack length and the final slope and ap. Thus, the crack length is determined at each point of unloading. It is not necessary for the crack to propagate uniformly because from the slope at the unloading, we can determine the size of the crack, calculate the fracture mechanics parameters and obtain one point on the resistance curve for each unloading. In this case, the method can be applied to certain heterogeneous materials, but care must be taken to take the appropriate material properties where the crack tip is located. However, in some materials, there may be a problem of ensuring that the crack front is adequately straight, which is something to be very careful about.
We wanted to use these methods on the ultra-strength Protac 500 steel to see how this affects the determination of KIC or KJIC in a material that is ultra-strength and relatively brittle or quasi-brittle. Based on the test results of Protac 500 steel, Figure 21 and Figure 22 show the comparative J-∆a and δ-∆a resistance curves for all three methods: the compliance method (specimen P03), normalization method (specimen P03), and multi-specimen method (where the individual experiments of specimens P01–P05 are plotted). These points were used for the construction of a resistance curve for the multi-specimen method.
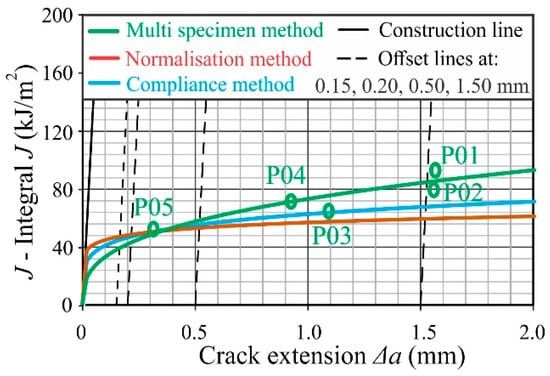
Figure 21.
J-∆a resistant curves for all methods.
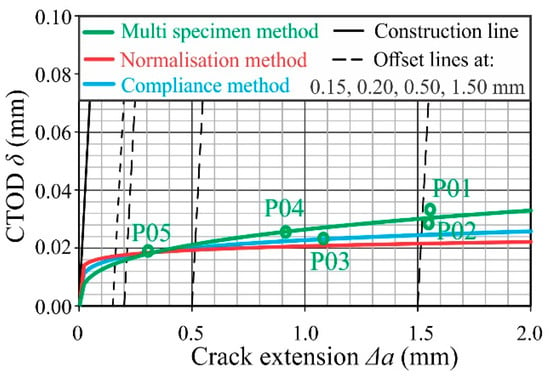
Figure 22.
δ-∆a resistant curve for all methods.
To determine the KJIC as accurately as possible, it is best to carry out the experiment we conducted with the P05 specimen using the ASTM E399 standard but to be able to stop the experiment at the right moment at a point that would meet all the criteria for the use of the LEFM. We went the other way and carried out this experiment at the end rather than blindly, and somehow, we already knew, assuming that it was similar to the CMOD, when to stop the experiment from the earlier tests for specimens P01–P04. We performed this and all the necessary conditions were met to determine the KIC, which was 105.87 MPa m1/2. Similar values were obtained for P03 (see Table 14) where the crack elongated by about 1.1 mm (see Figure 21 or Figure 22).

Table 14.
Results of KJIC and KIC for all methods.
Regarding the resistance curves, it can be seen that the normalization method is the most conservative and, therefore, the resistance curve is the lowest, especially at the end of the resistance curve. The compliance method, however, gives the highest value of the resistance curve but is the most conservative in determining the KJIC since the lowest KJIC value of 101.07 MPa m1/2 is found here (see Table 14). As a general rule, the KJIC determined by normalization is slightly higher or similar to that of the compliance method because of the shapes of the resistance curves.
The KJIC value obtained according to the multi-specimen method had a lower value (approximately 7% lower value than individual measurements according to the other two methods). The reason for this is a more precise interpolation through multiple points that represent the loads of individual specimens up to different levels of crack growth. This enables a more precise determination of the point when the crack starts to grow and reduces the possibility of taking a higher value of the J-Integral. Another reason is that the multi-specimen method avoids the effect of “plastic expansion”, i.e., the normalization and compliance methods can slightly overestimate the toughness because they include additional energy spent on general plastic deformations, not only on crack growth.
5. Conclusions
This work contributed to the evaluation of the integrity of the Protac 500 steel structure, i.e., its behaviour in the presence of a crack-type defect.
The test results and analysis of the results showed, without any doubt, that the elastic–plastic fracture mechanics parameters, J-integral and δ, were successful in its assessment.
The properties of the material are clearly seen through the fracture toughness values obtained. The highest measured value of KJIC obtained by normalization was for the specimen P02 KJIC = 123.72 MPa m1/2 and δJIC = 0.0230 mm, and the smallest measured value was for the specimen P03 KJIC = 107.73 MPa m1/2 and δJIC = 0.0172 mm. The same was for the specimen P02, tested by the compliance method, and had the highest value KJIC = 123.77 MPa m1/2 and δJIC = 0.0236 mm, and the smallest had P03 KJIC = 105.64 MPa m1/2 and δJIC = 0.0172 mm. The value of KJIC measured by testing with the multi-specimen method was KJIC = 101.07 MPa m1/2 and δJIC = 0.0161 mm. The differences are relatively small and do not have to have an impact on statically loaded constructions. However, given that in this case, it is a construction that is exposed to a variable load, the KIC value is very significant because the resistance to crack propagation depends on the KJIC value.
Through a comparative analysis of the results of the applied methods, all tests showed a sufficient degree of similarity, that is, no difference was obtained using the normalization method and the compliance method, while the difference was about 7% with the multi-specimen method. We can confirm the degree of similarity if we look at the average values of fracture toughness obtained by the method of normalization (KJIC = 114.30 MPa m1/2) and compliance (KJIC = 112.55 MPa m1/2), where the deviations are very low, and compare it with the result of the multi-specimen method and the result for sample P03 obtained according to the ASTM E399 standard. Also, KIC according to the ASTM E399 standard was obtained for specimen P05. An approximate value KIC = 105.87 MPa m1/2 was obtained for the result, as with the multi-specimen method.
The multi-specimen method is the most accurate method because it uses several specimens (but also the most expensive) with different crack extensions, and the interpolation of these points would give the most accurate resistance curve and the result of the fracture toughness of the material. When comparing methods that use one specimen, we prefer the compliance method, which is more accurate than the normalization method. The reason for this is because the normalization uses normalized data that represent the uniform progress of the crack from point to point. In the case of ductile materials, this is not a big problem because the crack propagates evenly, while in the case of brittle materials, the crack grows unevenly between two points. With the compliance method, each unloading represents the progress of crack growth (easy to measure over the slopes), but there is a problem with very brittle materials where they would not be able to define a sufficient number of points (insufficient number of unloading slopes) in the diagrams of the resistance curves and according to the standard, these results would not be valid. Due to all of these reasons, and the advantages and disadvantages of the methods, we decided to test all three methods according to the ASTM E1820 standard on the base material of armoured steel.
In further research, we will compare these three methods in the differently heat-treated material Protac 500 and on the newer anti-ballistic steel Protac 600. Our goal is to obtain the best possible results of the fracture toughness of the material used for military and special purposes.
Author Contributions
Conceptualization, T.V. and S.G.; methodology, M.M. and G.L.; validation, M.M. and T.V.; formal analysis, M.M., S.G. and G.L.; investigation, M.M.; resources, T.V.; data curation, M.M.; writing—original draft preparation, M.M.; writing—review and editing, G.L.; visualization, T.V.; supervision, T.V.; project administration, T.V. and S.G.; funding acquisition, T.V. All authors have read and agreed to the published version of the manuscript.
Funding
This research was funded by the Slovenian Research and Innovation Agency, Research Core Funding (No. P2-0120) and projects BI-BA/19-20-036, BI-ME/23-24-019 and BI-BA/24-25-041.
Institutional Review Board Statement
Not applicable.
Informed Consent Statement
Not applicable.
Data Availability Statement
The original contributions presented in this study are included in the article. Further inquiries can be directed to the corresponding author.
Conflicts of Interest
The authors declare no conflicts of interest. The research was conducted in the absence of any commercial or financial relationships that could be construed as potential conflicts of interest.
Nomenclatures
| EPFM | elastic–plastic fracture mechanics |
| BM | base material |
| HAZ | heat affected zone |
| WM | weld metal |
| LEFM | linear–elastic fracture mechanics |
| SENB | single edge notch bend specimen |
| CMOD | crack mouth opening displacement |
| KJIC | critical stress intensity factor at cleavage fracture |
| KIC | plane strain fracture toughness (critical stress intensity factor under plane strain condition) |
| KQ | conditional fracture toughness value |
| δ | crack tip opening displacement |
| JIC | critical J–integral required to initiate growth of a pre-existing crack under plane strain condition |
| Jel | value of the elastic J–integrals |
| Jpl | value of the plastic J–integrals |
| Apl | the area bounded by the P–CMOD curve and the line of relief |
| δel | elastic part of crack tip opening displacement |
| δpl | plastic part of crack tip opening displacement |
| vi | projectile speed |
| Rp0.2 | yield strength |
| Rm | ultimate tensile strength |
| σy | mean value of yield stress Rp0.2 |
| A5 | elongation to Failure |
| CVN | charpy V–notch |
| AC3 | the temperature at which the transformation of ferrite into austenite is complete |
| P | force obtained by testing |
| ∆ap | increasing crack length |
| a0 | origin crack size |
| ap | physical crack length |
| Pm | nominal limit force |
| PQ | load at which crack initiation is assumed to occur |
| B | thickness of specimen |
| W | specimen width |
| aN | notch length |
| N | notch width |
| bo | remaining ligament |
| z | the thickness of the support knives placed at the location of CMOD measurements |
References
- Perović, Z. Zavarene Konstrukcije, 1st ed.; Obod: Cetinje, Montenegro; Faculty of Mechanical Engineering of Podgorica, University of Montenegro: Podgorica, Montenegro, 2002; Volume 1, p. 451. [Google Scholar]
- Gao, H.; Wu, Y.F.; Li, C.Q. Performance of normalization method for steel with different strain hardening levels and effective yield strengths. Eng. Fract. Mech. 2019, 218, 106594. [Google Scholar] [CrossRef]
- Gerić, K. Prsline u Zavarenim Spojevima; University of Novi Sad: Novi Sad, Serbia, 2005. [Google Scholar]
- Anderson, T.L. SSC-345—Part 1: Elastic-Plastic Fracture Mechanics—A Critical Review; Ship Structure Committee: Washington, DC, USA, 1990; p. 145. [Google Scholar]
- Zu, Y.Z.; Cao, Y.G.; Zhen, Y.; Li, F.G.; Wu, G. Determination on the fracture toughness of the welded joints of X80 pipeline steels based on small punch test. Eng. Fract. Mech. 2023, 291, 109525. [Google Scholar] [CrossRef]
- Wang, H.W.; Jia, M.D.; Yang, X.Y.; Wang, Y.J.; Yu, R.C.; Wu, Z.M. Determination of fracture toughness of concrete based on actual critical crack length: Theoretical model and experimental validation. Eng. Fract. Mech. 2025, 318, 110966. [Google Scholar] [CrossRef]
- ASTM E1820-20ae1; Standard Test Method for Measurement of Fracture Toughness. ASTM: West Conshohocken, PA, USA, 2020.
- Zhu, X.-K. Determination of Constraint-Independent Crack Tip Opening Angle for Stable Crack Growth in High-Strength Ductile Steels. Materials 2025, 18, 1051. [Google Scholar] [CrossRef]
- Sedmak, A. Structural Integrity Assessment Using Fracture Mechanics. Integritet Vek Konstrukcija 2001, 1, 67–73. [Google Scholar]
- Li, Y.Z.; Omacht, D.; Yu, F.; Sun, M.C. A new spherical indentation approach to determine fracture toughness of high strength steels. Eng. Fract. Mech. 2022, 272, 108695. [Google Scholar] [CrossRef]
- Saxena, A.; Kumaraswamy, A.; Dwivedi, S.P.; Srivastava, A.K.; Maurya, N.K. Experimental and computational investigation on dynamic fracture toughness behavior of multi-pass SMA armor steel weldments. Theor. Appl. Fract. Mec. 2020, 106, 102502. [Google Scholar] [CrossRef]
- Trajkovski, J.; Kunc, R.; Pepel, V.; Prebil, I. Flow and fracture behavior of high-strength armor steel PROTAC 500. Mater. Des. 2015, 66, 37–45. [Google Scholar] [CrossRef]
- Gao, H.; Li, C.Q.; Wang, W.G.; Wang, Y.L.; Zhang, B.H. Factors affecting the agreement between unloading compliance method and normalization method. Eng. Fract. Mech. 2020, 235, 107146. [Google Scholar] [CrossRef]
- Gao, H.; Wang, W.G.; Wang, Y.L.; Zhang, B.H.; Li, C.Q. A modified normalization method for determining fracture toughness of steel. Fatigue Fract. Eng. Mater. Struct. 2021, 44, 568–583. [Google Scholar] [CrossRef]
- Dzugan, J.; Viehrig, H.W. Application of the normalization method for the determination of J–R curves. Mater. Sci. Eng. A 2004, 387, 307–311. [Google Scholar] [CrossRef]
- Zhu, X.K.; Joyce, J.A. J-resistance curve testing of HY80 steel using SE(B) specimens and normalization method. Eng. Fract. Mech. 2007, 74, 2263–2281. [Google Scholar] [CrossRef]
- de Menezes, J.T.O.; Ipiña, J.E.P.; Castrodeza, E.M. Normalization method for J-R curve determination using SENT specimens. Eng. Fract. Mech. 2018, 199, 658–671. [Google Scholar] [CrossRef]
- Cimpoeru, S.J. The Mechanical Metallurgy of Armour Steels; Land Division, Defence Science and Technology Group: Fishermans Bend, VIC, Australia, 2016; DST-Group Number TR-3305; AR number 016-722. [Google Scholar]
- Iqbal, M.A.; Senthil, K.; Sharma, P.; Gupta, N.K. An investigation of the constitutive behavior of Armox 500T steel and armor piercing incendiary projectile material. Int. J. Impact Eng. 2016, 96, 146–164. [Google Scholar] [CrossRef]
- Poplawski, A.; Kedzierski, P.; Morka, A. Identification of Armox 500T steel failure properties in the modeling of perforation problems. Mater. Des. 2020, 190, 108536. [Google Scholar] [CrossRef]
- Garasic, I.; Jurica, M.; Iljkic, D.; Barisic, A. Determination of Ballistic Properties on Armox 500t Steel Welded Joint. Eng. Rev. 2019, 39, 186–196. [Google Scholar] [CrossRef]
- Fras, T.; Roth, C.C.; Mohr, D. Fracture of high-strength armor steel under impact loading. Int. J. Impact Eng. 2018, 111, 147–164. [Google Scholar] [CrossRef]
- Fras, T.; Roth, C.C.; Mohr, D. Dynamic perforation of ultra-hard high-strength armor steel: Impact experiments and modeling. Int. J. Impact Eng. 2019, 131, 256–271. [Google Scholar] [CrossRef]
- Gooch, W.; Showalter, D.; Burkins, M.; Montgomery, J.; Squillacioti, R.; Nichols, A.; Martin, L.; Bailey, R.; Swiatek, G. Development and Ballistic Testing of a New Class of Auto-Tempered High Hard Steels under Military Specification Mil-Dtl-46100e. In Proceedings of the TMS 2009 138th Annual Meeting & Exhibition—Supplemental Proceedings: General Paper Selections, San Francisco, CA, USA, 15–19 February 2009; Volume 3, pp. 321–328. [Google Scholar]
- Lešnjak, M.; Kosec, B.; Karpe, B.; Janjić, G.; Gojić, M.; Bernetič, J.; Kosec, G. Thermal properties of armour steel protac 600. In Proceedings of the 15th International Conference on Accomplishments in Mechanical and Industrial Engineering (DEMI 21), Banja Luka, Bosnia and Herzegovina, 28–29 May 2021; pp. 363–367. [Google Scholar]
- Bernetič, J.; Kosec, G.; Ažman, S.; Marčetič, M.; Podlipec, B.; Kosec, B.; Nagode, A.; Kosec, L.; Goič, M.; Rimac, M.; et al. Protac 500—Armored steel of new generation. In Proceedings of the 10th Scientific-Research Symposium with International Participation Metallic and Nonmetallic Materials, Bugojno, Bosnia and Herzegovina, 24–25 April 2025; pp. 127–140. [Google Scholar]
- da Luz, F.S.; Lima, E.P.; Louro, L.H.L.; Monteiro, S.N. Ballistic Test of Multilayered Armor with Intermediate Epoxy Composite Reinforced with Jute Fabric. Mater. Res. 2015, 18, 170–177. [Google Scholar] [CrossRef]
- Laharnar, T. Balistično Preizkušanje Jekla PROTAC 500. Ph.D. Thesis, University of Maribor, Faculty of Mechanical Engineering, Maribor, Slovenia, 2016. [Google Scholar]
- EN ISO 6892-1; Metallic Materials—Tensile Testing—Part 1: Method of Test at Room Temperature. European Committee for Standardization: Brussels, Belgium, 2019; p. 87.
- EN ISO 6507-1; Metallic Materials—Vickers Hardness Test—Part 1: Test Method. European Committee for Standardization: Brussels, Belgium, 2023; p. 42.
- EN ISO 148-1; Metallic Materials—Charpy Pendulum Impact Test—Part 1: Test Method. European Committee for Standardization: Brussels, Belgium, 2016; p. 29.
- Barbosa, V.S.; Ruggieri, C. J-resistance curve testing of a pressure vessel steel and a clad pipe girth weld using clamped SE(T) specimens and the normalization method. Eng. Fract. Mech. 2021, 258, 108052. [Google Scholar] [CrossRef]
- Creel, J.A.; Stover, S.M.; Martin, R.B.; Fyhrie, D.R.; Hazelwood, S.J.; Gibeling, J.C. Compliance calibration for fracture testing of anisotropic biological materials. J. Mech. Behav. Biomed. 2009, 2, 571–578. [Google Scholar] [CrossRef] [PubMed][Green Version]
- Tang, J.K.; Liu, Z.; Shi, S.W.; Chen, X. Evaluation of fracture toughness in different regions of weld joints using unloading compliance and normalization method. Eng. Fract. Mech. 2018, 195, 1–12. [Google Scholar] [CrossRef]
- Biswal, S.; Singh, G. Determination of fracture toughness and traction-separation relation in Mode I/II of a natural quasi-brittle orthotropic composite using multi-specimen approach. Eng. Fract. Mech. 2023, 282, 109163. [Google Scholar] [CrossRef]
- Chen, X.; Serrano, M.; Hernández, R.; Lu, D.; Sokolov, M.A.; De Vicente, S.M.G.; Katoh, Y. Influence of fatigue precracking and specimen size on Master Curve fracture toughness measurements of EUROFER97 and F82H steels. Nucl. Mater. Energy 2023, 34, 101393. [Google Scholar] [CrossRef]
- Maweja, K.; Stumpf, W. Fracture and ballistic-induced phase transformation in tempered martensitic low-carbon armour steels. Mater. Sci. Eng. A 2006, 432, 158–169. [Google Scholar] [CrossRef]
- ASTM E399-22; Standard Test Method for Linear-Elastic Plane-Strain Fracture Toughness of Metallic Materials. ASTM: West Conshohocken, PA, USA, 2012; pp. 1–39.
- Nassar, A.; Fayyad, E. Linear and Non-Linear Stress Analysis for Prediction of Fracture Toughness for Brittle and Ductile Material using ASTM E399 and ASTM E1290 By ANSYS Program package. IOP Conf. Ser. Mater. Sci. Eng. 2019, 579, 012050. [Google Scholar] [CrossRef]
- Gietl, H.; Olbrich, S.; Riesch, J.; Holzner, G.; Höschen, T.; Coenen, J.W.; Neu, R. Estimation of the fracture toughness of tungsten fibre-reinforced tungsten composites. Eng. Fract. Mech. 2020, 232, 107011. [Google Scholar] [CrossRef]
- Kumar, S.M.; Pramod, R.; Kumar, M.E.S.; Govindaraju, H.K. Evaluation of Fracture Toughness and Mechanical Properties of Aluminum Alloy 7075, T6 with Nickel Coating. Procedia Eng. 2014, 97, 178–185. [Google Scholar] [CrossRef]
- Gludovatz, B.; Naleway, S.E.; Ritchie, R.O.; Kruzic, J.J. Size-dependent fracture toughness of bulk metallic glasses. Acta Mater. 2014, 70, 198–207, Erratum in Acta Mater. 2014, 80, 507. [Google Scholar] [CrossRef]
- Jafari, A.; Ma, L.Y.; Shahmansouri, A.A.; Dugnani, R. Quantitative fractography for brittle fracture via multilayer perceptron neural network. Eng. Fract. Mech. 2023, 291, 109545. [Google Scholar] [CrossRef]
- Möser, M. Fractography with the SEM (Failure Analysis) Materials Science. In Electron Microscopy in Solid State Physics; Bethge, H., Heydenreich, J., Eds.; Elsevier: Amsterdam, The Netherlands, 1987; pp. 366–385. [Google Scholar]
- Paun, M.-A.; Paun, V.-A.; Paun, V.-P. Fractal Analysis and Time Series Application in ZY-4 SEM Micro Fractographies Evaluation. Fractal Fract. 2022, 6, 458. [Google Scholar] [CrossRef]
- Lintner, A.; Pippan, R.; Schloffer, M.; Hohenwarter, A. Quasi-static and dynamic fracture toughness of a γ-TiAl alloy: Measurement techniques, fractography and interpretation. Eng. Fract. Mech. 2021, 258, 108081. [Google Scholar] [CrossRef]
Disclaimer/Publisher’s Note: The statements, opinions and data contained in all publications are solely those of the individual author(s) and contributor(s) and not of MDPI and/or the editor(s). MDPI and/or the editor(s) disclaim responsibility for any injury to people or property resulting from any ideas, methods, instructions or products referred to in the content. |
© 2025 by the authors. Licensee MDPI, Basel, Switzerland. This article is an open access article distributed under the terms and conditions of the Creative Commons Attribution (CC BY) license (https://creativecommons.org/licenses/by/4.0/).