Communication

Enhancing Fatigue Life of Metal Parts Produced by High-Speed Laser Powder Bed Fusion Through In Situ Surface Quality Improvement

1
Department of Mechanical Engineering, KU Leuven, 3001 Leuven, Belgium
2
Flanders Make@KU Leuven, 3001 Leuven, Belgium
*
Author to whom correspondence should be addressed.
J. Manuf. Mater. Process. 2025, 9(7), 207; https://doi.org/10.3390/jmmp9070207
Submission received: 16 May 2025 / Revised: 10 June 2025 / Accepted: 13 June 2025 / Published: 20 June 2025
(This article belongs to the Special Issue Progress and Perspectives in Metal Laser Additive Manufacturing)

Abstract

The poor surface quality of the metal parts produced by laser powder bed fusion limits their application in load-bearing components, as it promotes crack initiation under cyclic loadings. Consequently, improving part quality relies on time-consuming surface finishing. This work explores a dual-laser powder bed fusion strategy to simultaneously improve the productivity, surface quality, and fatigue life of parts with inclined up-facing surfaces made from a novel tool steel. This is achieved by combining building using a high layer thickness of 120 μm with in situ quality enhancement through powder removal and laser remelting. A bending fatigue campaign was conducted to assess the performance of such treated samples produced with different layer thicknesses (60 μm, hull-bulk 60/120 μm, 120 μm) compared to as-built and machined reference samples. Remelting consistently enhanced the fatigue life compared to the as-built reference samples by up to a factor of 36. The improvement was attributed to the reduced surface roughness, the reduced critical stress concentration factors, and the gradually changing surface features with increased lateral dimensions. This led to a beneficial load distribution and fewer potential crack initiation points. Finally, the remelting samples produced with a layer thickness of 120 μm enhanced the fatigue life by a factor of four and reduced the production time by 30% compared to the standard approach using a layer thickness of 60 μm.

Graphical Abstract

1. Introduction

Laser powder bed fusion (LPBF) is a widely recognized technique for the additive manufacturing (AM) of metal parts. The technique enables the production of parts with complex geometries by utilizing a laser to melt and consolidate the powder particles layer by layer. While the design flexibility in AM makes LPBF well suited for applications in the tooling [1] and medical sectors [2], among others, its adoption for load-bearing components remains limited. In this regard, the low as-built surface quality falls short compared to conventionally manufactured parts [3]. The typical surface irregularities of parts produced by LPBF include partially melted particles [4], ridges between the melt tracks due to inadequate hatch spacing [5], the balling of melt tracks [6], hatching patterns [7], the redeposition of ejected spatters [8], and elevated part edges [9]. These irregularities contribute to a high roughness, which largely varies with the building conditions and can typically fall within the range of 5–40 μm [10]. Controlling the surface quality is particularly challenging for the often complex-shaped AM parts, as the quality highly depends on the build orientation [11]. Specifically, the quality of up-facing inclined surfaces comprises a combination of different phenomena. Most prominently, the surface quality is affected by the staircase effect, which depends on the inclination angle and layer thickness. In addition, the presence of partially molten particles and elevated edges along the stair steps further degrades the surface quality [12]. As a result, the as-built roughness on inclined surfaces is often higher than on horizontal and vertical surfaces relative to the build plate [12,13].
It is well known that the poor surface quality of metal parts fabricated through LPBF can negatively impact their fatigue performance. Early fatigue failure is frequently associated with a high as-built roughness, surface defects, and notches [14,15].
These sites locally amplify the stress under loading, thereby increasing the risk of crack nucleation and initiation. Local stress concentration factors capture this by considering the surface valleys as notches that act as stress concentrators. This approach accounts for the notch morphology by extracting the depth-to-radius ratio for each valley and calculating the corresponding local stress values [16]. Cutolo et al. further extended this approach to compute the stress concentration factors at the critical notches that will most likely initiate fatigue failure [17]. Different studies have demonstrated the suitability of stress concentration factors as input for correlating the fatigue performance of additively manufactured metal parts [17,18].
Post-AM surface treatments are systematically applied to improve the surface quality and consequently the fatigue performance. While conventional methods such as milling, polishing, or grinding are commonly used, various alternative treatments are constantly being explored to accommodate the complex geometries of AM parts, as reviewed in [19]. Considering the considerable efforts associated with the surface finishing of intricate part geometries, improving the as-built surface quality would offer significant benefits.
In this respect, laser remelting is a promising technique to improve the surface quality directly during building. While laser remelting enables the quality of horizontal surfaces to be enhanced through the re-scanning of build layers [20], the treatment of inclined surfaces is less common as these are covered by loose powder particles. A recently introduced dual-laser powder bed fusion (DLPBF) strategy demonstrated the quality improvement of up-facing inclined surfaces using laser-induced shock waves for powder removal and subsequent laser remelting. Although these recent studies have demonstrated notable improvements in the three-point bending fatigue performance of such treated parts made from M300 and Ti64 [18] and an aluminium-based metal matrix composite [21], further research is required to explore the wider potential of this novel approach. Specifically, it remains unexplored whether this surface treatment can be effectively applied to enhance the fatigue performance of parts with up-facing inclined surfaces of variable initial surface roughnesses resulting from different building with different layer thicknesses. This is particularly relevant for recent promising approaches that utilize a high layer thickness to increase build rates but severely increase the roughness [22].
This work advances a DLPBF strategy towards the high-speed building of up-facing inclined metal parts with an enhanced fatigue life made from M789, a novel tool steel powder. In situ surface quality improvement through laser remelting was applied to parts produced with different building strategies, namely a standard strategy using a layer thickness (LT) of 60 μm (LT60), a high-productivity strategy using a high LT of 120 μm (LT120), and a hull-bulk strategy using an LT of 60/120 μm (HB60/120). A three-point bending fatigue campaign was conducted to evaluate the fatigue life of such treated samples in comparison to reference samples with as-built (AB), electrical discharge machined (EDM), and mechanically polished (P) surface conditions. A comprehensive analysis of the surface morphology is presented, quantifying the surface roughness, the critical stress concentration factors, and the lateral size of the dominant surface features. The strategy’s capability to simultaneously enhance productivity, surface quality, and fatigue life is demonstrated.

2. Materials and Methods

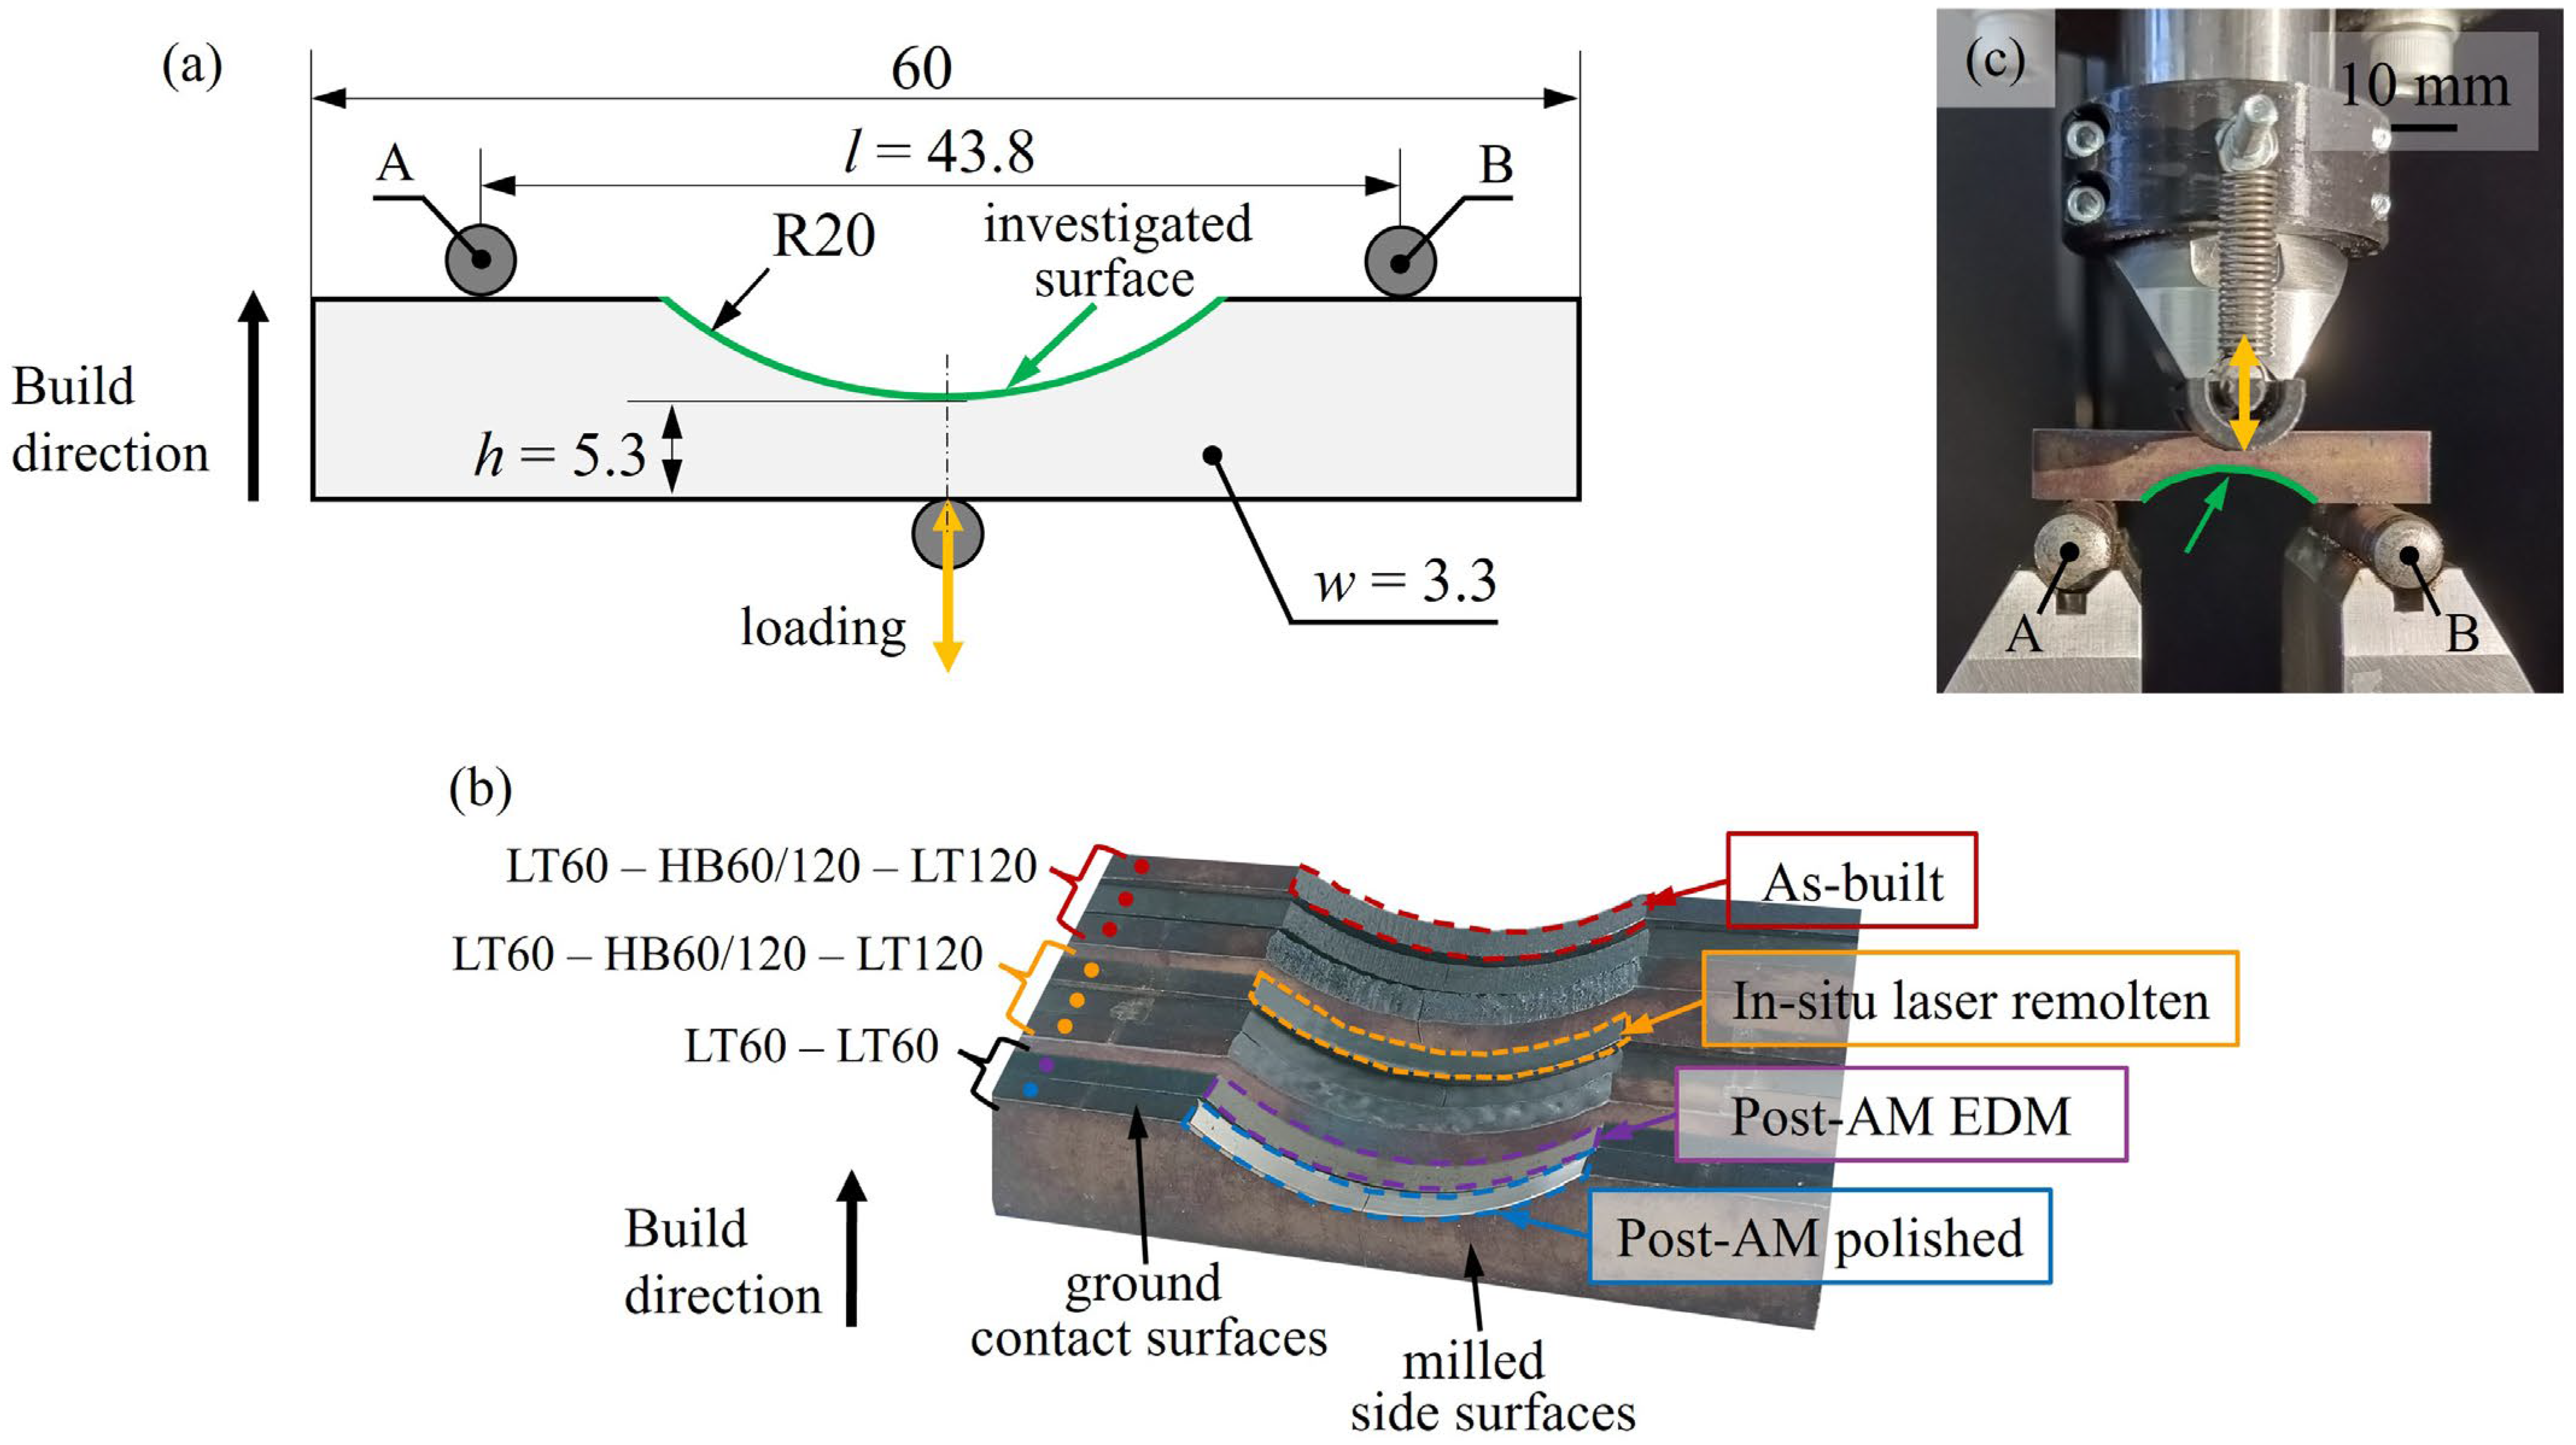
2.1. Sample Manufacturing

The samples were fabricated using an innovative DLPBF machine setup. The setup consisted of a commercially available ProX® DMP 320 machine (3DSystems, Leuven, Belgium) equipped with a continuous-wave laser with a nominal spot size of d1/e2 = 90 μm and a central wavelength of 1070 nm. The machine was further equipped with a nanosecond pulsed-wave laser with a nominal spot size of d1/e2 = 50 μm and a central wavelength comparable to the continuous-wave laser. The laser optics setup enabled sequential processing with either the continuous-wave or pulsed-wave laser. Slicing and hatching were performed using 3DXpert (Oqton, Bremen, Germany). The material selected was a novel tool steel powder, BÖHLER AMPO M789, from voestalpine Böhler Edelstahl GmbH & Co KG (Kapfenberg, Austria). The chemical composition is specified by the supplier in [23].
Figure 1a depicts the geometry that was used to fabricate the parts using three different layer thicknesses (LT): a standard LT of 60 μm (LT60), a high LT of 120 μm (LT120), and a hull-bulk LT of 60/120 μm (HB60/120. The LT60 samples were manufactured using the parameters recommended by 3D Systems [24]. To increase the productivity, the samples were manufactured by employing a recently proposed high-speed LPBF strategy using LT120 [22], which comes at the expense of reduced surface quality. Additional samples were manufactured through an HB60/120 strategy adapted from [22], aiming to restore the surface quality to the LT60 level by combining LT60 for the hull region of the samples and LT120 for the bulk. The hull thickness was set to 1000 µm, with an overlap of 150 µm between the hull and the bulk. In addition, 12 up-safety layers were used to reach a stable LT60 up-facing surface quality.
All samples underwent the same post-processing after LPBF. The vertical side surfaces were milled to focus the investigations on the curved surface (Figure 1b). The horizontal top and bottom surfaces that were in contact with the rollers were ground to ensure parallelism (Figure 1b,c). The samples underwent a heat treatment consisting of solution annealing at 1000 °C for 1 h followed by aging at 500 °C for 3 h in a nitrogen atmosphere. Consequently, in this study the term ‘as-built’ refers to the surface condition. This heat treatment yielded consistent hardness values across the investigated sample conditions of HLT60 = (51.7 ± 0.5) HRC, HLT120 = (51.5 ± 0.5) HRC, and HHB60/120 = (51.7 ± 1.2) HRC, each obtained from 10 measurements using the Wilson 4-JR equipment with a 150 kgf load. The hardness values are consistent with those available for solution-annealed and aged M789 material [24,25,26]. Average sample densities of ρLT60 = (99.73 ± 0.03)%, ρLT120 = (99.74 ± 0.03)%, and ρHB60/120 = (99.69 ± 0.03)% based on eight samples per condition were measured using the Archimedes principle with a theoretical density of 7.715 g/cm3.

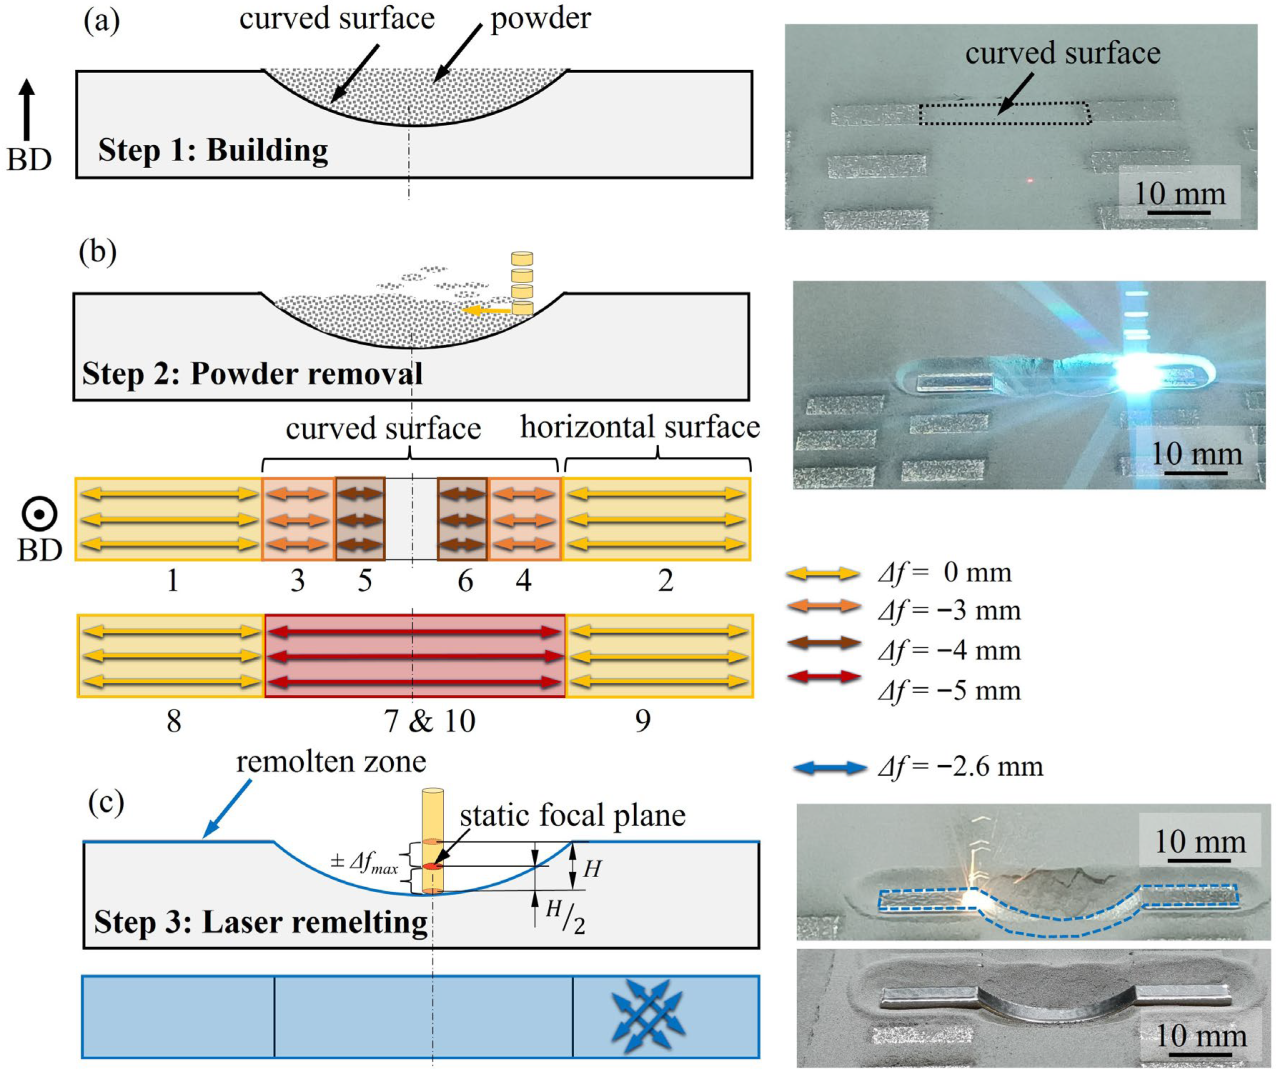
2.2. Dual-Laser Powder Bed Fusion Strategy

The proposed DLPBF strategy was specifically developed for the treatment of up-facing inclined surfaces. The DLPBF strategy was based on previous findings in [18], and in this study was further developed to enable the treatment of samples made from a novel tool steel, M789, with variable initial surface states resulting from building using different layer thicknesses. The strategy consisted of three steps, as illustrated in Figure 2. Firstly, the samples were built through LPBF (Figure 2a). Secondly, after completing the last layer, pulsed-laser-induced shock waves were used to remove the powder that was covering the up-facing curved surface (Figure 2b). The full scan sequence for the powder removal scan passes is illustrated in Figure 2b. The treatment happened in different sections with the focal plane manually adjusted by Δf (Figure 2b). This adjustment was necessary since treating an inclined surface with a static focal plane leads to constant laser defocusing along the surface slope, reducing the efficiency of the shock waves for powder removal [18]. Thirdly, laser remelting of the newly exposed up-facing surface was performed using four scan passes with the scan orientation indicated in Figure 2c. The processing parameters were selected based on previous research on the M789 material [27], using for powder removal an average laser power of 45 W, a scan speed of 500 mm/s, a hatch spacing of 40 μm, a pulse repetition rate of 100 kHz, and a pulse duration of 30 ns, and for remelting a laser power of 200 W, a scanning speed of 500 mm/s, and a hatch spacing of 80 μm.
To evaluate the effectiveness of the proposed DLPBF strategy, the fatigue performance of the laser remolten (LR) samples was compared to reference the samples in as-built (AB), electrical discharge machined (EDM), and mechanically polished (P) surface conditions. Both post-AM surface treatments were performed by the company Deceuninck (Hooglede-Gits, Belgium).

2.3. Surface Characterization

The surface quality was assessed through tactile profilometry with a Mitutoyo Formtracer CS-3200. It was evaluated on the up-facing curved surface based on 100 profiles spaced by 20 μm across an evaluation length of 10 mm, using a probe with a 2 µm tip radius. The primary profiles were filtered according to ISO 16610–21 [28], with short and long cut-off wavelengths of λs = 2.5 μm and λc = 2.5 mm, respectively.
The surface parameters [Ra, kt,crit, Ral, Rdq] were calculated based on the aforementioned tactile profiles. The arithmetic mean roughness Ra and root mean square gradient Rdq were calculated according to ISO 21920–2 [29]. The critical stress concentration factors kt,crit were evaluated according to the method described in [16]. This method treats the profiles a(x) as a function of cosine components using Equation (1), with Ai, λi = 1/fi, and ϕi being the ith cosine amplitude, wavelength, frequency, and phase, respectively. The profiles were filtered with a short wavelength cut-off filter of λs = 25 μm with a Gaussian filter according to ISO 16610-21 [28] before the corresponding stress concentration profiles kt(x) were calculated with Equation (2). The stress concentration factor at each valley’s location, defined as the local minimum in a(x), were extracted from kt(x). The critical notches were identified as those with a probability exceeding 95% in the generalized extreme value distribution according to [17].
a x = A 0 2 + i = 1 n A i cos ( 2 π x λ i + ϕ i )
k t x = 1 i = 1 n 4 π A i λ i cos ( 2 π x λ i + ϕ i )
The lateral dimensions of the dominant surface features were determined by the autocorrelation length Ral according to ISO 21920–2 [29], defined as the horizontal distance over which the autocorrelation function decays to 0.2 [30]. A smaller Ral indicates dominant fine features with rapid spatial variation, while a larger Ral denotes dominant coarser features with more gradual changes. The results presented in Table 1 for kt,crit and Ra represent mean values with corresponding standard deviations based on the samples included in the fatigue tests. The results reported for Ral and Rdq are based on five samples per condition.
The chamfer observed on the mechanically polished samples was characterized through tactile surface profile measurements. The chamfer height was defined as the maximum height difference between the part’s edge and the investigated surface within the middle section. The characterization was conducted using 10 tactile profiles spaced by 100 μm taken from the middle section.

2.4. Fatigue Testing

The three-point bending fatigue tests were performed on an Instron Electropuls E10000 machine equipped with a 10 kN dynamic load cell. The tests were performed with a stress ratio R of 0.1 and a frequency of 30 Hz. The samples were subjected to sinusoidal compression–compression loading, resulting in cyclic tensile stress on the surface under investigation (Figure 1a,c). The tests were performed at three stress levels until sample failure or run-out at Nf = 2 × 10⁶ load cycles without failure. The stress levels were chosen as a percentage of the materials’ yield strength, with σy,LT60 = 1758 MPa based on the testing of three round type 4 tensile specimens according to the ASTM E8 standard, with the values in agreement with [24], and σy,LT120 = 1737 MPa [22]. For the HB60/120 condition, the same stress levels were applied as those for the LT60 standard. The applied loads F required to achieve the maximum stress levels Smax were calculated using Equation (3), with the area moment of inertia I of a beam determined from Equation (4):
F = 8 · S m a x · I l · h
I = w · h 3 12
The bending span l was set at a constant of 43.8 mm. The sample dimensions (width w, height h) were measured at the critical cross-section. The fatigue data is presented with SN curves for the investigated sample conditions produced with a standard LT60 (AB, LR, P, EDM) and a high LT120 (LR, AB), based on a minimum of 10 and 8 samples for each condition, respectively. Additional fatigue data was collected for the samples produced through a hull-bulk strategy (HB60/120), with five samples tested for both the AB and LR conditions. The number of cycles to failure reported represent the arithmetic mean values and corresponding standard deviations for the samples tested at each respective stress level. The statistical significance of the differences in fatigue life between the sample conditions was assessed using p-values, with the reported improvements meeting a threshold of p < 0.05 (95% confidence level), and p < 0.32 (68% confidence level) for the polished samples.

3. Results

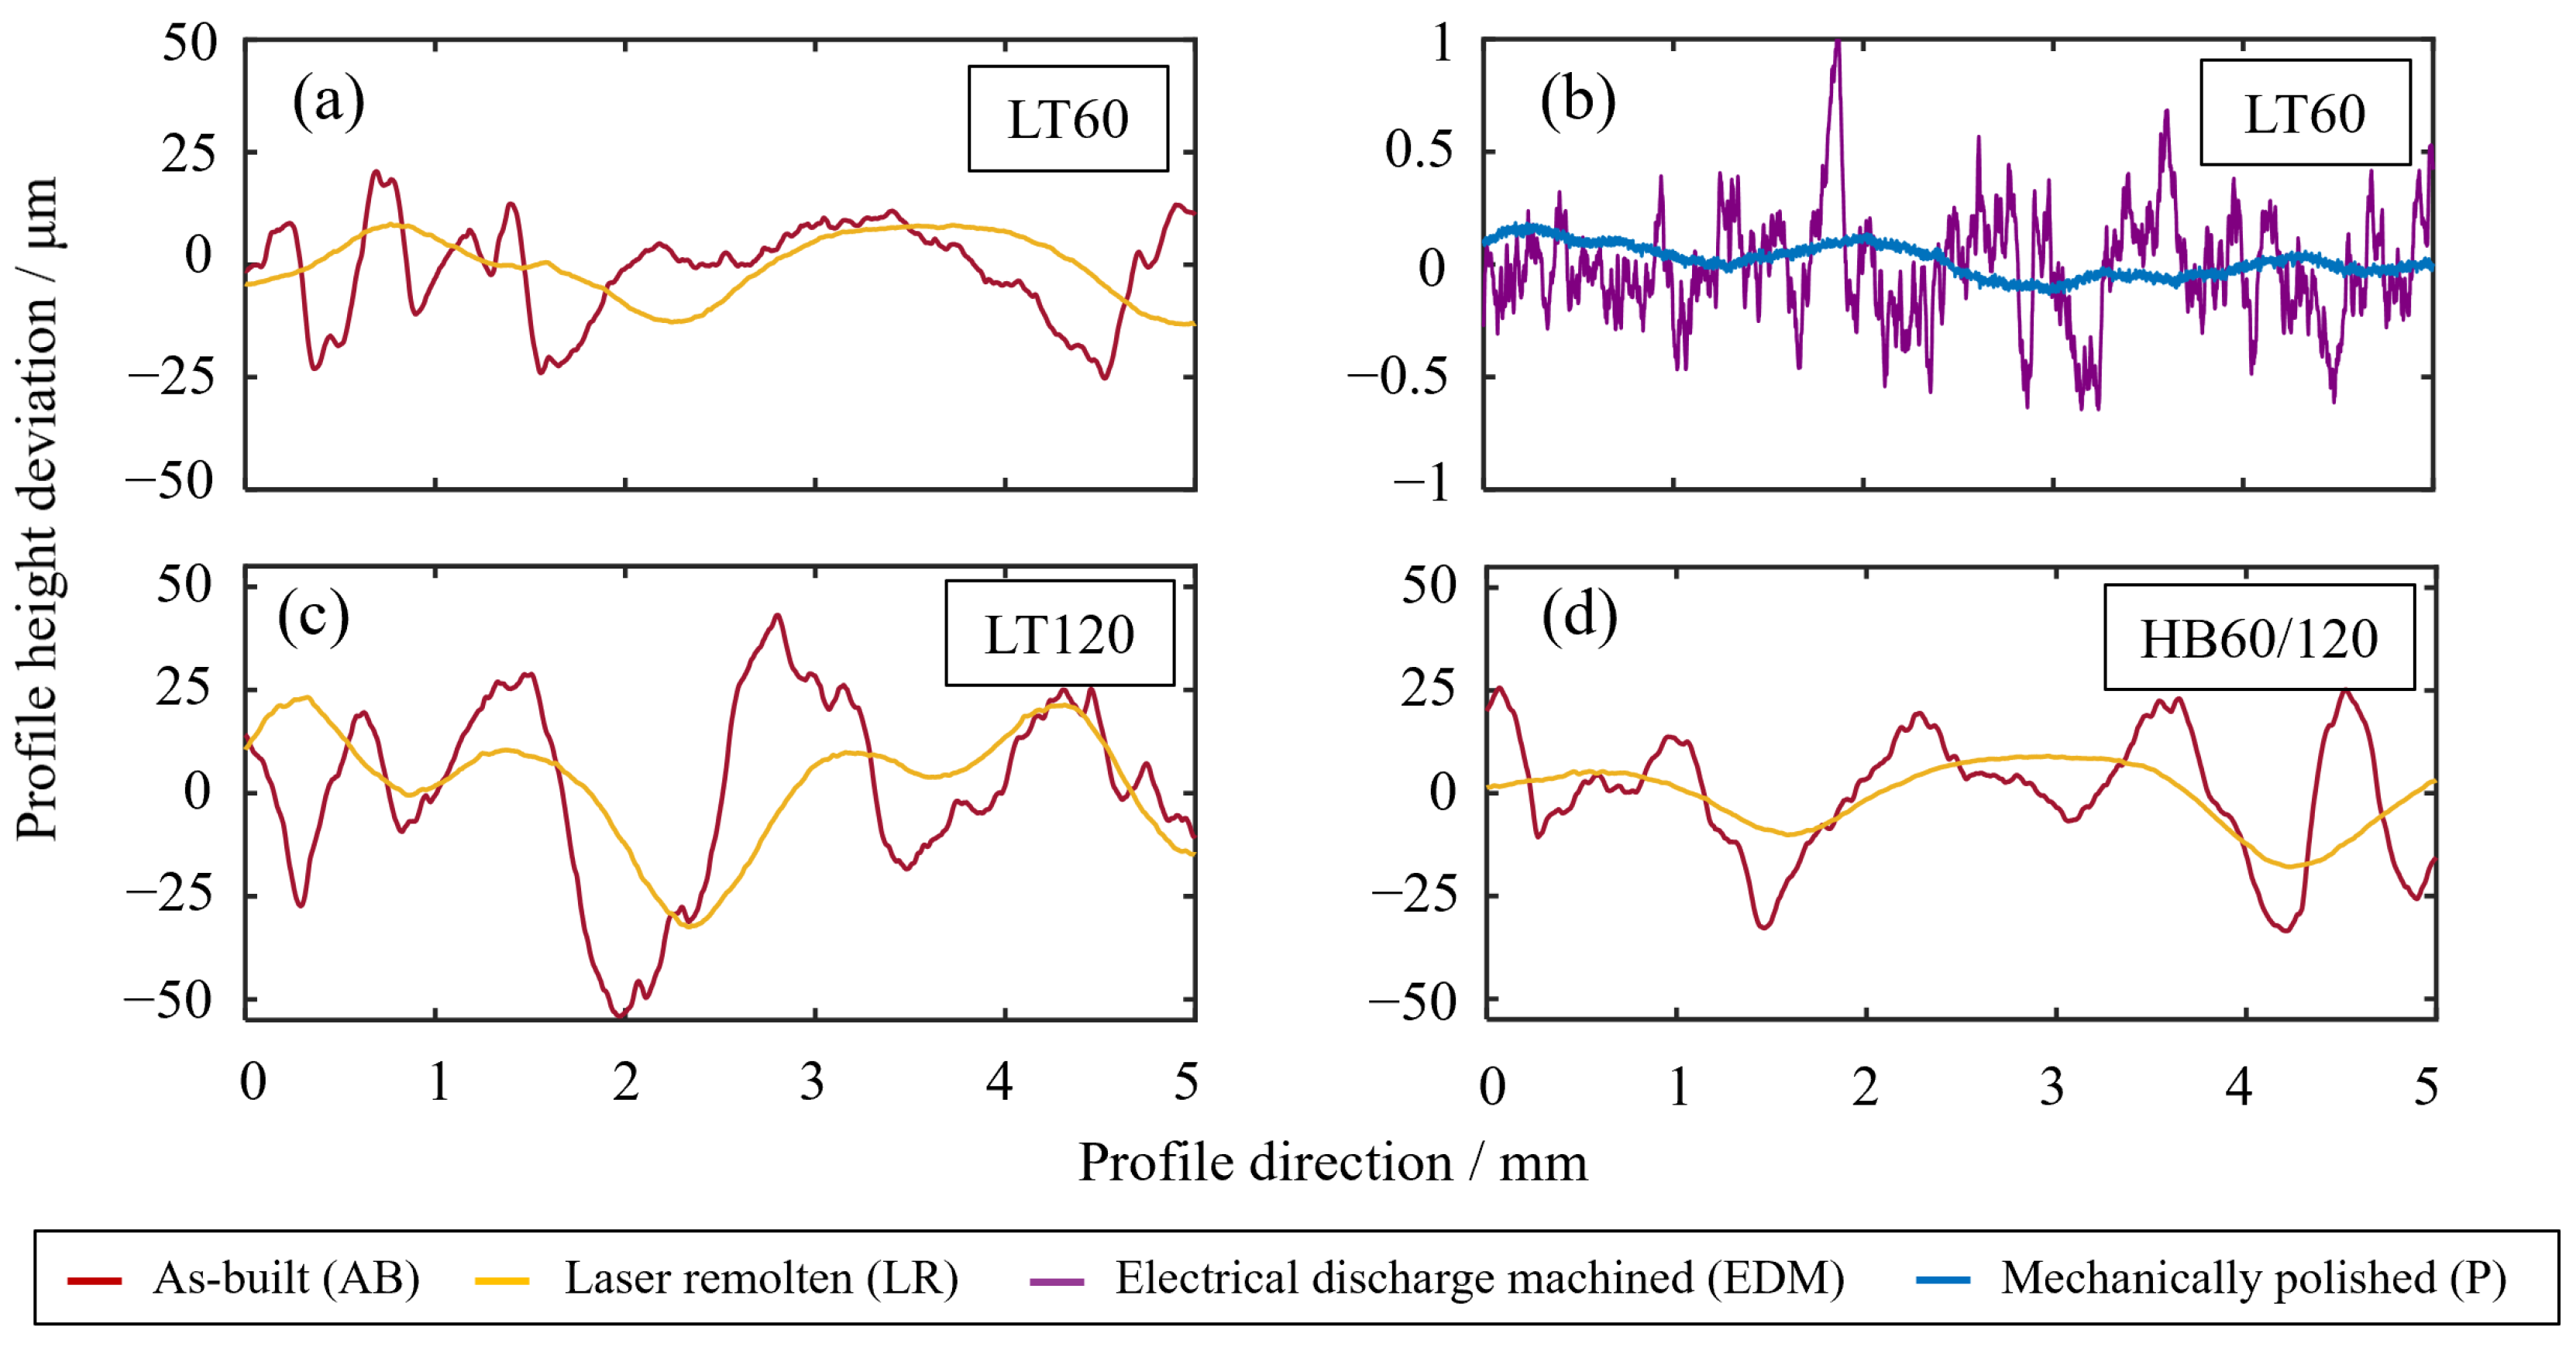
3.1. Surface Quality

Figure 3a–d present the surface profiles for the investigated sample, while Table 1 lists the calculated surface parameters and their corresponding standard deviations. The AB samples exhibited the highest surface roughness of Ra = 14.0 μm. LR reduced the roughness to Ra = 5.6 μm, which corresponds to a reduction of 60%. Mechanical polishing and electrical discharge machining achieved significantly lower roughness values of Ra = 0.2 μm and Ra = 0.7 μm, respectively.
The kt,crit trends observed for the investigated sample conditions were similar to those for Ra (Table 1); however, the differences between the investigated surface conditions were less pronounced. The AB and P reference samples displayed the highest and lowest values of kt,crit = 2.1 and kt,crit = 1.0, respectively. Notably, the LR samples exhibited a similar kt,crit = 1.2 to the EDM samples (kt,crit = 1.3), despite exhibiting a Ra value that was eight times higher. While the roughness parameter takes only the depth of the valleys into account, kt,crit considers the notch morphology, including both the valleys’ depth and radius. Laser remelting redistributes molten material from roughness peaks to valleys. The molten material partially fills the valleys, resulting in a smoothened surface morphology compared to the initial AB state, which is shown by a reduction of kt,crit by 40%.
The differences in the surface morphology among the investigated samples are evident from the tactile surface profiles displayed in Figure 3a–d. The reference EDM samples showed abruptly changing, spiky surface features (Figure 3b). A similar morphology was observed for the AB reference samples, but with higher amplitude and lower spatial frequency (Figure 3a). In contrast, the LR samples exhibited a gradually changing surface profile characterized by low spatial variation (Figure 3a). This is reflected by the autocorrelation length Ral, which quantifies the lateral size of the dominant surface features. The feature size increased for EDM, AB, and LR, with corresponding Ral values of 45 μm, 128 μm, 470 μm (Table 1). For the P samples, the significantly larger autocorrelation length of 1182 μm suggests the absence of dominant surface features. These observations were further supported by the root mean square gradient parameter Rdq, which showed an increasing local surface slope across the surface conditions, following the sequence P, LR, EDM, and AB samples (see Table 1).
Figure 3c,d and Table 1 further display the surface morphology for the samples produced with a high layer thickness of LT120 and a hull-bulk strategy of HB60/120. The AB samples produced by the LT120 strategy exhibited the highest observed Ra = 26 μm and kt,crit = 2.4, representing an increase of 84% and 11% compared to the standard LT60 approach. This aligns with previous work that demonstrated significant improvements in productivity with this LT120 strategy, albeit at the expense of the surface quality [22]. The AB samples produced using the HB60/120 strategy exhibited Ra = 16 μm and kt,crit = 2.3, which widely restored the surface quality to LT60 level. Laser remelting improved the surface quality for both sample conditions, shown by the reduction of Ra and kt,crit by 28% and 33% (LT120) and 59% and 41% (HB60/120). Moreover, Table 1 presents the Ral and Rdq values for the investigated conditions, reinforcing the previous observation that laser remelting consistently resulted in a smoothened surface morphology displayed by an increased feature size (Ral) and reduced local surface slope (Rdq) compared to the AB reference samples.

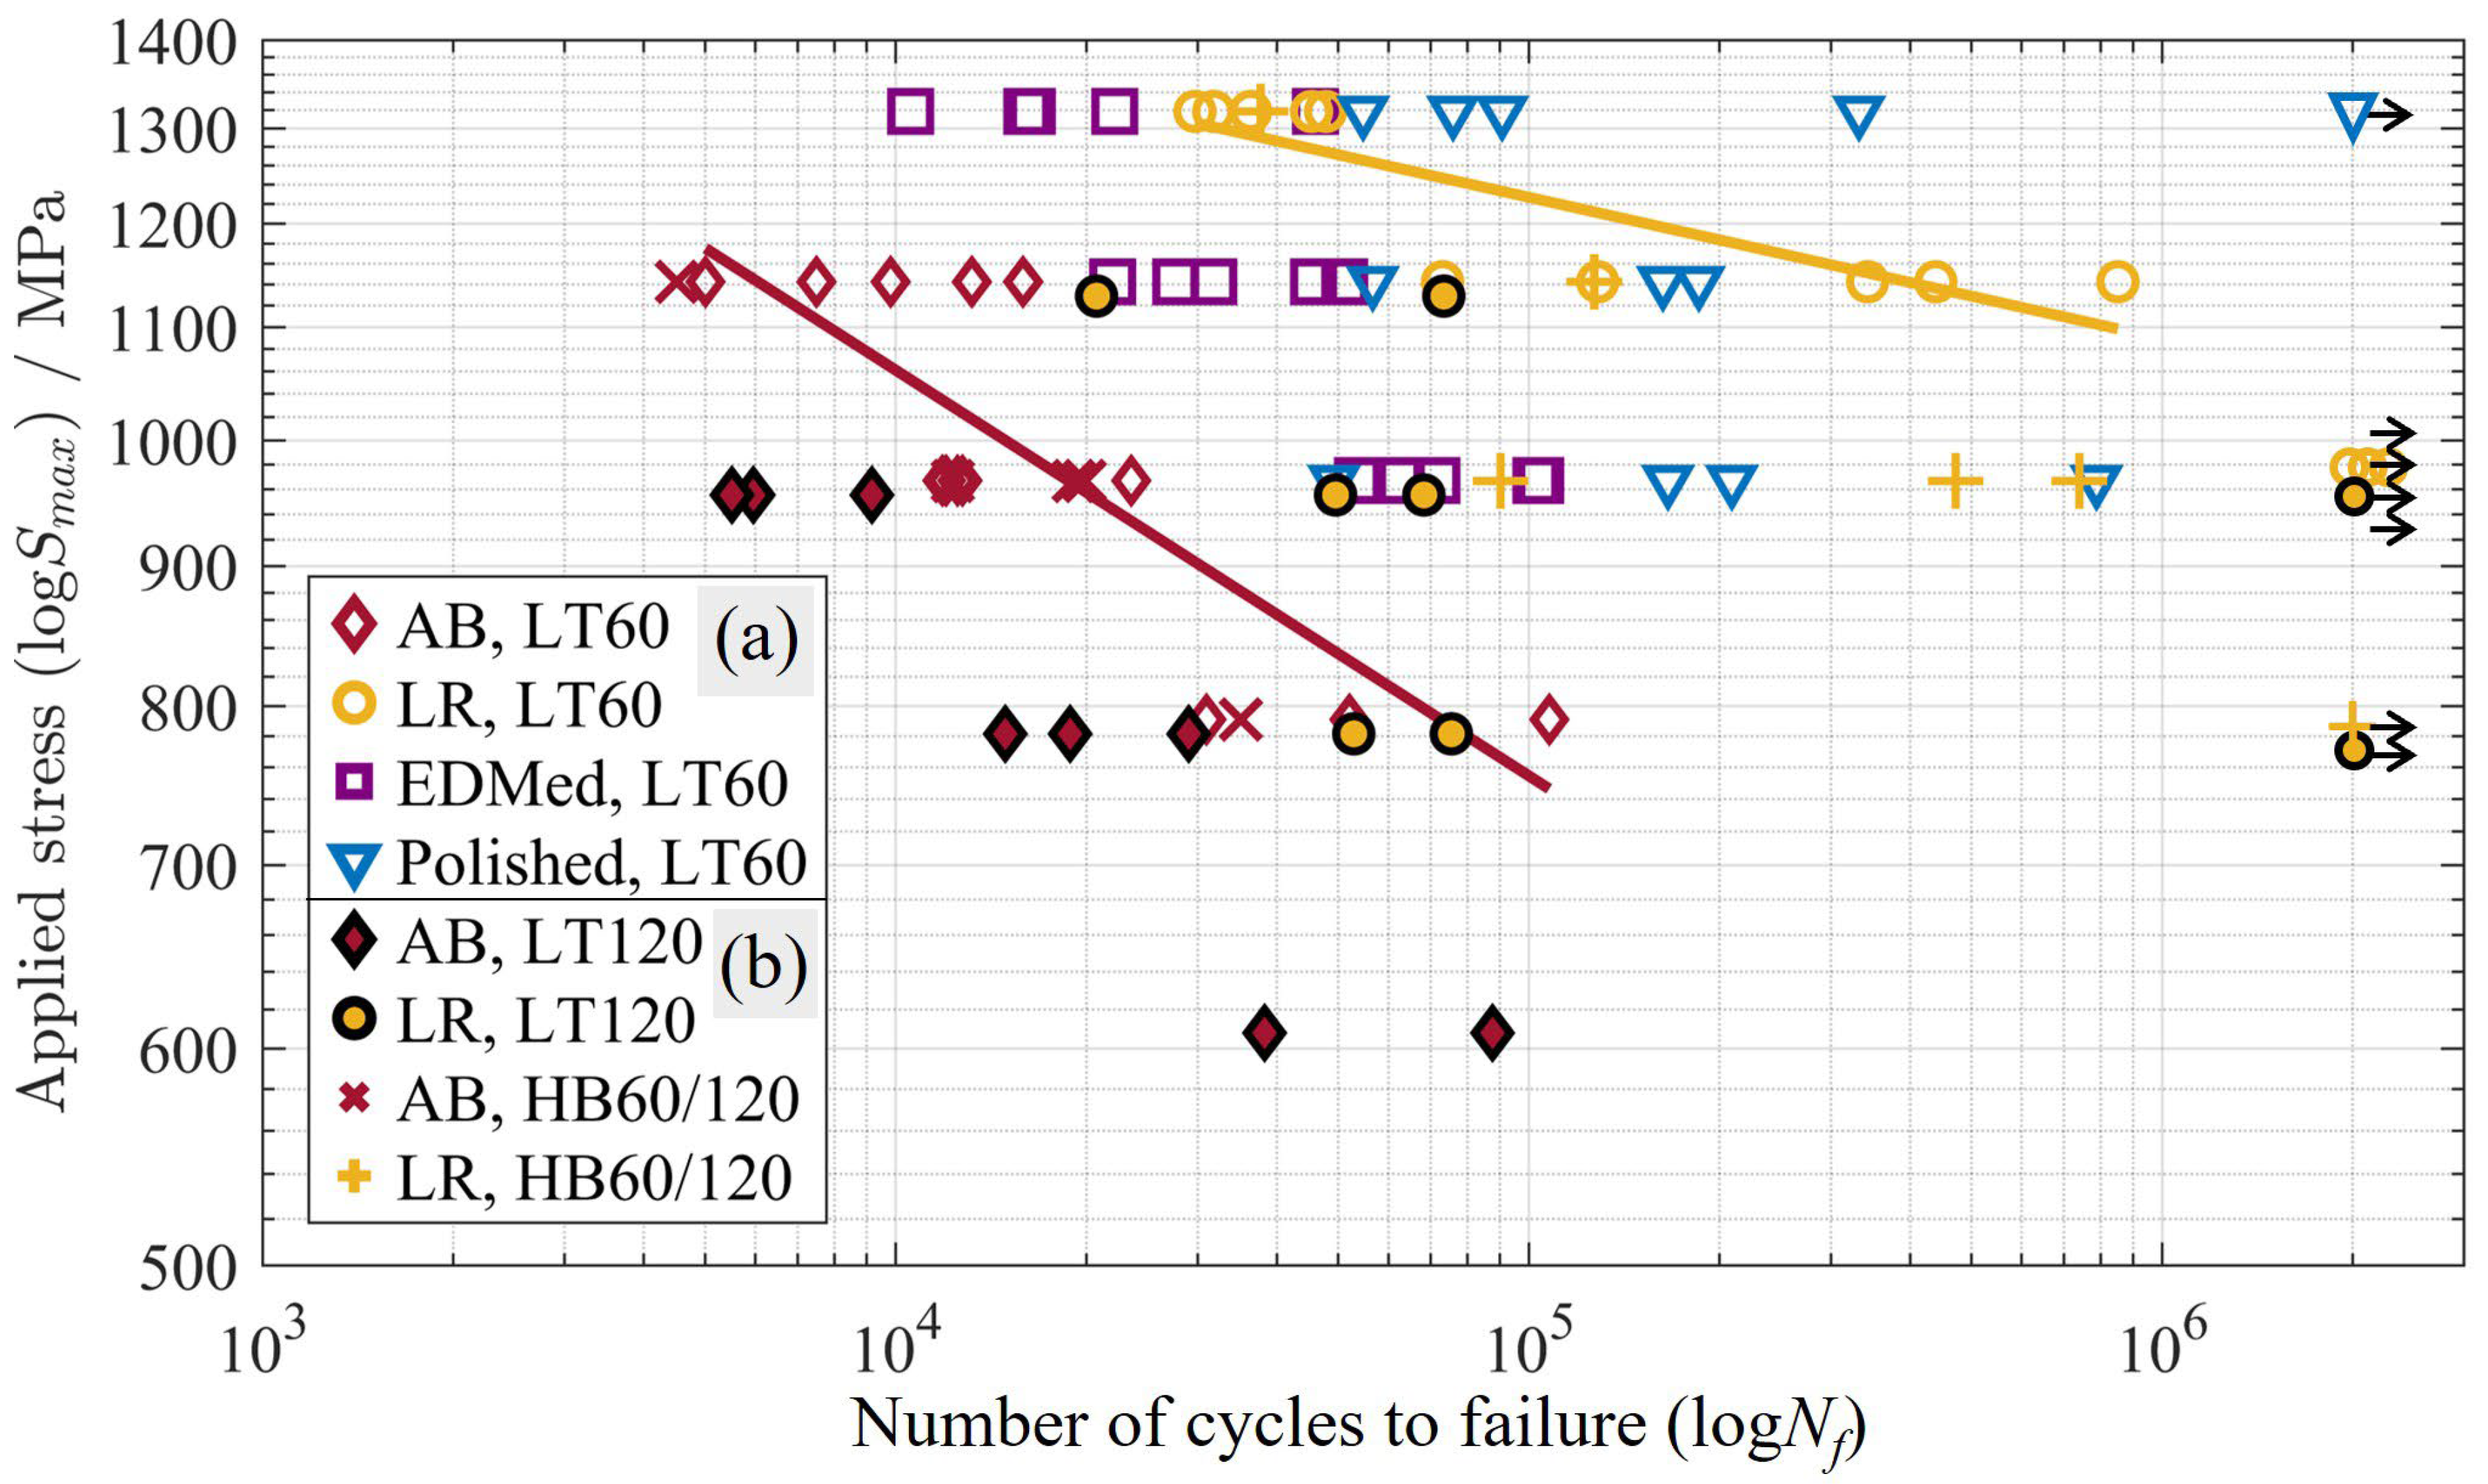
3.2. Fatigue Performance

Figure 4a presents the three-point bending fatigue test results for the investigated sample conditions produced with a standard layer thickness (LT) of 60 μm. The LR samples showed the best performance at the comparably low and intermediate stress levels of 967 MPa and 1143 MPa, followed by the P, EDM, and AB samples. At the highest stress level of 1317 MPa, the P samples exhibited an improved performance over the LR samples.
The AB samples exhibited the poorest fatigue performance across the investigated stress levels. They failed consistently below Nf < 100 × 103 load cycles at Nf = (64 ± 4) × 103 (at 791 MPa), Nf = (15 ± 5) × 103 (at 967 MPa), and Nf = (10 ± 4) × 103 (at 1143 MPa). In comparison, the LR samples recorded consistent run-outs without failure after Nf = 2·106 load cycles at an applied stress level of 967 MPa. Moreover, the LR samples only failed after Nf = (367 ± 310) × 103 load cycles at a stress level of 1143 MPa, corresponding to a fatigue life improvement compared to the AB reference by a factor of 36.
The EDM reference samples showed a consistent fatigue performance, failing at the stress levels of 967 MPa, 1143 MPa, and 1317 MPa at Nf = (79 ± 23) × 103, Nf = (36 ± 12) × 103, and Nf = (22 ± 14) × 103 load cycles, respectively. In comparison, the LR samples outperformed the EDM reference sample across the respective stress levels, showing an improvement in fatigue life by up to a factor of 10.
Despite the large scatter in the data from the P reference samples, they demonstrated a notably increased fatigue life compared to the AB and EDM reference samples across all stress levels. Furthermore, the P reference samples exhibited an enhanced fatigue life compared to the LR samples at the high stress level of 1317 MPa by almost a factor of four. In contrast, the LR samples showed an enhanced fatigue life at the stress levels of 967 MPa and 1143 MPa. At corresponding stress levels, the LR samples were consistently run-out without failure at Nf = 2 × 10⁶ load cycles, exhibiting a fatigue life that was improved by a factor of three.
Figure 4b further presents the fatigue performance of the samples produced with a high layer thickness of 120 μm (LT120) and a hull-bulk strategy of 60/120 μm (HB60/120). The LR samples demonstrated the dominant performance, with the HB60/120 outperforming LT120, followed by their respective AB reference samples.
The laser remelting of the samples produced with a high layer thickness of LT120 consistently achieved an enhanced fatigue life compared to the AB references. While the AB reference samples made from LT120 showed early failure with Nf = (7 ± 2) × 103 at a stress level of 955 MPa, one LR sample ran out at Nf = 2 × 10⁶ load cycles and other samples failed at Nf = 50 × 103 and Nf = 68 × 103 load cycles. Hence, this corresponded to an improvement in fatigue life by a factor of eight. Similarly, the reference AB samples produced through the HB60/120 strategy failed consistently after Nf = (17 ± 4) × 103, whereas their LR sample counterparts failed at Nf = (434 ± 267) × 103, representing an improvement in fatigue life by a factor of 25. Furthermore, the significant performance increase achieved through the remelting of the LT120 and HB60/120 samples is well demonstrated by their ability to compete with the reference samples produced using the LT60 approach. In fact, they exhibited a similar or improved fatigue life compared to the reference EDM samples and outperformed the AB LT60 reference. Specifically, the laser remelting samples that were built using LT120 had a fatigue life enhancement compared to the AB LT60 reference by up to a factor of four.

4. Discussion

The proposed DLPBF strategy enables significant improvements in fatigue life compared to the investigated reference samples. It is evident that the clear reduction in surface roughness Ra compared to the as-built AB reference by up to 60% contributes to the increase in performance. However, the Ra parameter does not sufficiently explain the increased performance compared to the reference samples that underwent surface finishing as they have a roughness that is smaller by several orders of magnitude. Similarly, it does not explain the improved performance in comparison to the specific AB sample conditions that exhibit a similar roughness. Given the similar sample quality, as evidenced by the consistent values for density, hardness, and yield strength across the investigated sample conditions, this strongly suggests that differences in the surface morphology are responsible for the observed fatigue performance.
The critical stress concentration factor kt,crit considers the morphology of surface valleys through the ratio of depth-to-radius. Surface valleys act as micro-notches that locally increase the stress and hence the risk of crack initiation from this site. Consequently, a deep and steep valley morphology corresponds to a high kt,crit value, whereas a shallow and gradual morphology corresponds to a low kt,crit value. The LR samples displayed a slightly lower kt,crit value compared to the reference EDM samples, despite exhibiting an Ra value larger than a factor of eight. This is in line with the surface profiles depicted in Figure 3, illustrating a smoothened, gradually changing surface morphology for the LR samples (Figure 3a). In contrast, the EDM sample exhibited numerous abruptly changing surface features that are likely to act as stress concentrators under loading (Figure 3b). Examining this further, the lateral size of the dominant surface features was quantified using the autocorrelation length Ral (Table 1). The LR exhibited wider surface features compared to the EDM samples, which displayed a dominant feature width of Ral = 45 μm and Ral = 474 μm, respectively. In addition, the EDM samples exhibited steeper local surface slopes by 58%, quantified by Rdq (Table 1). Hence, the EDM samples were densely packed with abruptly changing surface features, corresponding to a surface feature density that was increased by almost a factor of 11. This is linked to a higher number of potential crack initiation points and an unfavorable load distribution, both of which raise the likelihood of early failure.
Despite the large scatter observed for the data from the polished reference samples, it is evident that they display a significantly increased fatigue life at the highest stress level compared to the LR samples, whereas the LR samples are superior at the lowest stress level. The scatter is likely attributed to the presence of a chamfer located at the vertical side surface of the investigated curved surface, underscoring the challenges associated with the post-AM surface finishing of complex geometries. The manual polishing operation resulted in a maximum height reduction of 155 μm to 590 μm for the smallest and largest observed chamfers, respectively, captured by tactile profile measurements. Consequently, the reduced cross-section led to a local stress increase at the chamfers of approximately 6% and 27%, respectively, which likely reduced the fatigue life and increased the scatter. Moreover, following previous explanations, it is hypothesized that the gradually changing surface morphology of the LR samples is beneficial compared to abruptly changing fine features observed on the P surfaces (Figure 3a,b). This is supported by a kt,crit value that approaches that of the P reference samples, despite having a greater roughness by a factor of 28.
In an effort to simultaneously improve productivity, surface quality, and fatigue performance, LR was applied to samples that were built with a high layer thickness of 120 μm and a hull-bulk strategy of 60/120 μm, respectively. As displayed in Figure 4b, such treated samples demonstrated a significantly improved performance compared to the investigated AB reference samples, including those made from the standard LT60 approach. Furthermore, the LR samples displayed a similar or significantly enhanced performance compared to the EDM reference samples. Given that the LR samples made from LT120 had an Ra about 27 times higher than that of the EDM reference samples, the performance is likely attributed to the gradually changing surface morphology, as displayed in Figure 3c, in contrast to the abruptly changing surface features (Figure 3b). This is supported by the LR samples made from LT120 having a comparable kt,crit value and a reduced density of dominant surface features by a factor of 10 according to Ral (Table 1) compared to the EDM reference samples. Similar explanations apply to the performance improvement for the LR HB60/120 samples.
The production time for the proposed DLPBF strategy includes the build time through LPBF and additional time for the surface treatment. It is worth nothing that the production time depends on the number of samples to be treated, their size, and their design. In this case, the build time for a job including 16 samples using the standard LT60 approach was 170 min, compared to 94 min with the LT120 strategy. This corresponds to a reduction in build time by 81%. The surface treatment per sample required up to ~130 s for powder removal, ~30 s for remelting, and ~120 s for manually adjusting the focal plane. For the LT120 job, where eight samples were laser remolten, the resulting production time was 131 min. Hence, despite the additional surface treatment, this represents a 30% shorter production time compared to the standard LT60 approach. Simultaneously, the LR samples produced using LT120 exhibited an enhanced fatigue life compared to the AB LT60 samples by up to a factor of four. Moreover, as the DLPBF treatment happens directly in the AM machine, it has the potential to avoid or limit the need for post-AM surface finishing along with the associated costs and time. Despite its advantages, it is important to point out that this scanning strategy involves several manual operations to adjust the focal plane to avoid efficiency losses (see Figure 2), making it impractical for treating larger components. These limitations were recently addressed, enabling the fully automated treatment of large and complex-shaped components directly during building [27].

5. Conclusions

This work further developed a dual-laser powder bed fusion strategy that demonstrated simultaneous improvements in the productivity, surface quality, and fatigue life of parts with up-facing inclined surfaces made from M789—a novel tool steel powder. The proposed strategy combines building using a high layer thickness of 120 μm and subsequent in situ surface quality improvement. This is achieved through the selective removal of the powder covering the inclined surfaces via laser-induced shock waves and subsequent laser remelting. The main findings are as follows:
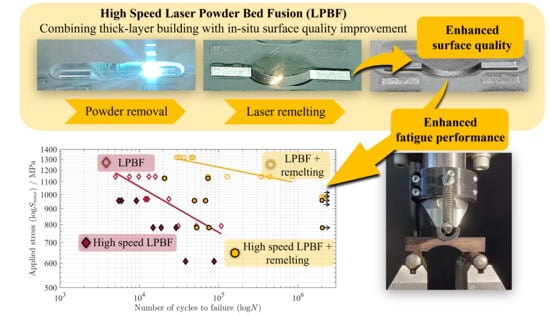
  • Laser remelting demonstrated significant improvements in surface quality and hence fatigue life when applied to samples with variable initial surface states resulting from building strategies using different layer thicknesses. The fatigue life was consistently improved across the investigated as-built conditions, reaching a performance increase of up to a factor of 36.
  • This significant improvement in fatigue life compared to the as-built reference samples was attributed to a smoothened surface morphology after remelting, shown by a reduction in surface roughness Ra and critical stress concentration factor kt,crit by up to 60% and 40%. Moreover, the smoothened surface morphology exhibited gradually changing features that were wider by up to a factor of four, as displayed by the autocorrelation length Ral, compared to the abrupt and rapidly changing surface features observed for the as-built reference samples.
  • Laser remelting enabled notable improvements in fatigue life compared to the electrical discharge machined reference samples by up to a factor of 10, despite having a roughness 8 times greater. This was similarly quantified by the smoothened surface morphology of the laser remolten samples. Moreover, the laser remolten samples demonstrated an enhanced fatigue life compared to that of the mechanically polished reference samples at relatively low and intermediate stress levels, whereas the mechanically polished samples dominated at higher stress levels.
  • In an attempt to combine increased productivity, surface quality, and, hence, fatigue performance, laser remelting was applied to samples fabricated using a high layer thickness of 120 μm. While this approach significantly reduced the build time compared to the standard strategy using a layer thickness of 60 μm, it also considerably deteriorated the as-built surface quality. The laser remelting samples produced using a high layer thickness of 120 μm demonstrated an improvement in fatigue life compared to the as-built reference samples produced using the standard layer thickness of 60 μm by up to a factor of four, while simultaneously reducing the production time by 30%.

Author Contributions

D.O.: methodology, conceptualization, investigation, and writing—original draft; M.S.: conceptualization and writing—review & editing; T.M.: writing—review & editing; H.H.: writing—review & editing; B.V.H.: supervision and writing—review & editing. All authors have read and agreed to the published version of the manuscript.

Funding

This research was funded by VLAIO/SIM/ICON HBC.2020.2958 MetaMould and FWO/SB 1SB2324N.

Data Availability Statement

The raw data supporting the conclusions of this article will be made available by the authors on request.

Acknowledgments

The authors express their gratitude to Deceuninck for their support in conducting the surface machining of the samples.

Conflicts of Interest

The authors declare no conflicts of interest. The funders had no role in the design of the study; in the collection, analyses, or interpretation of data; in the writing of the manuscript; or in the decision to publish the results.

Abbreviations

The following abbreviations are used in this manuscript:
ABAs-built
BDBuild direction
HBHull-bulk
LPBFLaser powder bed fusion
LRLaser remolten
LTLayer thickness
DLPBFDual-laser powder bed fusion
EDMElectrical discharge machined
PMechanically polished

References

  1. Asnafi, N. Application of Laser-Based Powder Bed Fusion for Direct Metal Tooling. Metals 2021, 11, 458. [Google Scholar] [CrossRef]
  2. Salmi, M. Additive Manufacturing Processes in Medical Applications. Materials 2021, 14, 191. [Google Scholar] [CrossRef] [PubMed]
  3. DebRoy, T.; Wei, H.L.; Zuback, J.S.; Mukherjee, T.; Elmer, J.W.; Milewski, J.O.; Beese, A.M.; Wilson-Heid, A.; De, A.; Zhang, W. Additive manufacturing of metallic components—Process, structure and properties. Prog. Mater. Sci. 2018, 92, 112–224. [Google Scholar] [CrossRef]
  4. Jamshidinia, M.; Kovacevic, R. The influence of heat accumulation on the surface roughness in powder-bed additive manufacturing. Surf. Topogr. 2015, 3, 014003. [Google Scholar] [CrossRef]
  5. Yadroitsev, I.; Smurov, I. Surface Morphology in Selective Laser Melting of Metal Powders. Phys. Procedia 2011, 12, 264–270. [Google Scholar] [CrossRef]
  6. Li, R.; Liu, J.; Shi, Y.; Wang, L.; Jiang, W. Balling behavior of stainless steel and nickel powder during selective laser melting process. Int. J. Adv. Manuf. Technol. 2012, 59, 1025–1035. [Google Scholar] [CrossRef]
  7. Kudzal, A.; McWilliams, B.; Hofmeister, C.; Kellogg, F.; Yu, J.; Taggart-Scarff, J.; Liang, J. Effect of scan pattern on the microstructure and mechanical properties of Powder Bed Fusion additive manufactured 17-4 stainless steel. Mater. Des 2017, 133, 205–215. [Google Scholar] [CrossRef]
  8. Li, Z.; Li, H.; Yin, J.; Li, Y.; Nie, Z.; Li, X.; You, D.; Guan, K.; Duan, W.; Cao, L.; et al. A Review of Spatter in Laser Powder Bed Fusion Additive Manufacturing: In Situ Detection, Generation, Effects, and Countermeasures. Micromachines 2022, 13, 1366. [Google Scholar] [CrossRef]
  9. Yasa, E.; Deckers, J.; Craeghs, T.; Badrossamay, M.; Kruth, J.P. Investigation on Occurrence of Elevated Edges in Selective Laser Melting. In Proceedings of the 2009 International Solid Freeform Fabrication Symposium, Austin, TX, USA, 3–5 August 2009; pp. 180–192. [Google Scholar]
  10. Jiménez, A.; Bidare, P.; Hassanin, H.; Tarlochan, F.; Dimov, S.; Essa, K. Powder-based laser hybrid additive manufacturing of metals: A review. Int. J. Adv. Manuf. Technol. 2021, 114, 63–96. [Google Scholar] [CrossRef]
  11. Elambasseril, J.; Rogers, J.; Wallbrink, C.; Munk, D.; Leary, M.; Qian, M. Laser powder bed fusion additive manufacturing (LPBF-AM): The influence of design features and LPBF variables on surface topography and effect on fatigue properties. Crit. Rev. Solid State Mater. Sci. 2023, 48, 132–168. [Google Scholar] [CrossRef]
  12. Strano, G.; Hao, L.; Everson, R.M.; Evans, K.E. Surface roughness analysis, modelling and prediction in selective laser melting. J. Mater. Process. Technol. 2013, 213, 589–597. [Google Scholar] [CrossRef]
  13. Maleki, E.; Bagherifard, S.; Razavi, N.; Riccio, M.; Bandini, M.; du Plessis, A.; Berto, F.; Guagliano, M. Fatigue behaviour of notched laser powder bed fusion AlSi10Mg after thermal and mechanical surface post-processing. Mater. Sci. Eng. A 2022, 829, 142145. [Google Scholar] [CrossRef]
  14. Zerbst, U.; Madia, M.; Klinger, C.; Bettge, D.; Murakami, Y. Defects as a root cause of fatigue failure of metallic components. I: Basic aspects. Eng. Fail. Anal. 2019, 97, 777–792. [Google Scholar] [CrossRef]
  15. du Plessis, A.; Beretta, S. Killer notches: The effect of as-built surface roughness on fatigue failure in AlSi10Mg produced by laser powder bed fusion. Addit. Manuf. 2020, 35, 101424. [Google Scholar] [CrossRef]
  16. Cheng, Z.; Liao, R.; Lu, W. Surface stress concentration factor via Fourier representation and its application for machined surfaces. Int. J. Solids Struct. 2017, 113–114, 108–117. [Google Scholar] [CrossRef]
  17. Cutolo, A.; Elangeswaran, C.; Muralidharan, G.K.; Van Hooreweder, B. On the role of building orientation and surface post-processes on the fatigue life of Ti-6Al-4V coupons manufactured by laser powder bed fusion. Mater. Sci. Eng. A 2022, 840, 142747. [Google Scholar] [CrossRef]
  18. Ordnung, D.; Metelkova, J.; Cutolo, A.; Van Hooreweder, B. Improving fatigue performance of metal parts with up-facing inclined surfaces produced by laser powder bed fusion and in-situ laser remelting. Addit. Manuf. Lett. 2022, 3, 100049. [Google Scholar] [CrossRef]
  19. Maleki, E.; Bagherifard, S.; Bandini, M.; Guagliano, M. Surface post-treatments for metal additive manufacturing: Progress, challenges, and opportunities. Addit. Manuf. 2021, 37, 101619. [Google Scholar] [CrossRef]
  20. Yasa, E.; Kruth, J.-P.; Deckers, J. Manufacturing by combining Selective Laser Melting and Selective Laser Erosion/laser re-melting. CIRP Ann. 2011, 60, 263–266. [Google Scholar] [CrossRef]
  21. Senol, S.; Cutolo, A.; Ordnung, D.; Datye, A.; Van Hooreweder, B.; Vanmeensel, K. Improved surface quality and fatigue life of high-strength, hybrid particle reinforced (Ti+B4C)/Al-Cu-Mg metal matrix composite processed by dual-laser powder bed fusion. Proc. Struct. Integr. 2024, 53, 12–28. [Google Scholar] [CrossRef]
  22. Sinico, M.; Metelkova, J.; Dalemans, T.; Thijs, L.; Van Hooreweder, B. High speed laser powder bed fusion of M789 tool steel with an optimized 120 µm layer thickness approach. In Procedia CIRP; Elsevier: Amsterdam, The Netherlands, 2022; Volume 113, pp. 162–165. [Google Scholar] [CrossRef]
  23. Böhler M789 Powder Composition. Available online: https://www.bohler-edelstahl.com/en/products/m789-ampo (accessed on 1 June 2025).
  24. 3DSystems. Certified M789 Material. Available online: https://www.3dsystems.com/materials/certified-m789-a (accessed on 16 May 2025).
  25. Tian, Y.; Palad, R.; Aranas, C. Microstructural evolution and mechanical properties of a newly designed steel fabricated by laser powder bed fusion. Addit. Manuf. 2020, 36, 101495. [Google Scholar] [CrossRef]
  26. Turk, C.; Zunko, H.; Aumayr, C.; Leitner, H.; Kapp, M. Advances in Maraging Steels for Additive Manufacturing. BHM Berg- Hüttenmänn. Monatshefte 2019, 164, 112–116. [Google Scholar] [CrossRef]
  27. Ordnung, D.; Mertens, T.; Metelkova, J.; Van Hooreweder, B. Novel strategy for automated quality enhancement of up-facing inclined surfaces by incremental dual laser powder bed fusion. Opt. Lasers Eng. 2024, 178, 108172. [Google Scholar] [CrossRef]
  28. ISO 16610-21; Geometrical Product Specifications (GPS)—Filtration—Part 21: Linear Profile Filters: Gaussian Filters. ISO: Geneva, Switzerland, 2011.
  29. ISO 21920-2; Geometrical Product Specifications (GPS). Surface Texture: Profile—Part 2: Terms, Definitions and Surface. ISO: Geneva, Switzerland, 2021.
  30. ISO 21920-3; Geometrical Product Specifications (GPS). Surface Texture: Profile—Part 3: Specific Operators. ISO: Geneva, Switzerland, 2021.
Figure 1. Experimental methodology illustrating (a) the sample design and the investigated curved surface highlighted in green, with build orientation BD, bending span l, and the samples’ width w and height h at the critical cross-section; sizes in mm, (b) the investigated sample conditions in testing conditions, and (c) the fatigue testing setup in the three-point bending configuration.
Jmmp 09 00207 g001
Figure 2. Schematic representation and photographs of the DLPBF strategy, with build direction BD and the arrows indicating scan vectors. The strategy consisted of three steps: (a) building through conventional LPBF, (b) removal of powder covering the curved surface through pulsed-laser-induced shock waves. Powder removal happens in sections treated with different focal plane locations shifted by Δf according to the scan sequence labeled from 1 to 10 with a total number of scan passes of 20 (LT60, HB60/120) and 35 (LT120), and (c) laser remelting of the newly exposed surface with the static focal plan located at mid-height H/2 of the inclined surface corresponding to a maximum defocus of ±Δfmax = 2.6 mm. The blue lines indicate the remolten zone.
Jmmp 09 00207 g002
Figure 3. Arithmetic mean surface profiles extracted from the middle section of the samples and fitted to a circular shape for the investigated conditions: (a) as-built and laser remolten, and (b) electrical discharge machined and mechanically polished build using LT60, respectively, and (c) as-built and laser remolten build using LT120, and (d) as-built and laser remolten build using HB60/120.
Jmmp 09 00207 g003
Figure 4. SN curves for the investigated sample conditions, produced with (a) the standard strategy using a layer thickness of LT = 60 μm (LT60), (b) the high-productivity strategy LT120 and the hull-bulk strategy HB60/120. For visual reference, the Basquin fittings are shown for the standard processes (AB, LT60, and LR, LT60). The arrows indicate run-outs at Nf = 2 × 10⁶ load cycles without failure.
Jmmp 09 00207 g004
Table 1. Quantification of surface parameters for the investigated surface conditions, including roughness Ra, critical stress concentration factor kt,crit, autocorrelation length Ral, and root mean square gradient Rdq. The results represent mean values and the corresponding standard deviation between the samples.
Surface Condition
Surface
Parameters
ABLRPEDM
LT60LT120HB60/120LT60LT120HB60/120LT60LT60
Ra/μm14.0 ± 1.425.8 ± 4.215.7 ± 1.85.6 ± 1.018.7 ± 6.56.5 ± 0.70.21 ± 0.030.70 ± 0.04
kt,crit2.14 ± 0.092.38 ± 0.202.27 ± 0.101.24 ± 0.021.60 ± 0.211.33 ± 0.041.03 ± 0.011.27 ± 0.01
Ral/μm128 ± 11307 ± 97260 ± 50474 ± 64466 ± 125508 ± 241182 ± 71545 ± 15
Rdq0.43 ± 0.020.48 ± 0.070.41 ± 0.020.12 ± 0.010.17 ± 0.010.12 ± 0.010.08 ± 0.00.19 ± 0.0
Disclaimer/Publisher’s Note: The statements, opinions and data contained in all publications are solely those of the individual author(s) and contributor(s) and not of MDPI and/or the editor(s). MDPI and/or the editor(s) disclaim responsibility for any injury to people or property resulting from any ideas, methods, instructions or products referred to in the content.

