1. Introduction
Platinum has played a significant role in wiring technology, particularly in the aerospace and automotive industries, due to its remarkable electrical properties and exceptional durability. In manufacturing, coatings serve both protective and functional roles. However, for certain applications, such as sensor integration or PCB soldering, these coatings must be selectively removed. Traditionally, chemical processes have been employed for this purpose due to their broad applicability and effectiveness [
1]. However, these methods are associated with considerable drawbacks, including high costs, extended processing times, and hazardous operational environments, as they often involve aggressive solvents or corrosive agents that pose safety risks to operators. These issues have motivated the search for alternative techniques [
2,
3].
Laser ablation has emerged as a compelling method for microscale coating removal, offering rapid processing, localized targeting, and minimal impact on the underlying substrates [
2]. Compared to ultrasonic [
1], cryogenic, or mechanical techniques, laser ablation delivers greater precision and efficiency, especially when applied to fine structures like micro-wires. It has been employed in various fabrication processes, with the laser parameters optimized according to the laser type and application requirements [
4]. Factors such as average power, peak power, repetition rate, and pulse duration significantly influence the outcome and are selected based on the material characteristics and desired effects [
5,
6].
UV nanosecond lasers offer a cost-effective and energy-efficient solution for high-precision ablation [
7]. Their short pulse durations enable focused energy delivery with reduced thermal diffusion, and their moderate cost makes them accessible for practical industrial applications. Additionally, laser ablation in liquid environments, especially in water, has gained attention as a promising method for clean microfabrication [
8]. Water provides superior cooling compared to air, reducing the heat-affected zone and improving processing precision [
9,
10]. In the case of platinum, debris generated during ablation is removed through bubble motion and convection, minimizing contamination and improving the surface quality [
11].
Despite these advantages, the interaction between the laser parameters and the resulting mechanical and surface properties remains complex, particularly under water-assisted ablation conditions. The scanning speed, overlap percentage, and line distance are critical factors that influence outcomes, such as tensile strength and surface roughness. However, their individual and combined effects are not yet fully understood.
Analysis of Variance (ANOVA) is widely employed in manufacturing research to identify the most influential process parameters and their interactions. It serves as a powerful statistical tool for optimizing fabrication processes, improving product quality, and reducing variability in industrial applications. Its integration into experimental design enables data-driven decision-making, which is crucial for achieving precision and efficiency in advanced manufacturing workflows. To address this, the current study applied Analysis of Variance (ANOVA) to statistically evaluate both the main effects and two-factor interactions among key process parameters. Interactions such as Speed × Overlap and Speed × Line Distance were analyzed to identify the most influential factors affecting the ablation quality. While other experimental design methods, such as full Design of Experiments (DOE) or Taguchi methods, exist, ANOVA was chosen for its robustness in identifying statistically significant trends and maintaining experimental flexibility in this exploratory phase [
12].
2. Material and Methods
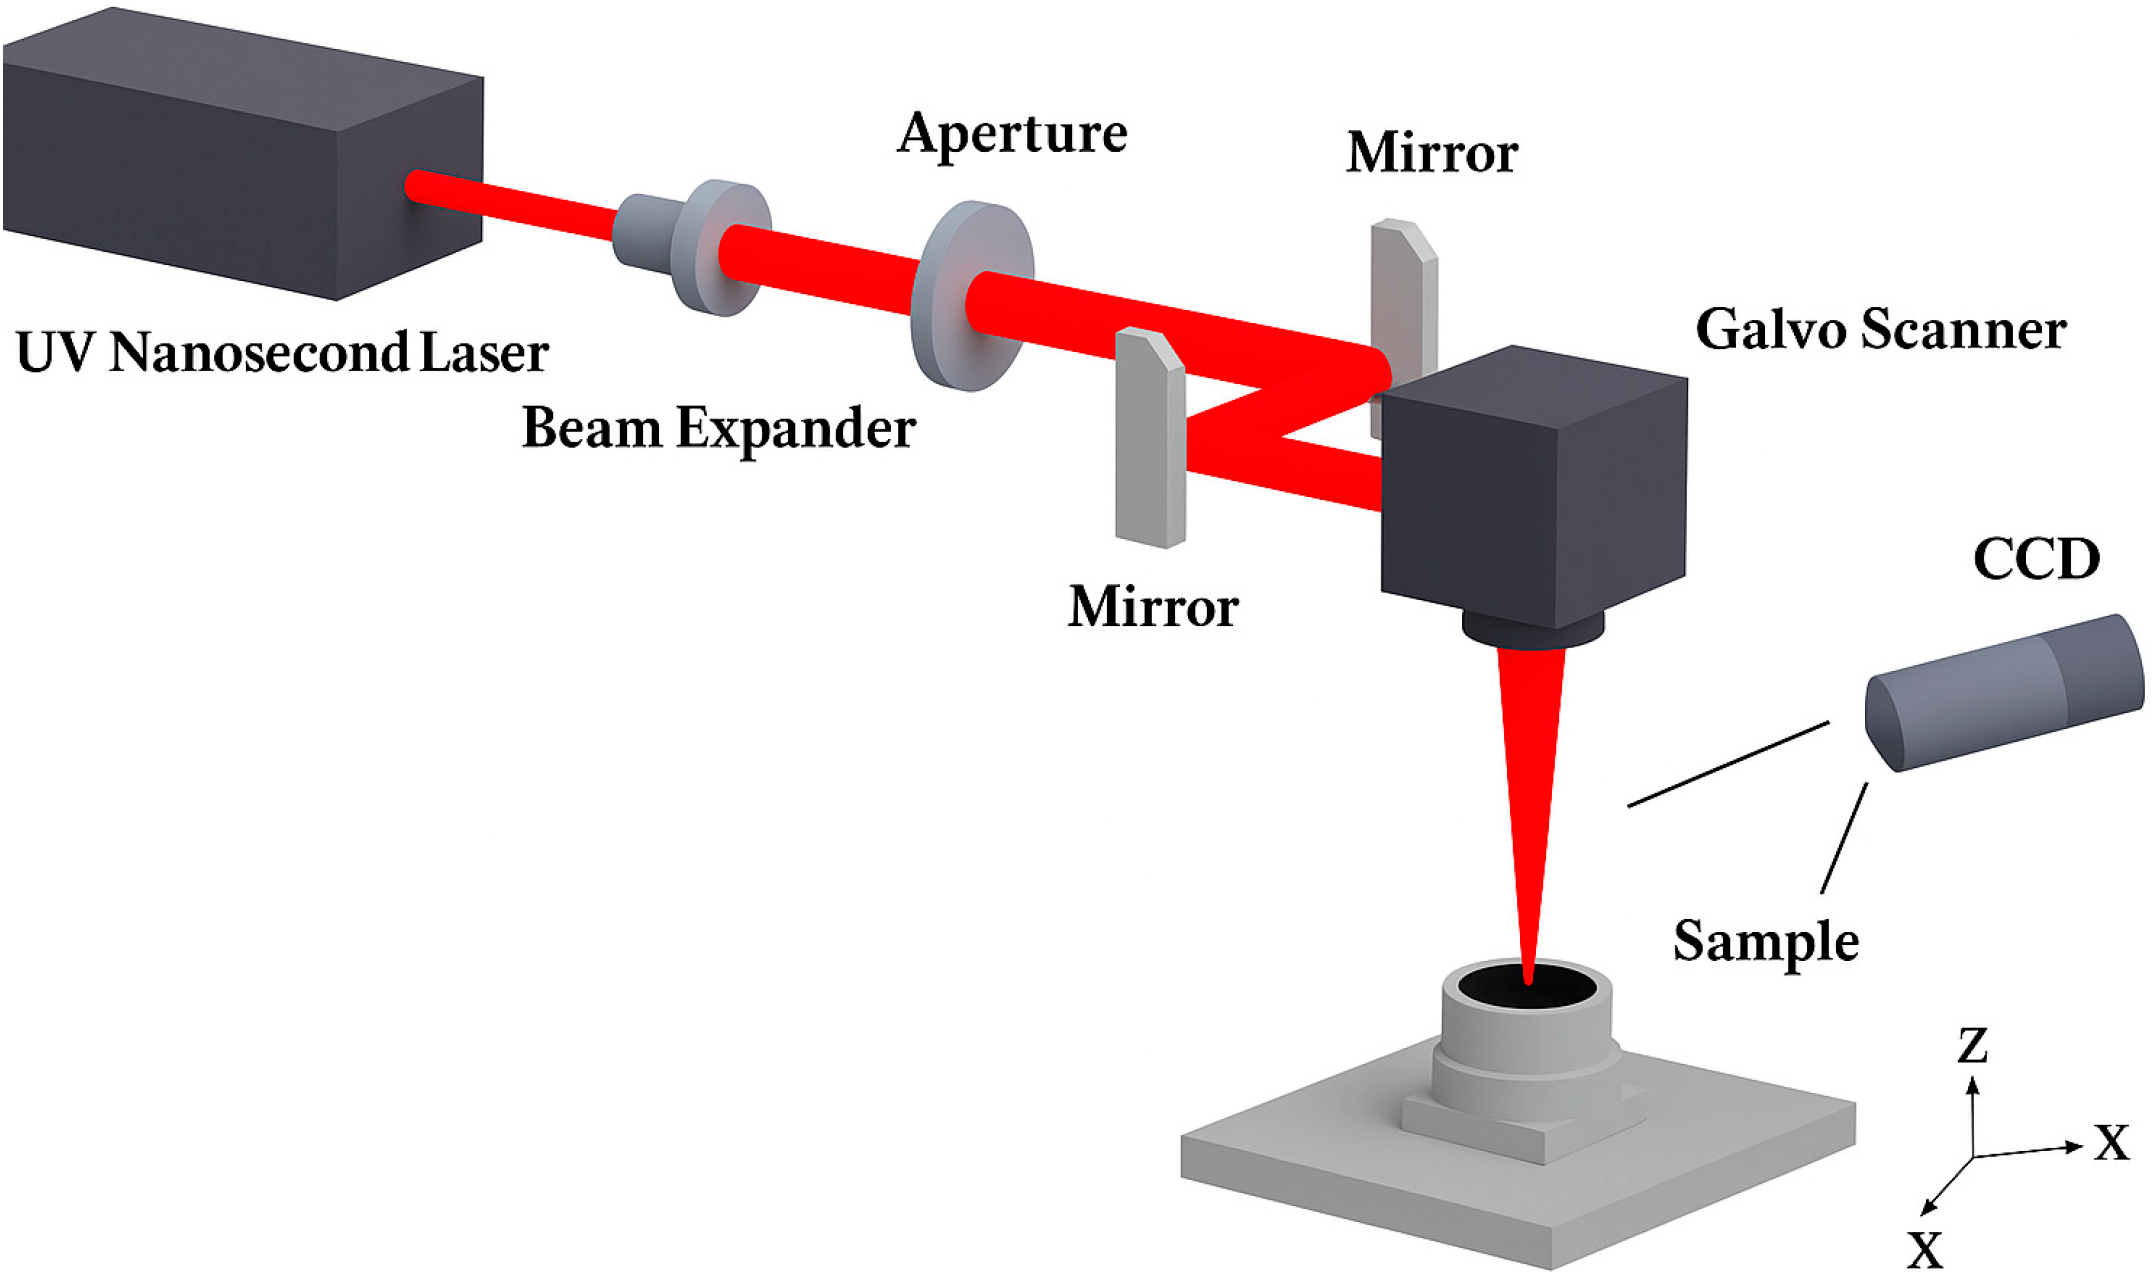
Figure 1 presents a schematic depiction of the experimental setup used for nanosecond laser ablation in water. The process was conducted using 18 ns laser pulses at a wavelength of 355 nm and pulse frequency of 20 kHz. A UV laser system with a Gaussian beam profile supplied by MACTRON Inc. was used.
The substrate used in this study was a pure platinum microwire. Due to the high accuracy and stability requirements of these wires in advanced industrial applications, the material is manufactured to a high purity standard, corresponding to 99.99% purity (4N grade). This level of purity ensures consistent thermal and mechanical properties, which are critical for precise laser processing and material characterization. The experiment involved a 50 µm platinum wire coated with polyamide, resulting in a total diameter of 65 µm. The platinum wire, including its polyamide coating, was fully submerged in a 2–3 mL layer of water in a glass container. The ablation process was conducted in two rotations of 180° each, ensuring that only half of the wire’s circumference was ablated per pass. The laser focus was set at the apex of the wire (65 µm level), meaning that the lowest point reached by the laser beam during ablation was 32.5 µm from the bottom of the wire. This setup allowed complete circumferential ablation in two passes while ensuring that the water layer provided effective thermal regulation and debris removal. The sample was secured on a three-axis translation stage, with the ablation area set to a 10 mm × 10 mm square. The interaction of the laser with the target material was governed by the frequency control of the galvo scanner mirrors, as depicted in
Figure 1. To achieve a beam spot size of 20 µm, a lens with a focal length of 130 mm was positioned from the galvo scanner, ensuring that the beam was perpendicular to the surface within the ablation area. Adjustments were made to account for the refractive index difference between water and air, which necessitated parameter modifications compared with the dry ablation experiments. A detailed description of this experimental setup and its parameters has been documented in previous water-based laser ablation studies [
3].
This research focuses on achieving optimal coating removal by utilizing higher scanning speeds, multiple ablation loops, and increased line distances in the X direction. This approach aims to enhance the surface quality while improving the process efficiency and reducing the operational time.
The primary modification in this study, compared to previous research [
3], is based on prior findings that demonstrated the significant impact of the incident angle on the curved wire surface and the presence of a water layer on the spot diameter. These factors facilitated uniform ablation across the wire surface, eliminating gaps as predicted by theoretical calculations [
10]. However, in the current adjustment, the process parameters were altered to incorporate higher scanning speeds, resulting in an increased line distance along the
Y-axis, along with a greater number of loops to compensate for potential ablation gaps. It is important to note that the initial spot diameter of the laser system in air, when focused on a flat sheet, is 20 microns. However, as demonstrated in a previous study, the presence of water and the angle of incidence, due to the circular shape of the wires, cause the spot diameter to increase. The refractive index of water affects the focus of the laser, altering the behavior of the beam and causing the spot size to expand. Experiments show that when a flat sheet is submerged in 3 mL of water, the spot diameter increases to approximately 30 microns. With the added factor of the angle of incidence, which is influenced by the curvature of the wire surface, the spot diameter increased further. For a clearer understanding, on a flat sheet in the presence of water, the beam’s divergence causes the focal point to shift slightly, 32.5 µm below the apex. Consequently, the spot diameter on this sheet was measured at an average of 45 microns, which could be considered the maximum spot diameter for this sample. This increase in spot size is largely due to both the water medium and the angle of incidence on the surface. Therefore, for calculation purposes, the spot diameter is assumed to be an average of 45 microns, representing the largest observed diameter under the experimental conditions.
This adjustment introduces a critical consideration: ensuring that the energy per unit area remains sufficient for effective ablation. While changing the focal length inherently reduces the energy density, it simultaneously expands the coverage area, which could enhance uniformity. A well-balanced combination of spot size, scanning speed, and loop count is essential for achieving a smoother and more efficient ablation process. If optimized correctly, this new configuration could lead to faster ablation rates while maintaining complete coating removal without compromising the integrity of platinum wire [
13].
After completing all experimental procedures, each wire sample was subjected to both tensile strength testing and surface roughness evaluation. All measurements were conducted under the same standardized conditions to ensure consistency. Tensile strength tests were carried out using an Instron Inc. Universal Testing Machine (UTM) equipped with a 50 N load cell. The wires were securely clamped to prevent slippage during testing, and a crosshead speed of 5 mm/min was applied to maintain the accuracy and reduce the measurement variability. For each experimental condition, three independent wire samples were tested to determine the tensile strength.
The surface roughness was evaluated using an Olympus Lext 5000 confocal microscope, Olympus Corporation, Tokyo, Japan. Each sample was subjected to 3D scanning at 20× magnification with a resolution of 645 × 645 µm. Roughness measurements were taken along multiple lines in three distinct regions of each wire, including the ablated central area and two transition zones. This procedure was repeated for three wires per condition, and the average values were used for the subsequent analysis.
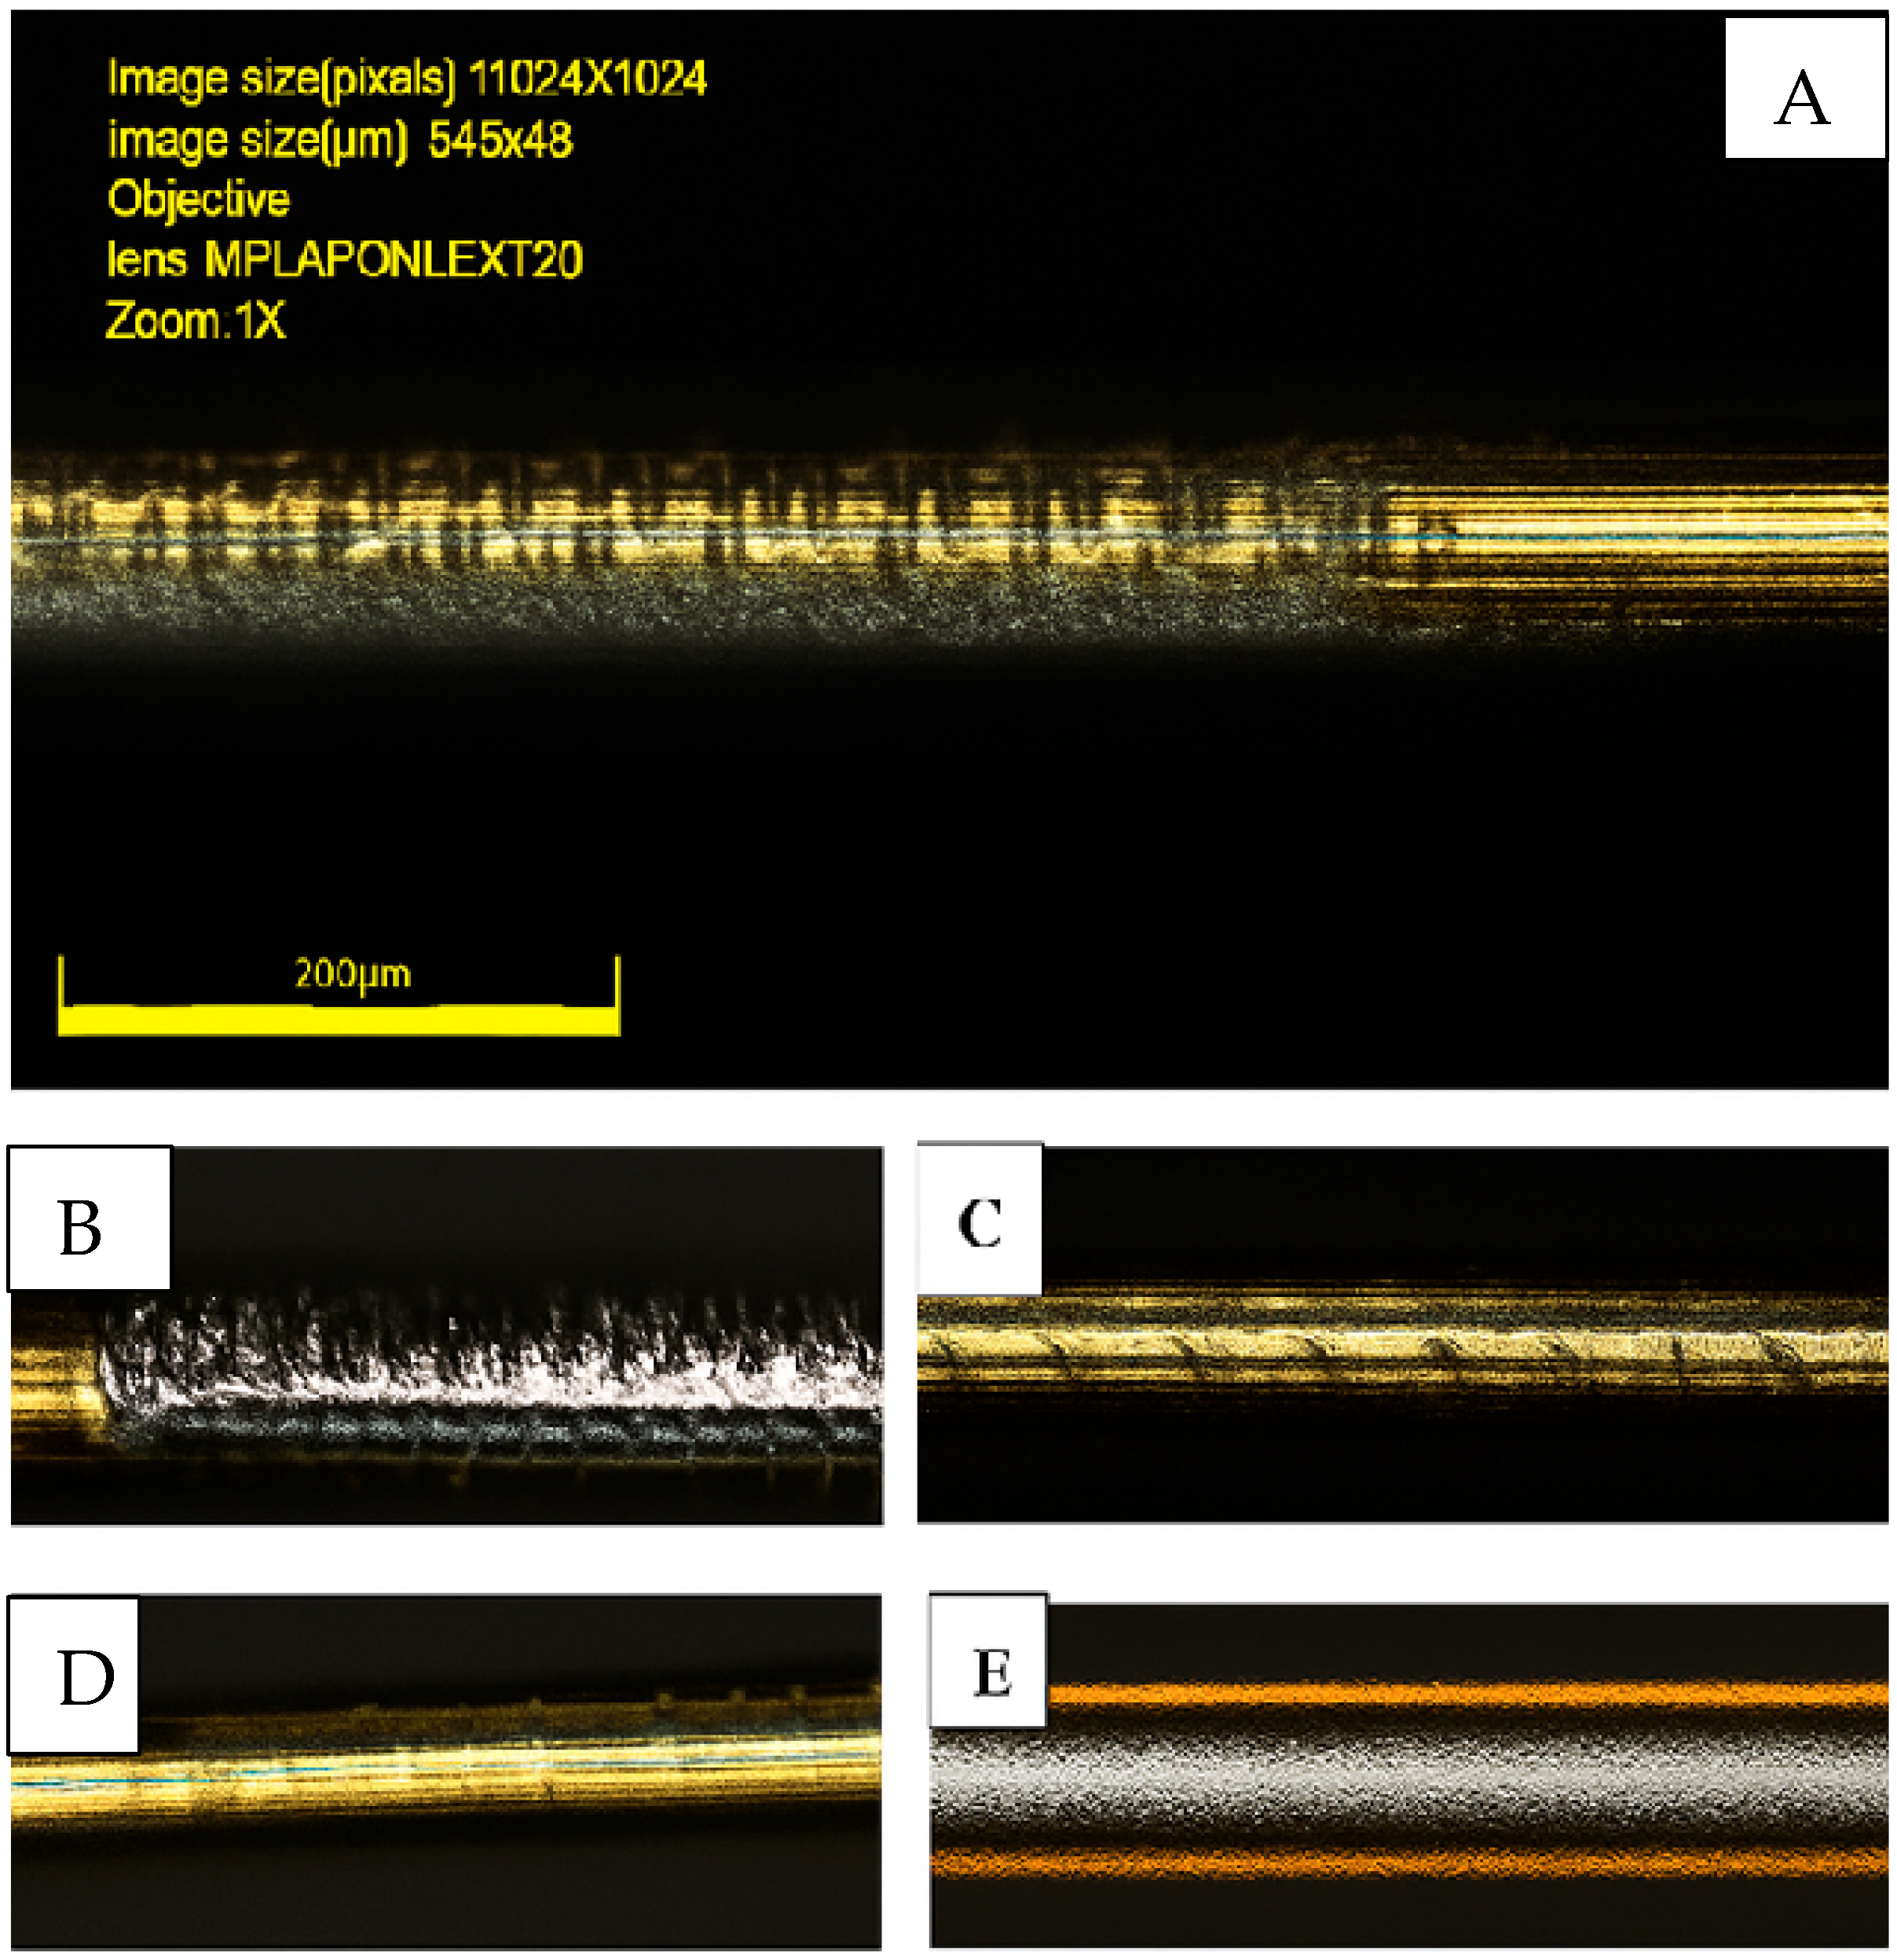
All samples were analyzed using the same imaging settings and scale references within the Olympus Lext 5000 system (as shown in
Figure 2A). However, due to layout and space constraints in the manuscript, the images of some samples were cropped for clarity and visual consistency. Nonetheless, all samples underwent identical imaging procedures and were captured at the same magnification and scale to ensure their comparability.
3. Results and Discussion
The experiments were conducted using three distinct scanning speeds and multiple ablation loops to assess their effects on the process. The overlap percentage, determined using Equation (1), was dependent on the line distance along the
X-axis, while the line distance along the
Y-axis was influenced by scanning speed, as described by Equation (2). However, the impact of the
Y-axis line distance remained stable throughout the experiments [
14].
On a laser system emitting Gaussian-shaped pulses, the pulse duration is typically measured at Full Width at Half Maximum (FWHM). The peak laser power can be estimated using Equation (3), assuming no correction factor is applied. Given that the average power of the system is 3 W and using the relationship between peak power and average power in pulsed laser systems, the calculated peak power is 8.33 kW [
14].
Before calculating the fluence, it is essential to determine the pulse energy, which can be obtained using Equation (5). This equation provides a direct relationship between the peak power and the energy delivered per pulse. Once E
pulse is determined, it can be used to compute the fluence, which quantifies the energy density delivered to the material during laser ablation. τ
Pulse is 18 nanoseconds for this system.
Consequently, the fluence, calculated using Equation (4), was determined to be 18.86 J/cm
2, which remained consistent across all experimental configurations. Initially, with the machine’s standard spot diameter, the fluence was calculated to be 95.5 J/cm
2. However, as the spot diameter increased due to factors such as the angle of incidence and the presence of water, the fluence consequently decreased. This reduction influence is a direct result of the larger area over which the laser energy is distributed, leading to less energy being delivered per unit area on the target.
Table 1 presents the experimental design for water-based ablation, incorporating higher scanning speeds and multiple loops. These parameters were optimized to achieve superior surface quality compared to previous adjustments and demonstrate improvements over the chemical methods referenced in earlier research [
3]. Following the completion of all experiments on the samples, including tensile strength and surface roughness measurements, the collected data was analyzed using ANOVA with the assistance of Python (version 3.11). The results of this analysis are presented in the subsequent sections.
3.1. Tensile Strength
As illustrated in
Figure 2, the experimental design indicated that several parameter combinations failed to produce satisfactory surface quality despite yielding tensile strength values comparable to those of the more successful cases. Among the tested conditions, only the samples processed at scanning speeds of 1500 mm/s and 1200 mm/s, with high overlap ratios in the X direction and two processing loops, exhibited acceptable surface characteristics. Notably, the sample treated at 1200 mm/s achieved the highest surface quality, outperforming all other configurations, as shown in
Figure 2E. In contrast,
Figure 2B reveals that although the coating was effectively removed, the resulting surface roughness remained suboptimal.
Figure 2A–D further demonstrates that increases in scanning speed and line distance contributed to partial coating removal, yet residual material persisted, suggesting the process did not fully expose the underlying substrate.
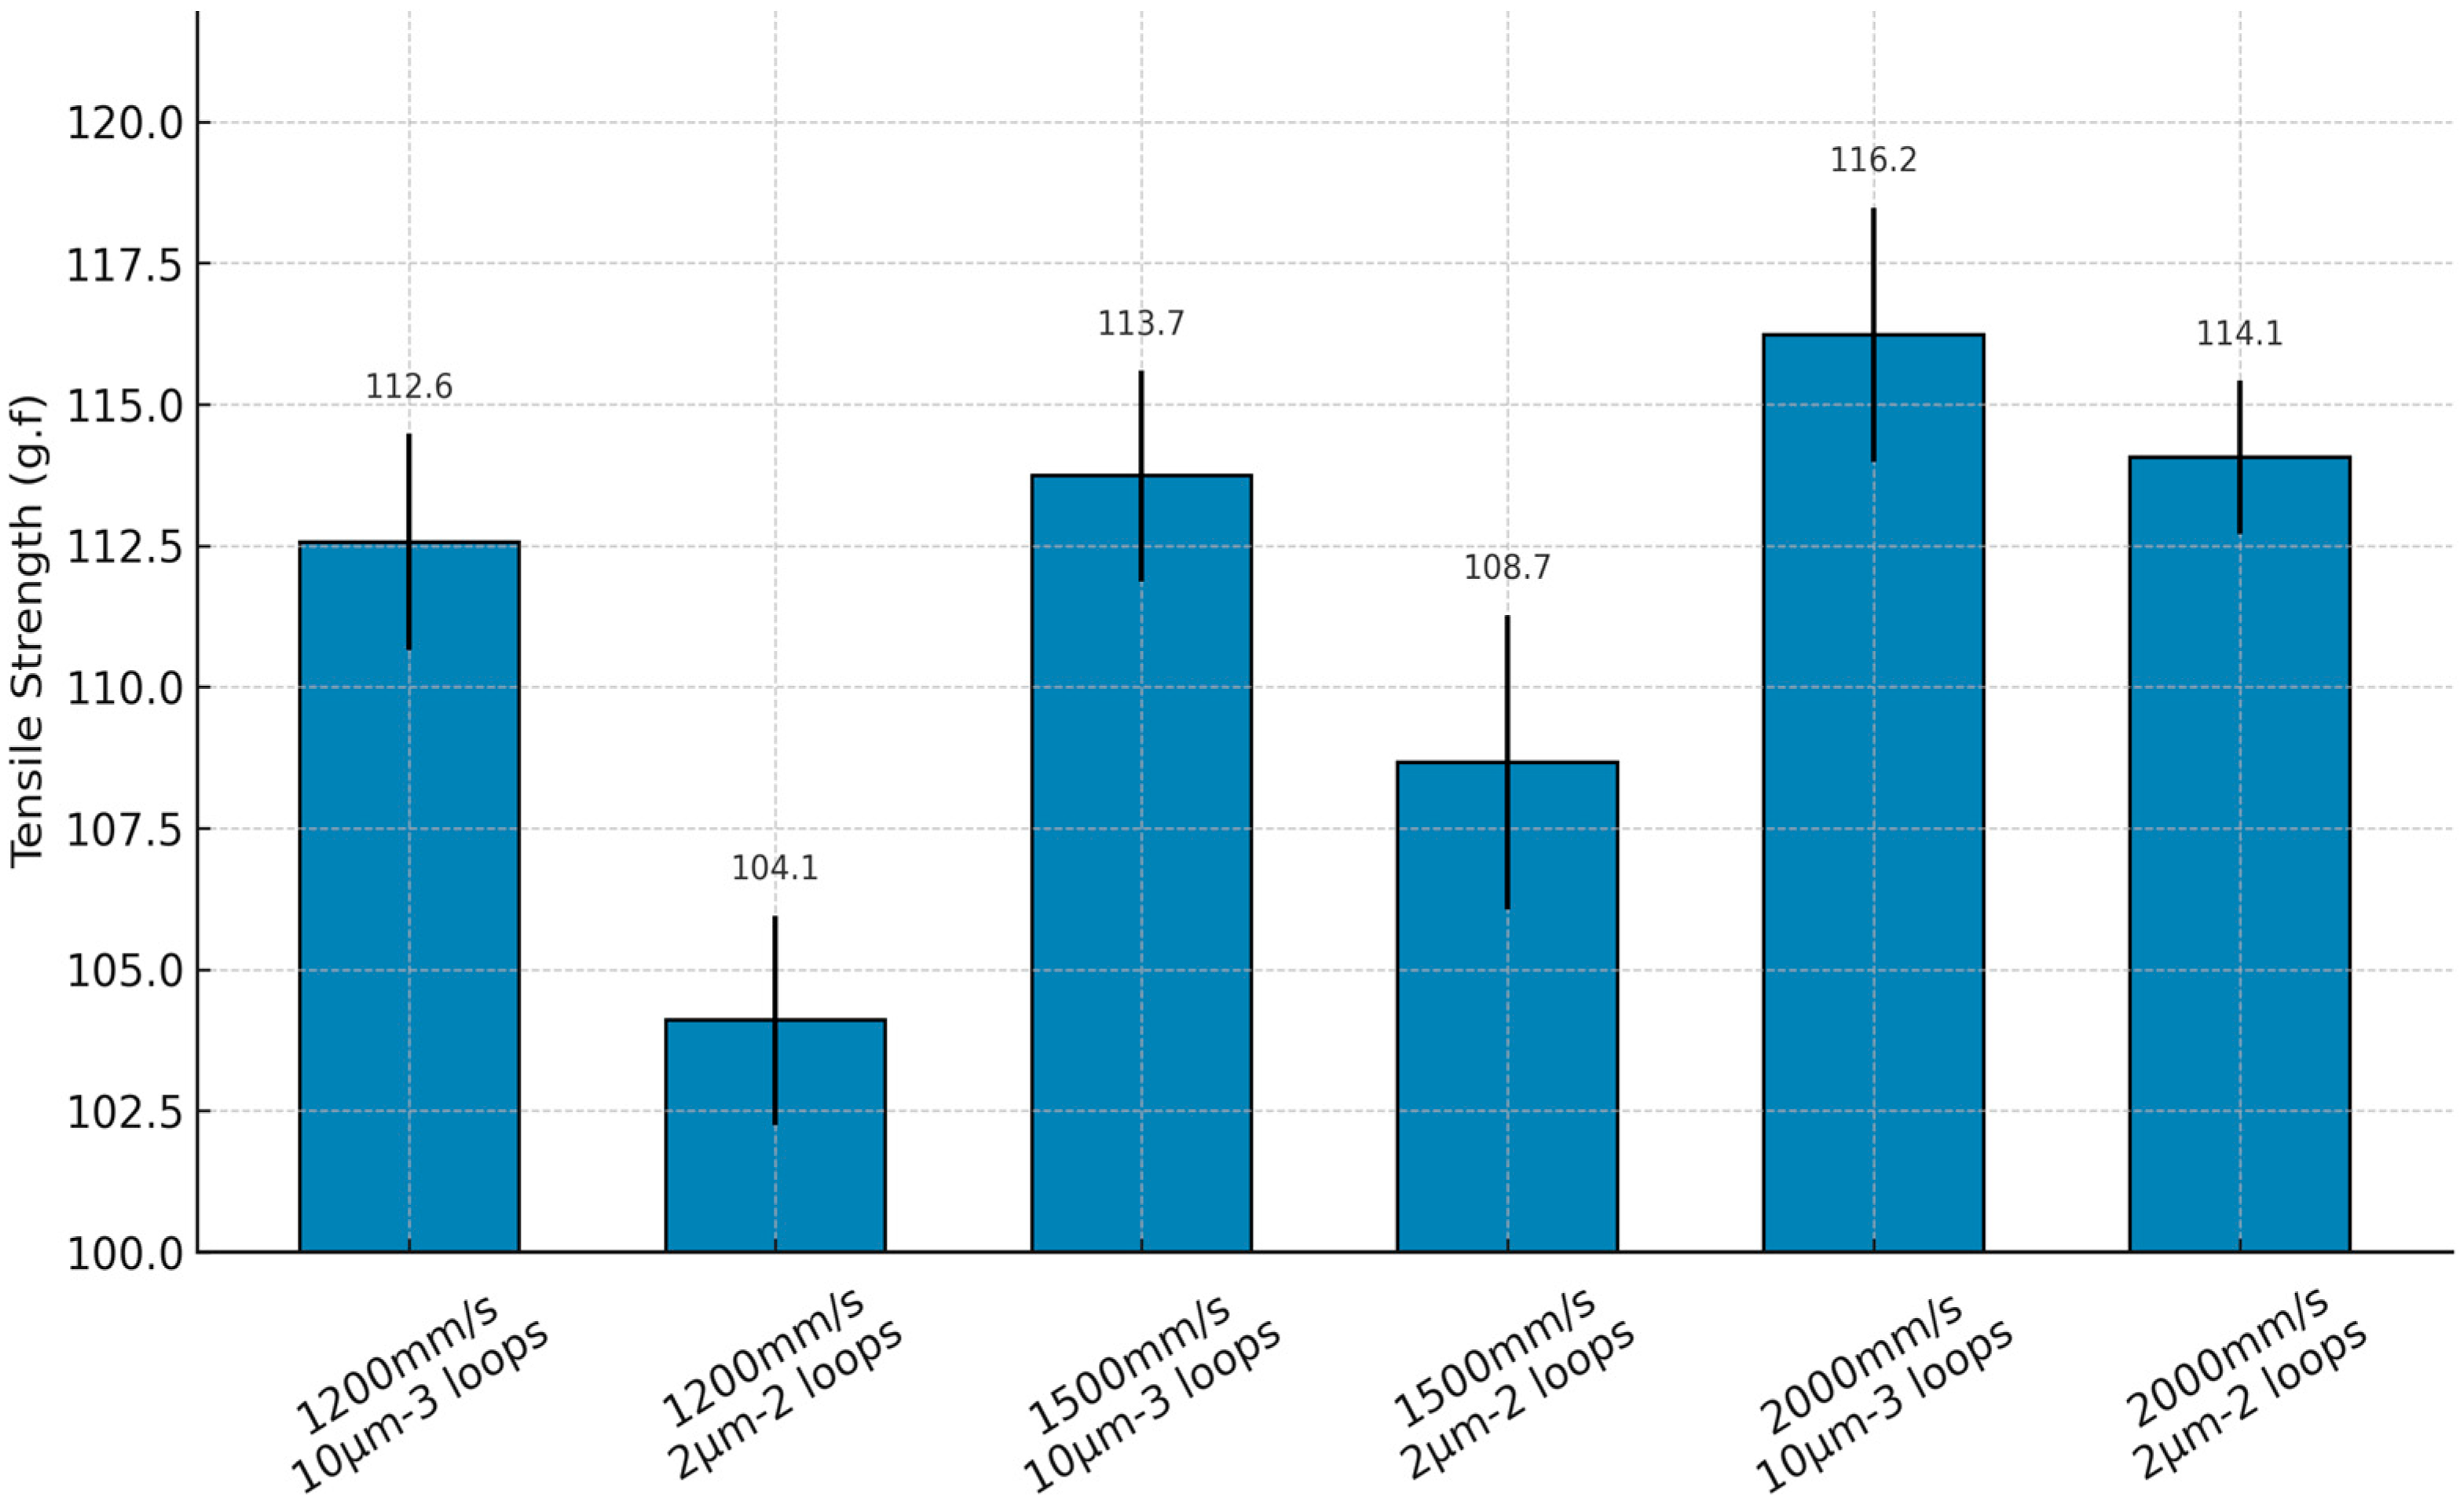
Based on the previously discussed experimental conditions, the laser-ablated wire samples were subjected to tensile strength measurements, and the average values for each sample are presented in
Figure 3. As anticipated, an increase in line distance, which directly reduces the overlap in the x-direction, resulted in higher tensile strength. Additionally, higher processing speeds exhibited a lesser weakening effect on the wires, leading to samples processed at higher speeds demonstrating superior tensile strength. The obtained results closely align with those achieved through the traditional chemical stripping process from prior studies while also demonstrating greater efficiency in both processing time and outcomes compared to the final water-assisted laser ablation adjustments conducted in the earlier study.
It is important to highlight that although all samples were evaluated using both the confocal microscope and the on-site microscope, only those processed at 1200 mm/s with a 2 µm line distance and at 1500 mm/s with a 2 µm line distance—both using two loops—exhibited surfaces completely free of debris. The remaining samples, while demonstrating partial coating removal, retained surface residues that made them unsuitable for the next stage of manufacturing. This stage, typically involving fine-pitch soldering or bonding, demands a high degree of surface cleanliness to ensure electrical reliability and mechanical stability. As shown in previous studies on microscale assembly and wire bonding, even minimal surface debris can hinder solder wetting or cause joint failures.
This outcome reflects a significant improvement attributed to the adjustment in focal length, which increased the laser spot diameter. This enhancement effectively compensated for the gaps in the y-axis, particularly at higher processing speeds, such as 1500 mm/s with a 2 µm line distance in the x-axis direction. Notably, these results exceed the performance of previously recommended parameters from earlier studies, which were limited to lower speeds (1000 to 1200 mm/s) and a 1 µm line distance in the x-direction.
The choice of experimental table design is also noteworthy. It was intended to enable a faster processing route while approximating the outcomes of conventional chemical methods. For example, the configuration using a 10 µm line distance in the x-axis, though substantially reducing the overlap, incorporated three consecutive ablation passes. This adjustment was found to effectively remove the coating without causing thermal damage or burning, though some sections still exhibited residual debris. Nonetheless, this setup provides a valuable framework for defining parameter boundaries in preparation for subsequent ANOVA analysis.
3.2. Roughness
The surface roughness values for each experimental adjustment were meticulously assessed using a confocal microscope, employing 3D scanning over a 645 × 645 µm area. To ensure accuracy, roughness measurements were conducted through line assessments at three distinct segments on three separate wire samples for each parameter configuration. As anticipated, a smaller line distance in the x-direction corresponding to a higher overlap yielded superior surface quality and lower roughness values. In contrast, processing speed exhibited an inverse correlation with surface roughness, as higher ablation speeds led to a decline in surface quality. Notably, increasing the number of ablation loops failed to compensate for the drawbacks of a larger line distance in the x-direction. This finding reinforces the critical role of a reduced line distance and greater overlap in achieving optimal surface smoothness.
Figure 4 illustrates the results across all adjustments, further substantiating these observations and validating the underlying analysis.
After collecting all the data, an ANOVA was conducted to gain a comprehensive understanding of the effects of each parameter on the laser ablation process. This analysis serves as a valuable tool for future research involving fine and delicate wire samples, facilitating the efficient identification of optimal process parameters, even when using different laser systems.
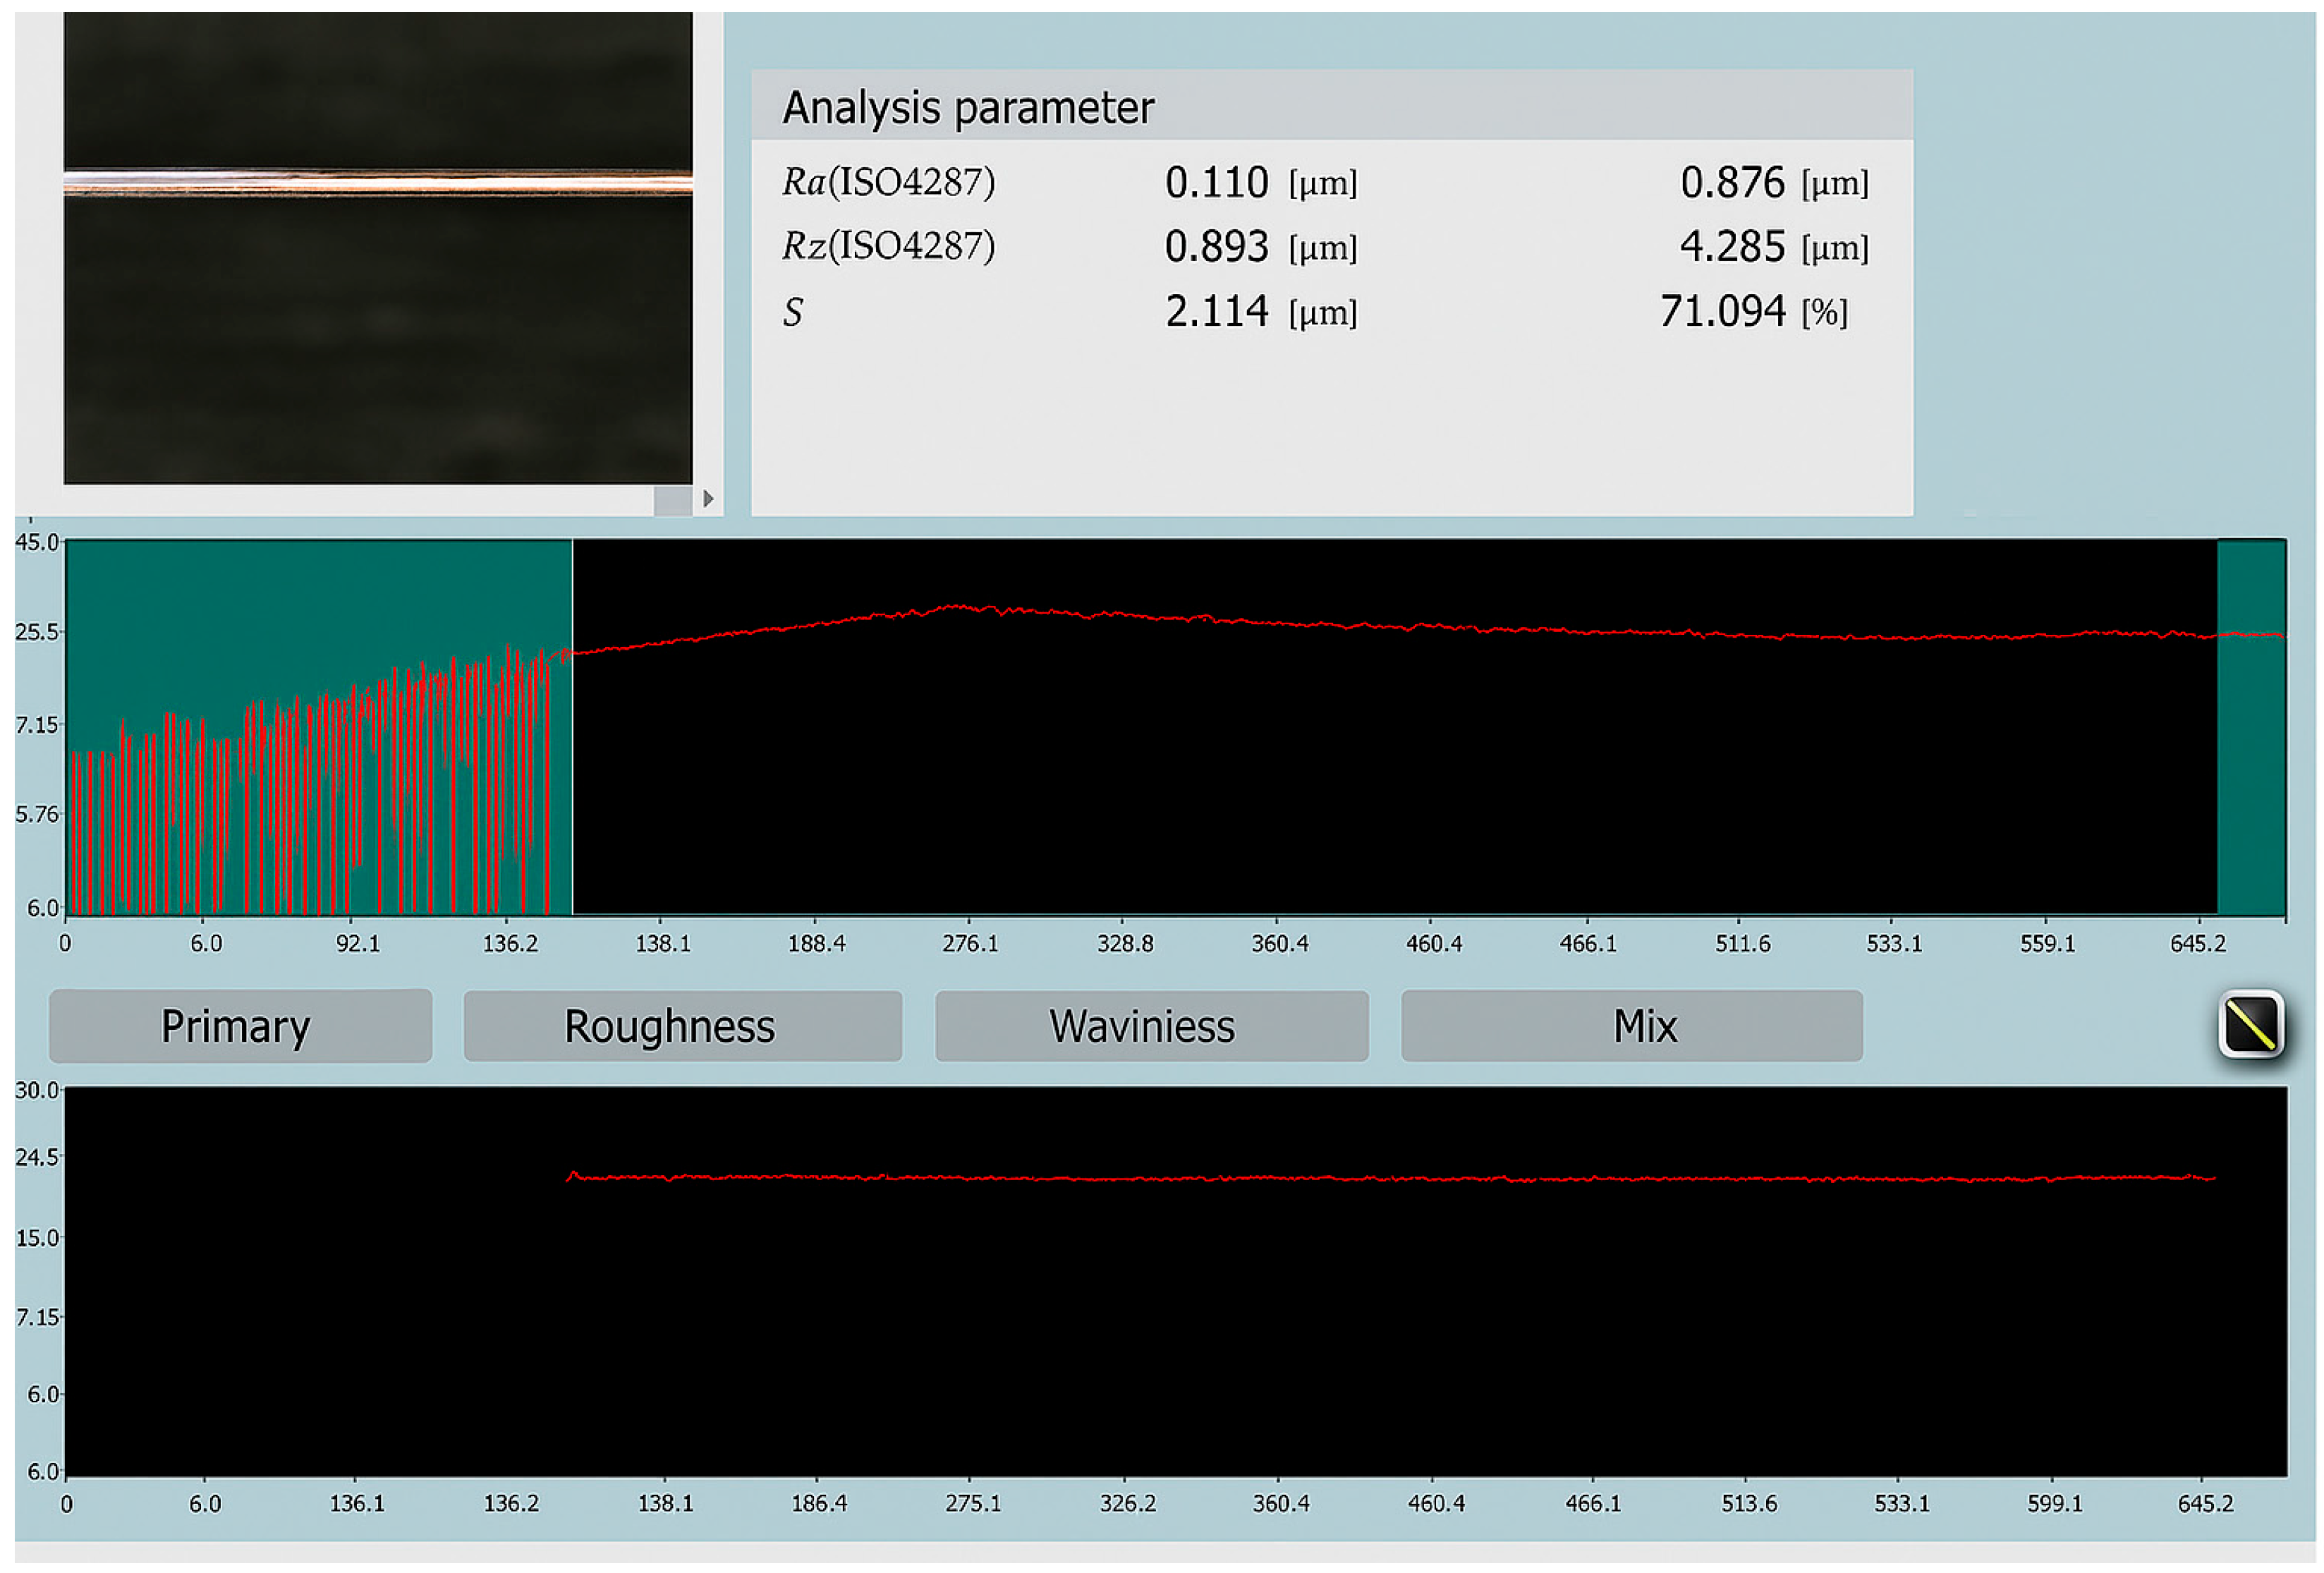
As shown in
Figure 5, a speed of 1200 mm/s combined with a 2-micron line distance in the X direction and two loops produced effective results, yielding clean de-coating with no visible debris. Surface roughness measurements further confirm the effectiveness, with a Ra value of 0.110 recorded at the center of the ablated area. It is important to note that for each wire, roughness was measured at three different segments, and the average value was reported in
Table 2. This approach ensured more reliable results for comparison and supported the validity of the outcomes of the ANOVA.
4. ANOVA Introduction
To evaluate the influence of key laser processing parameters on the tensile strength and surface roughness, an Analysis of Variance (ANOVA) was conducted using a multiple regression model that included both main effects and interaction terms. ANOVA is a statistical method used to determine the significance of individual factors and their interactions by comparing the variance within and between groups of data. This approach enables the identification of the most influential process parameters, guiding the optimal settings for improved outcomes [
15].
The primary factors analyzed in this study were as follows:
Scanning speed (which also governs the line distance in the Y direction)
Line distance in the X direction (which affects the overlap ratio in X)
Number of loops (which contributes to energy accumulation and coating removal uniformity)
The analysis was carried out in two stages. First, the main effects of each factor on the response variables—tensile strength (gf) and surface roughness (Ra, µm)—were evaluated. Subsequently, two-factor interactions, such as Speed × Overlap and Speed × Loops, were analyzed to assess their combined impact on the output.
A total of 18 experimental trials (
Table 2) with distinct parameter combinations were evaluated. The measured responses were used to generate an ANOVA model that identified the statistically significant contributors to the process performance. The results of the ANOVA, including the F-values and
p-values, are discussed in the following sections, highlighting both the individual and interaction effects that are critical for optimizing UV nanosecond laser ablation under water confinement.
Table 3 provides a comprehensive summary of all 18 experimental samples, detailing their individual tensile strength and surface roughness measurements. The overall standard deviations—4.486 gf for the tensile strength and 0.032 µm for the roughness—were calculated directly from the complete set of 18 data points using standard statistical formulas. These values reflect global variability across the full range of test conditions and offer a broader indication of process stability and repeatability. This analysis further confirmed the consistency of the laser ablation process, and the favorable surface quality achieved to ensure strong and reliable joint formation.
The preliminary analysis was based on both earlier experimental results and new observations obtained using the optimized parameter table developed in this study. Trends observed across different configurations, such as scanning speed, number of loops, and line distance, provided qualitative insights into their effects on tensile strength and surface roughness. For example, higher scanning speeds generally improved the tensile strength, although the benefit plateaued beyond 1500 mm/s. Surface roughness showed a moderate increase at the highest speeds, possibly due to the reduced control over energy distribution.
Similarly, increasing the number of loops enhanced the tensile strength, likely due to better coating removal, while roughness also increased under conditions of reduced overlap (e.g., at 10 µm line distance in X), indicating inconsistent ablation. At very tight overlaps with multiple loops, overheating leads to occasional substrate damage, underscoring the need for balance in parameter selection.
Based on these experimental observations, a structured ANOVA was performed to statistically validate these trends and investigate both the main and interaction effects. This two-stage approach—initial qualitative observation followed by statistical modeling—offers a comprehensive understanding of how laser parameters influence the process outcomes.
4.1. ANOVA for Main Effects (Tensile Strength)
Statistical analysis was conducted using Python to evaluate the effects of individual processing parameters on tensile strength.
Table 4 summarizes the main effects of the scanning speed, number of loops, and line distance along the
X-axis. Among these, the number of loops and line distance in the X-direction showed the strongest influence (
p = 0.00035). The scanning speed was also statistically significant (
p = 0.00075), with an increased speed correlating with an improved tensile strength up to a saturation point.
As the scanning speed increased from 1200 mm/s to 2000 mm/s, the tensile strength improved due to more efficient energy delivery; however, the effect plateaued at higher speeds, where reduced energy per unit area diminished the ablation efficiency. Similarly, a smaller line distance in the X-direction, which increased the overlap, improved the structural integrity by ensuring more uniform ablation. The number of loops also played a critical role: increasing the number of loops enhanced the coating removal completeness, but excessive loops could introduce thermal stress.
The lack-of-fit test yielded a p-value of 0.0562, indicating that the model adequately fits the experimental data at a 95% confidence level. No significant lack of fit was detected.
As shown in
Table 3 and
Figure 2, increasing the scanning speed enhances the tensile strength up to a certain threshold, after which the improvement plateaued. At lower speeds, prolonged laser exposure may lead to excessive heat accumulation, resulting in over ablation and structural weakening. Conversely, at higher speeds, the reduced energy deposition per unit area decreases the ablation efficiency. This trade-off explains why the tensile strength initially increases and then eventually stabilizes.
Furthermore, a smaller line distance in the X-direction (i.e., greater overlap) facilitates more uniform and complete material removal, thereby improving the mechanical integrity. In contrast, a larger line distance of X may lead to incomplete ablation and the formation of weak points, particularly when the overlap is insufficient.
4.2. ANOVA for Main Effects (Surface Roughness)
The influence of each parameter on the surface roughness was also analyzed. As shown in
Table 5, all three factors—scanning speed, line distance in the X direction, and number of loops—were statistically significant. The line distance X and loop count had the greatest effect (
p = 0.000002), followed by the scanning speed (
p = 0.000077).
According to the results presented in
Table 5, higher scanning speeds led to increased surface roughness, likely due to insufficient interaction time between the laser and material. Smaller line distances in X improved surface uniformity by increasing path overlap, while higher loop counts, although beneficial for coating removal, contributed to surface irregularities due to heat accumulation.
Surface roughness was highly sensitive to line distance X and loop count. A smaller line distance X produced smoother surfaces, while higher loop counts with large line distances caused irregular ablation and increased roughness.
5. Interactions Parameters
Following the analysis of the main effects, interaction effects were investigated to better understand the combined influence of the key laser parameters on the ablation quality. The interactions were selected based on their theoretical significance in determining the energy distribution and heat accumulation on the wire surface. The following pairwise interactions were evaluated:
This interaction captures the relationship between the energy delivery rate (speed) and cumulative exposure (number of loops). The results indicate that higher loop counts at increased scanning speeds yield more effective ablation and improved tensile strength, likely due to enhanced coating removal across multiple passes. However, at lower speeds, the same loop count may result in excessive heat input and thermal damage. Thus, the balance between speed and loop number is critical for achieving both effective coating removal and mechanical reliability.
The line distance in the X-direction directly controls the overlap between successive laser paths. At elevated scanning speeds, increased line distances (i.e., reduced overlap) tend to degrade the ablation uniformity, leading to surface roughness and incomplete coating removal. In contrast, smaller line distances at lower speeds facilitate better coverage and energy distributions. This interaction highlights the need for compensatory parameter tuning, as higher speeds require tighter overlap to maintain consistent ablation quality.
This interaction reflects the trade-off between repeated exposure and lateral spacing of the light. A high number of loops combined with a minimal line distance in X (high overlap) can result in thermal overload, increasing the risk of burning or structural degradation. Conversely, large line distances with too few loops may produce under-processed regions. Optimal ablation requires a balanced combination of loop count and overlap to ensure complete and uniform material removal without compromising wire integrity.
5.1. ANOVA for Interaction Effects (Tensile Strength)
Before delving further to determine which interaction has the highest effect, it is noteworthy that when analyzing the experimental results, we initially examined the main effects of Speed, Number of Loops, and Line Distance X separately to determine their individual influence on the tensile strength and roughness. However, to better understand how these factors interact, we expanded our analysis to include interaction effects. When interactions are considered, the variance that was initially attributed solely to the main effects is redistributed among the interaction terms, leading to slight adjustments in the F-values and p-values. This difference arises because certain combinations of factors may influence the response more than the sum of their individual effects. If a significant shift in values is observed, it suggests that the interactions play a crucial role in determining the final material properties. Conversely, if the differences are minor, it indicates that the primary factors are dominant contributors. Understanding these interactions allows for a more precise interpretation of how the process parameters collectively affect the tensile strength and surface roughness.
As of
Table 6, the interaction between the scanning speed and the number of loops yields a
p-value of 0.0562, which is marginally above the conventional threshold for statistical significance (α = 0.05). This suggests a potential interaction effect, implying that the impact of the scanning speed on the tensile strength may vary depending on the number of loops. For instance, an increased speed does not consistently enhance the tensile strength across different loop counts. Similarly, the interaction between speed and line distance in the X-direction (
p = 0.0562) is near significant, indicating that the effect of speed on the tensile strength may be influenced by the spacing between lines along the
X-axis. In contrast, the interaction between the number of loops and X-direction line distance is highly significant (
p = 0.0002), demonstrating a strong dependency between these two factors. Specifically, a larger X-line distance appears to enhance the tensile strength, particularly when a greater number of loops are applied. This suggests that a wider spacing between the lines allows for better heat dissipation during multiple passes, reducing the risk of thermal damage and promoting improved wire integrity.
Notably, the lack of fit was evaluated for the main effects model, and no significant deviation was observed. For the interaction model, the residual consisted entirely of pure error, leaving no degrees of freedom for a formal lack of fit test.
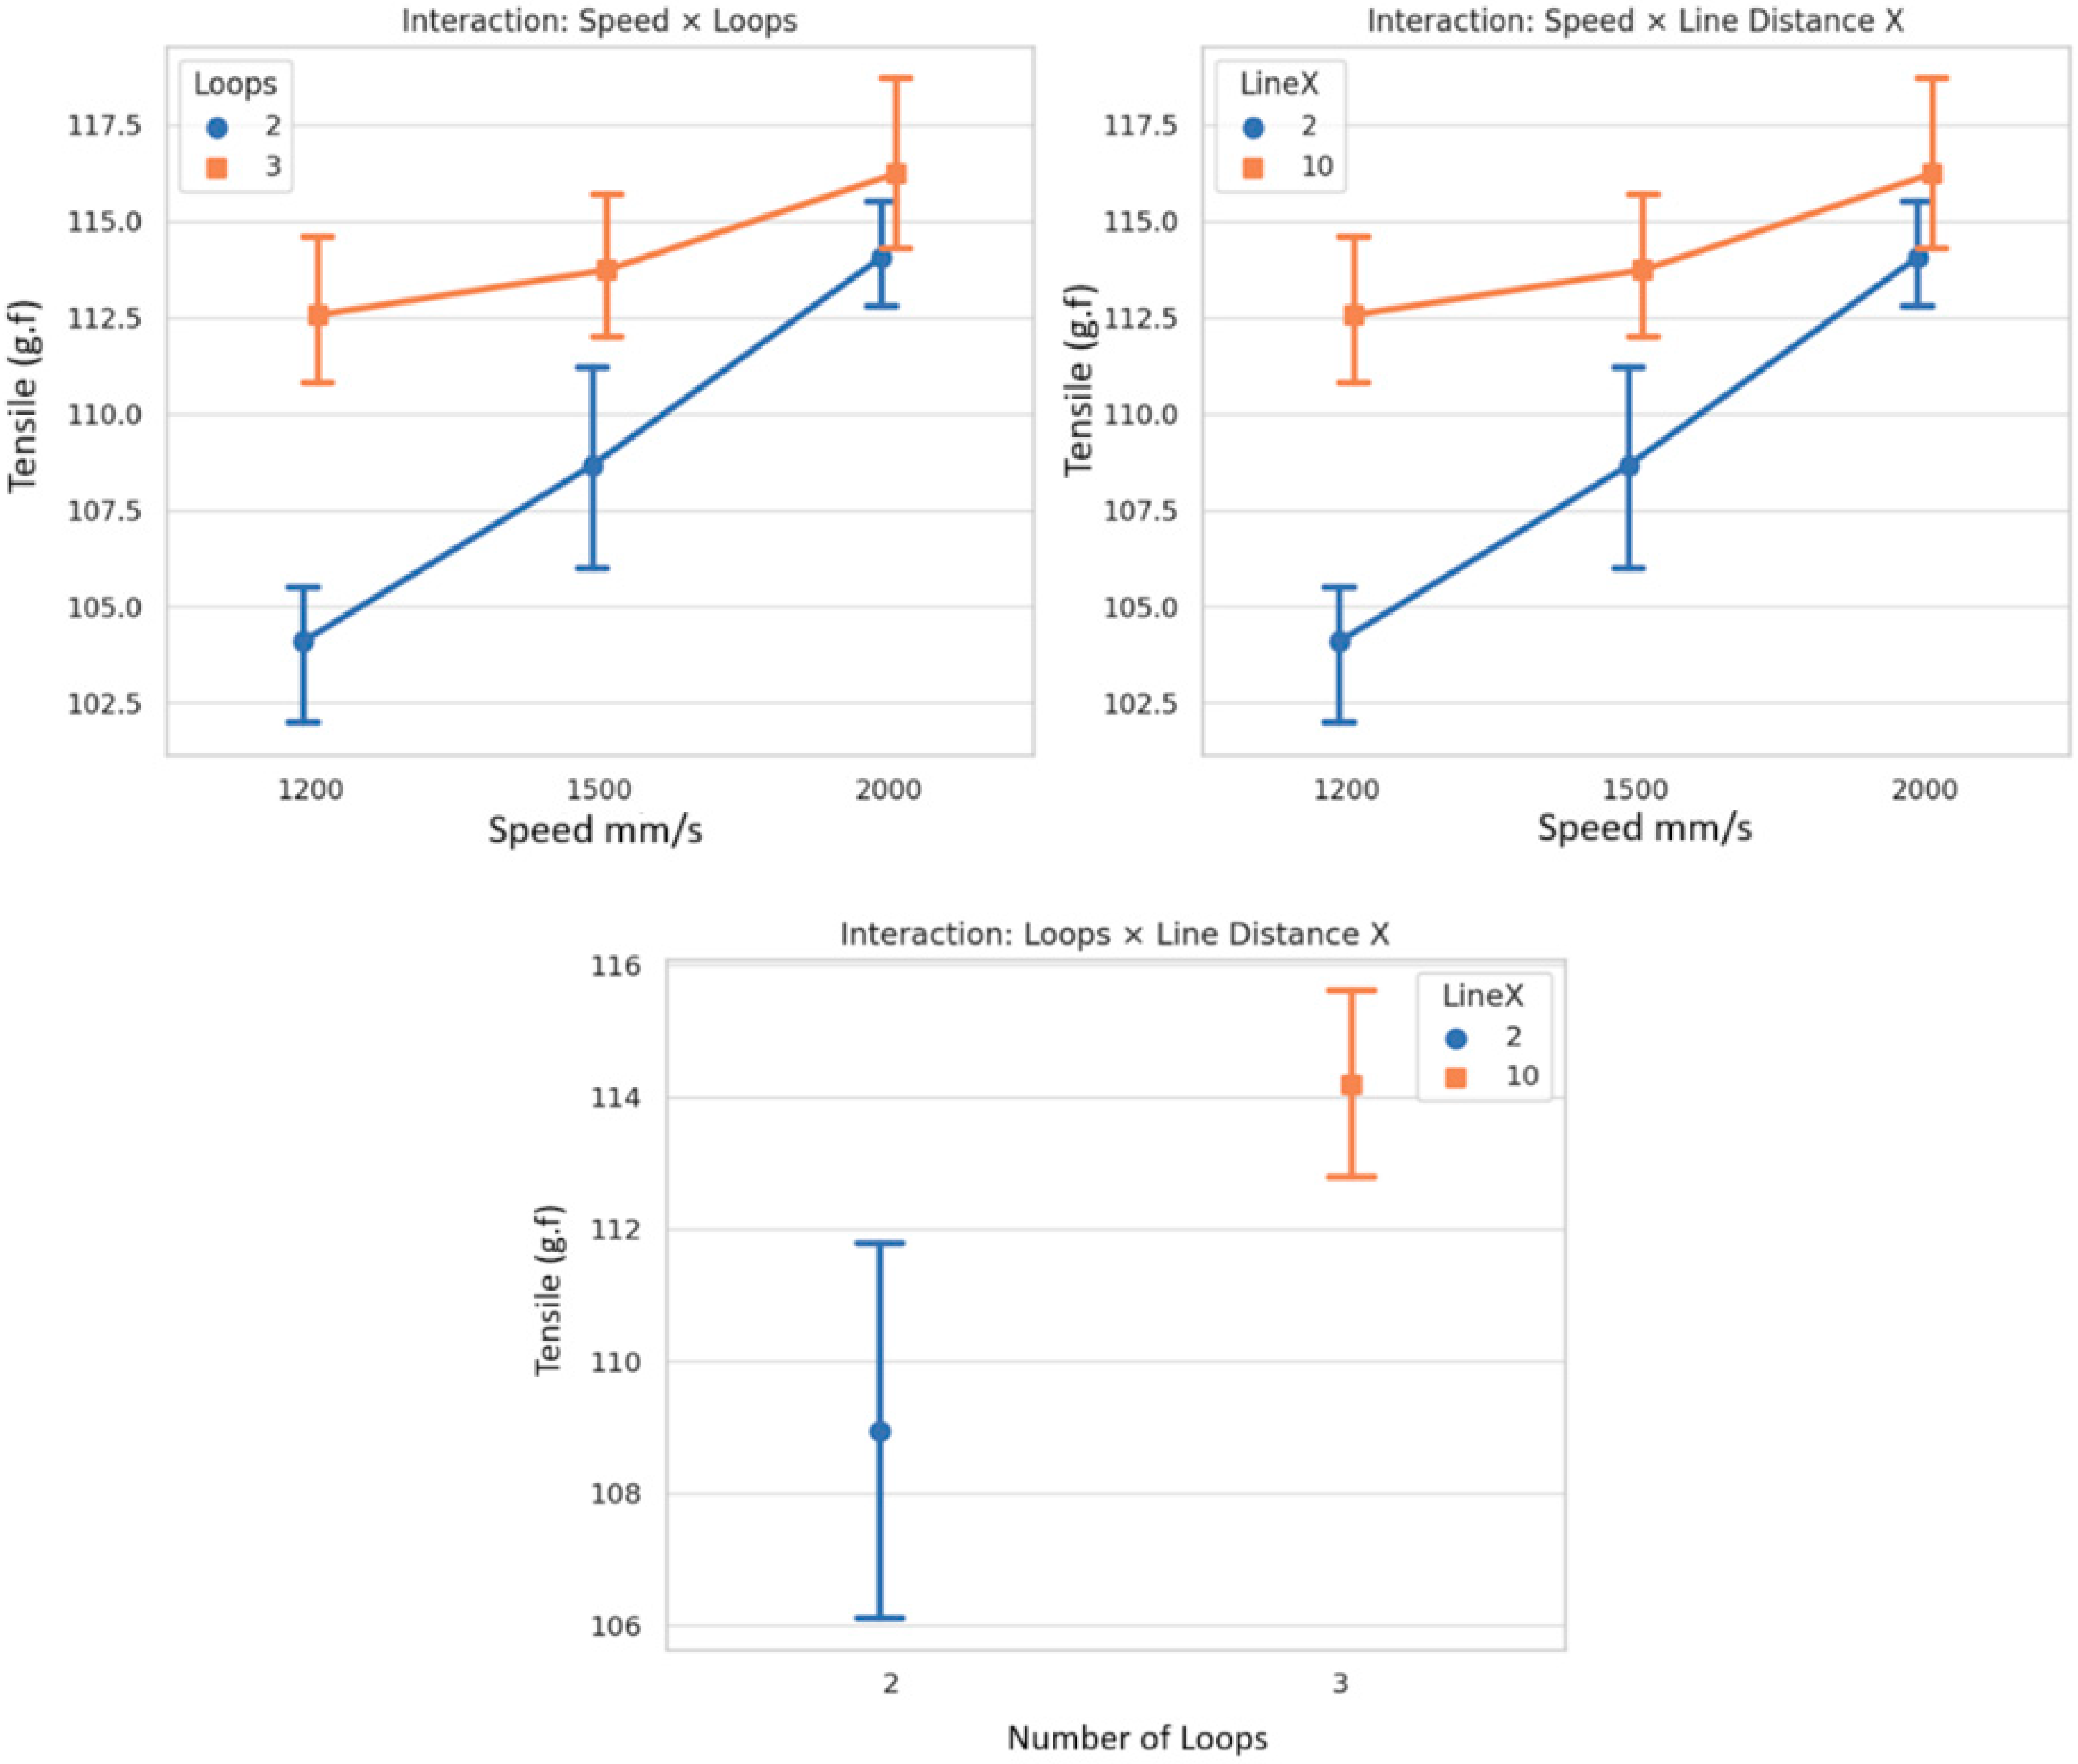
Plots for Interaction Effects (Tensile Strength)
As of
Figure 6, the interaction plot demonstrates that the tensile strength is influenced not only by the scanning speed or loop count independently but also by their combination. When the number of loops is set to three, increasing the speed from 1200 mm/s to 2000 mm/s leads to a more pronounced improvement in the tensile strength compared to when only two loops are used. This suggests that higher speeds are more effective in enhancing material strength when paired with a greater number of loops, likely due to more efficient ablation and better coating removal through multiple passes. However, this benefit was less evident at lower loop counts, indicating that speed alone cannot compensate for insufficient exposure.
This interaction reveals how the scanning speed and
X-axis line distance jointly influence the tensile strength. At lower speeds (1200 mm/s), a larger line distance (10 µm) results in a higher tensile strength, likely due to the minimized thermal overlap and reduced risk of overheating. However, this trend shifts at higher speeds. As also demonstrated in
Figure 6, as the speed increases, the benefit of a larger line distance becomes less significant or reverses, implying that at high speeds, tighter spacing (2 µm) may promote complete coating removal. Importantly, although the 10 µm line distance yielded better tensile results, it was observed during the experimentation that this setting often failed to achieve complete coating removal. This poses a significant limitation, as incomplete ablation undermines the functional performance despite the apparent mechanical strength. Therefore, under real processing conditions, 10 µm cannot be recommended, and a tighter spacing—though potentially more thermally aggressive—may be necessary to ensure consistent and complete stripping.
The interaction between the loop count and X-line distance highlights a shift in performance depending on the combination of settings. For two loops, a tighter line distance (2 µm) yields a higher tensile strength, likely compensating for fewer passes by improving the ablation density and surface interaction. In contrast, under 3-loop conditions, the 10 µm line distance results in better tensile strength, possibly due to the reduced cumulative heat input across multiple passes. However, as with the speed interaction, it is important to acknowledge that the 10 µm line distance failed to consistently remove the coating, making it unreliable for practical applications. Despite its favorable mechanical readings, incomplete removal introduces significant functional and reliability concerns, reinforcing the need for tighter spacing in real-world processing.
5.2. ANOVA for Interaction Effects (Surface Roughness)
According to
Table 7, the interaction between Speed and Number of Loops is highly statistically significant, indicating that the influence of scanning speed on surface roughness varies depending on the number of applied loops. Specifically, at lower loop counts, increasing the scanning speed may contribute to lower surface roughness due to the minimized thermal input. However, this benefit may diminish or reverse at higher loop counts, where the cumulative heat from successive passes can lead to greater surface irregularities. The large F-value associated with this interaction further supports its strong effect.
Similarly, the interaction between Speed and Line Distance X (horizontal line spacing) is also statistically significant, suggesting that the surface finish is affected by the interaction between the scanning speed and spacing between adjacent lines. At narrower line distances (2 µm), higher speeds may promote better heat dissipation and smoother surface. Conversely, with larger spacings (10 µm), an insufficient overlap at high speeds can lead to uneven ablation and increased roughness. This reinforces the necessity of coordinating the speed settings with the scan density to achieve optimal surface quality.
The interaction between the Number of Loops and Line Distance X demonstrates the most pronounced statistical significance, as reflected by the highest F-value and near-zero p-value. This indicates a dominant role in influencing the surface roughness. The effect of line spacing significantly changes with varying loop counts. At fewer loops, a denser scan pattern (smaller line distance) enhances the surface uniformity through controlled ablation. However, under increased looping, the same tight spacing can result in a thermal buildup, thereby deteriorating the surface finish. This interaction underscores the fundamental balance that must be maintained between spatial resolution and thermal effects to optimize the process.
Plots for Interaction Effects (Surface Roughness)
Figure 7 shows the interaction between the scanning speed and the number of loops, highlighting their combined influence on the surface roughness. The results indicate that the effect of speed on roughness is contingent on the number of loops applied. At two loops, the surface roughness remains relatively low at reduced speeds but increases considerably at higher speeds, likely due to the accumulated thermal effects. In contrast, when three loops are applied, the surface roughness is consistently higher across all speeds, implying that additional scanning passes intensify heat accumulation, thereby diminishing any potential smoothing benefits associated with increased scanning velocity.
As depicted in
Figure 7, this interaction demonstrates that the impact of the scanning speed on the surface roughness is strongly influenced by the density of the scan lines. When the line spacing is narrow, higher scanning speeds can still yield satisfactory surface smoothness, likely due to the uniform energy distribution and effective thermal management. However, at wider line spacings, an increased scanning speed results in an inadequate overlap between the scan lines and a reduced ablation consistency, thereby significantly increasing the surface roughness.
This interaction is the most statistically significant, indicating that the influence of line spacing on surface roughness is strongly dependent on the number of loops. At lower loop counts, the reduced line spacing enhances ablation control, contributing to improved surface smoothness. Conversely, at higher loop counts, the same tight spacing can lead to excessive thermal accumulation, which adversely affects the surface quality. This finding underscores the critical trade-off between spatial resolution and thermal regulation, necessitating careful optimization of the processing parameters to achieve the desired surface characteristics.
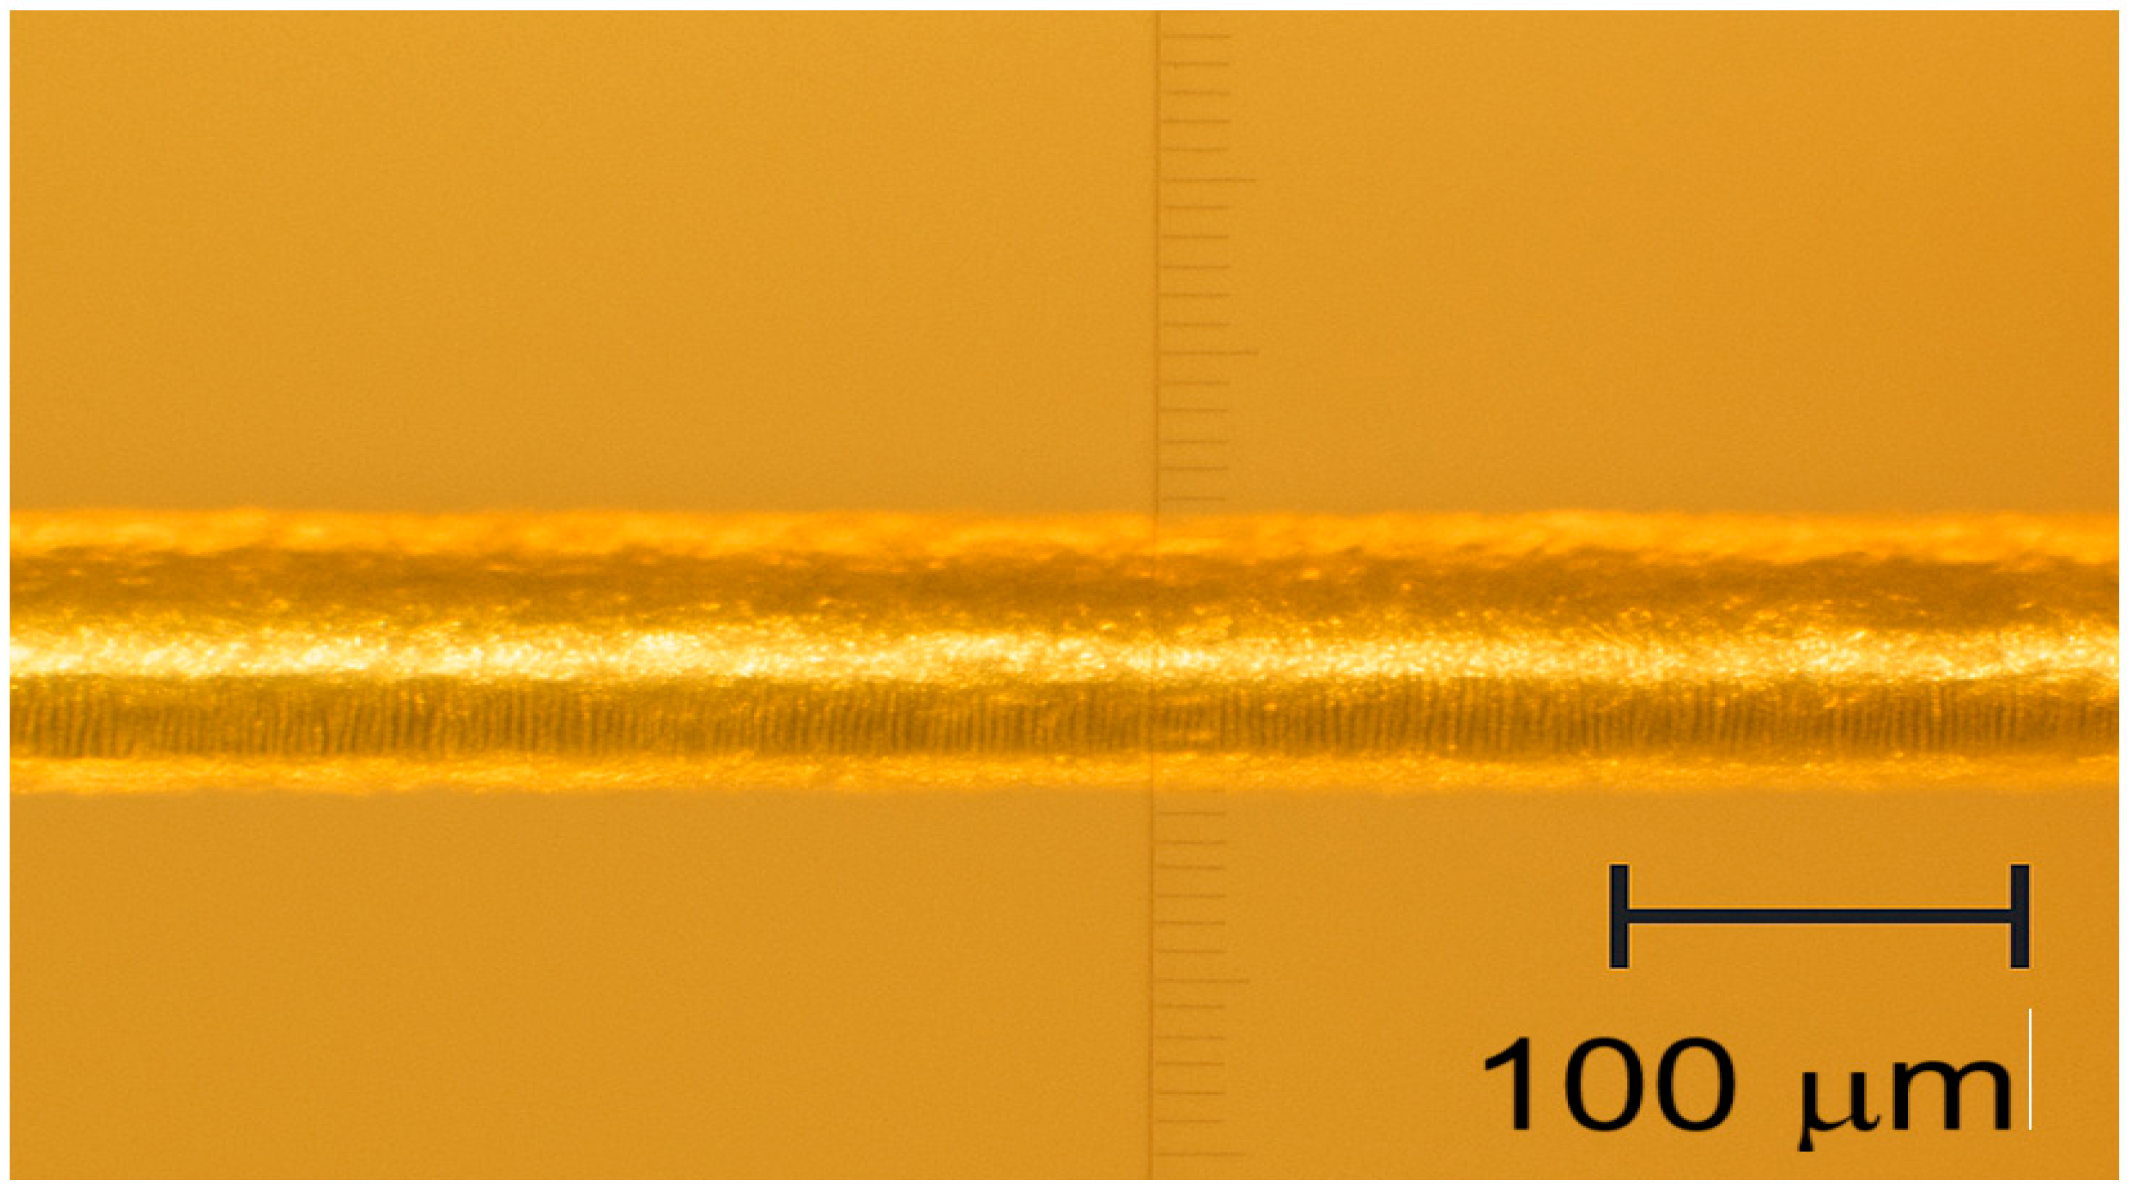
Figure 8 illustrates the final results of the newly adjusted ablation settings. Notably, the insights gained through ANOVA provide a clearer understanding of the process, which can significantly enhance the efficiency and speed of future operations.
6. Conclusions
This study provides a comprehensive statistical analysis of the factors influencing the surface roughness in laser-based machining processes, with a particular focus on the scanning speed, number of loops, and X-direction line spacing. Using two-way ANOVA, the effects of both individual parameters and their interactions were examined to better understand their impact on surface finish and tensile strength.
The main findings are as follows:
Main Effects
- ○
The scanning speed and number of loops significantly affected the surface roughness.
- ○
Higher speeds generally led to smoother surfaces.
- ○
The number of loops showed a stronger influence at lower speeds due to the extended exposure and thermal buildup.
- ○
The line distance in the X-direction had a less significant effect on its own but became important when combined with other factors.
Interaction Effects
- ○
Speed × Loops: The influence of loop count on roughness was more pronounced at lower speeds, where a longer exposure time led to heat accumulation. At higher speeds, this effect was diminished due to the limited thermal buildup.
- ○
Speed × Line Distance X: Tighter spacing (2 µm) improved the surface finish at lower speeds, but this advantage diminished at higher speeds, where thermal management was less dependent on spacing.
- ○
Loops × Line Distance X: At higher loop counts, the effect of line spacing decreased as the thermal effects from repeated passes dominated the surface quality.
These findings underscore the importance of evaluating both the main effects and interactions when analyzing laser machining outcomes. The complex interplay between speed, loop count, and line distance suggests that optimal parameters cannot be determined by analyzing the factors in isolation.
This study demonstrates how statistical methods, specifically ANOVA, can be effectively used to validate and expand experimental observations. The identification of both the main effects and interaction terms provides valuable insights for optimizing laser process parameters and guiding future research in precision surface engineering.
Author Contributions
Conceptualization, D.R. and G.C.; methodology, G.C.; software, D.R.; validation, S.N.; formal analysis, D.R.; investigation, D.R.; resources, G.C.; data curation, D.R.; writing—original draft preparation, D.R.; writing—review and editing, S.N.; visualization, D.R.; supervision, S.N.; project administration, D.R.; funding acquisition, G.C. All authors have read and agreed to the published version of the manuscript.
Funding
This research was funded by Dynatherm, Montreal, Canada, through a Mitacs research grant (Project ID: IT38184). The APC was also covered under the same Mitacs project. This project was conducted under the supervision of Graziano Chila.
Data Availability Statement
The data presented in this study are not publicly available due to privacy or institutional restrictions.
Conflicts of Interest
Graziano Chila is employed by the company (Dynatherm Inc.), declares no conflicts of interest. All authors declare no conflict of interest. All research activities and project funding were transparently conducted under the Mitacs-funded collaboration with Dynatherm, Montreal, Canada.
References
- Takada, N.; Fujikawa, A.; Koshizaki, N. Effect of ultrasonic wave on the syntheses of Au and ZnO nanoparticles by laser ablation in water. Appl. Phys. A 2013, 110, 835–839. [Google Scholar] [CrossRef]
- Wang, X.; Zhang, L. Influence of Laser Parameters on Surface Quality in Laser Processing of Metals. J. Mater. Process. Technol. 2020, 275, 116400. [Google Scholar] [CrossRef]
- Rahnama, D.; Chila, G.; Narayanswamy, S. A Feasibility Study on UV Nanosecond Laser Ablation Removal of Polyamide Insulation from Platinum Micro-wires. J. Manuf. Mater. Process. 2025; under review. [Google Scholar]
- Xu, J.; Zhang, G.; Rong, Y.; Huang, Y. Study on the ultraviolet nanosecond laser ablation and heat-affected zone of polydimethylsiloxane films based on comprehensive surface analysis. Opt. Laser Technol. 2023, 167, 109769. [Google Scholar] [CrossRef]
- İplikçi, H.; Barisik, M.; Türkdoğan, C.; İriş, M.E. Effects of nanosecond laser ablation parameters on surface modification of carbon fiber reinforced polymer composites. J. Compos. Mater. 2023, 57, 2843–2855. [Google Scholar] [CrossRef]
- Bonse, J.; Krüger, J.; Hohm, S.; Rosenfeld, A. Femtosecond laser-induced periodic surface structures. J. Laser Appl. 2012, 24, 042006. [Google Scholar] [CrossRef]
- Zhu, W.; Liu, H.; Li, Z. The Effect of Overlapping on Laser Ablation of Metals: A Numerical Study. Appl. Surf. Sci. 2017, 392, 453–461. [Google Scholar]
- Kazakevich, P.V.; Simakin, A.V.; Shafeev, G.A. Formation of periodic structures by laser ablation of metals in liquids. Appl. Surf. Sci. 2006, 252, 4457–4461. [Google Scholar] [CrossRef]
- Choo, K.L.; Ogawa, Y.; Kanbargi, G.; Otra, V.; Raff, L.M.; Komanduri, R. Micromachining of silicon by short-pulse laser ablation in air and under water, Mater. Sci. Eng. A 2004, 372, 145–162. [Google Scholar] [CrossRef]
- Kruusing, A. Underwater and water-assisted laser processing: Part 1—General features, steam cleaning and shock processing. Opt. Lasers Eng. 2004, 41, 307–327. [Google Scholar] [CrossRef]
- Cui, J.; Fang, X.; Dong, X.; Mei, X.; Xu, K.; Fan, Z.; Sun, Z.; Wang, W. Fabrication of PCD Skiving Cutter by UV Nanosecond Laser. Materials 2021, 14, 4027. [Google Scholar] [CrossRef] [PubMed]
- Kekana, N.; Shongwe, M.B.; Mpofu, K.; Muvunzi, R. Investigation into Process Parameter Optimization of Selective Laser Melting for Producing AlSi12 Parts Using ANOVA. Appl. Sci. 2024, 14, 6519. [Google Scholar] [CrossRef]
- Zhang, X.; Zhan, Z.; Liu, H.; Zhao, H.; Xie, S.; Ye, Q. Influence of Water Layer Thickness on Hard Tissue Ablation with Pulsed CO2 Laser. J. Biomed. Opt. 2024, 17, 038003. [Google Scholar]
- Garcia-Lechuga, M.; Grojo, D. Simple and robust method for determination of laser fluence thresholds for material modifications: An extension of Liu’s approach to imperfect beams [Version 2]. Open Res. Eur. 2021, 1, 7. [Google Scholar] [CrossRef] [PubMed]
- Özbey, S.; Tıkız, İ. ANOVA-Based Analysis of Laser Cutting Parameter Effects on ST52 Steel. In Proceedings of the 4th International Conference on Frontiers in Academic Research, Konya, Turkey, 13–14 December 2024; pp. 382–386. [Google Scholar]
Figure 1.
UV laser principal diagram [
11].
Figure 1.
UV laser principal diagram [
11].
Figure 2.
(A) Laser scan speed of 1500 mm/s, line distance of 10 μm, and three loops. (B) Laser scan speed 1500 mm/s, line distance 2 μm with two loops. (C) Laser scan speed: 2000 mm/s, line distance: 2 μm with two loops. (D) Laser scan speed of 2000 mm/s, line distance of 10 μm with three loops. (E) Laser scan speed of 1200 mm/s, line distance of 2 μm, and two loops.
Figure 3.
Tensile strength results in confined adjustments.
Figure 3.
Tensile strength results in confined adjustments.
Figure 4.
Roughness results from confined adjustment.
Figure 4.
Roughness results from confined adjustment.
Figure 5.
Sample ablated under 1200 mm/s, 2 µm line distance X combined with two loops, under Lext 5000 confocal machine.
Figure 5.
Sample ablated under 1200 mm/s, 2 µm line distance X combined with two loops, under Lext 5000 confocal machine.
Figure 6.
ANOVA plot for the interaction effects of tensile strength.
Figure 6.
ANOVA plot for the interaction effects of tensile strength.
Figure 7.
ANOVA plot for the interaction effects of average roughness.
Figure 7.
ANOVA plot for the interaction effects of average roughness.
Figure 8.
Ablated wire with a speed of 1200 mm/s-2 μm under an on-site microscope (Nikon Nomarski 20X, Nikon Corporation, Tokyo, Japan).
Figure 8.
Ablated wire with a speed of 1200 mm/s-2 μm under an on-site microscope (Nikon Nomarski 20X, Nikon Corporation, Tokyo, Japan).
Table 1.
Adjustment of laser machine for experiment in water.
Table 1.
Adjustment of laser machine for experiment in water.
| Sample | Speed (mm/s) | Line Distance X (µm) | Line Spacing Y (µm) | Overlap (%) | Number of Loops |
|---|
| 1 | 1200 | 2 | 60 | 95.55 | 2 |
| 2 | 1200 | 10 | 60 | 77.77 | 3 |
| 3 | 1500 | 2 | 75 | 95.55 | 2 |
| 4 | 1500 | 10 | 75 | 77.77 | 3 |
| 5 | 2000 | 2 | 100 | 95.55 | 2 |
| 6 | 2000 | 10 | 100 | 77.77 | 3 |
Table 2.
Results of each adjustment for the three samples.
Table 2.
Results of each adjustment for the three samples.
| Sample | Overlap X (%) | Line Distance X (µm) | Line Distance Y (µm) | Speed mm/s | Number of Loops | Tensile Strength (g/force) | Roughness (µm) |
|---|
| 1 | 95.55 | 2 | 60 | 1200 | 2 | 105.5 | 0.126 |
| 2 | 95.55 | 2 | 60 | 1200 | 2 | 102 | 0.134 |
| 3 | 95.55 | 2 | 60 | 1200 | 2 | 104.8 | 0.123 |
| 4 | 77.77 | 10 | 60 | 1200 | 3 | 112.3 | 0.179 |
| 5 | 77.77 | 10 | 60 | 1200 | 3 | 114.6 | 0.192 |
| 6 | 77.77 | 1o | 60 | 1200 | 3 | 110.8 | 0.186 |
| 7 | 95.55 | 2 | 75 | 1500 | 2 | 108.8 | 0.138 |
| 8 | 95.55 | 2 | 75 | 1500 | 2 | 106 | 0.145 |
| 9 | 95.55 | 2 | 75 | 1500 | 2 | 111.2 | 0.131 |
| 10 | 77.77 | 10 | 75 | 1500 | 3 | 112 | 0.201 |
| 11 | 77.77 | 10 | 75 | 1500 | 3 | 115.7 | 0.195 |
| 12 | 77.77 | 10 | 75 | 1500 | 3 | 113.5 | 0.194 |
| 13 | 95.55 | 2 | 100 | 2000 | 2 | 113.9 | 0.191 |
| 14 | 95.55 | 2 | 100 | 2000 | 2 | 112.8 | 0.197 |
| 15 | 95.55 | 2 | 100 | 2000 | 2 | 115.5 | 0.186 |
| 16 | 77.77 | 10 | 100 | 2000 | 3 | 118.7 | 0.218 |
| 17 | 77.77 | 10 | 100 | 2000 | 3 | 114.3 | 0.197 |
| 18 | 77.77 | 10 | 100 | 2000 | 3 | 115.7 | 0.214 |
Table 3.
Summary of all samples with mean values and standard deviations.
Table 3.
Summary of all samples with mean values and standard deviations.
| Speed (mm/s) | Line Distance X (µm) | Line Distance Y (µm) | Number of Loops | Mean Tensile (gf) | Std Tensile | Mean Roughness (µm) | Std Roughness |
|---|
| 1200.0 | 2.0 | 60.0 | 2.0 | 104.1 | 1.85 | 0.13 | 0.006 |
| 1200.0 | 10.0 | 60.0 | 3.0 | 112.57 | 1.91 | 0.19 | 0.007 |
| 1500.0 | 2.0 | 75.0 | 2.0 | 108.67 | 2.6 | 0.14 | 0.007 |
| 1500.0 | 10.0 | 75.0 | 3.0 | 113.73 | 1.86 | 0.2 | 0.004 |
| 2000.0 | 2.0 | 100.0 | 2.0 | 114.07 | 1.36 | 0.19 | 0.006 |
| 2000.0 | 10.0 | 100.0 | 3.0 | 116.23 | 2.25 | 0.21 | 0.011 |
Table 4.
ANOVA values for main effects of tensile strength.
Table 4.
ANOVA values for main effects of tensile strength.
| Source | Sum of Squares | Degree of Freedom | F-Value | p-Value |
|---|
| Speed | 140.57 | 2 | 12.57 | 0.00075 |
| Line Distance X | 123.25 | 1 | 22.04 | 0.00035 |
| Number of Loops | 123.25 | 1 | 22.04 | 0.00035 |
| Lack of fit | 29.83 | 2 | 3.69 | 0.0562 |
| Pure Error | | 12 | - | - |
| Residual (Error) | 78.28 | 14 | - | - |
Table 5.
ANOVA values for the main effects of Surface Roughness.
Table 5.
ANOVA values for the main effects of Surface Roughness.
| Source | Sum of Squares | Degree of Freedom | F-Value | p-Value |
|---|
| Speed | 0.00627 | 2 | 20.08 | 0.000077 |
| Line Distance X | 0.00911 | 1 | 58.37 | 0.000002 |
| Number of Loops | 0.00911 | 1 | 58.37 | 0.000002 |
| Lack of Fit | 0.00160 | 2 | 16.45 | 0.00036 |
| Pure Error | 0.00059 | 12 | - | - |
| Residual (Error) | 0.00219 | 14 | - | - |
Table 6.
ANOVA values for the interaction effects of tensile strength.
Table 6.
ANOVA values for the interaction effects of tensile strength.
| Source of Variation | Sum of Squares | Degree of Freedom | F-Value | p-Value |
|---|
| Speed × Loops | 29.83 | 2 | 3.69 | 0.0562 |
| Speed × Line Distance X | 29.83 | 2 | 3.69 | 0.0562 |
| Loops × Line Distance X | 107.53 | 1 | 26.63 | 0.0002 |
| Residual | 48.45 | 12 | - | - |
Table 7.
ANOVA values for the interaction effects of surface roughness.
Table 7.
ANOVA values for the interaction effects of surface roughness.
| Source of Variation | Sum of Squares | Degree of Freedom | F-Value | p-Value |
|---|
| Speed × Loops | 0.00160 | 2 | 16.404 | 0.00037 |
| Speed × Line Distance X | 0.00160 | 2 | 16.404 | 0.00037 |
| Loops × Line Distance X | 0.00505 | 1 | 103.44875 | 0.0000 |
| Residual | 0.00059 | 12 | - | - |
| Disclaimer/Publisher’s Note: The statements, opinions and data contained in all publications are solely those of the individual author(s) and contributor(s) and not of MDPI and/or the editor(s). MDPI and/or the editor(s) disclaim responsibility for any injury to people or property resulting from any ideas, methods, instructions or products referred to in the content. |
© 2025 by the authors. Licensee MDPI, Basel, Switzerland. This article is an open access article distributed under the terms and conditions of the Creative Commons Attribution (CC BY) license (https://creativecommons.org/licenses/by/4.0/).


