1. Introduction
The rise of service-oriented economies has dramatically transformed how organisations approach operational excellence, making it more critical than ever to manage both tangible and intangible processes efficiently. While Lean thinking, originally rooted in manufacturing, has demonstrated its value in optimising production, its adaptation to service-based industries—known as “Lean Services”—is still relatively new and lacks a clear, universally accepted framework [
1]. This lack of clarity makes it challenging to effectively translate Lean’s waste reduction principles into service settings, where processes are often less visible and harder to measure. As service industries like healthcare, finance, and retail continue to adopt Lean practices, there is growing evidence of their significant impact on efficiency, costs, and customer satisfaction. Studies highlight improvements ranging from 20% to 40% in operational efficiency through waste elimination and process optimisation [
2]. For example, in healthcare, Lean practices have led to a 30% reduction in patient wait times and a 25% increase in procedural accuracy [
3], while financial services have achieved 18% operational cost savings through tools like Value Stream Mapping and DMAIC [
4]. Similarly, retail industries report up to a 20% improvement in service delivery times, demonstrating the broad applicability and measurable benefits of Lean Services across sectors [
5].
Despite these successes, existing research on Lean Services highlights several critical gaps that constrain its systematic application [
6,
7]. Chief among these is the absence of a standardised classification of waste specific to service processes, which leads to inconsistencies in identifying and addressing inefficiencies. Furthermore, there is limited comparative analysis of different Lean methodologies when applied to service contexts, making it difficult for practitioners to select the most suitable approach. Lastly, while Lean principles are well established in manufacturing, their applicability in service settings remains underexplored, particularly in terms of economic feasibility and long-term sustainability.
To address these shortcomings, this study pursues two main objectives: (1) to develop a structured classification of service-specific wastes by integrating insights from both the literature and empirical observation and (2) to evaluate the applicability and effectiveness of two prominent Lean methodologies—DMAIC from Six Sigma and Cost Deployment from World Class Manufacturing (WCM)—within a service-oriented environment. Rather than attempting to determine which method is inherently superior, we clarify the organisational conditions under which each approach is most effective, particularly whether the underlying problem is isolated or systemic. This perspective provides decision-makers with an operational framework to select the methodology that best aligns with their organisation’s context, objectives, and resource constraints.
By focusing on a dichotomous choice between DMAIC and Cost Deployment, our research addresses a noteworthy gap in the existing literature, where most studies do not explicitly link the chosen methodology to the specific industrial challenge at hand. Accordingly, this study is characterised by its strongly empirical orientation, as opposed to a purely theoretical or deterministic model. Instead of presenting results through narrow technical criteria, we highlight key analytical factors—especially whether a given problem is more localised or more systemic—that guide the methodology selection. By integrating real-world evidence with methodological rigour, our approach bridges the gap between theory and practice, offering concrete decision-making guidance for organisations seeking to adapt Lean principles to service-based processes. Ultimately, this shift in focus—from identifying a single “best” method to ensuring that Lean Service methods are suitably chosen—enables more impactful, scalable, and sustainable improvements in today’s service-driven economy.
2. Materials and Methods
This study employs a hybrid research approach that integrates a literature review and an empirical case study to address the research gaps identified in
Section 1. The research follows a two-phase structure:
Literature Review Phase—This phase identifies and classifies service-specific wastes through a comprehensive analysis of existing literature. The classification serves as a foundation for the empirical phase.
Research Design—A case study methodology is applied to evaluate the effectiveness of two Lean methodologies, DMAIC (Six Sigma) and Cost Deployment (World Class Manufacturing, WCM), within a European scooter and motorcycle manufacturer.
2.1. Lean Service
The concept of “Lean” has been defined in various ways by scholars and practitioners. Some emphasise its role in customer-centric management, while others view it primarily as a methodology for waste reduction and process efficiency. Due to this diversity of interpretations, Lean is often perceived as a set of tools rather than a cohesive management philosophy. However, a more precise definition recognises Lean as an integrated system of management practices aimed at eliminating waste and fostering continuous improvement [
1]. Over the years, Lean has evolved beyond its manufacturing origins, becoming a versatile management model applicable to multiple sectors and processes.
The roots of Lean can be traced back to the Toyota Production System (TPS), which was developed in the mid-20th century and formally articulated by Taiichi Ohno and Shigeo Shingo. TPS is founded on two fundamental pillars: Monozukuri (the art of making things efficiently) and Hitozukuri (the development of people). Hitozukuri, in particular, is critical for ensuring that Lean is not just a set of tools but a deeply embedded philosophy that prioritises workforce development and engagement [
8,
9]. This principle is reflected in the case study discussed later in this paper, where training programs and structured learning initiatives played a crucial role in the successful implementation of Lean Service methodologies.
The application of Lean principles to service industries is relatively recent. Theodore Levitt was among the first to propose, as early as 1972, that the discipline and rigour of manufacturing processes could also improve service management. However, the first explicit references to “Lean Service” appeared in 1998, when Bowen and Youngdahl formally introduced the term [
10]. Since then, research on Lean Service has expanded significantly, particularly from 2010 onwards, highlighting the increasing relevance of Lean methodologies in non-manufacturing contexts. Geographically, the bulk of Lean Service research originates from the UK, USA, and India. At the same time, German contributions remain comparatively limited despite Germany being one of the most Lean-oriented economies in Europe [
11].
A key distinction between TPS and hybrid Lean methodologies, such as DMAIC (Six Sigma) and Cost Deployment (WCM), lies in their prioritisation of objectives. TPS places “safety” as the highest criterion for customer satisfaction, with cost savings being a secondary byproduct of process efficiency. In contrast, the hybrid Lean system analysed in this study emphasises economic feasibility and cost reduction without explicitly incorporating safety as a primary metric for customer satisfaction. This deviation from TPS principles presents a significant conceptual challenge. The reason for this departure is largely contextual: The case study focuses on a data collection process, where cost and efficiency were the primary concerns, rather than physical operational safety. However, future applications of Lean Service should consider integrating safety as a core component, particularly in industries where service quality is directly linked to risk management and regulatory compliance.
Another fundamental aspect of TPS is its problem-solving framework, which is built around the PDCA (Plan-Do-Check-Act) cycle and the eight-step problem-solving method. These methodologies enable continuous, incremental improvements, a principle known as Kaizen. While DMAIC also follows a structured improvement cycle, it differs from PDCA in that it relies heavily on statistical analysis and data-driven decision-making, rather than iterative problem-solving rooted in frontline worker engagement. This distinction is critical, as the success of any Lean implementation depends not only on the tools used but also on the underlying mindset and philosophy of continuous improvement [
12]. Without a strong foundation in Lean principles such as Hitozukuri and PDCA, applying Lean tools can lead to inefficiencies rather than enhancements. This is particularly relevant in Lean Service contexts, where processes are intangible and more susceptible to misinterpretation of Lean methodologies. Misapplying Lean in a service environment could result in an excessive focus on cost-cutting at the expense of long-term quality and customer satisfaction [
9]. Therefore, this study emphasises the importance of employee training, structured mentorship, and cross-functional learning to ensure that Lean Service is internalised as a philosophy rather than merely a set of tools.
By acknowledging these critical distinctions between TPS-based Lean and hybrid Lean methodologies, this study contributes to a deeper understanding of Lean Service implementation. Future research should explore integrated models that combine TPS principles, such as Hitozukuri, PDCA, and Kaizen, with structured analytical methodologies like DMAIC and Cost Deployment to optimise both short-term efficiency and long-term sustainability.
Service-Specific Waste Classification
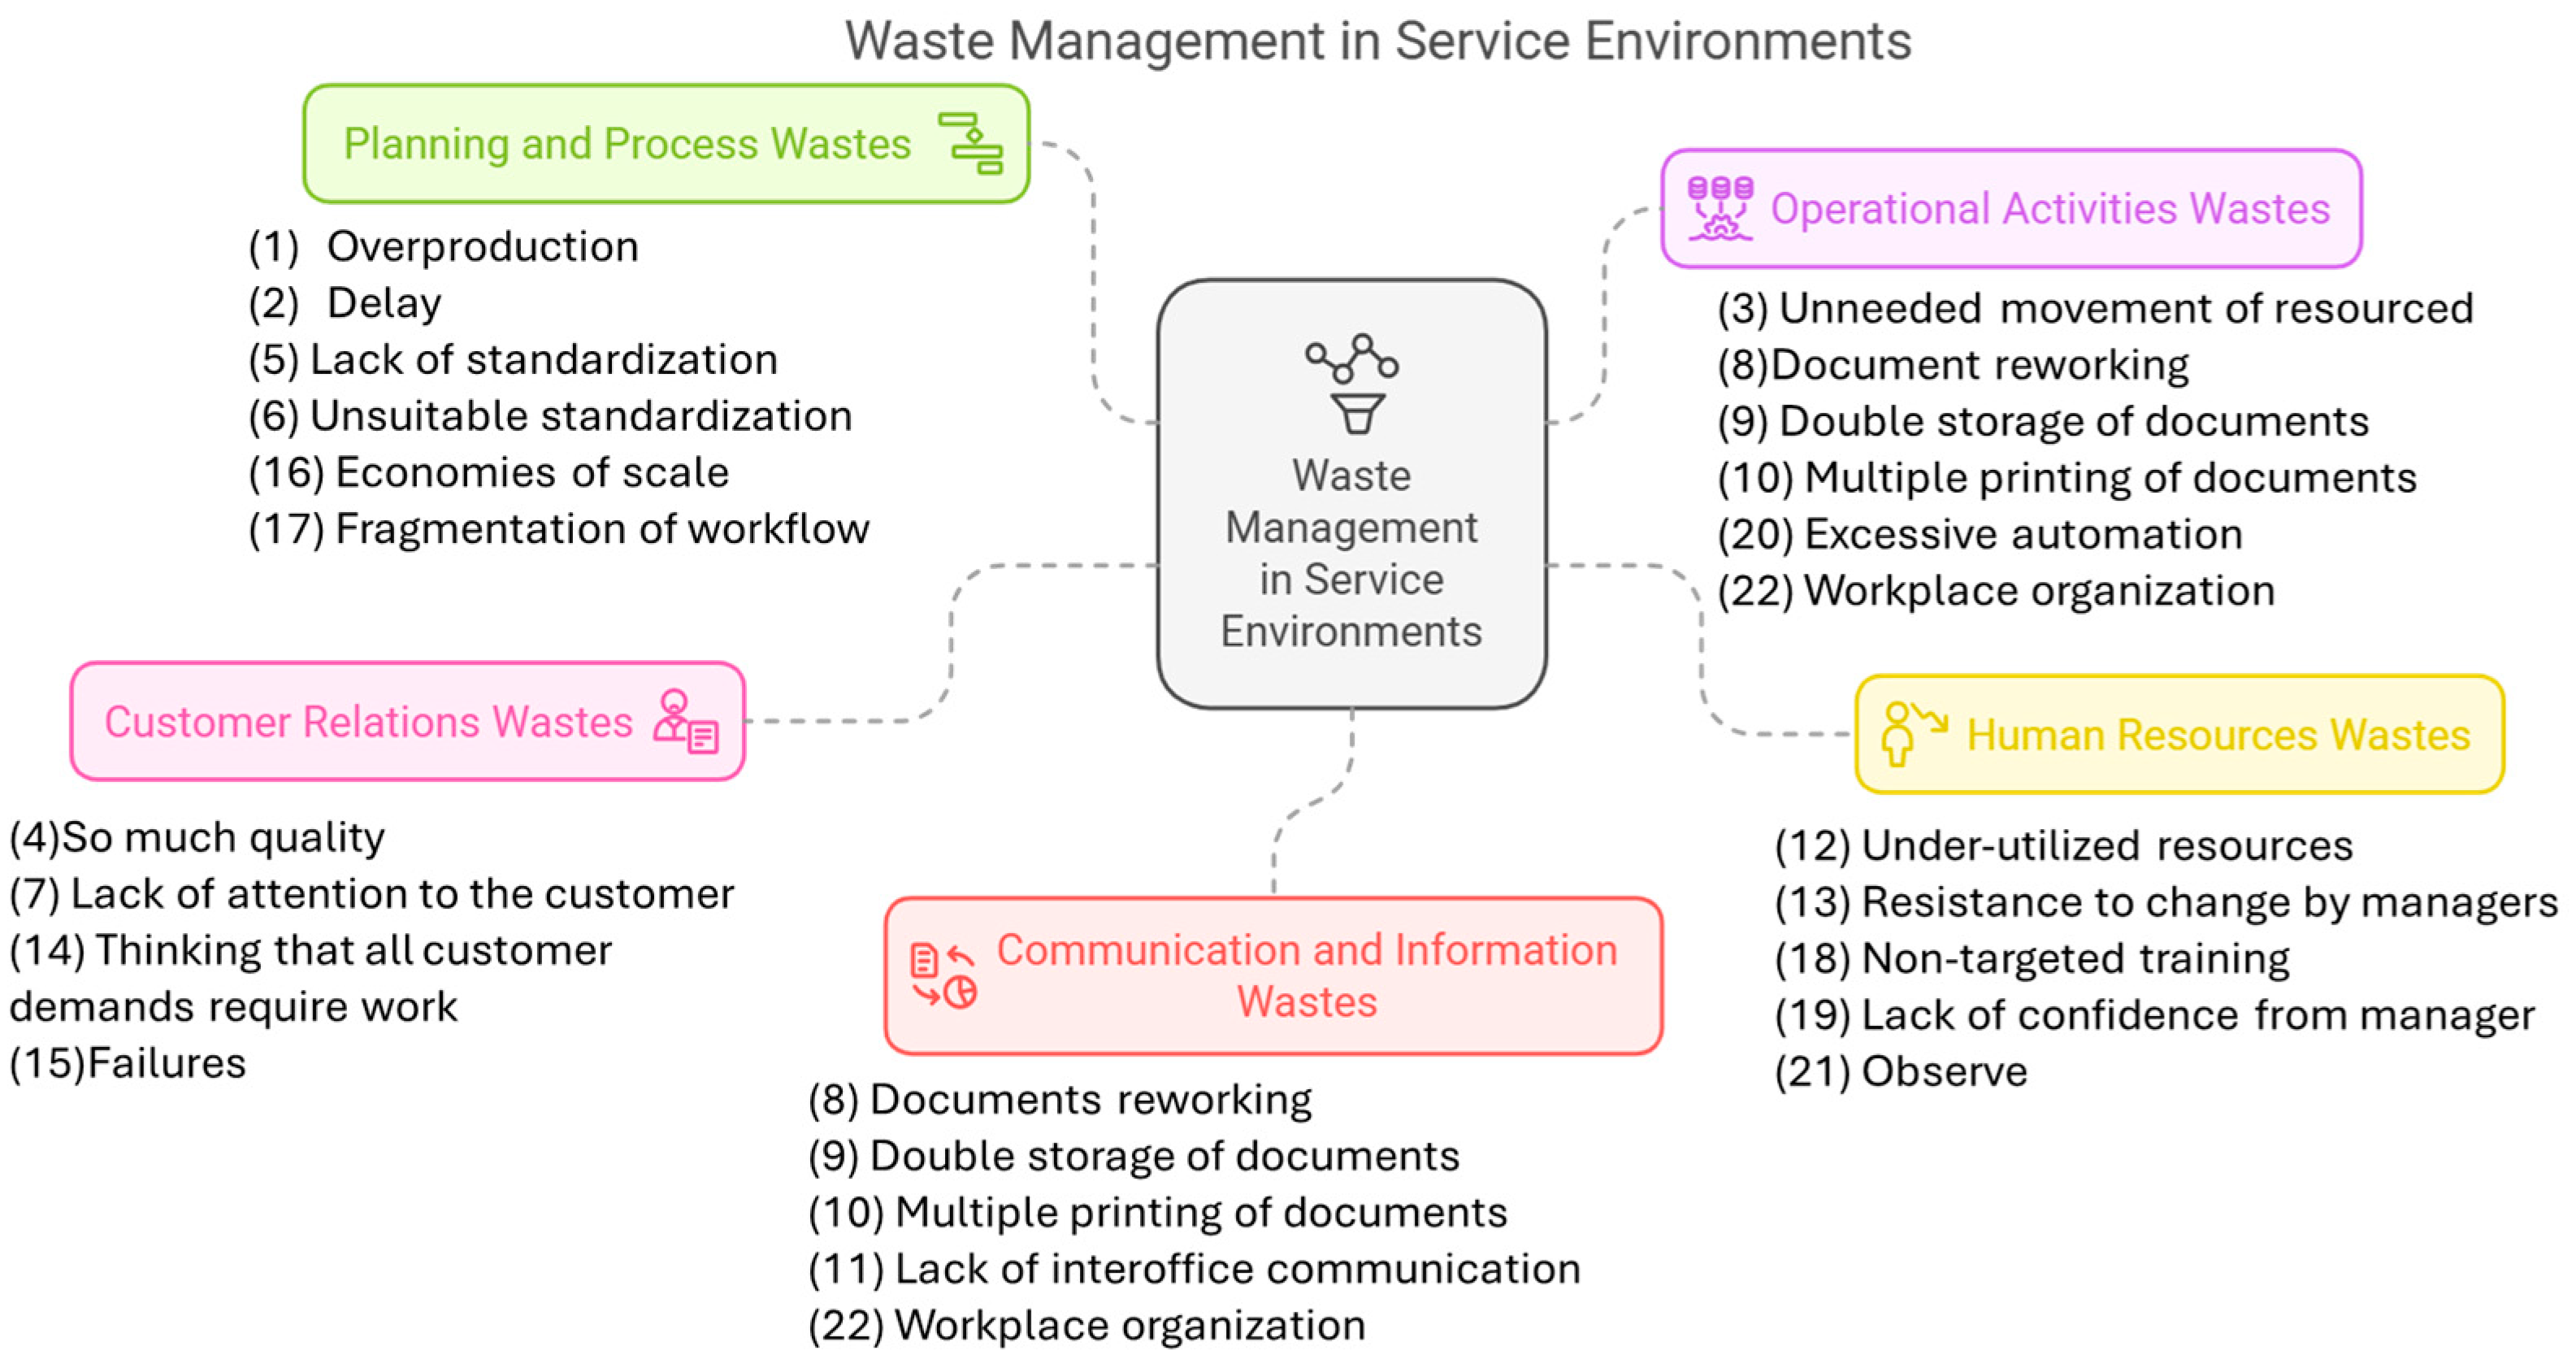
The identification of wastes in services can be complex, considering that the activities are intangible. Some wastes can be identified as deriving directly from those observed in production, while others are specific to services. The list below was compiled by combining bibliographic research with observations from the case study, which will be described later.
As a result, the first contribution of this work lies in a classification of the literature to identify and categorise the main wastes related to lean service. Specifically, 22 types of waste have been identified and grouped into 5 macro-categories (Planning and Process Wastes, Operational Activities Wastes, Customer Relations Wastes, Communication and Information Wastes, and Human Resources Wastes), which are described and illustrated in
Figure 1.
Overproduction: Performing more work or completing a service earlier than necessary, often caused by poor planning, leading to wasted time and resources [
7,
13].
Delay: Delays occur when employees receive work instructions late or when customer requirements remain unresolved longer than necessary, impacting efficiency [
7,
14].
Unneeded movement of resource: This waste arises from excessive movement of people or resources, often due to inefficient layouts or poor process organisation, such as long distances between workstations [
7].
So much quality: Delivering a level of service exceeding customer expectations or needs, often driven by excessive bureaucracy, adds unnecessary costs without added value [
7].
Lack of standardisation: The absence of consistent procedures, updated formats, or standard service delivery times creates variability and inefficiencies [
7,
15].
Unsuitable standardisation: Standardised processes that are too rigid fail to accommodate diverse customer requirements, leading to inefficiencies in customised services [
10].
Lack of attention to the customer: Errors, incomplete work, or missed opportunities arise from poor communication or insufficient alignment with customer needs, similar to defects in production [
7].
Document reworking: Reworking documents to correct errors or missing information wastes time and resources and delays processes.
Double storage of documents: Archiving the same document in both digital and physical formats results in unnecessary duplication of effort and resource consumption.
Multiple printing documents: Print documents multiple times for distribution or archiving waste materials and time.
Lack of interoffice communication: Inefficient communication between departments leads to employees spending excessive time obtaining necessary information [
16,
17].
Underutilised resources: Employees’ skills, abilities, and knowledge are not fully leveraged, resulting in untapped potential and limited responsibility for capable individuals [
7].
Managers’ resistance to change: Managers’ resistance to embracing innovation or change restricts team involvement and hinders continuous improvement initiatives [
7].
Think that all customer demand involves some work: Inefficient filtering of customer demands leads to unnecessary activities that do not add value [
10].
Failures: Unresolved issues or incomplete services lead to customer dissatisfaction but also present opportunities for continuous improvement [
10].
Economies of scale: Misaligned with the “pull” logic of services, overestimating demand results in unused services and the need for promotions to recoup losses [
18].
Fragmentation of workflow: Excessive task division to control or reduce training costs often causes coordination problems and increased errors [
10].
Non-targeted training: Employees lacking the appropriate training must seek answers elsewhere, wasting time and reducing the effectiveness of training investments [
10,
19].
Lack of confidence from managers: Micromanagement and excessive inspections due to mistrust in employees cause inefficiencies and delays [
16].
Excessive automation: Over-reliance on automation can lead to issues such as system crashes or reduced flexibility, diminishing efficiency despite its potential benefits [
16].
Observe: Employees relying on observing others for solutions due to insufficient or outdated training leads to wasted time and underutilised training investments.
Workplace organisation: Poorly organised physical or digital workspaces cause employees to spend excessive time searching for tools, files, or information.
2.2. Research Design
Following the classification of the primary wastes in Lean Service, the second contribution of this work lies in implementing Lean Service principles within a case study and applying methodologies that have been used in production and manufacturing contexts: DMAIC and Cost Deployment. This study aims to evaluate their application and impact within the context of services, with a particular focus on improving the quality data collection process. The objective is to analyse how these methodologies, which have demonstrated effectiveness in other domains, can enhance efficiency, accuracy, and overall contribution to product quality and customer satisfaction.
Research Strategy
This study employs a comparative case study methodology to analyse the practical implications of Lean Service techniques. The rationale for selecting a case study approach is that it can provide both qualitative and quantitative insights into the application of Lean methodologies in real-world service environments.
A structured two-phase research framework was designed:
Literature Review: The first phase consists of an extensive literature review to establish a standardised classification of Lean Service waste types. This step builds the theoretical foundation for the study.
Empirical Research: A case study at a European scooter and motorcycle manufacturer evaluates the effectiveness of two Lean methodologies—DMAIC and Cost Deployment—in optimising a service-based process.
The selection of DMAIC and Cost Deployment is justified based on their distinct yet complementary strengths:
- -
DMAIC is a problem-focused methodology that provides a structured, data-driven approach for identifying and eliminating inefficiencies. By systematically defining, measuring, analysing, improving, and controlling processes, DMAIC enhances process efficiency and quality.
- -
Cost Deployment takes a holistic view of Lean improvements, prioritising economic feasibility and systemic waste reduction. It enables organisations to identify cost-related inefficiencies and align Lean improvements with financial performance objectives.
By applying both methodologies within the same organisational context, this study offers a direct comparative analysis of their effectiveness in addressing inefficiencies within service-based processes. This dual-method approach ensures that quantitative performance metrics and broader economic impacts are considered, providing a comprehensive understanding of Lean Service optimisation.
3. Case Study Introduction
The case study was conducted with a leading European scooter and motorcycle manufacturer, focusing on quality data collection and defect analysis within the commercial vehicles division. Due to confidentiality reasons, the company’s name has been omitted. The company operates globally, with production facilities in Italy, Vietnam, India, China, Indonesia, and the United States. It manufactures millions of units annually and serves a diverse customer base.
Before Lean implementation, the company’s data collection process was inefficient and prone to errors. Employees manually transferred information from end-of-line test reports into a digital system. This method had significant limitations:
It covered only a small sample of vehicles, leaving large portions of production unaccounted for.
- -
It was time-consuming and tedious, delaying defect identification and correction.
- -
Manual transcription errors compromised data reliability, leading to outdated and inaccurate defect reports by the time management meetings occurred.
- -
The inefficiencies increased operational costs and impacted decision-making regarding quality improvement initiatives.
Recognising these challenges, the company initiated a dual-methodology approach, applying DMAIC (Six Sigma) and Cost Deployment (World Class Manufacturing, WCM) to improve the data collection system. A cross-functional team—including plant managers, department supervisors, and quality assurance personnel—was formed to identify pain points and implement targeted improvements. Key issues addressed included the following:
- -
Reducing transcription errors
- -
Minimising redundant data entry
- -
Enhancing process efficiency and data reliability
The case study evaluates the practical application of Lean Services. It demonstrates how Lean principles can be adapted to intangible service processes in manufacturing environments, driving operational improvements and ensuring better quality control.
3.1. Data Collection
This study was conducted with the plant manager and supervisors from the welding, painting, and assembly departments. Direct interviews were conducted with operators responsible for end-of-line vehicle testing to ensure a comprehensive understanding of the process. These interactions facilitated the collection of detailed data on time consumption, error frequency, and operational costs associated with the manual data collection system. Additional insights were obtained through process quality meetings, where key performance indicators were discussed and analysed.
3.2. Data Analysis
The case study was implemented using two distinct methodologies—DMAIC and Cost Deployment—allowing for a comparative analysis of their effectiveness in a service-based Lean transformation. Data collected during the implementation of each method were systematically analysed to identify common trends, performance improvements, and methodological differences.
- -
DMAIC Analysis: Focused on measurable improvements in data processing time, defect identification accuracy, and cost reduction.
- -
Cost Deployment Analysis: Examined waste categorisation, economic feasibility, and resource allocation efficiency.
By applying both methodologies to the same process, this study provides direct comparative insights into their applicability in Lean Service contexts and their potential to drive sustainable improvements in data-driven decision-making within manufacturing service processes.
4. Results and Discussion
4.1. Case Analysis with Method 1: Six Sigma and DMAIC Cycle
The DMAIC (Define, Measure, Analyse, Improve, Control) methodology was applied to address inefficiencies in the quality data collection process for the Case Study under analysis. This structured approach was chosen for its proven effectiveness in systematically identifying the root causes of problems, developing data-driven solutions, and sustaining improvements. The following sections detail the implementation of each step of the DMAIC cycle within the case study.
4.1.1. Define
The first phase of the DMAIC methodology, Define, focuses on identifying the problem, understanding its scope, and establishing the objectives for improvement. A cross-functional team, including plant managers, supervisors, and quality assurance personnel, was assembled to ensure a holistic approach to problem-solving.
The primary issue identified was the inefficiency and inaccuracy of the existing quality data collection process. Defect data were manually transcribed from end-of-line test reports into a digital system, a process prone to transcription errors, delays, and limited sampling coverage. These inefficiencies impacted the timeliness and reliability of the defect data used during management meetings. To formalise the problem and identify key elements of the process, a SIPOC (Suppliers, Inputs, Process, Outputs, Customers) map was developed. The SIPOC diagram outlined the flow of information through the process, highlighting key inputs, outputs, and stakeholders. However, the leading utility of the SIPOC was to identify the critical parameters for improvement and define measurable objectives. The refined version of the SIPOC map is summarised in
Table 1.
The parameters defined for evaluating the project’s success were as follows:
Time: The time required to retrieve quality data for the current production process.
Cost: The cost associated with the resources utilised in data collection.
Quality of Data Collection: The percentage of collected data accurately reflects the actual defects in production.
Specific improvement targets were established as follows:
- -
A reduction in time and cost by 80%, as they are proportional.
- -
An improvement in the accuracy of defect data to ensure 95% compliance with actual production quality.
The Define phase provided a strong foundation for the subsequent stages of the DMAIC methodology by clearly defining the problem, setting measurable goals, and involving key stakeholders.
4.1.2. Measure
The Measure phase of the DMAIC methodology aims to collect data on the current process to establish a baseline for future comparisons. This step focuses on quantifying the inefficiencies of the existing system and identifying areas requiring improvement. The analysis revealed the following baseline metrics for the quality data collection process:
Time: The employee responsible for data collection spends 16 h over two full working days per session, repeating the process twice a month. This results in 32 h/month dedicated to manual data entry tasks.
Cost of Resources: The hourly employee collecting data costs 25 EUR/h. Based on the total monthly time expenditure, the cost amounts to 25 EUR/h × 32 h/month = 800 EUR/month.
Quality of Data: The accuracy of the collected data, defined as the percentage of defect data that corresponds to reality, was found to vary between 71% and 83%. This variability was determined based on the number of contested defects identified during process quality meetings.
These baseline metrics highlight the inefficiencies and challenges of the current process, including excessive time consumption, high labour costs, and variability in data accuracy. Establishing these benchmarks is essential for evaluating the impact of the improvements implemented in later phases.
4.1.3. Analyse
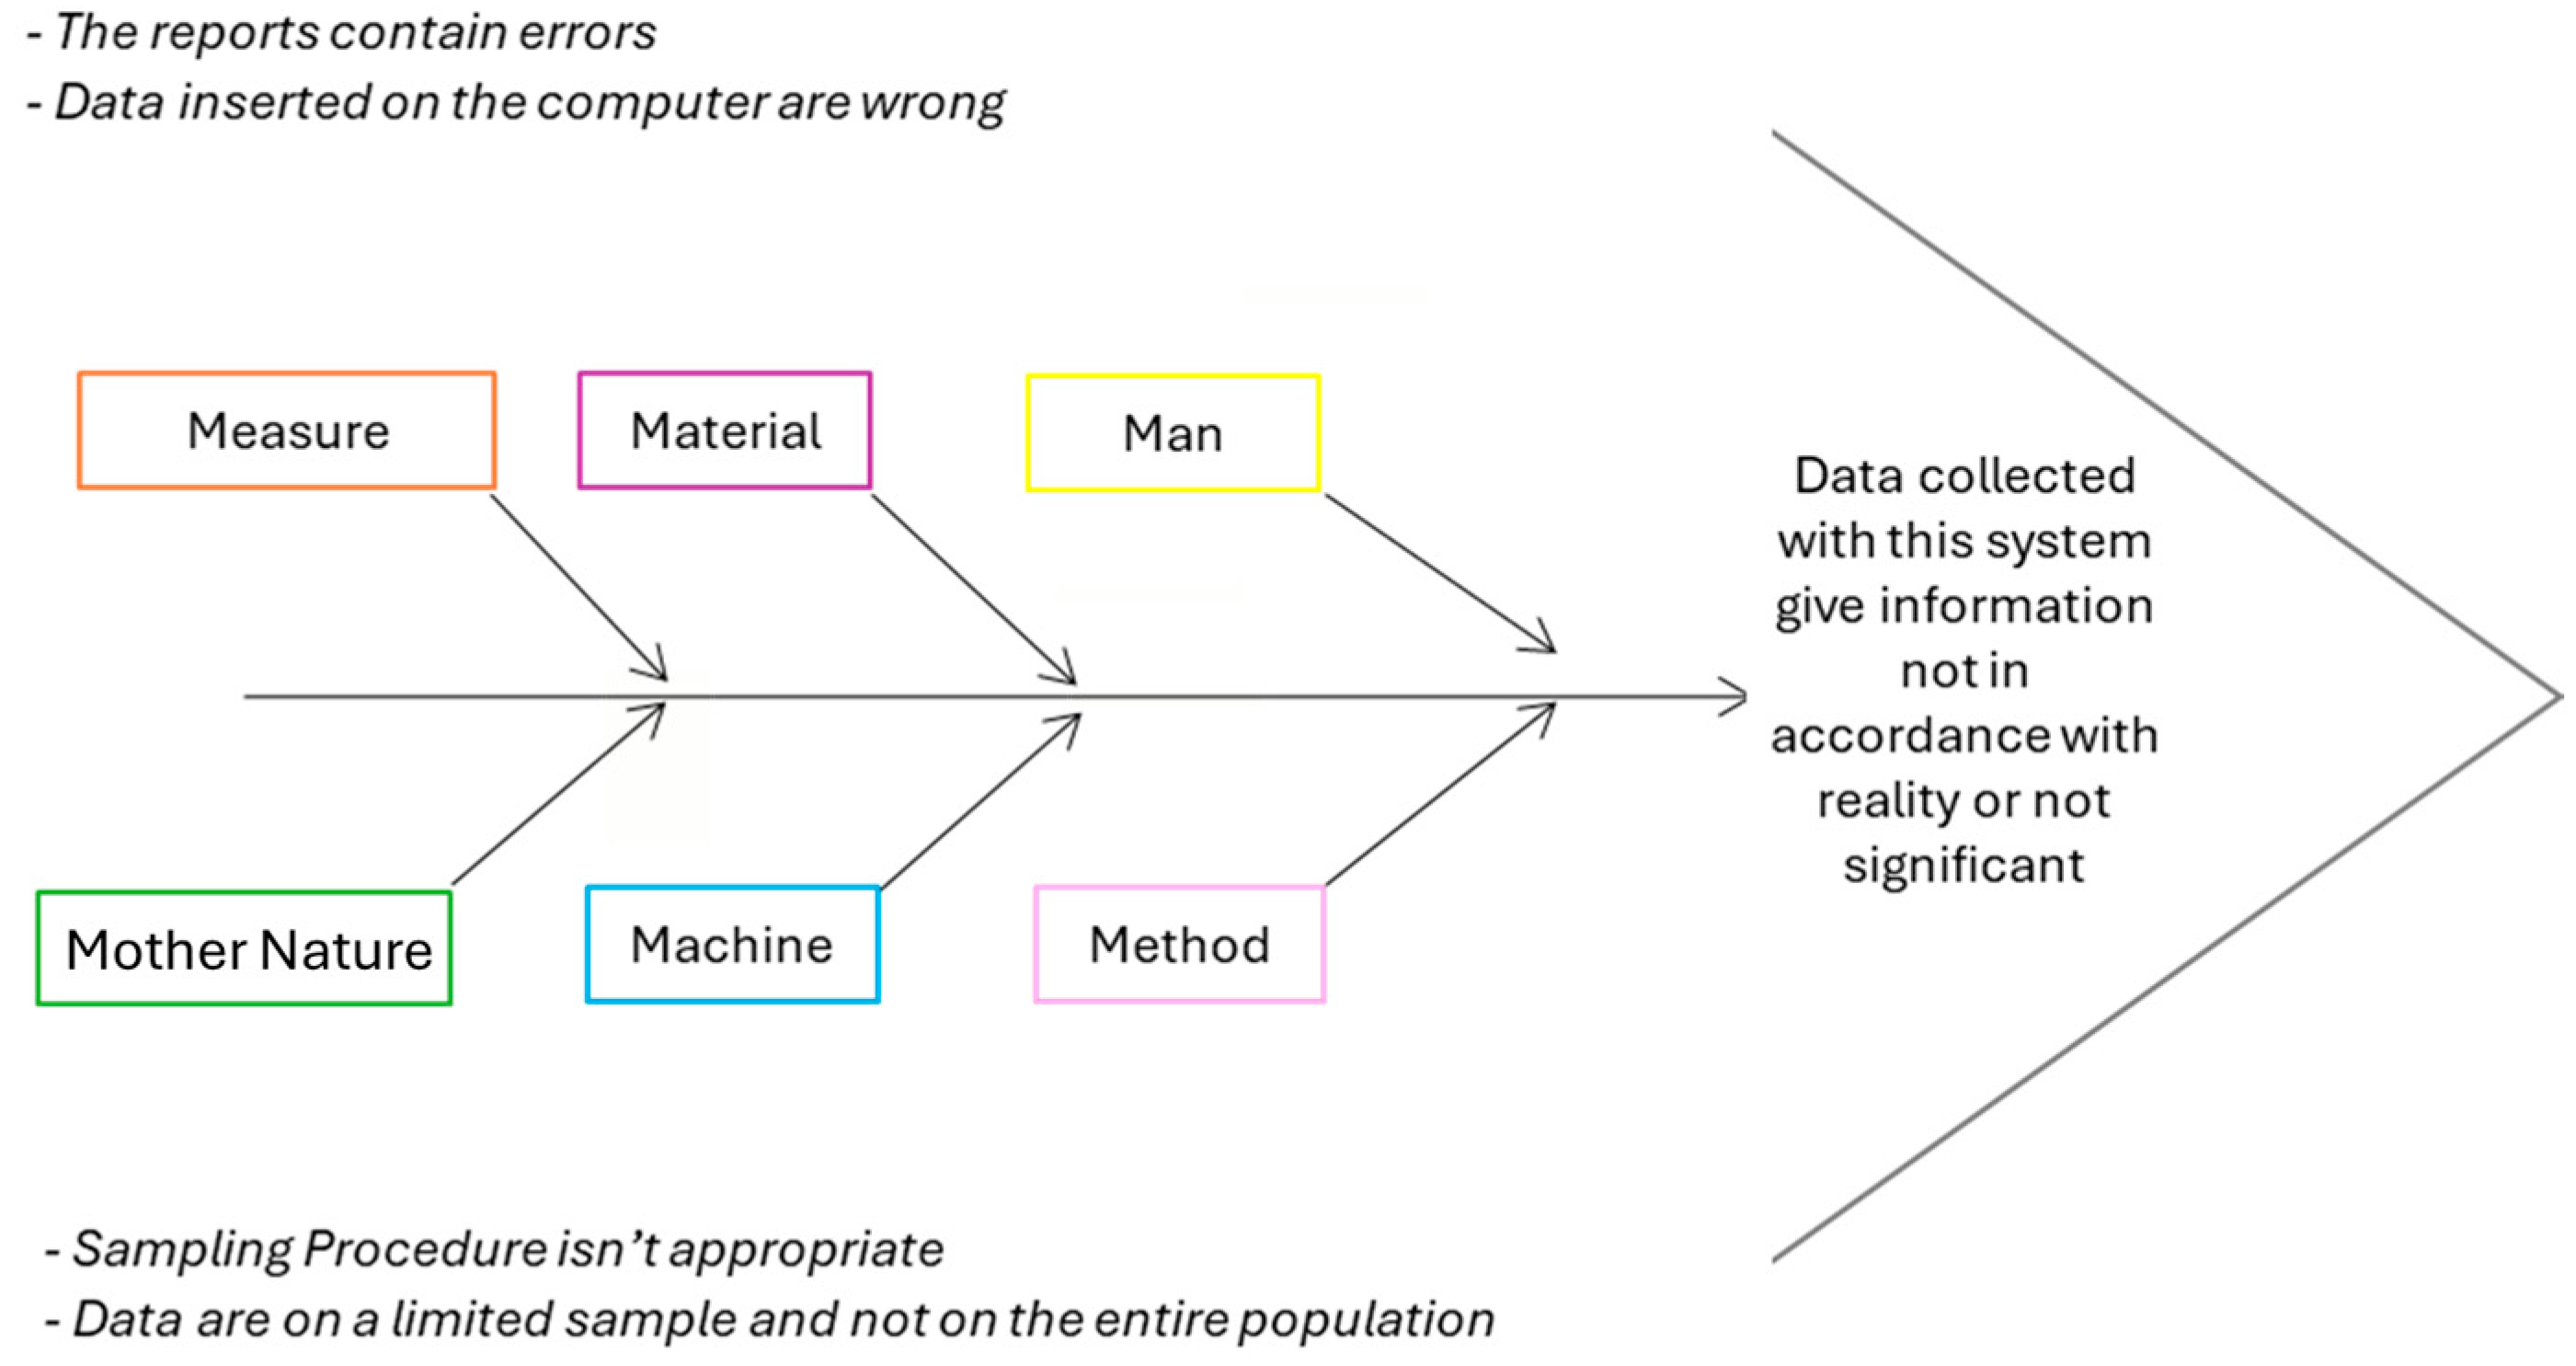
The Analyse phase of the DMAIC methodology aims to identify the root causes of the inefficiencies identified during the Measure phase. This step is crucial for understanding the underlying factors contributing to data inaccuracies, excessive time consumption, and high costs in the current data collection process. To thoroughly investigate the causes, an Ishikawa Diagram (Fishbone Diagram),
Figure 2, is utilised to map out potential sources of errors and inefficiencies visually. The Ishikawa Diagram provided a structured approach to categorising the root causes into areas such as Man, Method, Machine, Material, and Environment. This visual tool facilitated identifying factors that directly affected the accuracy and efficiency of the data collection process.
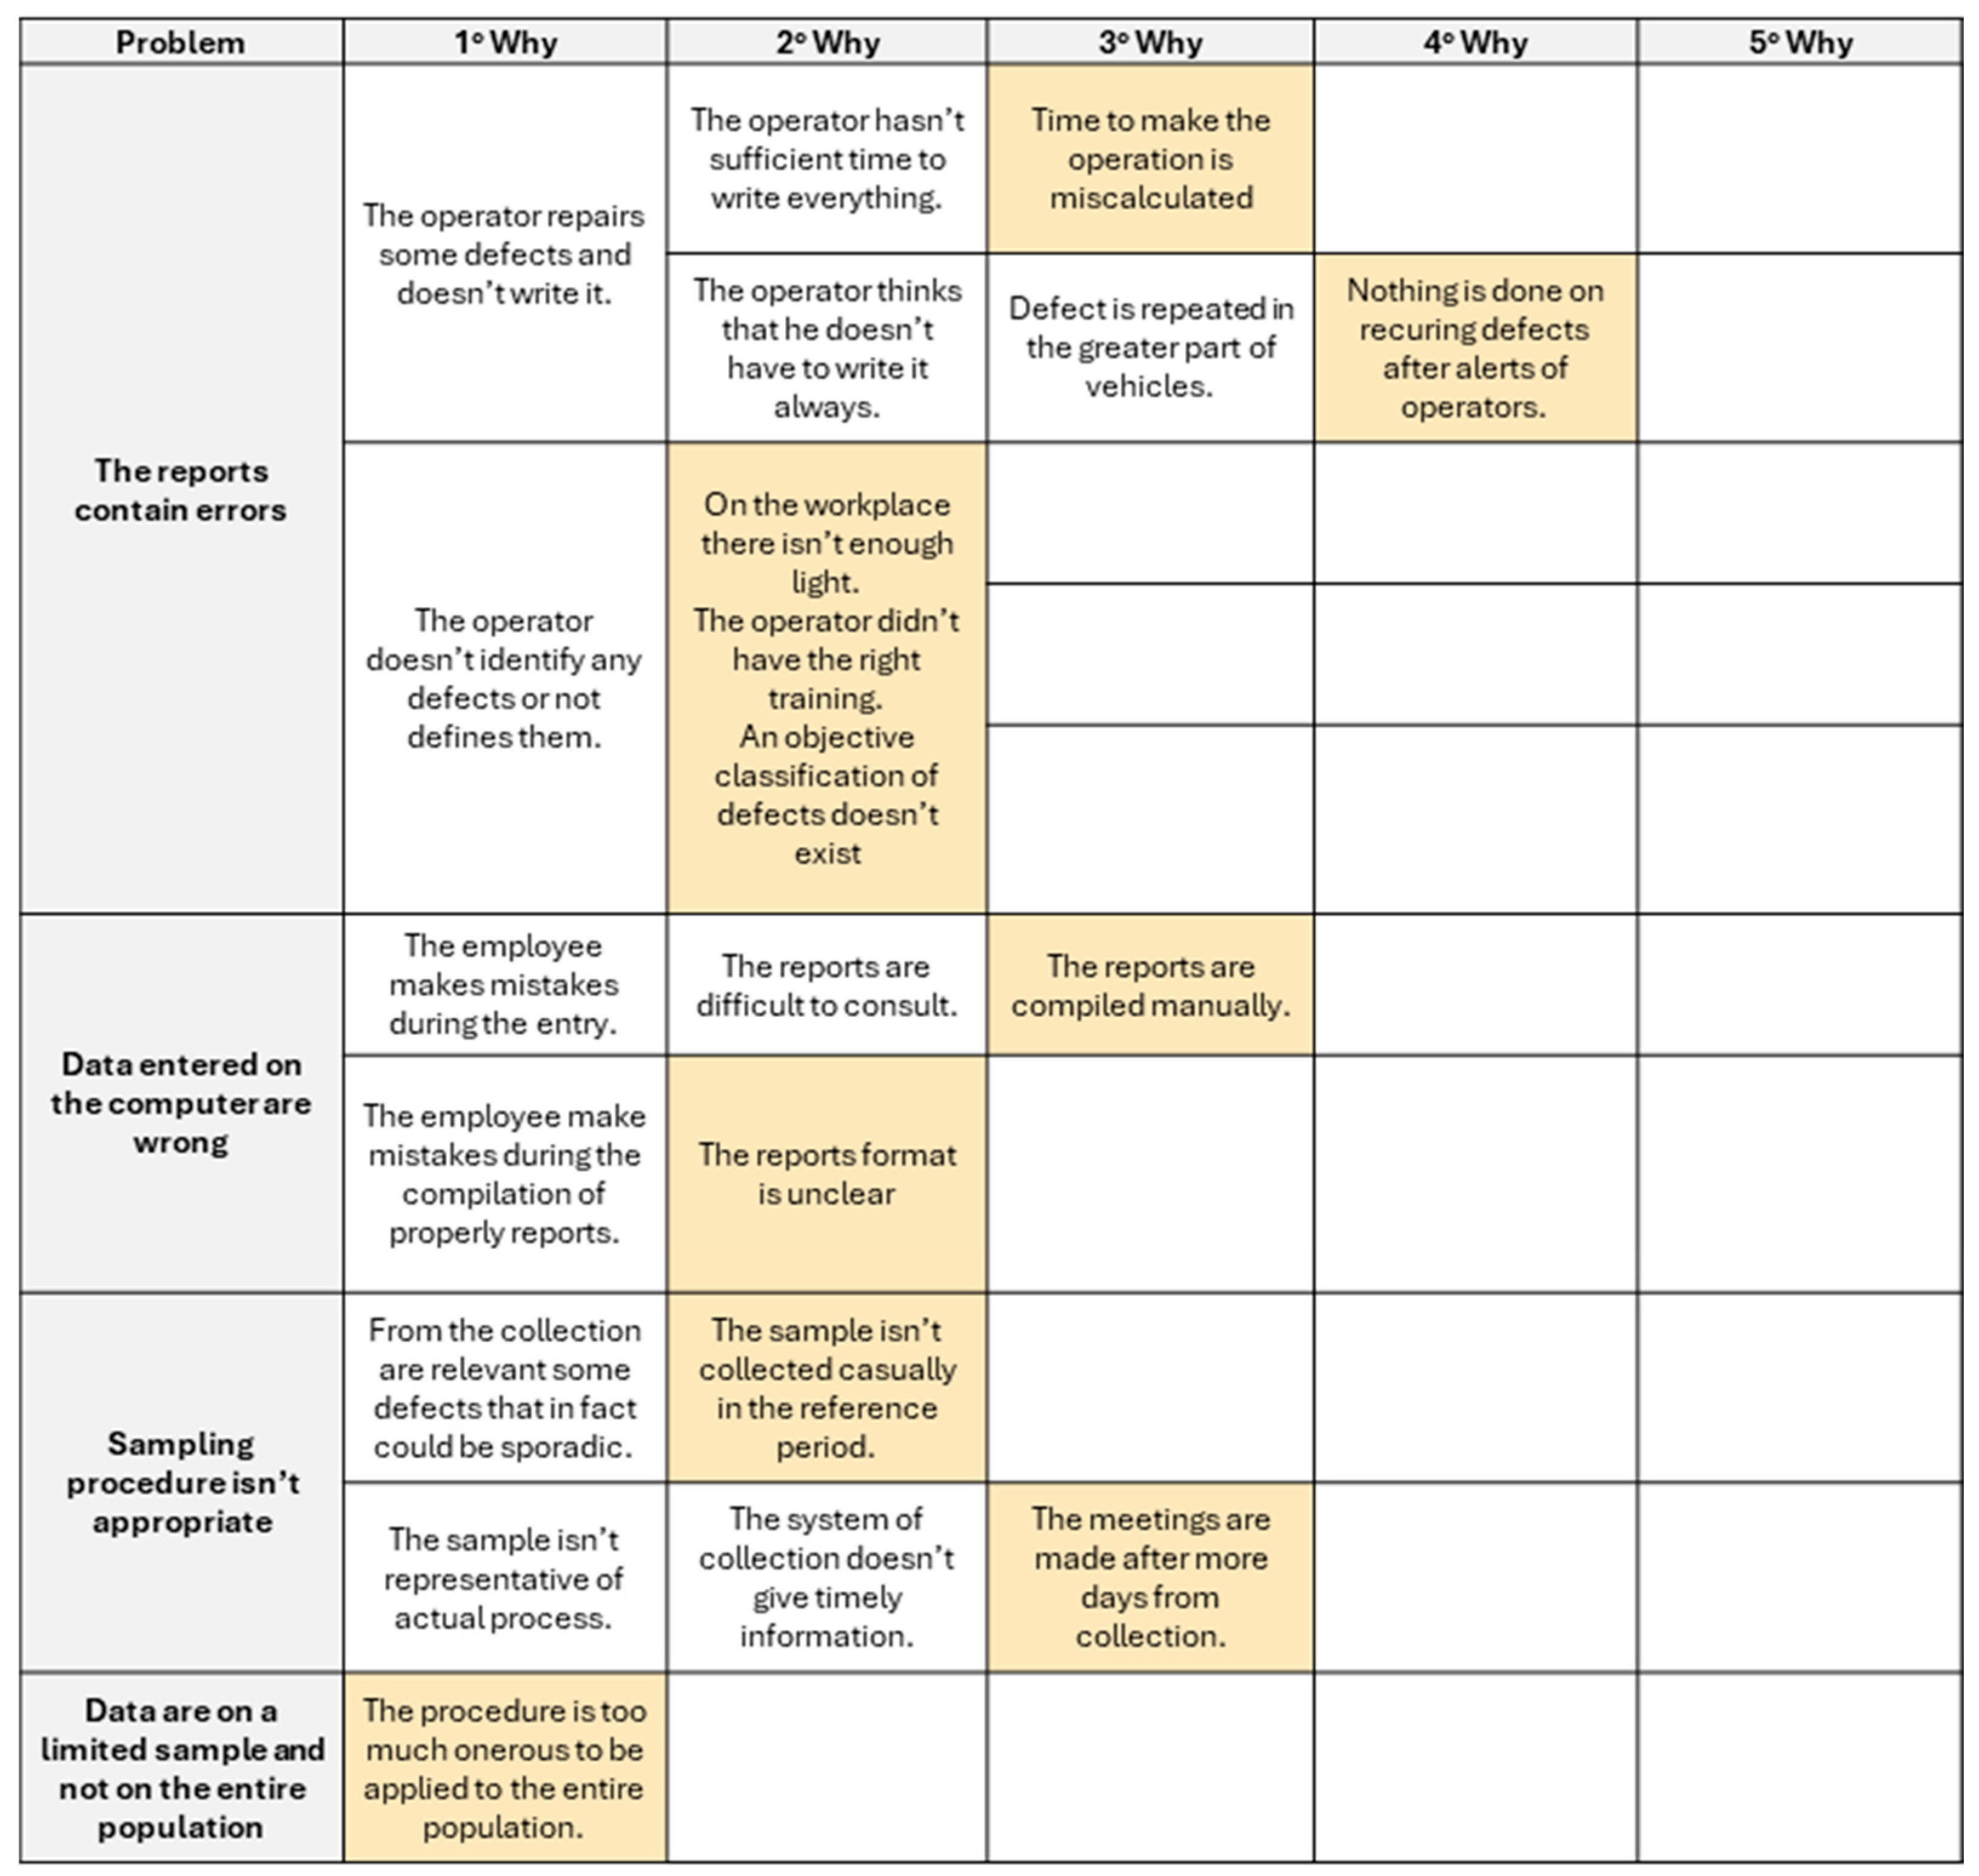
The primary issue identified was that the “data collected with the current system provides inaccurate or incomplete information”. This statement encapsulates the main impact observed, where data quality is compromised due to several contributing factors. Specifically, the term “incomplete information” was defined as data that either reflect defects occurring only during specific sampling periods (hence skewing the overall defect analysis) or as data that suffer from significant delays between the occurrence of defects and their subsequent analysis in meetings. The root causes were categorised primarily under the domains of Man and Method. For instance, human error in manual data transcription and delays in data recording were identified as significant contributors. These were further explored through a “5 Whys” analysis, which helped the team drill down into the deeper issues affecting the process. In particular,
Figure 3,
Figure 4 and
Figure 5 Whys Analysis examines the underlying causes of defects and inefficiencies in the data collection process. In the
Figure 3, the yellow-highlighted cells indicate critical root causes that have a significant impact on the problem and represent key leverage points for improvement.
This systematic approach clarified that issues such as manual data entry errors, inconsistent reporting methods, and a lack of standardisation in data handling were the primary factors leading to data inaccuracies. Additionally, the delay in data processing was attributed to the lack of real-time data input mechanisms, resulting in outdated information by the time it reached decision-makers. To facilitate a solution-oriented approach, a brainstorming session was conducted with the cross-functional team. The session leveraged insights from the Ishikawa Diagram and the “5 Whys” analysis to generate potential solutions. The key proposals considered were as follows:
Implementing a digital data entry system at the final verification stage: Operators would periodically input defect data for a sample of vehicles, with automatic file generation, while retaining the current paper-based reports.
Equipping all operators on the production line with data entry devices: Each operator would directly enter data for every vehicle, including any repairs made, effectively replacing paper records entirely.
Providing data entry devices only to quality control operators at the end of each department: This approach would involve entering data for each vehicle into a centralised database, followed by printing a record for repair stamping.
To objectively assess these proposals, a priorities matrix was used to evaluate the advantages and disadvantages of each solution. The evaluation criteria included implementation costs, the time required for implementation, ease of realisation, and the comprehensiveness of data coverage. Based on this analysis, the third solution—assigning data entry devices only to quality control operators at the end of each department—was identified as the most effective approach for satisfying the project’s goals.
4.1.4. Improve
To implement the solution identified in the Analyse phase, the PDCA (Plan–Do–Check–Act) cycle was utilised to ensure a structured and iterative approach to improvement. During the Plan phase, the specific problem of how to develop and deploy an IT-based data collection tool was analysed in detail. The objective was defined quantitatively: The time operators spend on data collection and defect recording needed to decrease by at least 20%. Baseline data were gathered by timing operators across three departments as they checked vehicles and manually recorded reports. A sample size of 30 vehicles per department was used to capture the average time per vehicle. This information provided the foundation for evaluating the effectiveness of the proposed improvements. The solution design involved the introduction of a barcode-based data entry system. Barcode tables were created for placement at each workstation, with codes corresponding to vehicle zones and defect types. Operators could scan the VIN number, the location of the defect, and its type, with an option to manually input additional information if needed. The system was designed to automatically save all data into a Microsoft Access database, streamlining data storage and retrieval processes. During the Do phase, a pilot project was implemented to test the feasibility and functionality of the new barcode-based system. Collaboration with a Microsoft Access expert was necessary to develop the database infrastructure. This phase focused on training operators, deploying the new tools, and monitoring their initial usage.
After the pilot implementation, during the Check phase, new measurements were conducted to evaluate the impact of the improvements. These metrics were compared to the baseline data collected during the Plan phase. The results showed significant reductions in time and cost, achieving the predefined objectives across all three departments.
In the Act phase, adjustments were made based on findings from the Check phase. Although the objectives were met, minor refinements were implemented to optimise the system further. The PDCA cycle remains an ongoing process, ensuring that any new challenges or inefficiencies can be addressed proactively.
4.1.5. Control
Following the implementation of the new system, measures were put in place to sustain the improvements over time and standardise the process. In particular, the performances under analysis were as follows:
Time: The time required for data collection decreased significantly. The employee now spends 1 h/week extracting and analysing samples from the database, amounting to 4 h/month. This represents a time reduction of 87.5%, far exceeding the original target of 20%.
Cost: With the time reduction, the monthly cost of data collection also dropped from 800 EUR/month to 100 EUR/month, reflecting a cost decrease of 87.5%.
Quality of Data: The accuracy of the defect data improved dramatically, with compliance rates increasing to a range of 95% to 100%, compared to the initial range of 71% to 83%. This improvement ensures that the data aligns closely with production reality, enabling more reliable decision-making during quality meetings.
In addition, to ensure the improvements remain consistent over time, a Standard Operating Procedure (SOP) was developed. The SOP provides detailed instructions for the operation of the new system, ensuring that staff, regardless of turnover, can perform the process correctly and consistently. Copies of the SOP were placed at key locations in the vehicle testing areas of all three departments, making them easily accessible to operators.
The introduction of the SOP minimises the risk of errors and misunderstandings, ensuring that the data collection process remains standardised and sustainable even with staff changes or adjustments to the workflow.
4.2. Case Analysis with Method 2: Cost Deployment from WCM
The implementation of the Cost Deployment (CD) methodology within the context of Lean Service was aimed at identifying and eliminating inefficiencies in a quality data collection process, as observed in the Case Study under analysis. The CD methodology was utilised to map waste and losses, quantify their economic impact, and prioritise interventions to improve the process. By leveraging structured tools such as the A, B, C, and D Matrices, which follow a structured, sequential process, the analysis revealed critical areas of inefficiency and provided actionable insights for process improvement. Each matrix builds upon the previous one in a step-by-step manner, ensuring clarity and consistency in decision-making. We have now explicitly clarified this point within the manuscript to avoid potential misunderstandings regarding the linearity of the process. The analysis began with the identification of key inefficiencies using a detailed process map and a classification of potential waste. The first major inefficiency was associated with the use of computing devices, which represented a technological bottleneck. Frequent system failures, slowdowns, and unscheduled software updates caused significant idle time for employees tasked with data management, delaying their ability to complete tasks effectively. A second issue was the resistance to change among management, particularly regarding the lack of automation in data collection processes. Despite recurring challenges reported by operators and data collection employees, automation opportunities were not explored, perpetuating inefficiencies and limiting process optimisation. The workflow itself presented structural inefficiencies, as it involved two distinct stages: the manual compilation of defect reports and their subsequent transcription into a digital format. This duplication resulted in unnecessary resource consumption, including excessive use of paper and operator time, and introduced a higher likelihood of errors during data entry. Furthermore, the lack of direct responsibility for defect reporting among operators led to an underutilisation of human resources, exacerbating inefficiencies. In addition, significant quality issues emerged during the data review process. Errors in defect files were frequently identified during quality meetings, often leading to dissatisfaction among stakeholders. These errors were attributed to incomplete or misinterpreted information entered by employees, who lacked the necessary training to accurately classify defects. Additionally, employees frequently required consultation with colleagues to clarify defect details, resulting in delays and a higher probability of mistakes. The absence of standardised terminology and reporting formats compounded these challenges. Inconsistent report structures caused confusion for both data compilers and reviewers, further hindering the accuracy and efficiency of the process. Inefficiencies related to workplace organisation were also prominent, as employees spent excessive time walking between workstations and testing areas to collect reports or seek clarifications. This unnecessary movement highlighted the need for improved workplace layouts and organisational systems.
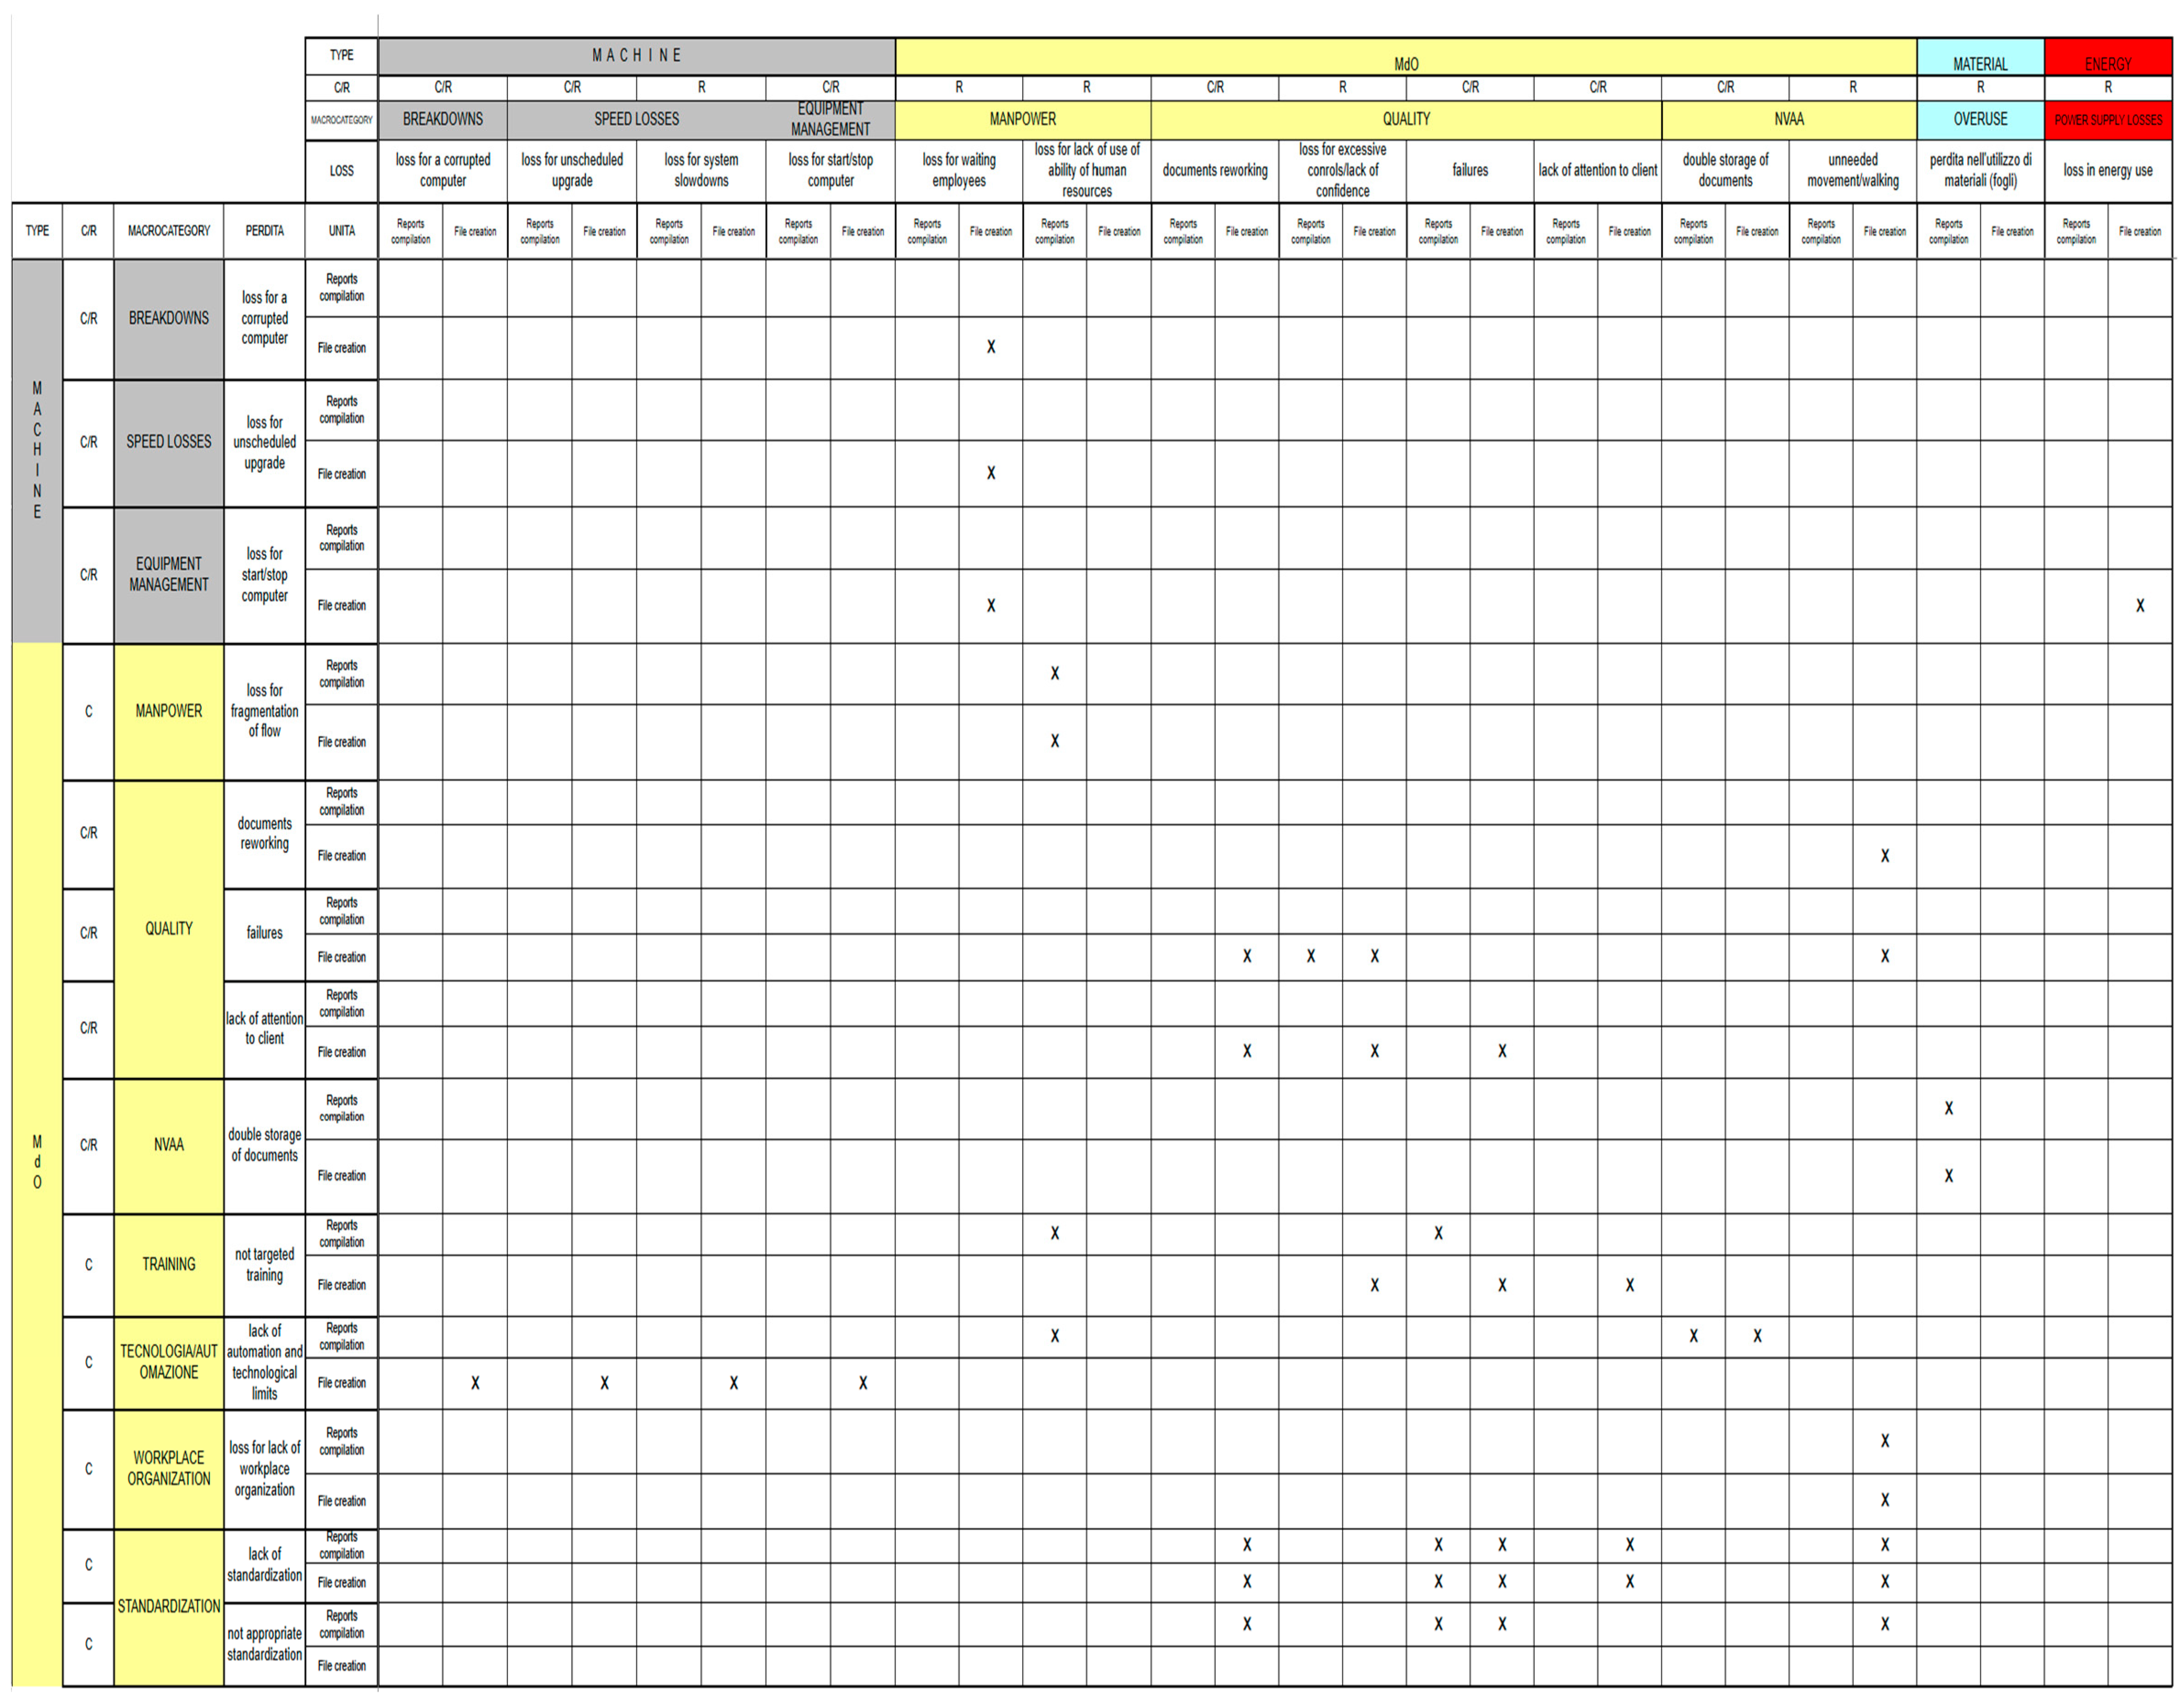
4.2.1. A Matrix
The A Matrix, shown in
Figure 4, serves as a critical tool in mapping the relationship between specific processes and the associated types of losses. This matrix enables a precise identification of where losses occur within the workflow and allows for an assessment of their economic impact, categorised into four levels: no impact, low impact, medium impact, and high impact. This matrix initiates the sequential analytical process, providing a foundational understanding of inefficiencies before proceeding to subsequent matrices. In this case study, the A Matrix was constructed by first identifying and categorising the predefined losses into four primary types: machine-related losses, manpower inefficiencies, material wastage, and energy consumption. These categories were organised along the rows of the matrix, while the corresponding processes within the workflow were arranged along the columns. The colours in the first two columns are used solely to visually distinguish the
type and
macrocategory of each loss. This structure facilitated a clear visualisation of the interconnections between processes and losses. Each cell within the matrix contains a value representing the intensity of the loss, determined through a subjective assessment conducted by the project team, using a colour-coded system to represent impact levels: green for low, yellow for medium, and red for high. Notably, the most critical losses were associated with manpower inefficiencies, such as workflow fragmentation and underutilisation of human resources. Additionally, cells highlighted in purple under the “causal/result” column denote causal losses, meaning they are root causes that directly contribute to inefficiencies. Distinguishing between causal and resulting losses is essential, as it informs prioritisation in later stages of the analysis.The qualitative assessment revealed that the most critical losses were linked to manpower inefficiencies, including delays caused by system slowdowns, workflow fragmentation, and the underutilisation of employee skills. By systematically categorising and quantifying losses, the A Matrix not only highlighted key areas of concern but also established a foundational understanding of the economic implications tied to each inefficiency.
Figure 4.
A Matrix: mapping identified losses across main processes and categorising their impact.
Figure 4.
A Matrix: mapping identified losses across main processes and categorising their impact.
4.2.2. B Matrix
The losses identified in the process can be categorised into two distinct types: causal losses and resulting losses. Causal losses originate from specific problems within the process or the plant, while resulting losses are the downstream effects caused by these initial issues. Understanding this distinction is critical for prioritising actions aimed at reducing or eliminating inefficiencies. The B Matrix, in
Figure 5, is constructed to analyse and visualise the relationship between causal and resulting losses on a process-by-process basis. In the figure, the colours used in the first rows visually recall the loss categories identified in
Figure 4, ensuring continuity in the classification and improving readability. As part of the structured flow, this matrix refines the findings of the A Matrix by distinguishing root causes from their downstream effects. This matrix uses the outputs of the A Matrix as its input, with causal losses arranged along the rows and resulting losses along the columns. Each cell in the matrix indicates the linkage between a specific causal loss and its corresponding resulting loss, providing a clear representation of the cause-and-effect relationships within the workflow. The purpose of the B Matrix is to identify the root causes of inefficiencies, as addressing causal losses is the only effective way to eliminate resulting losses. Since resulting losses are dependent on causal factors, targeting the root causes ensures a more impactful and sustainable improvement. However, distinguishing between causal and resulting losses can be challenging and is not always immediately apparent. During the construction of the B Matrix, the classification required iterative discussions and adjustments by the team to ensure accuracy and alignment with the observed processes. The analysis revealed that many resulting losses, such as rework and delays, were directly tied to root causes, including limited employee training and the absence of process automation.
4.2.3. C Matrix
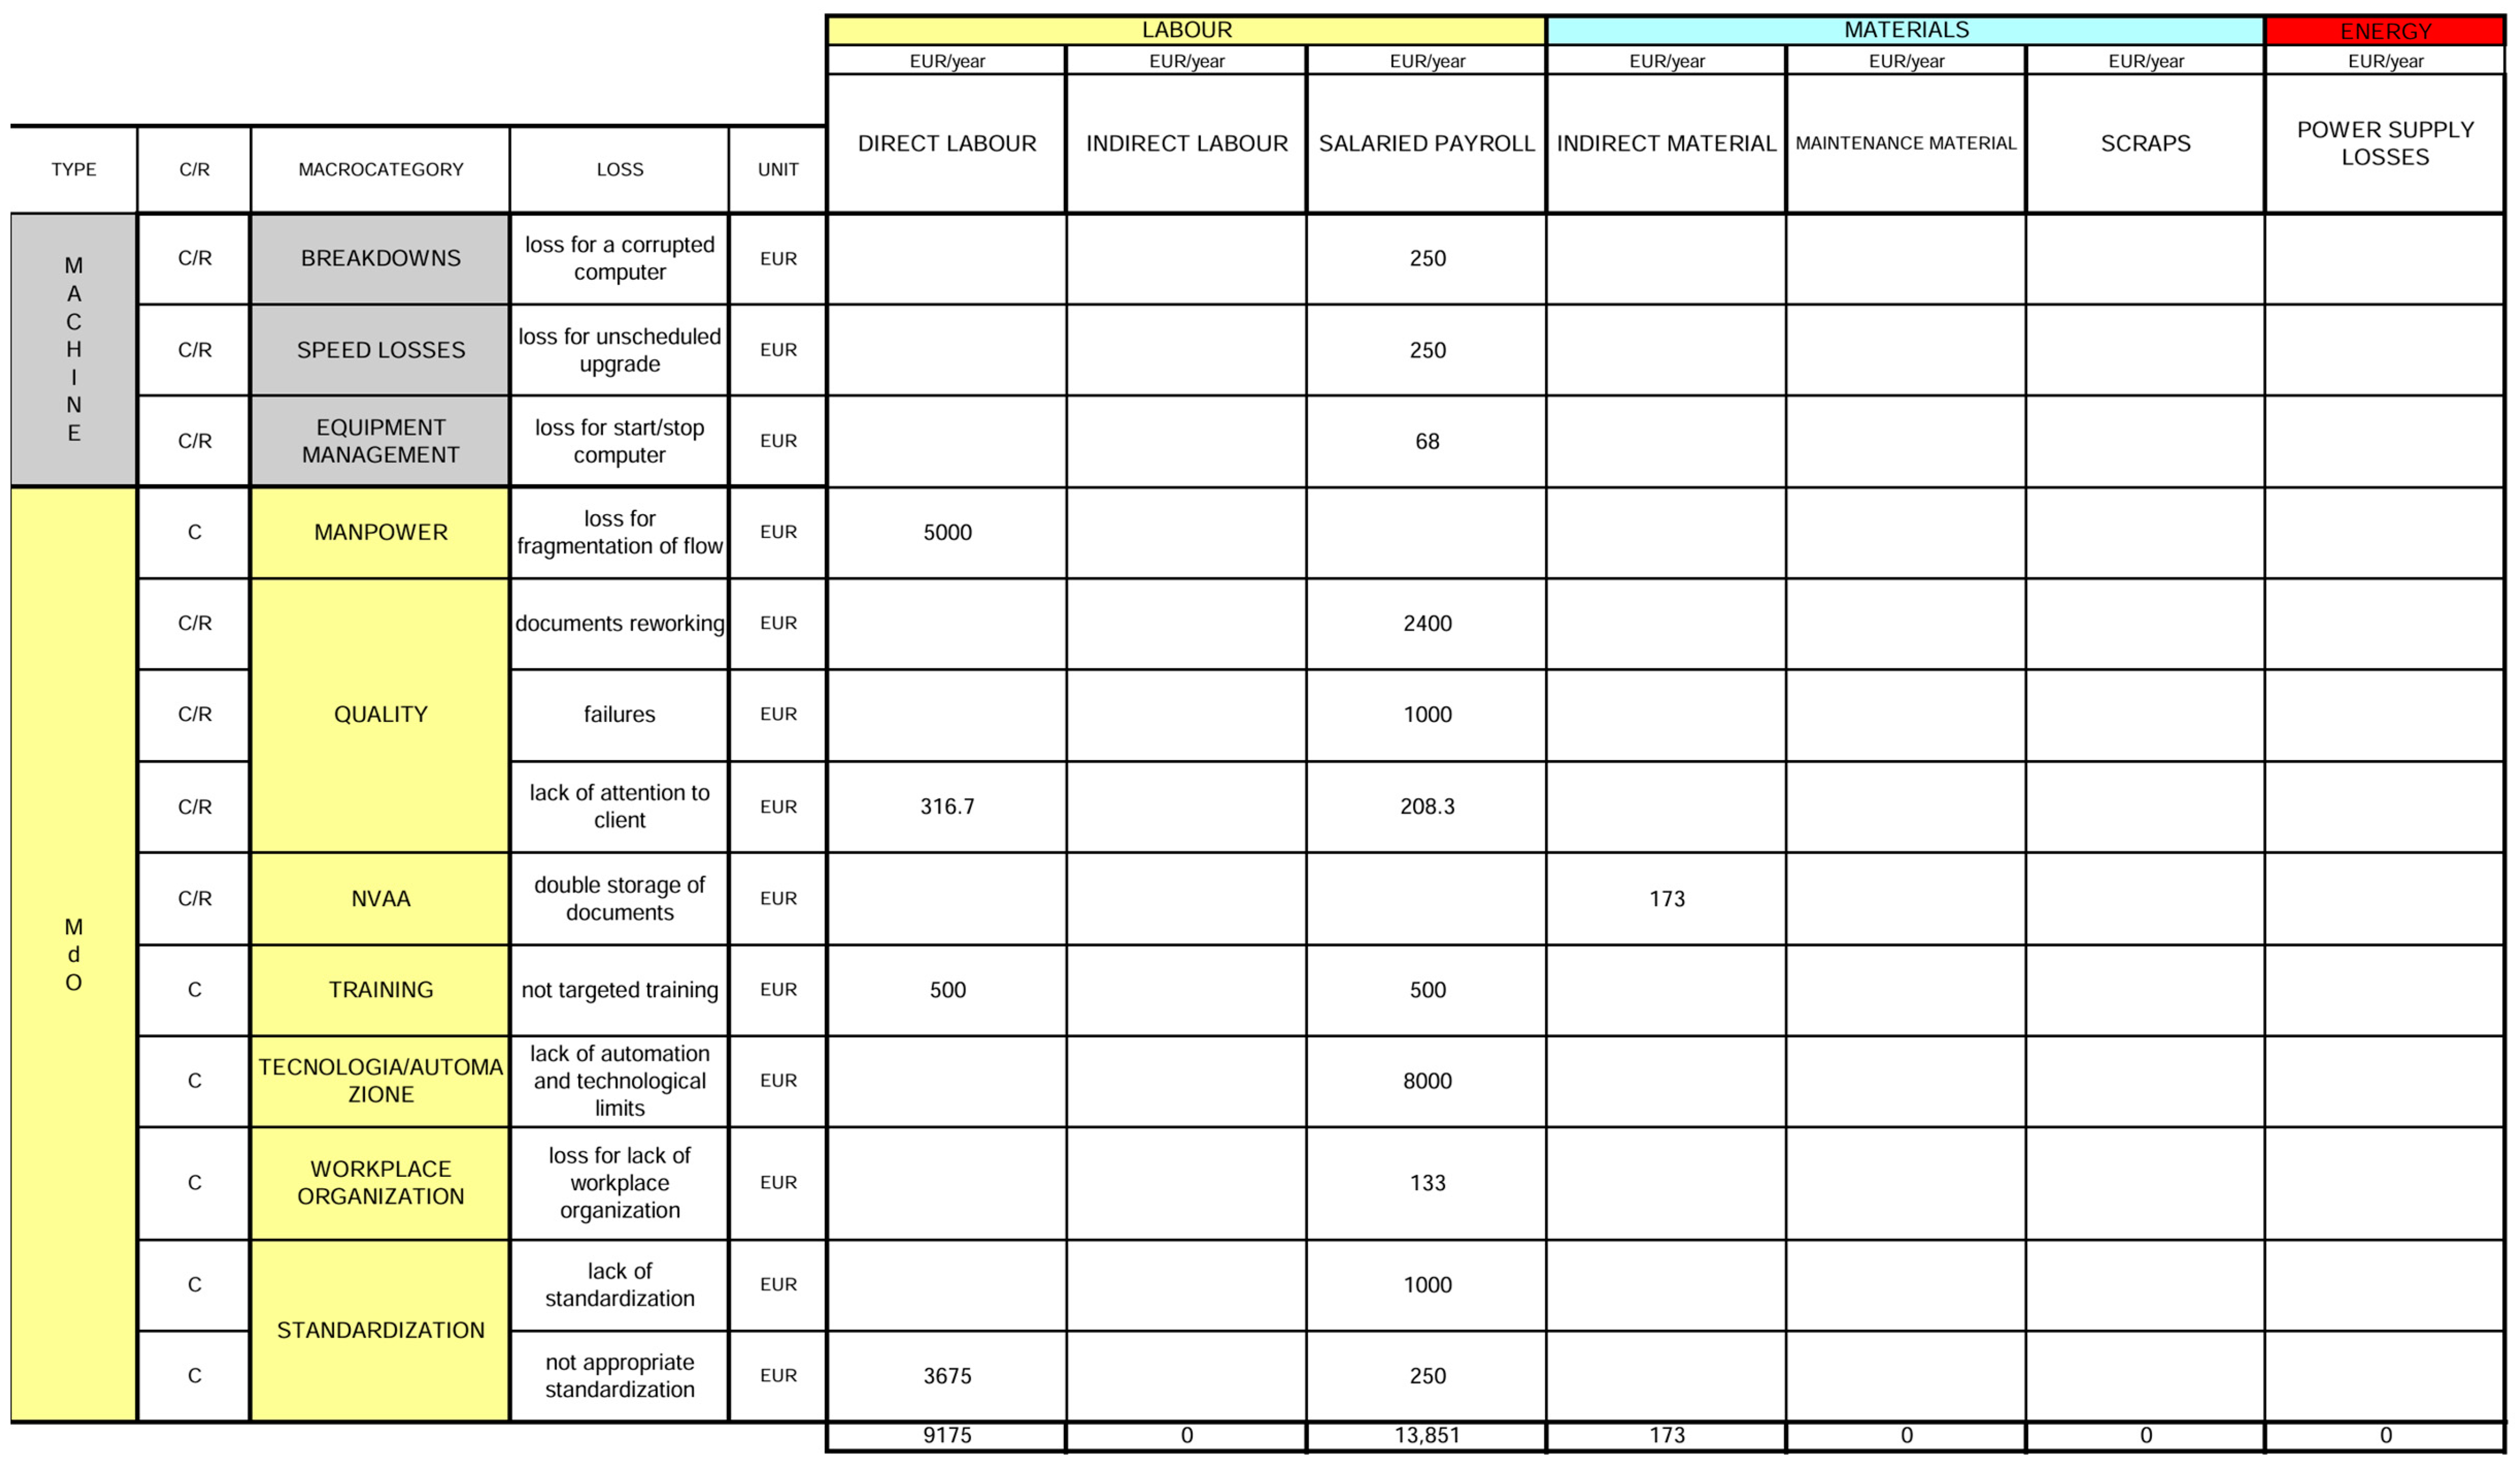
Building on the B Matrix, the C Matrix,
Figure 6, linked causal losses to the plant’s cost structure, quantifying their economic impact across three categories: labour, materials, and energy. This matrix continues the structured sequence by introducing financial quantification, enabling a more strategic prioritisation of issues identified in the previous matrices. The rows of the C Matrix represent the structure of the losses derived from the B Matrix, while the columns correspond to the transformation cost categories: labour, materials, and energy. In the figure, the colours used in the first rows visually recall the loss categories identified in
Figure 4 and
Figure 5 ensuring continuity in the classification and improving readability. Each cell in the matrix contains the economic value of a specific loss as it relates to a particular cost category. The total for each row represents the cumulative economic impact of an individual loss across all cost categories. Conversely, the total for each column quantifies the overall cost contribution of each transformation cost category. The results highlighted that a significant portion of the economic impact was attributed to labour-related inefficiencies, particularly those associated with the manual compilation and transcription of defect reports. This quantification provided a clear understanding of the financial implications of identified inefficiencies and guided the prioritisation of improvement efforts.
4.2.4. D Matrix
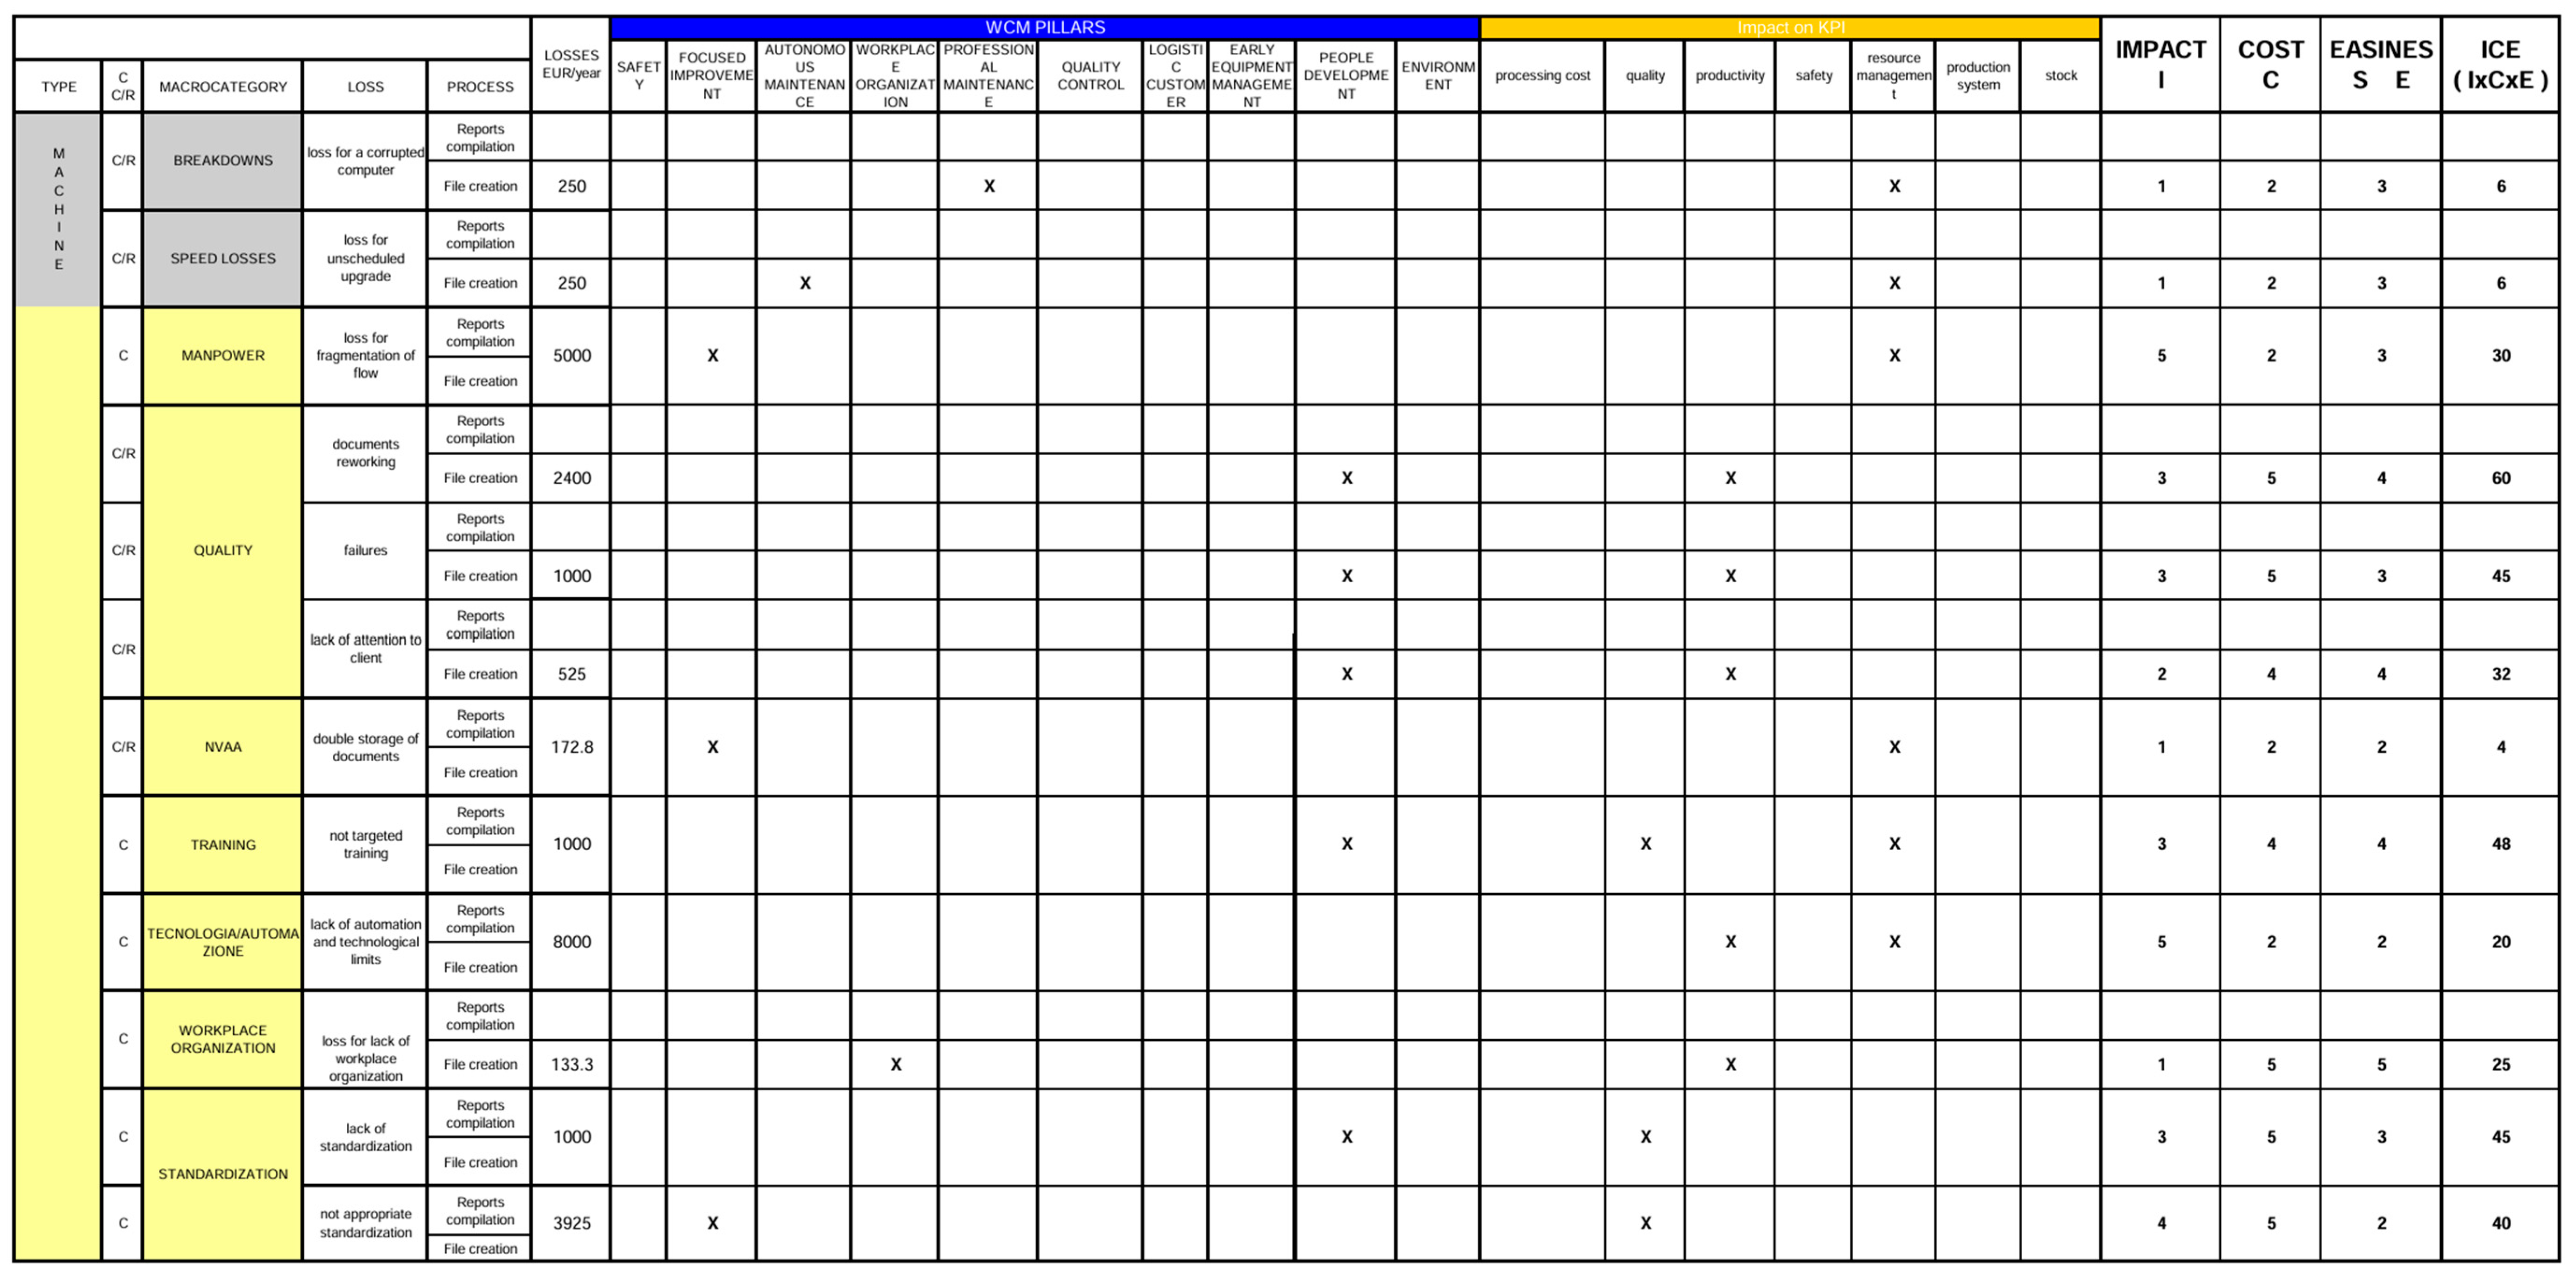
The D Matrix is a decision-making tool designed to identify and prioritise the methods for eliminating or reducing losses identified in the earlier phases. This matrix distinguishes between two types of improvement approaches: focused improvement and systematic improvement. Focused improvement addresses specific, well-defined issues and typically delivers results in a short timeframe. This approach is aligned with the principles of the Focused Improvement pillar in World Class Manufacturing (WCM), which aims to achieve immediate and perceptible effects. In contrast, systematic improvement focuses on broader, less clearly defined issues. While it requires a longer implementation period, systematic improvement offers more extensive and sustainable benefits by addressing the root causes of losses and preventing their recurrence.
The D Matrix (
Figure 7) served as a decision-making tool to prioritise interventions for reducing or eliminating losses. In the figure, the colours used in the first rows visually recall the loss categories identified in the previous Figures ensuring continuity in the classification and improving readability. Losses were evaluated based on three criteria, each one rated on a scale from 1 to 5: Impact (I), Cost (C), and Easiness (E), with the resulting ICE Index (I × C × E) used to rank losses by priority. High-priority losses were those with the highest ICE scores, representing opportunities for significant impact with low costs and ease of implementation. The analysis identified human resource utilisation as the highest-priority loss, particularly related to People Development. Addressing these losses requires improving employee competence, reducing human errors, and enhancing adaptability to changes. This is directly aligned with the Hitozukuri principle of the Toyota Production System (TPS), which emphasises continuous workforce development as a pillar of sustainable operational excellence. Structured training systems are crucial to ensure employees have the necessary skills and qualifications. Additionally, creating a supportive working environment fosters motivation, productivity, and a calmer atmosphere. By fostering a culture of learning and engagement, in line with Hitozukuri, implementing targeted training programs and workplace improvements empowers employees to perform effectively and confidently, driving long-term organisational improvements.
4.3. Cross-Case Analysis
This study compares two lean methodologies—DMAIC and Cost Deployment—that are applied to a service-based quality data collection process.
Table 2 provides a structured comparison of the two methods based on key performance indicators.
Table 2.
Comparative analysis of DMAIC and Cost Deployment.
Table 2.
Comparative analysis of DMAIC and Cost Deployment.
| Criteria | DMAIC | Cost Deployment |
|---|
| Process Efficiency | 87.5% time reduction | Systemic efficiency |
| Error Reduction | Eliminated manual errors | Indirect via training |
| Data Reliability | Improved (digital system) | Cost-loss analysis |
| Implementation Cost | €800/month | Training investment |
| Employee Training | Limited | High (People Development) |
| Strategic Planning | Low | Strong (holistic view) |
| Short-term Impact | Strong (25% faster) | Moderate (systemic) |
| Long-term Sustainability | Limited | Strong (15% resource use, 20% waste reduction) |
| Economic Feasibility | ✗ Not considered | ✔ Explicitly evaluated |
| Waste Reduction | N/A | 20% reduction |
Figure 5.
B Matrix: linking causal losses to resulting losses for root cause analysis.
Figure 5.
B Matrix: linking causal losses to resulting losses for root cause analysis.
Figure 6.
C Matrix: quantifying the economic impact of causal losses in terms of labour, materials, and energy.
Figure 6.
C Matrix: quantifying the economic impact of causal losses in terms of labour, materials, and energy.
Figure 7.
D Matrix: Prioritising potential improvements using the ICE (Impact, Cost, Ease) index and distinguishing between focused and systematic actions.
Figure 7.
D Matrix: Prioritising potential improvements using the ICE (Impact, Cost, Ease) index and distinguishing between focused and systematic actions.
DMAIC facilitated rapid and targeted improvements, particularly in process efficiency, error reduction, and data reliability. Implementing a computerised defect-tracking system eliminated manual data entry errors, streamlined defect identification, and reduced processing time by 87.5%. Key metrics used to evaluate this approach included the time required to access quality information, resource costs, and data quality. The resource cost of this implementation was calculated at 800 EUR/month or approximately EUR 8000 annually, reflecting the duration of active production periods. Additionally, organisations implementing DMAIC saw a 25% reduction in problem resolution time due to its structured statistical approach.
Conversely, Cost Deployment focused on long-term strategic efficiency, emphasising employee training and resource optimisation. The D Matrix analysis underscored the importance of People Development, while the C Matrix quantified financial inefficiencies, guiding sustainable cost-saving actions. This methodology provided a more comprehensive study by identifying all potential losses, including those not immediately actionable. The ability to compare the cost of losses with the cost of corrective actions ensured that interventions were implemented at the right time and under optimal conditions. At first glance, the outputs of the two methodologies appear to differ significantly in both proposed tools and cost assessments. However, a deeper analysis reveals a critical point of convergence: Both methods aim to enhance employee awareness and skill development. Both approaches address inefficiencies and promote activities that add value to the process by empowering employees and optimising their capabilities. This shared focus on training underscores its role in supporting the successful adoption of new tools or strategies.
From an economic evaluation, the Cost Deployment approach demonstrated a broader perspective by identifying systemic inefficiencies, providing a foundation for strategic planning and sustainable optimisation. A distinctive aspect of Cost Deployment is its capacity to compare the cost of losses with the cost of corrective actions, ensuring economic viability before implementation. In contrast, DMAIC prioritises immediate results, delivering rapid, targeted solutions to specific problems. A key insight from this comparison is that DMAIC provides short-term, high-impact gains, whereas Cost Deployment offers a holistic, economically driven approach. A combined methodology leveraging DMAIC for immediate operational enhancements and Cost Deployment for long-term waste elimination would yield the most significant improvements in service process efficiency and sustainability.
5. Conclusions
This study has extended the current understanding of Lean Service by proposing an extensive classification of 22 service-specific wastes and examining two established continuous improvement methodologies within a real-world manufacturing context. In addition, this research underscores that the choice between DMAIC and Cost Deployment should be guided primarily by the nature of the problem at hand—whether it is more isolated and narrowly defined or requires a broader, systemic intervention. Rather than championing one method as universally superior, we demonstrated that selecting the correct Lean approach can significantly influence both the effectiveness and the sustainability of the improvements achieved.
DMAIC provides structured, data-driven problem-solving capabilities that excel in tackling well-defined challenges and delivering rapid, measurable results. Conversely, Cost Deployment offers a holistic perspective, placing strong emphasis on systemic waste elimination, economic feasibility, and longer-term resource optimisation. While the two methods differ in their focal points, they converge on the importance of workforce empowerment and continuous improvement—key tenets of any Lean philosophy.
These findings must be considered in light of certain limitations. While the case study offers rich, practice-based insights, it derives from a single manufacturing setting, which may constrain its direct applicability to different service contexts. Although the proposed 22 waste categories are valuable for identifying inefficiencies, subtle variances in service processes across industries might warrant further contextual refinement. Furthermore, the comparative analysis remained largely qualitative and anchored in one specific scenario, suggesting that expanded, multi-case investigations or more extensive quantitative validation would enhance the generalisability of the results.
Looking to the future, the approach outlined here could be replicated in diverse service sectors—such as healthcare, finance, or hospitality—to test the universality of the proposed waste classification and the adaptability of the two methodologies. Adopting emerging digital tools and AI-driven analytics can reinforce data accuracy and generate more responsive Lean Service practices, particularly when combined with frameworks like DMAIC or Cost Deployment. It would also be worthwhile to explore how varying organisational cultures—shaped by national contexts or professional norms—influence Lean Service initiatives’ uptake and long-term impact. Lastly, longitudinal studies that follow the evolution of these improvements over extended periods would help assess the sustainability of Lean transformations and provide deeper insights into the conditions under which they become embedded as an enduring organisational philosophy rather than a transient operational intervention.


