Article

Effect of Ball Milling Speeds on the Phase Formation and Optical Properties of α-ZnMoO4 and ß-ZnMoO4 Nanoparticles

1
Institute of General and Inorganic Chemistry, Bulgarian Academy of Sciences, Acad. G. Bonchev, bl. 11, 1113 Sofia, Bulgaria
2
Institute of Optical Materials and Technologies “Acad. Jordan Malinowski”, Acad. G. Bonchev, Str., bl. 109, 1113 Sofia, Bulgaria
*
Author to whom correspondence should be addressed.
J. Manuf. Mater. Process. 2025, 9(4), 118; https://doi.org/10.3390/jmmp9040118
Submission received: 25 February 2025 / Revised: 14 March 2025 / Accepted: 27 March 2025 / Published: 3 April 2025

Abstract

Two modifications of ZnMoO4 were successfully obtained by mechanochemical treatment with two milling speeds applied at 500 and 850 rpm. The phase formation was monitored by XRD analysis. The metastable monoclinic ß-ZnMoO4 was directly synthesized at room temperature using the higher milling speed of 850 rpm. The thermodynamically stable triclinic α-ZnMoO4 was obtained by combining heat treatment t 600 °C and ball milling at the lower milling speed of 500 rpm. The IR spectra contain typical vibration bands and confirm the formation of both ZnMoO4 polymorphs. UV-Vis absorption and photoluminescence (PL) spectroscopy are used to study the optical properties of the as-prepared samples. The calculated optical band gaps for α- and ß-ZnMoO4 are 4.09 and 3.02 eV. The photoluminescence emission spectrum of both samples shows peaks with different maximum intensity at 615 and 403 nm for α and ß phase, respectively. CIE co-ordinates are located in the orange and blue range of the color diagram.

1. Introduction

In recent years, the transition metal molybdates AMoO4 (A = Cu, Ni, Co, Fe, and Zn) have been extensively investigated as a result of their unique structural, electronic, optical, magnetic, and catalytic properties. ZnMoO4 belongs to this family, which finds many technological and science applications, such as phosphors [1,2,3,4,5], host matrix [6,7,8,9,10], microwave dielectrics devices [11], catalysis [12,13,14], humidity sensors [15], and anode materials for LIB [16,17,18,19,20]. This compound is one of the semiconducting transition metal materials possessing direct optical band gap energy that ranges from 2.48 to 4.25 eV [1,4,8,11,12,13,14,15]. ZnMoO4 appears in two polymorphic modifications: alpha (α) and beta (ß). The α-ZnMoO4 is a thermostable phase characterized by a triclinic structure, with space group P1, where the Zn cations are co-ordinated by six oxygen anions and form ZnO6, while Mo atoms are connected with four oxygens in a tetrahedral unit [MoO4] [21]. However, ß-ZnMoO4 metastable phase possesses wolframite-type monoclinic structure with space group P2/c [3,22]. In the monoclinic structure, the Zn and Mo cations are co-ordinated by six oxygen atoms that form the distorted octahedral [ZnO6] and [MoO6], respectively [22]. It has been reported that isomorphs of ß-ZnMoO4 are CdWO4 and ZnWO4 [23].
The type of phase obtained depends on the synthesis method, conditions, time, and temperature processing. In principle, the preparation of the thermostable phase is achieved by vapor deposition [1], electrospinning–calcination combinations [2], solid-state reaction [5,7,11,17], sonochemistry [8], coprecipitation [6,9,10,12], and electrochemistry-assisted laser ablation [24]. The metastable one was synthesized mainly by the hydrothermal method and mechanochemical treatment [3,4,13,14,25,26]. The data about the luminescence properties of ZnMoO4 are limited in comparison with other metal molybdates with sheltie type of structure. It has been reported in the literature that α and ß phases possess blue–green, green, yellow, or orange emissions depending on the crystal structure and preparation method. In general, this behavior is ascribed to the charge-transfer transitions that occur from the oxygen ligands to the central molybdate atom in the MoO4 or MoO6 complexes in α- and ß-ZnMoO4 phases, respectively [5,7,10,22,23,24,25]. For example, α-ZnMoO4 synthesized by solid-state reaction shows prominent emission peaks at 420 nm and 530 nm [27]. Triclinic α-ZnMoO4 obtained by electrospinning–calcination combination method shows two emission peaks at lower wavelengths of 370 and 390 nm [2]. Y. Liang et al. established that nanoplates of α-ZnMoO4 exhibit two broad emission bands at 370 and 510 nm, while, for nano-rods of the same phase, there exists a single emission band located at 530 nm [24]. The nanowire particles of α-polymorph display a wide green emission band positioned at 560 nm [1]. The most intensive emission in the red region was observed for α-ZnMoO4 obtained by the sonochemical method and solid-state reaction [5,8]. The luminescence properties of the metastable-phase ß-ZnMoO4 were also investigated. The emission at various wavelengths in the visible electromagnetic spectrum is reported for this phase. Polygonal forms of particles of ß-ZnMoO4 exhibited a broad blue–green emission with maximum peak at 435 nm [12]. The green emission at a higher wavelength (590 nm) of the same modification obtained by hydrothermal method was reported by L.S. Cavalcante et al. [3]. The intensity of the yellow or orange emission from 588 to 598 nm is ascribed to changes in particle shape, crystal size, and surface defects [25]. Both phases of ZnMoO4 show emission at a lower wavelength of 366 nm [4]. The data about the luminescence properties of both phases indicated that ZnMoO4 is characterized with emission in a wider range and depends on the crystal structure, morphology, defects, and synthesis process.
There are different methods of preparation of ZnMoO4 phases such as by vapor deposition in air [1], electrospinning–calcination combinations [2], solid-state reaction [5,7,11,17,27], sonochemical method [8], coprecipitation [6,9,10,12], hydrothermal route [3,4,12,13,14,25,28], citrate complex route [29], and Czochralski technique [30]. Up to now there is only one article on the mechanochemical synthesis for preparation of ZnMoO4. The authors reported the preparation of metastable-phase ß-ZnMoO4 after a longer time of activation (8 years) at lower milling speed [26].
Mechanochemistry involves solid-state reactions that are induced by mechanical energy, such as activation in different mills, with or without additional solvent. This method was created as an alternative technique for preparing various types of materials with many applications. After mechanochemical activation, direct synthesis or reduction in temperature and reaction time of the desired phase is achieved [31,32,33,34,35,36,37]. The mechanochemical parameters, including mills type, speed, time, ball-to-powder weight ratio, and milling media (dry or wet) influence the reaction time, phase composition, and the properties of the final products. Milling speed is one of the parameters controlling the mechanical energy in the initial reagents during treatment. Therefore, higher energy is the reason for accelerating chemical reaction and direct synthesis [34,37]. Milling time is the other factor which influences the reaction time of the mechanochemical synthesis [38,39]. The relationship between both parameters, milling speed and time, suggests that they are interdependent and, as a result, lead to a reduction in the crystallite size, change in morphology, and a modification of the structure and properties.
Our group studies the direct synthesis of mixed metal oxides using mechanochemical synthesis with various milling speeds and times. In this work, two polymorphs of ZnMoO4 in triclinic and monoclinic form were prepared by mechanochemical treatment of pure ZnO and MoO3 oxides. The influence of crystal structures and the type of structural units on optical properties was systematically investigated.

2. Materials and Methods

2.1. Ball Milling Activation

The stoichiometric ratio (1:1) of ZnO (Merck, KGaA, Amsterdam, The Netherlands purity 99.9%) and MoO3 (Merck, KGaA, Amsterdam, The Netherlands purity 99.9%) was subjected to intensive mechanochemical activation. The treatment of the initial mixture was performed in a planetary ball mill (Fritsch–Premium line–Pulversette No. 7, Fritsch GmbH Milling and Sizing, Industriestrasse 8 55743 Idar-Oberstein, Germany) using milling speeds of 500 and 850 rpm in air atmosphere and 10:1 ball-to-powder weight ratio. To reduce the temperature while milling, the operation was conducted in 15 min intervals, followed by 5 min breaks, in accordance with our previous research [33,34,35,36,37].

2.2. Characterizations

The XRD powder patterns were collected on Bruker D8 Advance X-ray powder diffractometer, Karlsruhe, Germany, equipped with CuKa radiation source (1.542 Å) and LynxEye PSD detector. The quantitative phase analysis was performed by Bruker Diffrac. Eva v.2 program using Reference Intensity Ratio (RIR) method. The scale factor for each phase was manually adjusted. Infrared spectra were registered in the range 1200–400 cm−1 on a Nicolet-320 FTIR spectrometer using the KBr pellet technique with spectral resolution of 2 nm. The diffuse-reflectance spectra were recorded with a Thermo Evolution 300 UV-Vis Spectrophotometer equipped with a Praying Mantis device. For taking background, Spectralon is used. The optical absorption band was calculated based on Tauc’s equation αhν = A (Eg)n, where α is the absorption coefficient, A is the absorption constant, h is Plank’s constant, and ν is the photon frequency [40]. In the mentioned relation, n represents the type of semiconductor charge transition. The value of n is related to the characteristics of the electronic transition type in the semiconductors and n = 0.5 for a direct allowed transition; n = 2 for an indirect allowed transition; n = 3 for an indirect forbidden transition; and n = 3/2 for a direct forbidden transition. ZnMoO4 is known as a direct transition metal oxide and, therefore, the value of n = 0.5. The PL emission spectra were measured on a Horiba Fluorolog 3–22 TCS spectrophotometer (Longjumeau, France) equipped with a 450 W Xenon Lamp as the excitation source. The automated modular system had the highest sensitivity among those available on the market, allowing measurement of light emission of practically any type of samples. Double-grating monochromators were in emission in the range 200–950 nm. All spectra were measured at room temperature with the following instrumental parameters, with side entrance and exit slit of 10.00 nm.

3. Results and Discussion

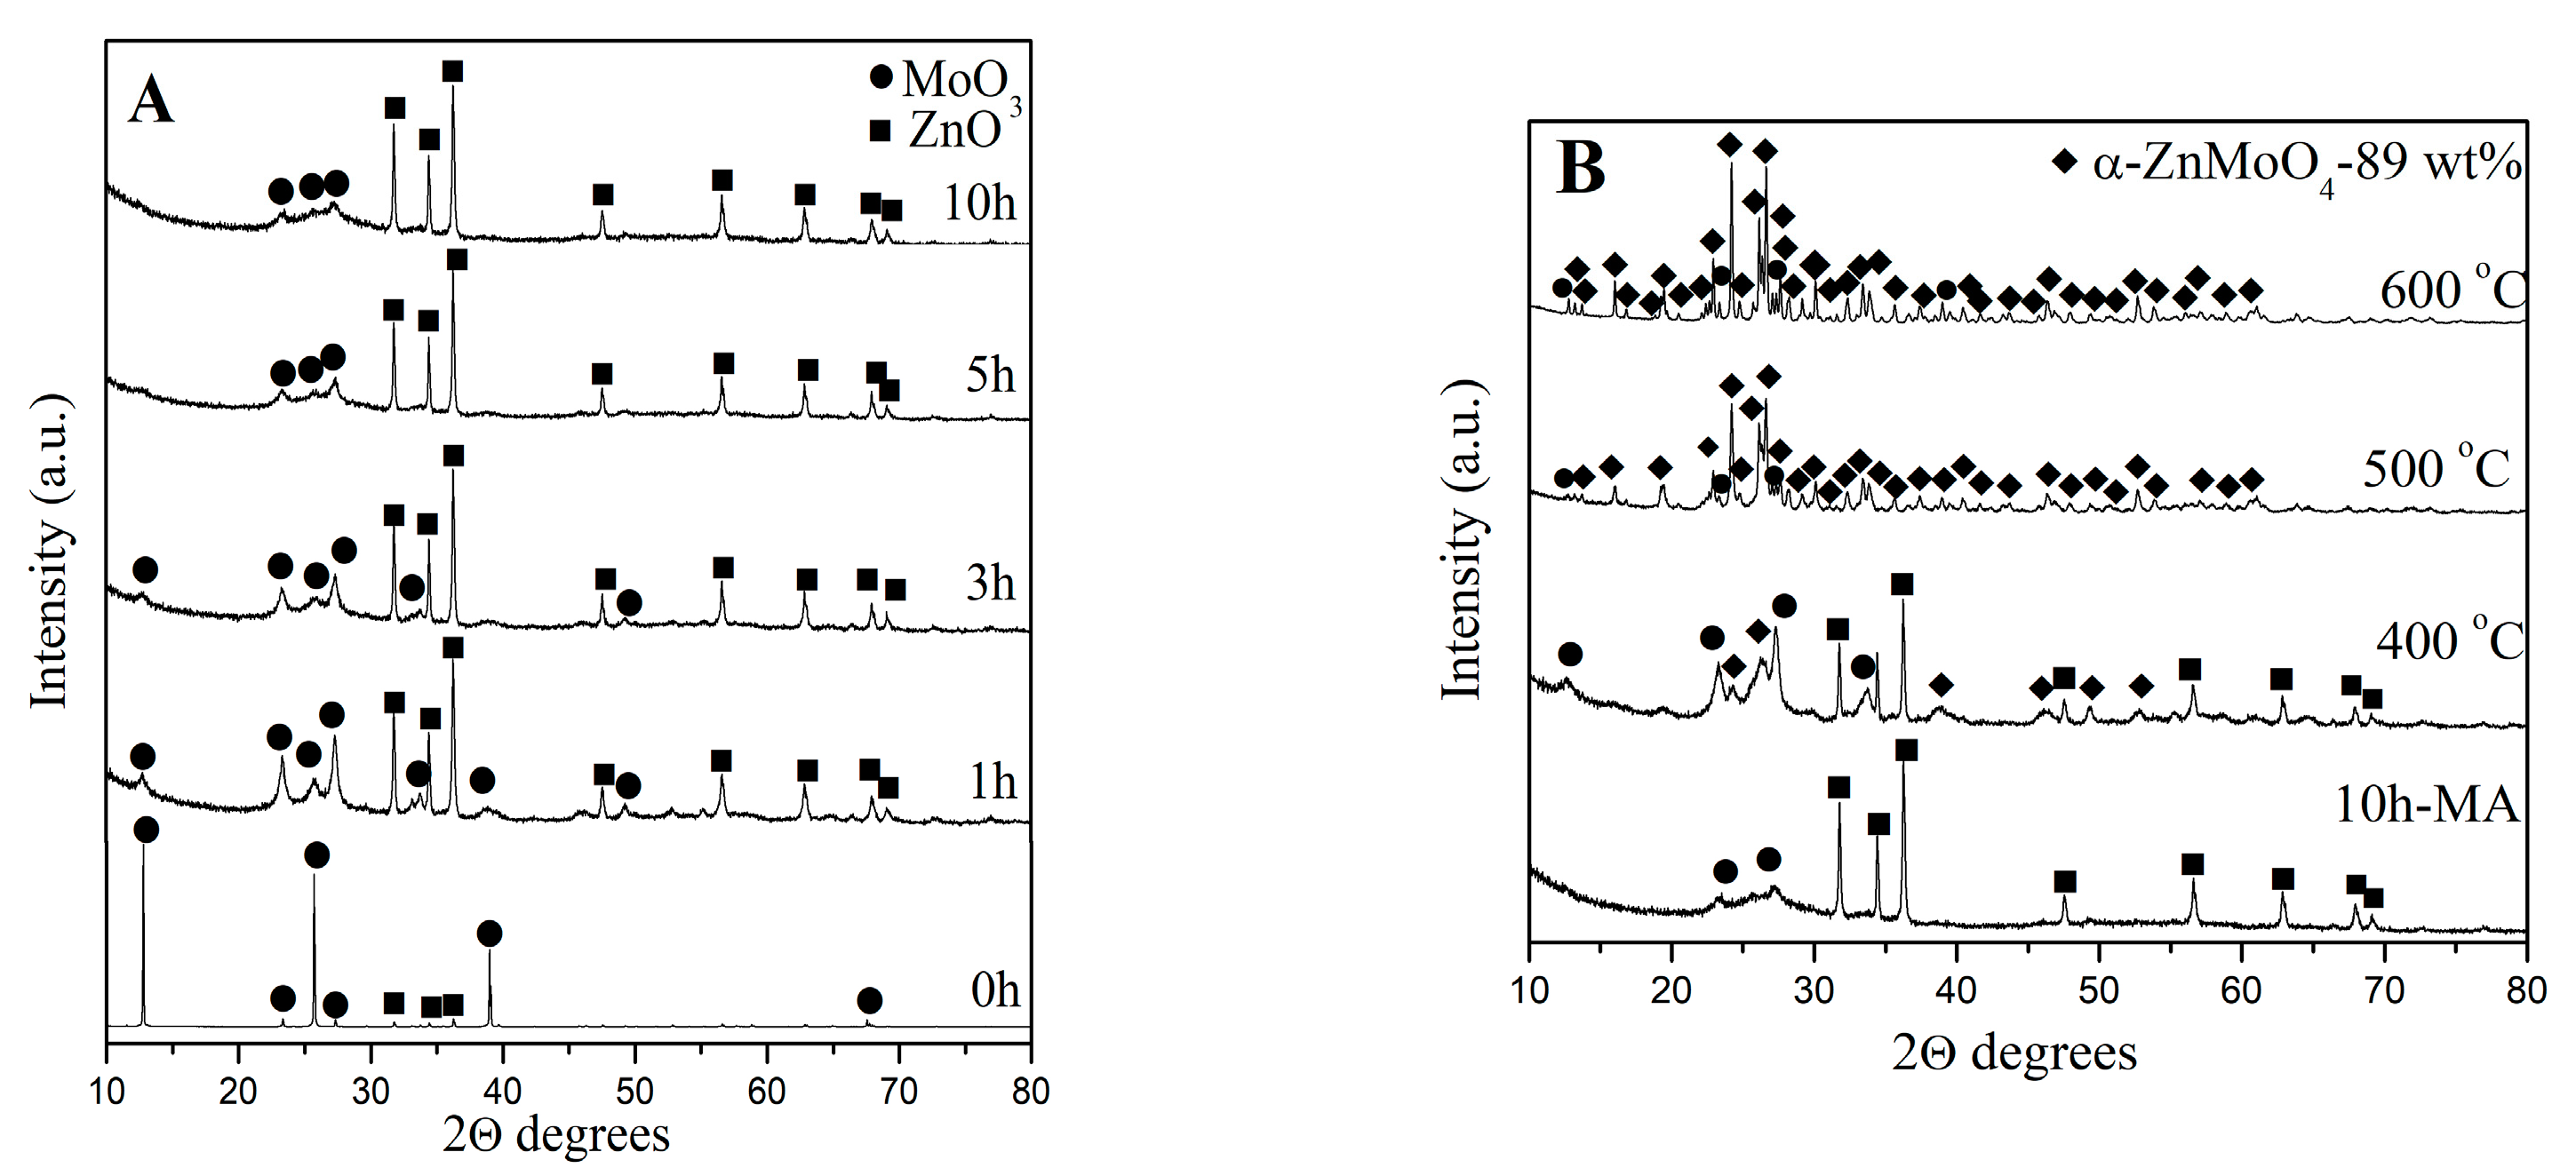
3.1. Phase Formation α- and ß-ZnMoO4 Nanoparticles

Our previous investigations show that the activation speeds of 500 and 850 rpm result in direct synthesis at room temperature of several mixed metal oxides [34,37]. In the current investigation we extended our knowledge to phase formation of ZnMoO4 by applying the same milling speeds. Figure 1 and Figure 2 show the phase transformation and phase formation of ZnMoO4 depending on the different milling speeds applied.
The defined diffraction lines of initial oxides ZnO (PDF-00-005-0664) and MoO3 (PDF-98-003-0258) were visible before the beginning of the mechanochemical process. Stronger diffraction lines typical of orthorhombic (α) MoO3 were observed compared to the lower-intensity ones of hexagonal wurtzite ZnO. Mechanochemical treatment at low milling speed (500 rpm) causes changes in the intensity and broadening of the diffraction lines of both oxides. It is observed that the diffraction lines of MoO3 have lower intensity, while those of ZnO are stronger after 5 h milling time. This tendency continued while the mixture was subjected to mechanical activation up to 10 h time. This suggests that defects build up in the crystal structure of MoO3, whereas the crystal structure of ZnO shows considerable resilience to mechanical energy throughout the process. As a result, the process of amorphization of MoO3 was caused and an amorphous halo between 20 and 30° was detected in the X-ray diffraction pattern. The analogous effect was established by us during the mechanochemical treatment of a mixture containing MoO3 with NiO and with MgO [36,41]. This result indicated that milling energy is insufficient to initiate the chemical reaction between both activated reagents. In order to prepare ZnMoO4, we performed heat treatment at different temperatures from 400 to 600 °C in the air atmosphere. The first step of annealing was 400 °C for the mechanochemically activated sample for 10 h. The XRD pattern exhibited new diffraction lines typical of α triclinic ZnMoO4 (PDF 01-070-5387) (Figure 1B). But the characteristic diffraction profiles of ZnO and MoO3 were also visible. We may deduce that two processes, starting the chemical reaction of α-ZnMoO4 and recrystallization of MoO3, occurred during the heat treatment. The numbers and intensity of diffraction lines of triclinic α-ZnMoO4 increase after annealing at 500 °C. But the lower-intensity diffraction lines of MoO3 were detected. Increasing the temperature up to 600 °C did not result in the completion of the chemical reaction, a small amount of MoO3 still remained. The strong diffraction peaks indicate a higher crystalline nature of the obtained ZnMoO4 phase. The phase compositions (weight %) and the crystallite sizes of α-ZnMoO4 were determined by the Diffracplus Eva program [42]. The results are presented in Table 1.
By X-ray diffraction analysis, we monitored the phase transformation of the initial mixture subjected to mechanochemical activation at a milling speed of 850 rpm. The early ball milling (1 h) induces only partial amorphization of MoO3 (Figure 2). This is evidence that the MoO3 underwent greater structural deformation during the mechanochemical process using both milling speeds. The new diffraction line typical for metastable ß-ZnMoO4 (PDF-00-025-1024) was observed after 3 h milling time. But the diffraction lines characteristic of MoO3 and ZnO are still visible. The formation of the single phase of ß-ZnMoO4 occurred after a milling duration of 5 h. The introduction of higher mechanical energy accelerates the chemical reaction at room temperature and no additional thermal treatment is required. The additional mechanochemical activation of 10 h did not result in a significant change in the XRD pattern, which is an indication of the structural stability of this ZnMoO4 phase. The broader diffraction lines are an indication for the formation of a crystalline phase in the nanoscale range. The average crystallite size is determined at the 30.70° line by the Scherrer equation, and it is 35 nm. Our results showed that the key factor for direct synthesis is the higher milling speed, and it is in good agreement with our previous investigations.
We can conclude that the formation of α- and ß-ZnMoO4 is achieved under different conditions. The thermostable triclinic α-ZnMoO4 phase was obtained by formation of the intermediate partial amorphous state at lower milling speed (500 rpm) and further thermal treatment at 600 °C. The metastable monoclinic ß-ZnMoO4 was prepared directly at room temperature using a higher milling speed (850 rpm).

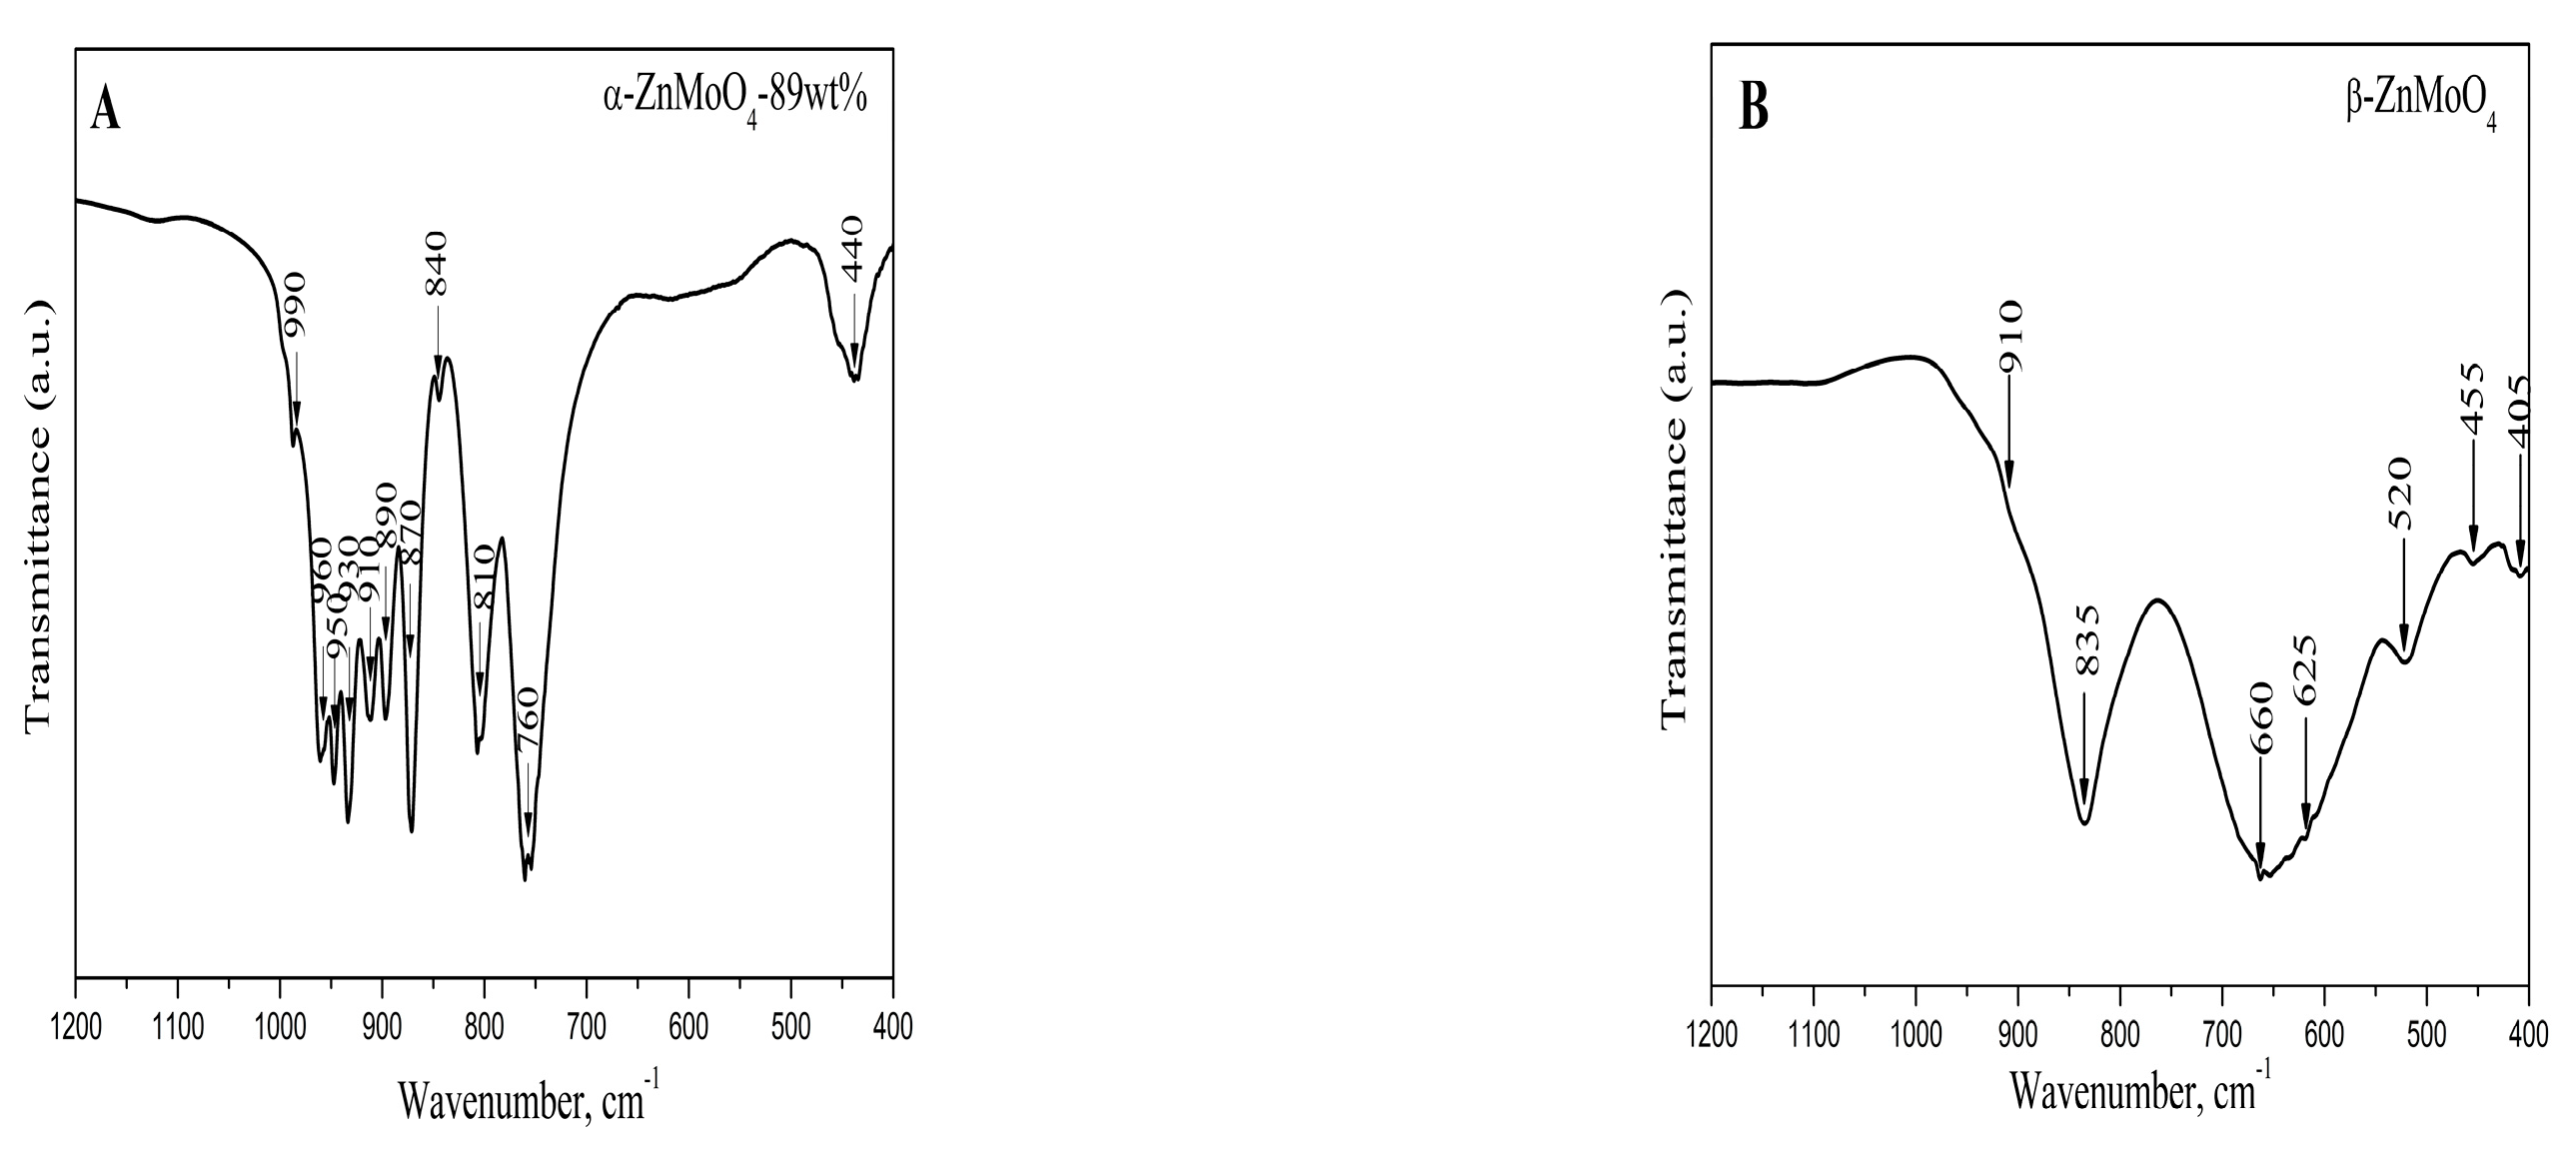
3.2. Infrared Spectroscopy

By IR spectroscopy, we confirmed the different crystal structure of the synthesized samples (Figure 3A,B). This technique is an efficient tool to distinguish structural units of both ZnMoO4 polymorphs. IR spectrum of the triclinic α-ZnMoO4 contains a set of absorption bands with strong intensity in the range from 1000 to 440 cm−1. The four bands at 960, 950, 930, and 910 cm−1 are associated with the activation of the ν1 vibration band of various MoO4 groups exhibiting low symmetry. The IR bands between 900 and 740 cm− 1 arise from the splitting of the triply degenerated ν3 asymmetric stretching mode of the asymmetrical MoO4 groups [2,4,11,28,37,43,44]. The low-frequency band at 440 cm− 1 is attributed to the bending vibration of the O-Mo-O bond within the MoO4 structure found in AMoO4 compounds [2,4,11,24,28]. H. Aitahsaine et al. also reported complex splitting of these fundamental vibrations due to the low symmetry of the triclinic structure [43]. On the other hand, the shoulder at 990 cm−1 is a result of vibration of the Mo=O terminal bond typical of unreacted MoO3, which is in good agreement with XRD analysis (Table 1).
The IR spectrum of metastable ß-ZnMoO4 exhibits a broader absorbance band from 910 to 405 cm−1 (Figure 3B). The description of this spectrum was carried out on the base on the crystal structure and vibrational data of the compounds exhibiting a wolframite-type structure [33,34,35,45]. The absorption bands observed at 910 and 835 cm−1 can be attributed to vibration of the MoO2 entity existent in the Mo2O8 groups.
The absorption lines at 660 and 625 cm−1 are characteristic of a two-oxygen bridge (Mo2O2) and arise from the asymmetric stretching of these units. Additionally, the vibrations associated with the ZnO6 polyhedra occur within the absorption range below 600 cm−1 [3,4,14,15,26].

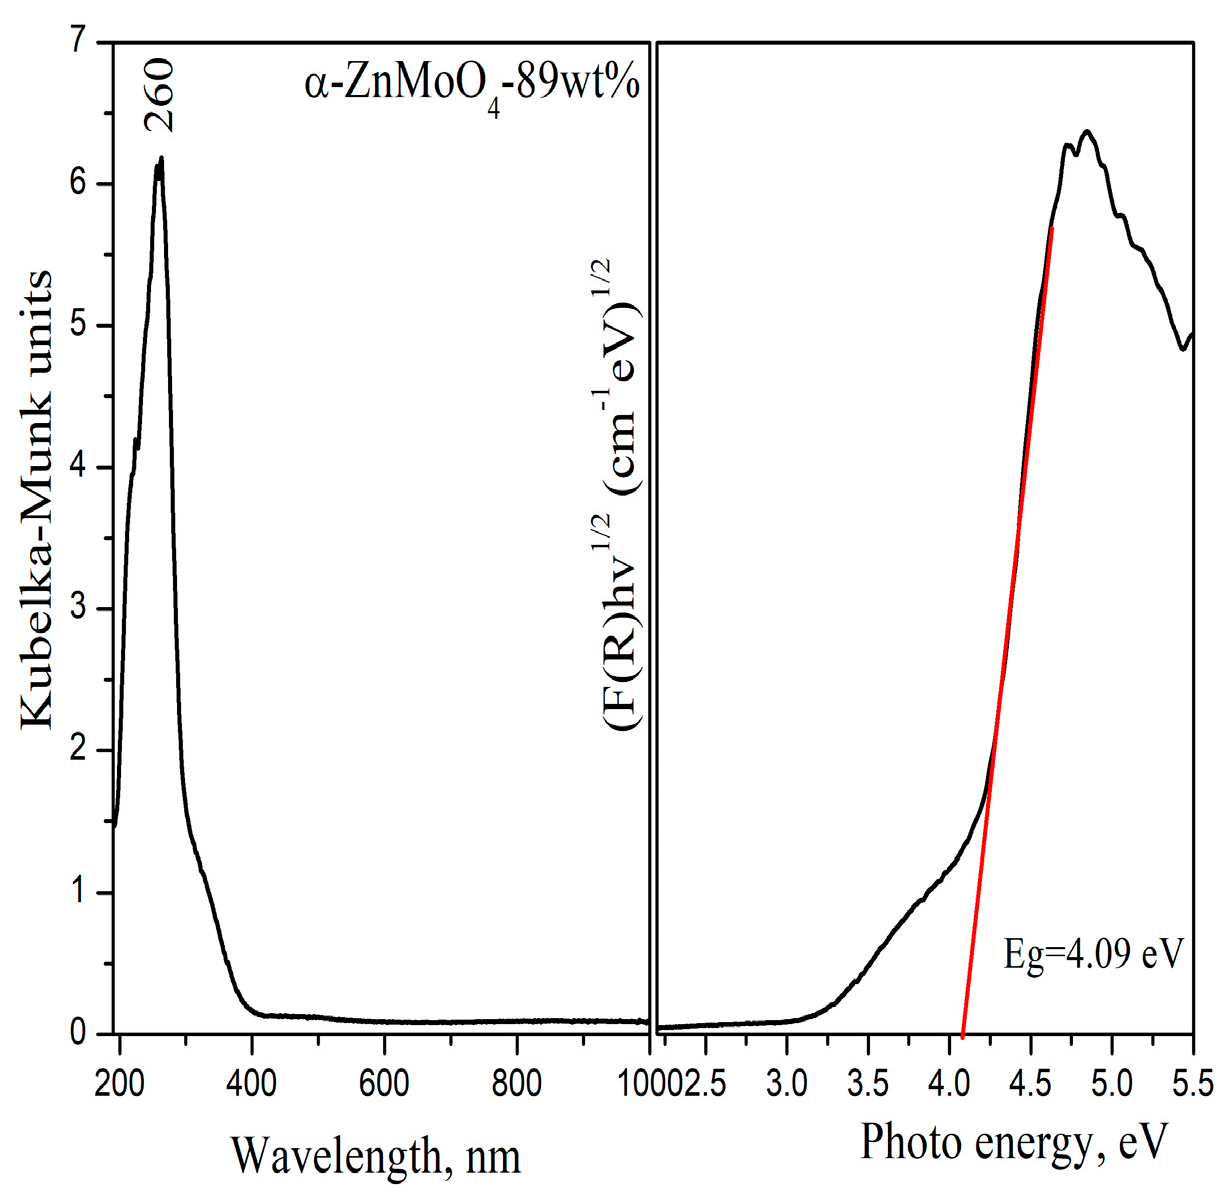
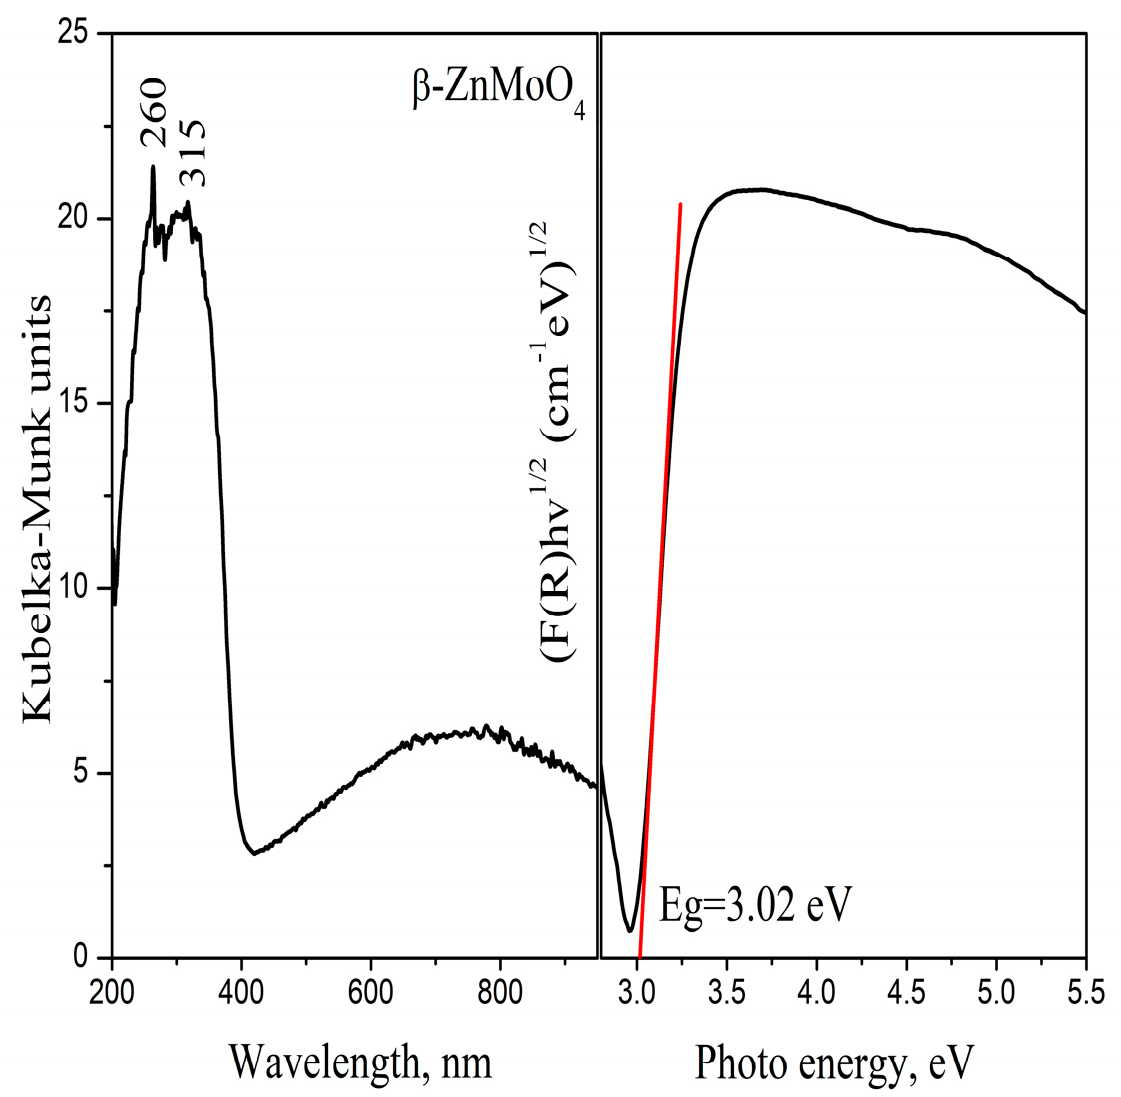
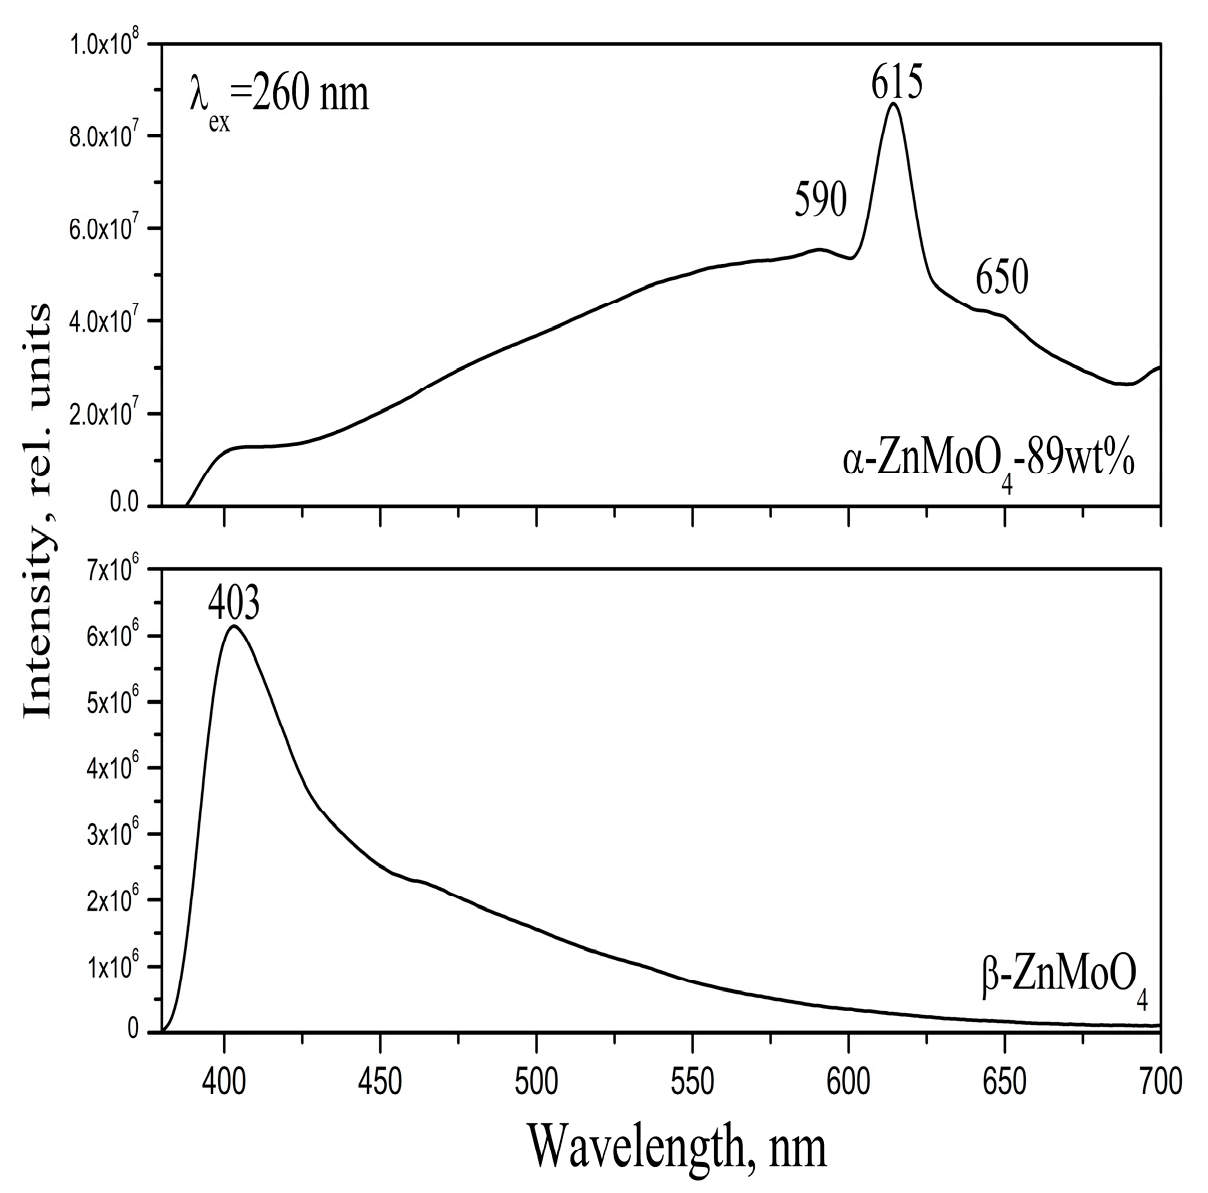
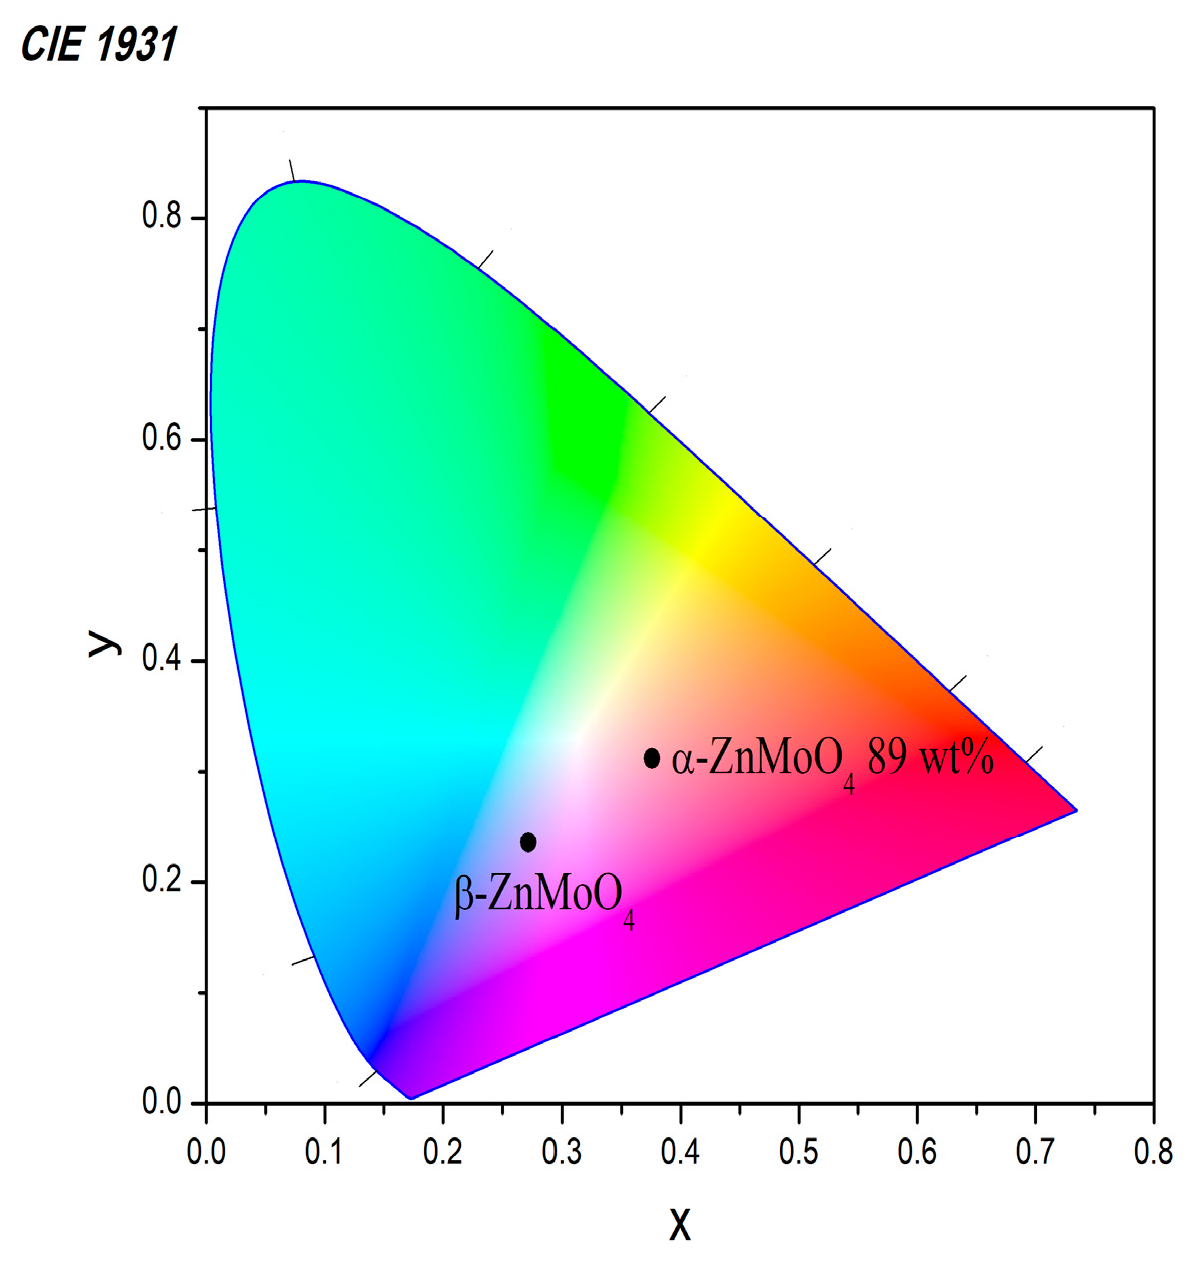
3.3. Optical Properties

The optical behavior of α- and ß-ZnMoO4 powders obtained by different milling conditions was investigated using UV-Vis and photoluminescence spectroscopies. The UV–visible absorption spectra for both samples were converted into the Kubelka–Munk function, as illustrated in Figure 4 and Figure 5, respectively. Triclinic α-ZnMoO4 powder exhibits a strong and narrow absorption peak, with a maximum at 260 nm. Both shoulders at 220 and 325 nm were observed. The peak at 260 nm is ascribed to the charge transfer from the oxygen into the central molybdenum atom within the [MoO4]2− groups [10,11,12,13]. A similar UV-Vis spectrum of α-ZnMoO4 was reported by P.J. Mafa et al. [12] and Y. Liang et al. [24]. Our previous investigation showed that MgMoO4 obtained by mechanochemical treatment followed by heat treatment also exhibits a similar absorption curve [36]. The literature indicates that the energy transition occurring between 220 and 260 nm is representative of tetrahedral MoO4 units, whereas the range from 250 to 350 nm is characteristic of octahedral MoO6 units [46,47]. We observed two broad bands with a maximum at 260 and 315 nm in the UV-Vis spectrum of monoclinic ß-ZnMoO4 [14,26]. On the other hand, along with the absorption peaks, a broad absorption tail is observed in the 400–1000 nm wavelength range, probably due to lower crystallite size (Figure 5). Our spectrum is very similar to monoclinic ß-ZnMoO4 synthesized by hydrothermal method and the crystal phase with wolframite-type structure [13,14,26,48,49]. The band gap values (Eg) for both samples were determined using Tauc’s equation. The calculated optical band gaps of α- and ß-ZnMoO4 are 4.09 eV and 3.02 eV, respectively. The higher value of the optical band gap of triclinic α-ZnMoO4 is in good agreement with the literature data [2,4,8,11,50]. The results indicate that the optical transition of ß-ZnMoO4 possesses a narrow band gap and is closer to the literature data [3,4,14,15,26].
Comparison of photoluminescence spectra of the nanocrystalline α- and ß-ZnMoO4 powders are displayed in Figure 6. Upon excitation at 260 nm, both emission spectra exhibit an asymmetric profile with following features. The PL spectrum of triclinic α-ZnMoO4 shows multiple emission peaks at 590 nm (green), 615 (orange), and 650 nm (red). The predominant peak is observed at 615 nm. According to the literature data, emission peaks from 400 to 600 nm are characteristics of the [MoO4] groups [1,5,11,24]. Based on IR analysis of α-ZnMoO4, the formation of several MoO4 units with different symmetry was established, which causes the appearance of some additional emission peaks. We reported a similar PL profile for MgMoO4 obtained by ball milling and additional heat treatment [36]. Having in mind the obtained IR data of this phase (α-ZnMoO4), as well as our previous investigations, we concluded that both the preparation method and symmetry of structural units are an essential factor for the photoluminescent properties. For comparison, P. Yadav et al. observed single IR bands typical of ν1, ν3, and bending mode of MoO4 groups and only one emission peak at 540 nm was obtained [11]. Y. Liang et al. also registered a lower number of IR bands of α-ZnMoO4 and one emission peak at 530 nm [24]. The emission peak at 403 nm is observed for monoclinic ß-ZnMoO4 (Figure 6). In this case, blue emission occurs by the electron charge transfer from oxygen ligands to the central molybdate atom inside the MoO6 groups [3,25,49]. A blue (at 420 nm) and a broad blue–green emission (from 420 nm to 480 nm) was observed at room temperature in the PL spectrum of ß-ZnMoO4 obtained by hydrothermal method [12,23]. Blue photoluminescence was reported for CdWO4 and MgWO4 with wolframite-type structure and monoclinic symmetry [49,50,51]. Z. Lou et al. have indicated that the (WO6) complex, which exhibits a minor deviation from ideal order in its crystal structures, is accountable for the emission band observed at approximately 440 nm [51]. The effect of crystallite size of α- and ß-ZnMoO4 nanopowders on PL intensity is established. The intensity of emission maximum of α-ZnMoO4 is 8.05 × 10⁷, while the emission maximum of ß-ZnMoO4 is 6.0 × 10⁶. The reduction in PL emission intensity is likely attributed to the extended duration of mechanochemical synthesis and the smaller crystallite size [52]. The above results demonstrated that the obtained α- and ß-ZnMoO4 phases possess novel photoluminescence behavior, as there are no reported emission peaks at 590, 615, and 650 nm for α-ZnMoO4 and blue emission at 403 nm for ß-ZnMoO4 in the literature data.
We think that the formation of more deformed MoO4 units at ball milling activation at 500 rpm and thermal treatment is related to the predominant emission in orange color and the appearance of two additional bands at 590 nm and 650 nm. On the other hand, MoO6 units obtained at direct mechanochemical treatment at higher milling speed determines the blue emission of ß-ZnMoO4 at 403 nm.
Figure 7 shows the corresponding CIE chromaticity diagram for both α- and ß-ZnMoO4 samples. CIE co-ordinates fall out in the strong blue (x = 0.27 and y = 0.23) and orange (x = 0.37 and y = 0.31) range, respectively. The corresponding emission color for ZnMoO4 can be tuned by varying the mechanochemical activation conditions. The blue emission color was observed for metastable ß-ZnMoO4 after long milling activation (10 h) at higher milling speed. The orange color was achieved for the thermostable α-ZnMoO4 obtained by the combination of mechanical and thermal treatment.

4. Conclusions

This study demonstrated that milling speed is an important parameter for the preparation of ZnMoO4. The direct synthesis of metastable monoclinic ß-ZnMO4 was achieved after 5 h at higher milling speeds of 850 rpm. The lower milling speed of 500 rpm led to the amorphization of MoO3 only. In this case, additional thermal treatment was carried out to prepare the crystal phase. Thermostable triclinic α-ZnMoO4 was obtained by a combination of ball milling at 500 rpm and calcination at 600 °C. By IR spectroscopy, the presence of main MoO4 and MoO6 groups of both samples was confirmed. The calculated optical band gap of triclinic α-ZnMoO4 is higher than those for monoclinic ß-ZnMoO4. The photoluminescence emission in the orange–red range was observed for α-ZnMoO4 due to the presence of deformed MoO4 units. The blue emission of ß-ZnMoO4 was registered as a result of the existence of MoO6 structural groups. As-prepared ZnMoO4 phases are a promising candidate for application as a phosphor with different emission colors.

Author Contributions

Conceptualization, M.G. and R.I.; methodology, R.I.; software, P.I.; validation, M.G. and A.Y.; formal analysis, A.Y.; investigation, M.G.; data curation, M.G.; writing—original draft preparation, M.G.; writing—review and editing, R.I.; visualization, A.Y.; supervision, R.I. All authors have read and agreed to the published version of the manuscript.

Funding

This research received no external funding.

Data Availability Statement

The original contributions presented in this study are included in the article.

Acknowledgments

Part of the experiments were performed with equipment included in the National Infrastructure NSI ESHER (NI SEVE) under grant agreement No. DO1-349/13.12.2023. Research equipment from the Distributed Research Infrastructure INFRAMAT, part of Bulgarian National Roadmap for Research Infrastructures, supported by the Bulgarian Ministry of Education and Science, was used in this investigation.

Conflicts of Interest

The authors declare no conflicts of interest.

References

  1. Zhai, B.; Ma, Q.; Yang, L.; Huang, Y.M. Growth of ZnMoO4 nanowires via vapor deposition in air. Mater. Lett. 2017, 188, 119–122. [Google Scholar] [CrossRef]
  2. Keereeta, Y.; Thongtem, T.; Thongtem, S. Characterization of ZnMoO4 nanofibers synthesized by electrospinning–calcination combinations. Mater. Lett. 2012, 68, 265–268. [Google Scholar]
  3. Cavalcante, L.S.; Moraes, E.; Almeida, M.A.P.; Dalmaschio, C.J.; Batista, N.C.; Varela, J.A.; Longo, E.; Li, M.S.; Andrés, J.; Beltrán, A. A combined theoretical and experimental study of electronic structure and optical properties of β-ZnMoO4 microcrystals. Polyhedron 2013, 54, 13–25. [Google Scholar]
  4. Keereeta, Y.; Thongtem, T.; Thongtem, S. Effect of medium solvent ratios on morphologies and optical properties of a-ZnMoO4, b-ZnMoO4 and ZnMoO4.0.8H2O crystals synthesized by microwave-hydrothermalsolvothermal method. Superlattices Microstruct. 2014, 69, 253–264. [Google Scholar]
  5. Hizhnyi, Y.; Zatovsky, I.; Nedilko, S.; Boiko, R.; Li, J.; Han, W.; Klyui, N.I. Origin of luminescence in ZnMoO4 crystals: Insights from spectroscopic studies and electronic structure calculations. J. Lumin. 2019, 211, 127–137. [Google Scholar]
  6. Jayasree, A.S.; Rahulan, K.M.; Sujatha, R.A.; Vinitha, G.; Flower, N.A.L. Influence of Ni doping on the structural and third order nonlinear optical properties of ZnMoO4 nanostructures. Ceram. Int. 2022, 48, 29267–29273. [Google Scholar]
  7. Zhou, L.Y.; Wei, J.S.; Gong, F.Z.; Huang, J.L.; Yi, L.H. A potential red phosphor ZnMoO4:Eu3+ for light-emitting diode application. J. Solid State Chem. 2008, 181, 1337–1341. [Google Scholar] [CrossRef]
  8. Lovisa, L.X.; Oliveira, M.C.; Andrés, J.; Gracia, L.; Li, M.S.; Longo, E.; Tranquilin, R.L.; Bomio, M.R.D.; Motta, F.V. Structure, morphology and photoluminescence emissions of ZnMoO4: RE3+ = Tb3+ − Tm3+ − Eu3+ (x = 1, 1.5, 2, 2.5 and 3 mol%) particles obtained by the sonochemistry method. J. Alloys Compd. 2018, 750, 55–70. [Google Scholar] [CrossRef]
  9. Zhai, B.; Ma, Q.; Yang, L.; Huan, Y.M. Effects of sintering temperature on the morphology and photoluminescence of Eu3+ doped zinc molybdenum oxide hydrate. J. Nanomater. 2018, 2018, 7418508. [Google Scholar]
  10. Jain, N.; Singh, B.P.; Singh, R.K.; Singh, J.; Singh, R.A. Enhanced photoluminescence behaviour of Eu3+ activated ZnMoO4 nanophosphors via Tb3+ co-doping for light emitting diode. J. Lumin. 2017, 168, 504–513. [Google Scholar]
  11. Yadav, P.; Sinha, E. Structural, photophysical and microwave dielectric properties of α-ZnMoO4 phosphor. J. Alloys Compd. 2019, 795, 446–453. [Google Scholar]
  12. Mafa, P.J.; Ntsendwana, B.; Mamba, B.B.; Kuvarega, A.T. Visible light driven ZnMoO4/BiFeWO6/rGO Z scheme photocatalyst for the degradation of anthraquinonic dye. J. Phys. Chem. C 2019, 123, 20605–20616. [Google Scholar]
  13. Wang, D.; Huang, M.; Zhuang, Y.; Jia, H.; Sun, J.; Guan, M. Phase- and Morphology-Controlled Synthesis of Zinc Molybdate for Excellent Photocatalytic Property. Eur. J. Inorg. Chem. 2017, 42, 4939–4946. [Google Scholar]
  14. Jiang, Y.R.; Lee, W.W.; Chen, K.T.; Wang, M.C.; Chang, K.H.; Chen, C.C. Hydrothermal synthesis of b-ZnMoO4 crystals and their photocatalytic degradation of Victoria Blue R and phenol. J. Taiwan Inst. Chem. Eng. 2014, 45, 207–218. [Google Scholar]
  15. Firmansyah, R.; Bakri, R.; Yualizar, Y. Enhancement of photocatalytic activity of ZnO by ZnMoO4 compositing under light via hydrothermal green synthesis. Inorg. Chem. Commun. 2023, 155, 110893–110902. [Google Scholar]
  16. Raj, A.M.E.S.; Mallika, C.; Swaminathan, K.; Sreedharan, O.M.; Nagaraja, K.S. Zinc(II) oxidezinc(II) molybdate composite humidity sensor. Sens. Actuators B Chem. 2002, 81, 229–236. [Google Scholar]
  17. Singh, B.; Tamta, A.; Chandra, B.; Kandpal, N.D.; Jadaun, S.S.; Panwar, A.K.; Babu, K.V.; Justin, P.; Rao, H.S.; Sekhar, K.S.K.R.C. Structural, Optical, Electrical, and Electrochemical properties of ZnMoO4 microspheres synthesized by the twin crystal method. Ceram. Int. 2023, 49, 38047–38057. [Google Scholar]
  18. Han, X.; Ge, R.; Zhang, C.; Liu, H. A facile and energy-saving preparation of α-ZnMoO4 nanorods for enhanced Li-ion intercalation application. Mater. Chem. Phys. 2022, 291, 126737–126743. [Google Scholar]
  19. Fei, J.; Sun, Q.; Li, J.; Cui, Y.; Huang, J.; Hui, W.; Hu, H. Synthesis and electrochemical performance of α-ZnMoO4 nanoparticles as anode material for lithium ion batteries. Mater. Lett. 2017, 198, 4–7. [Google Scholar]
  20. Ma, Q.; Li, X.; Li, G.; Shao, Z. Synthesis and electrochemical properties of cubic-like ZnMoO4 anode materials. J. Mater. Sci. 2020, 55, 13905–13915. [Google Scholar]
  21. Abrahams, S.C. Crystal Structure of the Transition-Metal Molybdates and Tungstates. III. Diamagnetic α-ZnMoO4. J. Chem. Phys. 1967, 46, 2052–2063. [Google Scholar]
  22. Mtioui-Sghaier, O.; Mendoza-Merono, R.; Ktari, L.; Dammak, M.; Garcıa-Granda, S. Redetermination of the β-zinc molybdate from single—Crystal X-ray diffraction date. Acta Cryst. 2015, E71, i6–i7. [Google Scholar]
  23. Abraham, Y.; Holzwarth, N.A.W.R.; Williams, T. Electronic structure and optical properties of CdMoO4 and CdWO4. Phys. Rev. B 2000, 62, 1733–1739. [Google Scholar]
  24. Liang, Y.; Liu, P.; Li, H.B.; Yang, G.W. ZnMoO4 Micro- and nanostructures synthesized by electrochemistry-assisted laser ablation in liquids and their optical properties. Cryst. Growth Des. 2012, 12, 4487–4493. [Google Scholar]
  25. Cavalcante, L.S.; Sczancoski, J.C.; Li, M.S.; Longo, E.; Varela, J.A. β-ZnMoO4 microcrystals synthesized by the surfactant-assisted hydrothermal method: Growth process and photoluminescence properties. Colloids Surf. A Physicochem. Eng. Asp. 2012, 396, 346–351. [Google Scholar]
  26. Sachuk, O.V. Nanodispersed Zn—MoO3 catalysts of selective ethanol oxidation synthesized by nontraditional methods. Rep. Natl. Acad. Sci. Ukr. 2019, 6, 48–53. [Google Scholar]
  27. Tiwari, S.K.; Singh, A.; Yadav, P.; Sonu, B.K.; Verma, R.; Rou, S.K.; Sinha, E. Structural and dielectric properties of Cu doped α ZnMoO4 ceramic system for enhanced green light emission and potential microwave application. J. Mater. Sci. Electron. 2021, 32, 12881–12889. [Google Scholar]
  28. Lv, L.; Tong, W.; Zhang, Y.; Su, Y.; Wang, X. Metastable monoclinic ZnMoO4: Hydrothermal synthesis, optical properties and photocatalytic performance. J. Nanosci. Nanotechnol. 2011, 11, 9506–9514. [Google Scholar] [CrossRef]
  29. Ryu, J.H.; Koo, S.M.; Yoon, J.W.; Lim, C.S.; Shim, K.B. Synthesis of nanocrystalline MMoO4 (M = Ni, Zn) phosphors via a citrate complex route assisted by microwave irradiation and their photoluminescence. Mater. Lett. 2006, 60, 1702–1705. [Google Scholar] [CrossRef]
  30. Spassky, D.A.; Mikhailin, V.V.; Savon, A.E.; Galashov, E.N.; Shlegel, V.N.; Vasiliev, Y.V. Low temperature luminescence of ZnMoO4 single crystals grown by low temperature gradient Czochralski technique. Opt. Mater. 2012, 34, 1804–1810. [Google Scholar] [CrossRef]
  31. Nascimento, J.F.L.; Nobre, F.X.; Batista, F.M.C.; Cabot, A.; Vendrell, X.; Mestres, L.; Mendes, O.C.; Ferreira, R.D.; Ruiz, Y.L.; Quaresma, J.N.N. BaNb2O6 at room temperature by ball milling method: Structural, optical, morphology, and electrochemistry properties. Inorg. Chem. 2023, 62, 16323–16328. [Google Scholar] [PubMed]
  32. Lee, H.K.; Lee, J.H.; Moon, H.R. Mechanochemistry as a reconstruction tool of decomposed metal–organic frameworks. Inorg. Chem. 2021, 60, 11825–11829. [Google Scholar]
  33. Mancheva, M.N.; Iordanova, R.S.; Klissurski, D.G.; Tyuliev, G.T.; Kunev, B.N. Direct Mechanochemical synthesis of nanocrystalline NiWO4. J. Phys. Chem. C 2007, 111, 1101–1104. [Google Scholar] [CrossRef]
  34. Mancheva, M.; Iordanova, R.; Dimitriev, Y. Mechanochemical synthesis of nanocrystalline ZnWO4 at room temperature. J. Alloys Compd. 2011, 509, 15–20. [Google Scholar] [CrossRef]
  35. Gancheva, M.; Naydenov, A.; Iordanova, R.; Nihtianova, D.; Stefanov, P. Mechanochemically assisted solid state synthesis, characterization, and catalytic properties of MgWO4. J. Mater. Sci. 2015, 50, 3447–3456. [Google Scholar] [CrossRef]
  36. Gancheva, M.; Rojac, T.; Iordanova, R.; Piroeva, I.; Ivanov, P. Structural and optical properties of MgMoO4 prepared by mechanochemical technique. Ceram. Int. 2022, 48, 7149–17156. [Google Scholar] [CrossRef]
  37. Gancheva, M.; Iordanova, R.; Koseva, I.; Avdeev, G.; Burdina, G.; Ivanov, P. Synthesis and luminescent properties of barium molybdate nanoparticles. Materials 2023, 16, 7025. [Google Scholar] [CrossRef]
  38. Kosmac, T.; Courtney, T.H. Milling and mechanical alloying of inorganic nonmetallics. J. Mater. Res. 1992, 7, 1519–1525. [Google Scholar]
  39. Zhang, F.L.; Wang, C.Y.; Zhu, M. Nanostructured WC/Co composite powder prepared by high energy ball milling. Scr. Mater. 2003, 49, 1123–1128. [Google Scholar] [CrossRef]
  40. Tauc, J. Absorption edge and internal electric fields in amorphous semiconductors. Mater. Res. Bull. 1970, 5, 721–729. [Google Scholar]
  41. Klissurski, D.; Mancheva, M.; Iordanova, R.; Tyuliev, G.; Kunev, B. Mechanochemical synthesis of nanocrystalline nickel molybdates. J. Alloys Compd. 2006, 422, 53–57. [Google Scholar]
  42. Axs Bruker. V.4 Topas, 2: General Profile and Structure Analysis Software for Powder Diffraction Data—User’s Manual; Bruker AXS: Karlsruhe, Germany, 2008. [Google Scholar]
  43. Aitahsaine, H.; Zbair, M.; Ezahri, M.; Benlhachemi, A.; Bakiz, B.; Guinnetonb, F.; Gavarri, J.-R. Structural and Temperature-dependent vibrational analyses of the non-centrosymmetric ZnMoO4 molybdate. J. Mater. Environ. Sci. 2016, 7, 3076–3083. [Google Scholar]
  44. Tana, W.; Luan, J. Investigation into the synthesis conditions of CuMoO4 by an in situ method and its photocatalytic properties under visible light irradiation. RSC Adv. 2020, 10, 9745–9759. [Google Scholar]
  45. Fomichev, V.V.; Kondratov, O.I. Vibration spectra of compounds with the wolframite structure. Spectrochim. Acta 1994, A50, 1113–1120. [Google Scholar]
  46. Fournier, M.; Louis, C.; Che, M.; Chaquin, P.; Masure, D. Polyoxometallates as models for oxide catalysts: Part I. An UV-visible reflectance study of polyoxomolybdates: Influence of polyhedra arrangement on the electronic transitions and comparison with supported molybdenum catalysts. J. Catal. 1989, 119, 400–414. [Google Scholar]
  47. Jeziorowski, H.; Knoezinger, H. Raman and ultraviolet spectroscopic characterization of molybdena on alumina catalysts. J. Phys. Chem. 1979, 83, 1166–1173. [Google Scholar]
  48. Dong, T.; Li, Z.; Ding, Z.; Wu, L.; Wang, X.; Fu, X. Characterizations and properties of Eu3+-doped ZnWO4 prepared via a facile self-propagating combustion method. Mater. Res. Bull. 2008, 43, 1694–1701. [Google Scholar]
  49. Jayaprakash, J.; Krishnakumar, V. Synthesis and optical characterization of cerium doped MgWO4 phosphor. Mater. Today Proceed. 2020, 26, 3514–3517. [Google Scholar]
  50. Jia, R.; Wu, Q.; Zhang, G.; Ding, Y. Preparation, structural and optical properties of ZnWO4 and CdWO4 nanofilms. J. Mater. Sci. 2007, 42, 4887–4891. [Google Scholar]
  51. Lou, Z.; Hao, J.; Cocivera, M. Luminescence of ZnWO4 and CdWO4 thin films prepared by spray pyrolysis. J. Lumin. 2002, 99, 349–354. [Google Scholar]
  52. Mishra, S.; Khare, A.; Tiwari, S.; Kshatri, D.S. Diminution in photoluminescent intensity of SrS: Ce3+ phosphor due to increased milling time. J. Alloys Compd. 2017, 695, 1956–1965. [Google Scholar]
Figure 1. (A) XRD patterns of the starting oxides mechanochemically activated for various milling durations at 500 rpm. (B) XRD patterns of the sample mechanochemically activated for 10 h at 500 rpm and heat treatment at various temperatures, • is MoO3 and ▪ is ZnO.
Jmmp 09 00118 g001
Figure 2. XRD patterns of the starting oxides mechanochemically activated for various milling durations at 850 rpm.
Jmmp 09 00118 g002
Figure 3. (A) IR spectrum of the mechanochemically activated mixture for 10 h at 500 rpm and heat treatment at 600 °C. (B) IR spectrum of the mechanochemically activated mixture for 10 h at 850 rpm.
Jmmp 09 00118 g003
Figure 4. The Kubelka–Munk function of the triclinic α-ZnMoO4. The Tous plots of F (R) (αhν)1/2 versus the photon energy ().
Jmmp 09 00118 g004
Figure 5. The Kubelka–Munk function of the monoclinic ß-ZnMoO4. The Tous plots of F (R) (αhν)1/2 versus the photon energy ().
Jmmp 09 00118 g005
Figure 6. Emission spectra of the triclinic α- and monoclinic ß-ZnMoO4 samples.
Jmmp 09 00118 g006
Figure 7. CIE diagram of the triclinic α- and monoclinic ß-ZnMoO4 samples.
Jmmp 09 00118 g007
Table 1. Presence of the crystal phases and the crystalline size of triclinic α-ZnMoO4 heated at 400, 500, and 600 °C.
SamplesPhase Composition, wt%Crystallite Size, nm
10 h milling time,
at 500 rpm
49 wt% ZnO
51 wt% MoO3
10 h milling time,
heated at 400 °C
15 wt% α-ZnMoO4
40 wt% ZnO
45 wt% MoO3
α-ZnMoO4-20 nm (±3)
10 h milling time,
heated at 500 °C
80 wt% α-ZnMoO4
20 wt% o-MoO3
α-ZnMoO4-75 nm (±4)
10 h milling time,
heated at 600 °C
89 wt% α-ZnMoO4
11 wt% o-MoO3
α-ZnMoO4-85 nm (±5)
Disclaimer/Publisher’s Note: The statements, opinions and data contained in all publications are solely those of the individual author(s) and contributor(s) and not of MDPI and/or the editor(s). MDPI and/or the editor(s) disclaim responsibility for any injury to people or property resulting from any ideas, methods, instructions or products referred to in the content.

