Article

Effects of Mixing Speed and Mixing Time on Powder Segregation During Powder Mixing for Binder Jetting Additive Manufacturing: An Experimental Study

1
Department of Industrial & Systems Engineering, Texas A&M University, College Station, TX 77843, USA
2
Saint-Gobain Research North America, Northborough, MA 01532, USA
*
Author to whom correspondence should be addressed.
J. Manuf. Mater. Process. 2025, 9(4), 117; https://doi.org/10.3390/jmmp9040117
Submission received: 21 February 2025 / Revised: 14 March 2025 / Accepted: 1 April 2025 / Published: 3 April 2025

Abstract

The binder jetting additive manufacturing process offers the ability to create three-dimensional parts layer by layer. However, using any powder that contains particles with different sizes, shapes, or densities can lead to powder segregation during the mixing, dispensing, and spreading steps of the binder jetting additive manufacturing process. Powder segregation can often lead to uneven powder distribution across the powder bed, potentially causing defects in final parts. Therefore, it is important to understand powder segregation in mixing, dispensing, and spreading. Reported studies on powder segregation in mixing were conducted primarily on pharmaceutical or food powder that have different properties compared to metal or ceramic powder used in binder jetting additive manufacturing. There is a need for a deep understanding of how mixing speed and mixing time affect powder segregation in the context of binder jetting additive manufacturing. This paper reports an experimental investigation using a two-variable, two-level full-factorial design to examine the main effects and interaction effect of mixing speed and mixing time on powder segregation in the mixing of Powder A and Powder B for binder jetting additive manufacturing. The results reveal that segregation was more severe at the high level of mixing speed and the high level of mixing time. These findings provide useful insights for selecting mixing variables and controlling segregation, essential for achieving high-quality printed parts in binder jetting additive manufacturing.

1. Introduction

Powder bed additive manufacturing processes include powder bed fusion (PBF) and binder jetting [1]. In powder bed fusion, thermal energy (laser or electron beam) is used to fuse selected regions of a powder bed, layer by layer, to form a three-dimensional (3D) object [2]. Binder jetting involves the deposition of a liquid binding agent onto selected regions of a powder bed, layer by layer, to form a 3D object [3]. Major steps of binder jetting with a hopper are illustrated in Figure 1 and briefly described below [4,5].
Step 1: The powder for printing is poured into the mixing jar of a mixing device.
Step 2: The mixing device mixes the powder at a mixing speed for a given mixing time. Mixing speed pertains to the rate at which the mixing device operates, while mixing time refers to the duration during which the powder in the mixing jar is subjected to agitation.
Step 3: The mixed powder is poured into the hopper of the binder jetting printer.
Step 4: The build plate of the binder jetting printer is lowered by a distance equal to layer thickness (LT).
Step 5: The powder is dispensed from the hopper onto the powder bed as the hopper moves from right to left over the build plate. Simultaneously, a roller spreads the powder across the powder bed, creating a layer of powder for subsequent steps.
Step 6: A liquid binder is deposited from the print head onto selected regions of the powder bed to bind particles in these regions together according to the 3D model of the parts to be printed.
In binder jetting, mixed powders (of different materials or/and particle sizes) can be used primarily for two purposes. Powders of different materials can be used to fabricate composite materials. For instance, Li et al. fabricated copper/diamond composite samples using binder jetting additive manufacturing from mixed copper powder (with particle size of 30.8 µm) and diamond powder (with particle size of 39.1 µm) for heat-dissipating devices in the electronics industry [6]. Powders of the same material but different particle sizes can be used to increase powder packing density, sintered density of printed parts, and mechanical properties of the final parts. For instance, Chen et al. utilized a bimodal mixture of 316 L stainless steel powders (with particle sizes of 13.71 µm and 48.15 µm, respectively) to improve powder bed packing density [7]. Similarly, Du et al. combined alumina powders of three different sizes (with particle sizes of 2, 10, and 70 µm) to achieve higher packing density than individual powders [8].
If the powder contains particles of different sizes, shapes, or materials (for example, one has a higher density than the other), powder segregation can occur during mixing, dispensing, or spreading of the powder. Powder segregation can lead to uneven powder distribution over the powder bed, potentially causing defects (such as cracks and porosity) or uneven performance in printed parts [4,9,10]. Therefore, to fabricate high-quality parts using binder jetting additive manufacturing, it is important to understand powder segregation in mixing, dispensing, and spreading.
Table 1 summarizes the reported studies on powder segregation during powder mixing. In these reported studies, the results are inconsistent regarding the effects of mixing speed and mixing time on powder segregation [11,12,13,14,15,16]. The studies show that higher mixing speeds promote segregation [11,12] in some studies, whereas they reduce segregation in some other studies [13]. Similarly, longer mixing time reduces segregation [14,15] in some studies but does not affect segregation after the mixing time reaches a certain point in another study [16]. Additionally, these reported studies were conducted primarily on pharmaceutical powders [14] or food powder [17] that have different properties compared to metal or ceramic powder used in binder jetting additive manufacturing. Powders commonly used in pharmaceuticals include lactose, microcrystalline cellulose, and starch. They are generally more uniform in particle size distribution and shape. In contrast, metal and ceramic powders used in binder jetting additive manufacturing typically have higher density and hardness and a broader range of particle sizes and shapes. In the literature, there are no reports on systematic investigations of powder segregation in mixing for binder jetting additive manufacturing.
This study aims to address this gap by investigating, using a two-variable, two-level full-factorial design, the effects of mixing speed and mixing time on powder segregation during the mixing of Powder A and Powder B for binder jetting additive manufacturing. Organized into four sections, this paper begins with an introduction. Section 2 details the materials and methods used in this study. Section 3 discusses the main effects and interaction effect of the mixing speed and mixing time on segregation. Lastly, Section 4 presents the conclusions drawn from this study.

2. Materials and Methods
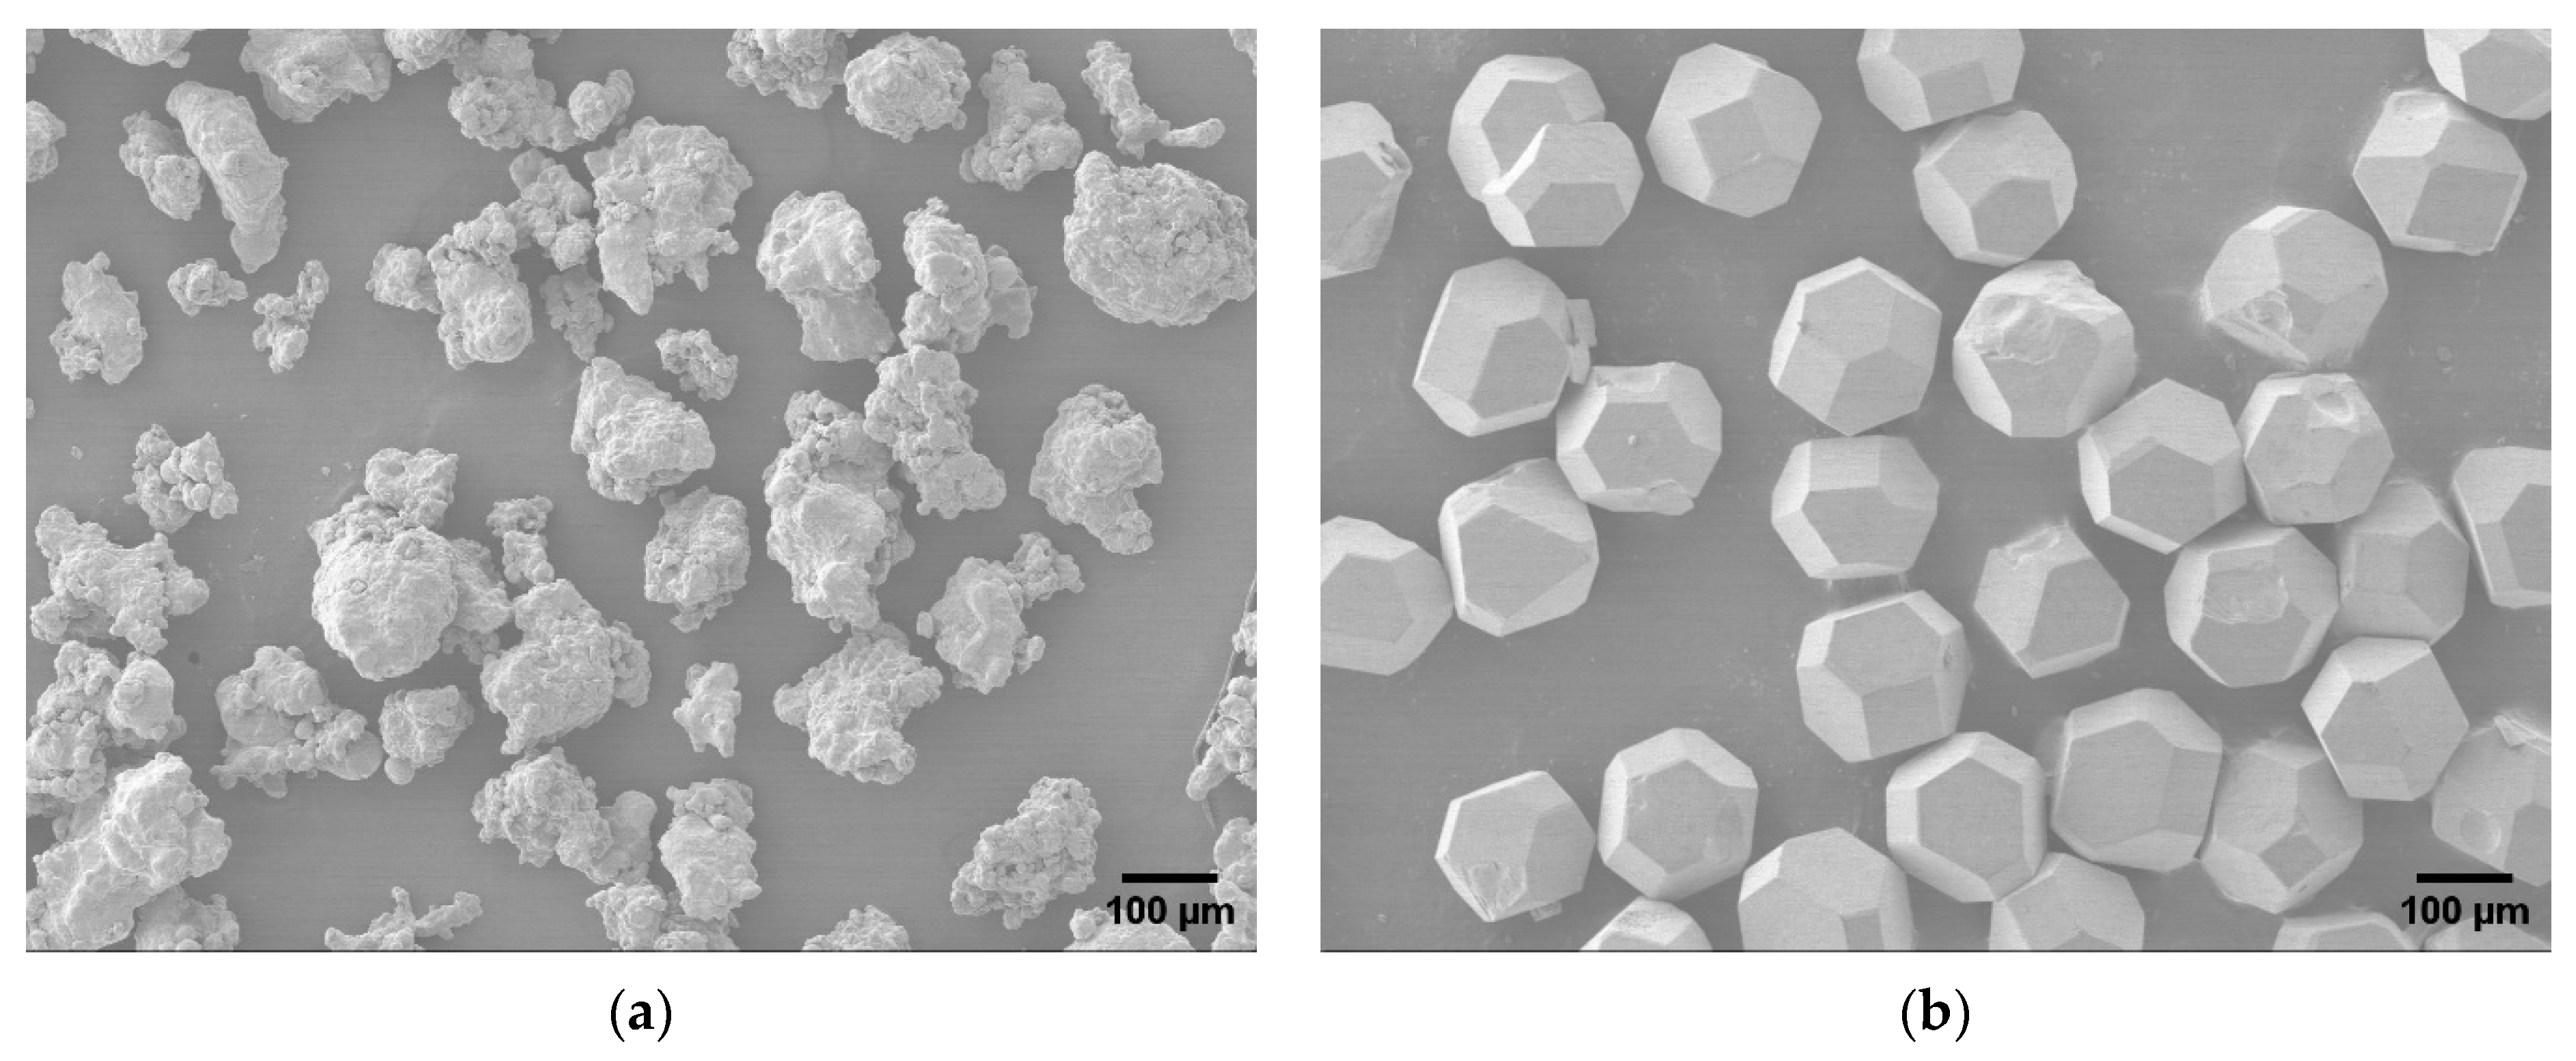
2.1. Materials

Two types of powder (Powder A and Powder B) were used in this study. Table 2 lists information regarding Powder A and Powder B. Figure 2 shows SEM images of Powder A and Powder B. The true density of both types of powder was measured using a gas pycnometer (Micromeritics, AccuPyc II 1345, Norcross, GA, USA). The true density of a powder refers to the density of the solid material itself, excluding any void spaces or pores between individual particles. Particle shape and size were analyzed using images captured with a field emission scanning electron microscope (SEM: JSM7500, RRID: SCR_022202, JEOL, Tokyo, Japan). The resulting TIFF (.tif) files of the microscope images were then processed using ImageJ Fiji software (version 1.54f) to measure the average powder particle size.

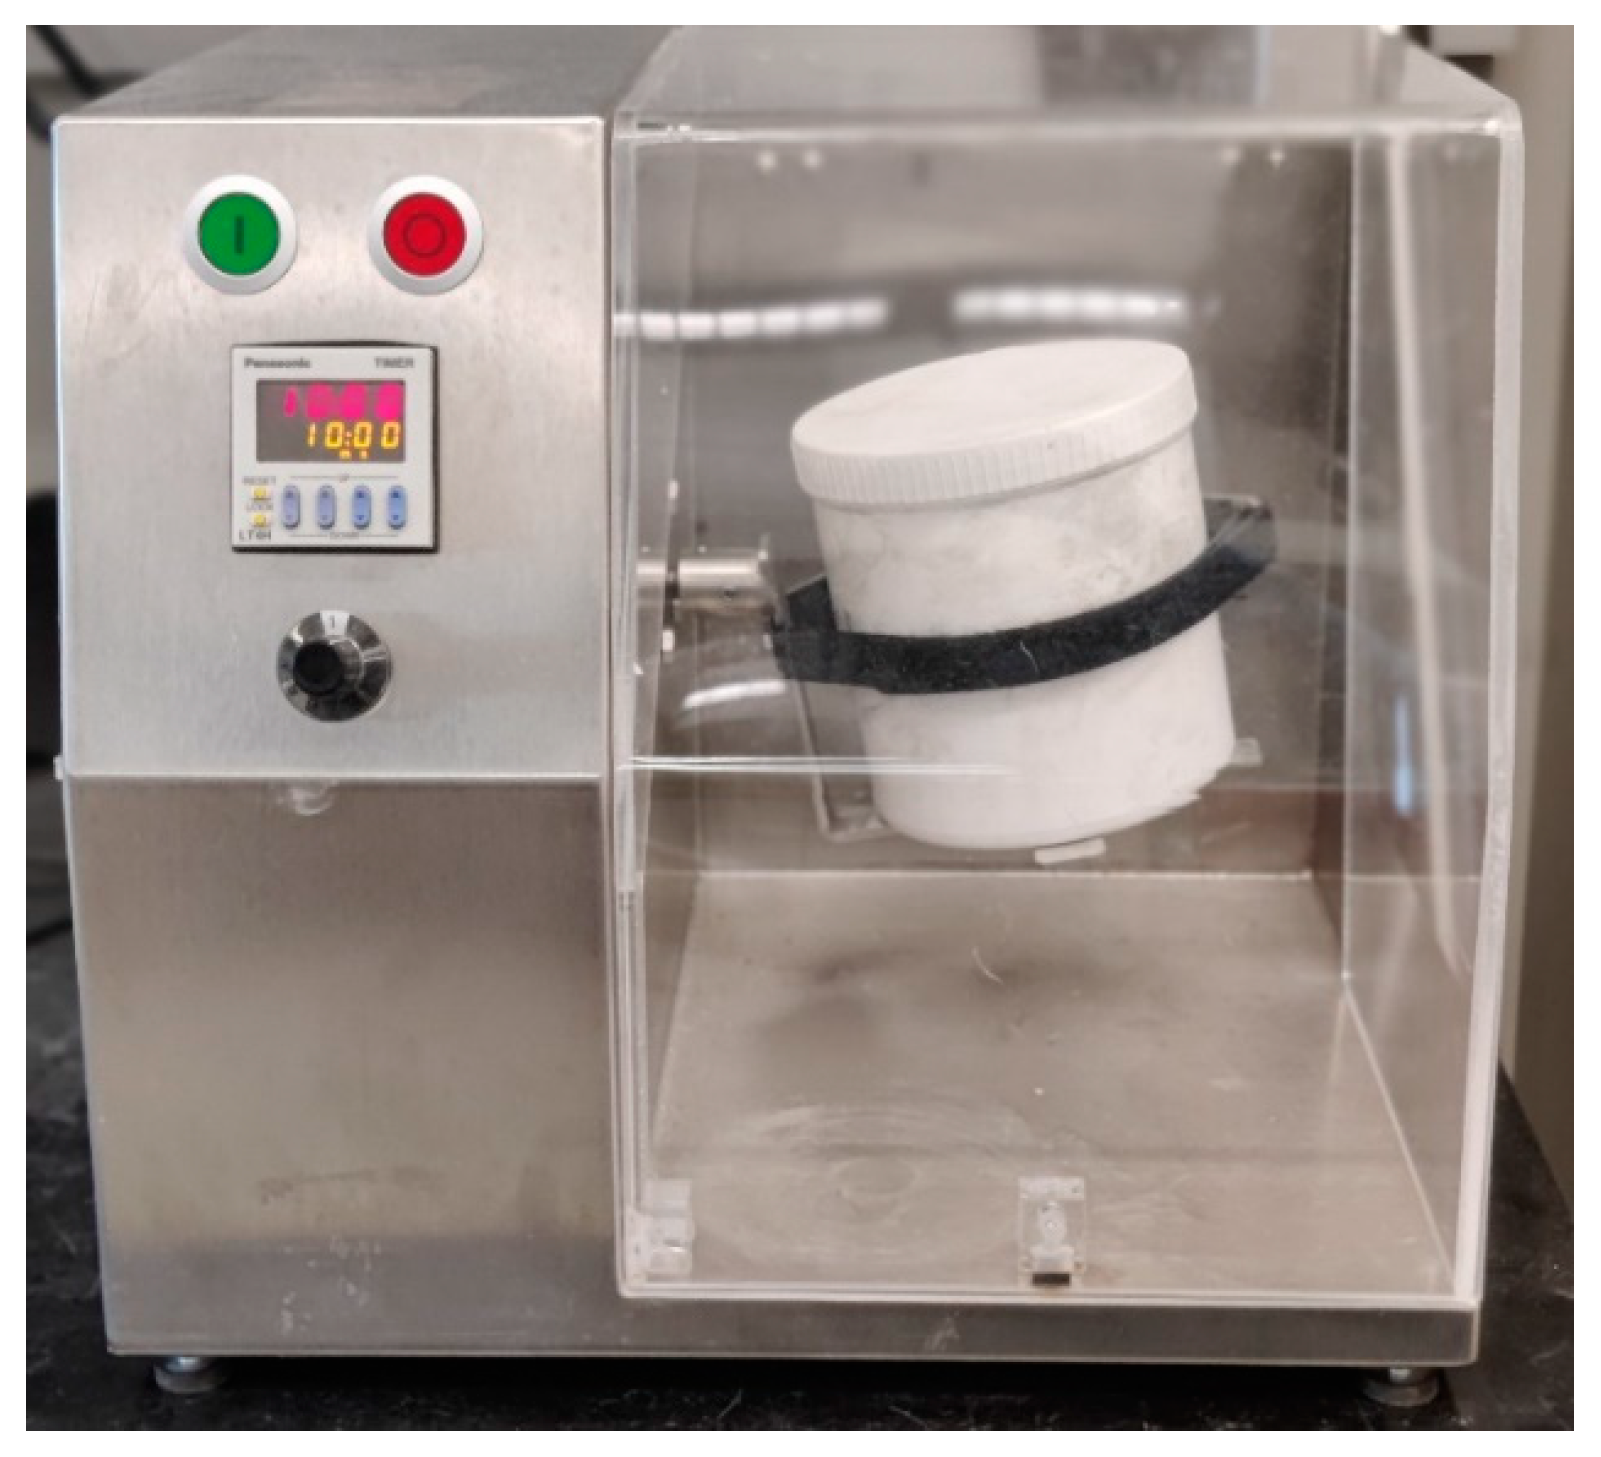
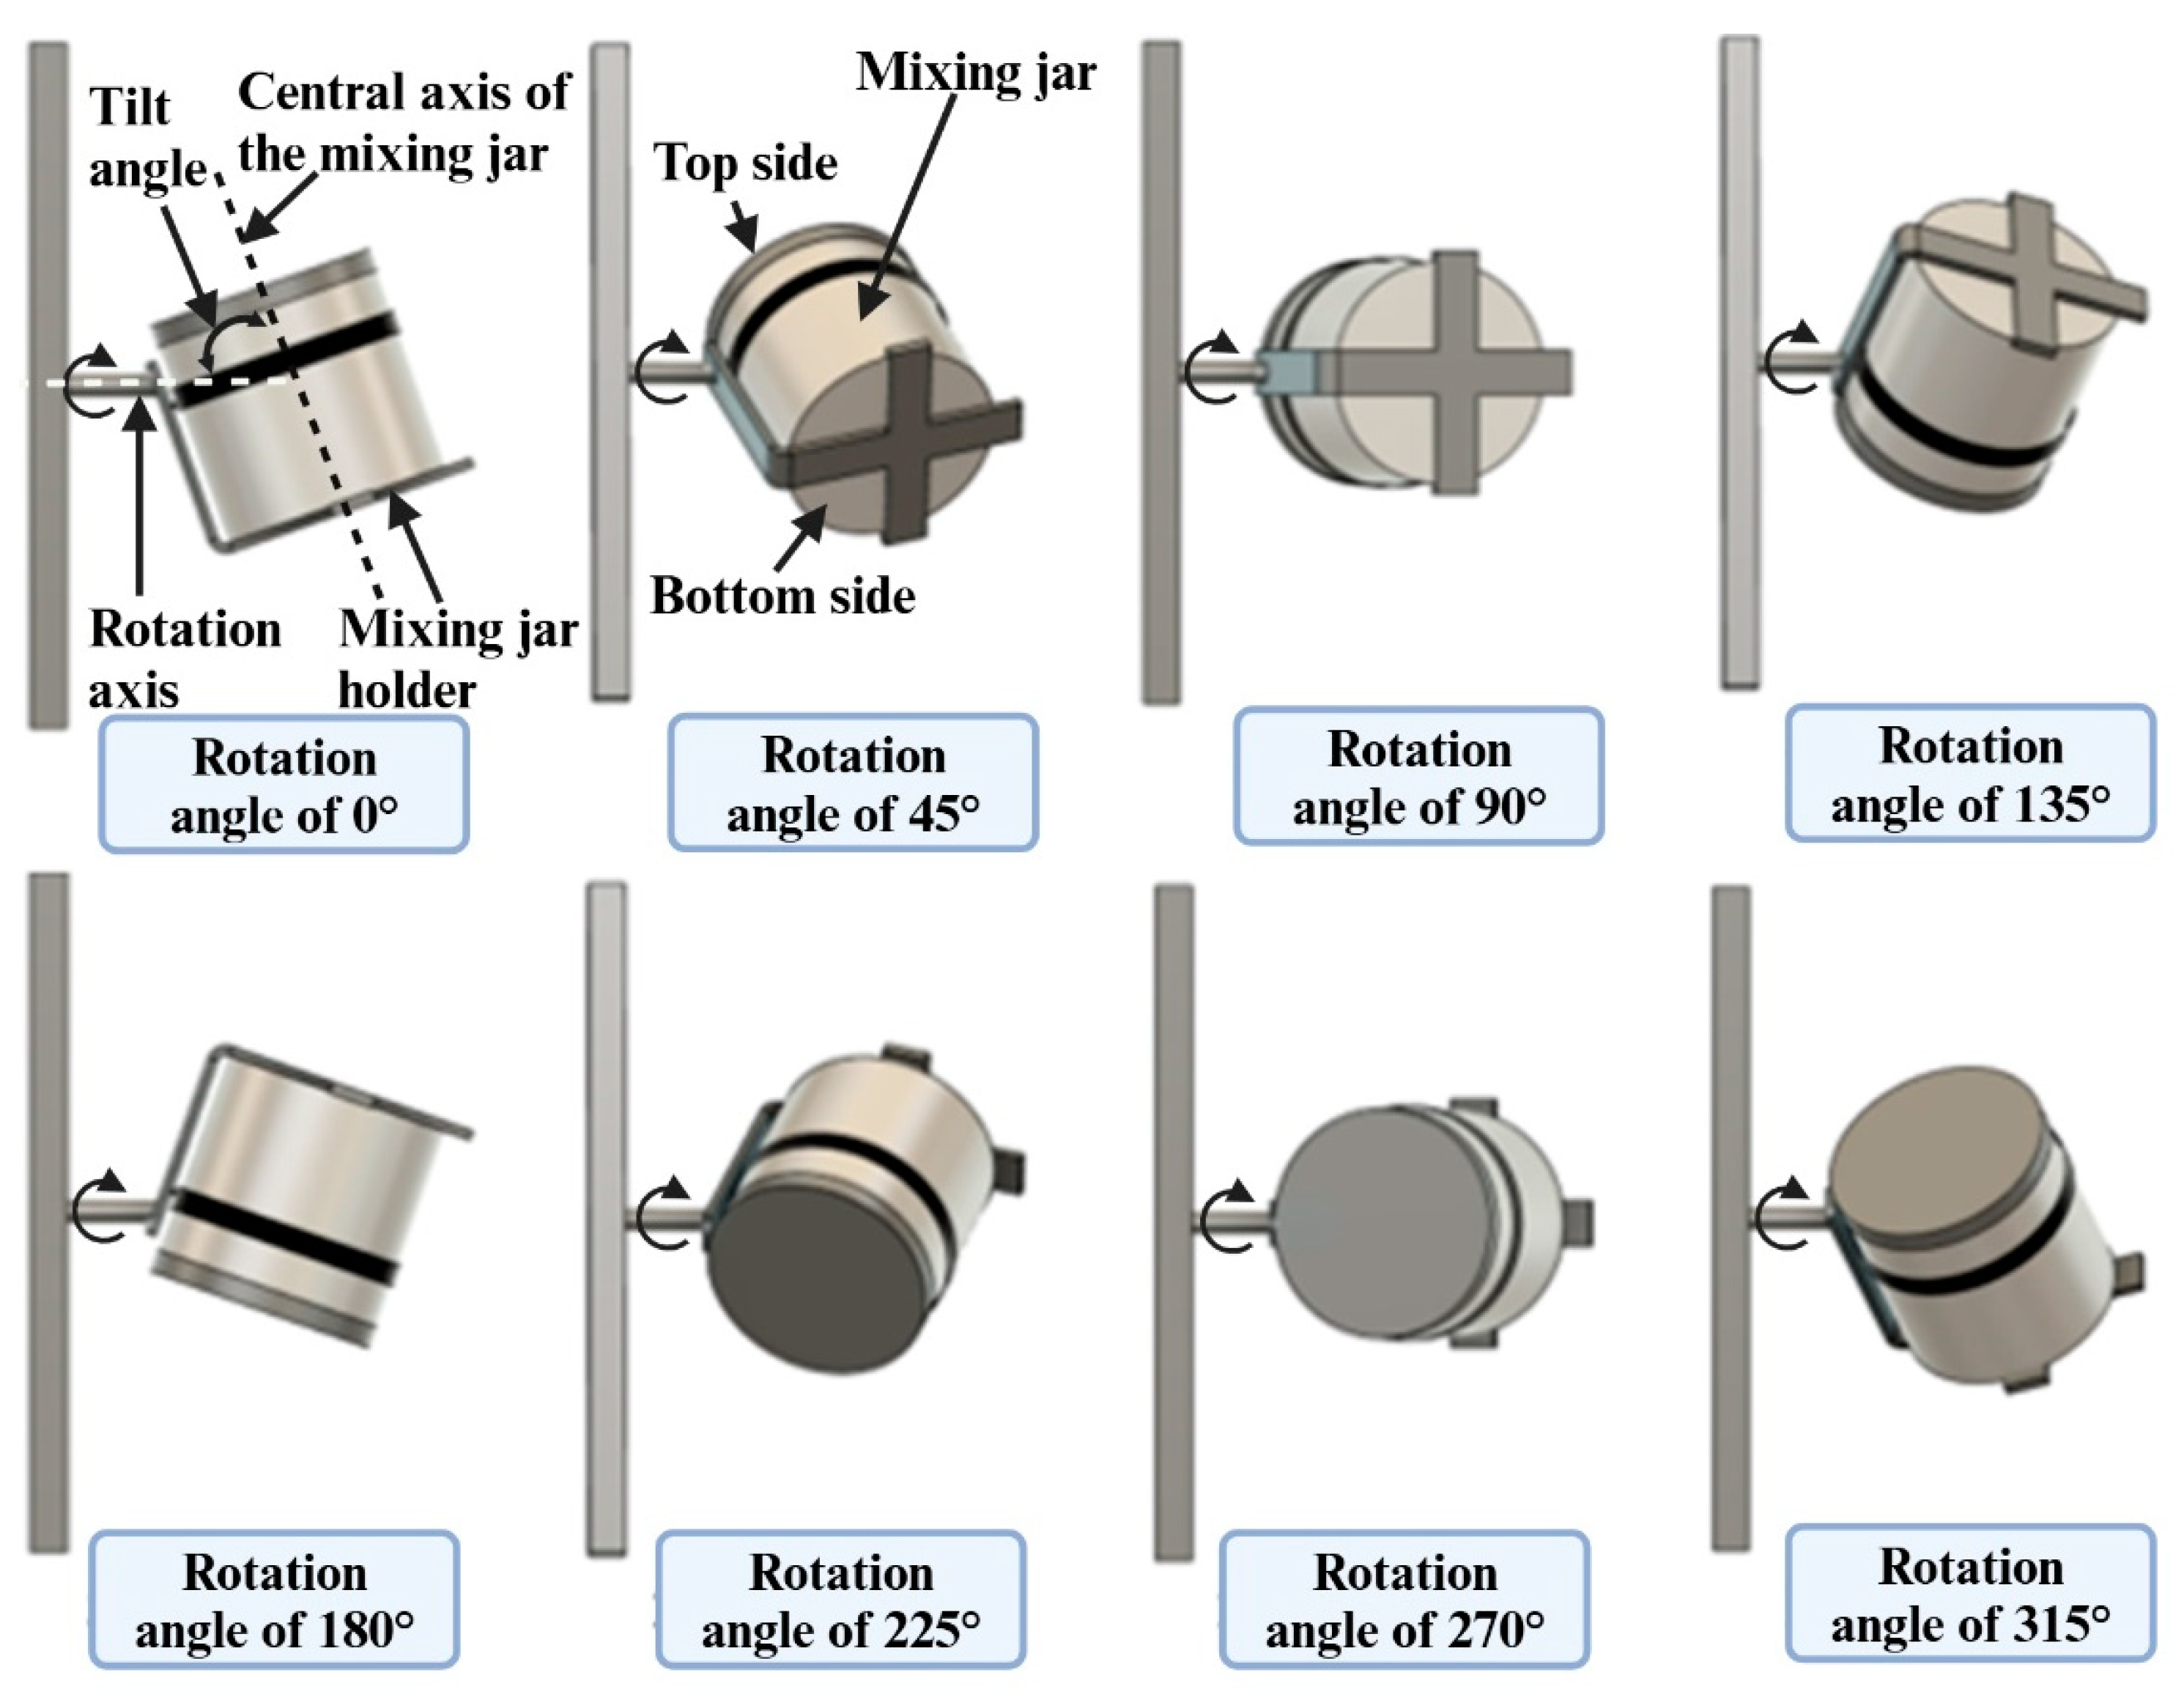
2.2. Mixing Equipment

The drum blender (Mixomat mini, Fuchs Maschinen AG, Granges-Paccot, Switzerland) shown in Figure 3 was used as the mixing equipment. Its load capacity was 2000 g, and maximum speed was 147 rpm. This paper studies the effects of jar rotation (speed and duration) on powder segregation. The jar rotates 360 degrees continuously. Figure 4 shows the relative positions of the mixing jar viewed from the side as it rotates to these angles: 0°, 45°, 90°, 135°, 180°, 225°, 270°, and 315° from the starting position. The central axis of the mixing jar is tilted at an angle relative to the rotation axis of the mixing equipment. This tilt angle remains constant when the mixing jar rotates.

2.3. Design of Experiments

In this study, a 22 (two variables, two levels, and four conditions) full-factorial design was used. Table 3 shows the values of variables at each level. The full-factorial design has been used in many reported studies to assess the main and interaction effects of input variables on output variables [18,19,20,21]. For instance, Pasha et al. employed a two-variable, two-level full-factorial design to investigate the main and interaction effects of layer thickness and compaction thickness on green part density in the binder jetting process. Many textbooks, including the one written by DeVor et al. [22], have comprehensive explanations of factorial design. The selection of two levels for both variables was based on preliminary experiments, where varying mixing speed from 80, 110, to 147 rpm resulted in an approximately linear change in powder segregation. Similarly, varying the mixing time from 5, 7.5, to 10 min also showed an approximately linear relationship between powder segregation and mixing time. This study employs a full-factorial design with the primary objective of analyzing the interaction effects of these two variables while maintaining a manageable number of experiments.
Three replications were made for each experimental condition. All experiments were conducted in a laboratory with a controlled room temperature of around 23 °C and relative humidity of 40% to 44% to minimize variability in powder segregation due to the environmental conditions. Minitab statistical software (version 22.1.0) was used to generate a random order for the experiments. Table 4 displays the matrix of experiments.

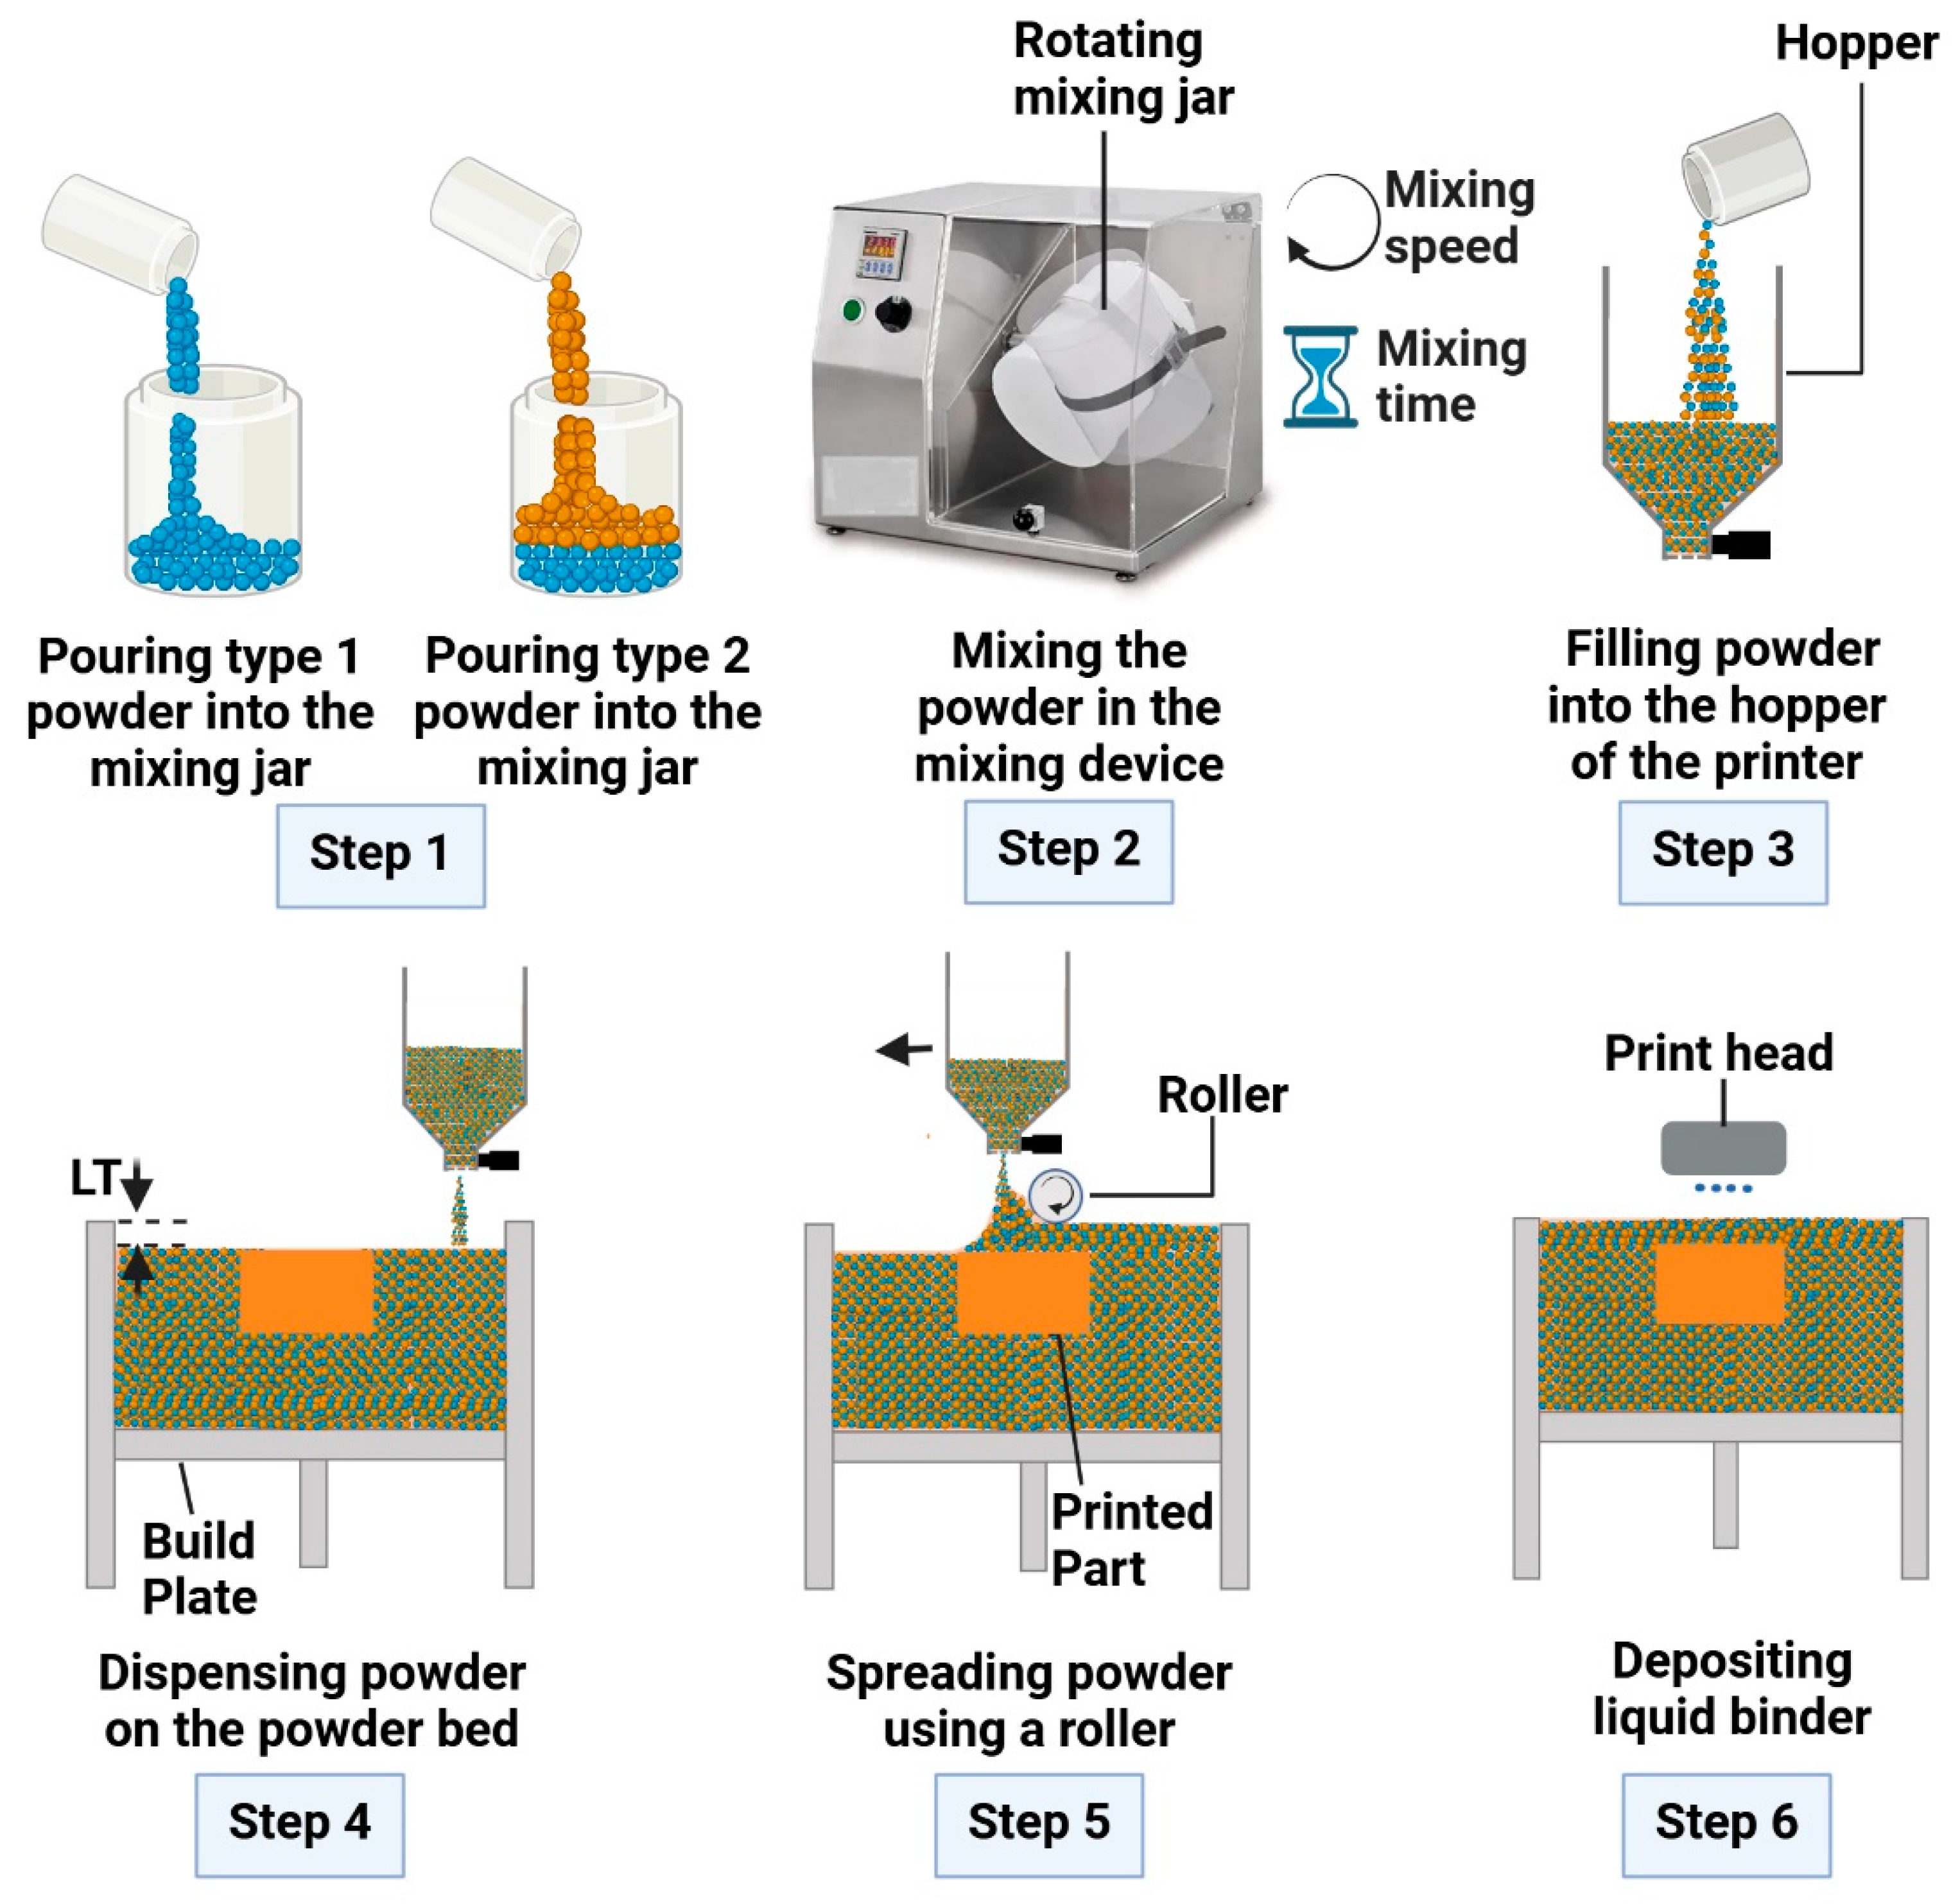
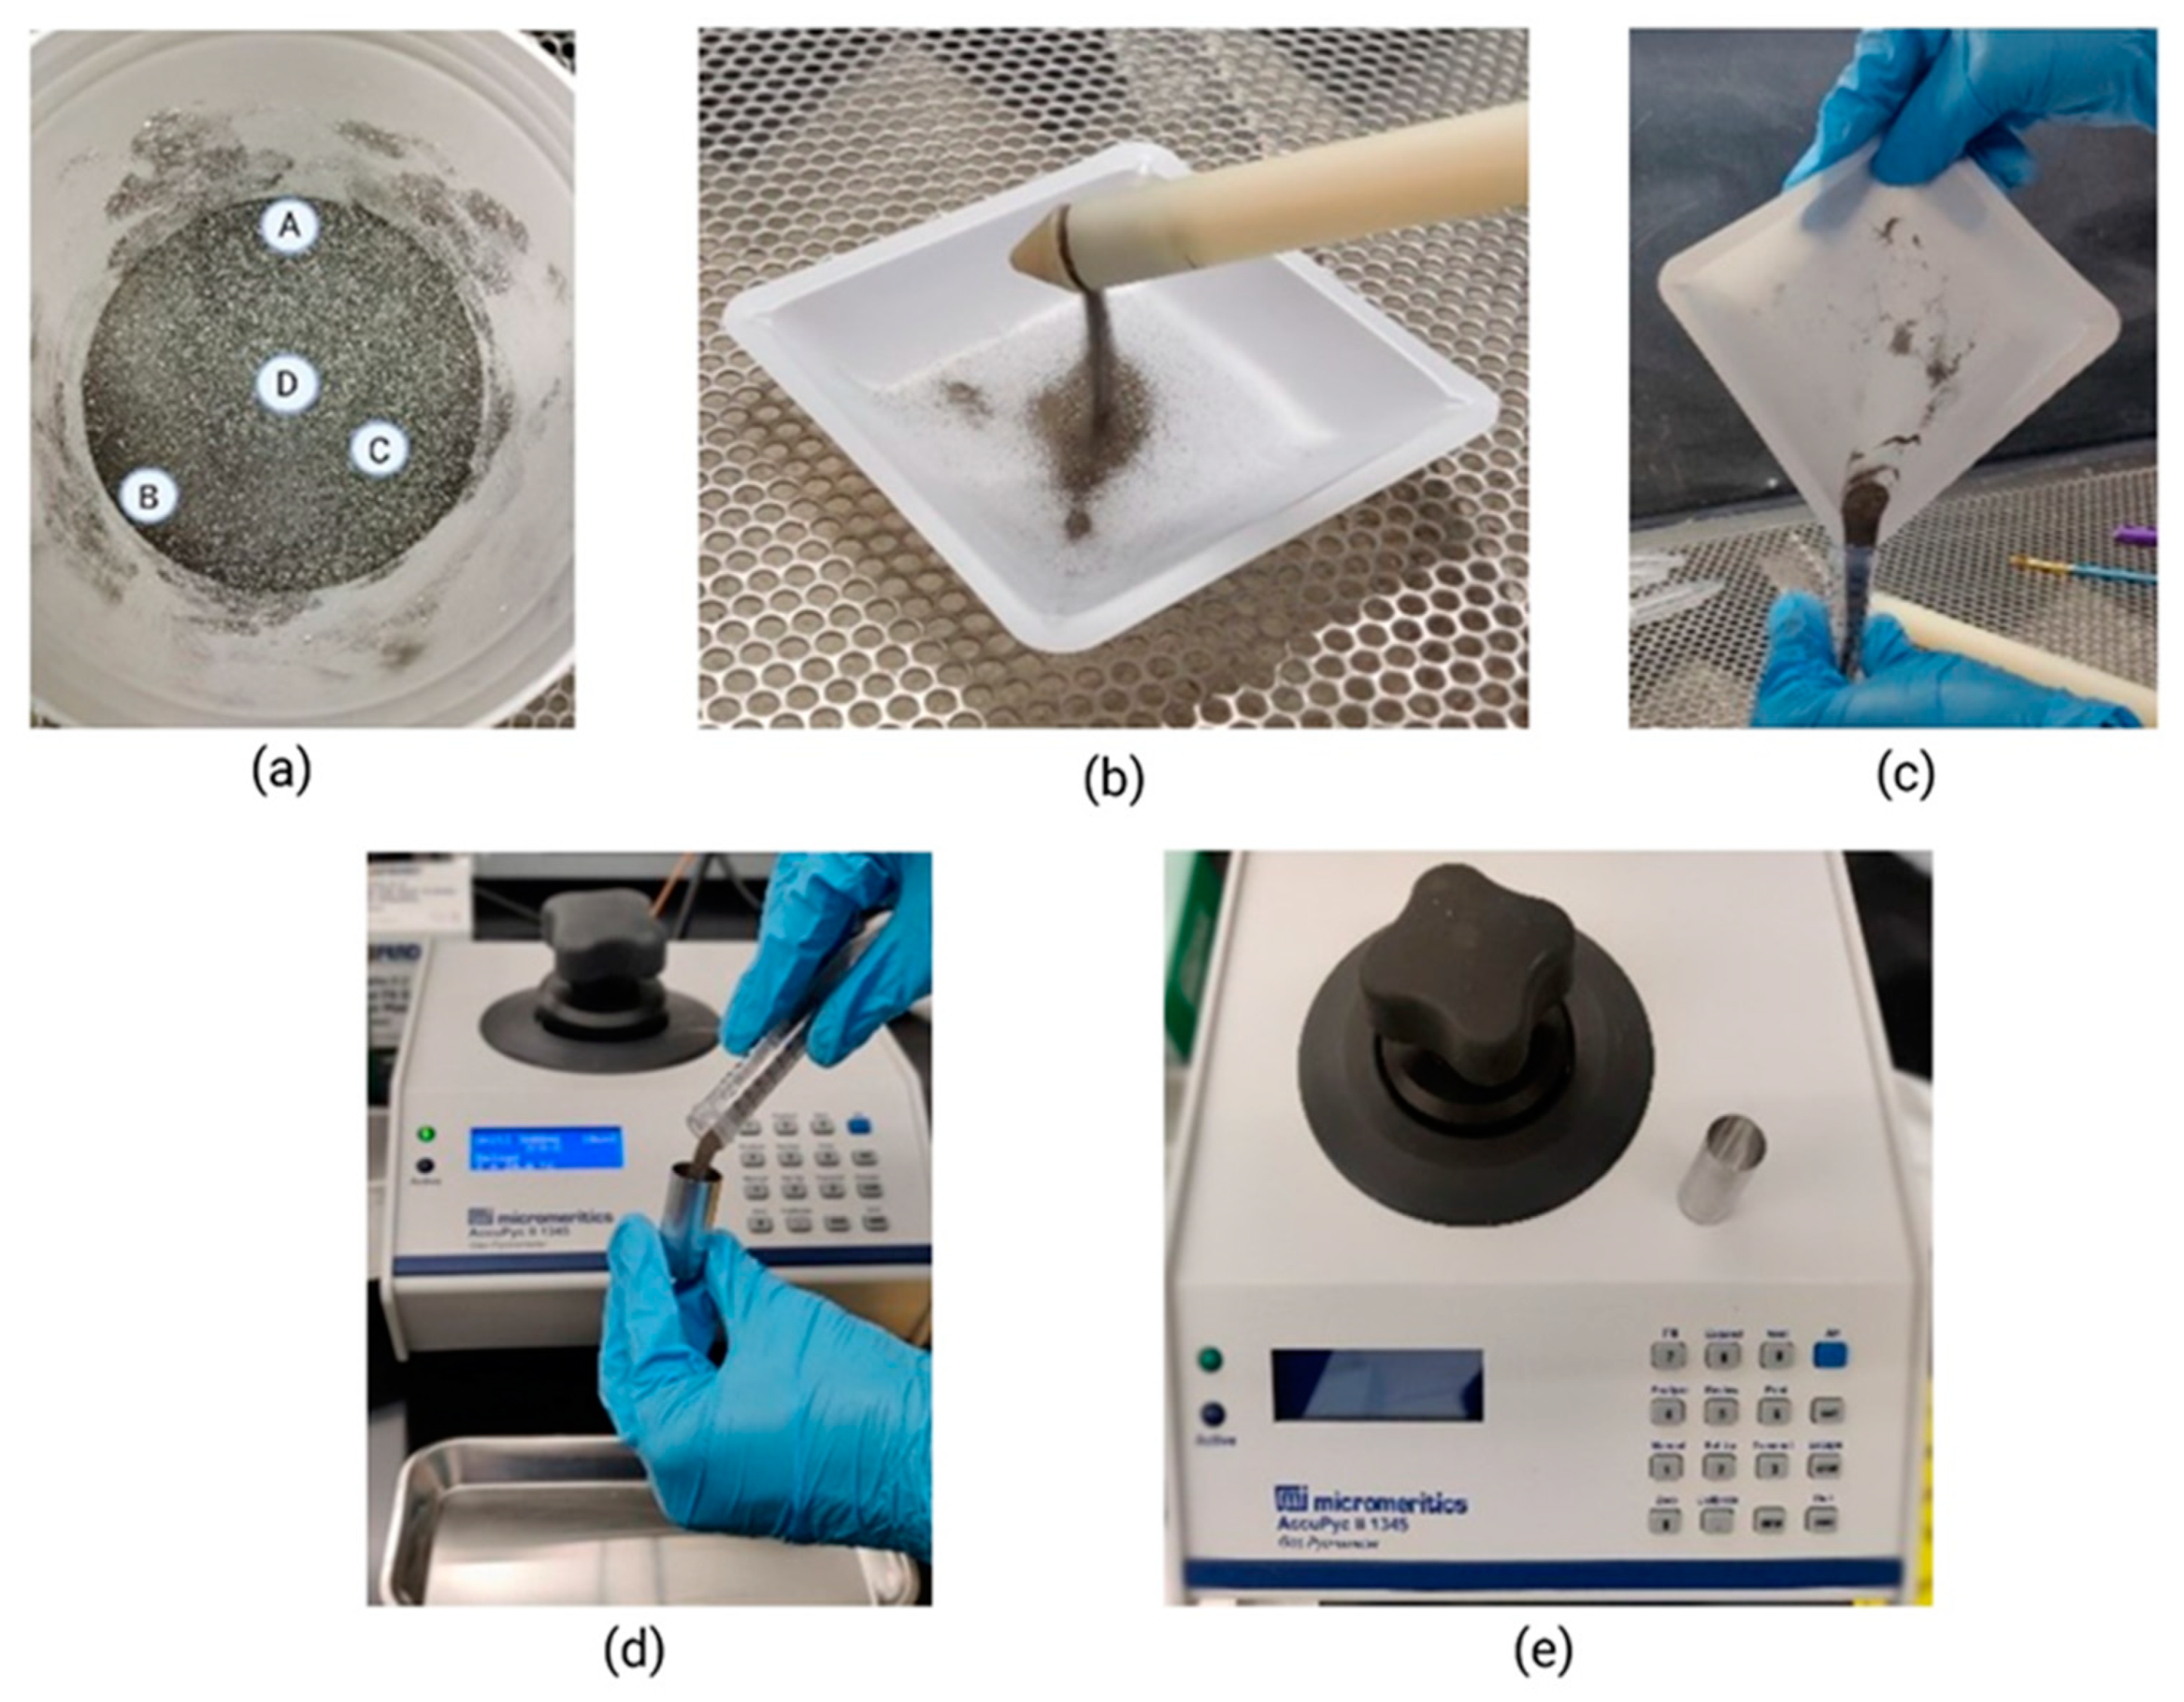
2.4. Procedures of Powder Mixing, Sampling, and Density Measurement

An amount of 1,200 g (in total) of Powder A and Powder B (with a weight ratio of 70% Powder A and 30% Powder B) was added to the mixing jar of the drum blender. Each mixing run was conducted using the conditions specified in Table 3 and Table 4. This paper studies the effects of mixing speed and mixing time on powder segregation with a fixed ratio of the two powders.
After mixing, the mixing jar was gently removed from the drum blender without any shaking and put on the flat surface of a table with the bottom side of the jar facing down. A 3 mL powder thief (8060H-503S, Sampling System, Birmingham, UK) was used to collect samples from four different locations, as shown in Figure 5a, inside the mixing jar for each experimental run. As shown in Figure 5a, locations A and B were close to the outer periphery of the mixing jar and about 60 degrees apart from each other, location D was at the center of the jar, and location C was at the mid-point between the outer periphery and the center and about 60 degrees apart from points A and B. The sample taken from each location was dispensed from the powder thief into a dish (Figure 5b) and then poured into a conical tube (Figure 5c). Subsequently, the powder from the conical tube was poured into the measuring cup of the gas pycnometer (Micromeritics, AccuPyc II 1345, Norcross, GA, USA) (Figure 5d). For each experimental run, density measurements (Figure 5e) were taken three times for the sample taken at each location, and the average of these three measurements was reported as the density of the sample at this location.

2.5. Evaluation of Segregation

The mean density for each experimental run was calculated from density values at all four locations, using Equation (1). The density deviation at each location was determined by subtracting the mean density of the experimental run from the density at this location and dividing the difference by the mean density, using Equation (2). Segregation was quantified by the largest difference of density deviation between any two of the four locations, using Equation (3).
Mean density = ((sum of density values at all locations)/(number of locations))
Density deviation (%) = ((density value at a location − mean density)/(mean density)) × 100
Segregation (%) = (highest density deviation − lowest density deviation)

3. Results and Discussion

Table 5 shows the experimental data for segregation. The OriginPro software, version 2024b, was used to generate both the main effect plots and the interaction effect plot. Table 6 shows the mean and standard deviation of segregation (%) for three replicated measurements under each experimental condition. Table 7 shows the ANOVA table for effects of mixing speed and mixing time on powder segregation.
Table 7 shows the ANOVA table for effects of mixing speed and mixing time on powder segregation. It is noted that, at the significance level of 0.05 (α = 0.05), only the effect of mixing speed is statistically significant. The effect of mixing time is significant only if the significance level is 0.3, and the interaction effect of mixing speed and time is significant only if the significance level is 0.19.

3.1. Main Effect of Mixing Speed

Figure 6 shows the main effect plot of mixing speed. It can be observed that powder segregation was higher at the high level of mixing speed. The error bar in this figure represents the standard deviation among the replicated measurements at each level. Specifically, segregation was increased from 6% to 15% as mixing speed was raised from 80 to 147 rpm. The trend observed from this study is consistent with the reported trend in some papers in the literature [11,12] but inconsistent with the trend reported in another paper in the literature [13].
Alizadeh et al. observed higher segregation as the mixing speed increased from 15 to 30 rpm. The authors investigated particle mixing and segregation of free-flowing granules (sucrose and starch spherical granules with the size of 2-4 mm) in a tetrapodal blender using the discrete element method. They explained that increased mixing speed caused particles to move faster, leaving insufficient time for proper mixing. Additionally, at very high mixing speed, centrifugal force might cause particles to stick to the blender wall [11]. Pereira et al. investigated shape-induced segregation of spherical and cubical particles in a slowly rotating cylindrical tumbler using the discrete element method. They observed higher segregation as the mixing speed increased from 1 to 3 rpm [12].
However, He et al. investigated shape-induced segregation of ellipsoid and spherical particles in a rotating drum using the discrete element method. The authors found that increasing the mixing speed from 5 to 40 rpm reduced segregation. They explained that the higher rotational speed might give the particles more energy, allowing a greater number of particles to mix into the flowing layer [13]. Comparing the conditions in the current study with the work by He et al., the key differences lie in particle shape and mixing speed. The particle shapes of the two types of powders were ellipsoid and spherical in the work by He et al., while the particle shapes were irregular and diamond in the current study. He et al. used the same density (2.5 g/cm3) and particle size (3 mm) for both types of powders and only focused on the shape-induced segregation, whereas, in the current study, there were differences in particle size (118 µm for Powder A and 230 µm for Powder B), particle shape (irregular for Powder A and diamond for Powder B), and density (7.93 g/cm3 for Powder A and 3.86 g/cm3 for Powder B). Additionally, He et al. used a much lower mixing speed (5 to 40 rpm) compared with the current study (80 to 147 rpm). Finally, He et al. conducted simulations (not experiments) using the discrete element method, while the current study was experimental.

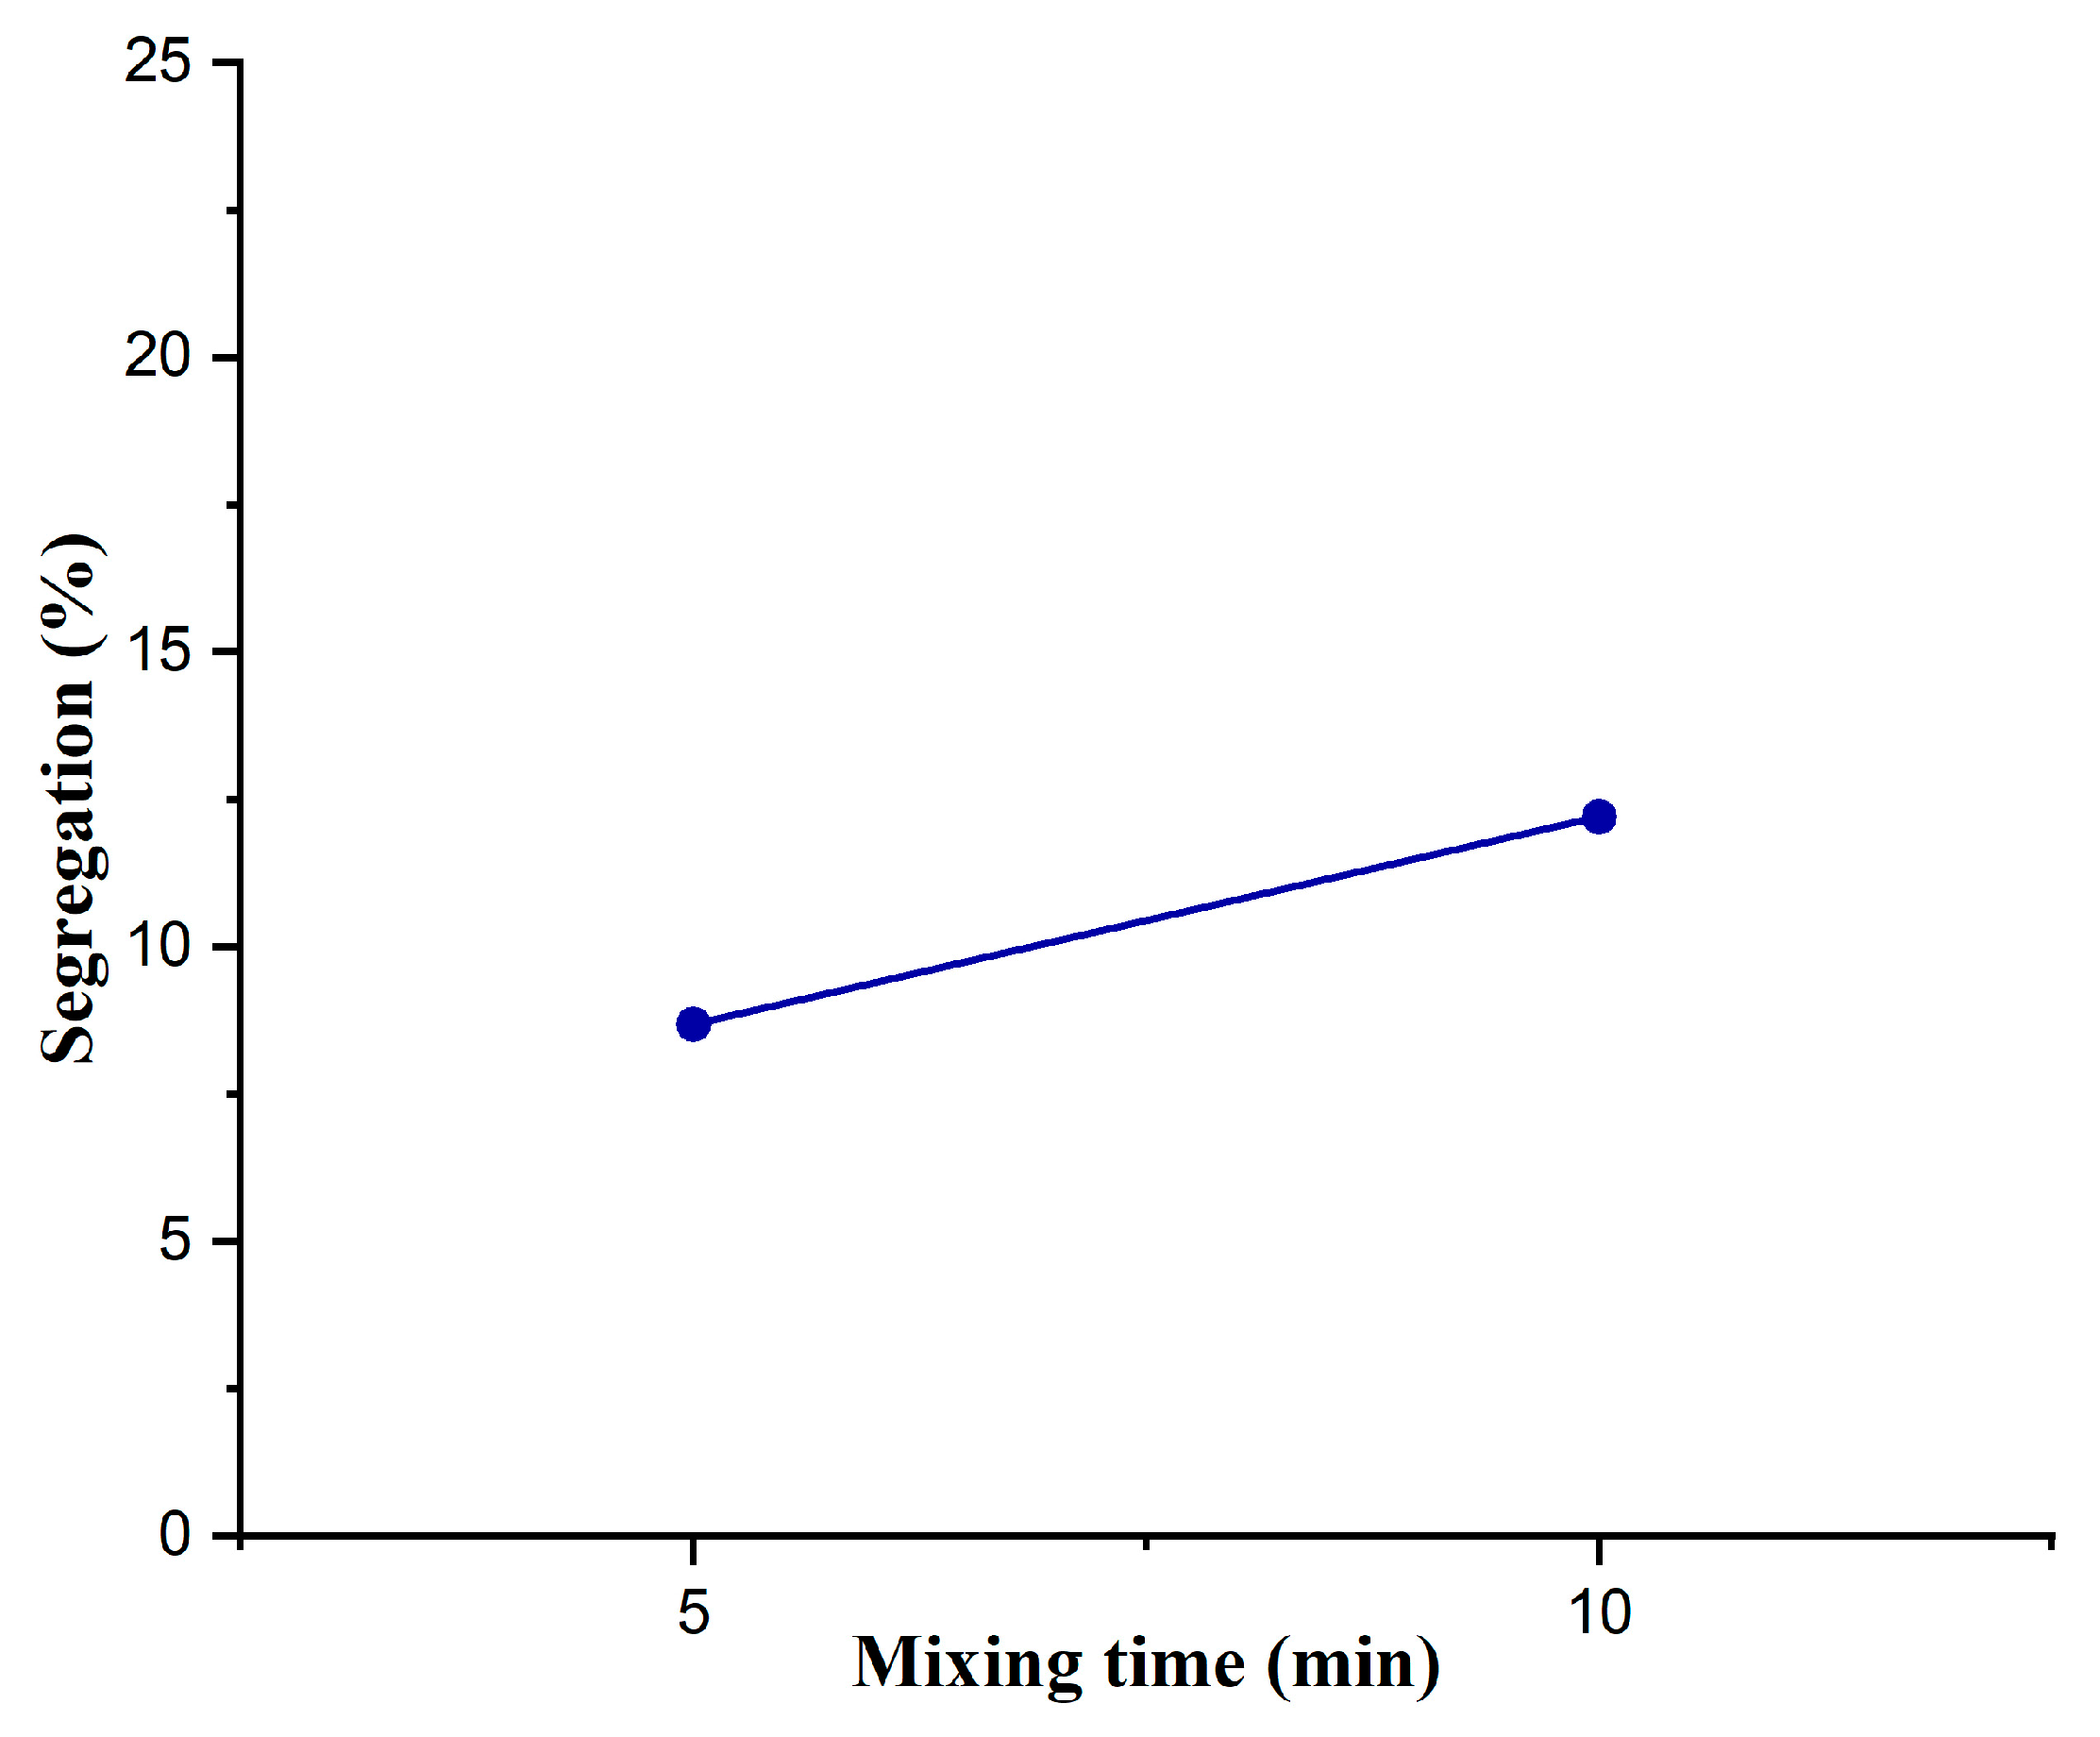
3.2. Main Effect of Mixing Time

Figure 7 shows the main effect plot of mixing time. It can be observed that powder segregation was higher at the high level of mixing time. The error bar in this figure represents the standard deviation among the replicated measurements at each level. Powder segregation was increased from 8% to 12% as the mixing time was increased from 5 to 10 min. The trend observed from this study is inconsistent with the reported trend in some papers in the literature. For example, Liu et al. observed reduced segregation as the mixing time increased from 5 to 20 sec. They investigated the effect of mixing time on size and shape-induced segregation using microcrystalline cellulose and starch granules with non-spherical, large particles (~1900 µm) and smaller, spherical particles (~550 µm) in a lab-made cylindrical container, employing tomographic imaging techniques [14]. Liao also observed reduced segregation as the mixing time increased from 300 to 1200 sec. He investigated the effect of mixing time on density-induced segregation using glass (2.48 g/cm3) and polypropylene (0.98 g/cm3) materials employing image processing technology [16].
Comparing the conditions in the current study with the work by Liu et al., the key differences lie in powder material, particle size, material property, and mixing time. The powder materials were cellulose and starch in Liu et al.’s work whereas metal and ceramic in the current study. The particle sizes were much larger (1900 µm for cellulose and 550 µm for starch) in the work by Liu et al. than the particle sizes in the current study (118 µm for Powder A and 230 µm for Powder B). Additionally, Powder A and Powder B are much denser and harder than cellulose and starch. Moreover, Liu et al. used a much shorter mixing time (5 to 20 s) compared to this study (5–10 min) [14].
Comparing the conditions of the current study with the work by Liao, the key differences lie in particle size and density. In Liao’s study, both glass and polypropylene particles had the same size (3 mm) and were much larger than those in this study (118 µm for Powder A and 230 µm for Powder B) [16]. Additionally, the density difference (2.48 g/cm3 for glass and 0.98 g/cm3 for polypropylene) in Liao’s work was much larger than in the current study (7.93 g/cm3 for Powder A and 3.86 g/cm3 for Powder B) [16].

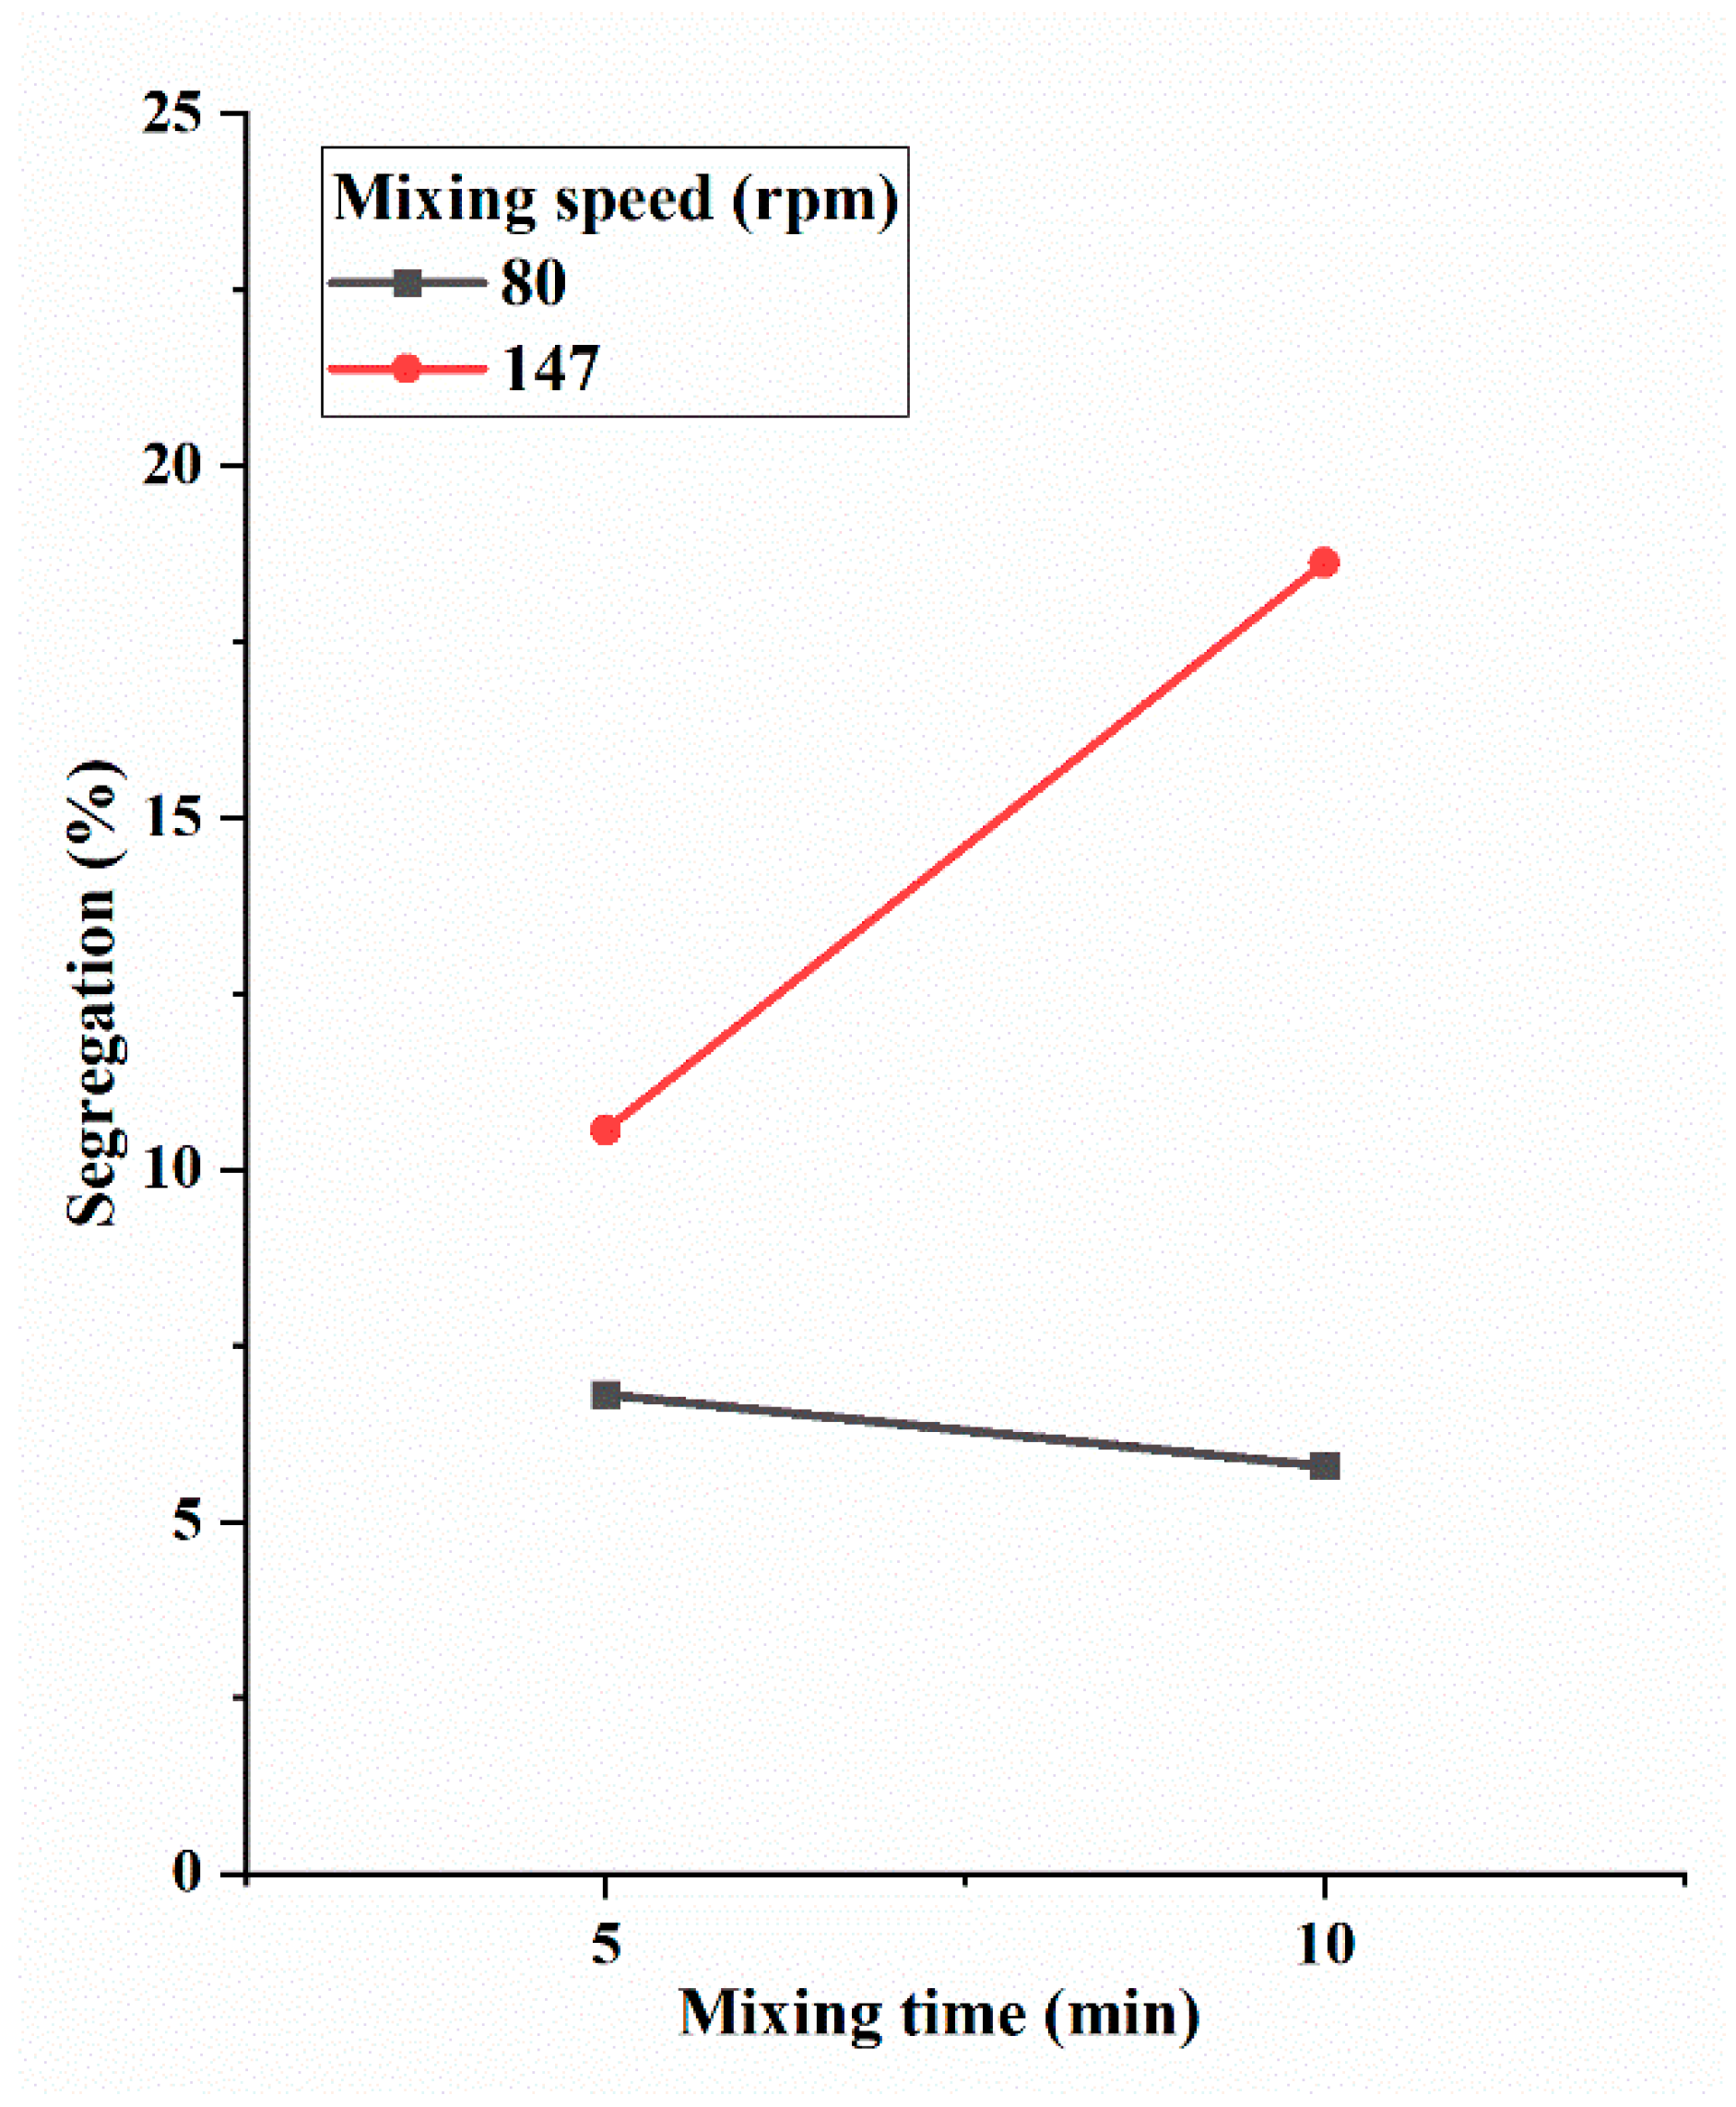
3.3. Interaction Effect of Mixing Speed and Mixing Time

Figure 8 shows the interaction effect plot of mixing speed and mixing time on segregation. Two levels of mixing speed (80 and 147 rpm) are represented by the black and red lines, respectively. The plot reveals the interaction effect between mixing speed and mixing time. At the low level of mixing speed (80 rpm), longer mixing time reduces segregation. However, at the high level of mixing speed (147 rpm), longer mixing time increases segregation.
The results highlight that a higher mixing speed, particularly when combined with a longer mixing time, would lead to a substantial increase in segregation. This finding is critical for mixing processes where powder segregation could negatively affect the quality of final products. Careful control of both mixing speed and time is, therefore, essential to minimize segregation and ensure product consistency.

4. Conclusions

This paper reports an experimental study using two-variable two-level factorial design. The main objective was to reveal the main effects and interaction effect of the two mixing variables (mixing speed and mixing time) on the segregation of Powder A and Powder B for binder jetting additive manufacturing. The authors plan to conduct further research to understand the scientific aspect of the effects revealed in this paper. The key findings of this study are given below:
  • Powder segregation was higher at the high level of mixing speed (statistically significant at the significance level of 0.03).
  • Powder segregation was higher at the high level of mixing time (statistically significant at the significance level of 0.30).
  • At the low level of mixing speed, longer mixing time reduced powder segregation; however, at the high level of mixing speed, longer mixing time increased powder segregation (statistically significant at the significance level of 0.19).
These results should be useful for the development of effective mixing protocols and the improvement of the performance of 3D-printed components when more than one types of powder are used in binder jetting additive manufacturing. Future research should include investigations into the effects of other mixing variables (such as the ratio of two types of powder, moisture content, and mixer design) on powder segregation as well as other types of powder in powder mixing. Future research should also include powder segregation during powder dispensing and spreading in binder jetting additive manufacturing.

Author Contributions

Conceptualization, M.M.P. and Z.P.; methodology, M.M.P. and Z.P.; formal analysis, M.M.P.; experiment, M.M.P. and M.S.A.; resources, M.M.P., C.J.G. and Z.P.; data curation, M.M.P. and Z.P.; writing—original draft preparation, M.M.P.; writing—review and editing, Z.P., M.M.P., C.J.G., Y.-T.K. and M.S.A. All authors have read and agreed to the published version of the manuscript.

Funding

This research received no external funding.

Data Availability Statement

The original data in this study are included in the article. Further inquiries can be directed to the corresponding author.

Acknowledgments

The authors would like to acknowledge that the characterization part of this work was performed at the Texas A&M University Materials Characterization Core Facility (RRID:SCR_022202). The authors extend their special thanks to Yordanos Bisrat for assistance with scanning electron microscopy (SEM). Furthermore, the authors thank Taieba Tuba Rahman (graduate student, Department of Industrial and Systems Engineering, Texas A&M University, College Station, TX 77843, USA) and Mireille Imbeau (senior research engineer, Saint-Gobain Research North America, MA 01532, USA) for their contributions in improving the writing of the manuscript. Moreover, the authors thank Drew Dalabakis and Steven Kuntzendorf (undergraduate student, Department of Industrial and Systems Engineering, Texas A&M University, College Station, TX 77843, USA) for their assistance in the experiment conducted in this paper. Additionally, the authors thank Sampling Systems Ltd. (Gorsey Lane, Coleshill. B46 1JU, UK) for supplying the powder thief.

Conflicts of Interest

The authors declare that the research was conducted in the absence of any commercial or financial relationships that could be construed as potential conflicts of interest.

References

  1. ASTM52900-15; Standard Terminology for Additive Manufacturing—General Principles—Terminology. ASTM International: West Conshohocken, PA, USA, 2015; Volume 3, p. 5.
  2. Miao, G.; Du, W.; Pei, Z.; Ma, C. A literature review on powder spreading in additive manufacturing. Addit. Manuf. 2022, 58, 103029. [Google Scholar] [CrossRef]
  3. Moghadasi, M.; Jaraczewski, J.; Mahdaviarab, A.; Pei, Z.; Ma, C. Roller-compaction-assisted binder jetting of textured ceramics. J. Manuf. Process. 2024, 124, 240–247. [Google Scholar] [CrossRef]
  4. Mostafaei, A.; Elliott, A.M.; Barnes, J.E.; Li, F.; Tan, W.; Cramer, C.L.; Nandwana, P.; Chmielus, M. Binder jet 3D printing—Process parameters, materials, properties, modeling, and challenges. Prog. Mater. Sci. 2021, 119, 100707. [Google Scholar] [CrossRef]
  5. Moghadasi, M.; Miao, G.; Li, M.; Pei, Z.; Ma, C. Combining powder bed compaction and nanopowders to improve density in ceramic binder jetting additive manufacturing. Ceram. Int. 2021, 47, 35348–35355. [Google Scholar] [CrossRef]
  6. Li, M.; Huang, J.; Fang, A.; Mansoor, B.; Pei, Z.; Ma, C. Binder jetting additive manufacturing of copper/diamond composites: An experimental study. J. Manuf. Process. 2021, 70, 205–213. [Google Scholar] [CrossRef]
  7. Chen, L.; Chen, W.; Zhang, S.; Zou, S.; Cheng, T.; Zhu, D. Effect of bimodal powder on densification and mechanical properties of 316L stainless steel fabricated by binder jet 3D printing. J. Mater. Res. Technol. 2023, 27, 4043–4052. [Google Scholar] [CrossRef]
  8. Du, W.; Roa, J.; Hong, J.; Liu, Y.; Pei, Z.; Ma, C. Binder jetting additive manufacturing: Effect of particle size distribution on density. J. Manuf. Sci. Eng. 2021, 143, 091002. [Google Scholar] [CrossRef]
  9. Du, W.; Ren, X.; Pei, Z.; Ma, C. Ceramic binder jetting additive manufacturing: A literature review on density. J. Manuf. Sci. Eng. 2020, 142, 040801. [Google Scholar] [CrossRef]
  10. Mindt, H.W.; Megahed, M.; Lavery, N.P.; Holmes, M.A.; Brown, S.G.R. Powder Bed Layer Characteristics: The Overseen First-Order Process Input. Metall. Mater. Trans. A 2016, 47, 3811–3822. [Google Scholar] [CrossRef]
  11. Alizadeh, E.; Bertrand, F.; Chaouki, J. Discrete element simulation of particle mixing and segregation in a tetrapodal blender. Comput. Chem. Eng. 2014, 64, 1–12. [Google Scholar] [CrossRef]
  12. Pereira, G.; Cleary, P. Segregation due to particle shape of a granular mixture in a slowly rotating tumbler. Granul. Matter 2017, 19, 23. [Google Scholar] [CrossRef]
  13. He, S.Y.; Gan, J.Q.; Pinson, D.; Zhou, Z.Y. Particle shape-induced radial segregation of binary mixtures in a rotating drum. Powder Technol. 2019, 341, 157–166. [Google Scholar] [CrossRef]
  14. Liu, R.; Yin, X.; Li, H.; Shao, Q.; York, P.; He, Y.; Xiao, T.; Zhang, J. Visualization and quantitative profiling of mixing and segregation of granules using synchrotron radiation X-ray microtomography and three dimensional reconstruction. Int. J. Pharm. 2013, 445, 125–133. [Google Scholar] [CrossRef] [PubMed]
  15. Mayer-Laigle, C.; Gatumel, C.; Berthiaux, H. Mixing dynamics for easy flowing powders in a lab scale Turbula® mixer. Chem. Eng. Res. Des. 2015, 95, 248–261. [Google Scholar] [CrossRef]
  16. Liao, C.-C. A study of the effect of liquid viscosity on density-driven wet granular segregation in a rotating drum. Powder Technol. 2018, 325, 632–638. [Google Scholar] [CrossRef]
  17. Gürmeriç, V.; Doğan, M. A new approach to evaluate mixing time in a V-type powder mixer: Taguchi weighted grey relational analysis. Eur. Food Res. Technol. 2024, 250, 547–564. [Google Scholar] [CrossRef]
  18. Pasha, M.M.; Arman, M.S.; Khan, F.; Pei, Z.; Kachur, S. Effects of Layer Thickness and Compaction Thickness on Green Part Density in Binder Jetting Additive Manufacturing of Silicon Carbide: Designed Experiments. J. Manuf. Mater. Process. 2024, 8, 148. [Google Scholar] [CrossRef]
  19. Pei, Z.; Strasbaugh, A. Fine grinding of silicon wafers: Designed experiments. Int. J. Mach. Tools Manuf. 2002, 42, 395–404. [Google Scholar] [CrossRef]
  20. Yap, Y.L.; Wang, C.; Sing, S.L.; Dikshit, V.; Yeong, W.Y.; Wei, J. Material jetting additive manufacturing: An experimental study using designed metrological benchmarks. Precis. Eng. 2017, 50, 275–285. [Google Scholar] [CrossRef]
  21. Rahman, T.T.; Arman, M.S.; Perez, V.; Xu, B.; Li, J. Analysis of the operating conditions of pulse electric field–assisted EHD for sodium alginate printing using design of experiment approach. Int. J. Adv. Manuf. Technol. 2021, 115, 2037–2047. [Google Scholar] [CrossRef]
  22. DeVor, R.E. Statistical Quality Design and Control: Contemporary Concepts and Methods; Chang, T.-H., Sutherland, J.W., Eds.; Pearson/Prentice Hall: Upper Saddle River, NJ, USA, 2007. [Google Scholar]
Figure 1. Major steps of binder jetting with a hopper.
Jmmp 09 00117 g001
Figure 2. SEM images of (a) Power A and (b) Powder B.
Jmmp 09 00117 g002
Figure 3. Picture of the drum blender used as the mixing equipment in this study.
Jmmp 09 00117 g003
Figure 4. Positions of the mixing jar as it rotates.
Jmmp 09 00117 g004
Figure 5. Procedure of taking samples and measuring density: (a) collecting each sample with a powder thief at four locations labeled as A, B, C, and D as shown; (b) pouring the sample on a dish; (c) pouring the sample from the dish into a conical tube; (d) pouring the sample in the conical tube into the sampling cup of pycnometer; and (e) measuring density using a pycnometer.
Jmmp 09 00117 g005
Figure 6. Main effect of mixing speed on segregation.
Jmmp 09 00117 g006
Figure 7. Main effect of mixing time on segregation.
Jmmp 09 00117 g007
Figure 8. Interaction effect of mixing speed and mixing time on segregation.
Jmmp 09 00117 g008
Table 1. Reported studies on powder segregation during powder mixing.
Powder TypeResultReference
Sucrose and starch spherical powder (particle size of 2 and 4 mm, respectively)Higher mixing speed increased segregation[11]
Spherical and cubical powder (particle size of 2 mm)Higher mixing speed increased shape-induced segregation[12]
Ellipsoid and spherical-shaped powder (particle size of 3 mm)Higher mixing speed reduced shape-induced segregation[13]
Microcrystalline cellulose spherical powder (particle size of 0.55 mm) and starch non-spherical powder (particle size of 1.90 mm)Longer mixing time reduced size and shape-induced segregation[14]
Lactose powder (particle size of 65.4 µm) and couscous powder (particle size of 1 mm)Longer mixing time reduced segregation[15]
Glass and polypropylene beads of same size (3 mm) As mixing time increased, segregation reduced (till mixing time reached a certain value) and then did not change much[16]
Table 2. Information regarding Powder A and Powder B.
Powder APowder B
Material typeMetalCeramic
Average particle size (µm)118230
Particle shape IrregularDiamond
True density (g/cm3)7.93 3.86
Table 3. Values of variables at each level.
VariableLow Level (−)High Level (+)
Mixing speed (rpm)80147
Mixing time (min)510
Table 4. Matrix of experiments.
Experiment OrderMixing SpeedMixing Time
1
6
10
3+
5+
7+
2+
8+
11+
4++
9++
12++
Table 5. Experimental data for segregation.
Experiment OrderDensity at Each Location (g/cm3)Mean Density (g/cm3)Density Deviation at Each Location (%)Segregation (%)
ABCDABCD
15.796.005.645.795.81−0.263.36−2.84−0.266.20
65.605.795.895.665.74−2.350.962.70−1.315.06
105.735.355.875.795.690.79−5.893.251.859.15
35.936.166.56.236.21−4.43−0.734.750.409.19
55.415.646.285.745.77−6.20−2.218.89−0.4815.08
76.016.275.865.825.990.334.67−2.17−2.847.51
25.735.85.875.605.75−0.350.872.09−2.614.70
85.715.615.915.655.72−0.17−1.923.32−1.225.24
115.625.565.985.765.73−1.92−2.974.360.527.33
46.766.715.865.616.248.427.62−6.01−10.0218.44
95.304.936.565.975.69−6.85−13.3615.294.9228.65
125.465.745.875.975.76−5.21−0.351.913.658.85
Table 6. Mean and standard deviation of segregation (%) for three replicated measurements under each experimental condition.
Mixing SpeedMixing TimeSegregation Mean (%)Standard Deviation (%)
6.802.11
+5.761.39
+10.593.98
++18.659.90
Table 7. ANOVA table for effects of mixing speed and mixing time on powder segregation.
DFSum of SquaresMean SquareF Valuep Value
Mixing speed1206.687206.6876.9080.030
Mixing time137.24937.2491.2450.297
Interaction161.81761.8172.0660.189
Model3305.752101.9173.4060.074
Error8239.37129.921
Total11545.123
Disclaimer/Publisher’s Note: The statements, opinions and data contained in all publications are solely those of the individual author(s) and contributor(s) and not of MDPI and/or the editor(s). MDPI and/or the editor(s) disclaim responsibility for any injury to people or property resulting from any ideas, methods, instructions or products referred to in the content.

