Article

A Nanoindentation Approach to Investigating Dislocation Density in Additive-Manufactured SS316L-Graded Lattice Structures

Department of Industrial Engineering and Mathematical Sciences (DIISM), Università Politecnica delle Marche, Via Brecce Bianche, 12, 60131 Ancona, Italy
*
Author to whom correspondence should be addressed.
J. Manuf. Mater. Process. 2025, 9(2), 59; https://doi.org/10.3390/jmmp9020059
Submission received: 14 January 2025 / Revised: 6 February 2025 / Accepted: 8 February 2025 / Published: 13 February 2025

Abstract

:
The dislocation density in additive-manufactured components significantly influences the local mechanical behavior of crystalline metals. Nanoindentation, renowned for its sensitivity to local mechanical responses and hardness, facilitates the assessment of local dislocation density. This study aimed to analyze the evolution of local dislocation densities in bulk, graded lattice structures (GLSs), and reduced-size GLSs of LPBF SS316L via nanoindentation. Components were fabricated using laser powder bed fusion with 316L stainless steel. The microstructural analysis revealed that the distribution of mechanical deformation across the bodies of the parts was higher in the reduced-size GLS compared to that obtained for the GLS. The simulation of plastic deformation allowed for recognizing that this difference is attributed to the different thermal stresses resulting from the higher rate of thermal excursions to which the scaffold structure was subjected whenever there was a reduction in the reciprocal distance of the struts. Mechanical deformation, identified as the primary factor contributing to dislocation density in additive manufacturing, was significant in both the GLS and reduced-size GLS, for which the dislocation density was incremented by one order of magnitude compared to the bulk material.

1. Introduction

This work presents local and sub-micrometer analyses of dislocation evolution driven by the specific production parameters of an SS316L scaffold structure printed by LPBF. Scaffold structures are graded lattice structures (GLSs) that can greatly reduce weight by assembling a number of repetitions of space-filling unit cells with a gradient in size or customized strut thickness. The produced reticular structure is known to enhance performance through optimized material distribution [1,2]. Because of their unique functional properties, metal-graded lattice structures have received significant interest in the biomedical and aerospace sectors [1,3]. The fabrication of GLSs requires advanced manufacturing techniques capable of producing intricate and geometrically precise structures. Laser powder bed fusion (LPBF), a highly accurate additive manufacturing (AM) process, excels in constructing customized metal lattice structures by selectively melting powder in a layer-by-layer fashion using a focused laser beam [4]. However, the high solidification rates and complex laser–powder interactions inherent to LPBF present a challenge in controlling the mechanical deformation of the material, which can influence the mechanical properties of the components produced [5].
Moreover, the printing process for metal parts using LPBF exhibits nonuniform thermal cycles, as powder melting is directly followed by cooling and eventual reheating because of the hatch overlapping process. This LPBF-driven thermal cycle is responsible for thermal gradients within printed layers and, conversely, to a degree of anisotropic shrinkage [6]. The thermal stresses induced by the rapid solidification and shrinkage of the material may exceed its strength, potentially leading to plastic deformation [7]. Slicing represents one of the principal procedures inherent to the AM process, and it is the primary cause of the staircase effect. This effect is responsible for most of the observed possible building deformation [8]. Printing flaws, melt pool dynamics, inclination, and curved surfaces are considered the major sources of the staircase effect in a structure [9].
Concerning the metallic material used in this study, the AM of SS316L is known to induce higher strength and ductility with respect to materials obtained through conventional techniques [10,11]. One microstructural feature accounting for the enhancement of such mechanical properties is given by the recombination and development of dislocation toward well-organized cell structures within austenite grains [12]. In addition, local plastic deformations that occur during LPBF printing processes result in the accumulation of dislocations within polycrystalline microstructures [13]. A further contributing factor is surely the coherent strain introduced by fine precipitation and by local crystallographic distortion due to solute enrichment that develops in inter-dendritic regions during LPBF printing processes, which can also affect the dislocation activity [12,14]. According to Bertsch et al. [15], the primary source of dislocations in AM SS316L is the thermal shrinkage–expansion process experienced by the metallic material during the production stage. Other solidification features, including precipitation, solute enrichment, and misorientations among dendrites, also influence the evolution of the dislocations. An effective process for the storage and recombination of dislocations occurs in LPBF austenitic stainless steels, whereby the strain energy yield from the LPBF accounts for the accumulation of dislocations, a phenomenon that eventually plays a significant role in restoring the original plasticity of the metallic material. Thence, upon thermal excursion, the stored dislocations tend to annihilate because of elevated temperatures, resulting in local microstructural modifications (tangled dislocations, cell structure, etc.) [13]. Therefore, what happens within austenite grains of SS316L during LPBF can be considered as mainly due to and driven by dislocations.
One method used to inspect the role of dislocations within fine grains is surely instrumented nanoindentation. Nanoindentation is a technique that is highly sensitive to the local mechanical response of materials. This is measured by considering the so-called indentation size effect (ISE). A variety of methods have been developed to examine ISEs due to dislocations in crystalline materials using nanoindentation. This effect is evidenced by increases in hardness with an increasing penetration depth. In crystalline metals, this effect is controlled by the evolution or nucleation of geometrically necessary dislocation (GND) density [16,17]. The model proposed by Nix and Gao et al. [18] and further developed by Drust et al. [19] provides a comprehensive explanation of the elastoplastic deformation observed during the test and establishes a clear correlation between local hardness and dislocation density beneath the indenter.
Yet, all that has been stated so far holds for LPBF bulk SS316L, and in the present study, the steel was produced in form of reticular GLS. Thence, the presence of geometrically significant voids and eventually pores is likely to result in a variation in the local mechanical response [3,4]. GLS generally exhibits thermal and mechanical properties closely aligned with those of the bulk components [1], which effectively bridges the gap between bulk and uniform lattice structures by combining their distinctive characteristics.
In this respect, while previous published studies have investigated dislocation density in AM components [12,13,14,15], the influence of geometrical voids/pores and intricate lattice geometries (GLSs) on the local mechanical response and dislocation density can surely be considered as a novel and promising approach. In fact, this study addresses these gaps by employing nanoindentation to investigate the evolution of the local mechanical response and AM dislocation density among bulk, GLS, and reduced-size GLS components of LPBF SS316L. To this purpose, local mechanical response including the local hardness, driven by dislocation recombination, was evaluated by using nanoindentation techniques. The local dislocation density was estimated from the elastoplastic regime of the nanoindentation.

2. Materials and Methods

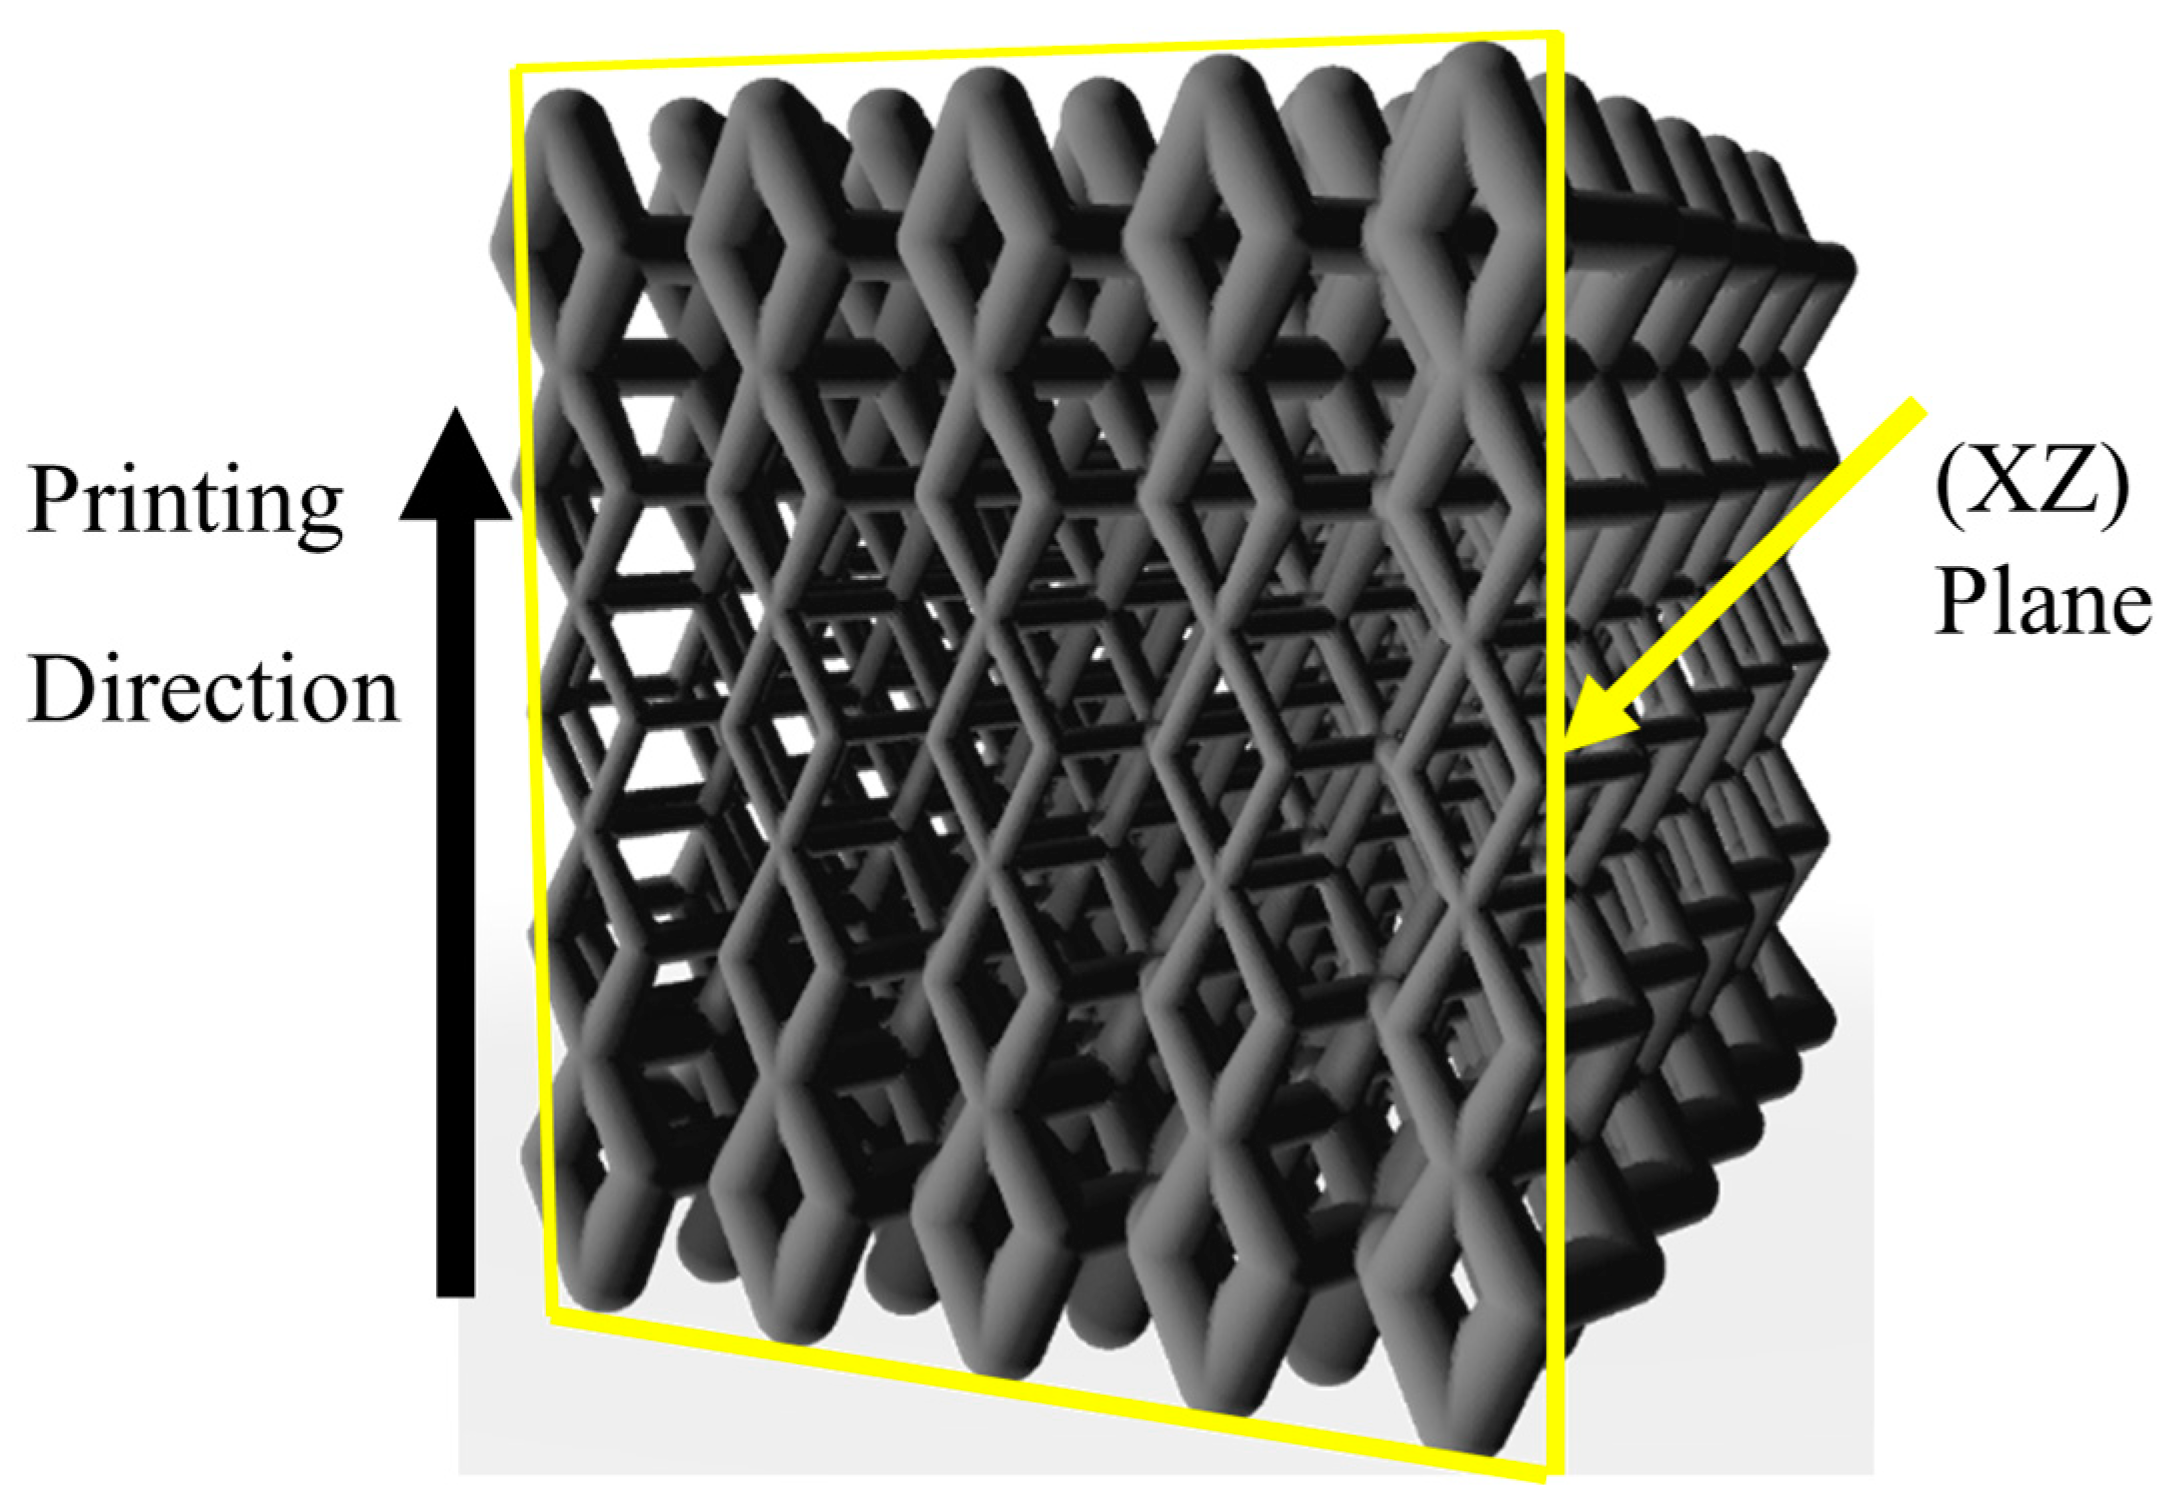
2.1. Parts Design and Manufacturing

The GLS structure was obtained based on a rhombic dodecahedral unit cell by obeying a bi-grading procedure from the central horizontal axis of the part starting with a 0.25 mm strut thickness at the core, which increases by 0.25 mm step size up to the edge. The cell size was maintained throughout the process, and the resulting structure had a 10 mm cubic dimension, which was referred to as the 10 mm scaffold (S10). The reduced GLS was obtained by reducing S10 by a factor of 0.7, resulting in a structure referred to as the 7 mm scaffold (S7).
The bulk part of the 10 mm cubic dimension, S10 and S7, were manufactured using LPBF technology in a 3D4steel manufacturing system (3D4Mec Srl, Sasso Marconi, Italy), conducted in a nitrogen atmosphere and using a 300 W Yb-fiber laser. The ranges of the printing parameters employed in the fabrication of the parts are presented in Table 1, with the volumetric energy density serving as a comprehensive index of the total amount of energy transferred by the laser beam to a sample unit volume. The components were subjected to a thermal treatment at a temperature of 1150 °C for a period of 2 h.

2.2. Microstructural Characterization Techniques

Microstructural analysis was performed on the (XZ) plane along with the printing direction of the parts. As-built components were examined using a TescanTM VEGA3® scanning electron microscope (SEM) (Tescan, Rrno, Czech Republic). The thermally treated parts were analyzed using a LEICA™ DMi8® optical microscope (OM) (Leica Microsystems, Wetzlar, Germany). Prior to analysis, the parts were mechanically polished by wet ground silicon carbide abrasive papers of progressively finer grit sizes (600, 1200, 2000, and 4000) followed by polishing with a diamond paste of varying particle sizes (6, 3, and 1 µm). Subsequently, the cross-sectional surface of the investigated parts underwent chemical etching using a solution of 10 mL nitric acid, 15 mL hydrochloric acid, and 10 mL acetic acid to reveal the microstructure morphology.

2.3. Deformation Analysis

A prior understanding of the resulting deformation can be achieved by simulating the studied parts using Siemens NX® software (Version 2212) in the Additive Manufacturing toolbox for LPBF simulations. The simulation of the parts is based on a comprehensive understanding of the material properties, printing parameters, and thermal ambient conditions that prevail during the printing process.
The surface scan of the scaffold part for distortion measurement was conducted on the as-printed surface of the (XZ) plane by using a LEICA™ DVM6® digital microscope (Leica Microsystems, Wetzlar, Germany)rom the Leica M series stereo microscopes, provided with a mid-magnification objective with a maximum field of view (FOV) of 12.55 mm, a working distance up to 33 mm, and a magnification range of 46× to 675×. CloudCompare software (Version 2.14.alpha) was employed for the analysis of the distortion of the scanned phases of the scaffold parts. The 3D point cloud and the mesh process allow a comparison between the scanned surfaces and the nominal STL-modelled GLS presented in Figure 1.

2.4. Dislocation Density by Means of Nanoindentation Approach

Nanoindentation is regarded as a fundamental technique for investigating local hardness (H). The technique provides in situ measurements using a sharp diamond indenter, through the elastic–plastic regime, and the analysis of load–displacement data using the Oliver and Pharr method [20]. The method estimates the indentation projected contact area (AC) between the indenter and the sample surface at the maximum load (Pmax), which is a function of contact depth (h). The local hardness is evaluated by calculating the ratio between the maximum load to contact area, as expressed in Equation (1). In this experimental method, the nano-hardness H is defined as the average contact pressure.
H = P m a x A c h
In accordance with the mechanistic model proposed by Durst et al. [19], there is a discernible correlation between local hardness and total dislocation density ρT. During the indentation process a strain field is applied, giving rise to a representative strain (εrep), dependent on the total included angle of the indenter. In Tabor’s approach [21], the representative strain is employed to transfer a complex strain field situated beneath the indenter to a uniaxial strain field. Furthermore, the complex stress state underneath the indenter can also be transferred to a uniaxial stress state through the use of a constraint factor (C); according to Tabor, C is dependent upon the ratio of elastic modulus (E) to yield stress (σy) [19,22]. Accordingly, the local hardness (H) of plastically flowing metals can be estimated from the normal flow stress (σ) of the material:
H = C σ
σ = σ ε r e p
The constraint factor C is found to be between 2 and 3 for most metals. The normal stress flow σ can be related to the crystal shear flow stress τf using Taylor factor M in a uniaxial deformation experiment. In addition, the resolved shear stress is given by the linear superposition of the GND and statistically stored dislocation (SSD) densities, adding up to the total dislocation density according to the Taylor relation [19,23]:
H = C σ = C M τ f = H 0 + C M α G b ρ T
ρ T = ρ G N D + ρ S S D
where H0 is due to the frictional effect and solution strengthening, independent of dislocation density. Considering the average Taylor factor M = 3, α is a geometrical factor that depends on the arrangement of dislocations and typically ranges between 0.2 and 0.4. G is the elastic shear modulus, b is the magnitude of the Burgers vector, ρGND is the density of the GND, and it depends on the indentation depth, and ρSSD is the density of the SSD, and it is a function of εrep [19].
The dislocation density influences the elastoplastic regime of the nanoindentation load–displacement curve [24]. The approach of Nix and Gao et al. [18] and further developed by Drust et al. [19] describes the impact of dislocation density during elastoplastic deformation based on Taylor’s relation. The GND plays an essential role in accommodating the indented shape during the deformation, thereby demonstrating the necessity of lattice rotation. The storage volume of the GND is here considered as the plastically deformed volume situated beneath the indenter. This is achieved by correlating the contact radius (ac) and the plastic zone radius (apz) with a factor (f):
ρ G N D = 3 2 tan 2 θ f 3 h b
A C = π h tan 2 β
P = A C H = A C C M α G b 3 2 tan 2 θ f 3 h b + ρ S S D
where θ is the angle between the surface and the indenter, β is the tip half-opening, P is the load, and f is the ratio of the apz to the ac.
The nanoindentation test was conducted using a HysitronTM Ubi® 1 nanomechanical instrument (Hysitron Inc., Minneapolis, MN, USA) equipped with a Berkovich diamond indenter and using TriboScan® (Version 8.1.1) analyzing software on the polished surface of each component under investigation. Ten matrices each of 50 indents were distributed over the surfaces of the parts. The indentations were carried out at a maximum load of 10,000 μN and an indentation depth range of approximately 300 nm to avoid the indentation size effect at a smaller indent size and thus the higher contribution of the GND. The dwelling time was set to 1 s to avoid the nanoindentation creep during holding time.

2.5. Dislocation Density Using X-Ray Diffraction

X-ray diffraction (XRD) is a measurement technique that enables the experimental determination of the total dislocation density. XRD employs the broadening of diffraction peaks to estimate dislocation density [25]. The technique is more sensitive to the SSD than the GND due to its capacity to measure disorientations within the crystallites and underestimates the dislocations accumulated near the grain boundaries, which are considered the main source of the GND. The total dislocation density of the component can be calculated from the contribution of crystallite size (or domain size) and strain using the Williamson and Smallman approach [26]:
ρ T = ρ D × ρ S 1 2
ρ D = 3 D 2
ρ S = K ε L 2 b 2
where ρD is the domain contribution and ρS is the deformation contribution, with material constant K, crystallite size D, and microstrain ε L 2 , and b is the magnitude of the Burgers vector.
X-ray diffraction (XRD) measurements were carried out using a Bruker D8 Advance diffractometer (Bruker, MA, Germany) operating at V = 40 kV and I = 40 mA with Cu-Kα radiation. A pattern analysis was performed by DIFFRAC. EVA (Version 4.3.0.1, Bruker AXS) software by using the PDF2 database of the International Centre for Diffraction Data (ICDD). MAUD (Material Analysis Using Diffraction, Version 2.992) software was used for Rietveld refinement of the XRD patterns.

3. Results and Discussion

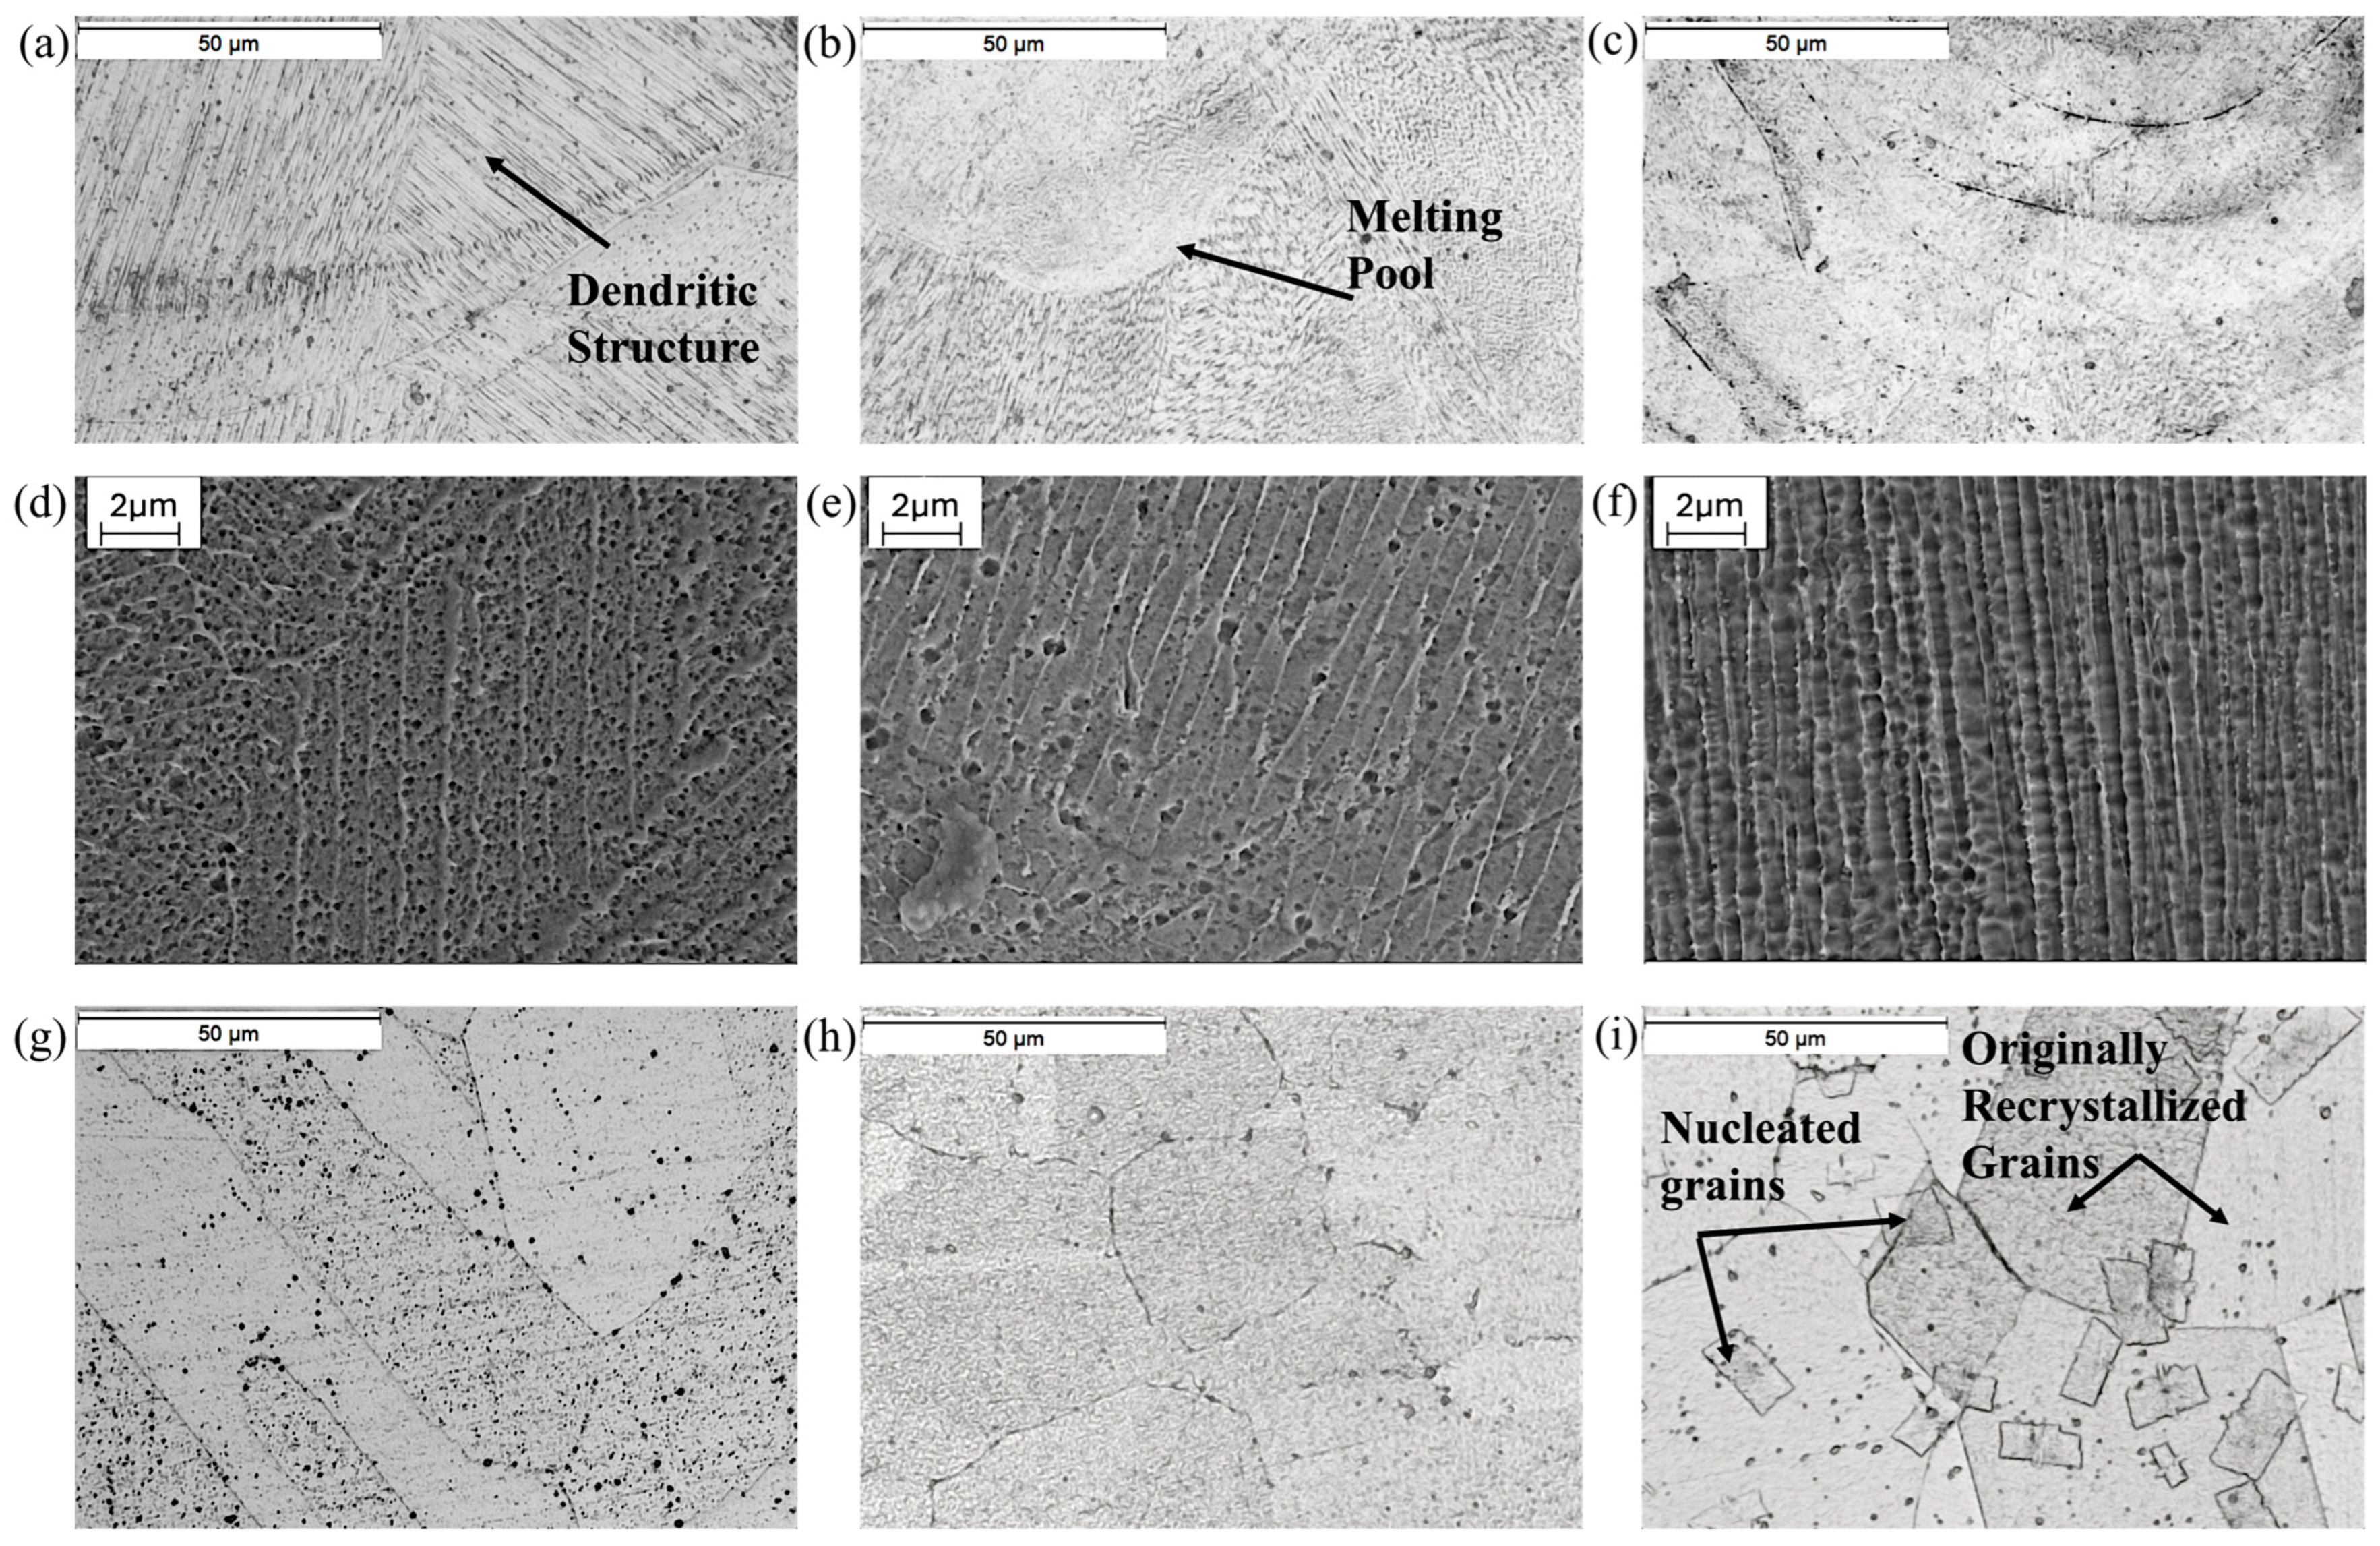
3.1. Microstructural Characterization

The 316L stainless steel bulk and scaffolds demonstrate the formation of dendritic structures in their as-built condition (Figure 2a–c). The SEM investigations indicate a slight reduction in the dendrite arm spacing in scaffold S7, recorded as 0.47 µm ± 0.02, compared to S10 with an arm spacing equal to 0.65 µm ± 0.06 and the bulk component with a 0.92 µm ± 0.06 dendrite arm spacing. This can be attributed to the increase in the cooling rate for parts with a lower volume density. Figure 2d–f depict the columnar dendritic structure of the bulk, S10, and S7, respectively. Following the heat treatment at 1150 °C for a period of 2 h, the bulk and S10 components underwent complete recrystallization, resulting in a notable alteration in their microstructure in comparison to the as-built state. The microstructure of the thermally treated components consists of equiaxed grains, which are randomly oriented and separated by grain boundaries, including twin boundaries (Figure 2g–i). However, the heat-treated S7 was subjected to new grain nucleation after complete recrystallization, resulting in the formation of finer grains within the originally recrystallized equiaxed grains (Figure 2i). This indicates that S7 may exhibit a reduced thermal stability and higher dislocation density, which stores access strain energy and triggers the growth of new grains into the dislocated crystal. The recrystallization of the 316L stainless steel produced by LPBF is controlled through mechanical deformation that arises during the printing process. Therefore, it can be assumed that scaffold S7 may have undergone a high degree of deformation due to its fine and complex geometry, as well as the higher cooling rate exhibited during manufacturing.

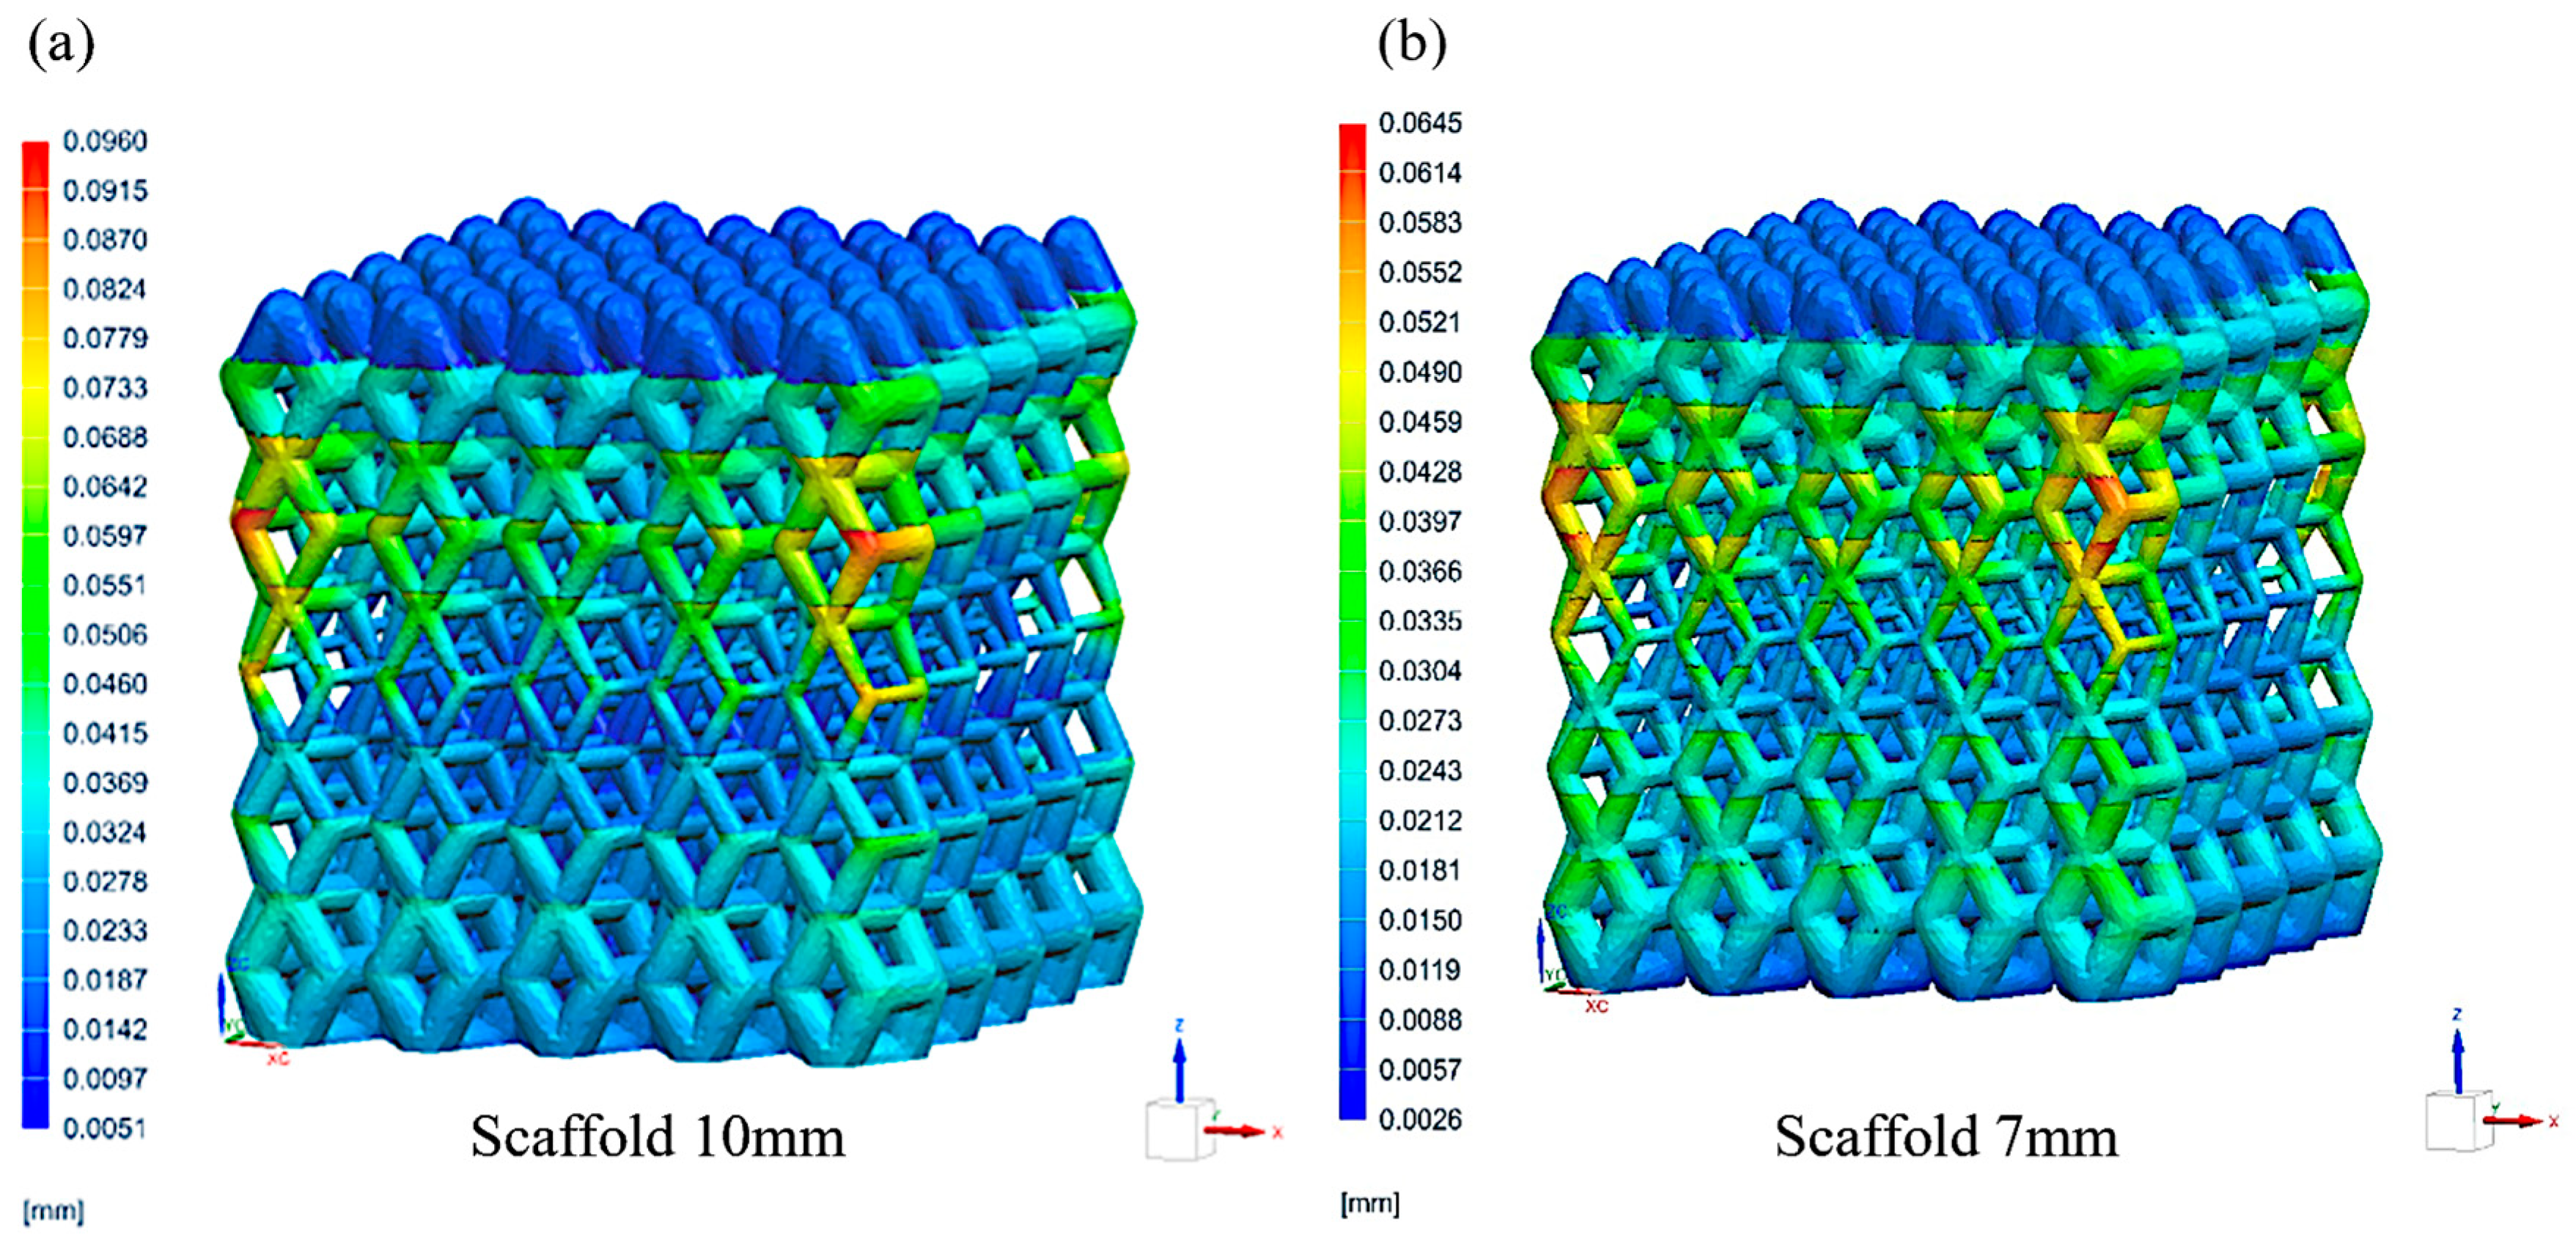
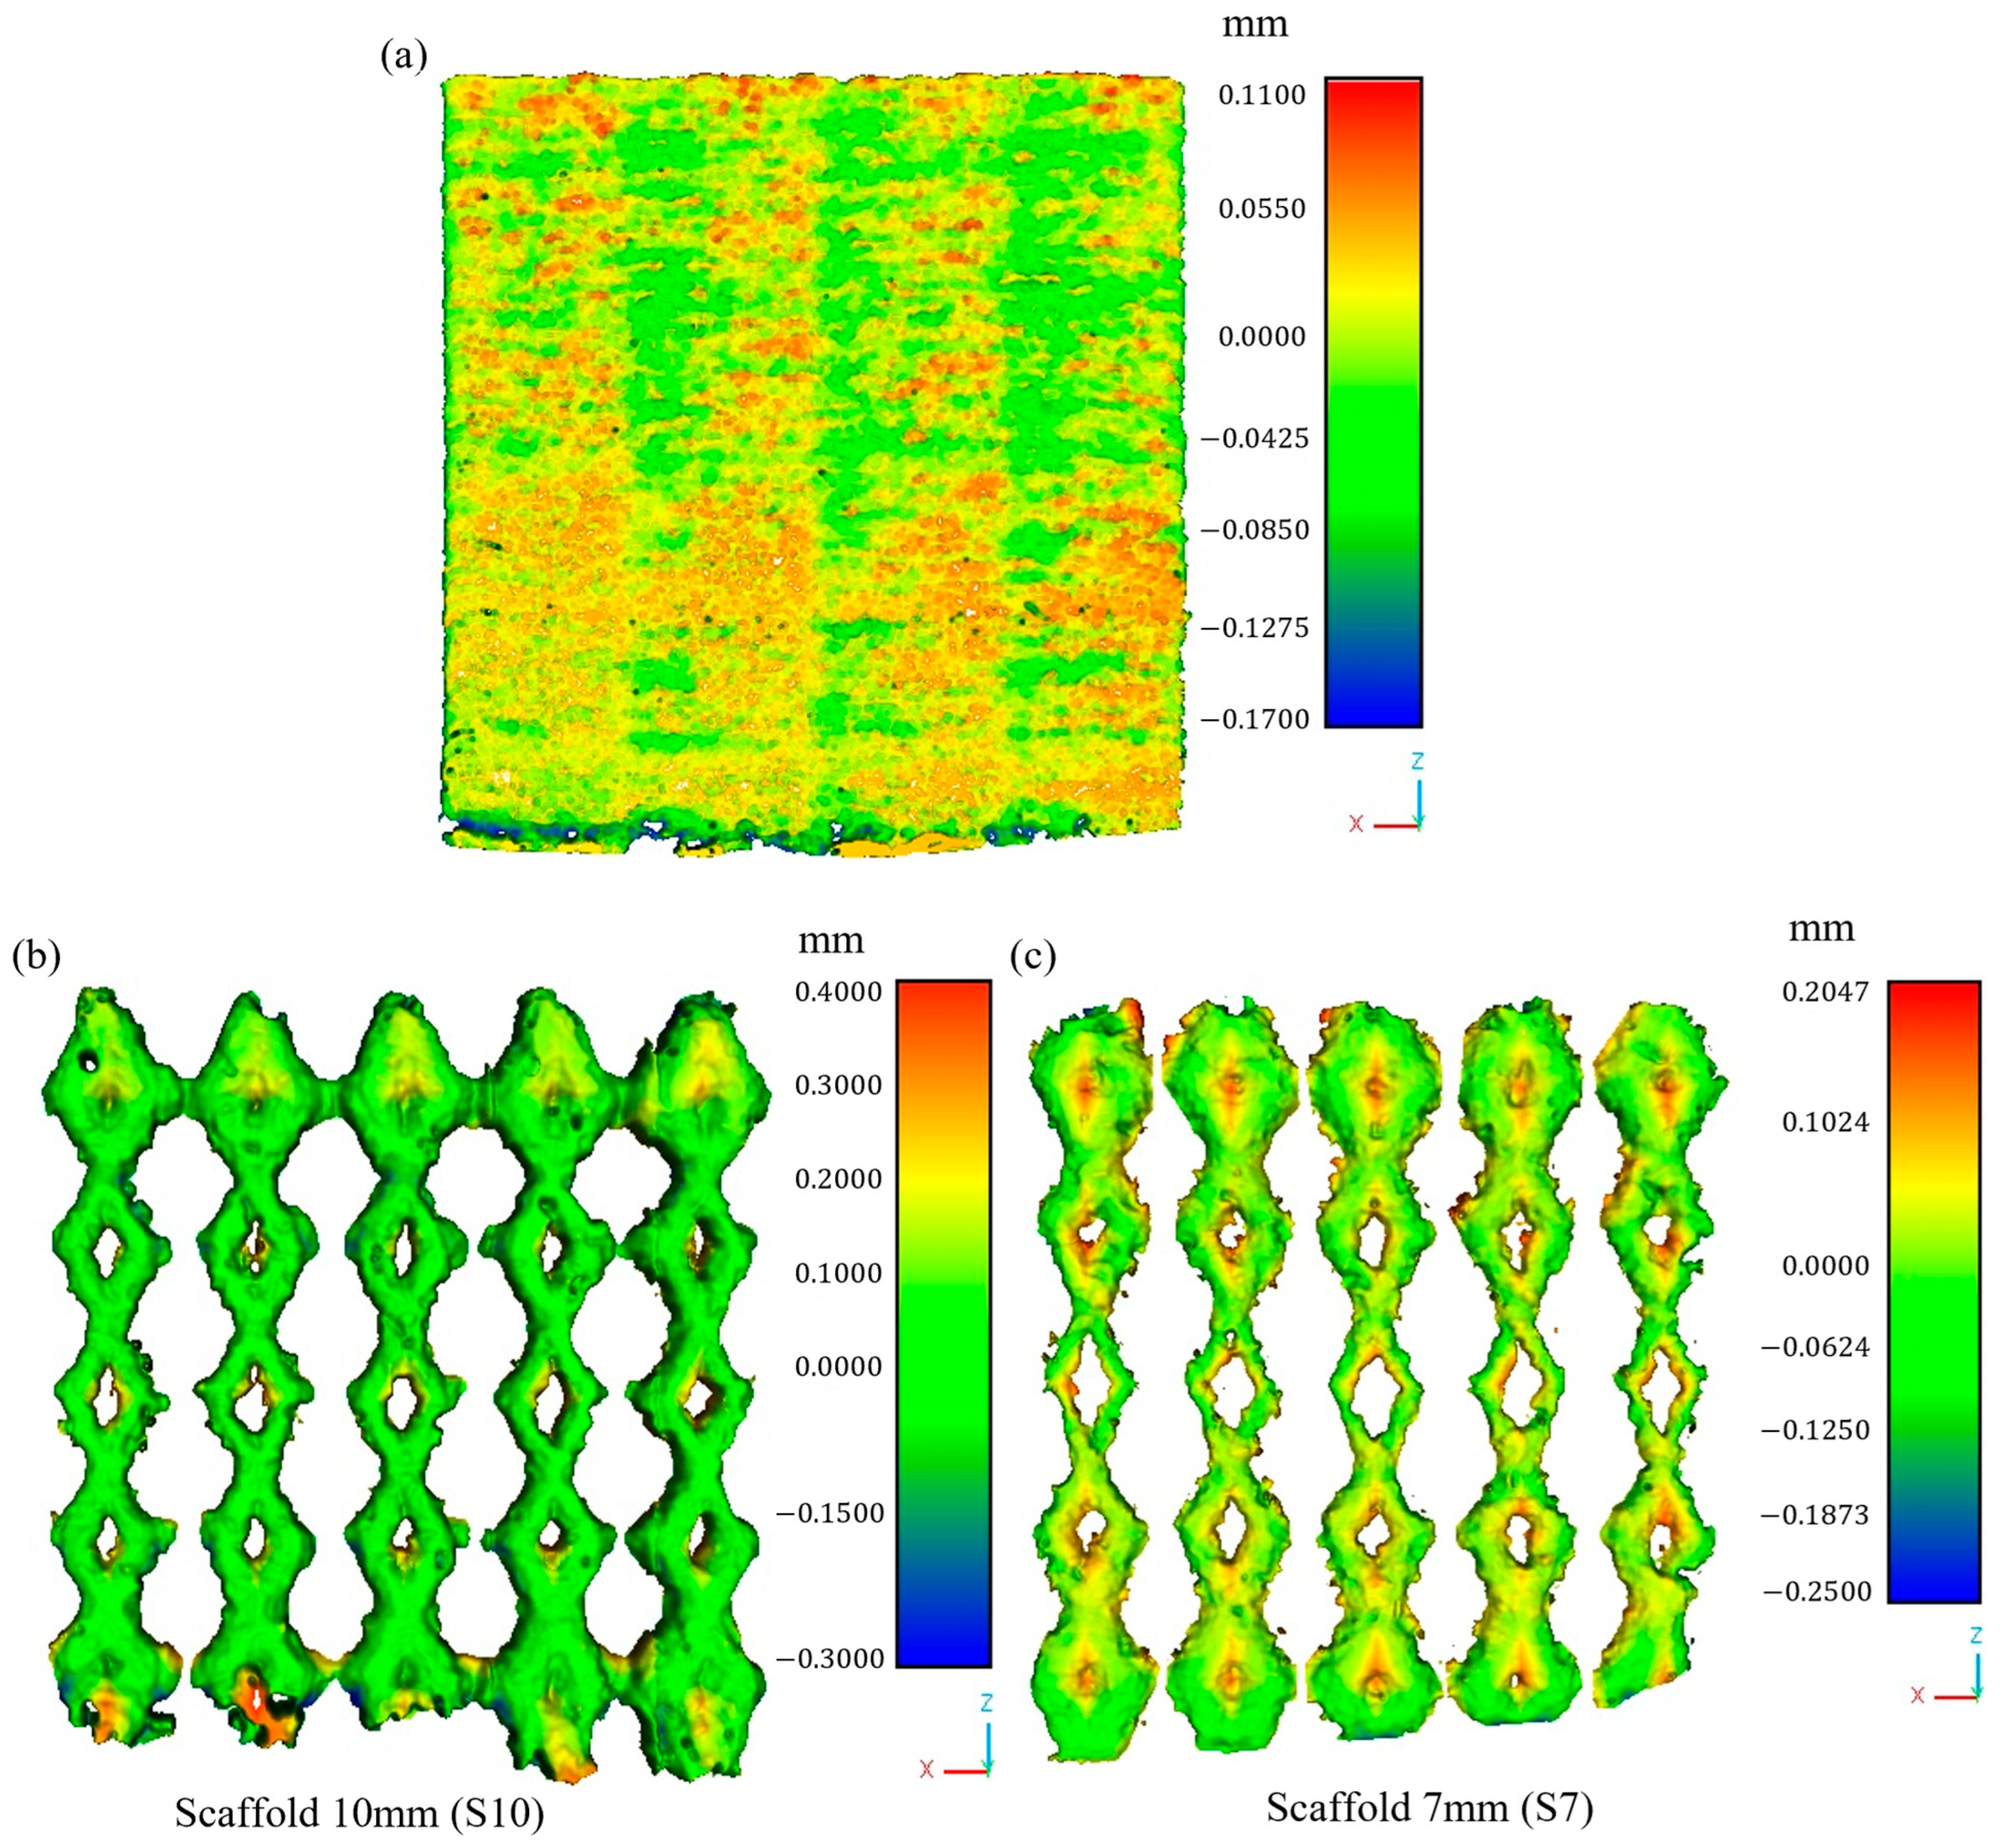
3.2. The Mechanical Deformation of the AM Components

The mechanical deformation calculated by means of a simulation of the parts printing process is presented in Figure 3. The 10 mm scaffold exhibits distortion in the range of 40 μm to 70 μm across the core struts and between 80 μm and 95 μm as a maximum distortion accumulated on the vertices of intermediate unit cells, as illustrated in Figure 3a. The 7 mm scaffold exhibits a magnitude of distortion between 40 μm and 50 μm across the core struts with a maximum value of approximately 64 μm (Figure 3b). A comparison of the thickness of the strut with the magnitude of distortion localized on it reveals that the S10 deformed by 15% to 28% in the core and by 16% to 19% at the maximum recorded magnitude of distortion. In contrast, the S7 shows approximately 32% to 40% deformation across the core struts and about 25% at the maximum recorded deformation. The distribution of mechanical deformation across the body of the parts demonstrates that the 7 mm scaffold exhibits a higher degree of deformation in comparison to the 10 mm scaffold. The plastic deformation calculated by simulation is attributed to thermal stresses resulting from the high cooling rate and the shrinkage presented during the printing process, which exceed the strength of the material.
Preliminary insight into the mechanical deformation of a component can be achieved through the scanning of its surfaces in the printing direction. Figure 4 illustrates the deformation of the bulk and scaffold components, represented by a pseudo-color map. The bulk component displays deformation across the printing layers, with a range of 50 µm and localized peaks of approximately 100 µm. This phenomenon can be attributed to the layer-by-layer method of fusing powder during the printing process, which gives rise to a staircase-like effect. The dynamics of the melting pool and the adhesion of unprocessed powder particles, which are influenced by surface tension, convection, and heat diffusion, contribute to the deformation of the part. This phenomenon is exemplified by the bulk part (Figure 4a). The scaffold components exhibit a greater degree of deformation than the bulk components. This can be attributed to the higher cooling rate exhibited by the lattice structure and the lack of solid-supported zones around the geometrical pores. The highest recorded value for S10 is in the order of 300 to 400 µm. It should be noted that this refers to the distortion acquired due to the mechanical cut removal from the build plate of the LBPF (Figure 4b) rather than the intrinsic distortion of the printed component. However, a comparison of the measured distortion value with the strut dimensions of each lattice structure and the distribution of the distortion along the surface reveals that S7 is the component that has undergone the greatest deformation. This is due to the accumulation of deformation around the geometrical pores and the thinner strut (Figure 4c). S7 demonstrates the influence of various factors on the phenomenon of plastic deformation. It is worth mentioning that the finer dimensions of the struts can facilitate a greater degree of shrinkage, which may in turn give rise to printing difficulties associated with flaws.

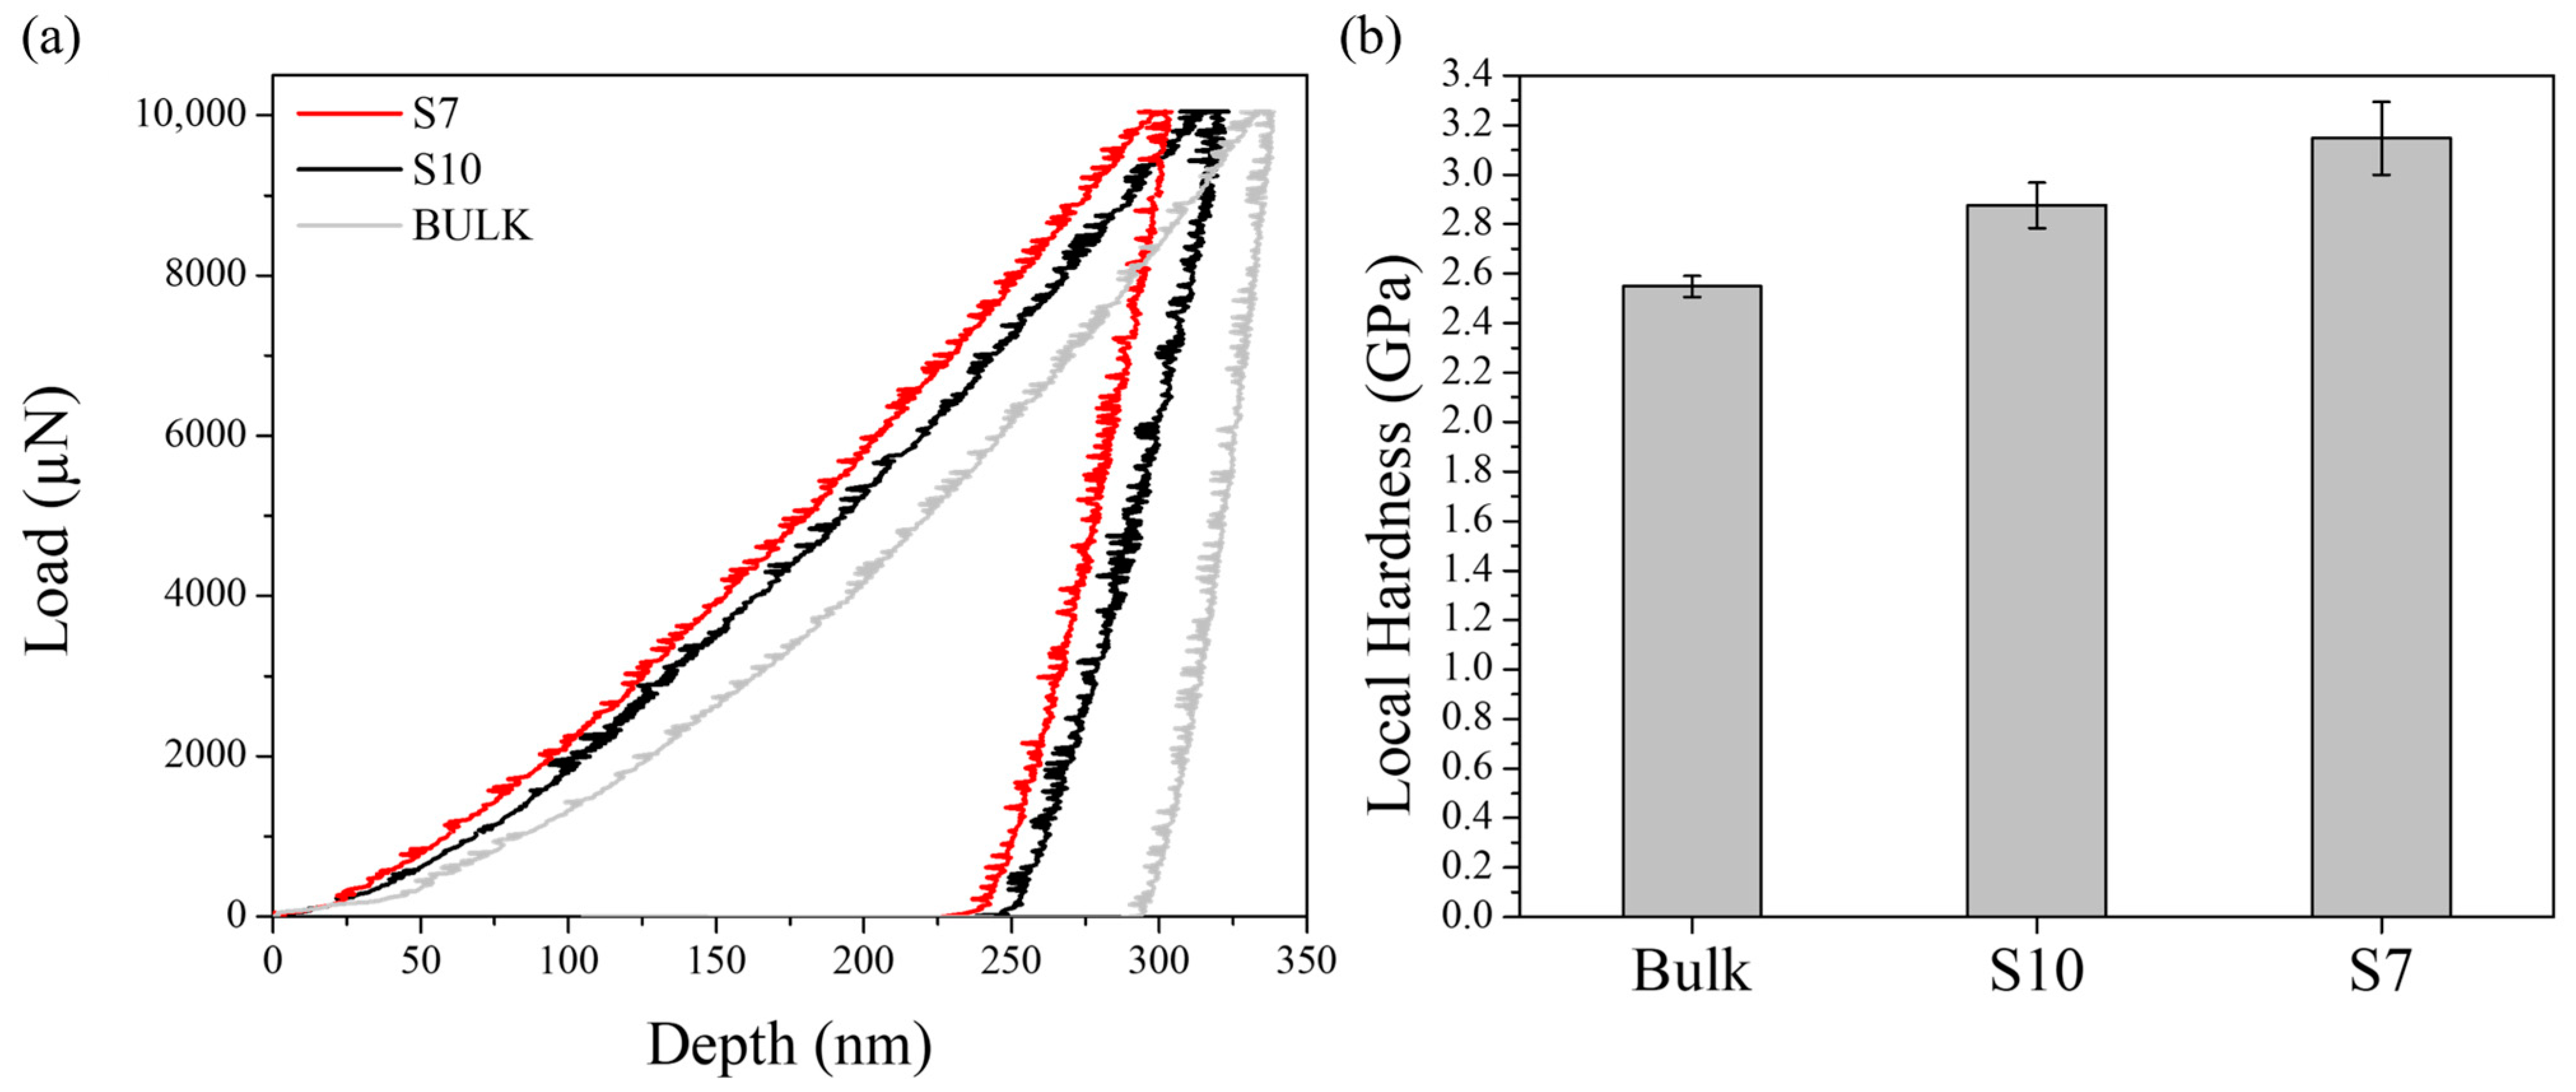
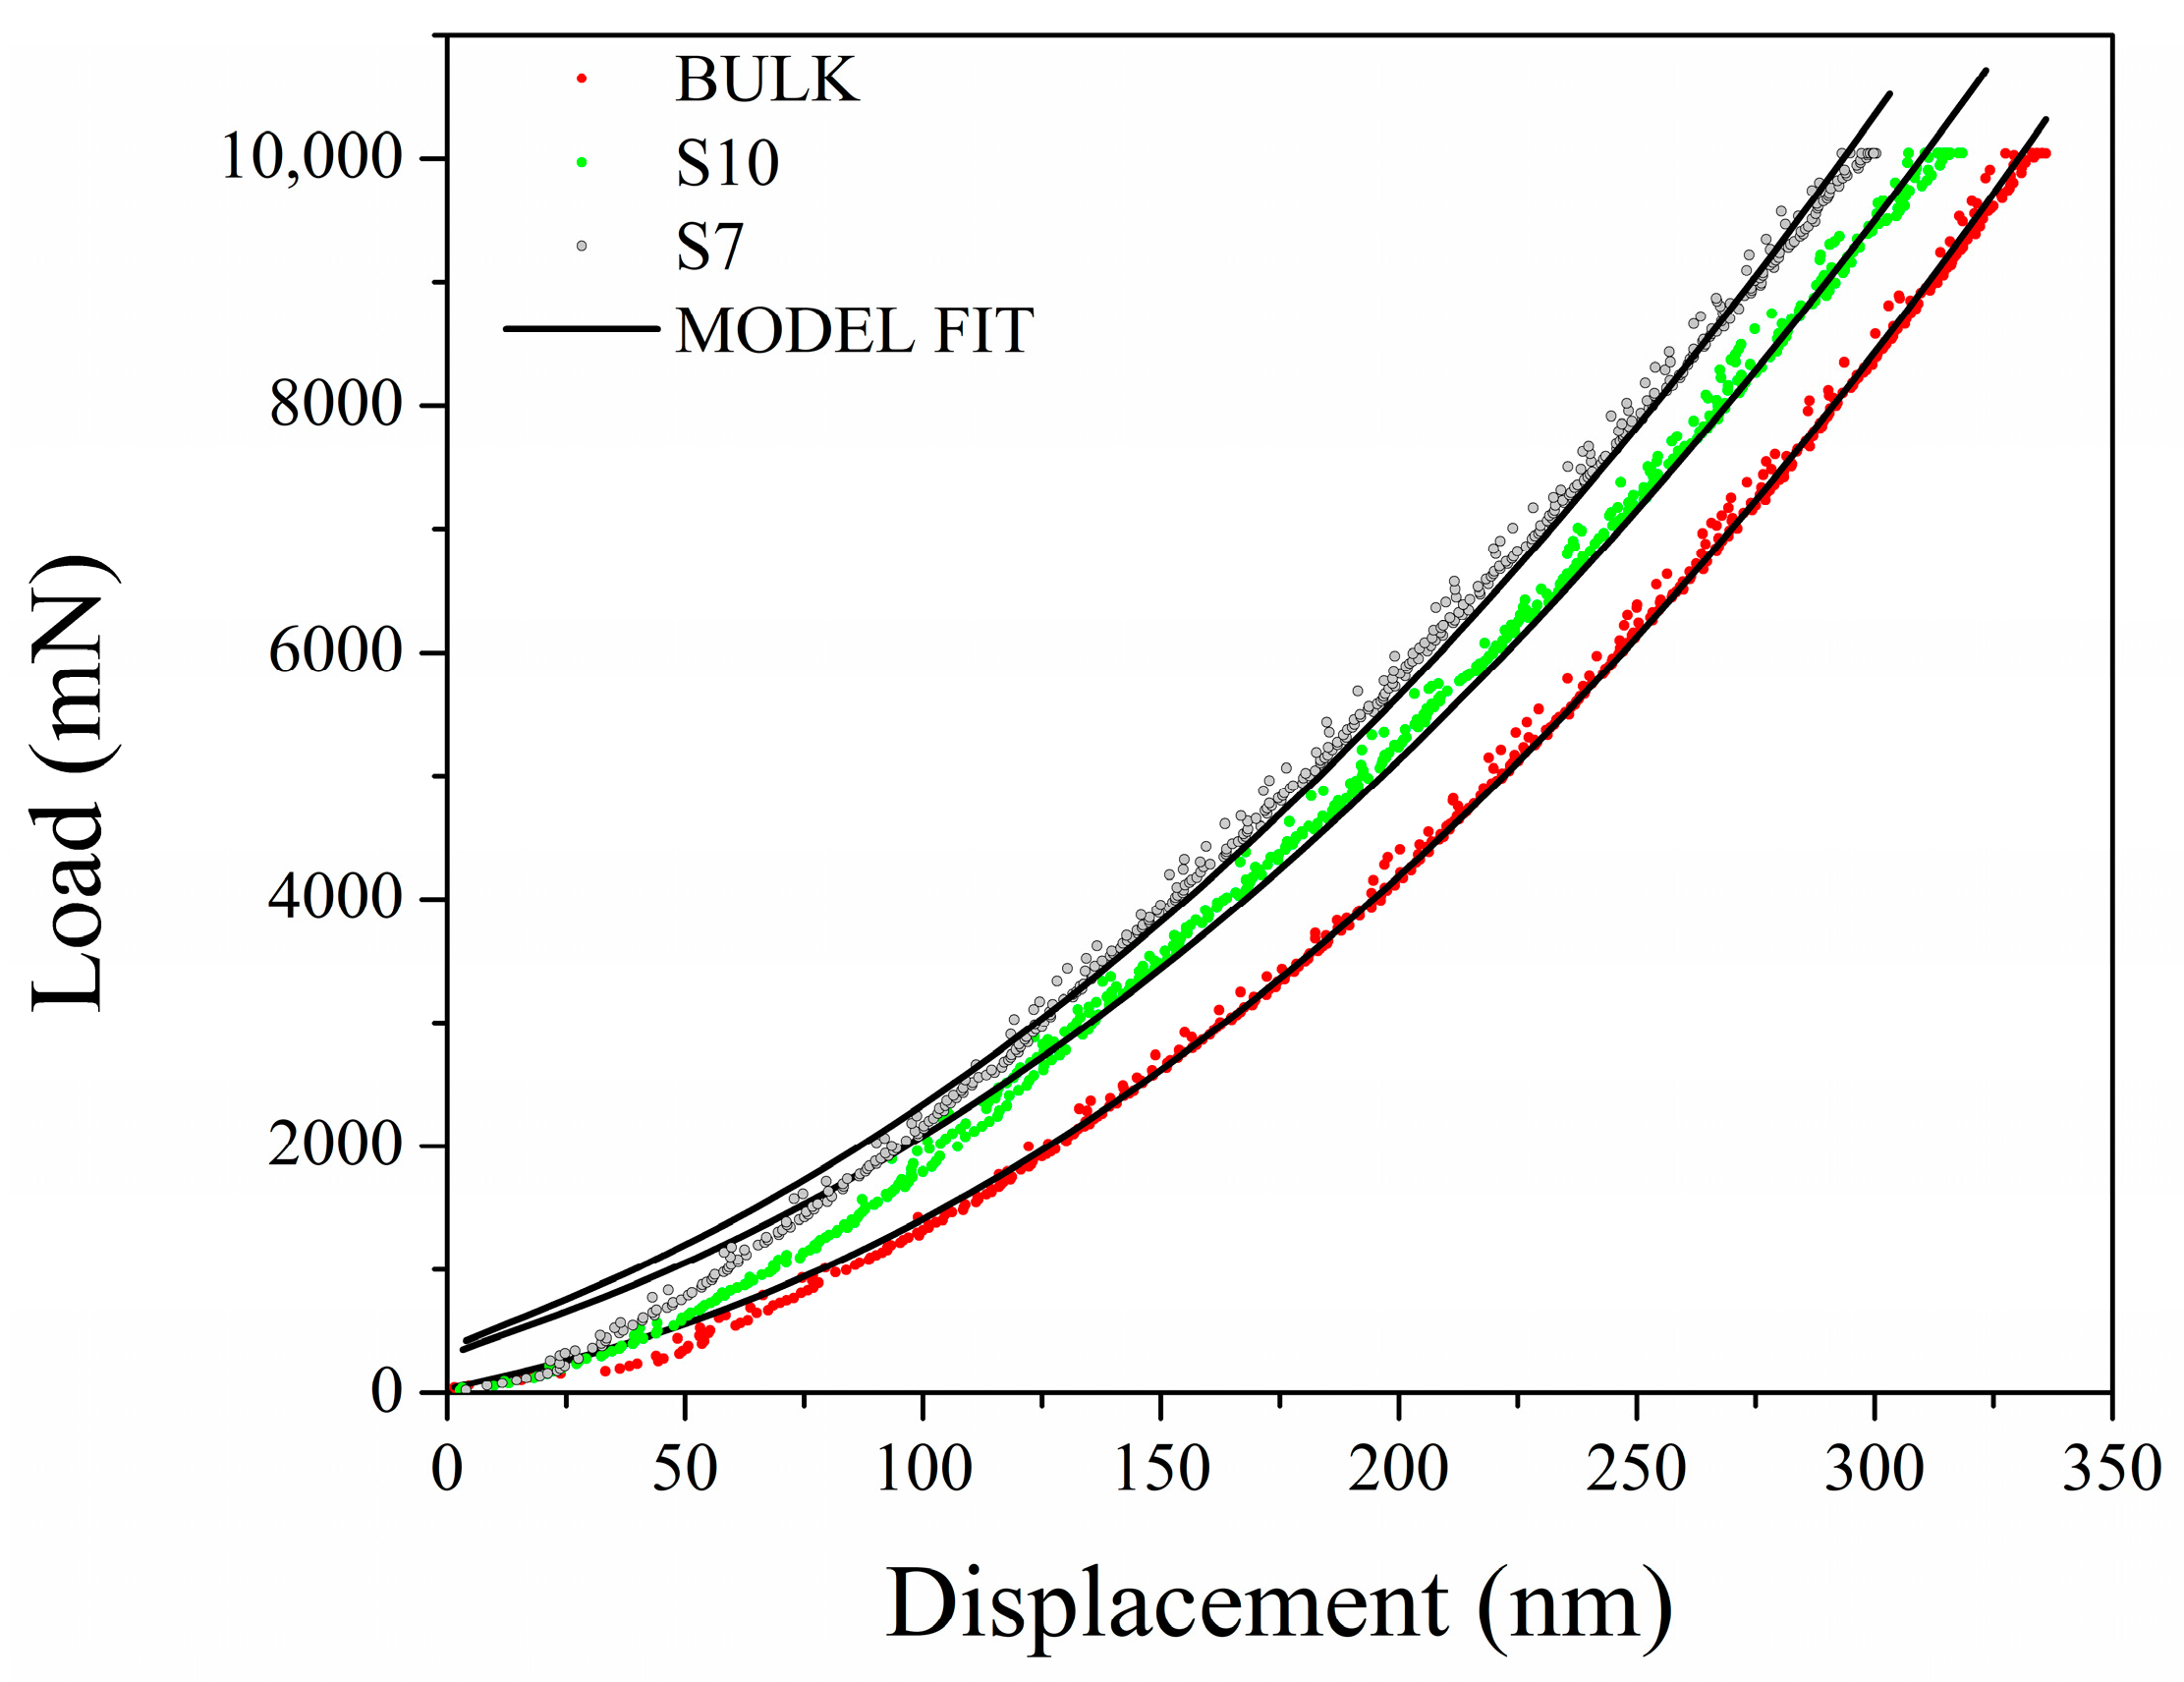
3.3. Dislocation Density by Nanoindentation

The load–displacement curves of the bulk and scaffolds S10 and S7 in the as-built condition, extracted from the results of nanoindentation using the Oliver and Pharr method, are presented in Figure 5a. The curves demonstrate the phenomenon of continuous plastic deformation and elucidate the presence of a high dislocation density beneath the indenter, proceeding with the progressive accumulation of geometrically necessary dislocations, without abrupt dislocation nucleation events. The nanoindentation results indicate an increase in local hardness in the context of lattice structures. Figure 5b below illustrates the variation in local hardness across the different structures. It can be observed that the hardness increases from the bulk to scaffold S10 of the same dimension, with a higher value recorded after the size reduction of S10. It is noteworthy that the variation in local hardness falls within the range of error for the graded strut of the same scaffold part.
According to Equation (4), and assuming that H0 is identical for the 316L bulk and lattice structures, a correlation can be established between the total dislocation density of the bulk (ρTb) and that of the lattice structure (ρTl).
ρ T l = H l H b C M α G b + ρ T b 2
where Hb and Hl are the local hardness of the bulk and lattice structures, respectively. The observed increase in the local hardness is attributed to the increase in the local dislocation density. This relationship is plotted in Figure 6.
The elastoplastic nanoindentation load–displacement curves were fitted by using Equation (8), and the resulting fit is represented in Figure 7. The fitted curves demonstrate a high degree of convergence with the experimental curves at a depth exceeding 125 nm, with a slight divergence observed at a shallower depth. This can be explained by the purely elastic nature of the initial loading. The model permits the estimation of the GND and SSD densities, with the resulting calculations illustrated in Table 2. An excellent fit to the experimental load–displacement curves was obtained by setting f = 2.3 for the bulk part, f = 1.2 for S10, and f = 1.02 for S7. The discrepancy in the value of factor f across the various components describes the variation in the extent of the plastic deformation zone size and the realistic deformation volume that the factor encompasses. The estimated dislocation density increases from the bulk to the scaffold parts. The SSD density of S7 was found to be approximately one order of magnitude higher than that of the bulk.
A comparison of the variation in dislocation densities estimated by the nanoindentation method with the resulting data from the deformation and optical microscopy reveals a significant increase in the dislocation density resulting from the increase in mechanical deformation from the bulk to scaffold and the reduction in size. However, the dislocation density of S7 was slightly greater than that of S10, indicating that not all the observed mechanical distortion resulted in the formation of dislocation. This suggests that the recrystallization of new grains over the original grains, as observed in the thermally treated S7, may be triggered by another factor in conjunction with the increase in dislocation density. This could be attributed to the size effect, resulting in a higher sensitivity to thermal treatment.
Thence, the significant increase in dislocation density from the bulk to S10 can be attributed to two main factors:
(a)
Thermal gradient and cooling rate: The higher surface-area-to-volume ratio of the S10 structure relative to the bulk component results in faster cooling rates and more pronounced thermal shrinkage, leading to a higher density of dislocations.
(b)
Geometric constraints: The interconnected lattice struts in S10 experience greater local mechanical constraints compared to the bulk, amplifying residual stresses and plastic deformation during printing.
The relatively small difference in dislocation density between S10 and S7 is probably attributable to saturation effects, signifying that the dominant mechanisms responsible for dislocation formation are already significant in S10, and a further reduction in size (S7) amplifies them.

3.4. X-Ray Diffraction Results

The XRD results indicate the presence of the austenitic phase in all the samples studied. Additionally, they provide a preliminary estimation for the average value of the total dislocation density for each of the bulk and scaffold components. The resulting measurements are displayed in Table 3. The total dislocation density of the lattice structure exhibited a significant increase compared to that of the bulk, and a slight increase was observed following the reduction in size from S10 to S7. The dislocation densities estimated by XRD align closely with the SSD values obtained from nanoindentation. The relatively smaller contribution of GNDs in the XRD measurements explains the difference in absolute values between the two methods. However, the trend of increasing dislocation density with lattice complexity remains consistent across both techniques. The dislocation density estimated from XRD primarily corresponds to the SSD, as this technique is more sensitive to lattice distortions and misorientations within grains. In contrast, the nanoindentation technique probes both the SSD and GND. Despite these methodological differences, both techniques reveal analogous trends in dislocation density evolution across the components studied. This correlation arises because the SSD and GND densities are interrelated through Taylor’s relationship, where the strain energy storage in the microstructure influences the overall dislocation structure. Consequently, the total dislocation density estimated by nanoindentation, which incorporates both the SSD and GND, follows a similar trend to the SSD measured by XRD, with different absolute values.

4. Conclusions

The present study employed nanoindentation and X-ray diffraction techniques to examine the evolution of dislocation density in three distinct additive manufacturing components: cubic bulk, a graded lattice structure (S10) of the same cubic dimension, and a reduced-size graded lattice structure (S7). The components were manufactured using laser powder bed fusion (LPBF) in 316L stainless steel. The results of the microstructural analysis, mechanical deformation investigation, and the estimation of dislocation density can be summarized as follows:
  • The as-built microstructure exhibited dendritic structure, and the dendrite sizes were measured as 0.92 µm for the bulk component, 0.65 µm for S10, and 0.47 µm for S7, thus confirming that higher cooling rates in lattice structures led to finer dendrites. Following thermal treatment at 1150 °C for 2 h, complete recrystallization occurred in both the bulk and S10 structures, resulting in the formation of equiaxed grains. However, in the S7 structure, new grain nucleation was observed within the recrystallized structure, likely due to higher stored strain energy from mechanical deformation.
  • LPBF-induced thermal stresses result in varying degrees of deformation, as confirmed by both simulation and experimental surface scans. Furthermore, the finer strut size in S7 leads to a more significant shrinkage effect, thereby increasing the mechanical deformation compared to both bulk and S10.
  • The investigation revealed a progressive increase in local hardness from the bulk to lattice structures with values of approximately 2.6 GPa for the bulk, 3.2 GPa for S10, and around 3.8 GPa for S7. A correlation was observed between the increase in hardness and the rise in total dislocation density, as determined by nanoindentation and XRD.
    Bulk: 4.48 × 10 14 m 2
    S10: 4.03 × 10 15   m 2
    S7: 6.03 × 10 15   m 2  
  • The consistency between the XRD and nanoindentation SSD confirms that the dominant contribution to dislocation density in the studied structures arises from stored plastic deformation. However, the trend similarity between the total dislocation density (as determined by nanoindentation) and SSD (as determined by XRD) indicates that GNDs follow a related evolution pattern, influenced by strain gradients imposed by the printing process.

Author Contributions

Conceptualization, K.S.; methodology, M.C.; software, K.S. and G.G.; validation, M.C., K.S. and G.G.; investigation, M.C. and G.G.; writing—original draft preparation, K.S.; writing—review and editing, M.C. All authors have read and agreed to the published version of the manuscript.

Funding

This research was financed by the European Union-NextGenerationEU (National Sustainable Mobility Center CN00000023, Italian Ministry of University and Research Decree n. 1033-17/06/2022, Spoke 11- Innovative Materials and Lightweighting) and the National Recovery and Resilience Plan (NRRP), Mission 04 Component 2 Investment 1.5-NextGenerationEU, Call for tender n. 3277 dated 30 December 2021. The opinions expressed are those of the authors only and should not be considered representative of the European Union or the European Commission’s official position. Neither the European Union nor the European Commission can be held responsible for them. In addition, this research was partially funded by the Grant of Excellence Departments, MIUR-Italy (ARTICOLO 1, COMMI 314–337 LEGGE 232/2016).

Data Availability Statement

The data presented in this study are freely available on request from the corresponding author.

Conflicts of Interest

The authors declare no conflicts of interest.

Abbreviations

The following abbreviations are used in this manuscript:
GLSGraded lattice structure
AMAdditive manufacturing
LPBFLaser powder bed fusion
SEMScanning electron microscopy
OMOptical microscopy
GNDGeometrically necessary dislocations
SSDStatistically stored dislocations

References

  1. Numan, K.; Riccio, A. A systematic review of design for additive manufacturing of aerospace lattice structures: Current trends and future directions. Prog. Aerosp. Sci. 2024, 149, 101021. [Google Scholar] [CrossRef]
  2. Stephen, D.; Stefanie, F.; Wen Feng, L.; Jun, W. Optimisation of functionally graded lattice structures using isostatic lines. Mater. Des. 2017, 127, 215–223. [Google Scholar] [CrossRef]
  3. János, P.; Ajit, P. Effect of density and unit cell size grading on the stiffness and energy absorption of short fibre-reinforced functionally graded lattice structures. Addit. Manuf. 2020, 33, 101171. [Google Scholar] [CrossRef]
  4. Gatto, M.L.; Cerqueni, G.; Groppo, R.; Santecchia, E.; Tognoli, E.; Defanti, S.; Mattioli-Belmonte, M.; Mengucci, P. Improved biomechanical behavior of 316L graded scaffolds for bone tissue regeneration produced by laser powder bed fusion. J. Mech. Behav. Biomed. Mater. 2023, 144, 105989. [Google Scholar] [CrossRef] [PubMed]
  5. Calignano, F. Design optimization of supports for overhanging structures in aluminum and titanium alloys by selective laser melting. Mater. Des. 2014, 64, 203–213. [Google Scholar] [CrossRef]
  6. Paul, R.; Anand, S.; Gerner, F. Effect of thermal deformation on part errors in metal powder based additive manufacturing processes. J. Manuf. Sci. Eng. 2014, 136, 031009. [Google Scholar] [CrossRef]
  7. Xie, D.; Lv, F.; Yang, Y.; Shen, L.; Tian, Z.; Shuai, C.; Chen, B.; Zhao, J. A review on distortion and residual stress in additive manufacturing. Chin. J. Mech. Eng. Addit. Manuf. Front. 2022, 1, 100039. [Google Scholar] [CrossRef]
  8. Di Pompeo, V.; Santecchia, E.; Santoni, A.; Sleem, K.; Cabibbo, M.; Spigarelli, S. Microstructure and defect analysis of 17-4PH stainless steel fabricated by the Bound Metal Deposition additive manufacturing technology. Crystals 2023, 12, 1312. [Google Scholar] [CrossRef]
  9. Pan, C.; Han, Y.; Lu, J. Design and optimization of lattice structures: A review. Appl. Sci. 2020, 10, 6374. [Google Scholar] [CrossRef]
  10. Liu, L.; Ding, Q.; Zhong, Y.; Zou, J.; Wu, J.; Chiu, Y.L.; Li, J.; Zhang, Z.; Yu, Q.; Shen, Z. Dislocation network in additive manufactured steel breaks strength–ductility trade-off. Mater. Today 2018, 21, 354–361. [Google Scholar] [CrossRef]
  11. Wang, Y.M.; Voisin, T.; McKeown, J.T.; Ye, J.; Calta, N.P.; Li, Z.; Zeng, Z.; Zhang, Y.; Chen, W.; Roehling, T.T. Additively manufactured hierarchical stainless steels with high strength and ductility. Nat. Mater. 2018, 17, 63–71. [Google Scholar] [CrossRef] [PubMed]
  12. Saeidi, K.; Gao, X.; Zhong, Y.; Shen, Z.J. Hardened austenite steel with columnar sub-grain structure formed by laser melting. Mater. Sci. Eng. 2015, 625, 221–229. [Google Scholar] [CrossRef]
  13. Gao, S.; Li, Z.; Van Petegem, S.; Ge, J.; Goel, S.; Vas, J.V.; Luzin, V.; Hu, Z.; Seet, H.L.; Sanchez, D.F. Additive manufacturing of alloys with programmable microstructure and properties. Nat. Commun. 2023, 14, 6752. [Google Scholar] [CrossRef]
  14. Ramirez, D.A.; Murr, L.E.; Martinez, E.; Hernandez, D.H.; Martinez, J.L.; Machado, B.I.; Medina, F.; Frigola, P.; Wicker, R.B. Novel precipitate–microstructural architecture developed in the fabrication of solid copper components by additive manufacturing using electron beam melting. Acta Mater. 2011, 59, 4088–4099. [Google Scholar] [CrossRef]
  15. Bertsh, K.M.; De Bellefon, G.M.; Kuehl, B.; Thoma, D.J. Origin of dislocation structures in an additively manufactured austenitic stainless steel 316L. Acta Mater. 2020, 199, 19–33. [Google Scholar] [CrossRef]
  16. Chamma, L.; Pipard, J.M.; Arlazarov, A.; Richeton, T.; Lecomte, J.S.; Berbenni, S. A combined EBSD/nanoindentation study of dislocation density gradients near grain boundaries in a ferritic steel. Mater. Technol. 2022, 110, 203. [Google Scholar] [CrossRef]
  17. Voyiadjis, G.Z.; Yaghoobi, M. Review of nanoindentation size effect: Experiments and atomistic simulation. Crystals 2017, 7, 321. [Google Scholar] [CrossRef]
  18. Nix, W.D.; Gao, H. Indentation size effects in crystalline materials: A law for strain gradient plasticity. J. Mech. Phys. Solids 1998, 46, 411–425. [Google Scholar] [CrossRef]
  19. Durst, K.; Backes, B.; Franke, O.; Göken, M. Indentation size effect in metallic materials: Modeling strength from pop-in to macroscopic hardness using geometrically necessary dislocations. Acta Mater. 2006, 54, 2547–2555. [Google Scholar] [CrossRef]
  20. Oliver, W.C.; Pharr, G.M. An improved technique for determining hardness and elastic modulus using load and displacement sensing indentation experiments. J. Mater. Res. 1992, 7, 1564–1583. [Google Scholar] [CrossRef]
  21. Tabor, D. The Hardness of Metals; Oxford University Press: Oxford, UK, 2000. [Google Scholar] [CrossRef]
  22. Dao, M.; Chollacoop, N.V.; Van Vliet, K.J.; Venkatesh, T.A.; Suresh, S.J.A. Computational modeling of the forward and reverse problems in instrumented sharp indentation. Acta Mater. 2001, 49, 3899–3918. [Google Scholar] [CrossRef]
  23. Taylor, G.I. The mechanism of plastic deformation of crystals. Part I.—Theoretical. Proc. R. Soc. Lond. A 1934, 145, 362–387. [Google Scholar]
  24. Barnoush, A. Correlation between dislocation density and nanomechanical response during nanoindentation. Acta Mater. 2012, 60, 1268–1277. [Google Scholar] [CrossRef]
  25. Gallet, J.; Perez, M.; Guillou, R.; Ernould, C.; Le Bourlot, C.; Langlois, C.; Beausir, B.; Bouzy, E.; Chaise, T.; Cazottes, S. Experimental measurement of dislocation density in metallic materials: A quantitative comparison between measurements techniques (XRD, R-ECCI, HR-EBSD, TEM). Mater. Charact. 2023, 199, 112842. [Google Scholar] [CrossRef]
  26. Murugesan, S.; Kuppusami, P.; Mohandas, E.; Vijayalakshmi, M. X-ray diffraction Rietveld analysis of cold worked austenitic stainless steel. Mater. Lett. 2012, 67, 173–176. [Google Scholar] [CrossRef]
Figure 1. Schematic view of the GLS representing the studied plane and the printing direction.
Jmmp 09 00059 g001
Figure 2. Optical microscopy images of the as-built bulk (a), S10 (b), and S7 (c). Microstructural morphology of the as-built bulk (d), S10 (e), and S7 (f) using scanning electron microscopy, and the microstructure of the heat-treated bulk (g), S10 (h), and S7 (i) using optical microscopy.
Jmmp 09 00059 g002
Figure 3. The magnitude of mechanical distortion as calculated by simulating the lattice structures S10 (a) and S7 (b) during the printing process and after support removal.
Jmmp 09 00059 g003
Figure 4. Deformation color map conducted by CloudCompare for the scanned surfaces of bulk (a), S7 (b), and S10 (c).
Jmmp 09 00059 g004
Figure 5. The load–displacement curves (a) and the local hardness (b) of the 316L stainless steel bulk, 10 mm scaffold, and 7 mm scaffold measured using the nanoindentation test.
Jmmp 09 00059 g005
Figure 6. The variation in the local total dislocation density of the lattice structure ρTl with respect to that of the bulk structure ρTb.
Jmmp 09 00059 g006
Figure 7. The load–displacement curves of bulk and scaffold structures extracted by the nanoindentation test and fitted by Equation (8).
Jmmp 09 00059 g007
Table 1. The range of printing parameters used to produce the components is based on a previous study [4].
Printing Parameter Range
Laser power [W]200–270
Scan speed [mm/s]400–1000
Hatching distance [mm]0.10–0.14
Thickness [mm]0.02–0.06
Volumetric energy density [J/mm3]48
Table 2. The factor f, GND, and SSD densities of the bulk and scaffold parts calculated by fitting the load–displacement curves of nanoindentation using Equation (8).
Factor fρGND (m−2)ρSSD (m−2)ρTotal (m−2)
Bulk2.34.238 × 1014 ± 1.3765 × 10122.460 × 1013 ± 4.11096 × 10114.484 × 1014
S101.23.932 × 1015 ± 3.10271 × 10129.739 × 1013 ± 1.93623 × 10124.029 × 1015
S71.025.799 × 1015 ± 3.74386 × 10122.308 × 1014 ± 5.59723 × 10126.029 × 1015
Table 3. Total dislocation density of the bulk and scaffold 316L stainless steel component measured by XRD.
Dislocation Density (m−2)
Bulk 2.18783 × 10 13
S10 2.36152 × 10 14
S7 6.76931 × 10 14
Disclaimer/Publisher’s Note: The statements, opinions and data contained in all publications are solely those of the individual author(s) and contributor(s) and not of MDPI and/or the editor(s). MDPI and/or the editor(s) disclaim responsibility for any injury to people or property resulting from any ideas, methods, instructions or products referred to in the content.

