3. Materials and Methods
The wear amount in the punch and die of D2 steel with complex shapes and sharp corners was investigated according to the number of strokes on the front surface, side surfaces, and corners.
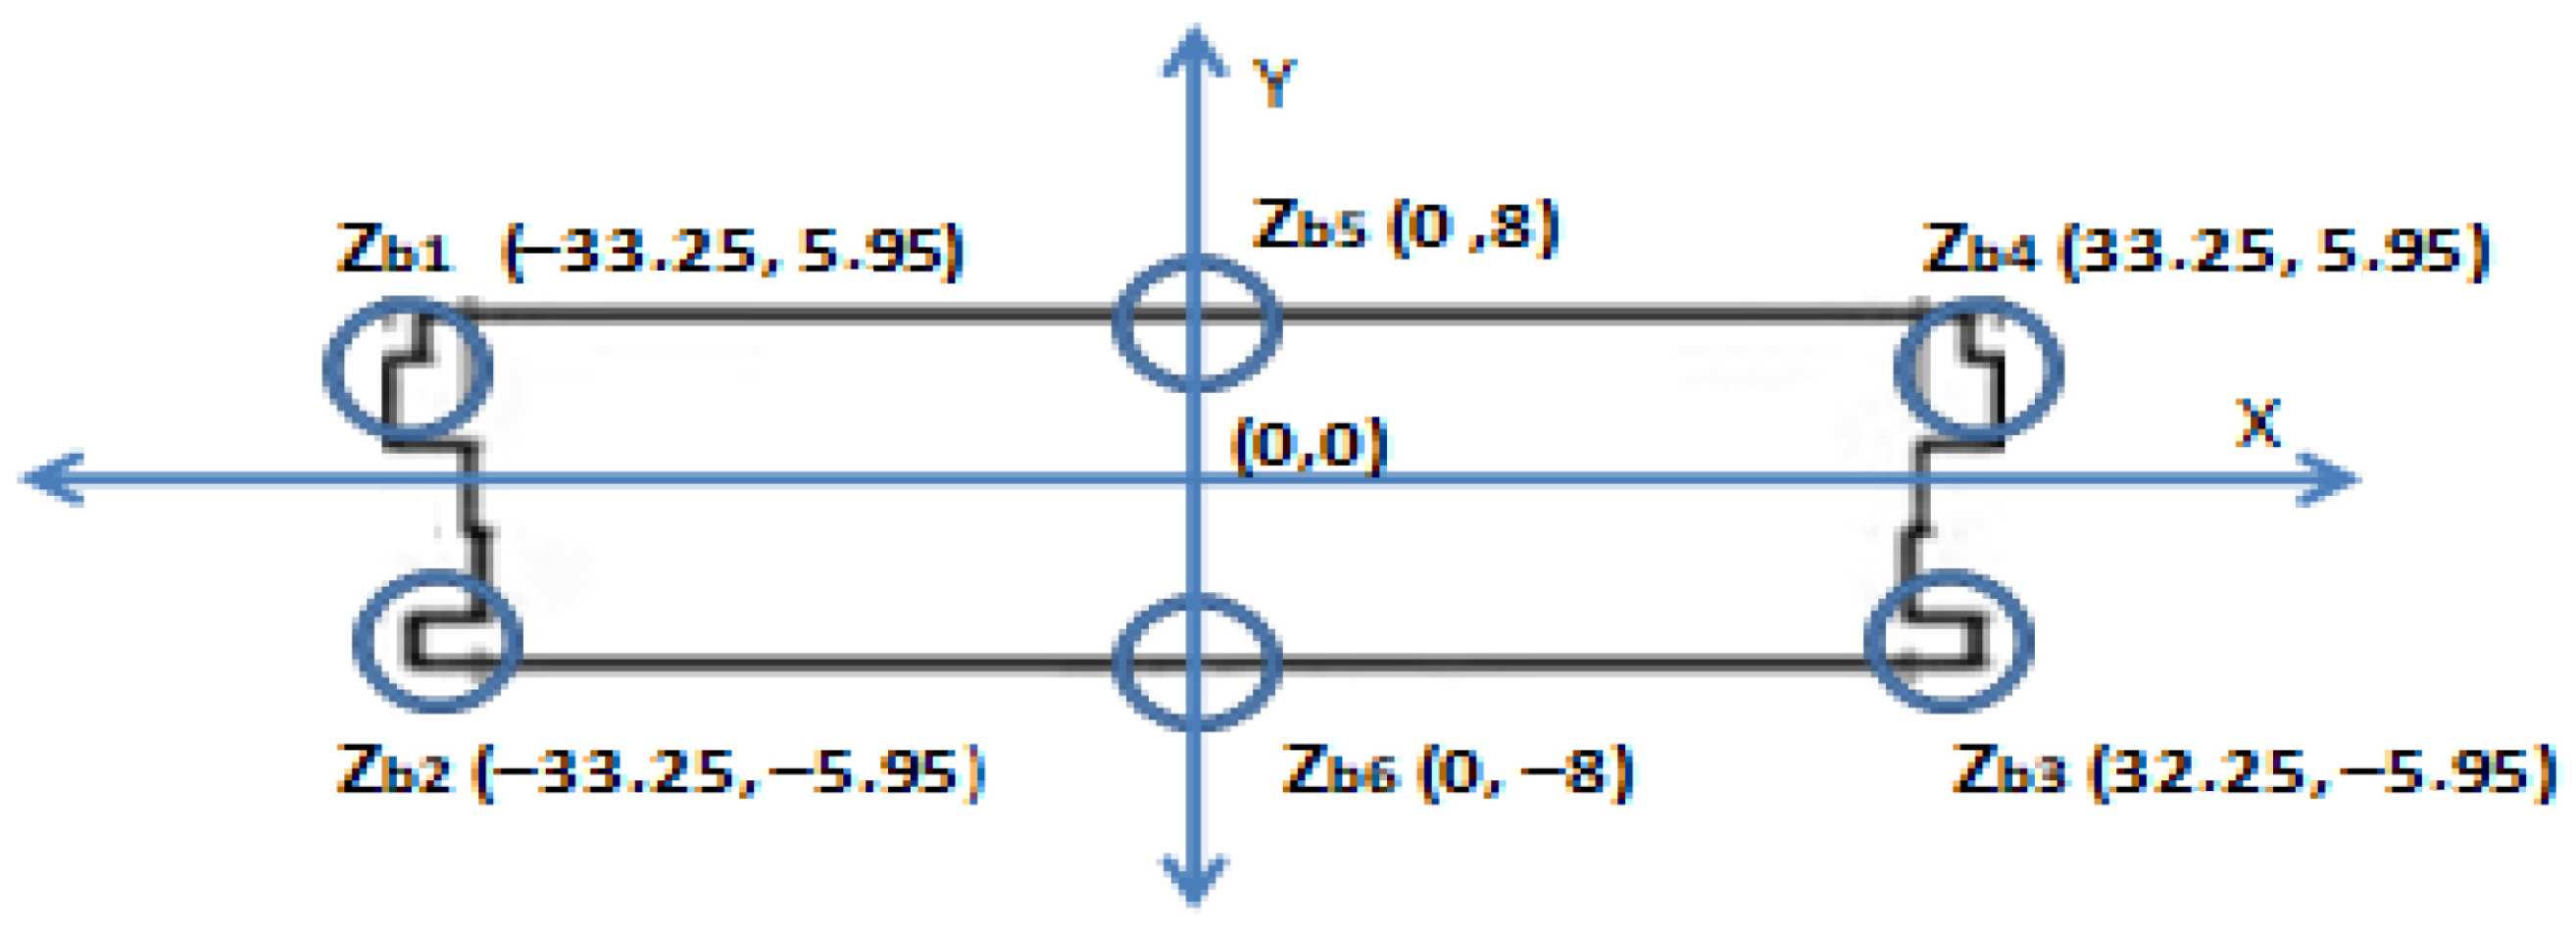
The surface roughness changes on the front and flank surfaces of the die and punch were measured according to the number of strokes. Burr formation was measured in six different regions as the number of strokes for a 0.50 mm thin sheet increased.
The changes in the radius and blanking edge angle on the blanking edge of the die and punch, as well as the changes in adhesive wear on the punch front and flank faces, which changed with the number of strokes (where the effect of wear was most visible), were measured.
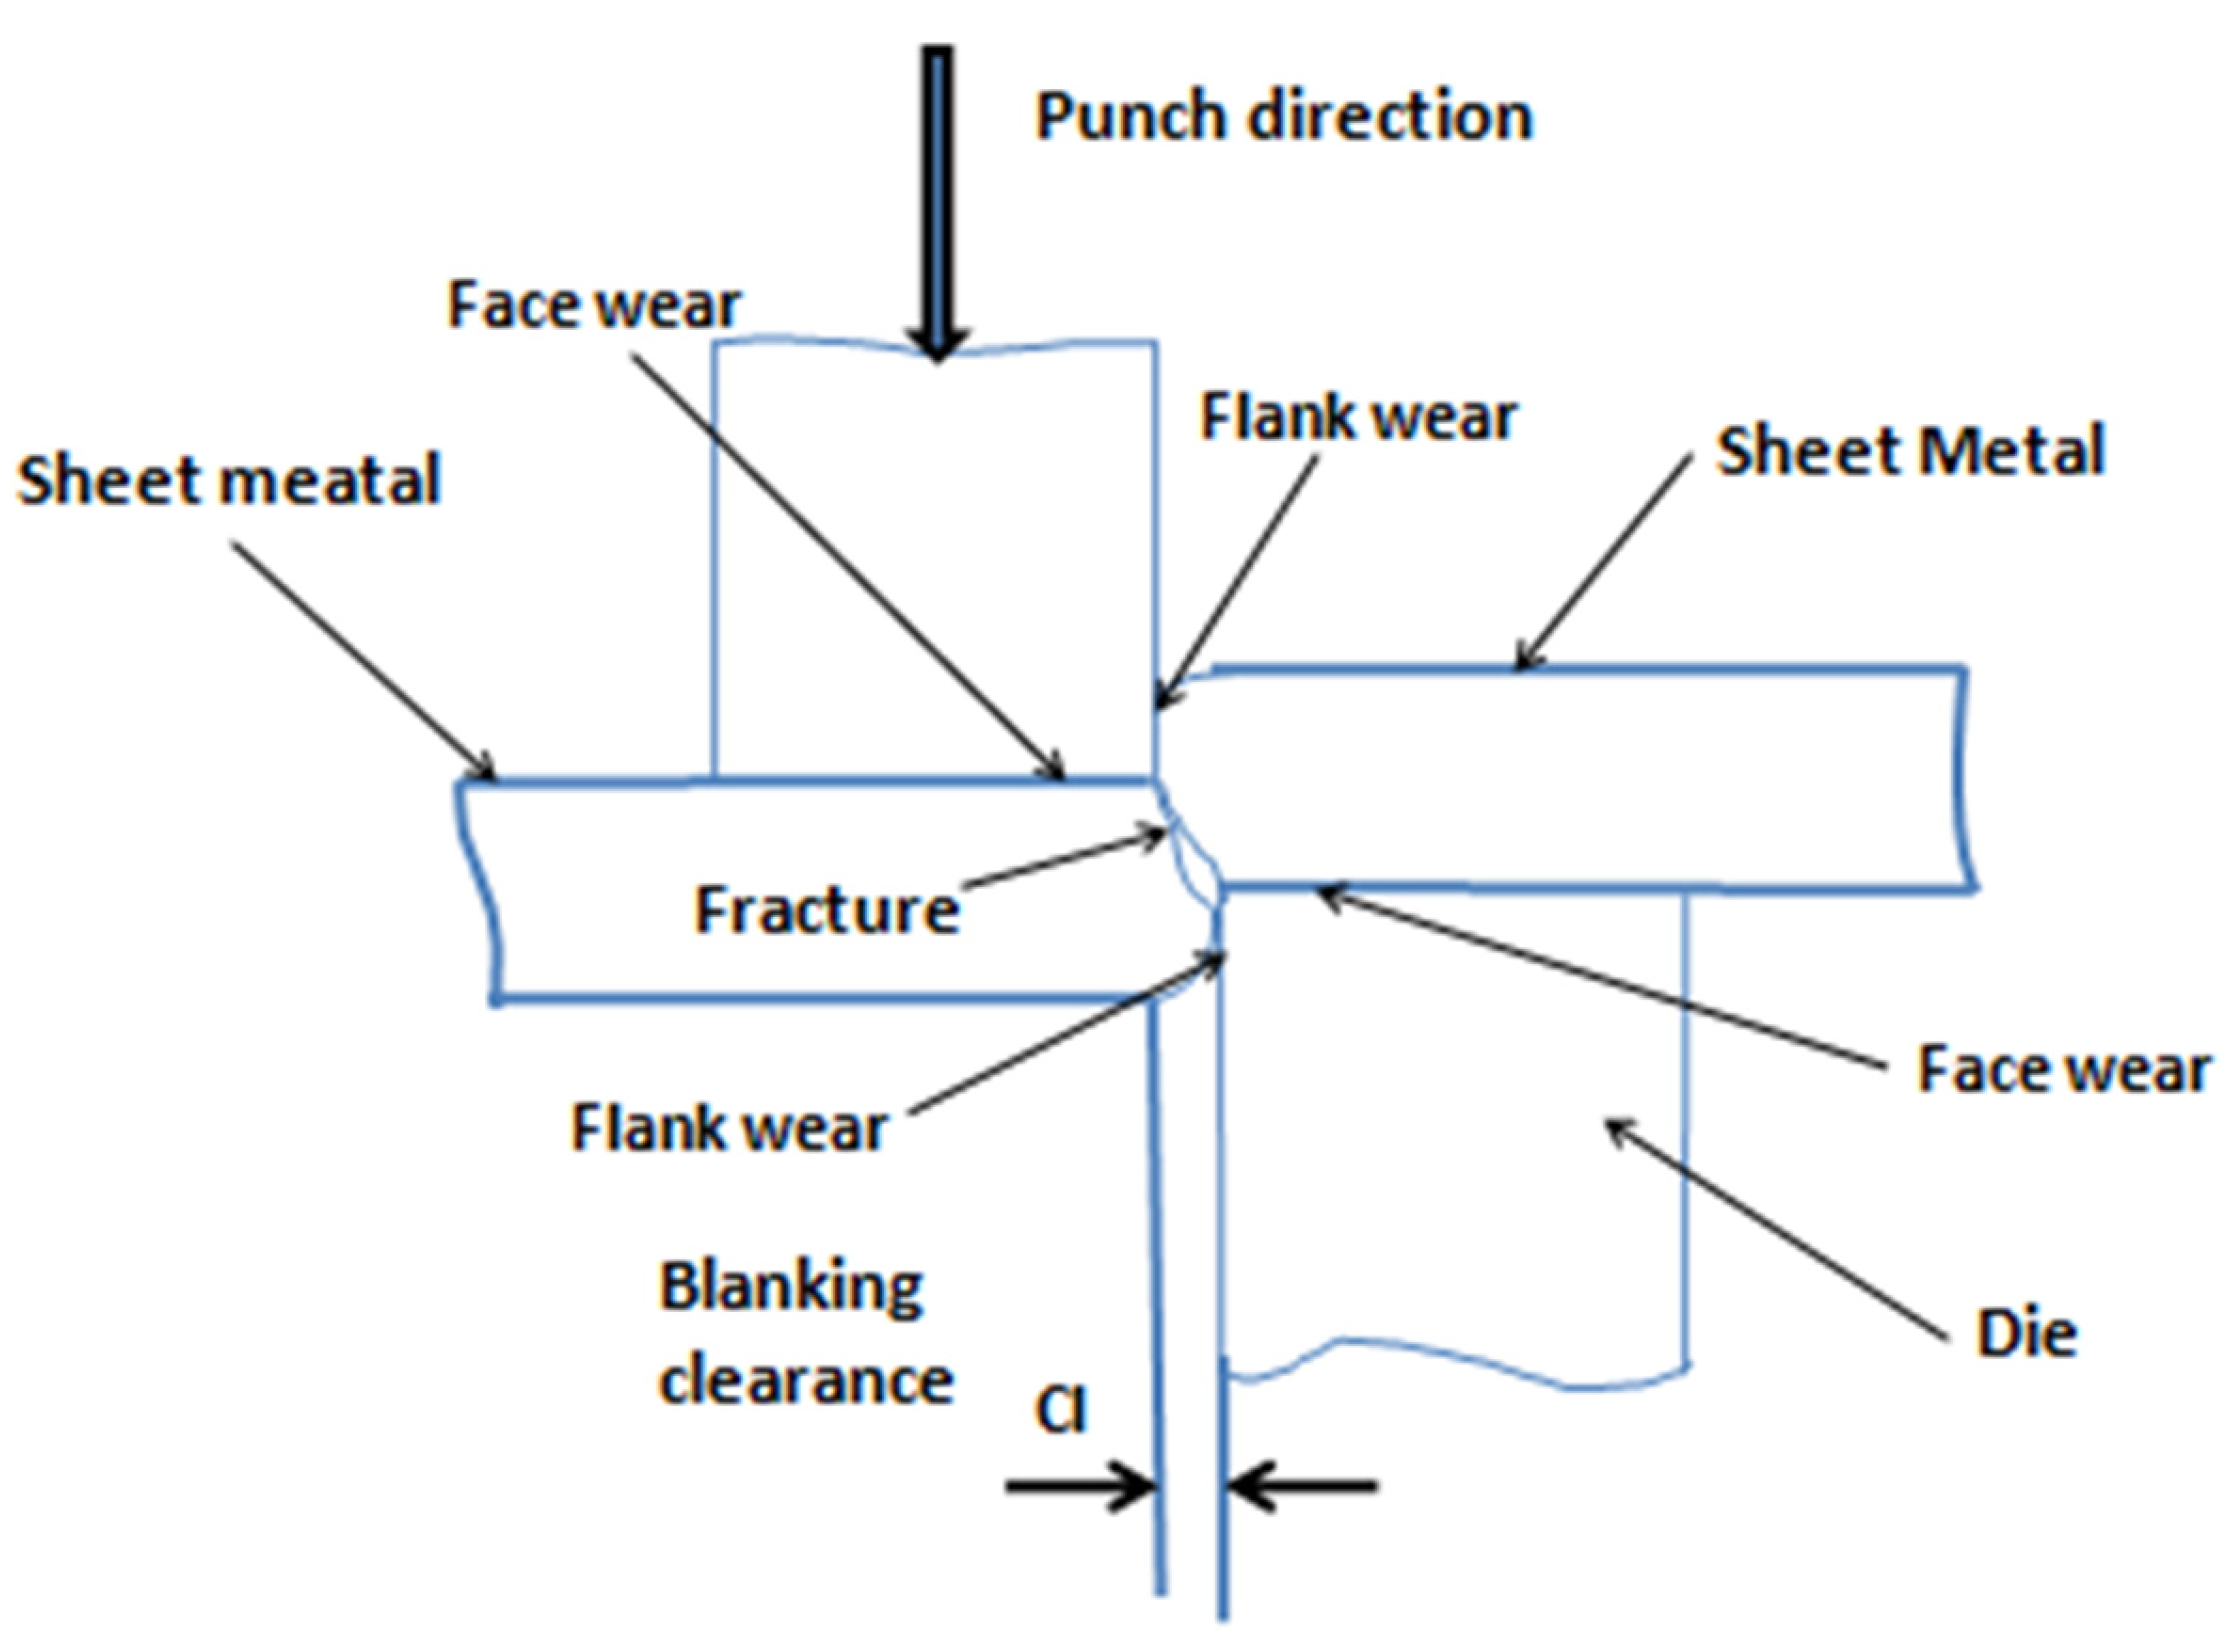
The worn edge in the blanking process and the representation of the die clearance are depicted in
Figure 1. The clearance between the die and the punch is marked as
.
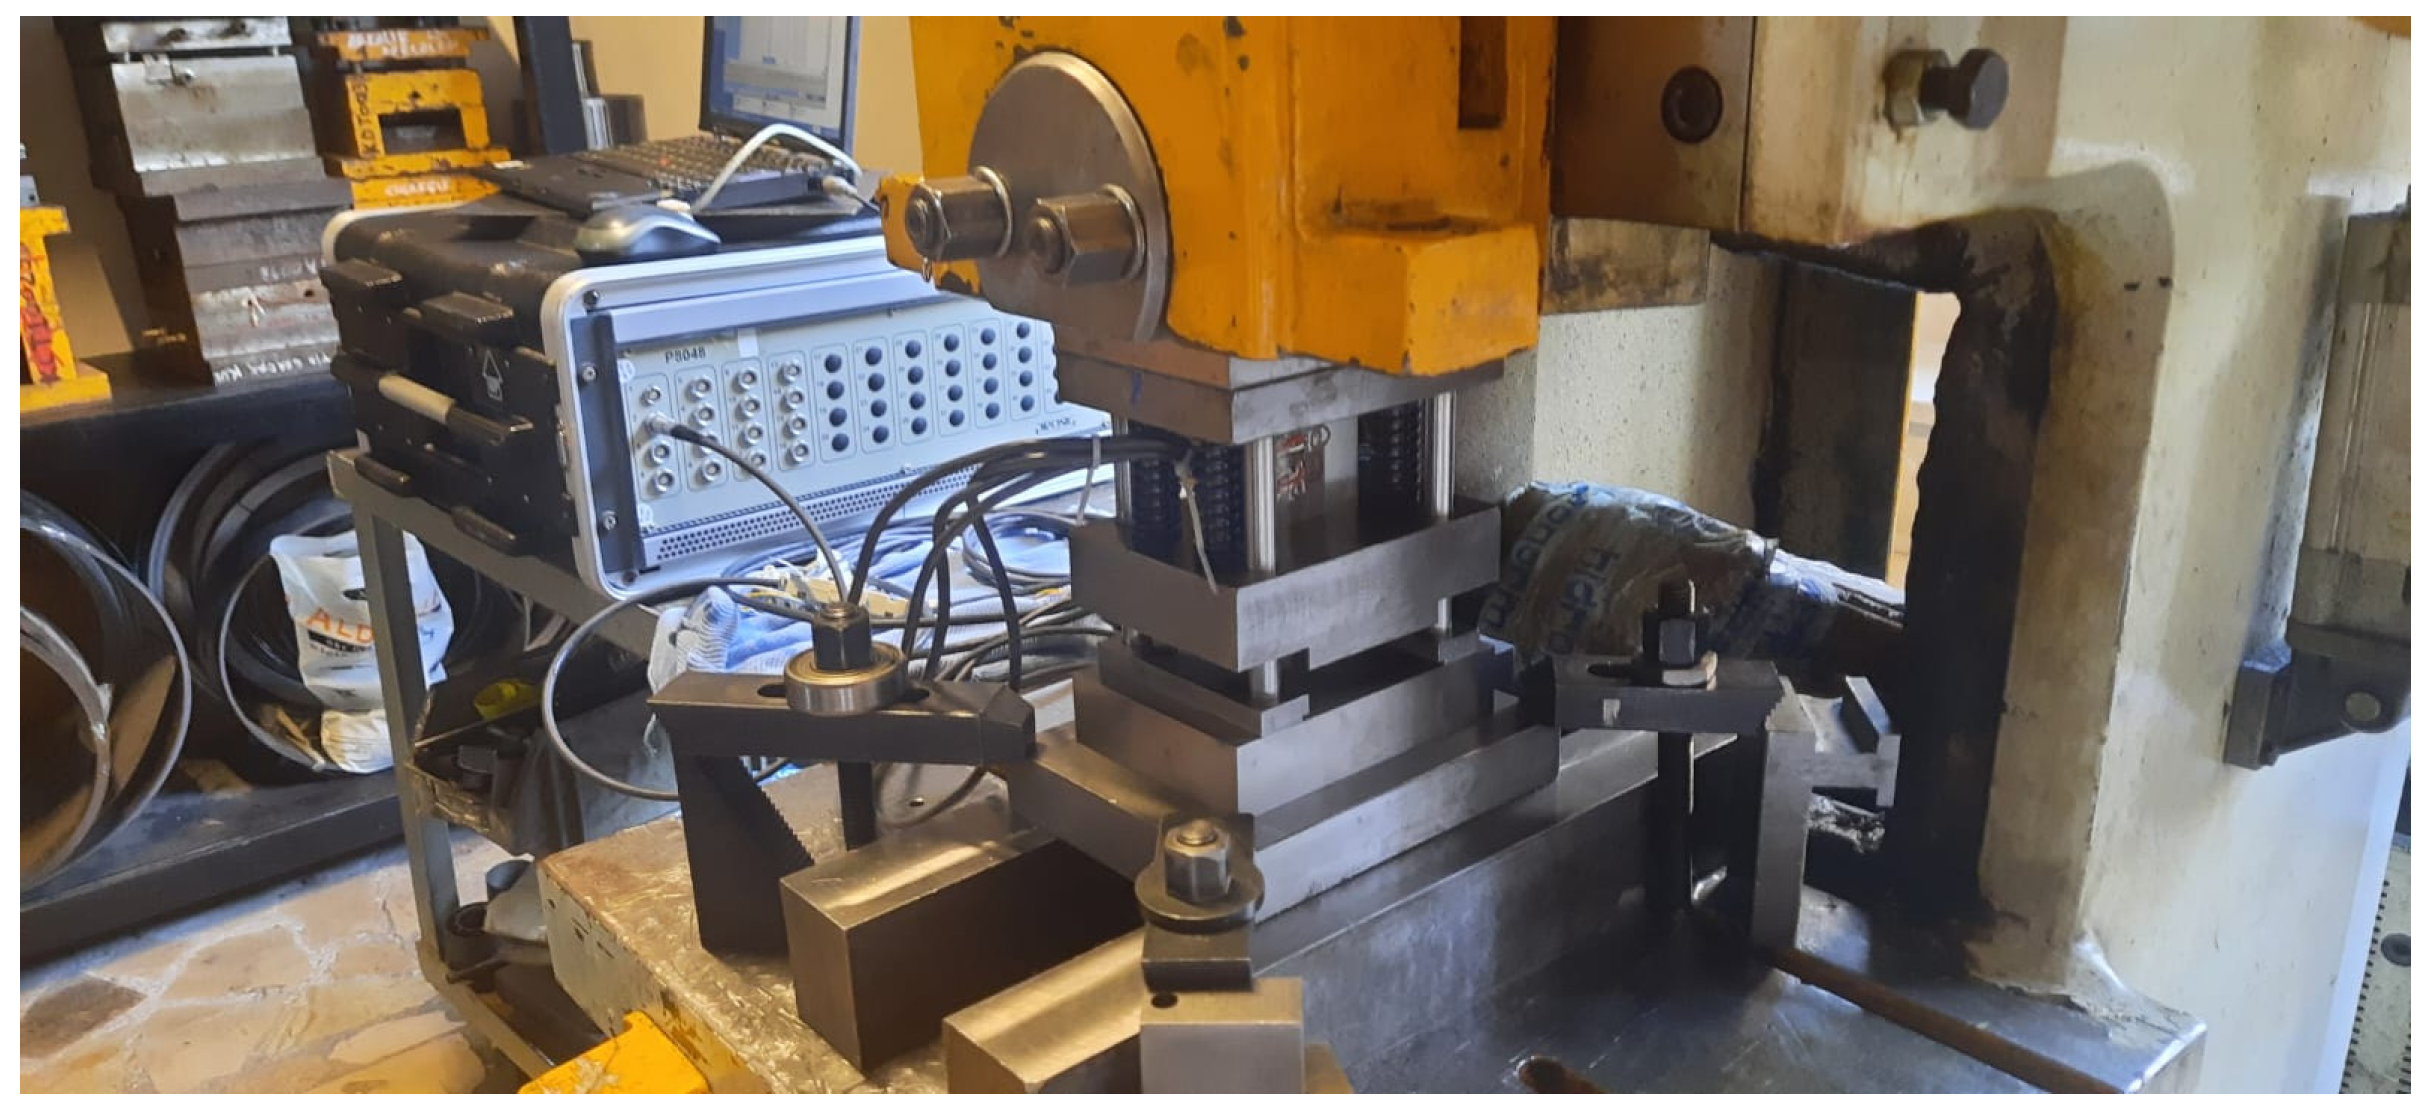
The instrument used in this study is shown in
Figure 2. The prepared cutting die was connected to a C-type eccentric press with a mechanical clutch and pneumatic system with a capacity of 35 tons, and the experimental study was carried out. The die stroke is 25 mm, and the punch rate at the cutting frequency (
mm/s) was determined; all experiments were performed with these parameters. The experiments were conducted on a C-type eccentric press operating at a constant motor speed of 950 rpm, corresponding to a flywheel speed of 95 rpm (≈9.97 rad/s, 14° angular progression per stroke). The press worked at a constant stroke speed without dwell, and cycle time was determined by flywheel rotation.
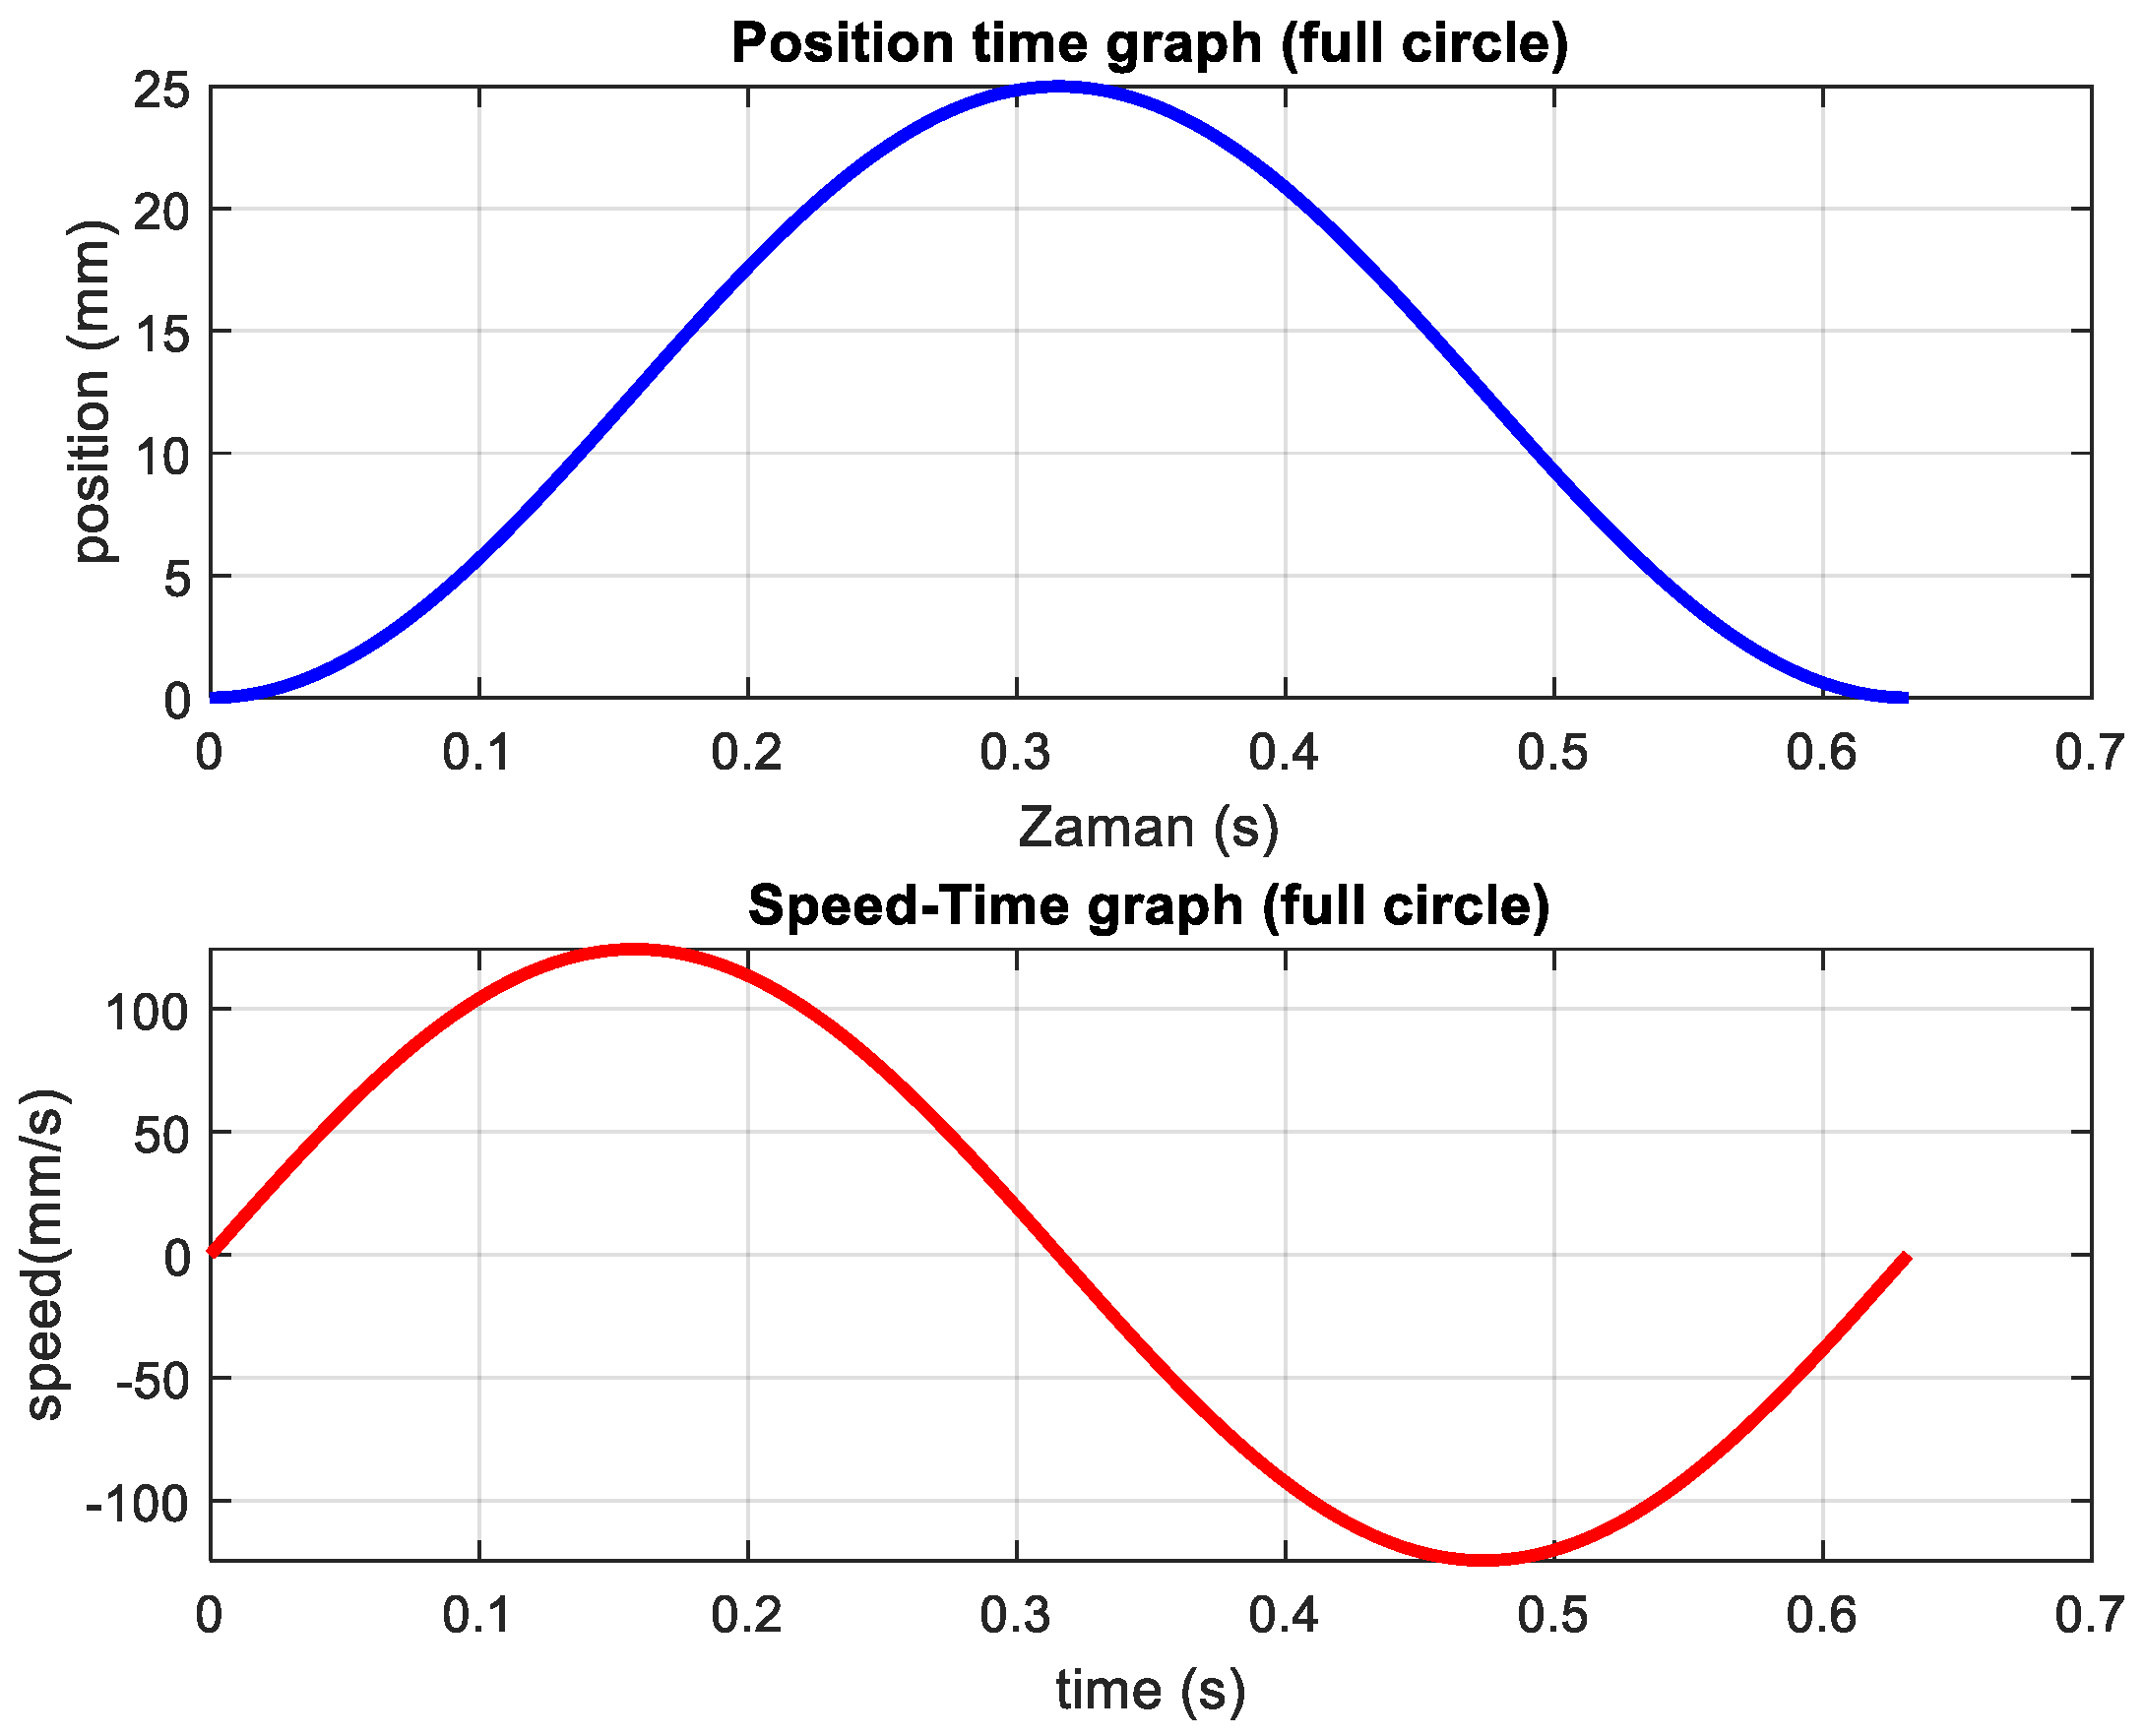
In this figure, the blanking die fixed to the table of the C-type eccentric press, as well as the data acquisition instruments, can also be seen. No lubrication was used; the environment was controlled at 22 °C and 40–50% relative humidity. Sampling was performed systematically, as follows: up to 10,000 strokes, every 1000; between 10,000 and 26,000, every 2000; between 26,000 and 50,000, every 5000; and from 50,000 to 186,000, every 10,000 strokes (5 samples each). For the 3% clearance die, 5 samples were taken every 1000 strokes. The kinematics of the C-type eccentric press are shown in
Figure 3. The position of the RAM and the speed of the RAM are plotted according to the full cycle time of the process.
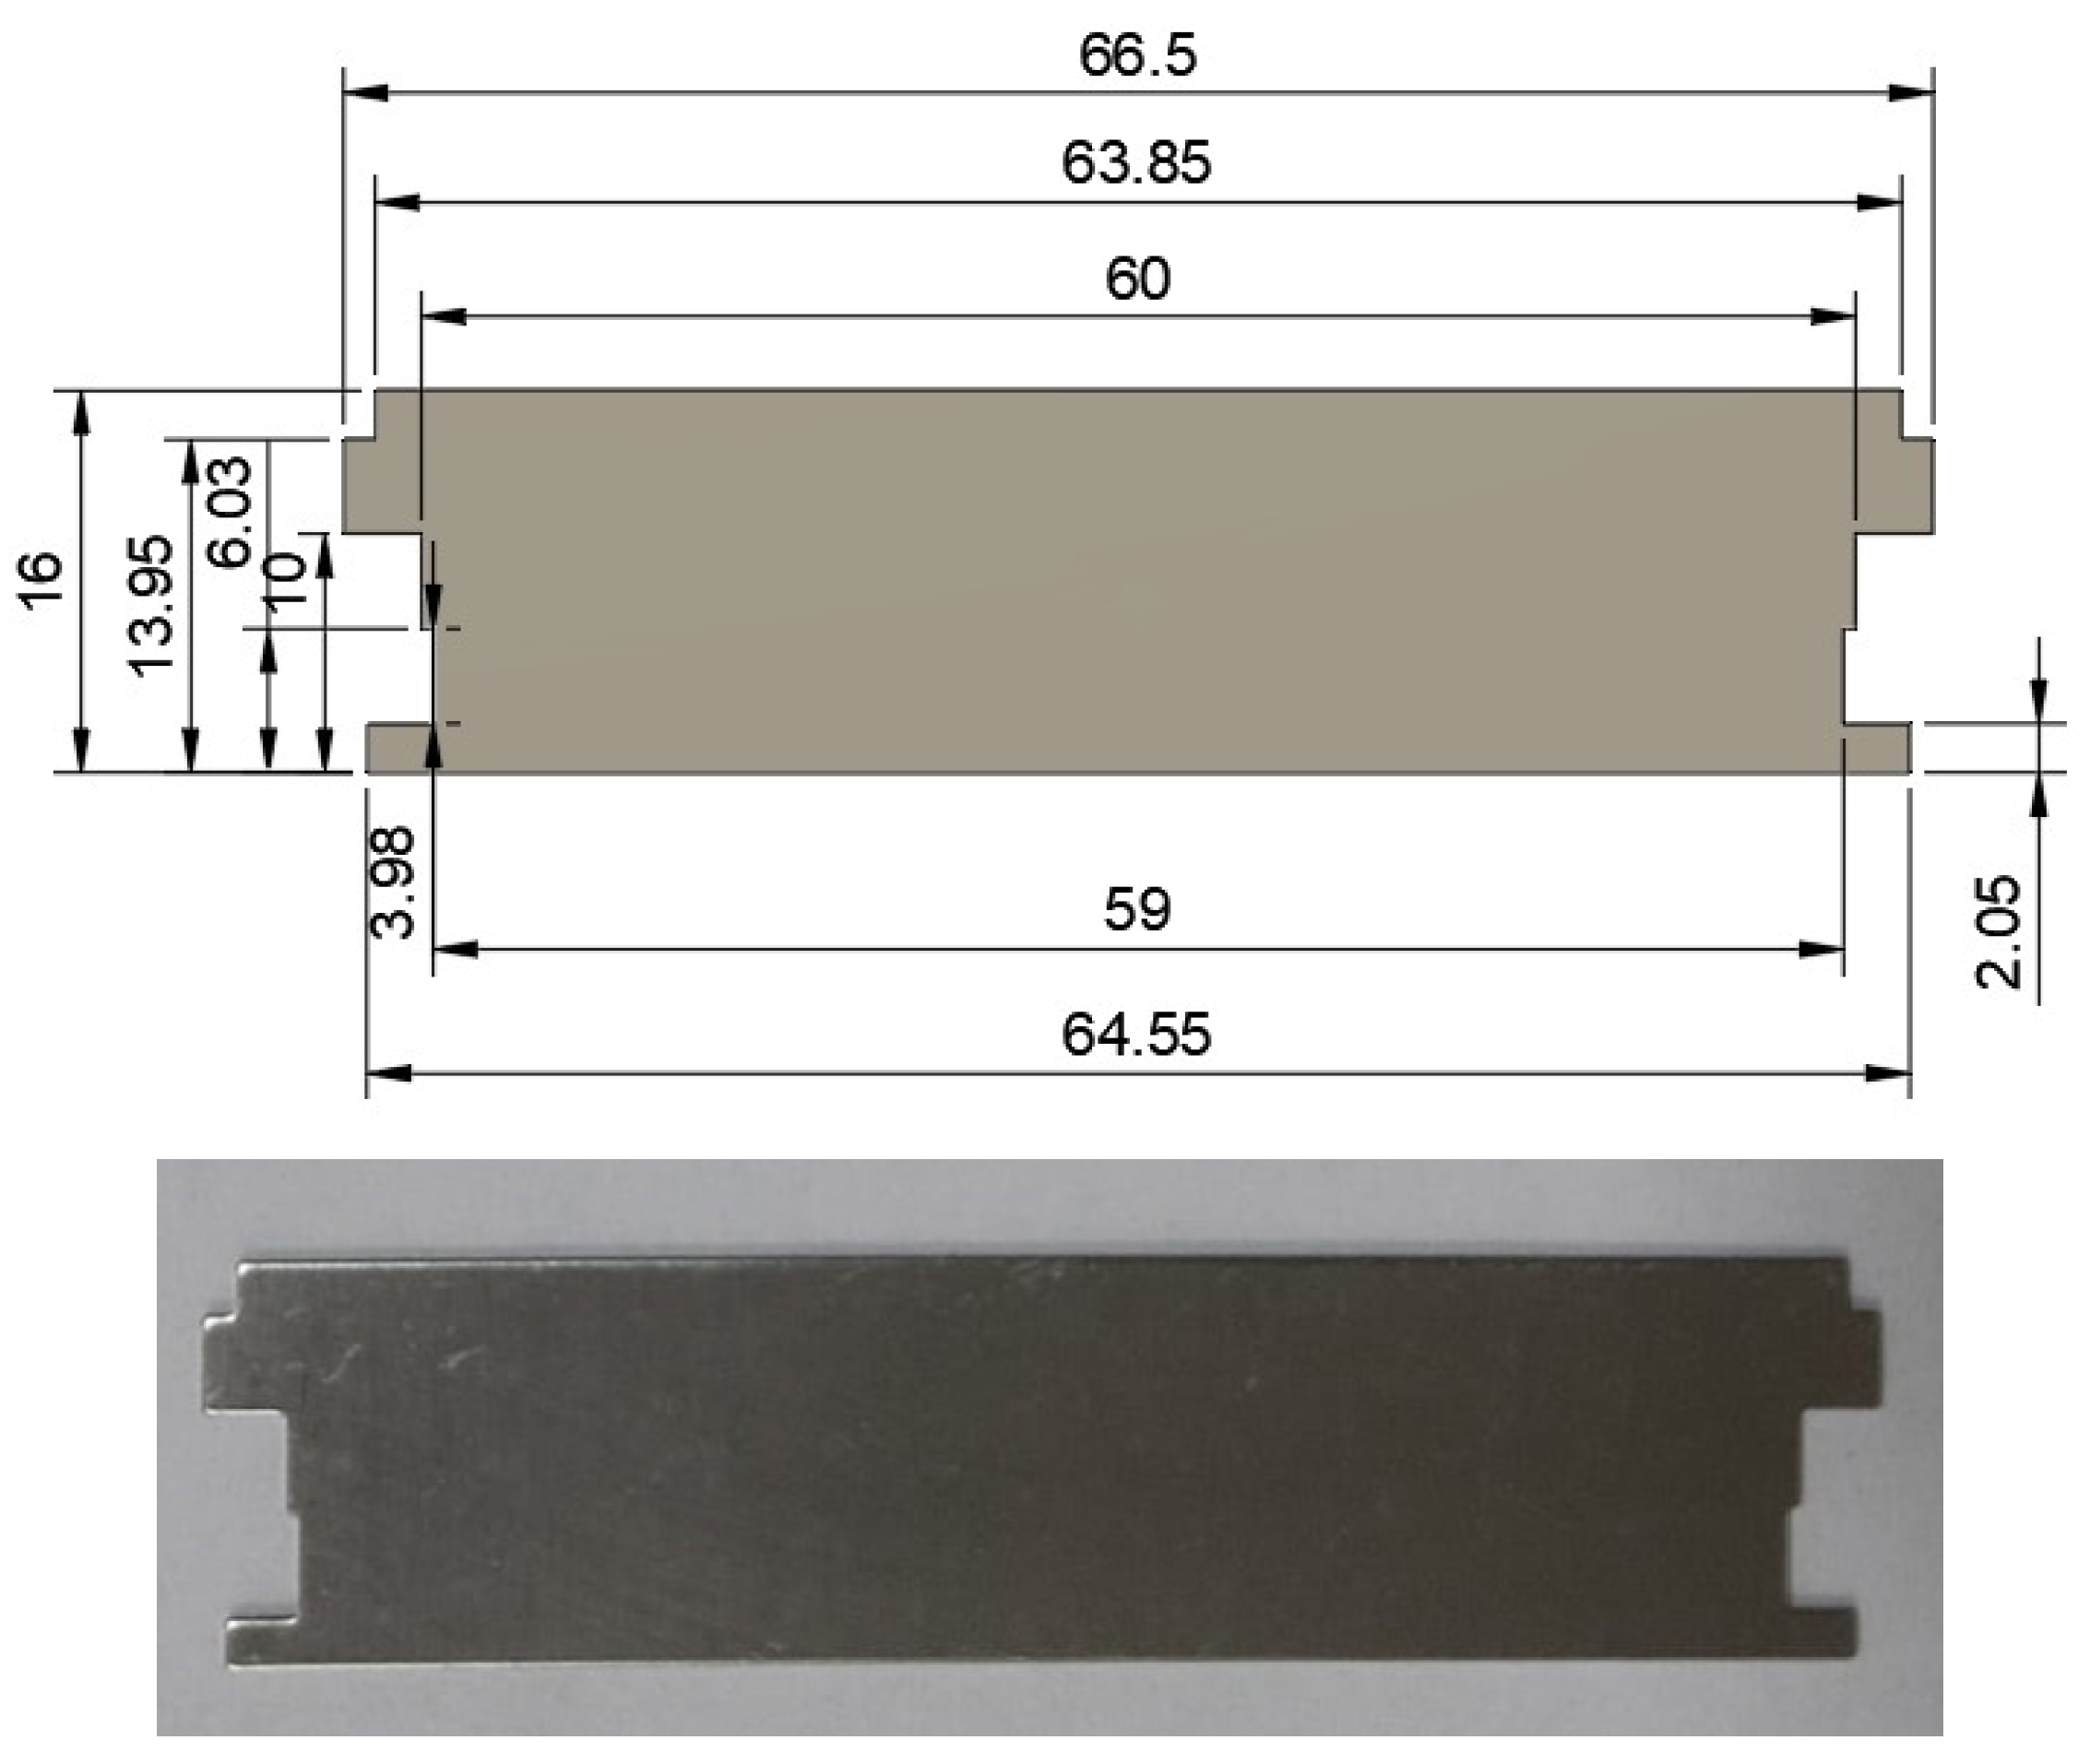
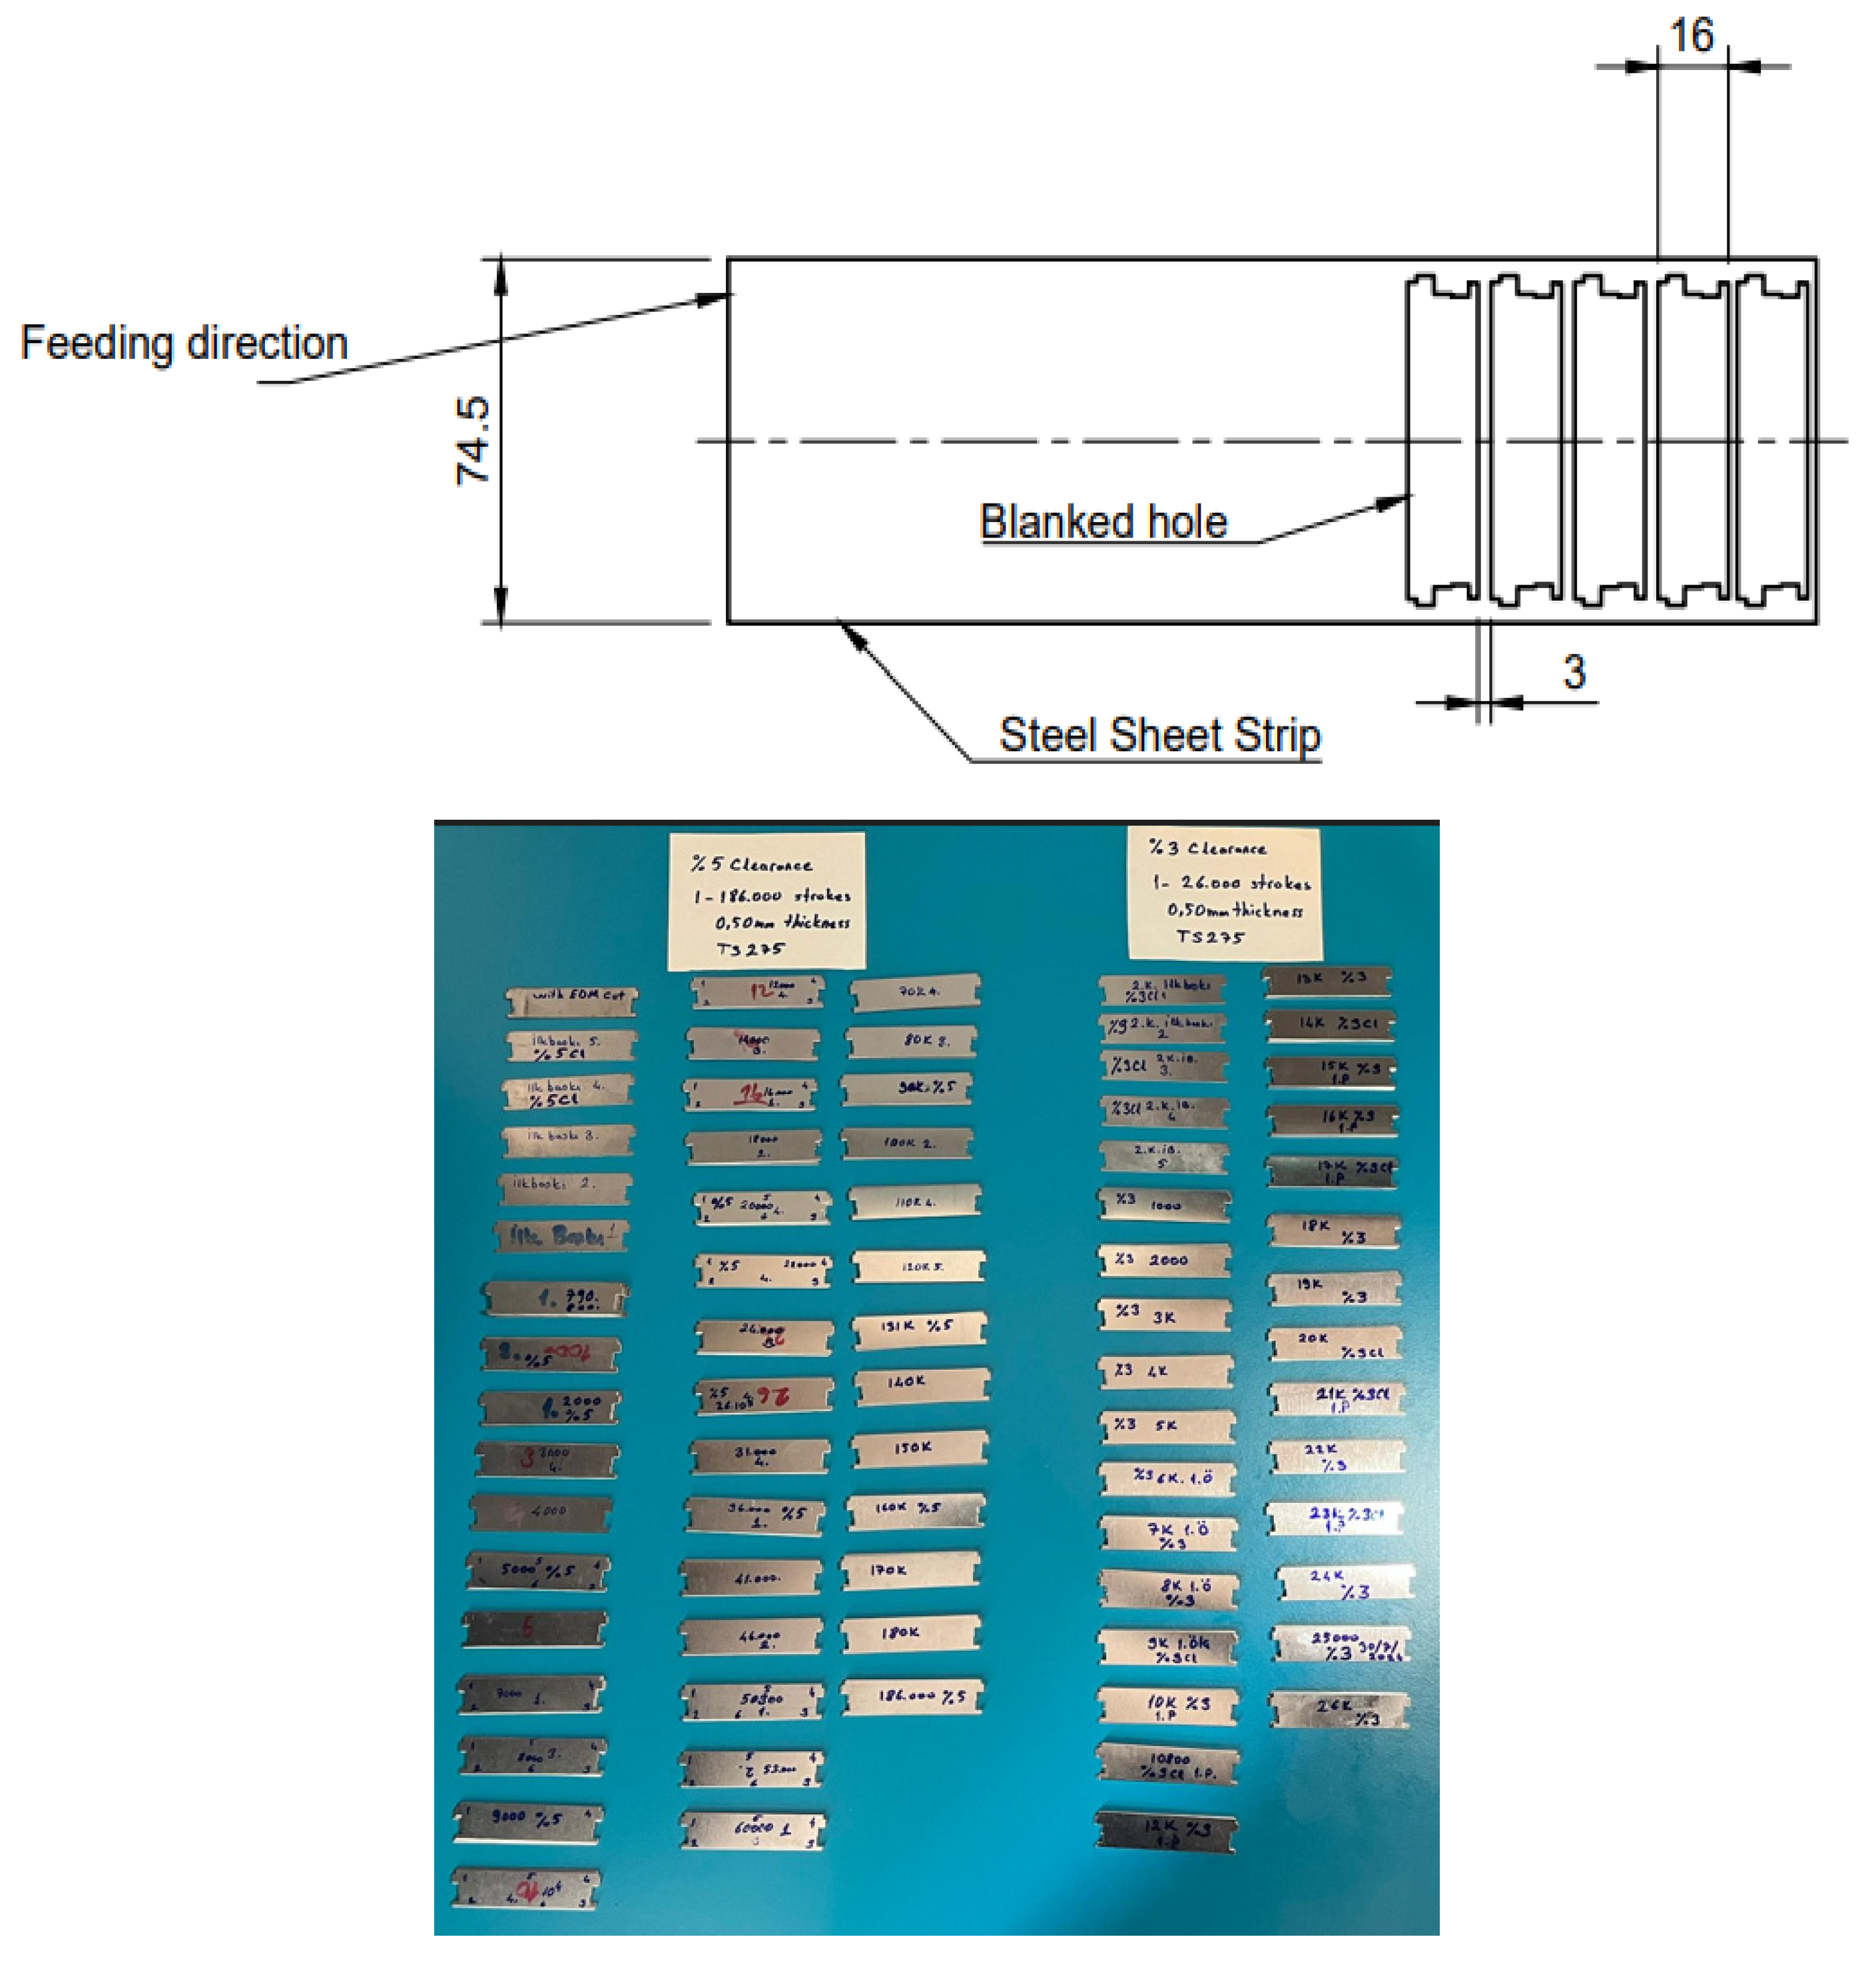
Generally, in eccentric press mechanisms, the motor operates at a fixed speed. The motor speed was 950 rpm, with a motor pulley diameter of 75 mm and a flywheel diameter of 750 mm. Due to the pulley/flywheel ratio, the flywheel speed was reduced to 95 rpm, corresponding to an angular velocity of approximately 9.97 rad/s. Assuming constant angular velocity, the angular displacement during the given time interval (Δt = 0.0246 s) was calculated as Δθ ≈ 0.245 rad, which is equivalent to about 14°. The press operated with a stroke length of 25 mm. The workpiece and its dimensions, with a sheet metal product, are shown in
Figure 4.
A total of 26,000 parts were produced with the die with 3% clearance, while 120,000 parts were produced with the die with 5% clearance. To manufacture the desired workpiece, which was 0.50 mm thick and 74.5 mm wide, an EN 10202-2001 TS275 (from Ereğli Demir Çelik fabrikaları A.Ş, Zonguldak, Türkiye, in 2020) single-crushed tin-coated tin coil sheet was used, as shown in
Figure 5.
Samples of 0.50 mm thick tin-plated steel sheets obtained from dies with 5% and 3% clearance values are shown in
Figure 5. The tool material used in this study was BÖHLER AISI D2 (DIN 1.2379) cold-work tool steel (BÖHLER, Wien, Austria). AISI D2 steel, which is a high chromium tool steel specifically designed to provide a high abrasive-wear resistance and high hardenability, is broadly used for punches, punching and cutting dies, spinning tools, cutting blades, and slitting cutters, and for achieving maximum production numbers at low cost [
28]. Heat treatment was carried out by Alpha Heat Treatment Co. (İstanbul, Türkiye) using a Systemtechnik vacuum furnace (Kocaeli, Türkiye). In the applied cycle, the steel was held at 400 °C, 600 °C, and 800 °C for 1.5 h each, followed by austenitizing at 1050 °C and cooling under nitrogen gas at 4 bar pressure. Tempering was performed twice at 300–350 °C for 3 h. As reported in the hardness certificate, the resulting hardness was 62 HRC, measured using the Rockwell C method. Hardness measurements were taken on the punch front face, side surfaces, and body, with values remaining stable in the range of 61.8–62.3 HRC at the cutting edge. These microstructural and mechanical properties directly influenced the wear resistance of the tool and contributed to the experimental results.
Die and punches were manufactured by making three cuts using the CharmillesRobofil 310 CNC wire erosion machine (Charmilles Technologies, Genève, Switzerland). The amount of clearance between the die and the punch is expressed as a percentage according to the sheet thickness. No liquid was used in the sheet blanking process.
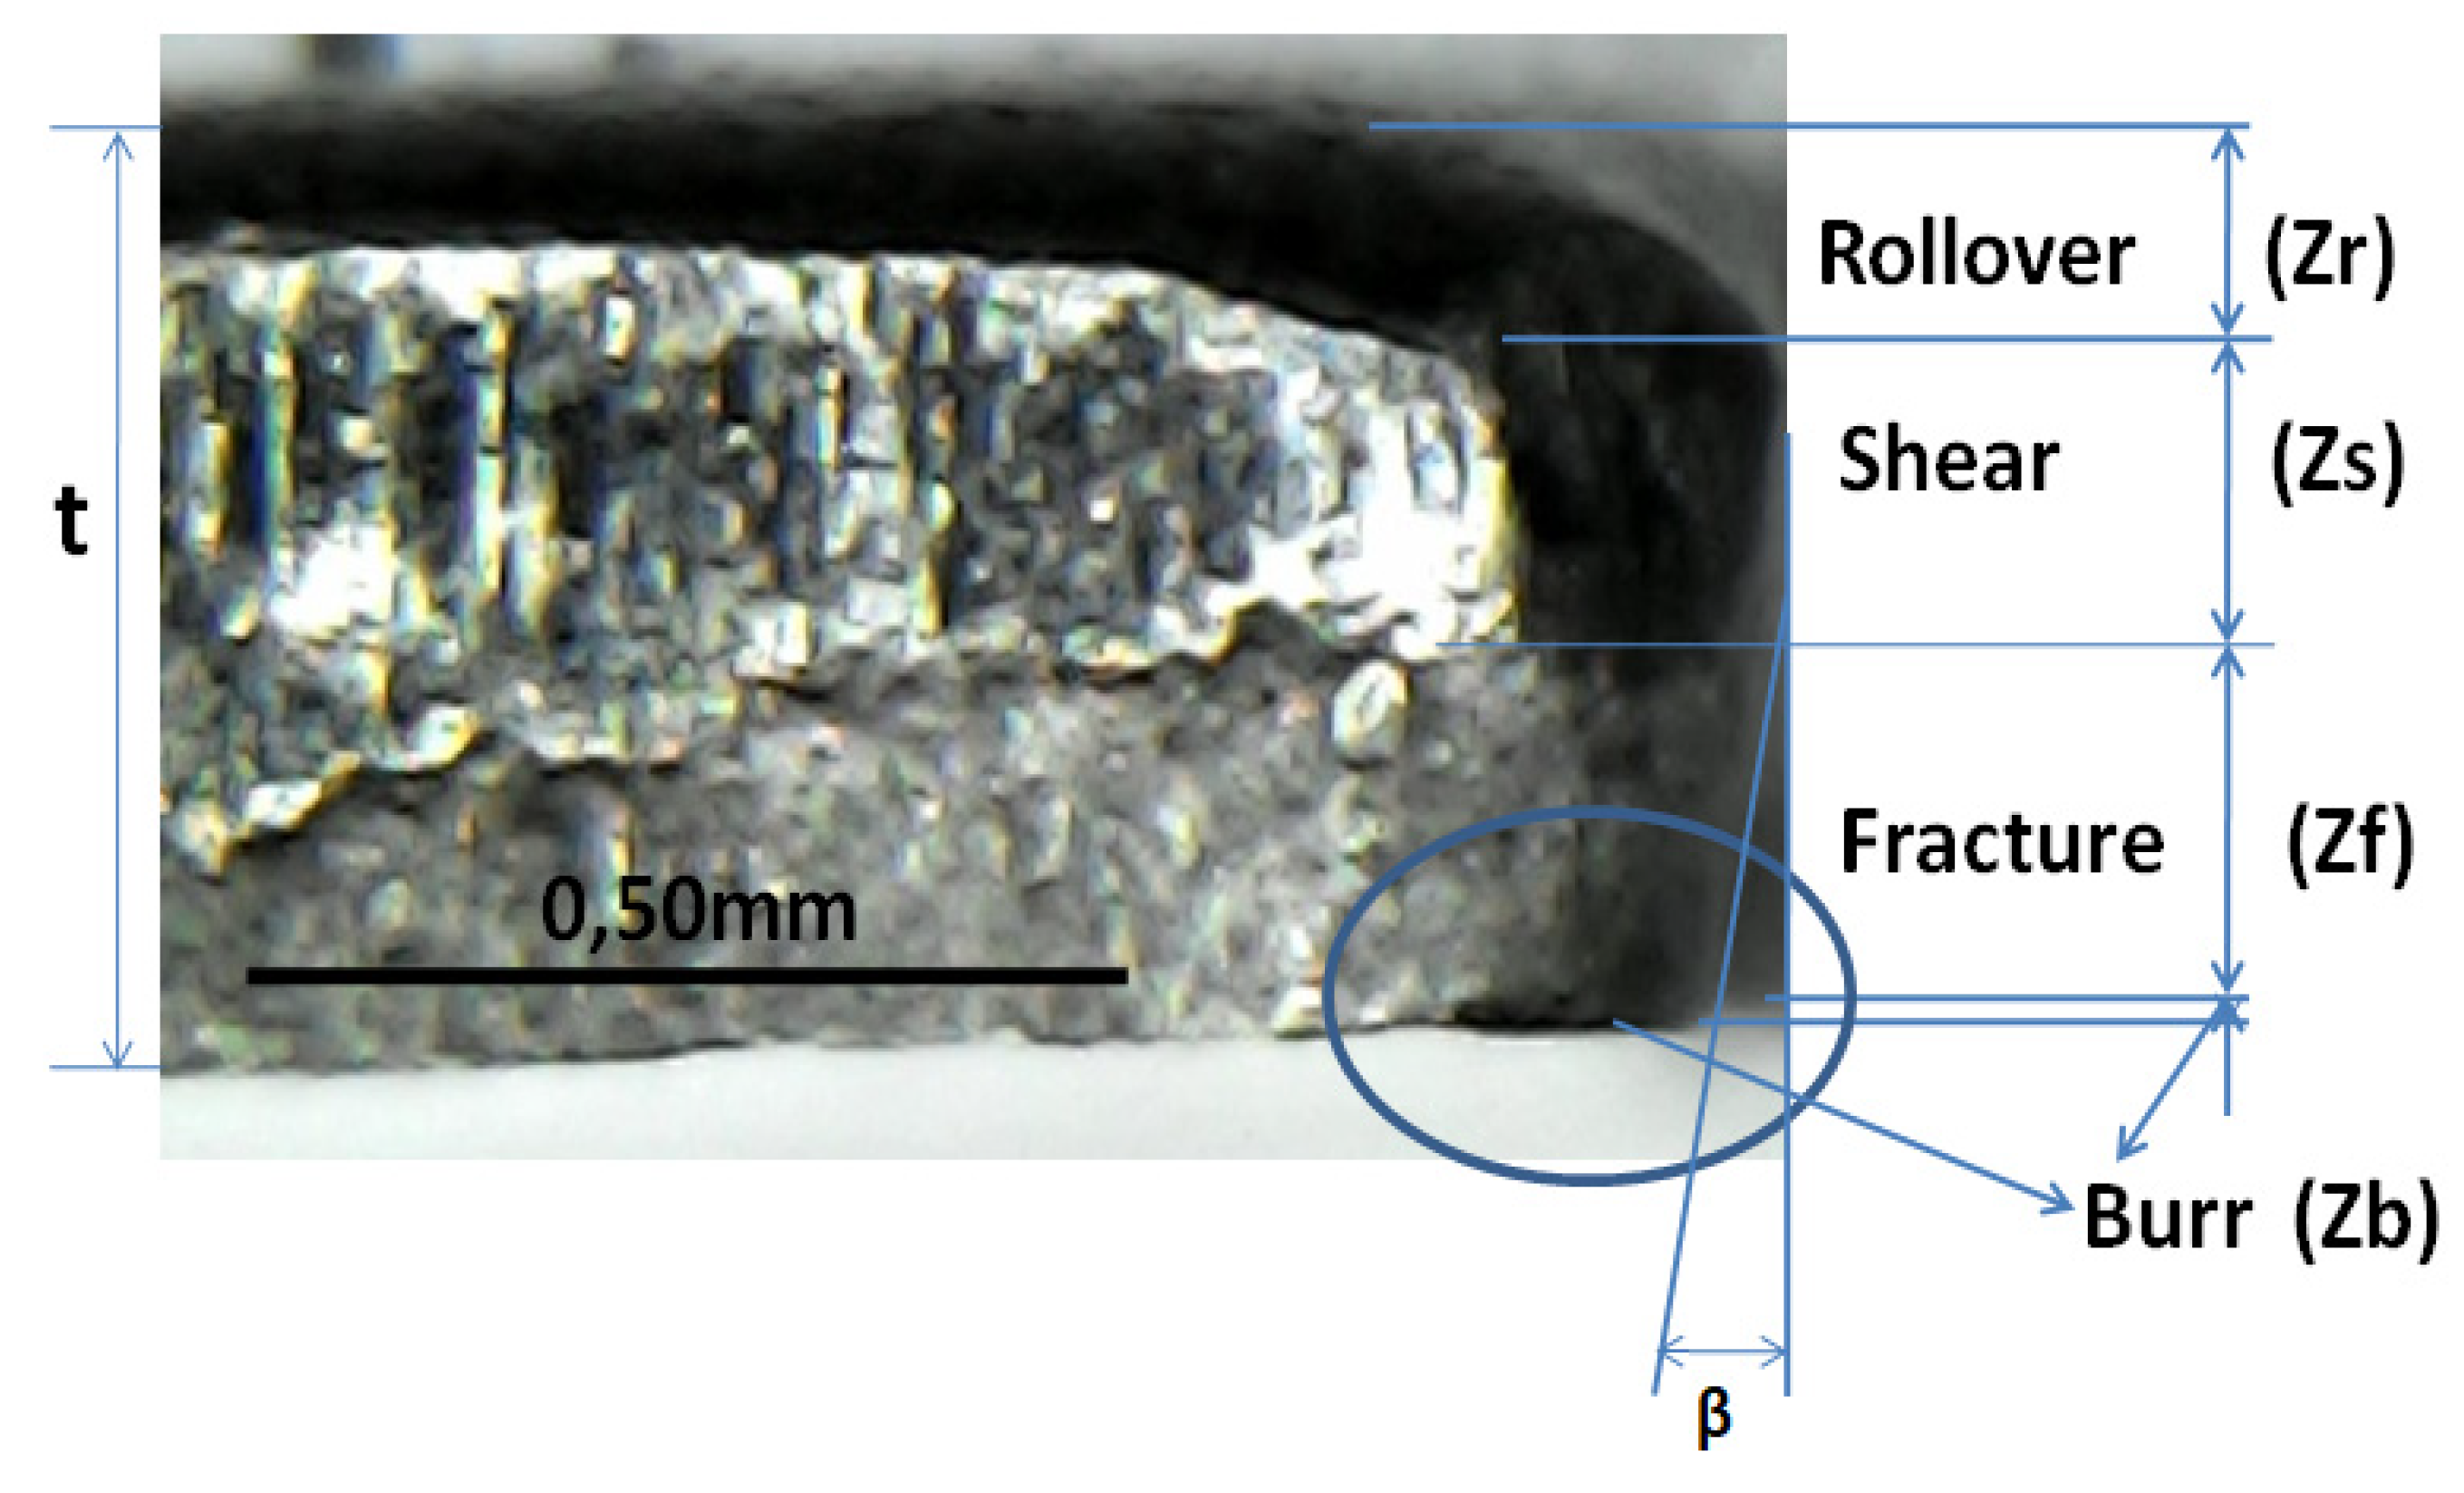
The sheet thickness,
, the burr height,
, and the angle formed at the fracture zone,
, are shown in
Figure 6. The form errors of the blanked sheet piece are also in this figure. The sheet metal thickness can be written in the following form:
where
denotes the height of rollover,
denotes the height of shear, and
the height of the fracture. By inserting
from Equation (1), one can obtain the clearance between the die and punch:
Here, is the die diameter, and is the punch diameter. In this study, the diameter of the die was selected as 16.000 mm; therefore, for the 5% die clearance and 3% die clearance, respectively, the punch diameters were calculated as 15.950 mm and 15.970 mm. The hardness of the die and punches after heat treatment was measured to be 62 HRC.
Before starting the experiments, the surface roughness of the die and punch with both 5% and 3% clearance values was measured according to ISO 4287-1 [
29]. The declared measurement uncertainty is the value found by multiplying the standard uncertainty by the expansion coefficient, taken as
, and provides 95% reliability.
The average surface roughness of the punch surface was 0.135 µm, and that of the punch flank surface, which was cut by CNC wire EDM, was 0.16 µm. The average surface roughness of the die-grinding surface was 0.115 µm, and that of the die inner flank wall cut by CNC wire EDM was 0.48 µm. Since the front surfaces of the mold and the punch were made by grinding, the value of the average surface roughness can be assumed to lie between 0.10 µm and 0.20 µm.
The blanking experiments were carried out for both dies with the 5% and 3% clearances, and every 750 prints, 20,000 prints, 26,000 prints, and 50,000 prints; the workpieces were measured using a Zeiss smart prof 5 Confocal microscope (Carl Zeiss AG, Oberkochen, Germany). The number of parts to be measured was determined according to the number of prints. Accordingly, 5 samples were taken for every 1000 prints in the first 10,000 prints; 5 samples were taken for every 2000 prints between 10,000 and 26,000 prints; 5 samples were taken for every 5000 prints between 26,000 and 60,000 prints; and 5 samples were taken for every 10,000 prints between 60,000 and 120,000 prints. Burr measurements were taken from six different regions of the samples according to the sampling method given above.
3.1. Measurement Methodology in Tool Wear
During the blanking process, the blanking tool edge is exposed to high tribological forces due to the sliding distance and high contact pressure. Wear occurs on cutting tools in the contact area and on the flank, tip, and surface of the die and punch. The wear in these areas is greater at the corners, as reported by Hambli et al. [
29]. The burr height is calculated from the maximum thickness as follows:
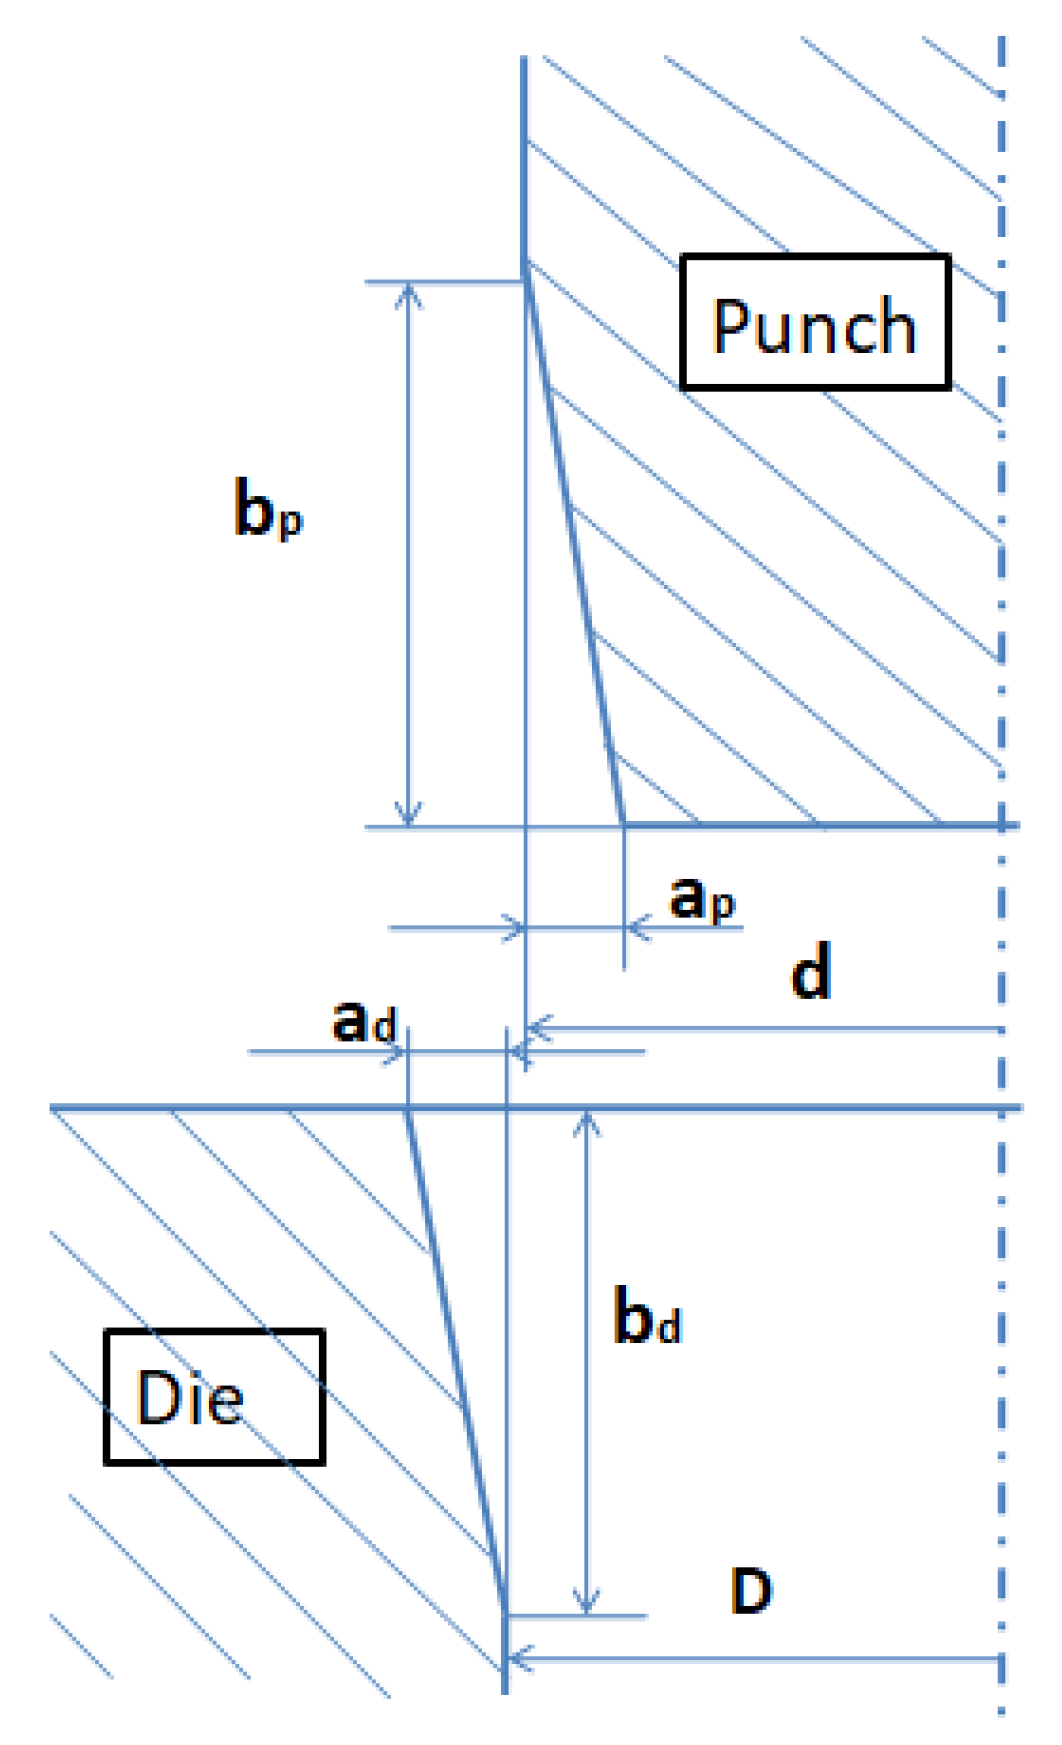
The wear area of the die flank surface, denoted as
, and the wear area of the punch flank surface, denoted as
, are shown in
Figure 5. One can express the die and punch wear as follows:
where the radial wear distance of the die is
, the radial wear distance of the punch is
, the axial wear length in the die is
and the axial wear length in the punch is
.
Die flank wear loss and punch flank wear losses were measured from the tip part and 1.5 mm from the bottom of the tip with a coord 3 EOS 544 MOT CMM. The number of parts to be measured with a Zeiss proof 5 confocal microscope for tool wear and form errors was determined according to the number of prints. Samples were taken at 750 prints, 10,000 prints, 26,000 prints, 50,000 prints, and 120,000 prints, corresponding to the first stroke at each sampling point.
3.2. Clearance Between Die and Punch
The total amount of clearance during stamping with the blanking die can be calculated from the clearance between the punch and die when the blanking die is produced and the change in wear after stamping, as shown in the studies by Lenik, Lauwers, and Hernandez [
26,
30,
31,
32]:
With distance from the cutting edge, approximately triangular-prism-shaped wear occurs along the distance of the punch entering the die. For both the punch and the die, the highest volume loss occurs closest to the cutting edge. As the wear length in the working direction of the die and punch becomes more evident, the clearance value between the die and punch also increases.
By substituting the radial wear distance of the die and the radial wear distance of the punch into Equation (5), one can obtain the clearance between the die and the punch [
30]:
The first term of Equation (6) shows the increase in the distance between the punch and the die, and the second term shows the effect of the cutting tool geometry on axial wear length. Whenever the axial wear length, , which varies depending on the thickness of the cut sheet, is very small, becomes negligible as the second term approaches zero.
The wear volume loss in the axial direction on the cutting tools also occurs in the radial direction as the number of die strokes increases. Substituting Equation (6) into Equation (5), the clearance value between the punch and the die can be expressed as follows [
30]:
Figure 7 illustrates the wear observed on the side walls of the cutting tool for both the die and the punch, while the wear on the front face is not considered.
It is known that the radial wear distances of the die and the punch are equal, and can be taken as
, because the radial wear lengths on the die and the punch use the same material and have the same number of strokes. Equation (7) can be rewritten as follows [
30]:
4. Results and Discussion
4.1. Surface Roughness Variation of the Die and Punch
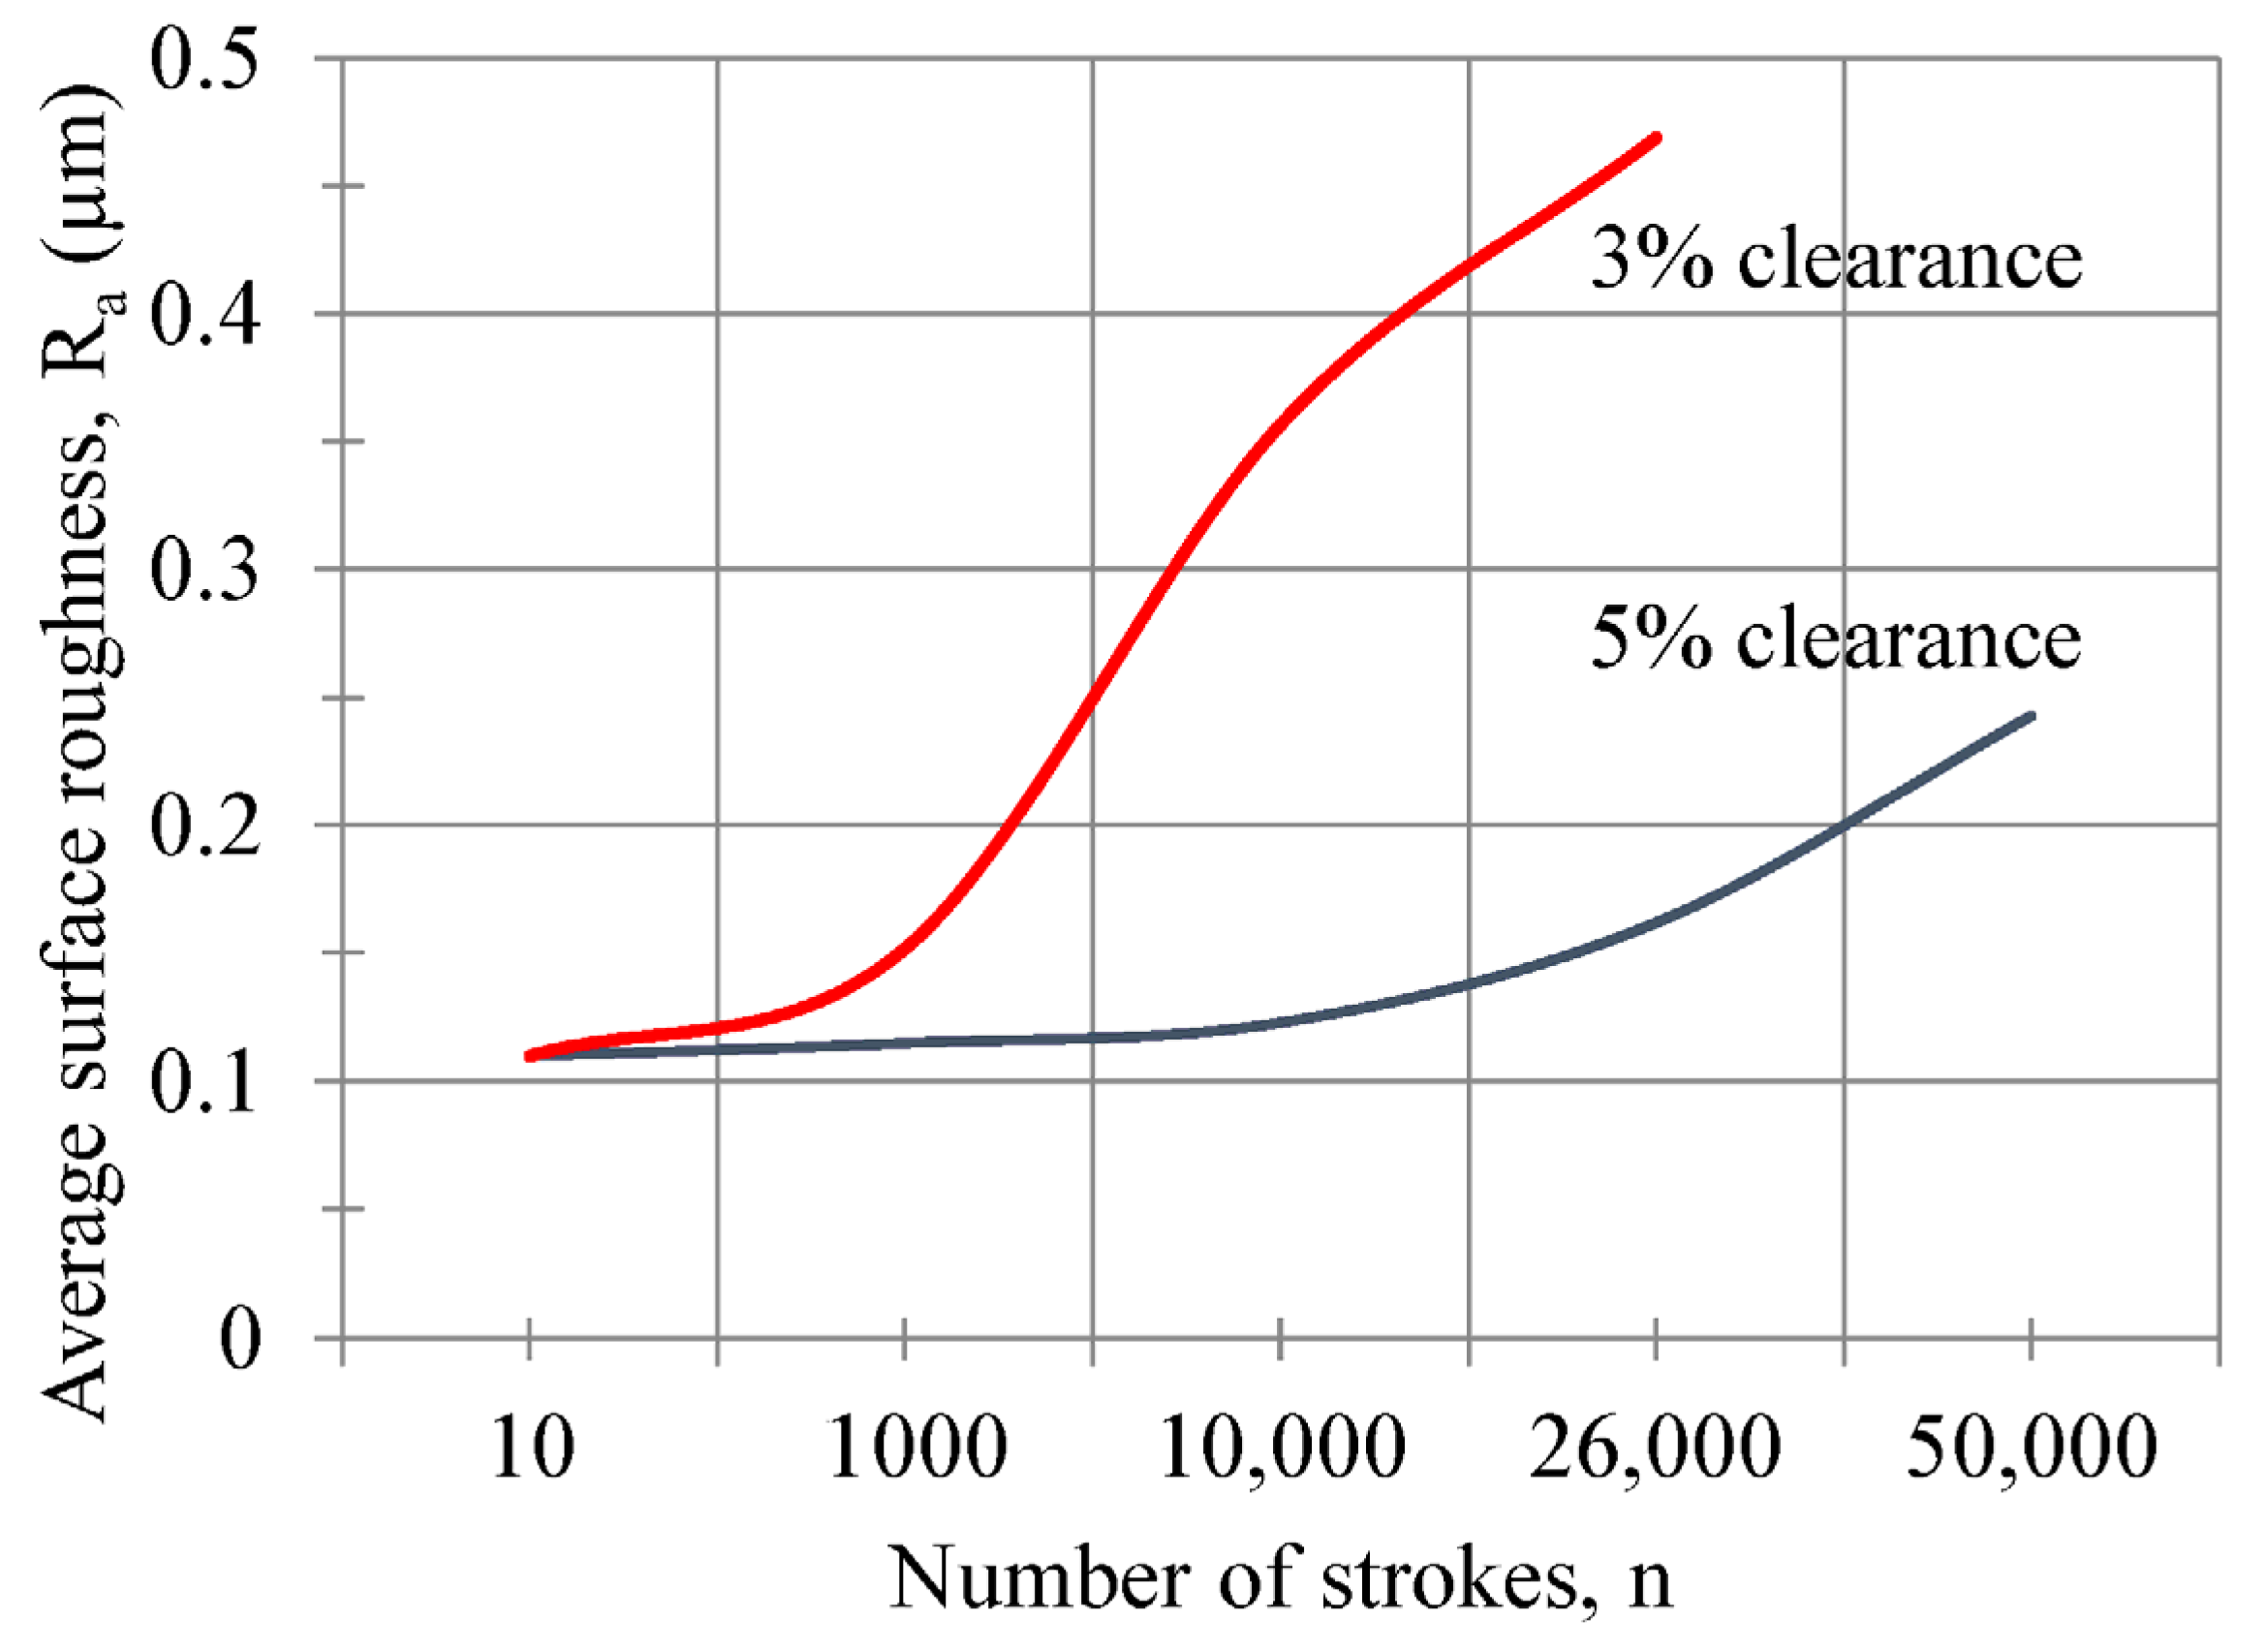
Under a microscope, it can be seen that the grinding lines on the punch surface of the 0.50 mm thick tin sheet produced by leaving clearances of 3% and 5% gradually disappear as the number of prints increases. The average surface roughness changes according to the number of strokes on the punch surface for clearances of 3% and 5%, as shown in
Figure 8. A Zeiss smartproof 5 and Mitutoyo Surftest SJ 210 were used as measuring devices to read the surface roughness. The graph based on measurements taken from the edge of the punch to 500 µm, in the area perpendicular to the edge, is shown in this figure. The roughness value can be calculated approximately according to the number of prints using the equations shown in
Figure 7.
Because of the experimental study, it was found that the average surface roughness of the punch face could be calculated with the following equation, depending on the number of strokes for clearances of 5% and 3%:
and
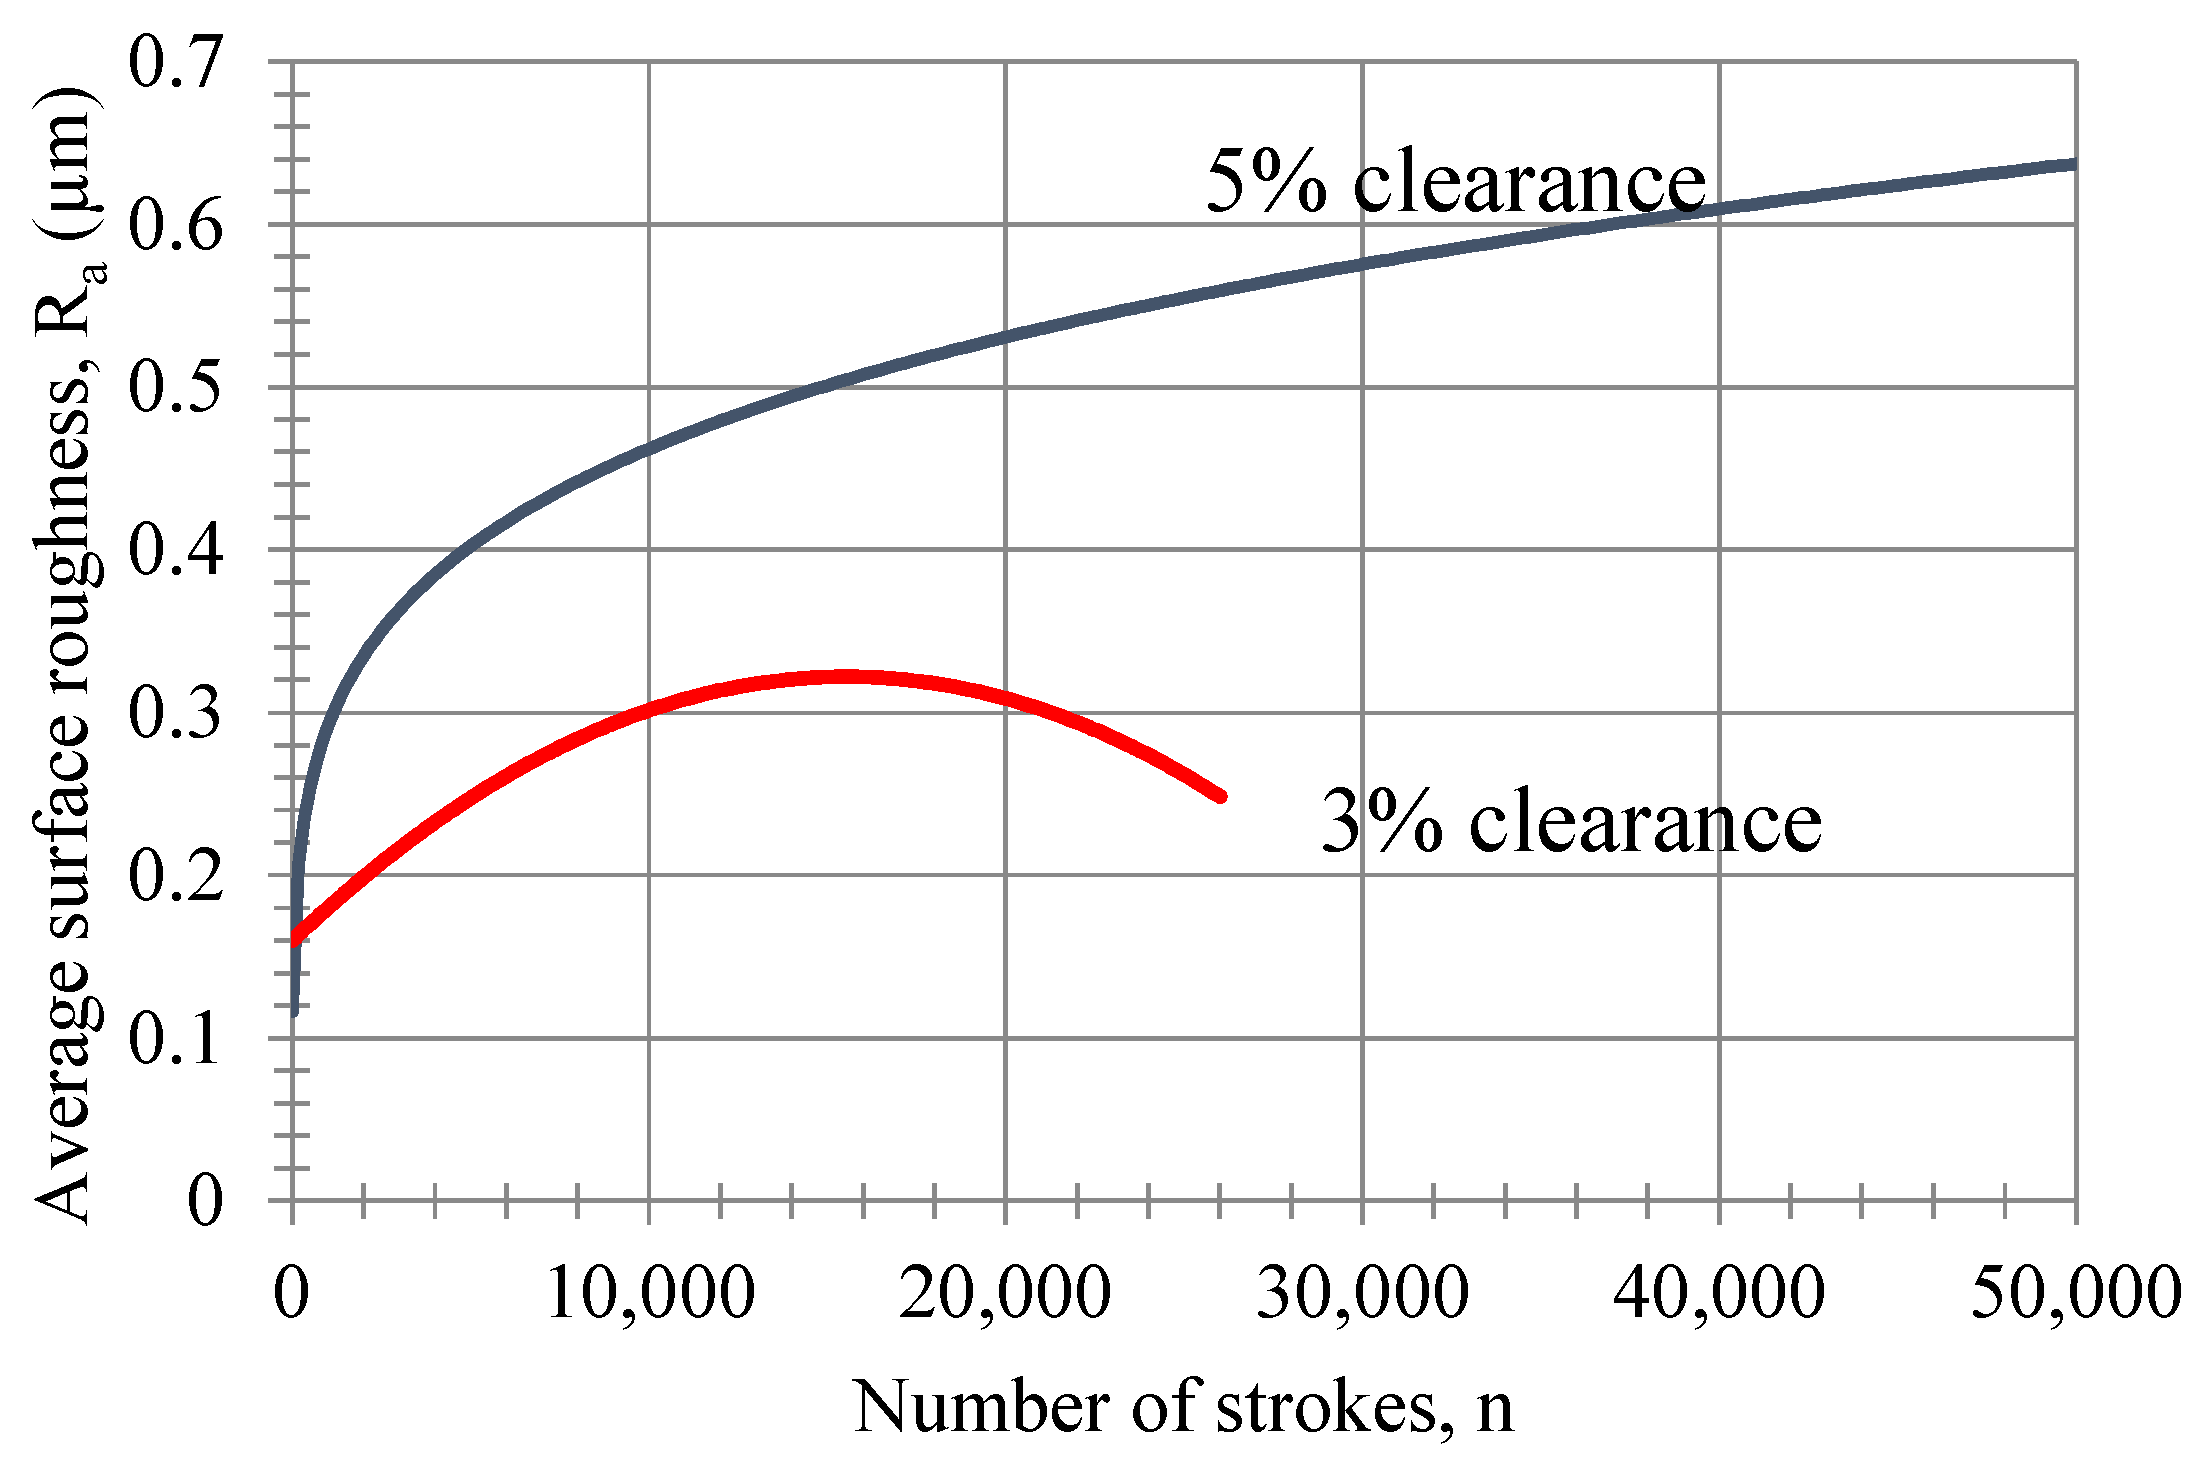
The change in surface roughness on the side surface of the punch with respect to the increase in the number of strokes is depicted in
Figure 9. The average surface roughness was measured with a 2D profilometer Mitutoyo Surftest SJ 210 (Mitutoyo Corporation, Kawasaki, Japan) when the blanking die was made. Subsequent measurements were made with a Zeiss Smart Prof5 laser confocal microscope. It was found that the average surface roughness of the punch flank face could be calculated with the following equation, depending on the number of strokes for the 5% and 3% clearances.
and
The average surface roughness on the die surface with the 5% clearance was measured at about 0.30 µm after 50,000 strokes. The average surface roughness on the 5% and 3% clearance dies was measured to be 0.115 µm on the die surface before starting the strokes. In the initial condition, the average surface roughness of the punch flank face on the 5% clearance die was 0.36 µm, and was then measured after 50,000 prints as 0.648 µm, while the average surface roughness of the punch front face was 0.225 µm, and after 50,000 prints was 0.325 µm. At the die-cutting surface, it can be observed that the surface roughness value and the amount of wear decrease as we move away from the cutting surface. In the measurement with a confocal microscope, a wear volume of 77,571 µm3 was measured in an area of 107,313 µm2 after 50,000 strokes on the front surface of the die. Using the least-squares plane in the wear volume measurements, the maximum depth on the worn punch surface was 10.69 µm, and the value of average wear depth was 0.7228 µm. Because the burr height reached the 3% clearance value of the die, the experiment was stopped at 26,000 prints. Moreover, the punch side surface roughness value was 0.30 µm at 12,000 strokes and 0.25 µm at 26,000 strokes. The average wear height and wear volume were higher after 26,000 strokes than in the 5% clearance value.
4.2. Punch-Tip Angle Change and Wear Surface Height Difference
The change in the blanking edge of the die and punch also shows the wear value. The wear angles on the front surface and flank surface of the die and punch edge are different from each other. The wear on the flank surfaces is more than on the front surface of the punch and die. While measuring the angle at the cutting edge of the punch, measurements are made at a horizontal distance of up to 50 µm from the tip. The punch wear surface decreases as it moves away from the tip. Since the stresses at the tip are much higher due to cutting, the angle changes at the tip are also high.
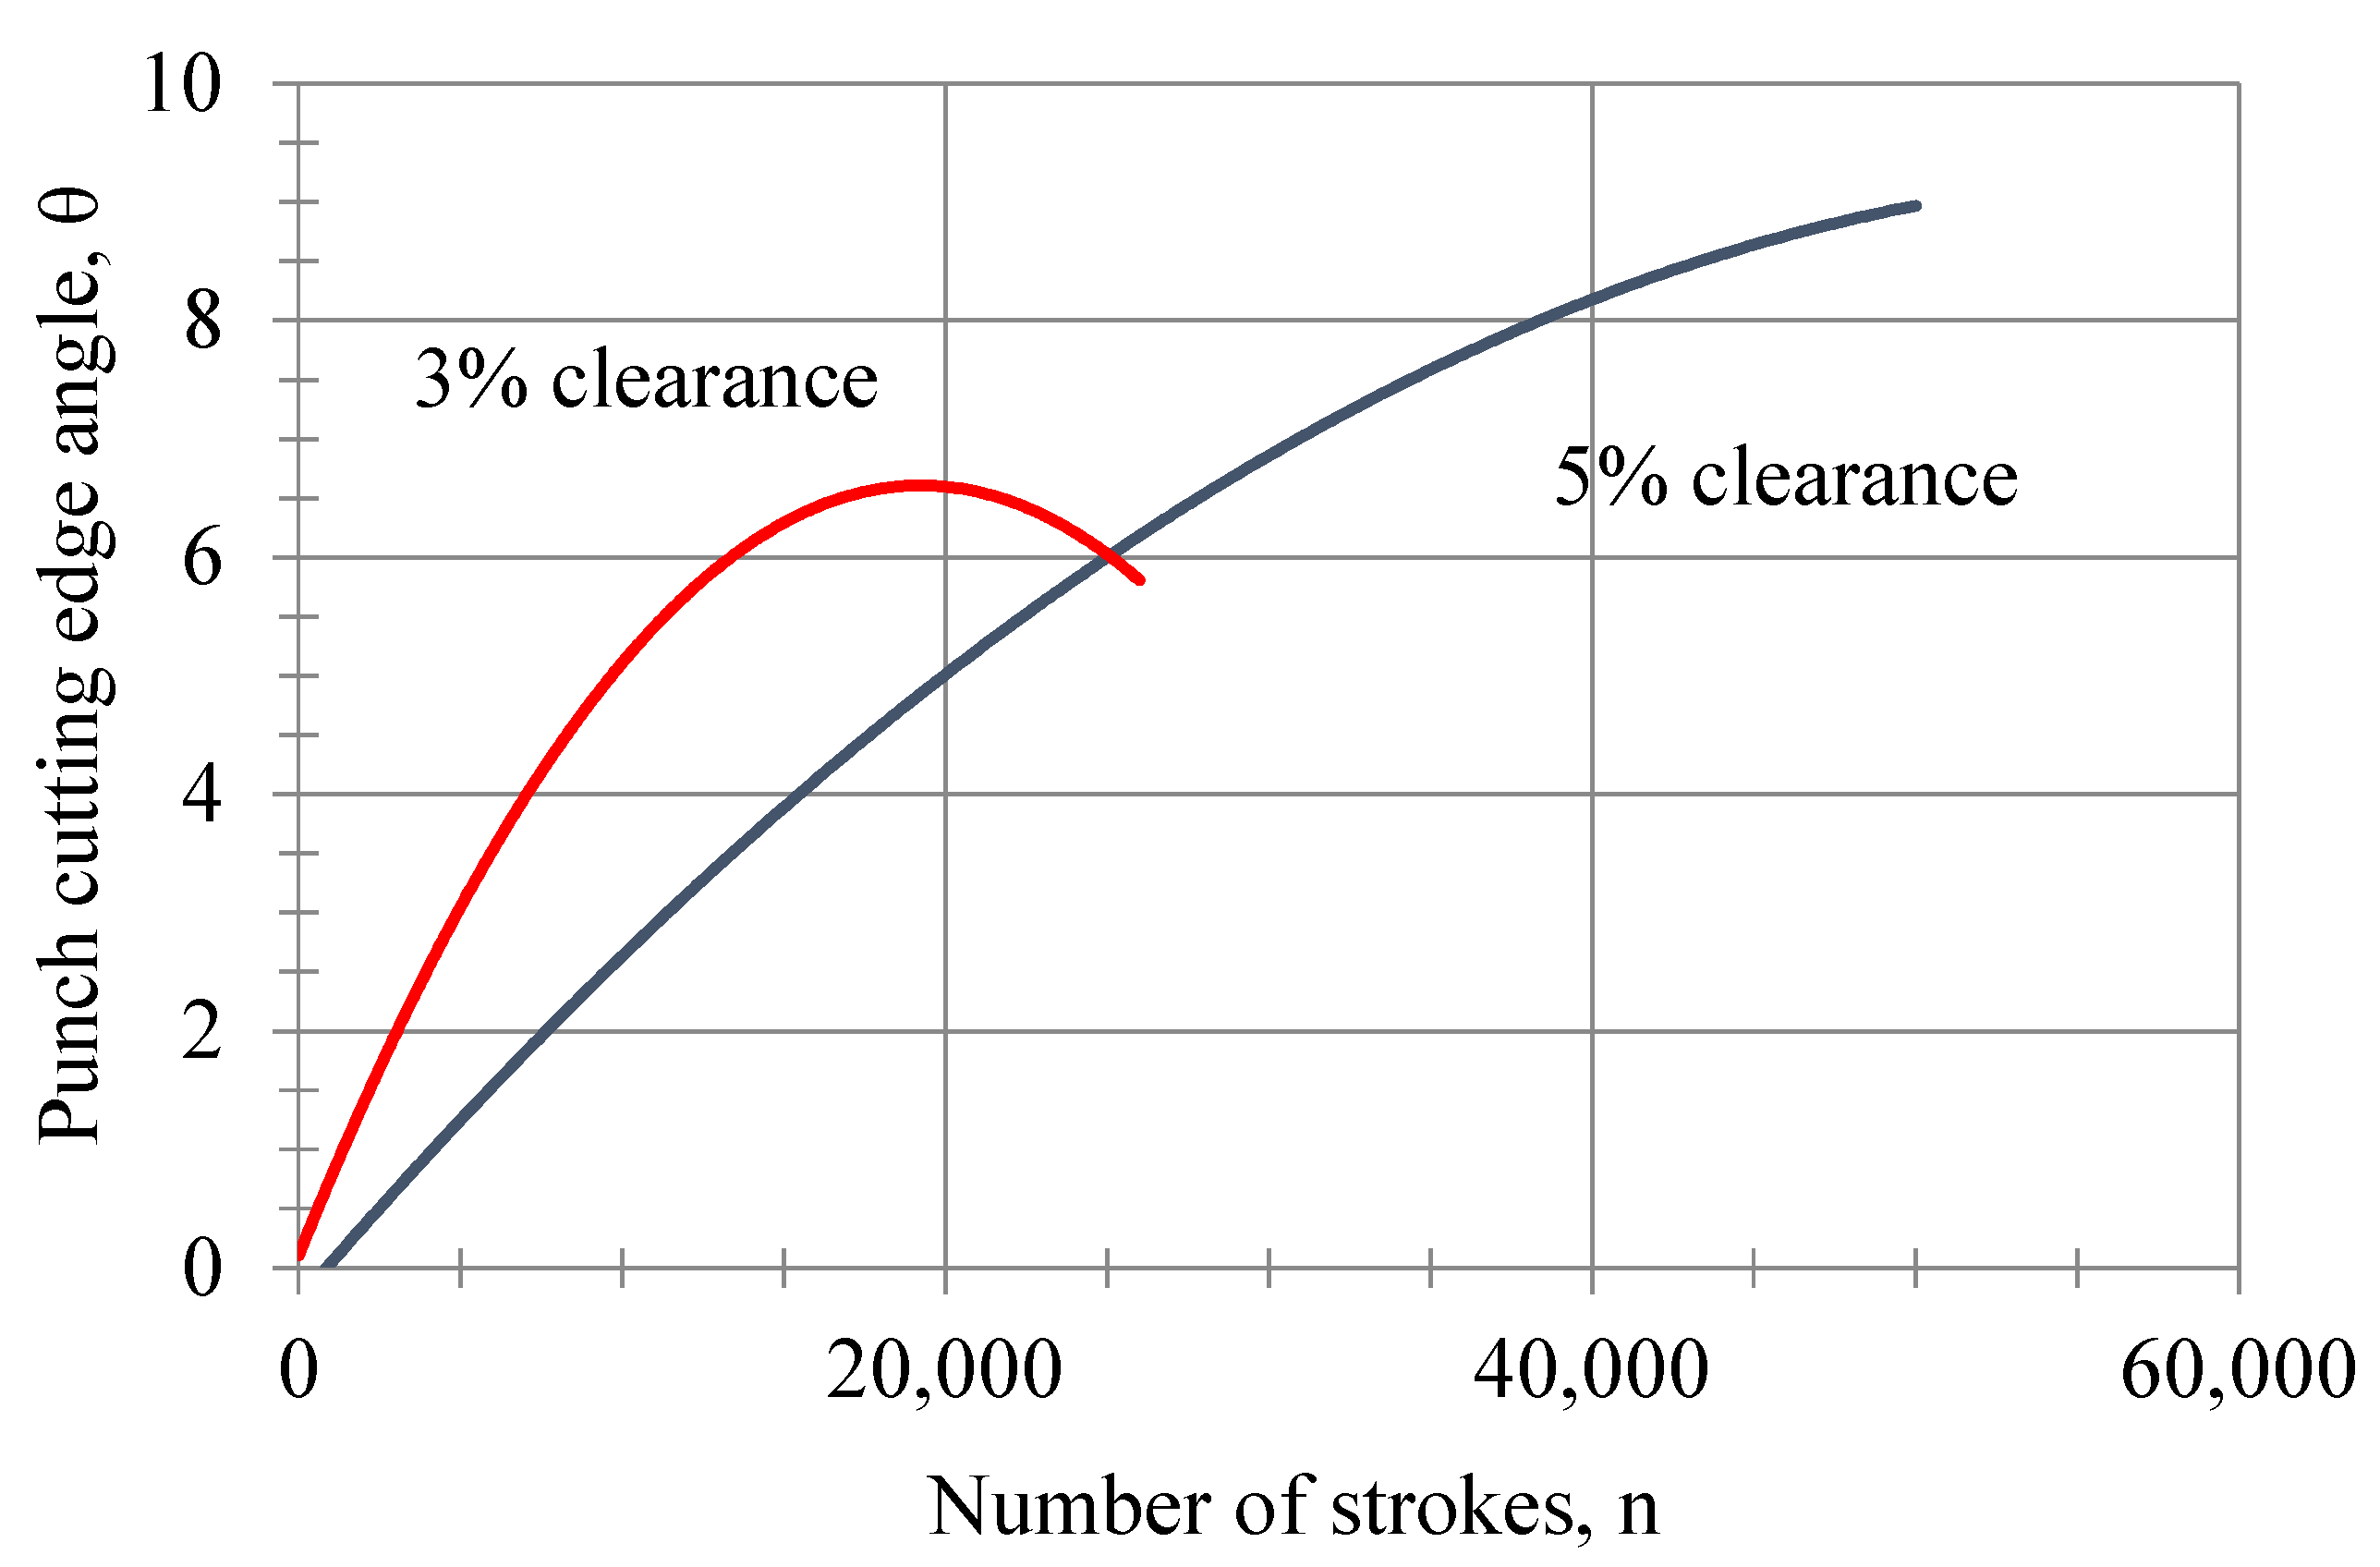
The change in the cutting-edge angle on the front surface of the punch, with respect to the number of strokes for both the 5% and 3% clearances, is shown in
Figure 10. Because of the experimental study, it can be said that the one with 3% clearance has a higher cutting angle than the one with 5% clearance, and after 26,000 strokes, the one with 5% clearance shows a progressive increase. It was found that the innovative angle of the punch face could be calculated with the following equation, depending on the number of strokes for the 5% and 3% clearances:
and
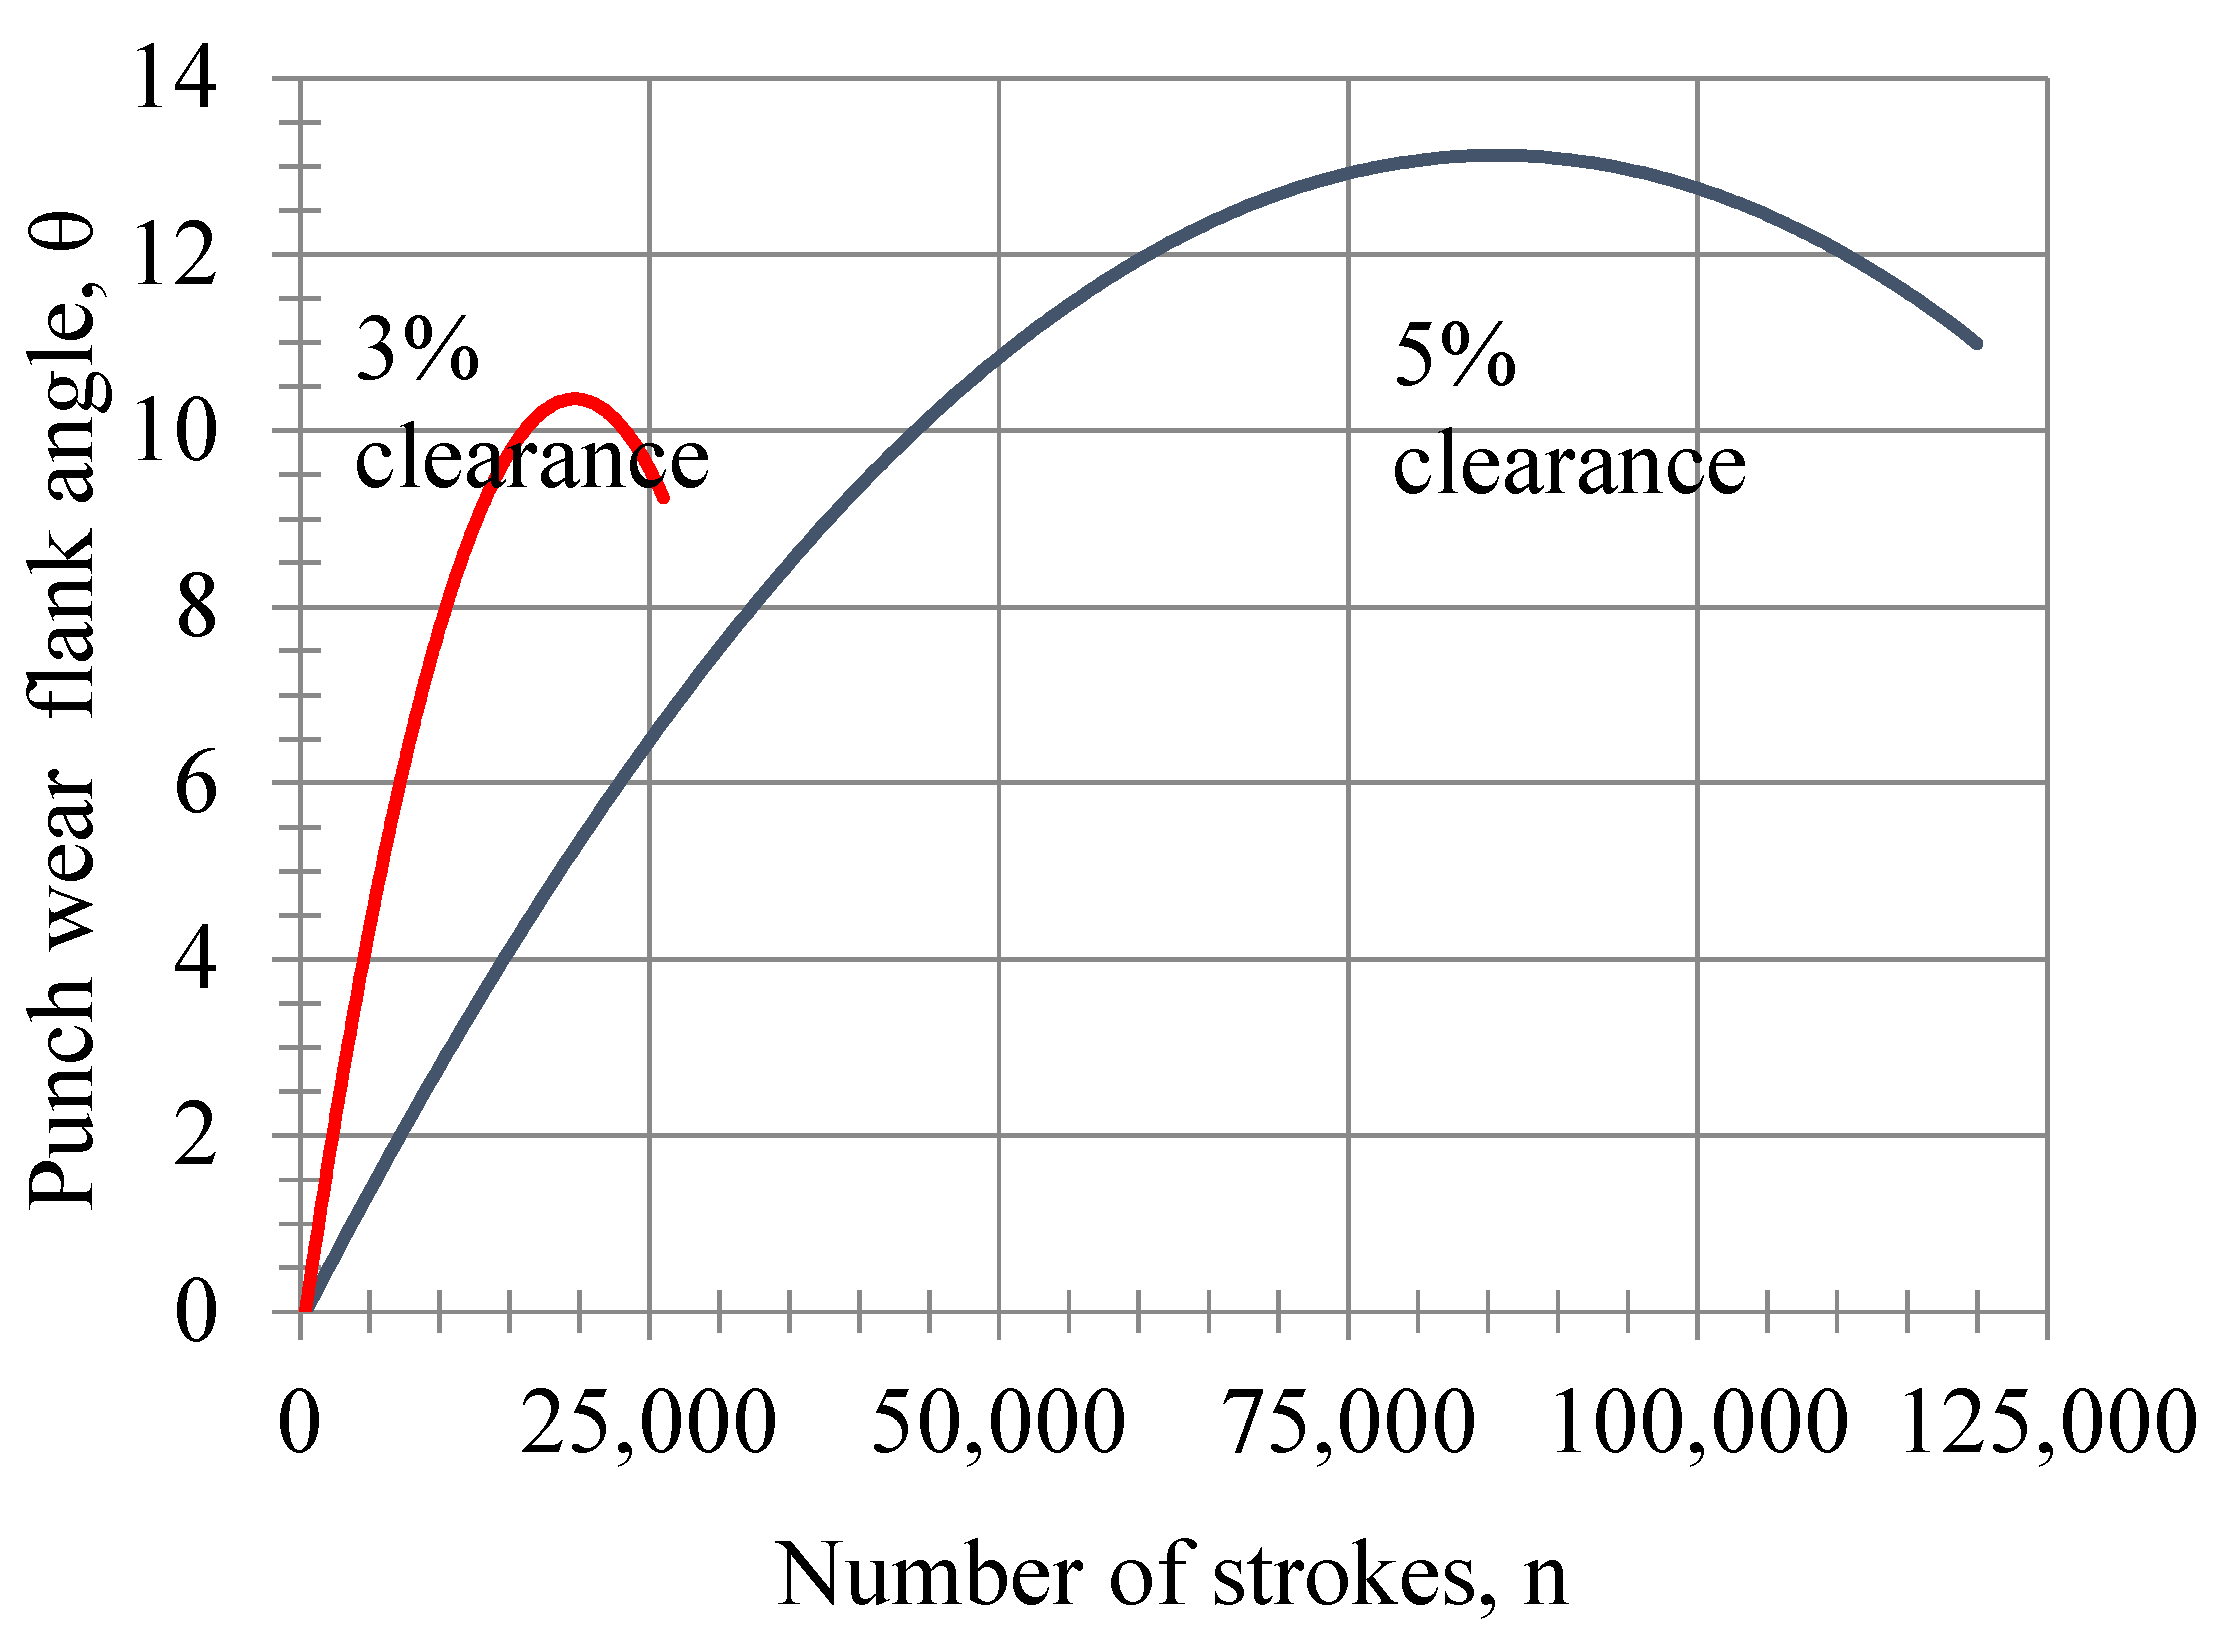
The variation of the wear flank angle with respect to the number of strokes at the end of the punch side face is shown in
Figure 11. It can be clearly seen from this figure that the punch with 3% clearance has a higher wear flank angle than that with 5% clearance, and that the 5% clearance case shows a marked increase after 26,000 strokes. It can be seen that the wear flank angle of the punch flank face can be calculated with the following equation—depending on the number of strokes—for clearance values of 5% and 3%:
and
The average angle resulting from 50,000 strokes at the tip of the side surface is 10.667°, while the angle at the tip with the same number of strokes is 8.761°. Since the burr height exceeds the desired height at the 3% clearance, the print ends at 26,000 prints. As the number of strokes changes, the tip angles also change. The radius is formed at the punch tip, and the die is innovative. One can also calculate the tip wear profile and wear loss in the punch; the die from the angle changes at the tip.
The grinding marks on the die surface for the 5% and 3% clearances start to disappear due to abrasive wear after 5000 strokes. After 50,000 strokes, the grinding marks disappear in the die with a 5% clearance. The angle resulting from the wear of 0.5° is measured from the end of the blanking die, parallel to the edge, 500 µm backwards. The angle formed toward the back at a distance of 15 µm from the tip of the blanking die increases up to 15°.
4.3. Radial Wear Length Change on the Wear Surface
An attempt was made to calculate the wear volume by using the radial wear length, , the axial wear length, , and the wear distance on the cutting tools. Volumetric topography measurements and the average of these measurements were taken; the punch volume losses resulting from 750 strokes, 26,000 strokes, and 50,000 strokes were calculated. The total volume loss in the punch was determined by calculating the average of the linear area on the punch surface.
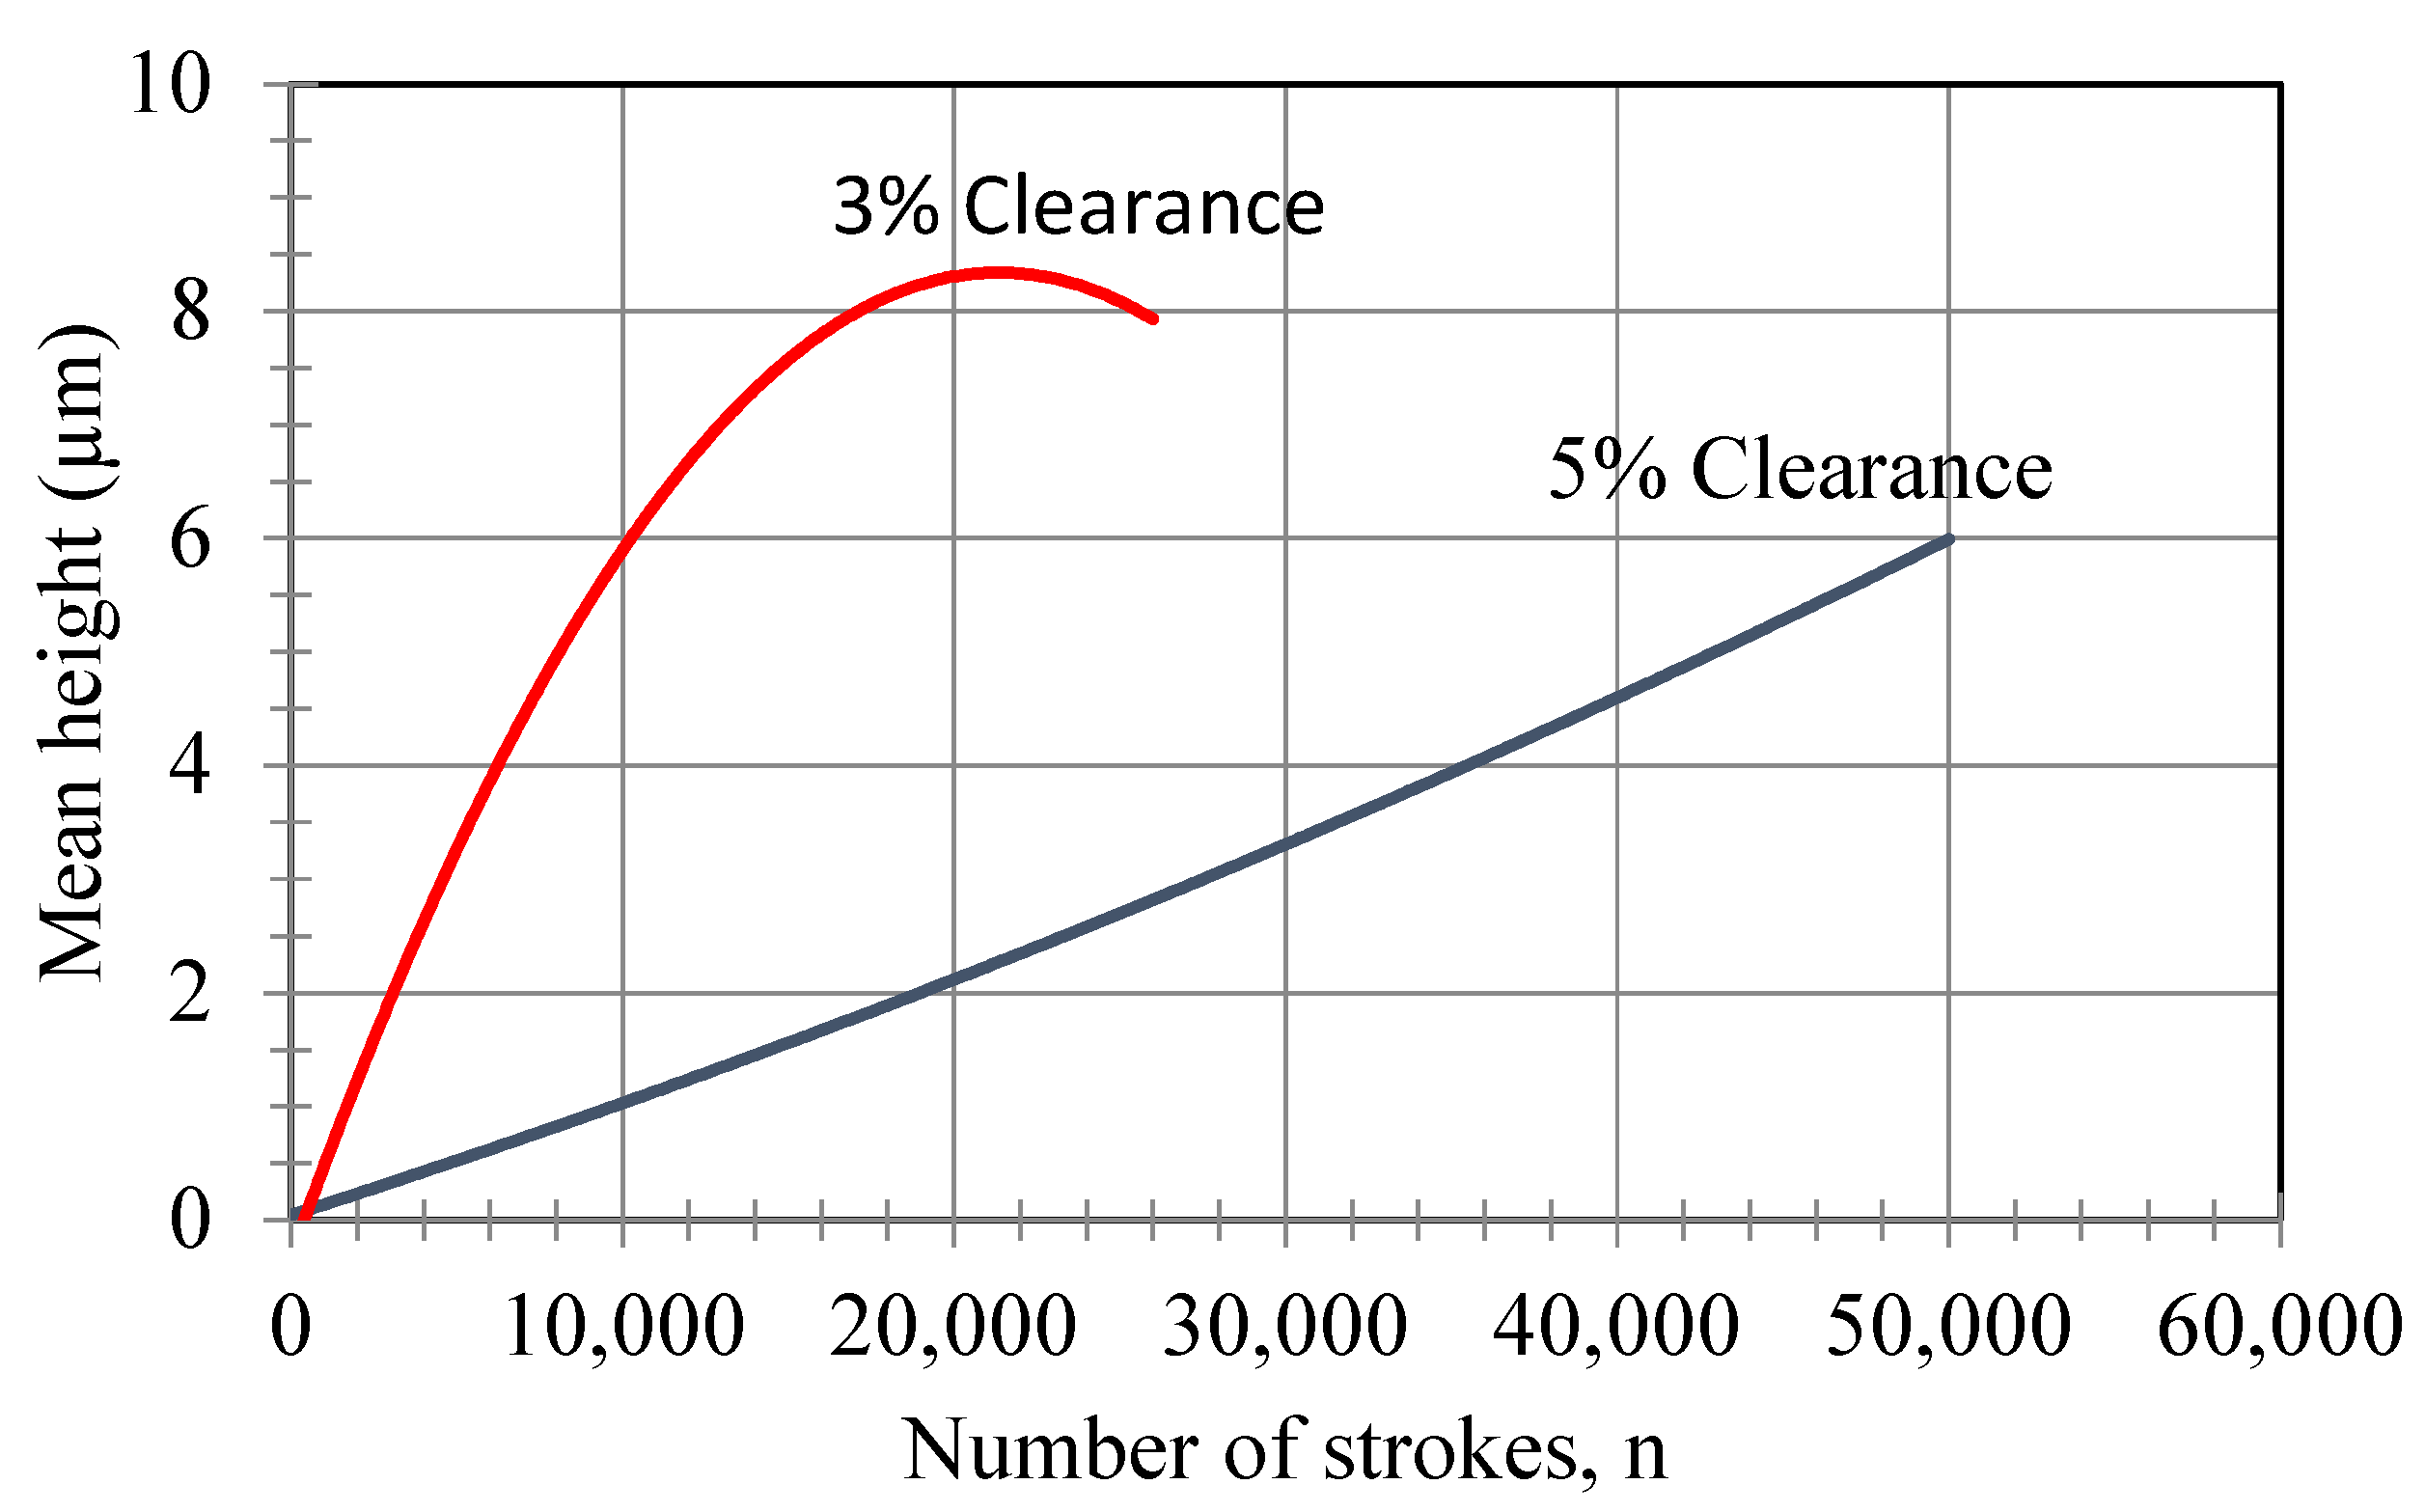
The wear heights on the punch side and front face can be seen in
Figure 12 and
Figure 13. The shape of the changes along the wear width on the punch side surface is depicted in
Figure 12. It can be stated that the average height difference in wear on the punch face can be calculated with the following equation, depending on the number of strokes for the 5% and 3% clearances:
and
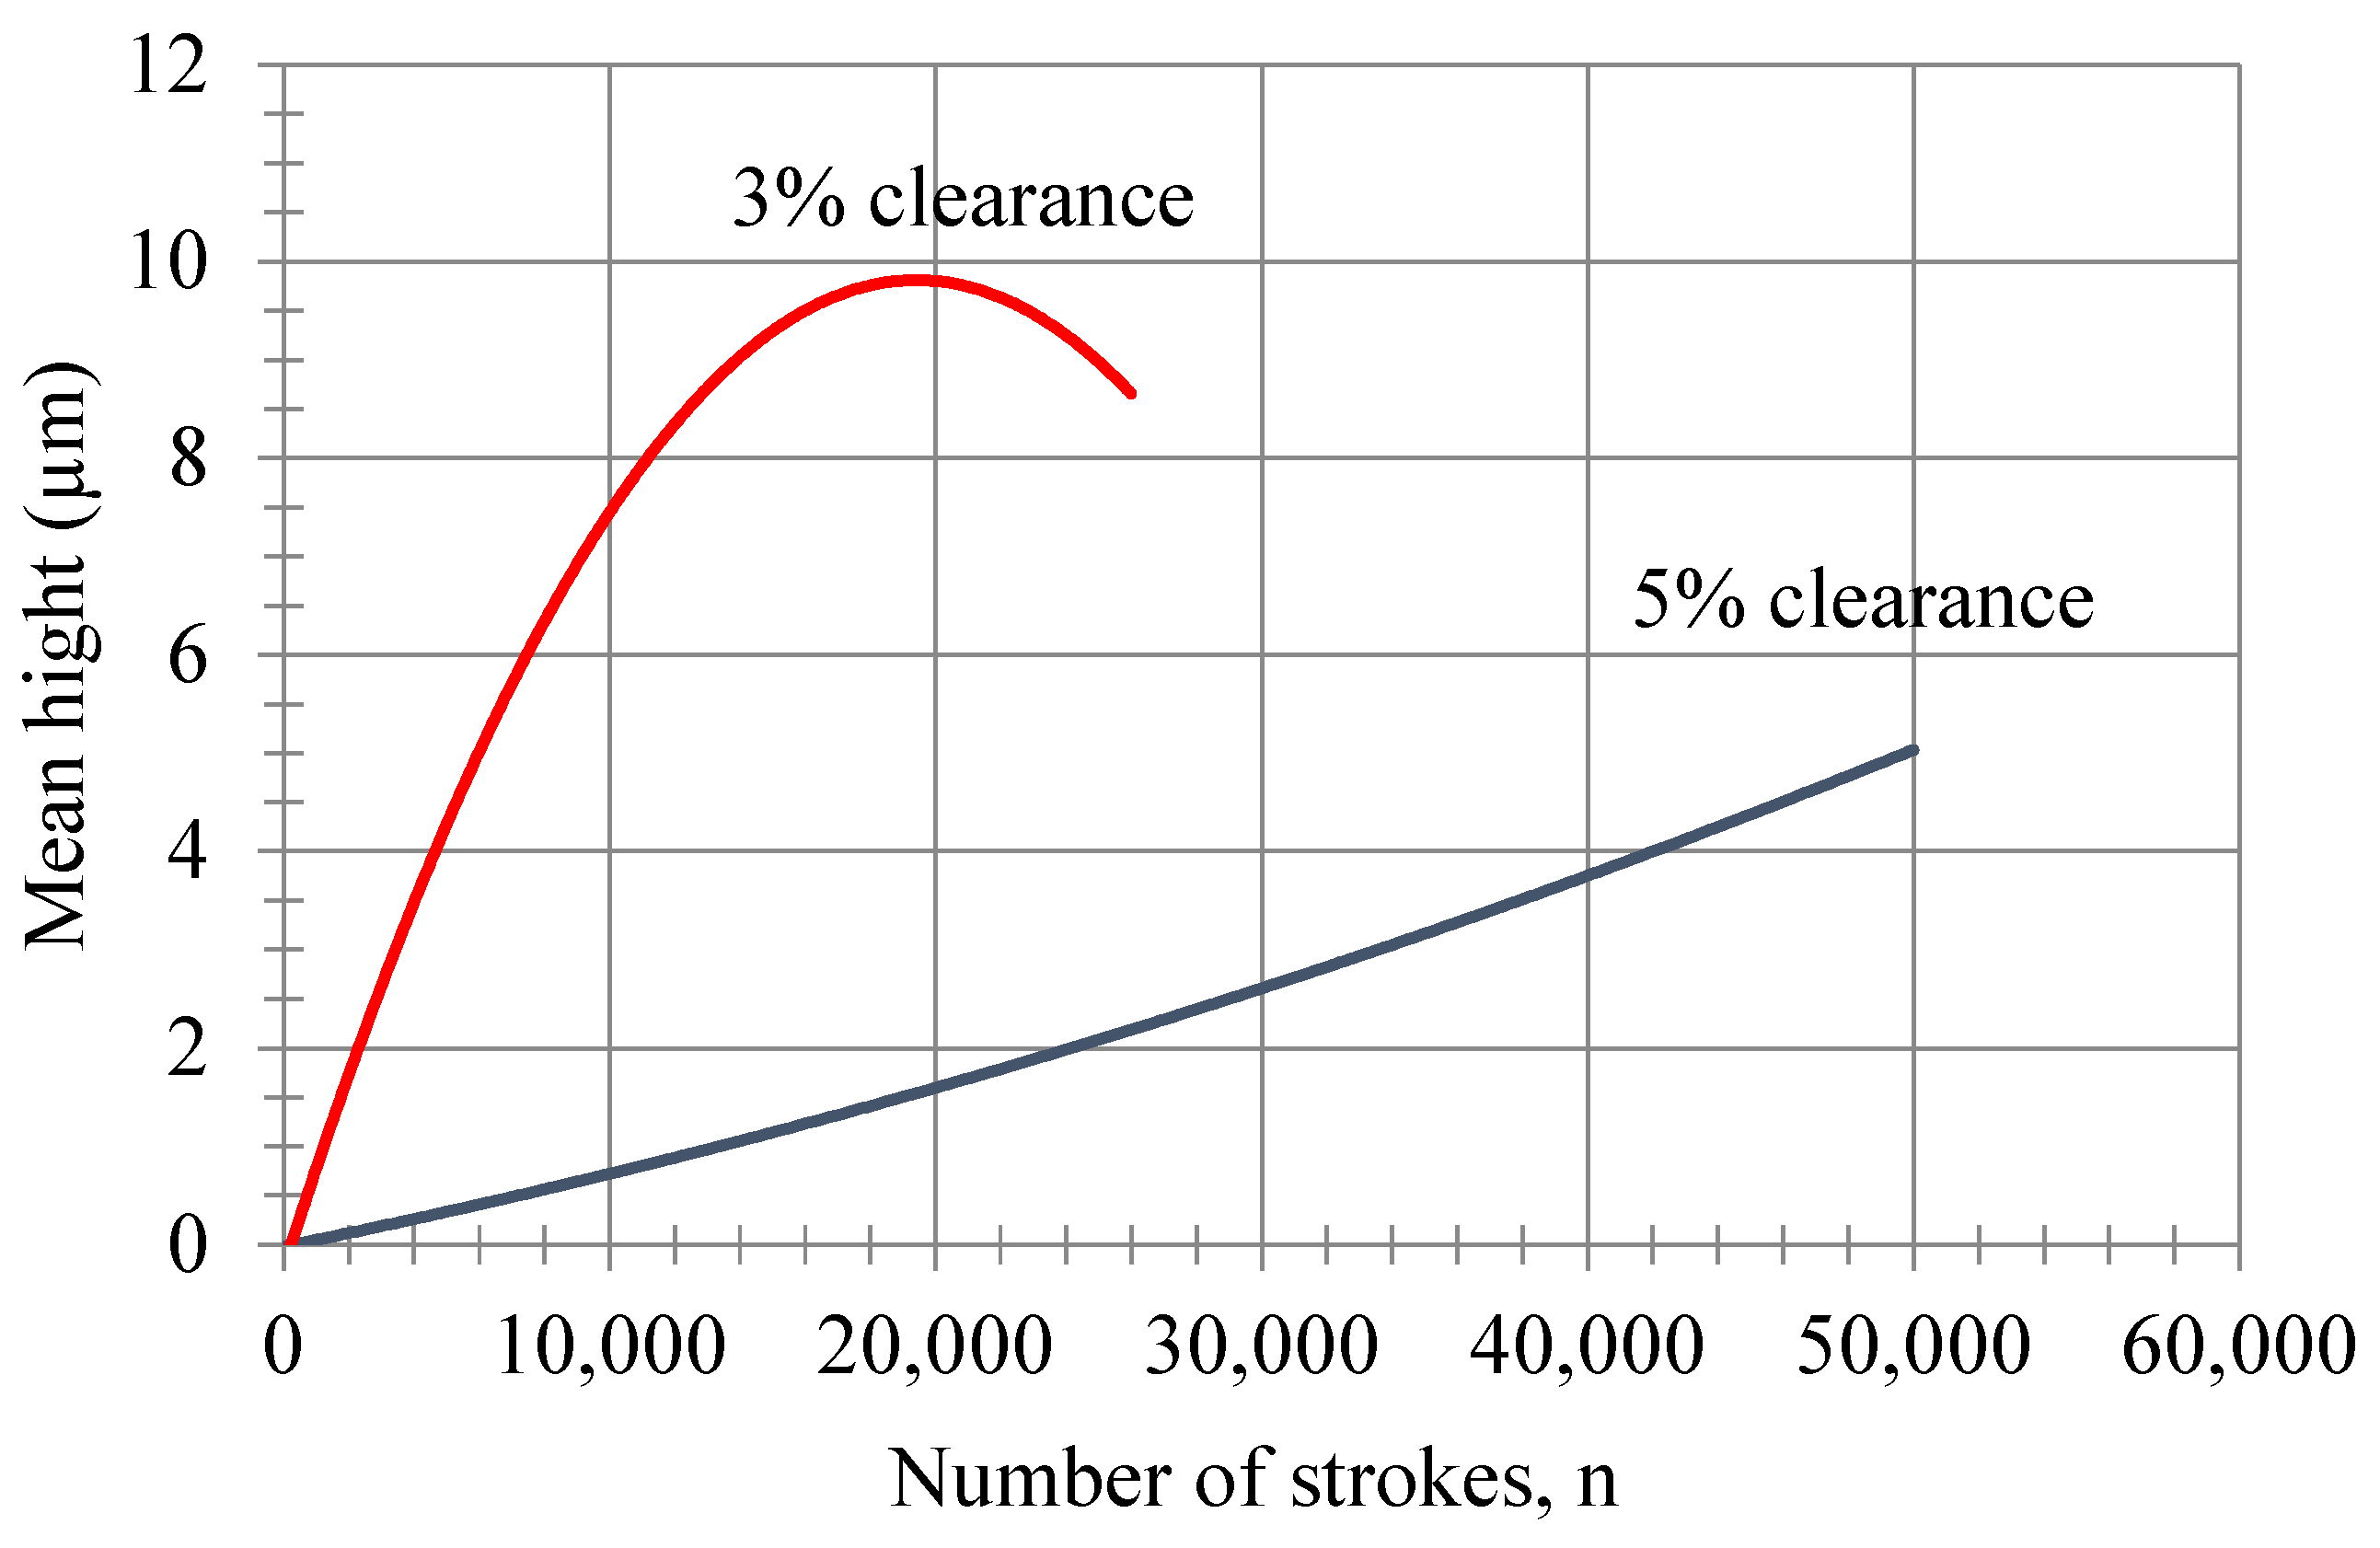
The wear height differences on the punch flank face are shown in
Figure 13. The volume loss on the lateral face created a triangular-shaped wear profile on the punch and die. One can calculate the average wear volume by the difference in wear profile width, length, and height, as well as the wear height, by taking the average of the measurements.
The volume loss can be found by means of the perimeter of the punch and die and the linear wear area along the wear width. The average height difference in the punch flank wear width for both the 3% and 5% clearance conditions is shown in
Figure 13. It can clearly be seen from this figure that the 3% clearance has a higher wear flank angle than the one with 5% clearance, and that the 5% clearance case shows a progressive increase after 26,000 strokes. It can be stated that the height difference in the punch flank face can be calculated with the following equation, depending on the number of strokes for the 5% and 3% clearances. The Zeiss smartproof 5 and Coord3 EOS 5.4.4 CMM were used as measuring devices to read the wear length, as shown in
Figure 14.
and
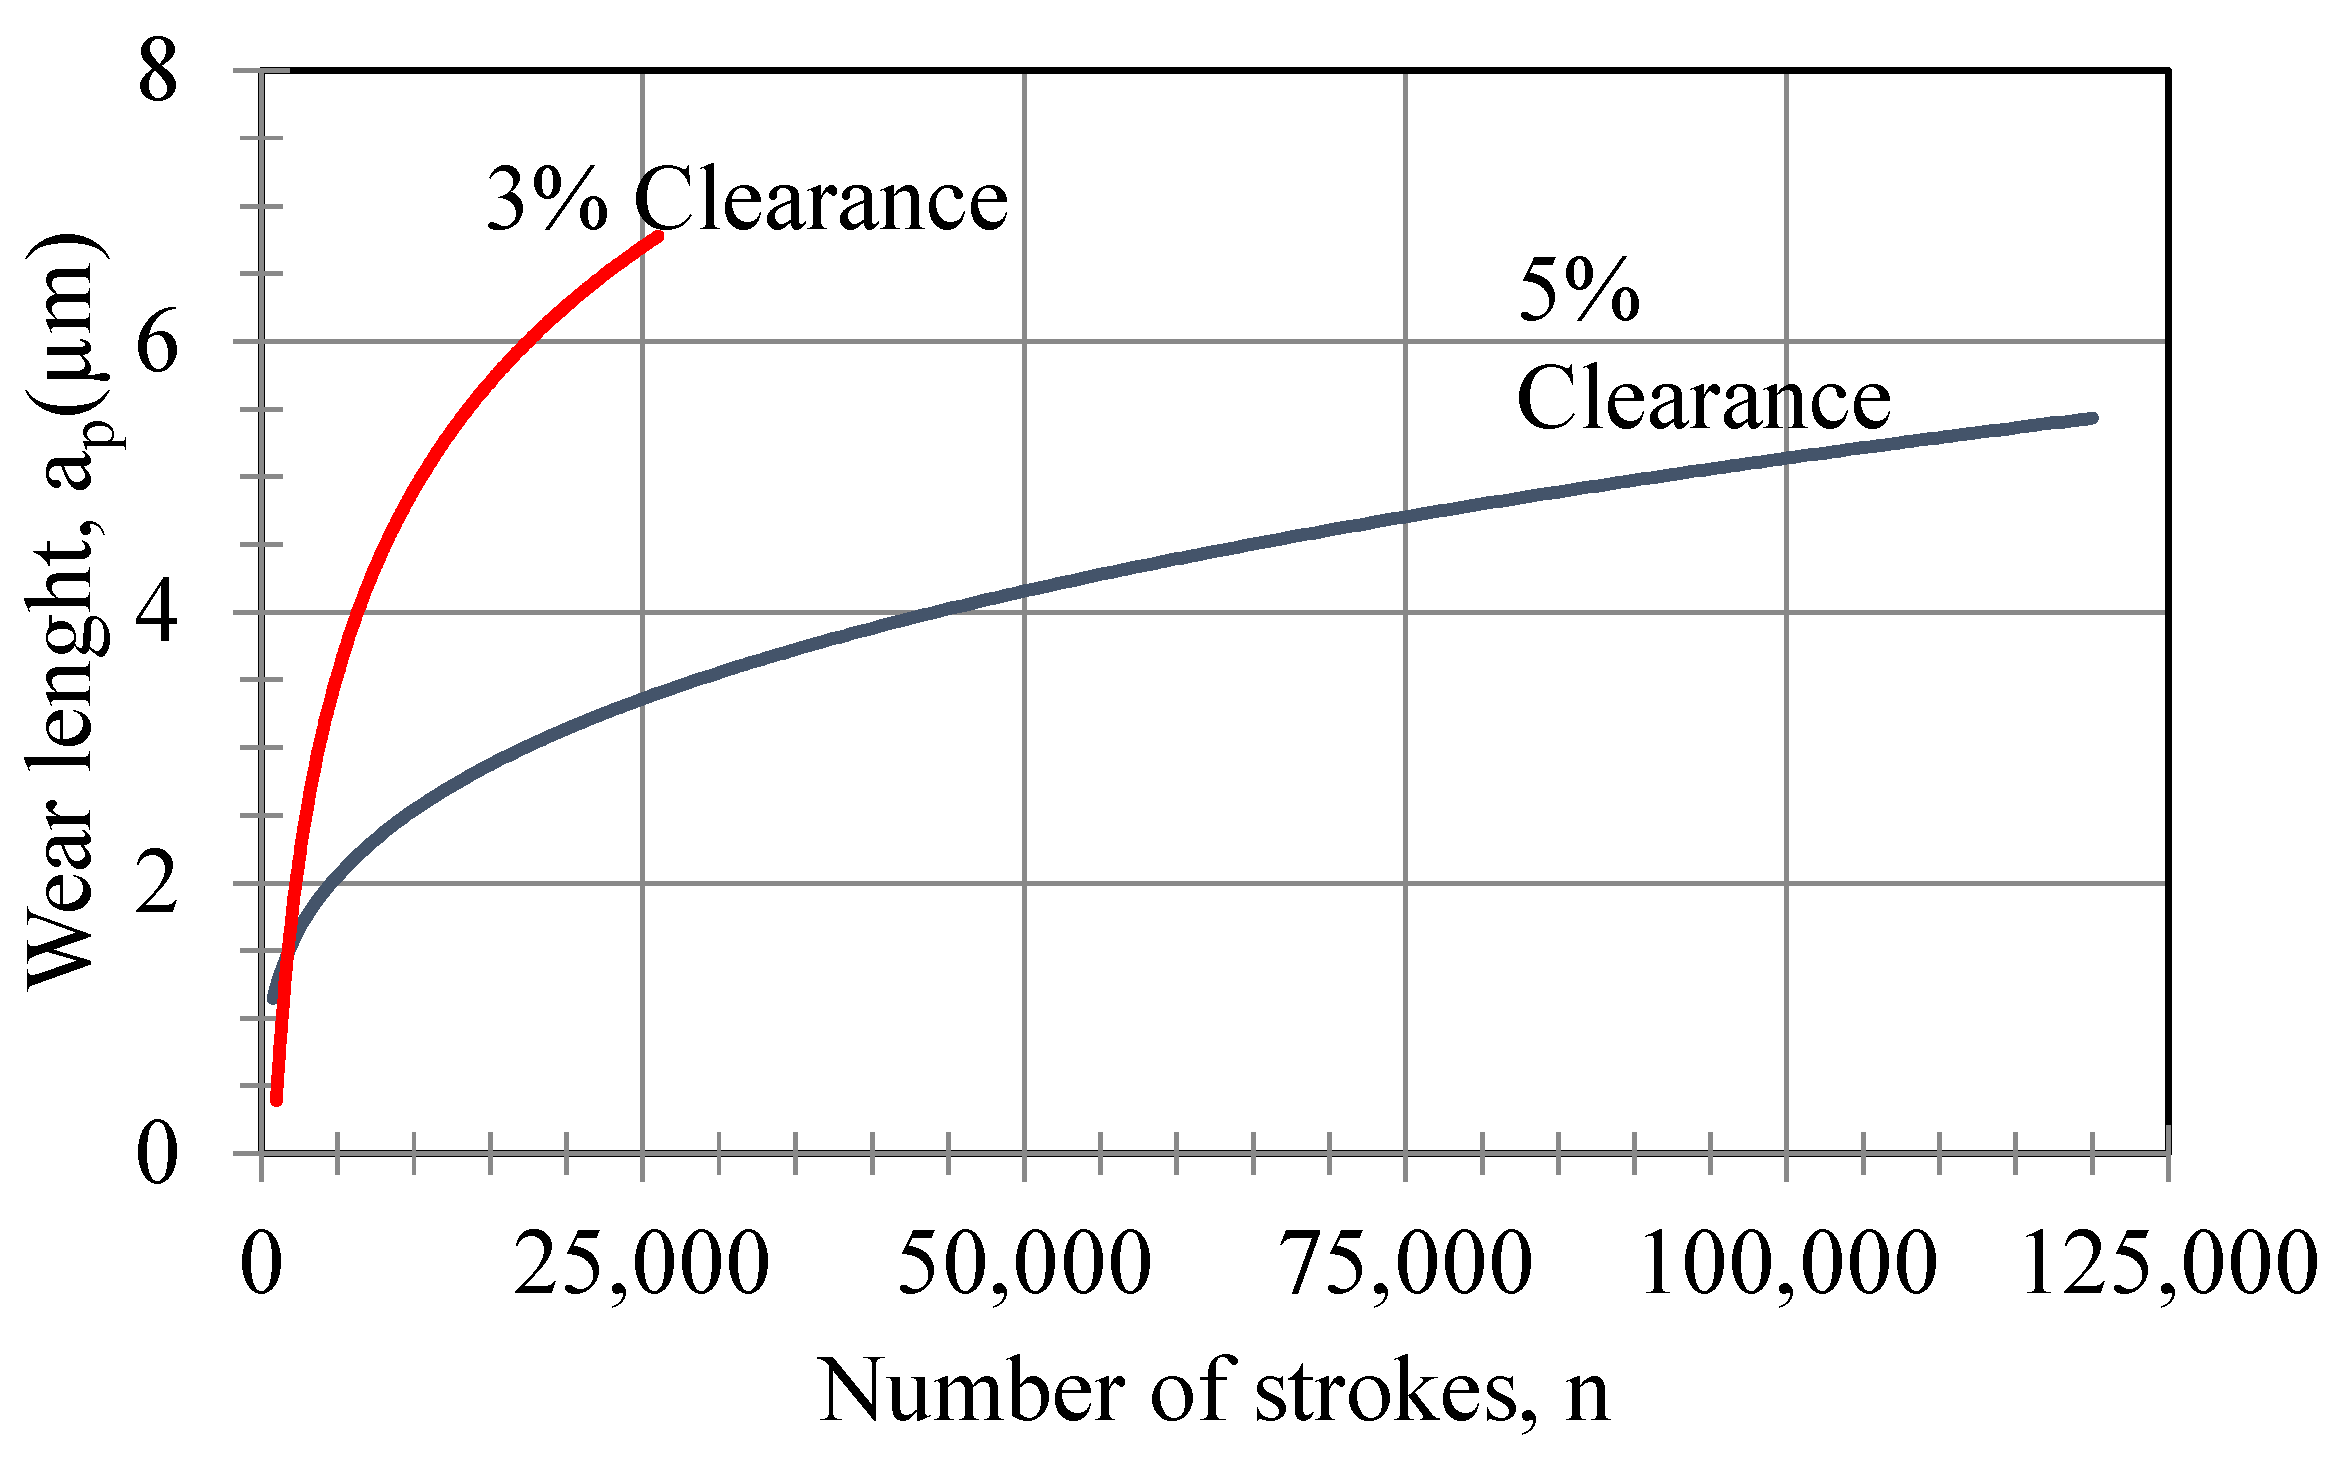
The narrow edge width on the punch is 16 mm. The radial wear distance of the punch with respect to the number of strokes is shown in
Figure 14. The radial wear length as a function of the number of parts for
mm can be calculated by means of the equation exposed in this figure. The radial wear distance varies depending on the number of strokes. It can also be written as a function of the radial wear length with the following equation, depending on the number of strokes for the 5% and 3% clearances:
and
4.4. Axial Wear Length Variance on the Wear Surface
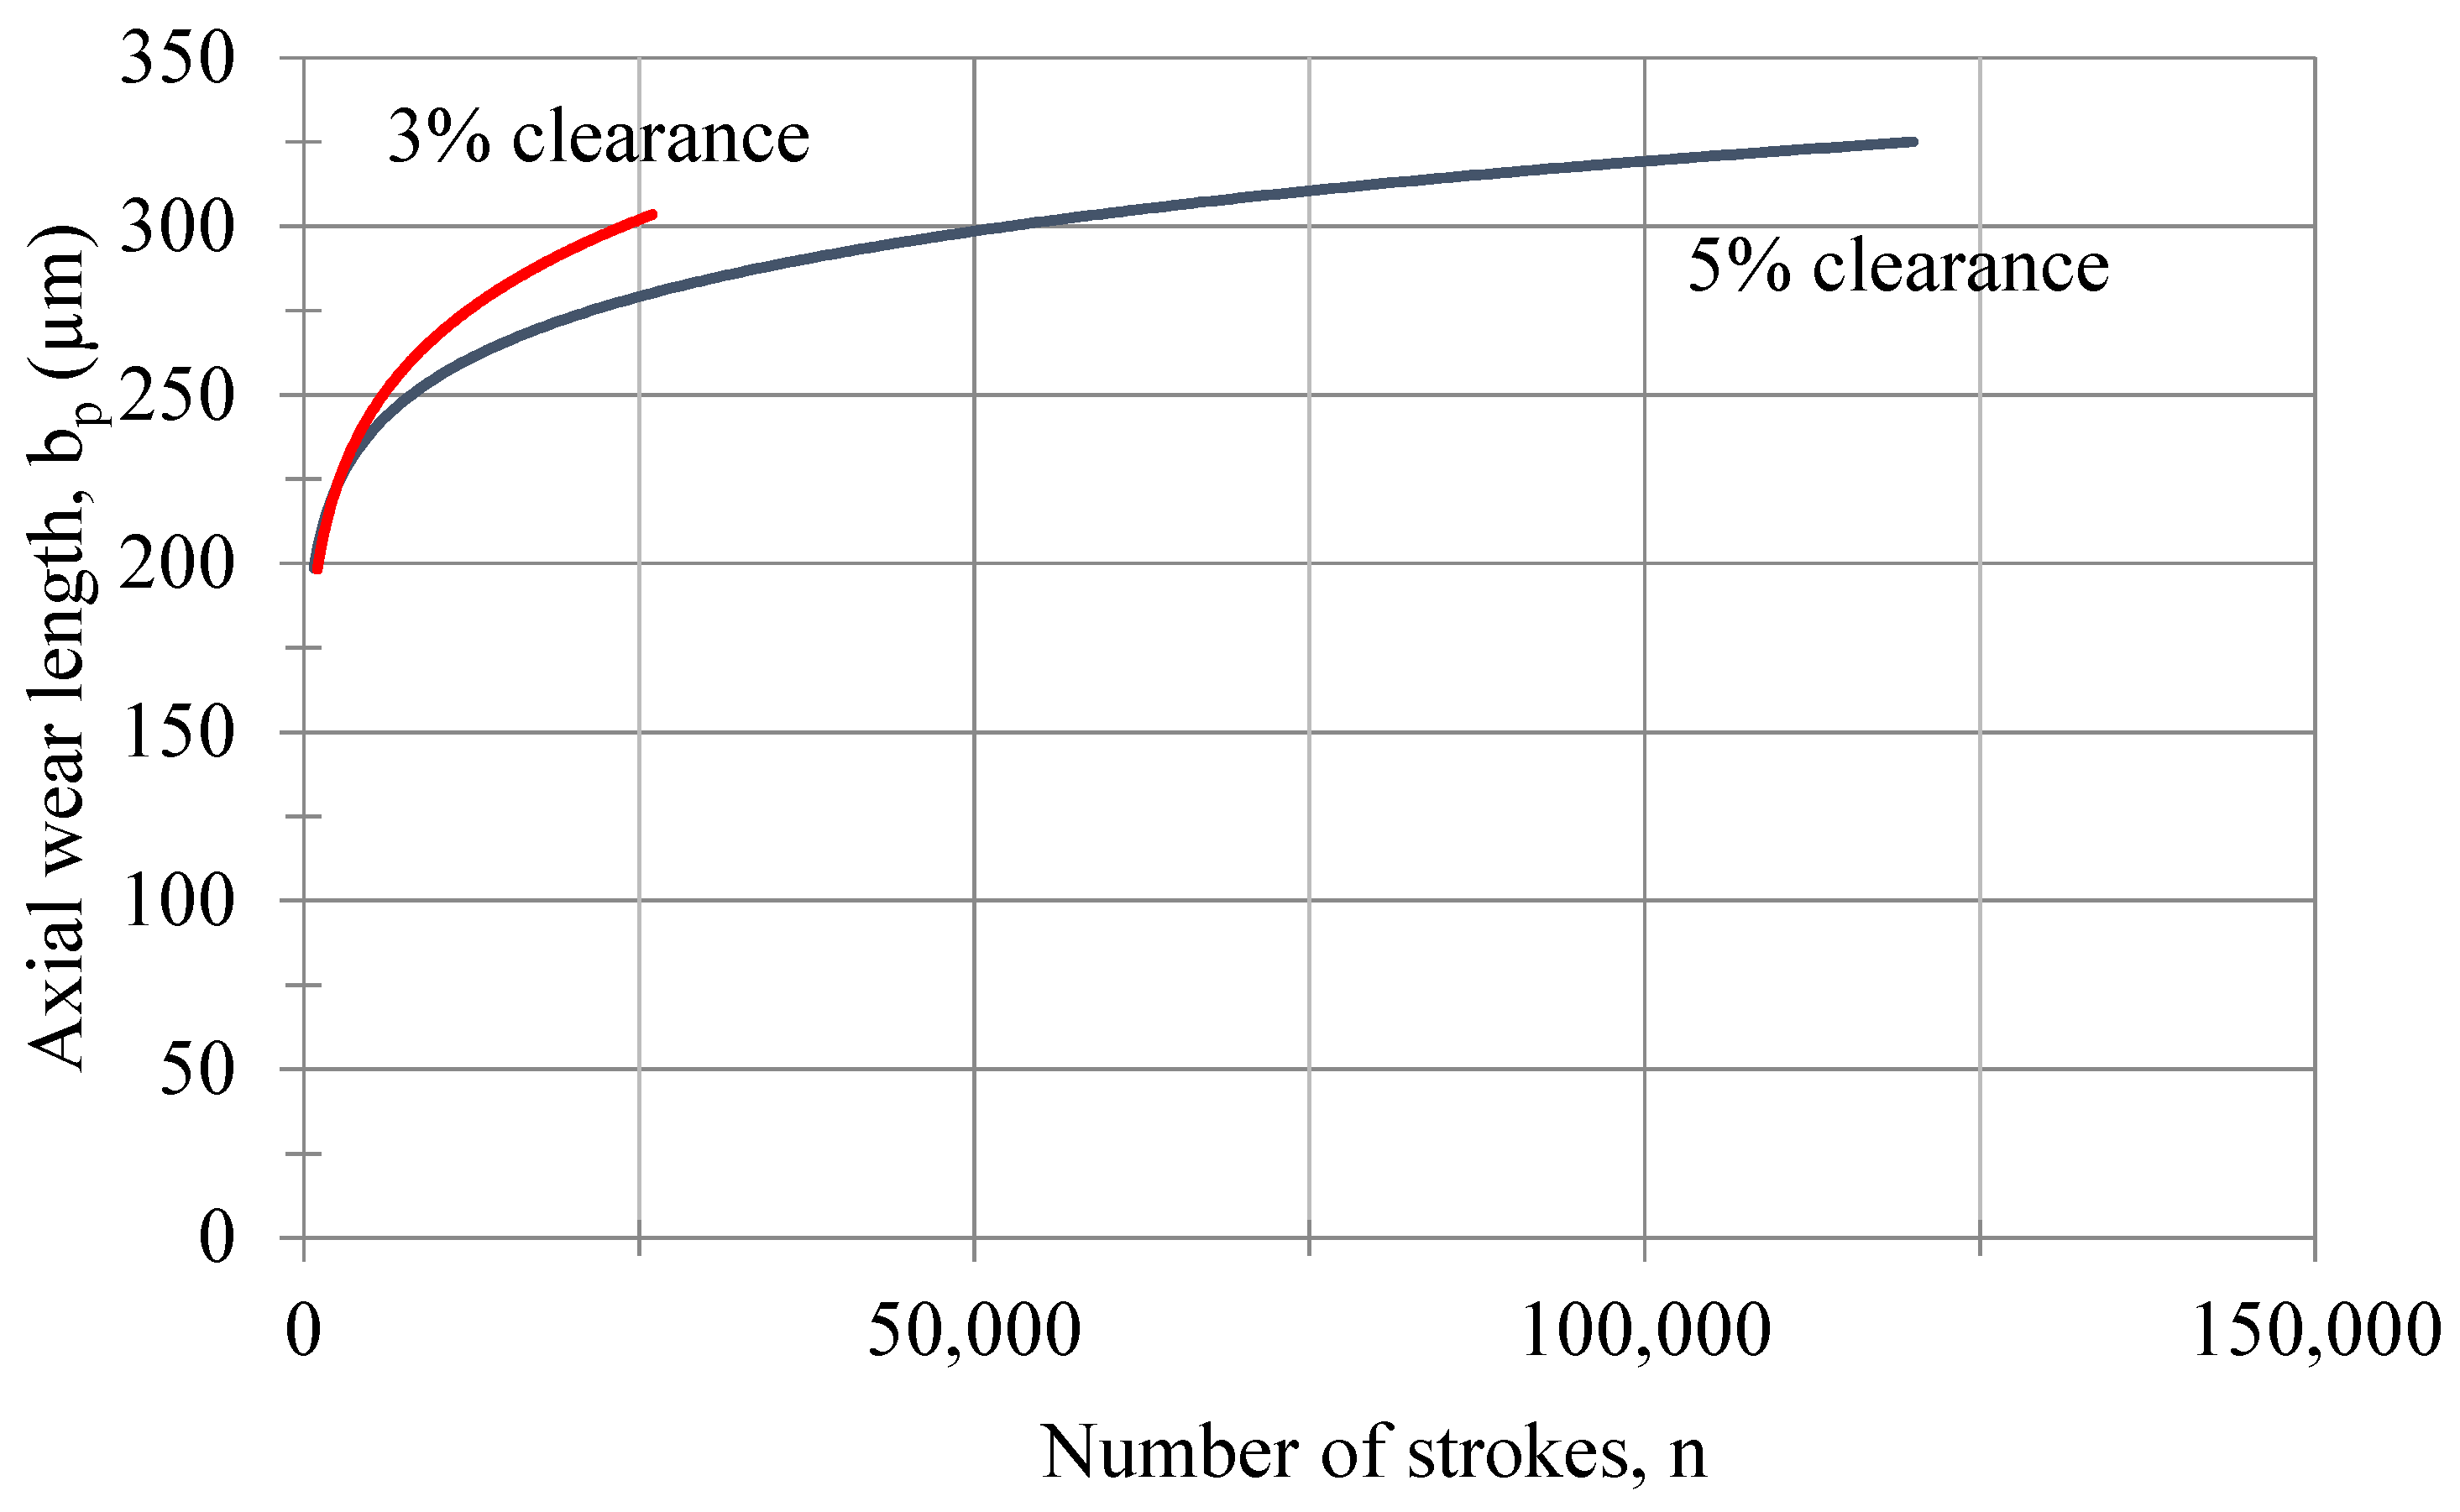
The axial wear length—as a function of the number of strokes for both 3% and 5% clearances—is shown in
Figure 15. To draw axial wear length, the Zeiss smartproof 5 and the Coord3 EOS 5.4.4 CMM were used as measuring devices. Since the axial wear length occurs throughout the punch movement, it will be much larger than the value of the radial wear length. It can be written as a function of the axial wear length with the following equation, depending on the number of strokes for the 5% and 3% clearances:
and
Using Equation (7), the radial wear lengths calculated are in good agreement with the experimental data of radial wear distances of the punch, denoted as , , , , , and , which were measured after 750, 10,000, 26,000, 50,000, and 120,000 strokes, respectively.
4.5. Calculation of Wear Volume Using Laser Profilometer Measurements
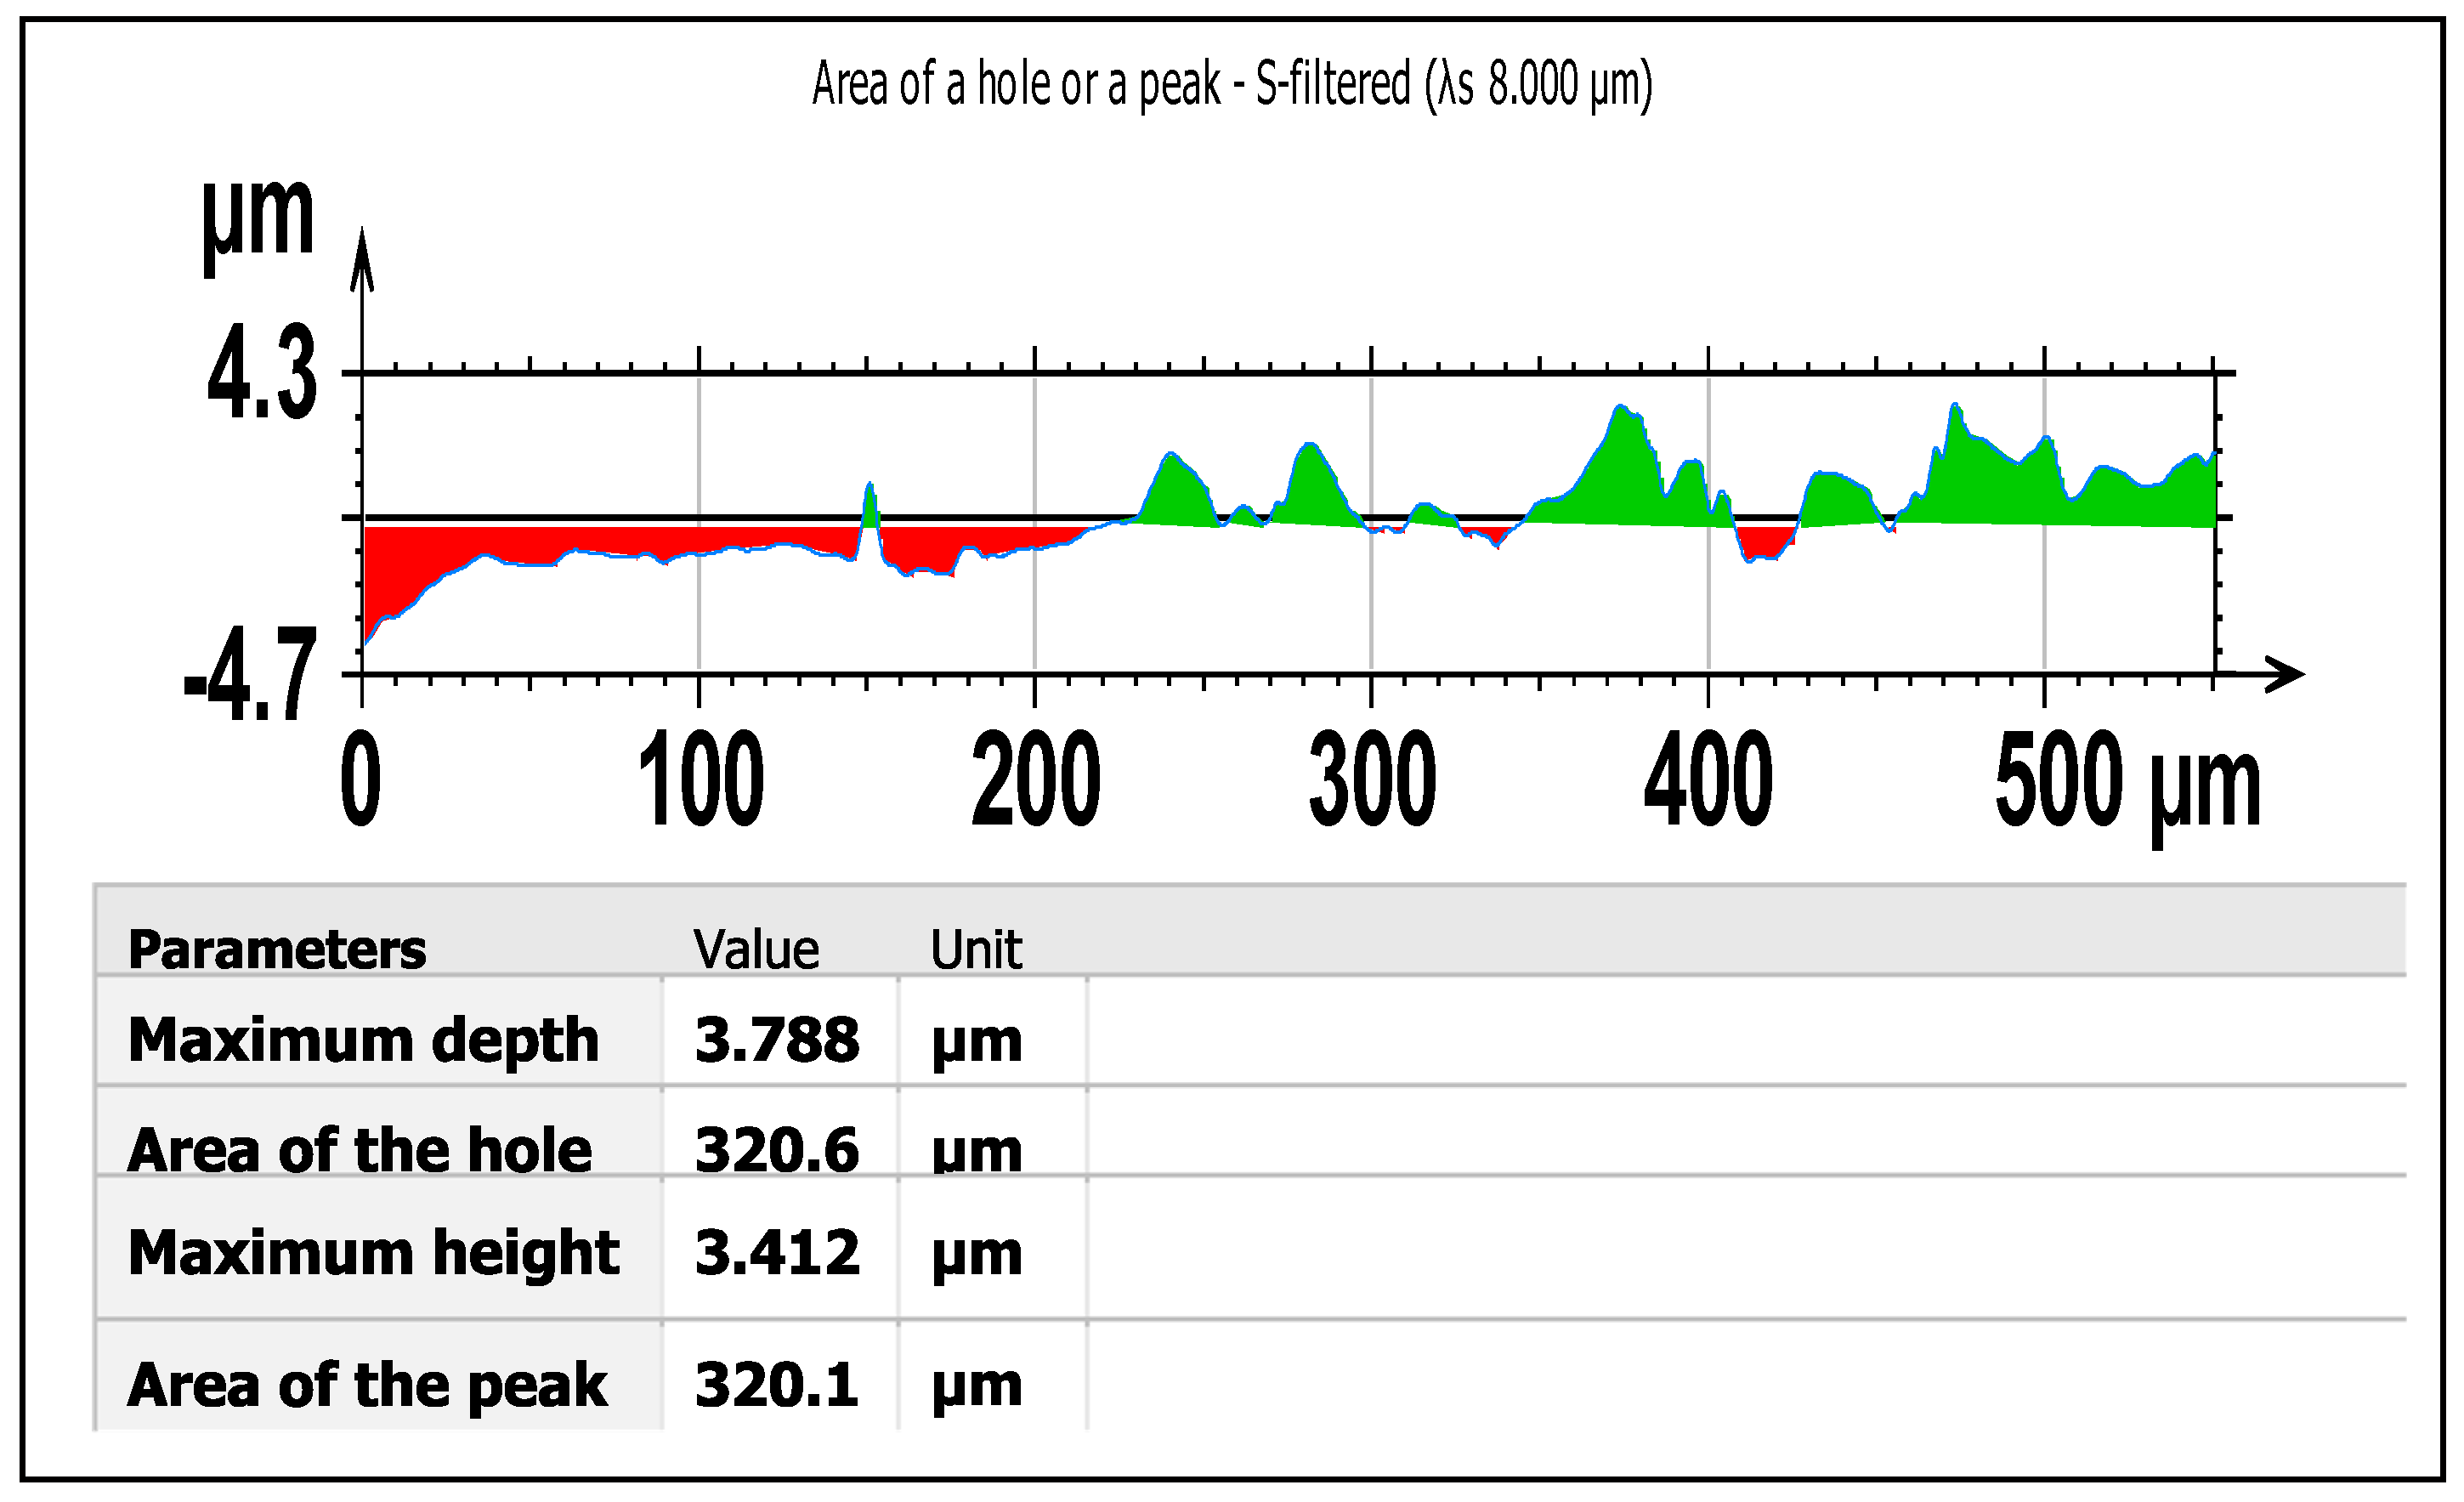
Wear surface area and wear length can be measured with a laser profilometer for measurements made under a certain pressure on the die and punch surfaces. Furthermore, three-dimensional surface maps of the punch and die periphery were obtained using a confocal laser microscope (Zeiss Smart Proof 5). These maps were analyzed using Digital Surf MountainsLab Premium 11 software, and linear wear areas were determined based on the least-squares plane. The circumferential average of these areas was then used to calculate volumetric wear loss along the punch and die. In addition, alternative methods for calculating volume loss were proposed, thereby leading to a versatile approach to wear characterization. The areas of peaks and holes at the end of the punch side face for the 5% clearance condition at 26,000 strokes are shown in
Figure 16.
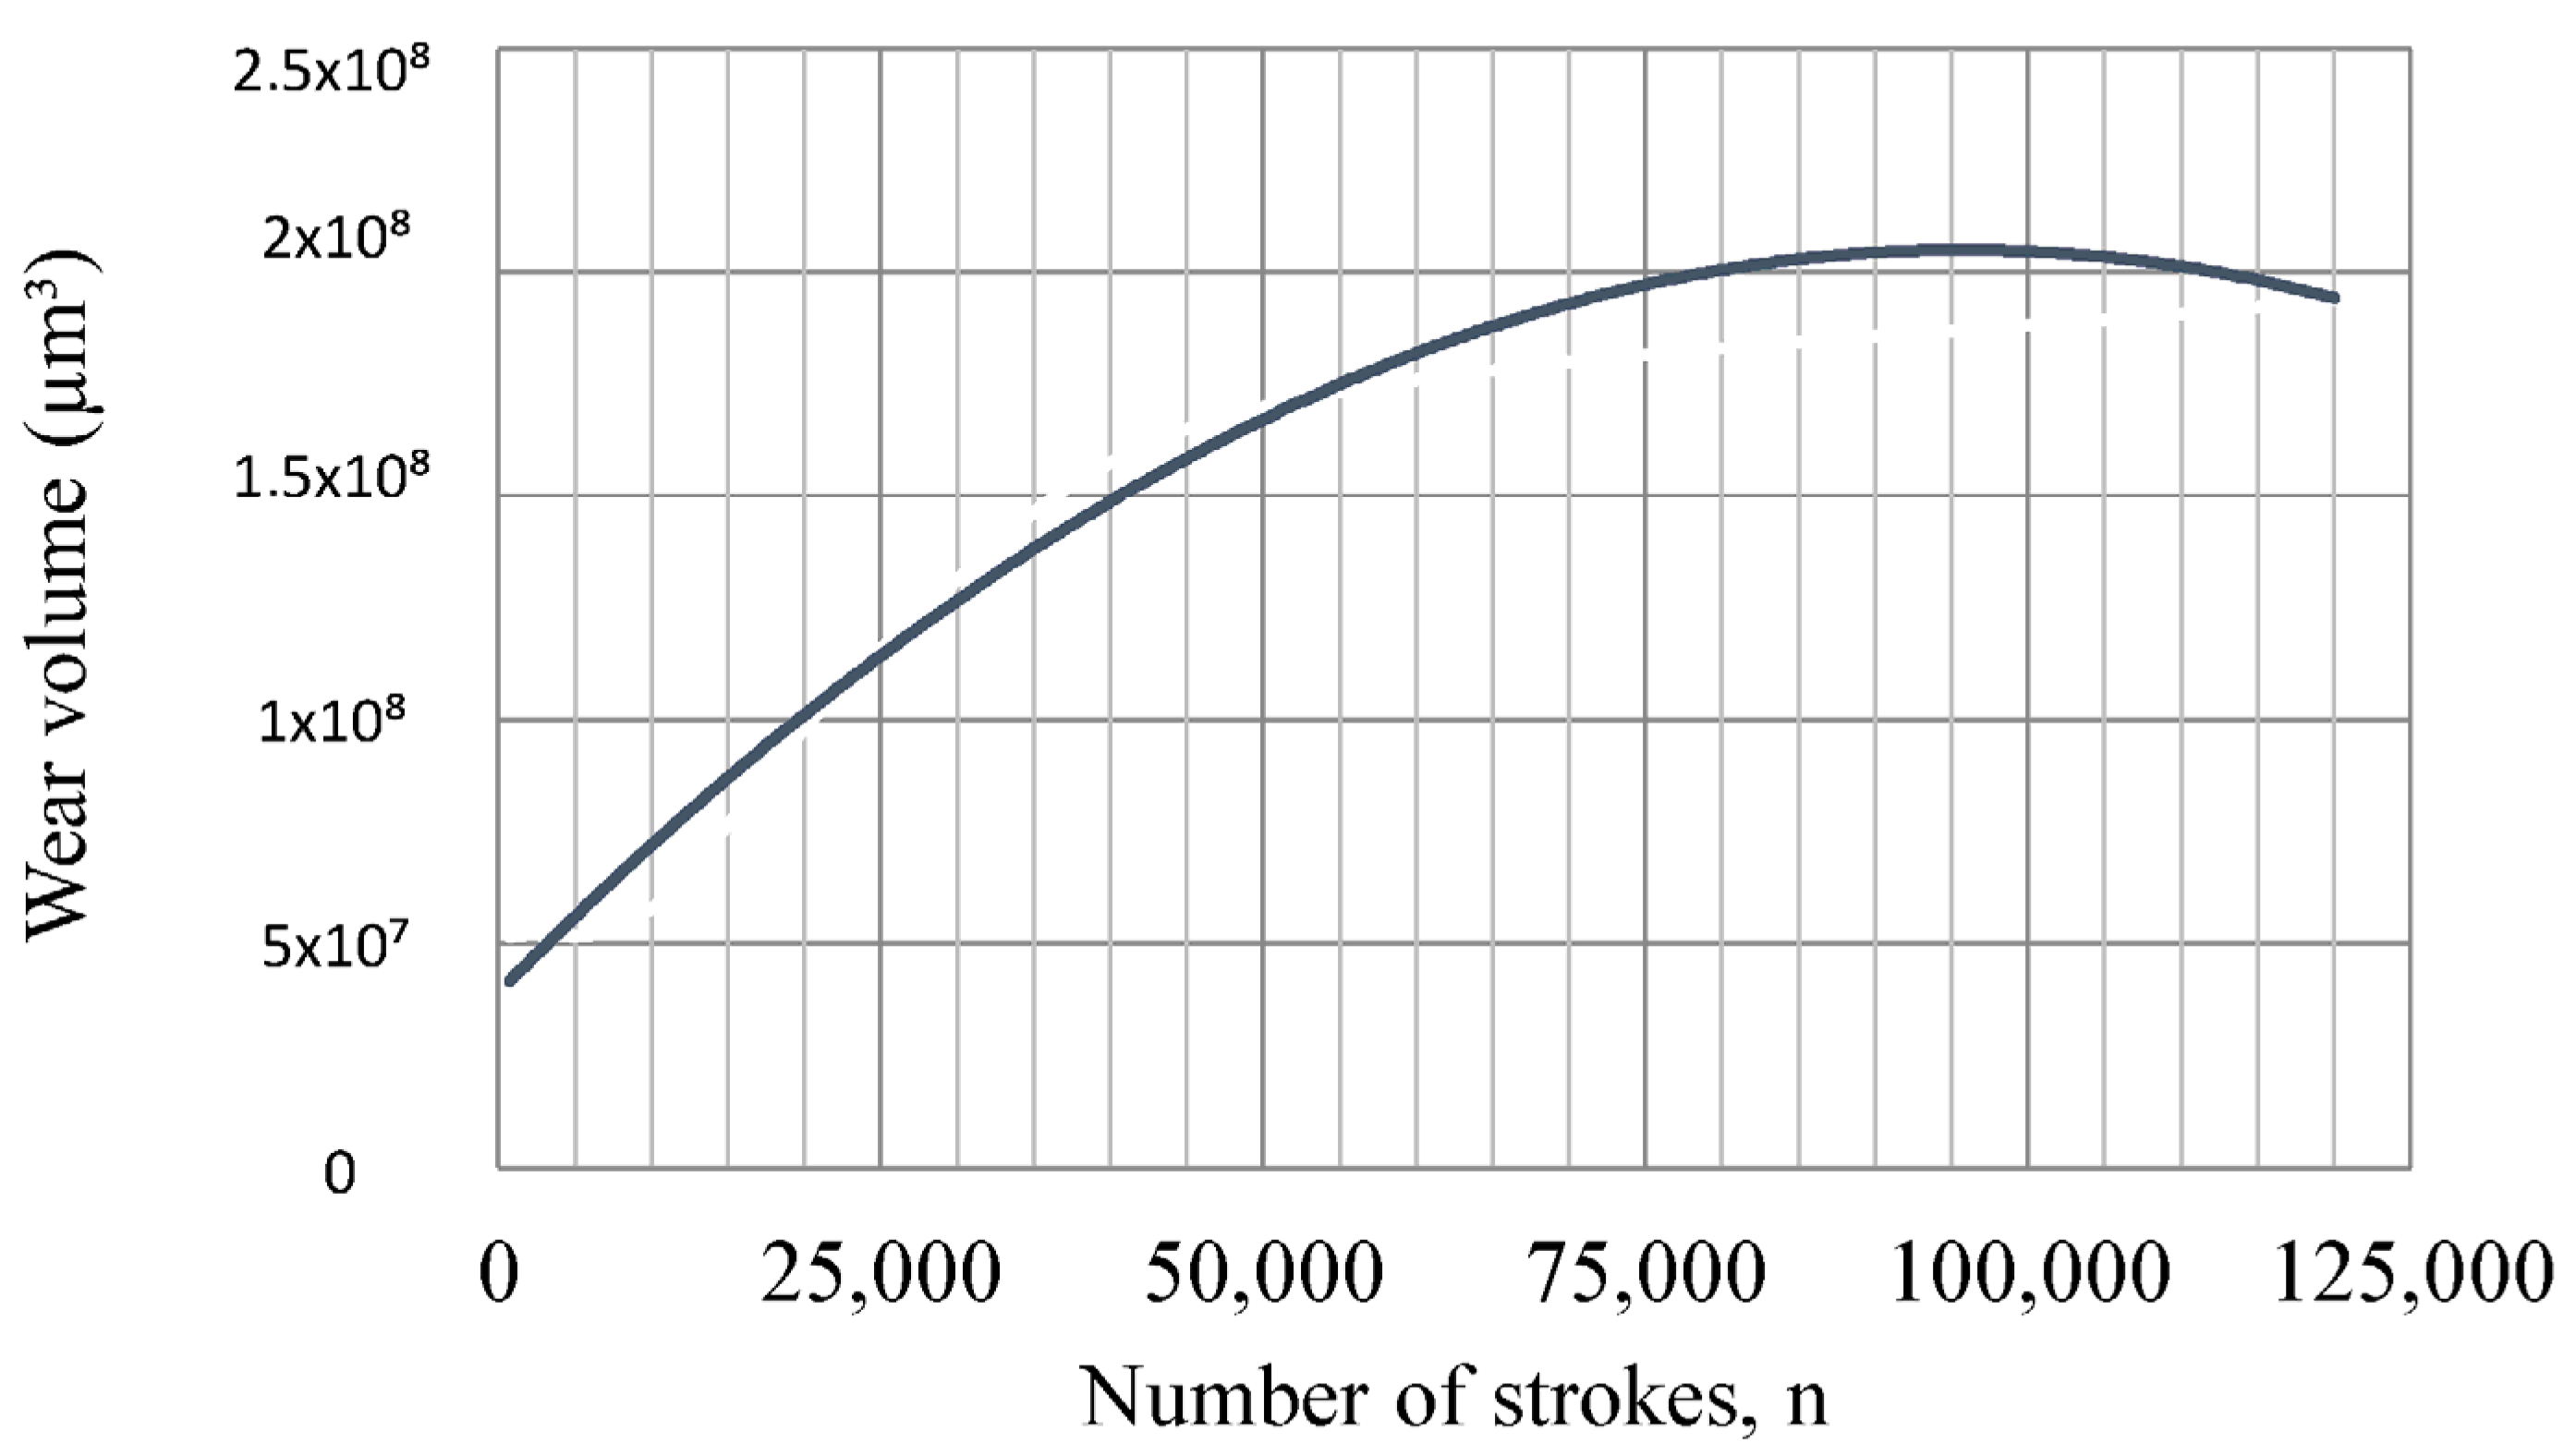
The wear in the measurement taken linearly from the flank of the punch at a distance of 550 µm from the tip after 26,000 strokes is shown in red. One can calculate the wear volume for 5% clearance at 10,000 prints, 26,000 prints, and 50,000 prints by using
Figure 17. To calculate wear volume, many measurements were made on the punch front and side faces, as well as on the die surface, for 750, 10,000, 26,000, 50,000, and 120,000 prints. The side surface wear volume on the punch for each number of strokes can be calculated by multiplying the punch perimeter by the average wear area.
Since the average wear length,
, is the constant at the same number of strokes, the weary length along the perimeter of the punch is uniform. The wear volume can be written in the following form:
In the approach applied in Equation (17), it was assumed that wear is not uniformly distributed along the punch perimeter; therefore, measurements were taken from different regions. The surface topographies obtained from each region were recorded using a confocal laser microscope (Zeiss Smartproof 5) and analyzed using DigitalSurf MountainsLab (Digital Surf S.A.S., Besançon, France) software with reference to the least-squares plane. This plane minimizes deviations of measurement points along the z-axis, representing the overall surface inclination and enabling the calculation of wear parameters in compliance with ISO 25178 [
33]. For each topography, mean values were determined individually and subsequently combined to obtain a more reliable average linear wear area (Ph
0) along the perimeter.
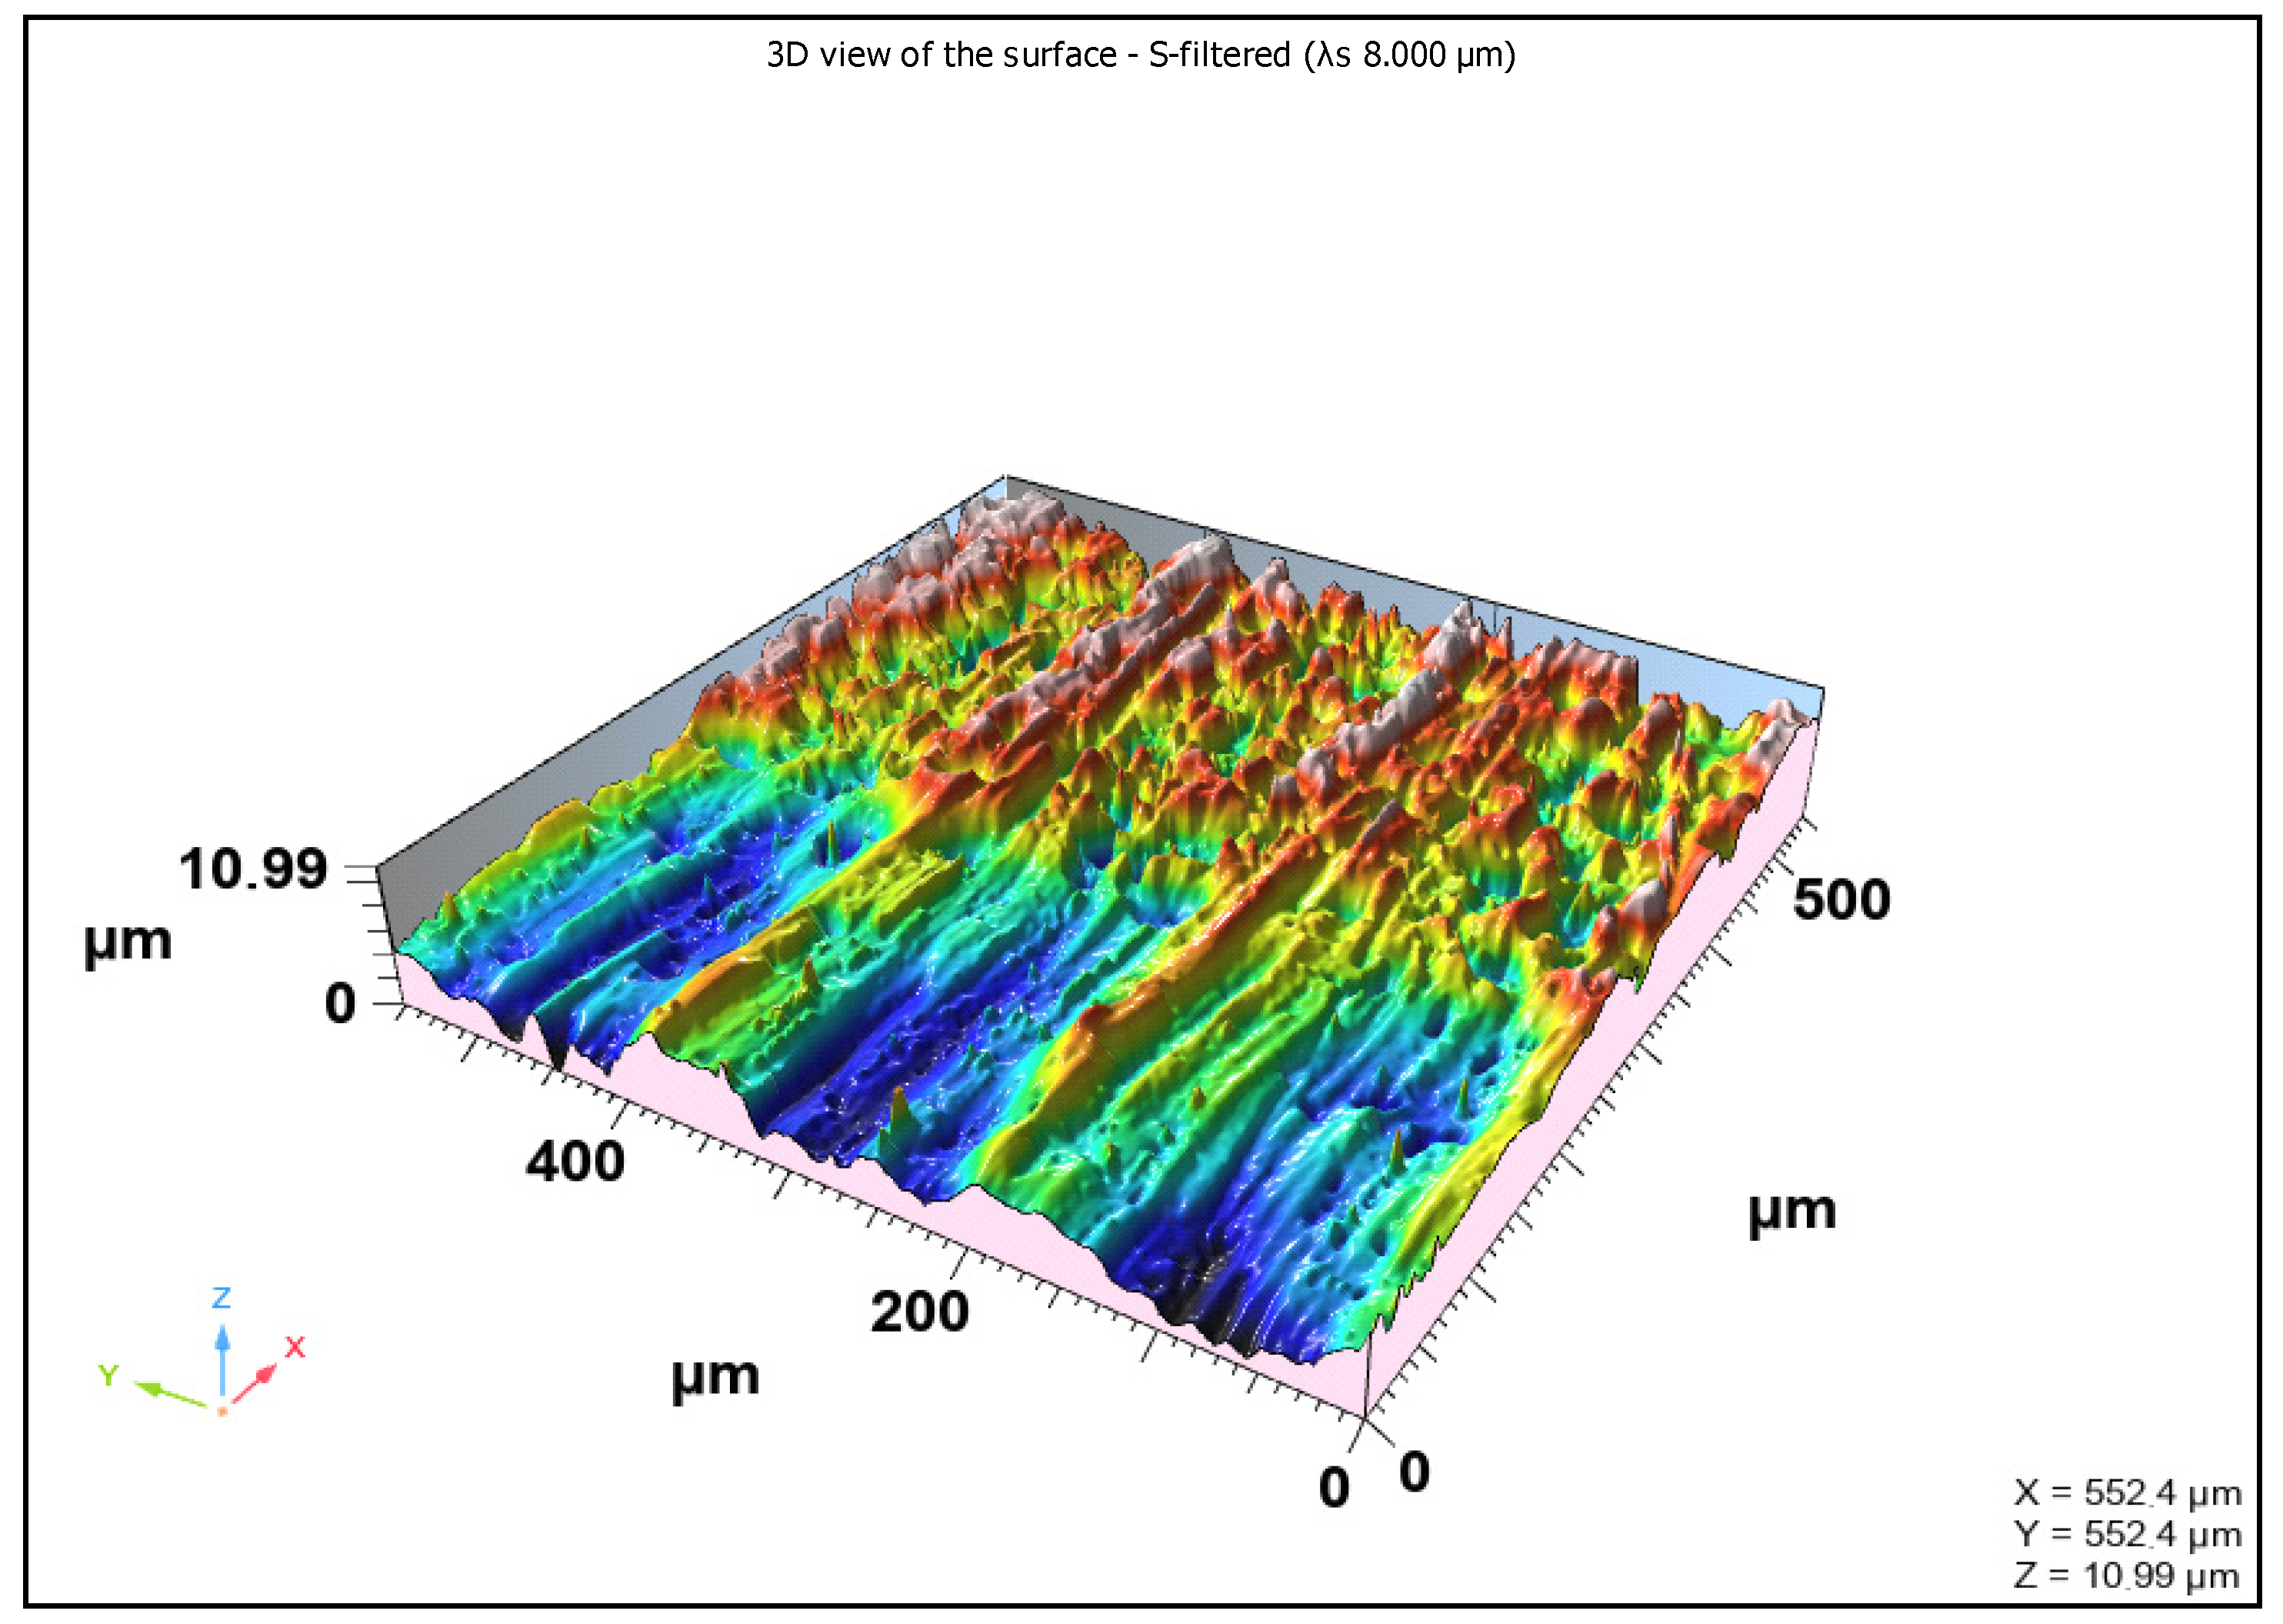
The 550 µm × 550 µm 3D topography of the punch-tip flank face captured using a Zeiss smartproof 5 measuring device is shown in
Figure 18.
Here, the perimeter of the punch is denoted by , the punch wear width is denoted by , and the average wear area is . For 750 strokes, by inserting the length of the punch flank wear as 200.50 µm, the punch perimeter of 174.4 mm, and the average wear area of 147.76 µm2 into Equation (9), one can calculate the volume loss on the side face of the punch as 51,538,688 µm3.
The total mass,
, is calculated with the material density,
, and Equation (7), as follows:
For 750 strokes, by inserting the punch material density of 7.7 kg/dm
3 and the volume loss on the side face of the punch of 51,538,688 µm
3 into Equation (8), one can calculate the total mass as 3968 × 10
−4 g. The total wear volume on the punch side surface of the die at a 5% clearance is shown in
Figure 16. It can also be written as a function of total wear volume with the following equation, depending on the number of strokes for the 5% clearance:
The radial wear distance,
, and the axial wear length,
, on the punch flank surface are shown in
Figure 18. The length of the punch-tip flank face wear at 26,000 strokes was found by increasing the amplitude by 15%. In case of loss due to wear, the wear volume in this area can be measured both as a linear area and as a least-squares plane by taking the topography measurement. It is assumed that the external area is flat enough and gaps are closed with the average plane. The volume under the entire outline gives the wear value.
4.6. Rollover of Blanked Part
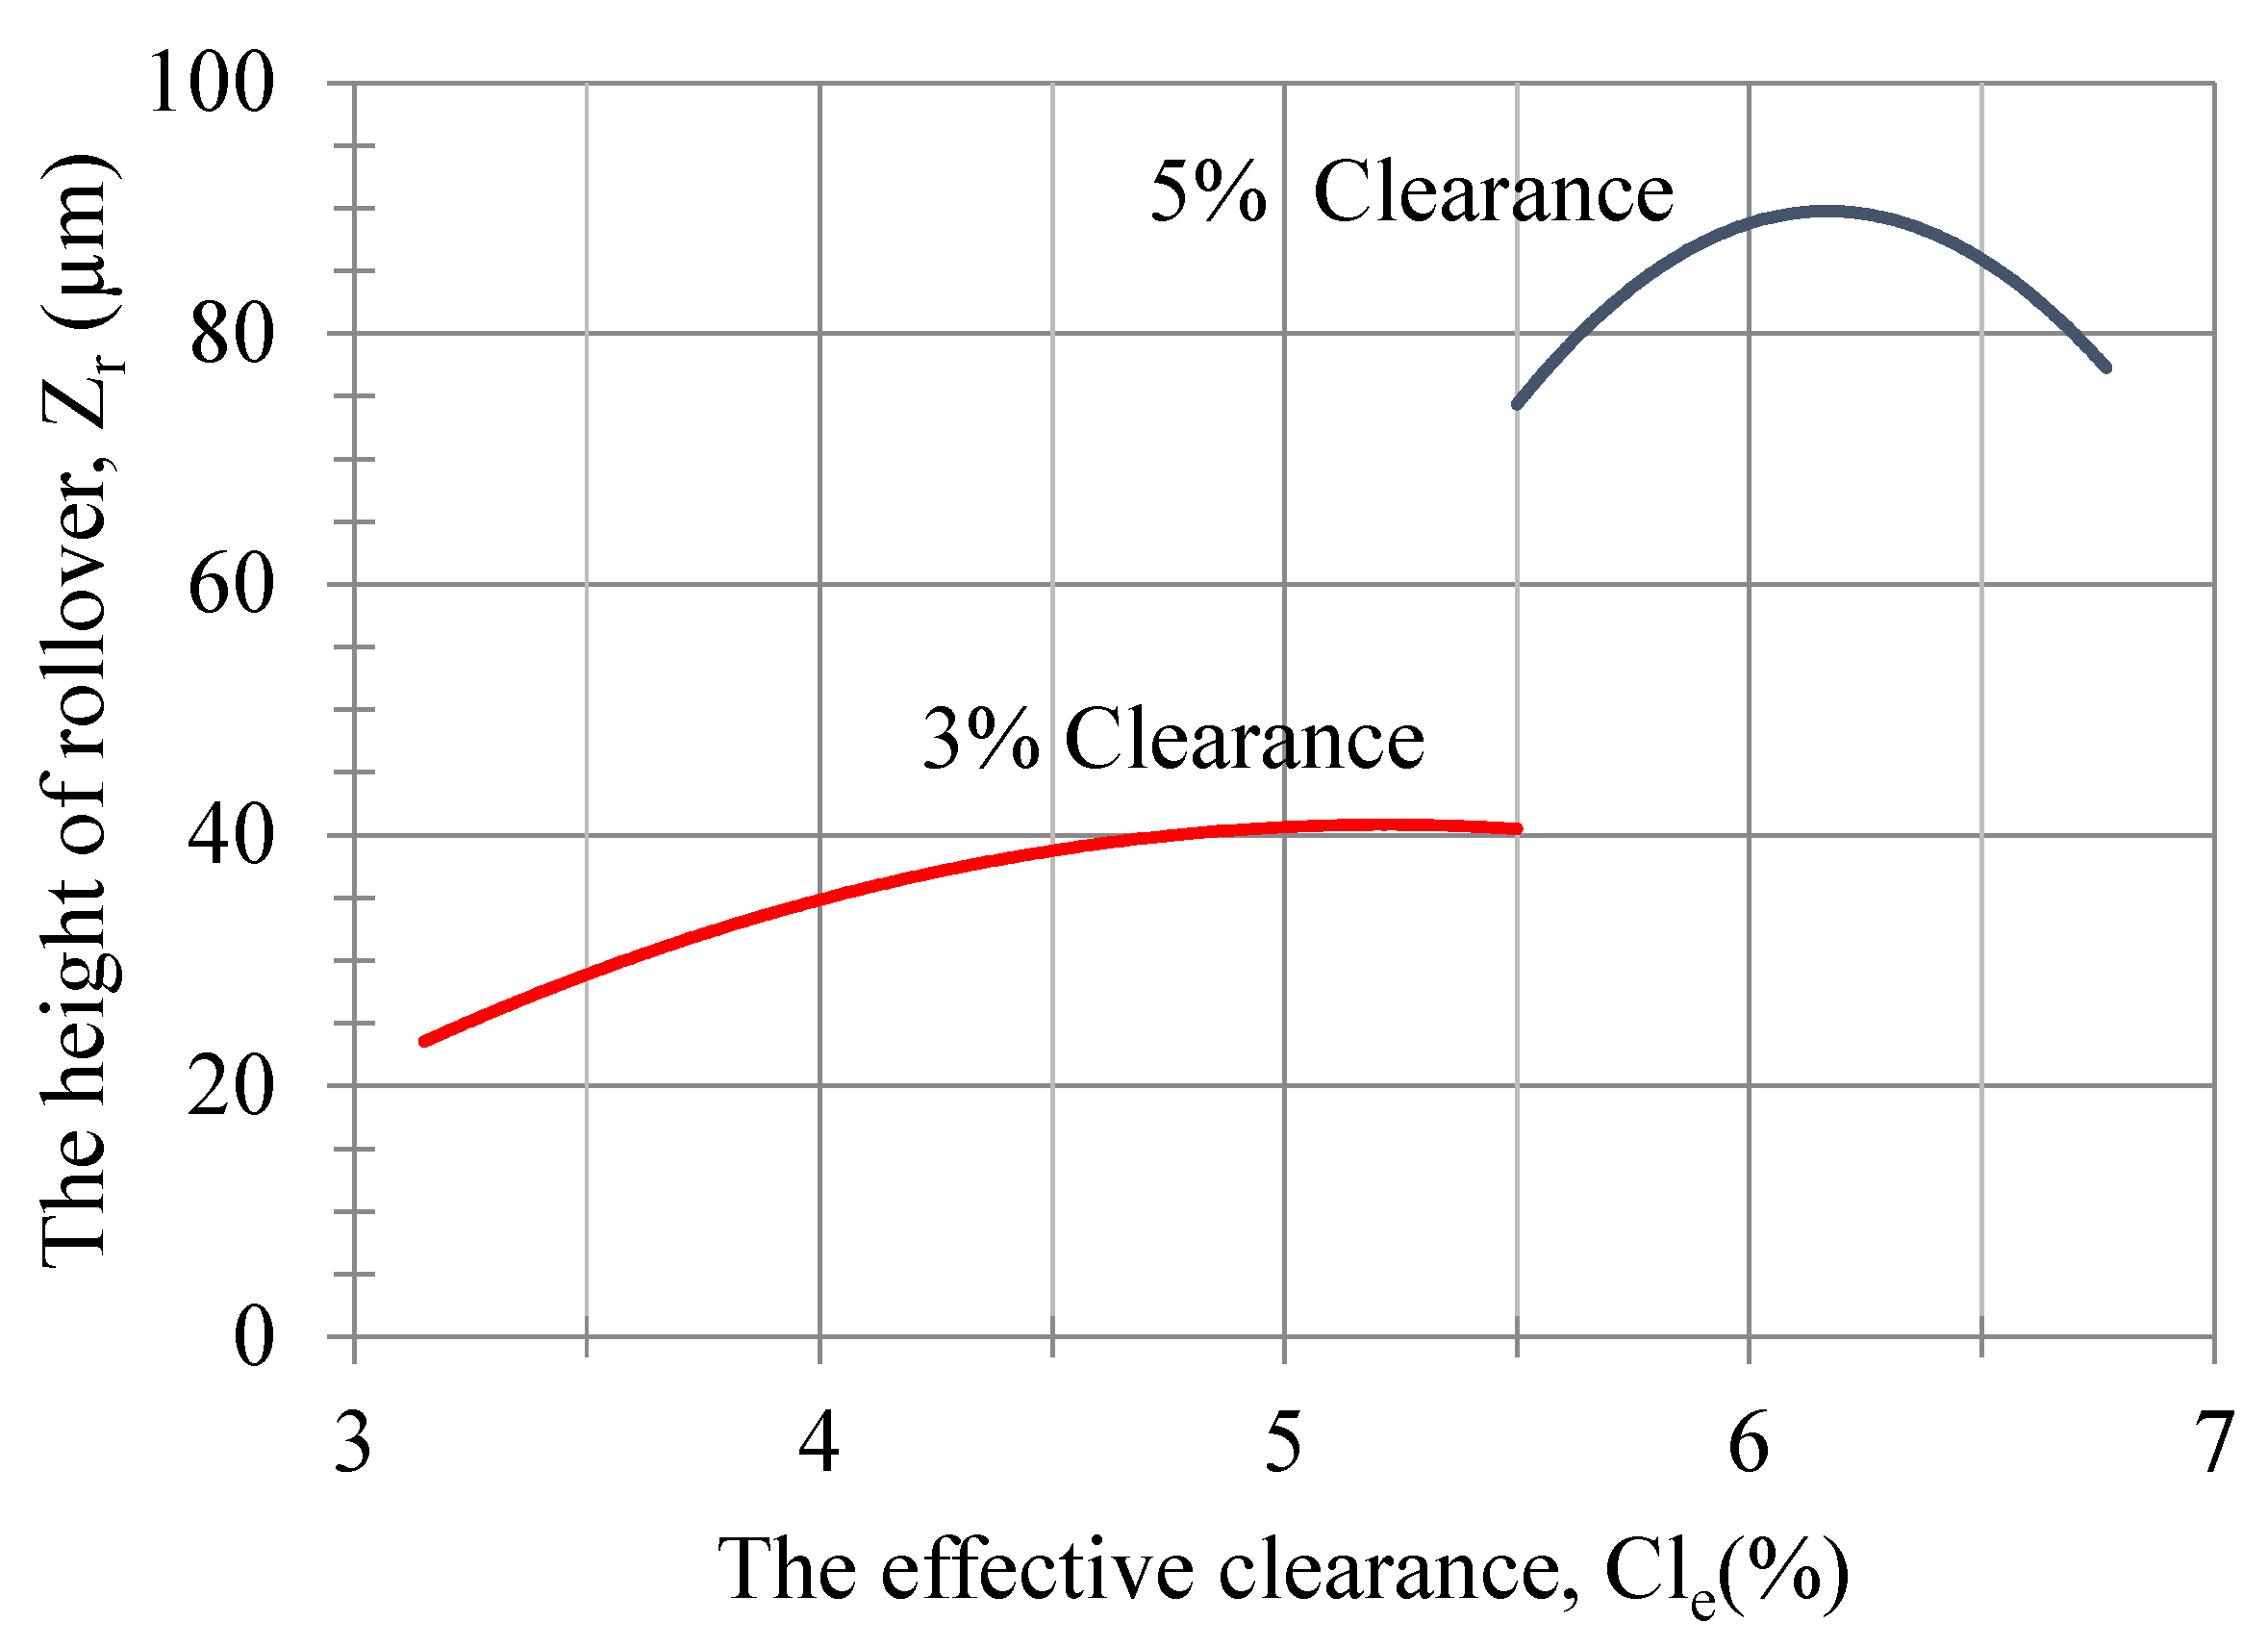
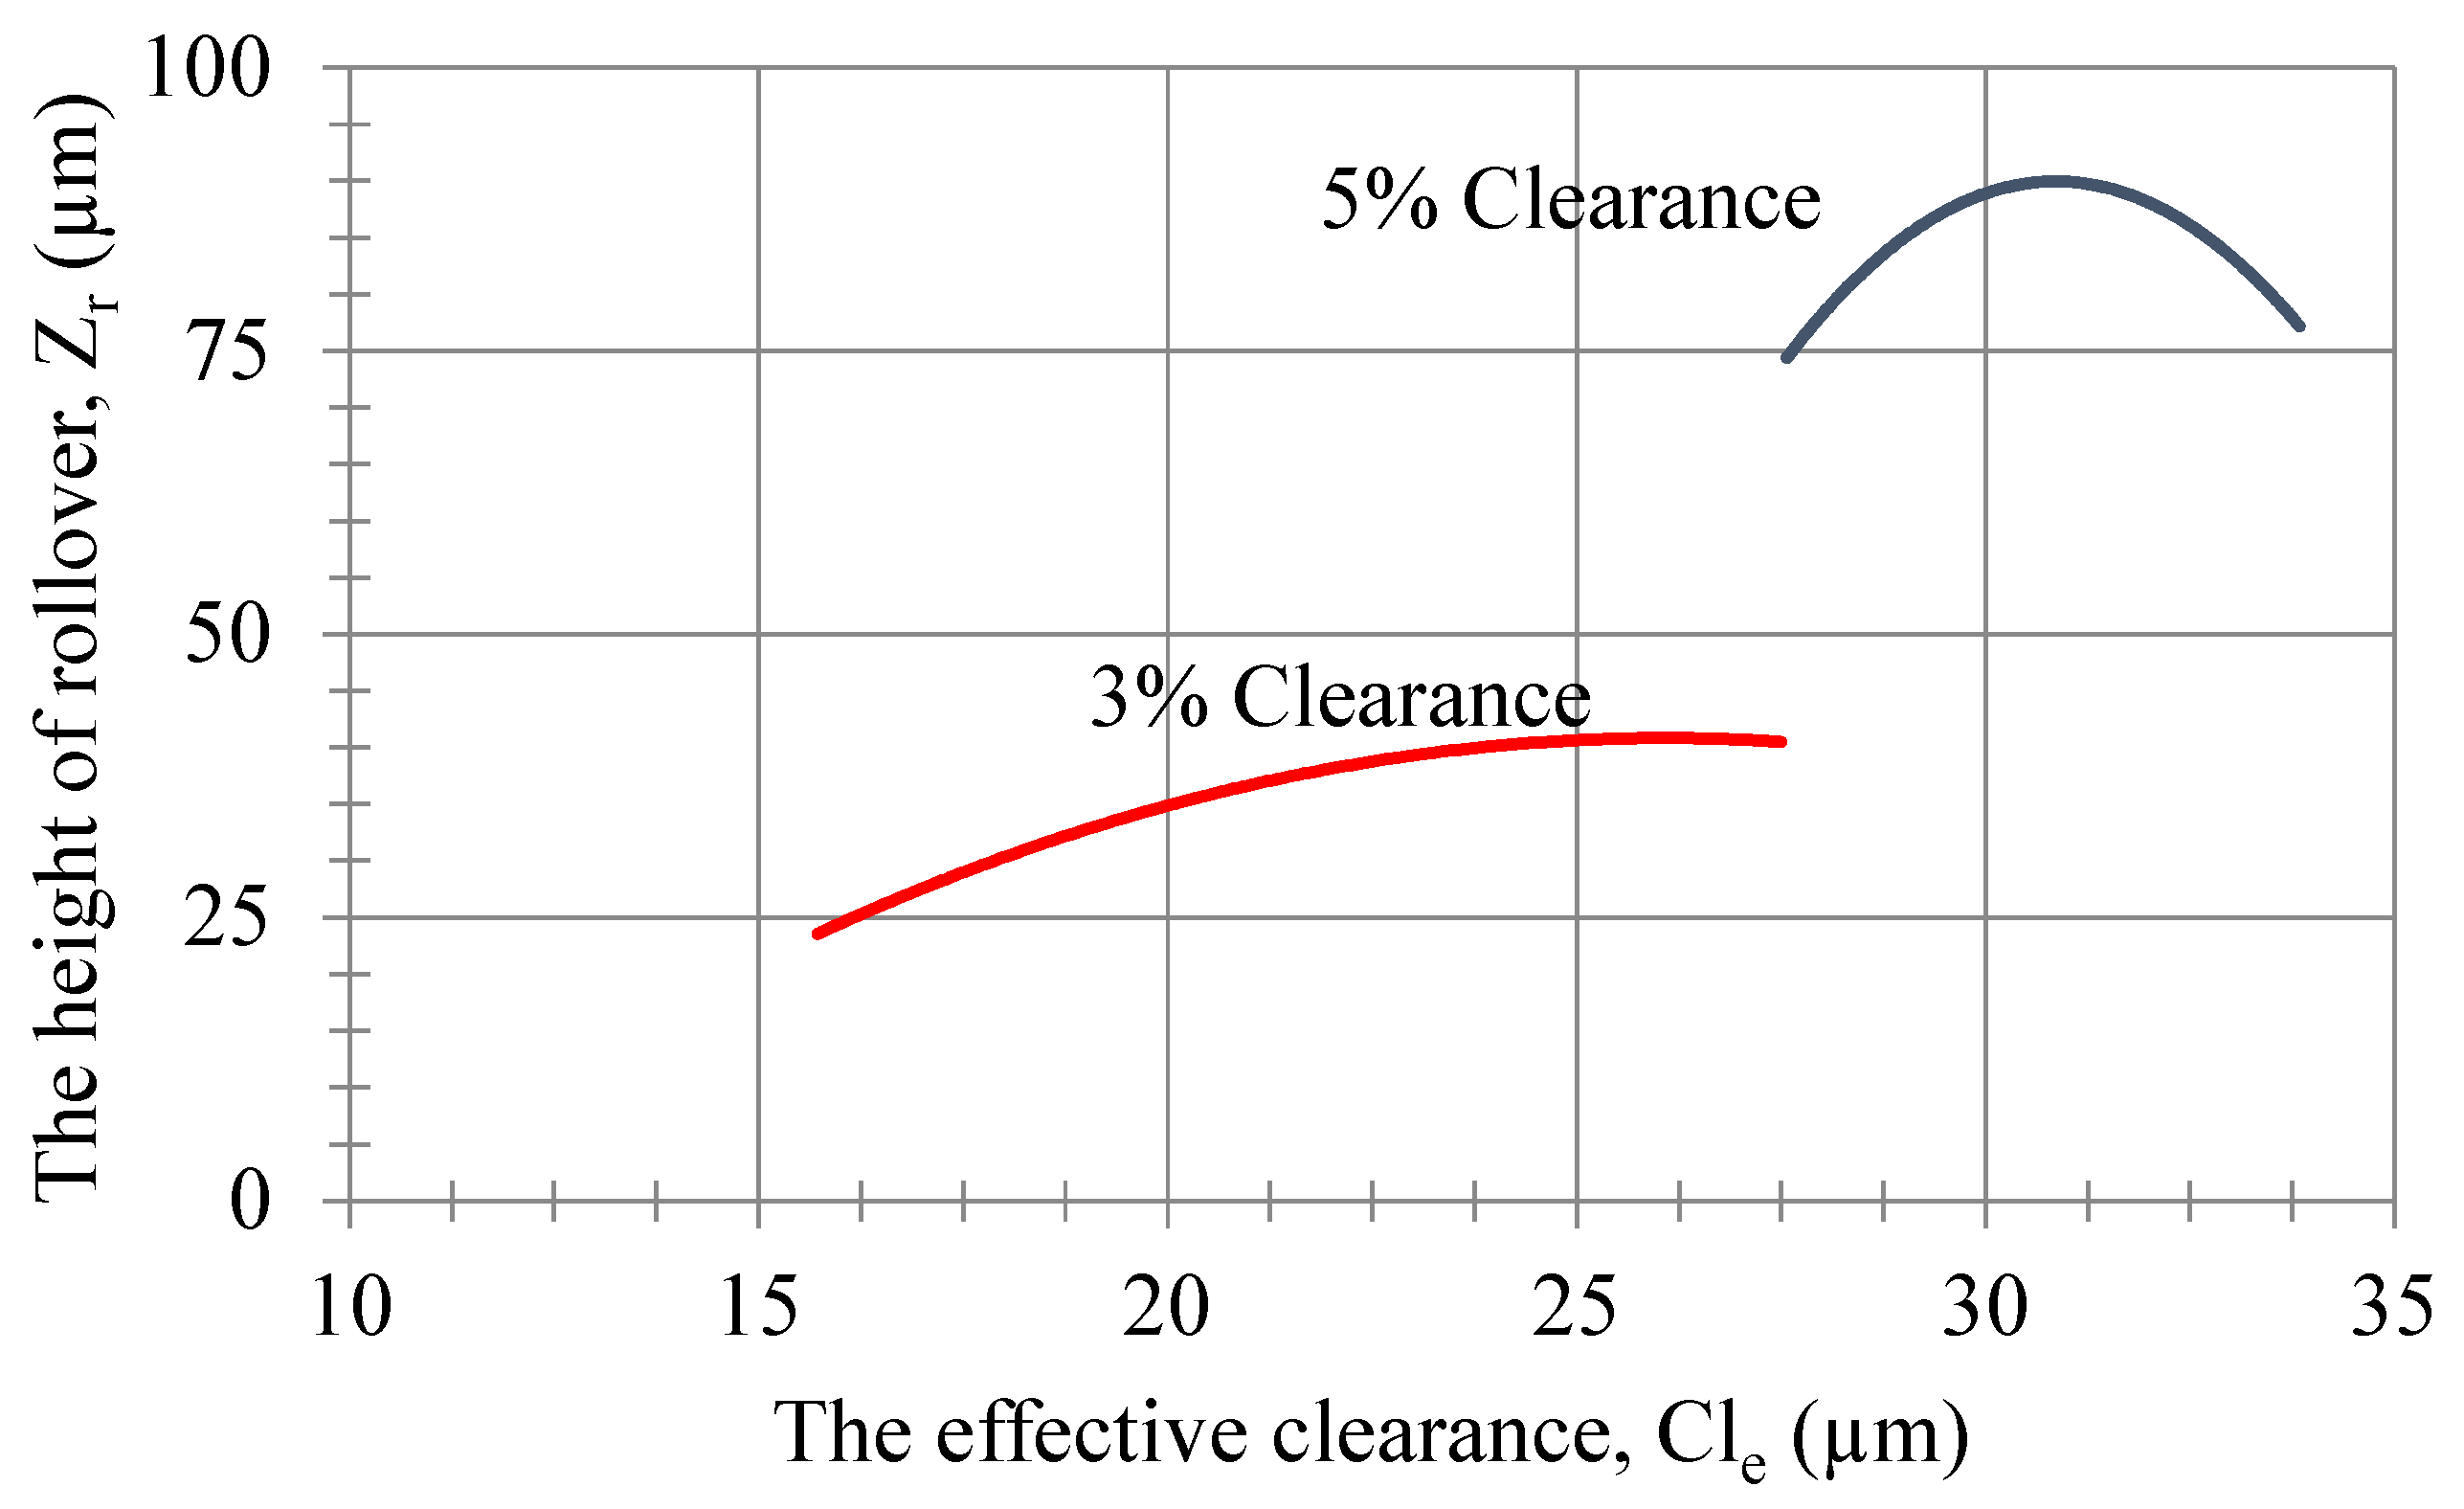
The height of rollover of the blanked piece with respect to the effective clearance is shown in
Figure 19. Accordingly, 5 samples were taken for every 1000 prints in the first 1000 prints, 5 samples were taken for every 2000 prints between 10,000 to 26,000 prints, and 5 samples were taken for every 5000 prints after 26,000 to 50,000 prints.
The rollover measure value can be calculated according to the number of prints using the equations, as shown in
Figure 19. It can be written as a function of the height of rollover of the blanked piece, with the following equation, depending on the value of the effective clearance for the 5% and 3% clearances:
and
The variation in the rollover of the blanked piece with respect to the punch–die clearance is shown in
Figure 20. A Zeiss smartproof 5 and a Coord3 EOS 5.4.4 CMM were used as measuring devices to read the rollover height. The rolling-effective clearance curve of a complex-shaped part with sharp corners and the rollover-effective clearance curve of circular cross-section parts vary depending on the thickness and diameter of the cut part. The rollover curve of a blanked part with a 16 mm wide punch with a 5% clearance is similar to the rollover curve of a 1 mm thick, 6 mm diameter part with an 11% clearance. It can be seen in
Figure 20 that the wear value (
) in the clearance increases by 2%. It can be written as a function of the height of rollover of the blanked piece with the following equation, depending on the value of the effective clearance for the 5% and 3% clearances:
and
In sheet metal parts, the bright shear zone decreases as the punch–die clearance increases; at the same time, the amount of rollover rises with increasing clearance. The findings of the Gurson damage model show that larger clearance expands the void volume and plastic deformation regions within the material, which in turn reduces the bright shear zone and increases rollover on the cut surface. These predictions from the model are in full agreement with the experimental findings. Therefore, the Gurson model provides a reliable theoretical framework to explain both the increase in effective clearance as wear progresses and the associated changes in cutting surface quality.
According to the Gurson damage model, the shear zone (bright region) height of the cut sheet narrows as punch–die clearance increases. At 3% clearance, plastic deformation lasts longer, and the shear zone is measured at approximately 0.15–0.20 mm, whereas at 5% clearance, fracture initiates earlier, reducing the shear zone to 0.10–0.12 mm. This finding is consistent with both the experimental results and the Gurson model predictions regarding void growth and damage accumulation.
4.7. Sheet Thickness Change in the Blanked Parts
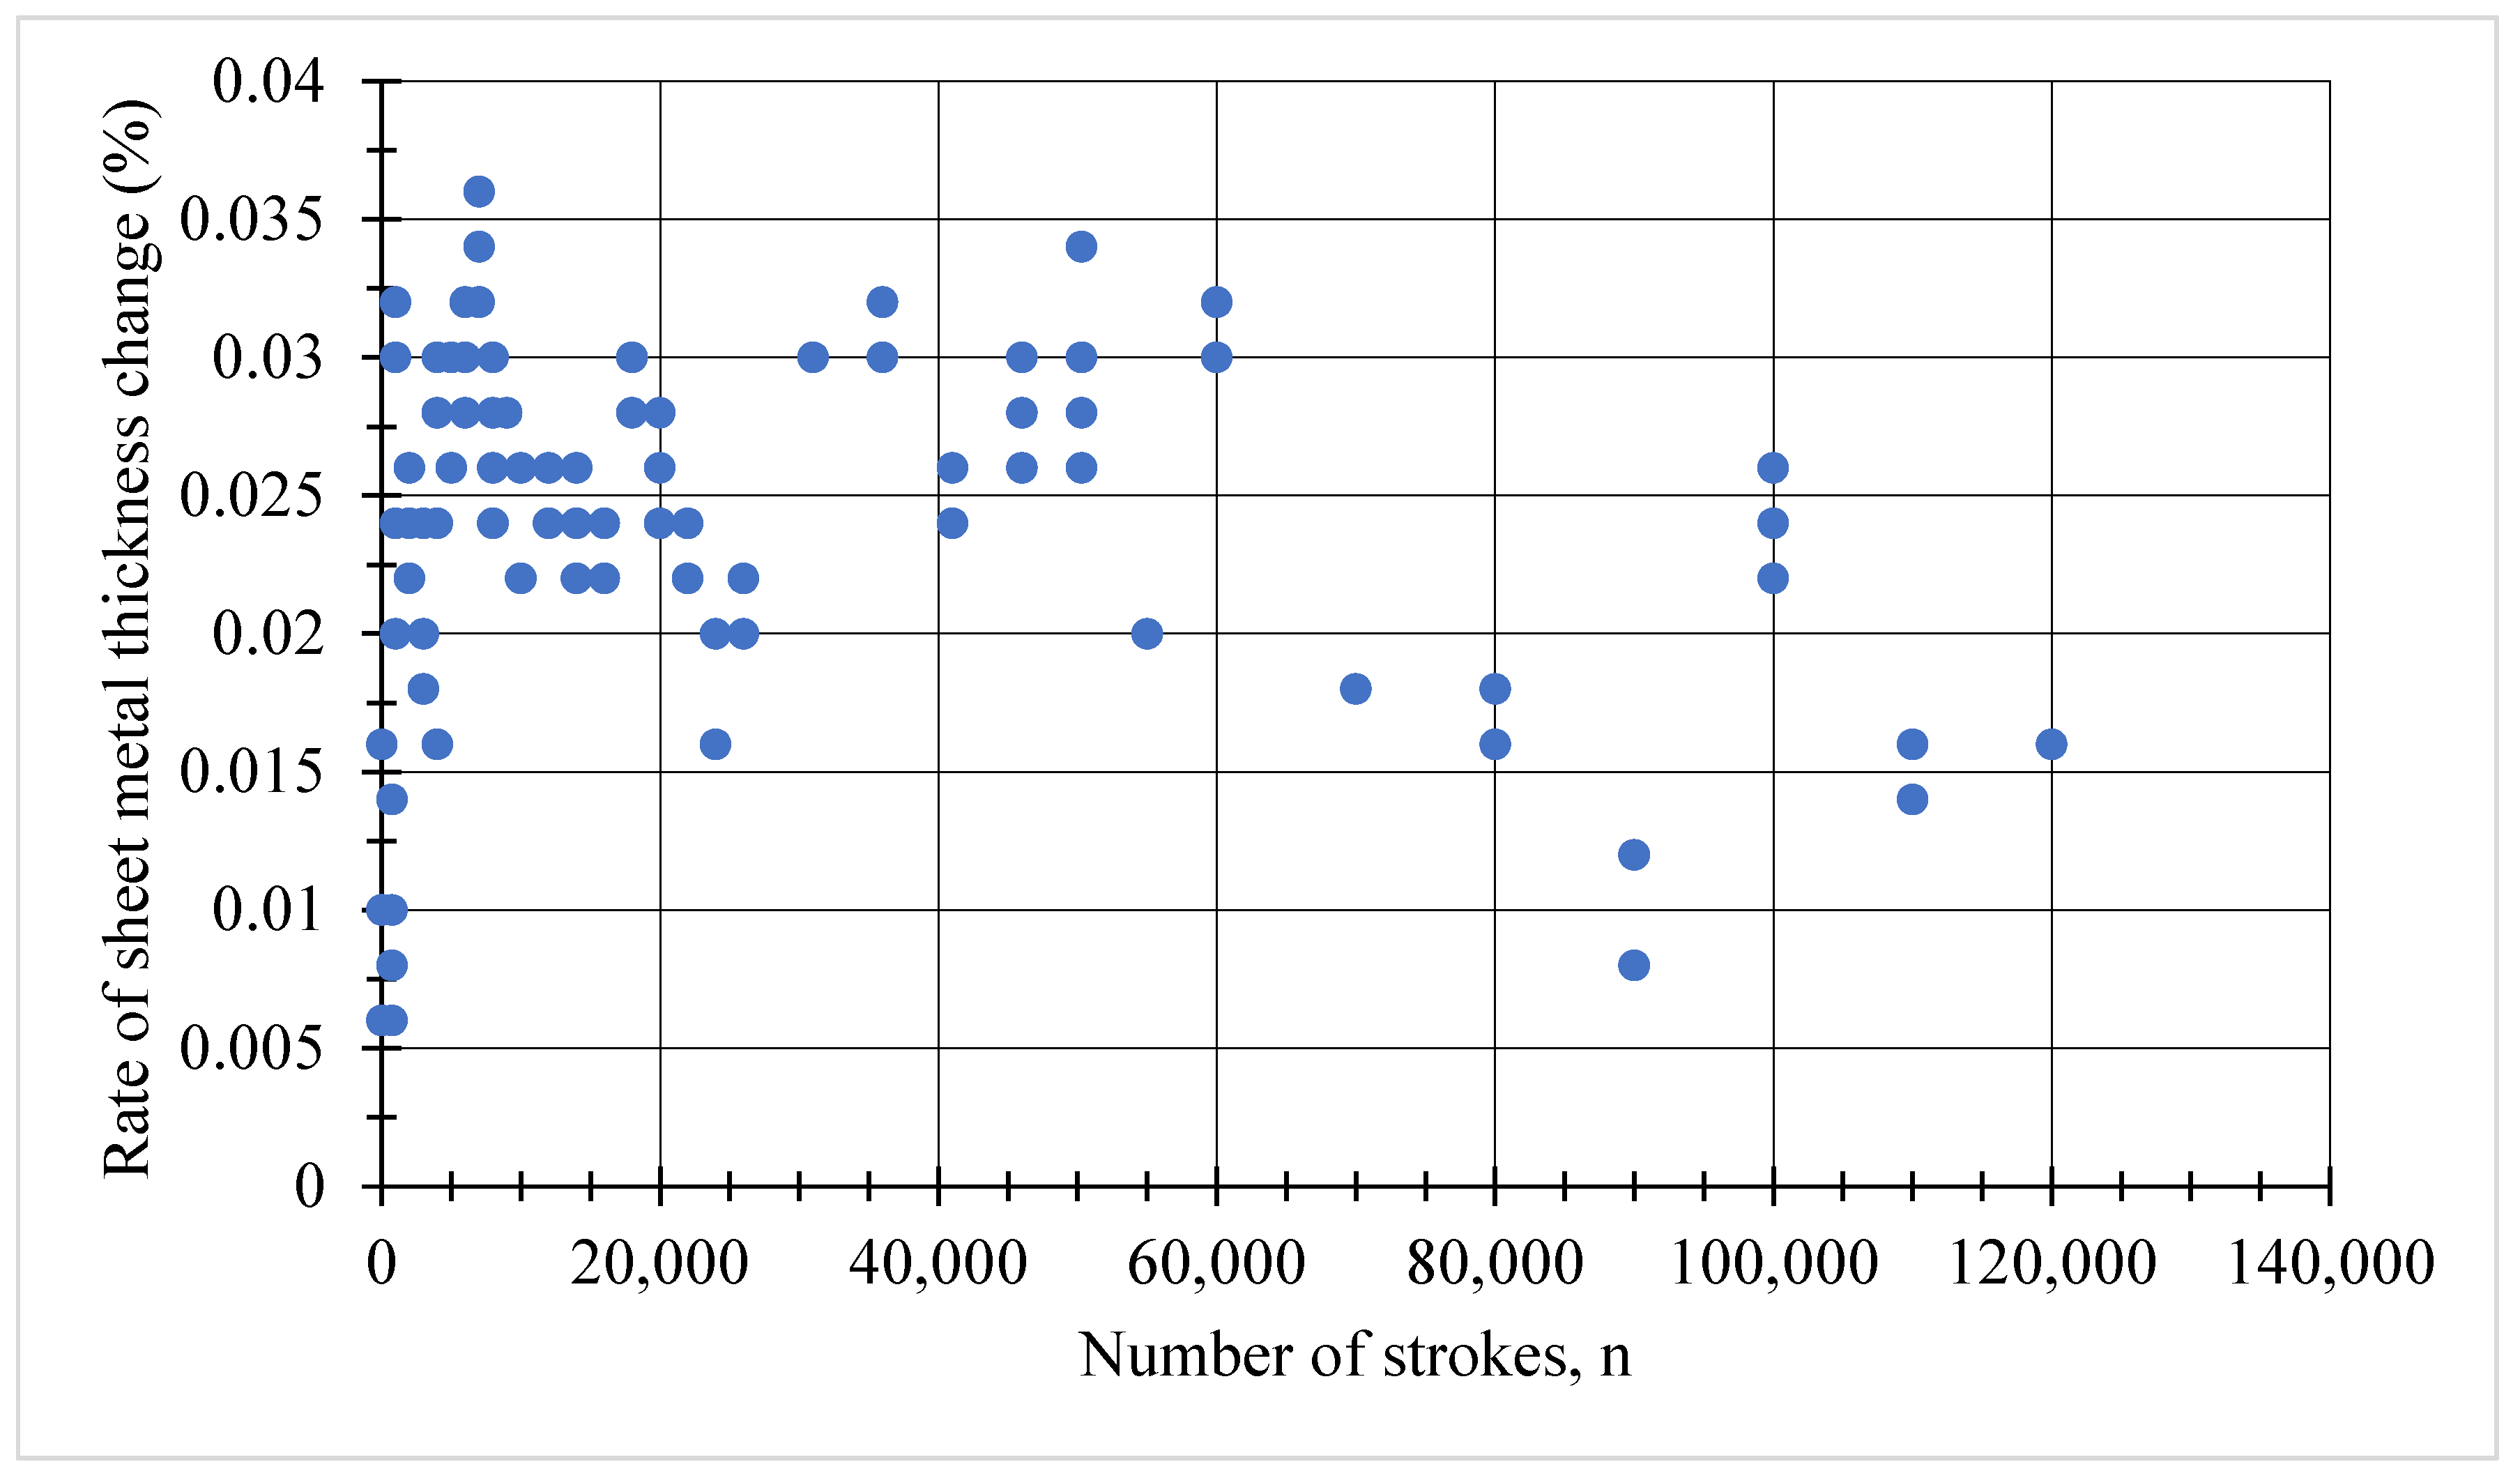
The blanked part thickness is selected as 0.50 mm according to the EN 10202-2001 (from Ereğli Demir Çelik fabrikaları A.Ş, Zonguldak, Türkiye, in 2020) standard for the single-rolled tin-coated coil sheet, and the sheet thickness varies between 0.497 mm and 0.482 mm. It was observed that the selected sheet thickness varies between a maximum of 3.7% and 0.6% from the given measurement. On the other hand, the variation in sheet thickness shows that the die–punch clearance is larger than calculated. The amount of void is greater than 5% and the blanking die opening varies between 5.18% and 5.03% depending on the original punch and die size, and depending on the thickness of the sheet metal. The rate of change of the 0.50 mm sheet thickness with respect to the number of strokes is depicted in
Figure 21. An Insize 3109-25A digital micrometer (Insize Co., Ltd., Suzhou, China) was used as the measuring device.
Punch–die clearance with 5% Cle clearance varies between 5.18% and 5.03% depending on the initial punch and die size, and depending on the thickness of the sheet metal. According to the measured sheet thickness for the 3% clearance value, the clearance value is between 3.015% and 3.18%.
It can be written as a function of the amount of change in sheet metal thickness with the following equation, depending on the number of strokes, as follows:
It can also be expressed as a function of the rate of change of sheet metal thickness with the following equation, depending on the number of strokes, as follows:
4.8. Burr Height
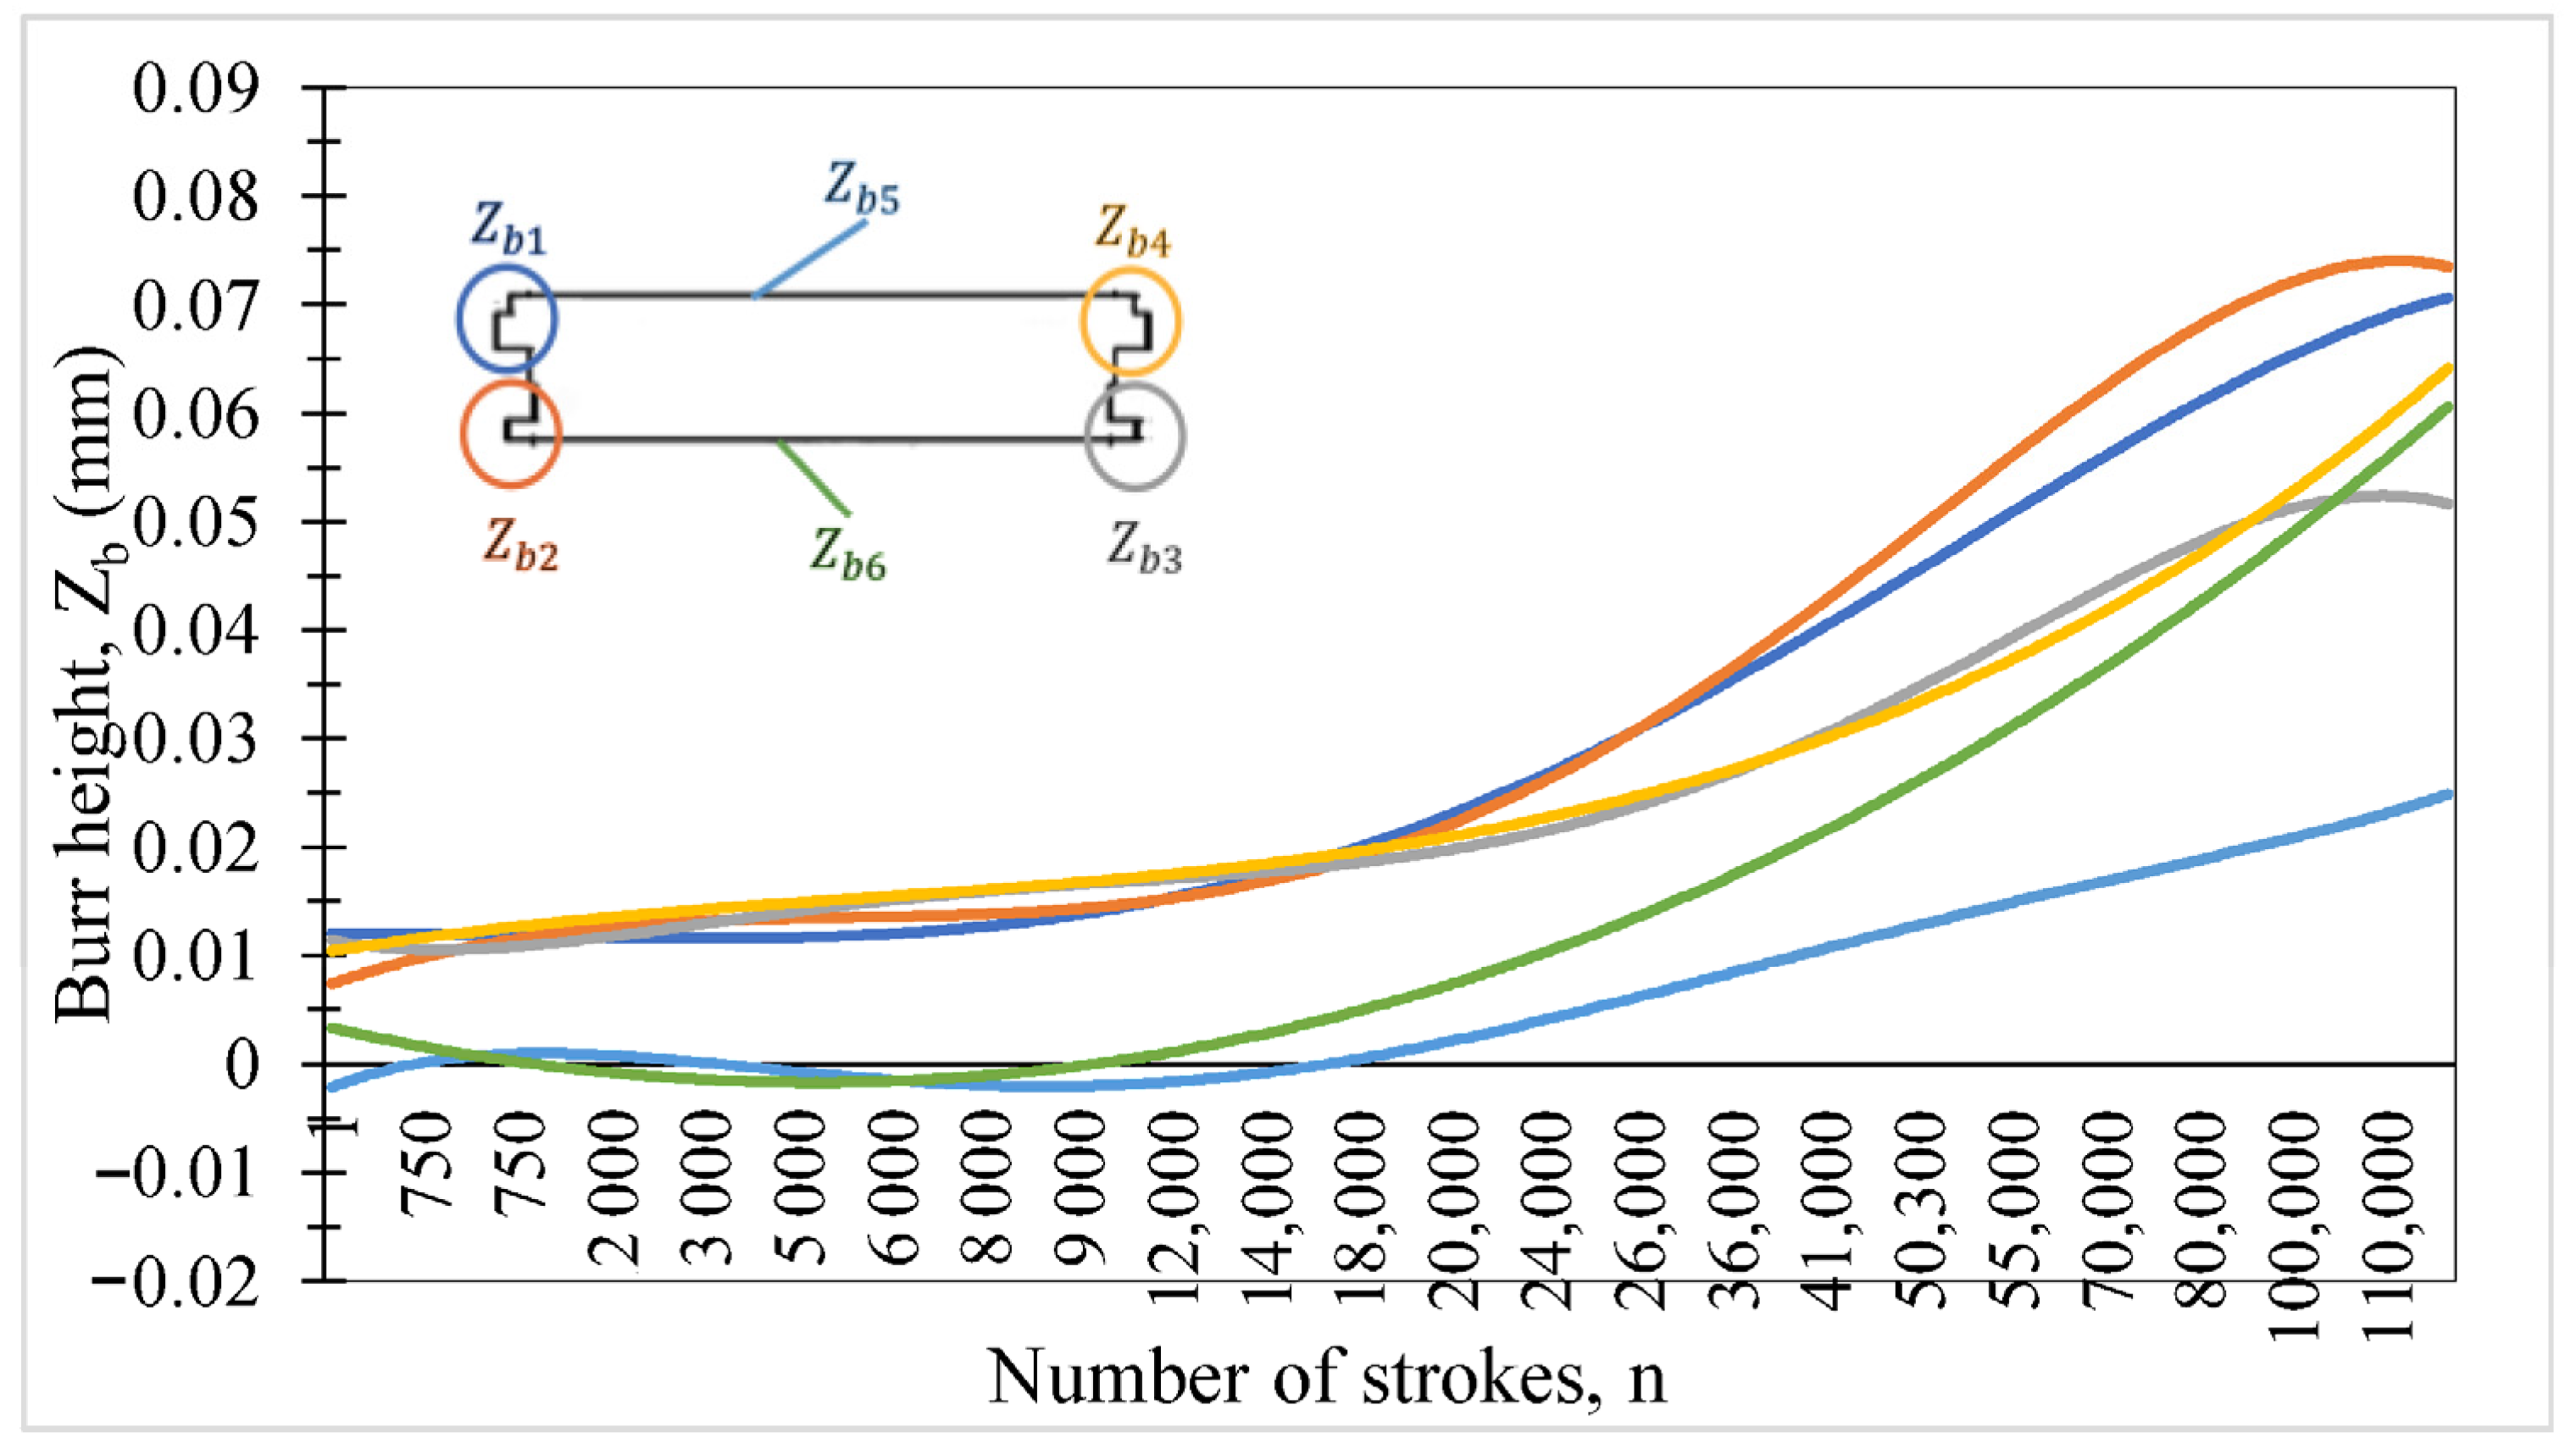
The values of burr heights change according to the number of strokes in six different regions, including the flat surfaces and corners, as shown in
Figure 22. In fact, region 1 and region 2 are symmetrical with region 4 and region 3, and region 5 and region 6 are similar to each other, although the burr heights in each region are different. While the highest burr height occurs in region 2, the lowest burr height occurs in region 5. The burr heights of region 5 and region 6 are similar up to 25,000 prints; however, afterwards, the values of regions 5 and 6 separate from each other. It is a fact that burr heights on sharp corners are higher than on flat surfaces.
It is clearly seen that up to 25,000 strokes, the burr heights show little change horizontally, as shown in
Figure 23. Burr height was measured with an INSIZE 3109-25A digital micrometer, while cutting surface features (rollover, shear, fracture, fracture angle, roughness) were analyzed using a Zeiss Smartproof 5 confocal laser microscope and MountainsLab Premium V11 software. Die and punch sidewall wear was measured with a COORD3 EOS 5.4.4 CMM at 750, 10,000, 26,000, 50,000, and 120,000 strokes at depths of 0.20 mm and 1.5 mm. Using the plot diagram given in
Figure 23, the burr height as a function of the number of prints could be written as follows:
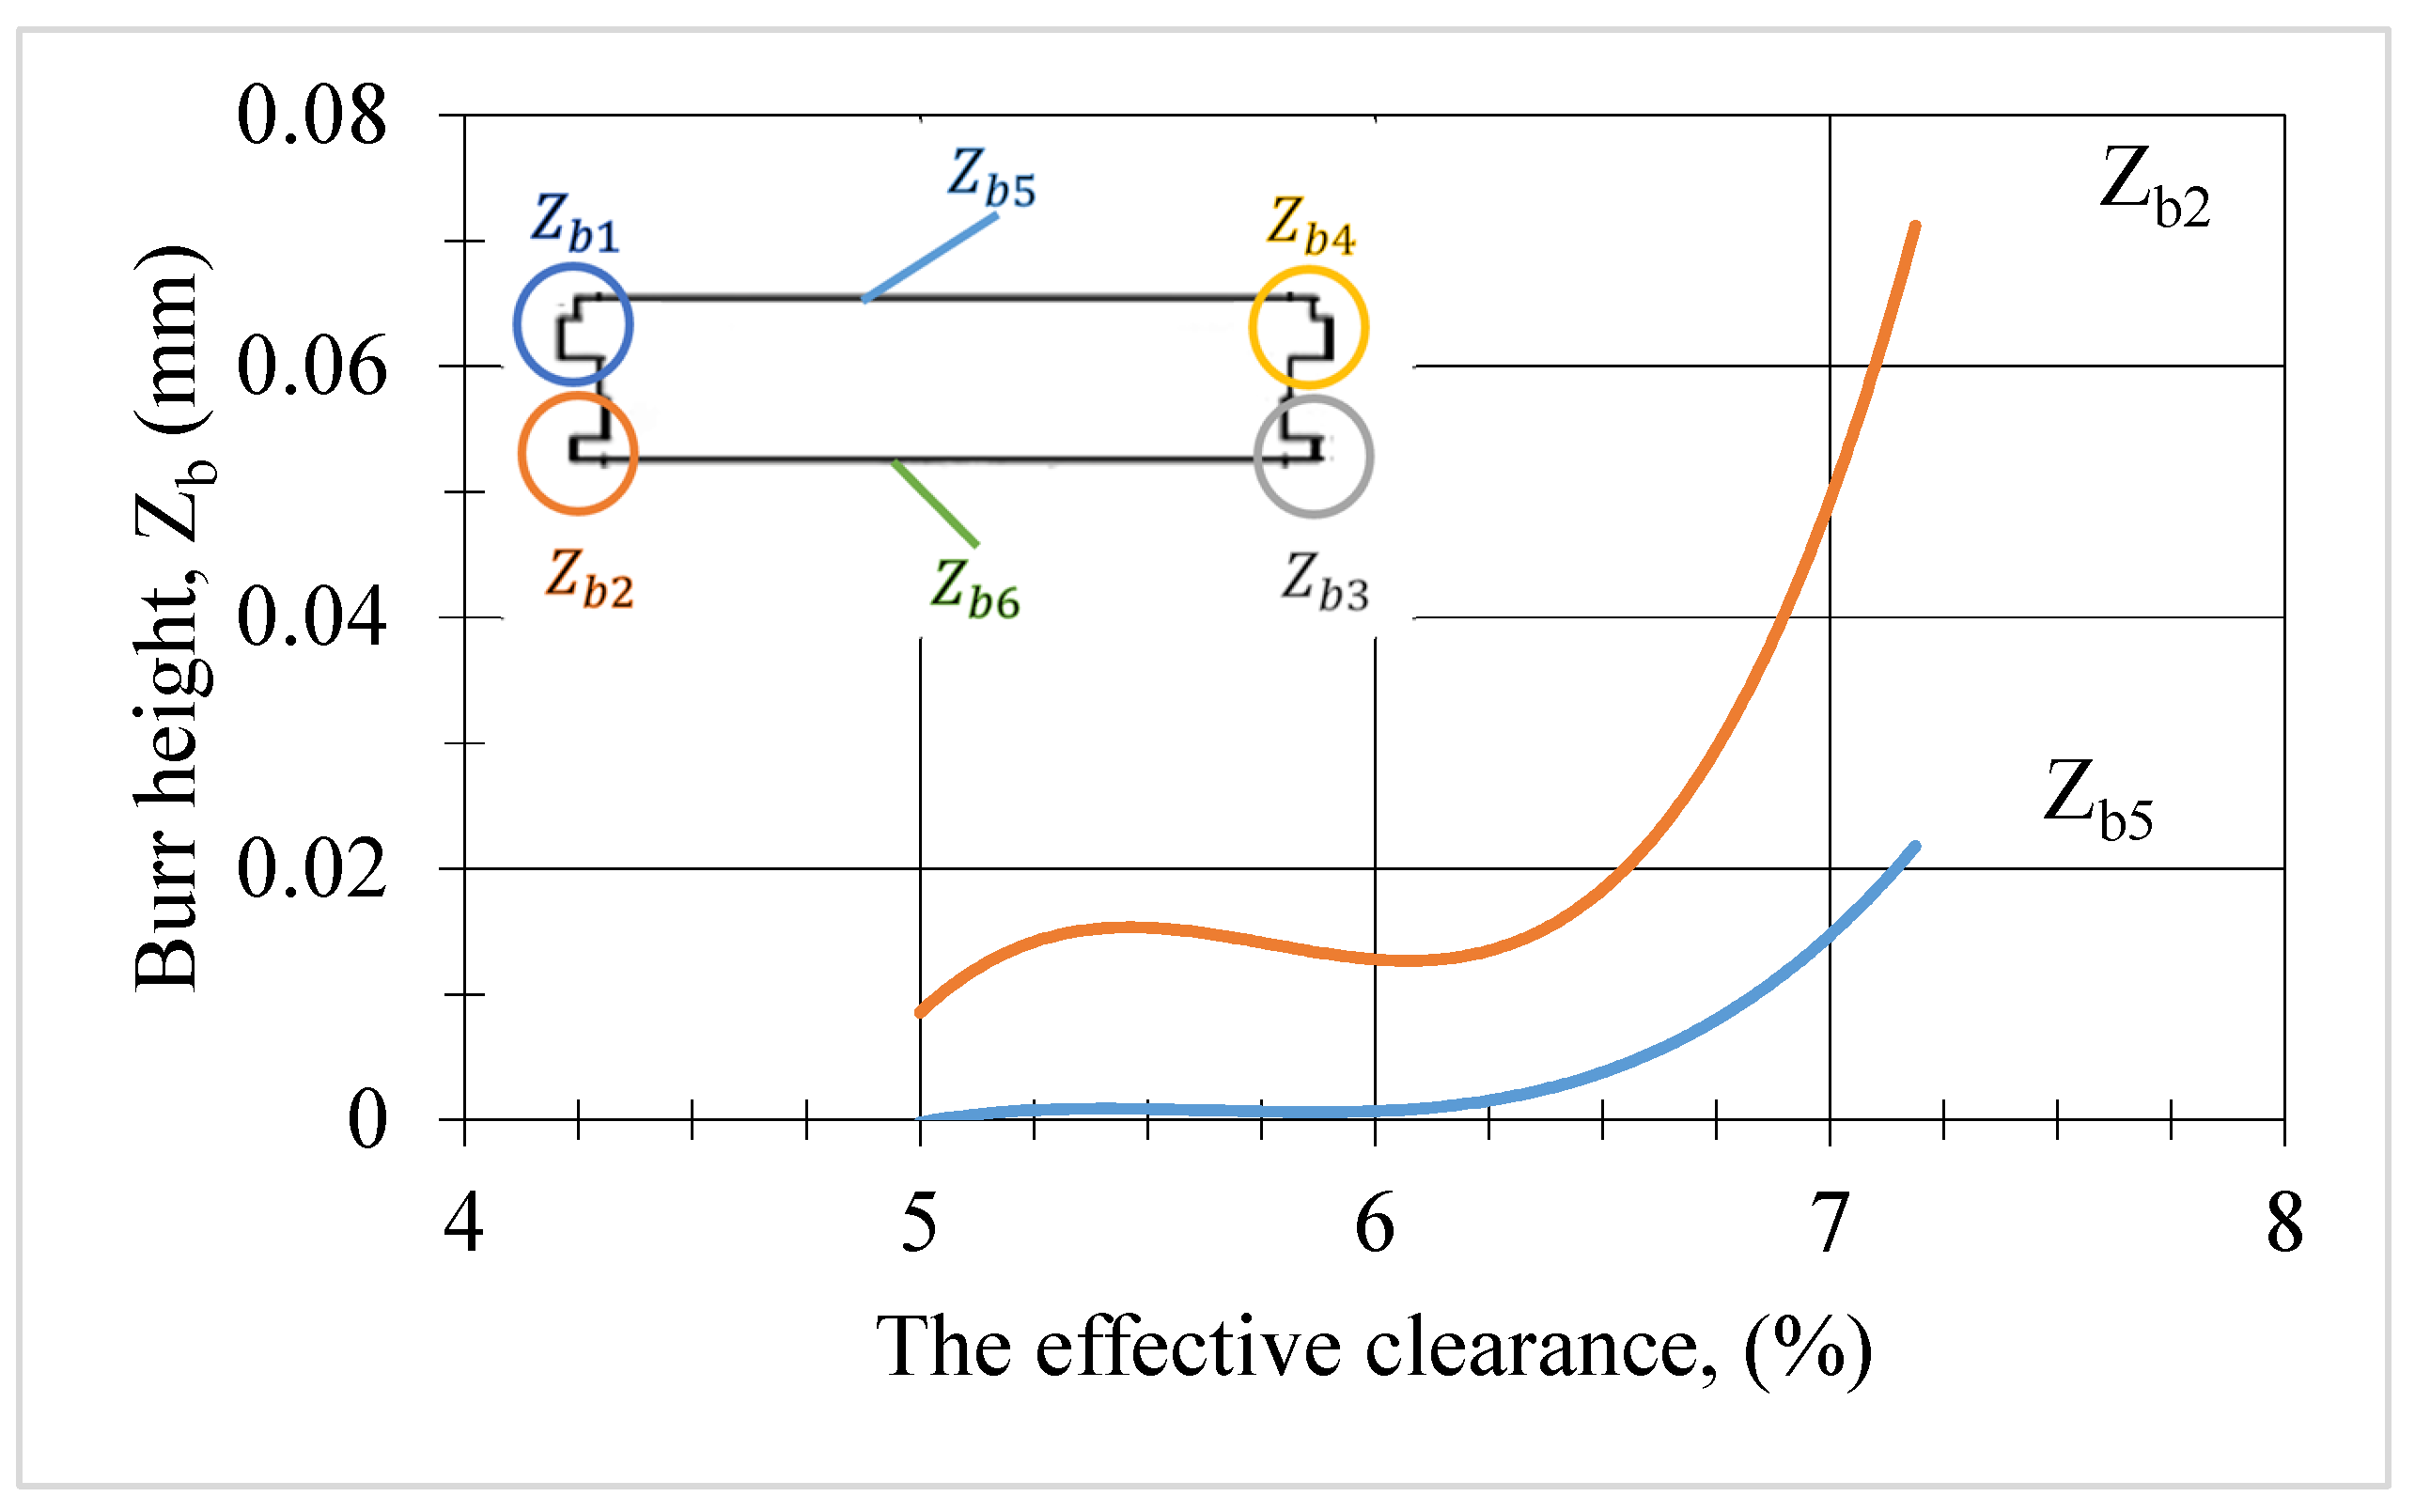
The relationship graph between the highest burr height,
, the lowest,
, and the effective clearance is shown in
Figure 24. The difference in burr height between the flat surface and the sharp corner in region 2 can be seen in region 5. Using the plot diagram given in
Figure 24, the burr height as a function of the clearance value between the punch and die can be written as follows:
and
Based on the experimental results, although the burrs formed on the sheet metal part on the cutting edge on the flat surface are the same in regions 5 and 6, there are large differences between the burr heights. As the number of prints increased, the tip rolling angles of the punch and die, and the die circumference increased, while the punch circumference decreased. However, since the wear in the corners and the radii formed by the tip angles are larger, the clearance values in the corners increased more than in the flat parts. The differences between burr heights were measured in the same piece after 120,000 prints, while the burr height was 0.025 mm in region 5 and 0.077 mm in region 2.
At the 26,000th stroke, the burr height exceeded the critical threshold, with 0.089 mm in region 1 and 0.078 mm in region 2, surpassing the maximum allowable limit of 0.075 mm. The burr threshold criterion is defined as a 0.085 mm burr height in the final product based on industrial experience. This limit is used for quality assurance protocols to prevent damage during assembly operations. Excessive burr formation compromises tolerances and material integrity; therefore, the experiment was terminated once the threshold was exceeded.
4.9. Regression Analysis and Model Justification
Regression analyses were performed for all empirical relationships reported in this study, with coefficients of determination (R2), parameter uncertainties, and residual diagnostics presented. The regression analysis of Equation (9b), modeled as a second-order polynomial, demonstrated an excellent fit (R2 = 0.999) across the range n = 10–50,000 strokes (Ra = 0.11–0.243 µm). Parameter uncertainties and residual diagnostics confirmed the robustness of the model, with residuals small and randomly distributed. Both physical reasoning (nonlinear wear progression with stroke count) and statistical evidence support the quadratic form as the most appropriate representation, outperforming linear and logarithmic alternatives.
As a general result, the experimental findings obtained in this study were quantitatively compared with relevant works in the literature. In evaluating the overall results and the original contribution of this study, and when compared to previous publications, most previous studies focused on circular parts, while investigations involving complex-shaped, thin, soft sheets remain limited. Subramonian et al. [
7] reported that variable clearance extended tool life; in the present study, the die with 5% clearance reached 120,000 strokes, whereas the die with 3% clearance was stopped at 26,000 strokes due to burr height. Hernandez et al. [
32] and Hambli et al. [
30] noted that tool wear increases effective clearance, leading to form errors; in this study, the effective clearance of the 5% die increased to 7.188%. Li and An [
19] and Kovač et al. [
17] supported surface roughness and volumetric wear measurements through image-based monitoring methods; here, confocal laser microscopy revealed a wear volume of 77,571 µm
3 and a maximum depth of 10.69 µm after 50,000 strokes. Lee et al. [
9] and Lenik [
26] emphasized burr height and regional variations; in this study, burr height after 120,000 strokes ranged from 0.025 mm (Region 5) to 0.077 mm (Region 2) on the same part. Collectively, these comparisons demonstrate the strong connection of this work to the literature and highlight its contribution, particularly through high-resolution measurements obtained via laser microscopy.
5. Conclusions
In this study, a methodology was proposed to calculate the volume loss caused by wear on the punch and die front/side surfaces. Three-dimensional surface maps obtained by confocal laser microscopy were analyzed using dedicated software, and the least-squares plane was employed to determine the wear volume. The key findings are summarized as follows:
(1) Rollover of the blanked piece can be calculated as a function of the effective clearance value. Additionally, an equation was generated between the average surface roughness value and the number of strokes.
(2) As clearance increased, the bright shear zone decreased while rollover became more pronounced. Findings of the Gurson damage model indicated that void volume and plastic deformation zones expanded within the material, which was in full agreement with the experimental findings.
(3) It was also observed that wear is higher at sharp corners. Since a C-type eccentric press is used, burr formation may be affected differently due to the difference between the two ends of the cut piece, due to the tension created during pressing
(4) Small variations in initial clearance values were observed depending on sheet thickness (5.03–5.18% for 5% clearance; 3.015–3.18% for 3% clearance). This indicates that the precise fit between die–punch dimensions and sheet thickness directly influences cutting quality.
(5) Taking into account the thickness change of the blanked sheet parts, one can see the variation in the initial clearance value.
(6) Experimental results indicate that punch–die clearance is critical for tool life and cutting quality. Proper adjustment enhances efficiency, reduces maintenance costs, and supports sustainable manufacturing by lowering die consumption and carbon emissions.
The findings of the present work suggest that the die clearance with 5% clearance gave much better results than the 3% clearance for soft sheets of 0.50 mm thickness to minimize tool wear and maximize the clearance value. The findings contribute to a better understanding of the effect of the surface roughness of the cut piece and the change in burr height on sharp corners, radii, and flat surfaces on punch wear.
Within the scope of this study, only dies and punches manufactured from AISI D2 cold-work tool steel were used, and tin-plated sheet material (EN 10202-2001 TS275, single-reduced, 0.50 mm thickness) was processed. The part geometry was complex with sharp corners; the punch width was fixed at 16 mm, production was carried out on a 35-ton C-type eccentric press with pneumatic clutch, and no lubricant was applied during operation. Therefore, the empirical correlations obtained cannot be directly generalized to different sheet thicknesses, material types, press configurations, or punch geometries. Future studies will consider alternative tool materials (e.g., Vanadis 4, CPM10V, AISI D6), coating applications, variable clearance designs, and measurements of cutting forces using strain gauges. In addition, rollover, shearing, fracture, and burr formation regions as functions of stroke count will be examined, and the resulting data will be compared with finite element simulations using Abaqus 6.14, LS-Dyna R15.0.1, and ANSYS 2025 R2.
