1. Introduction
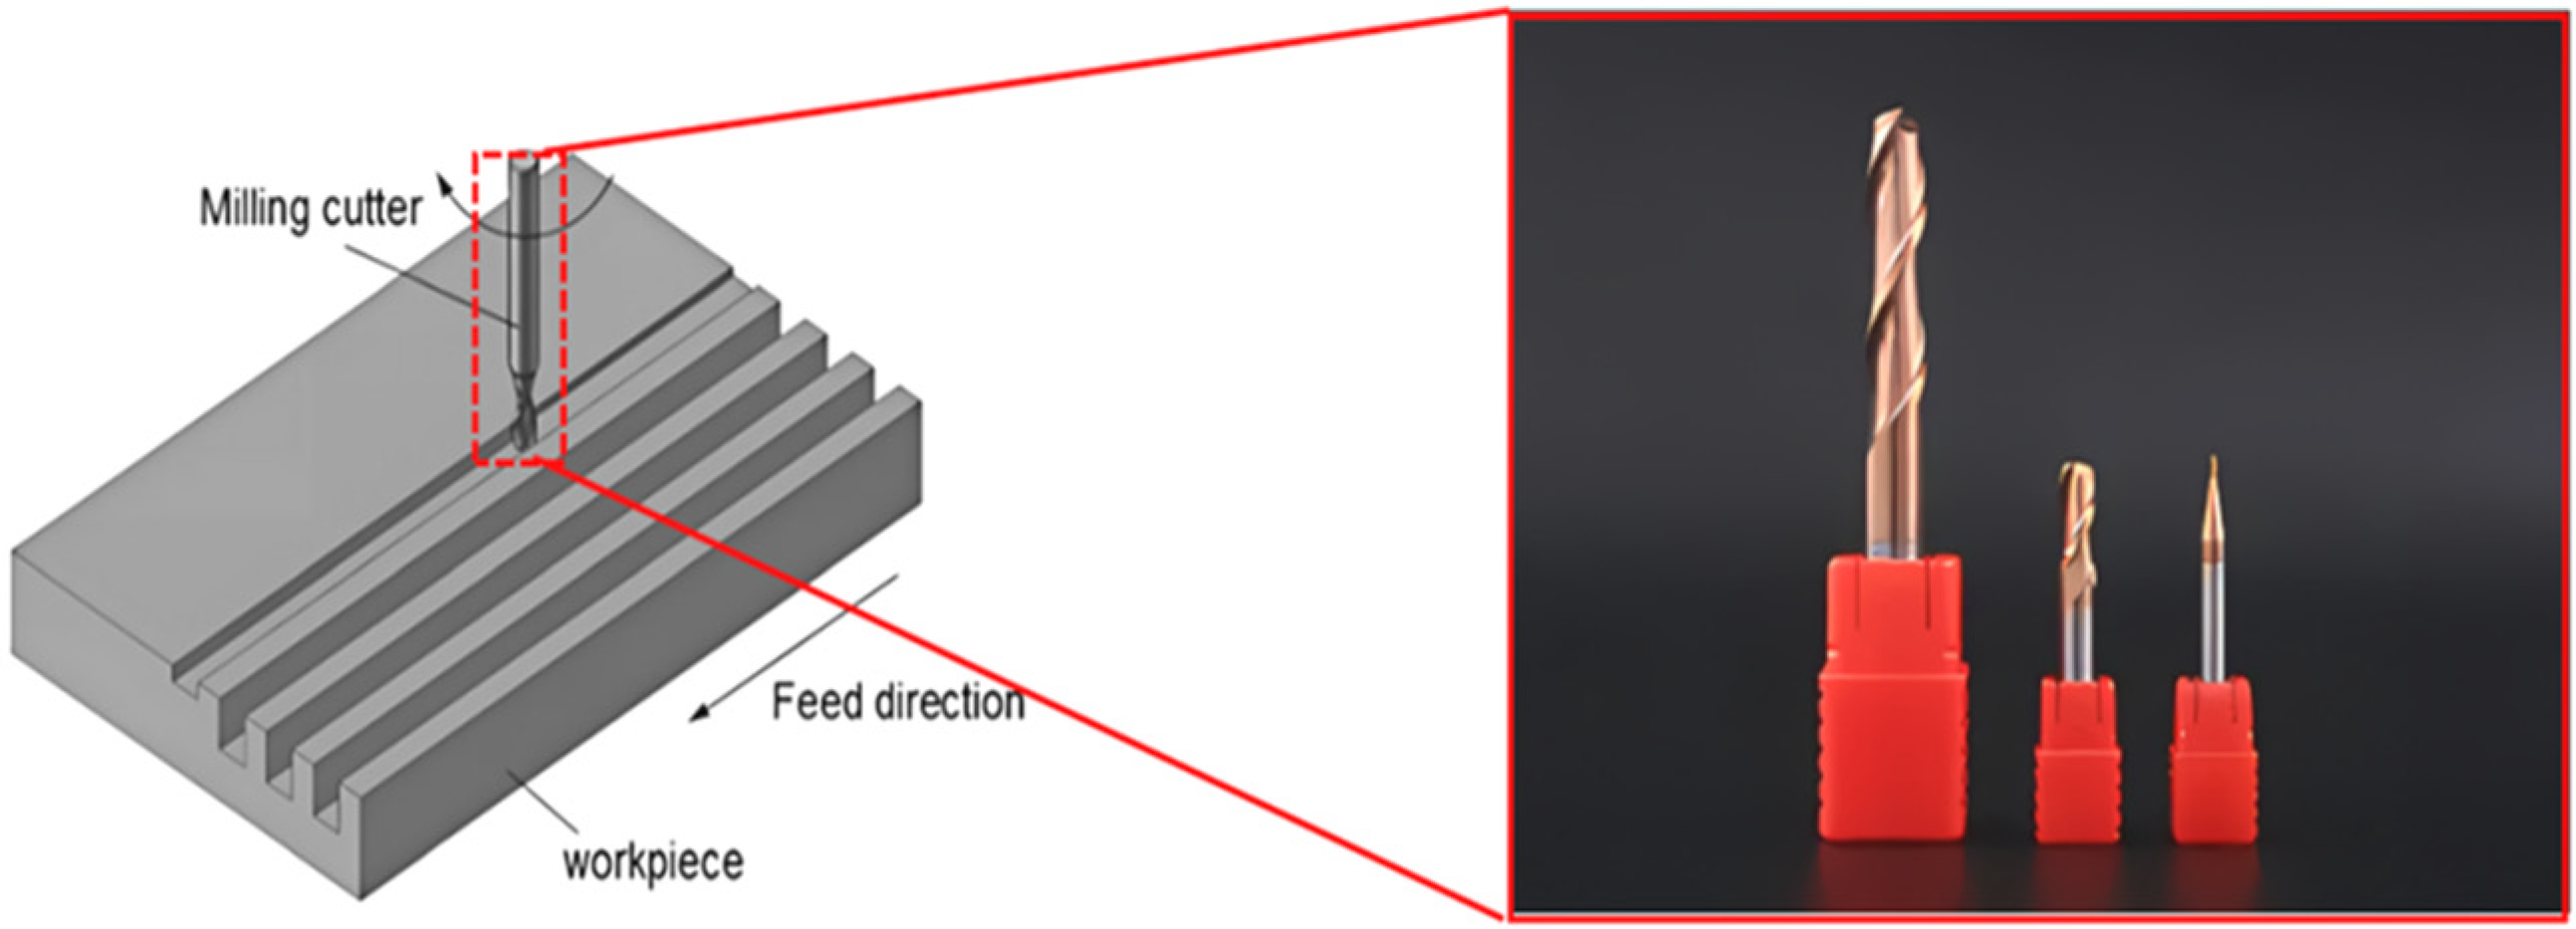
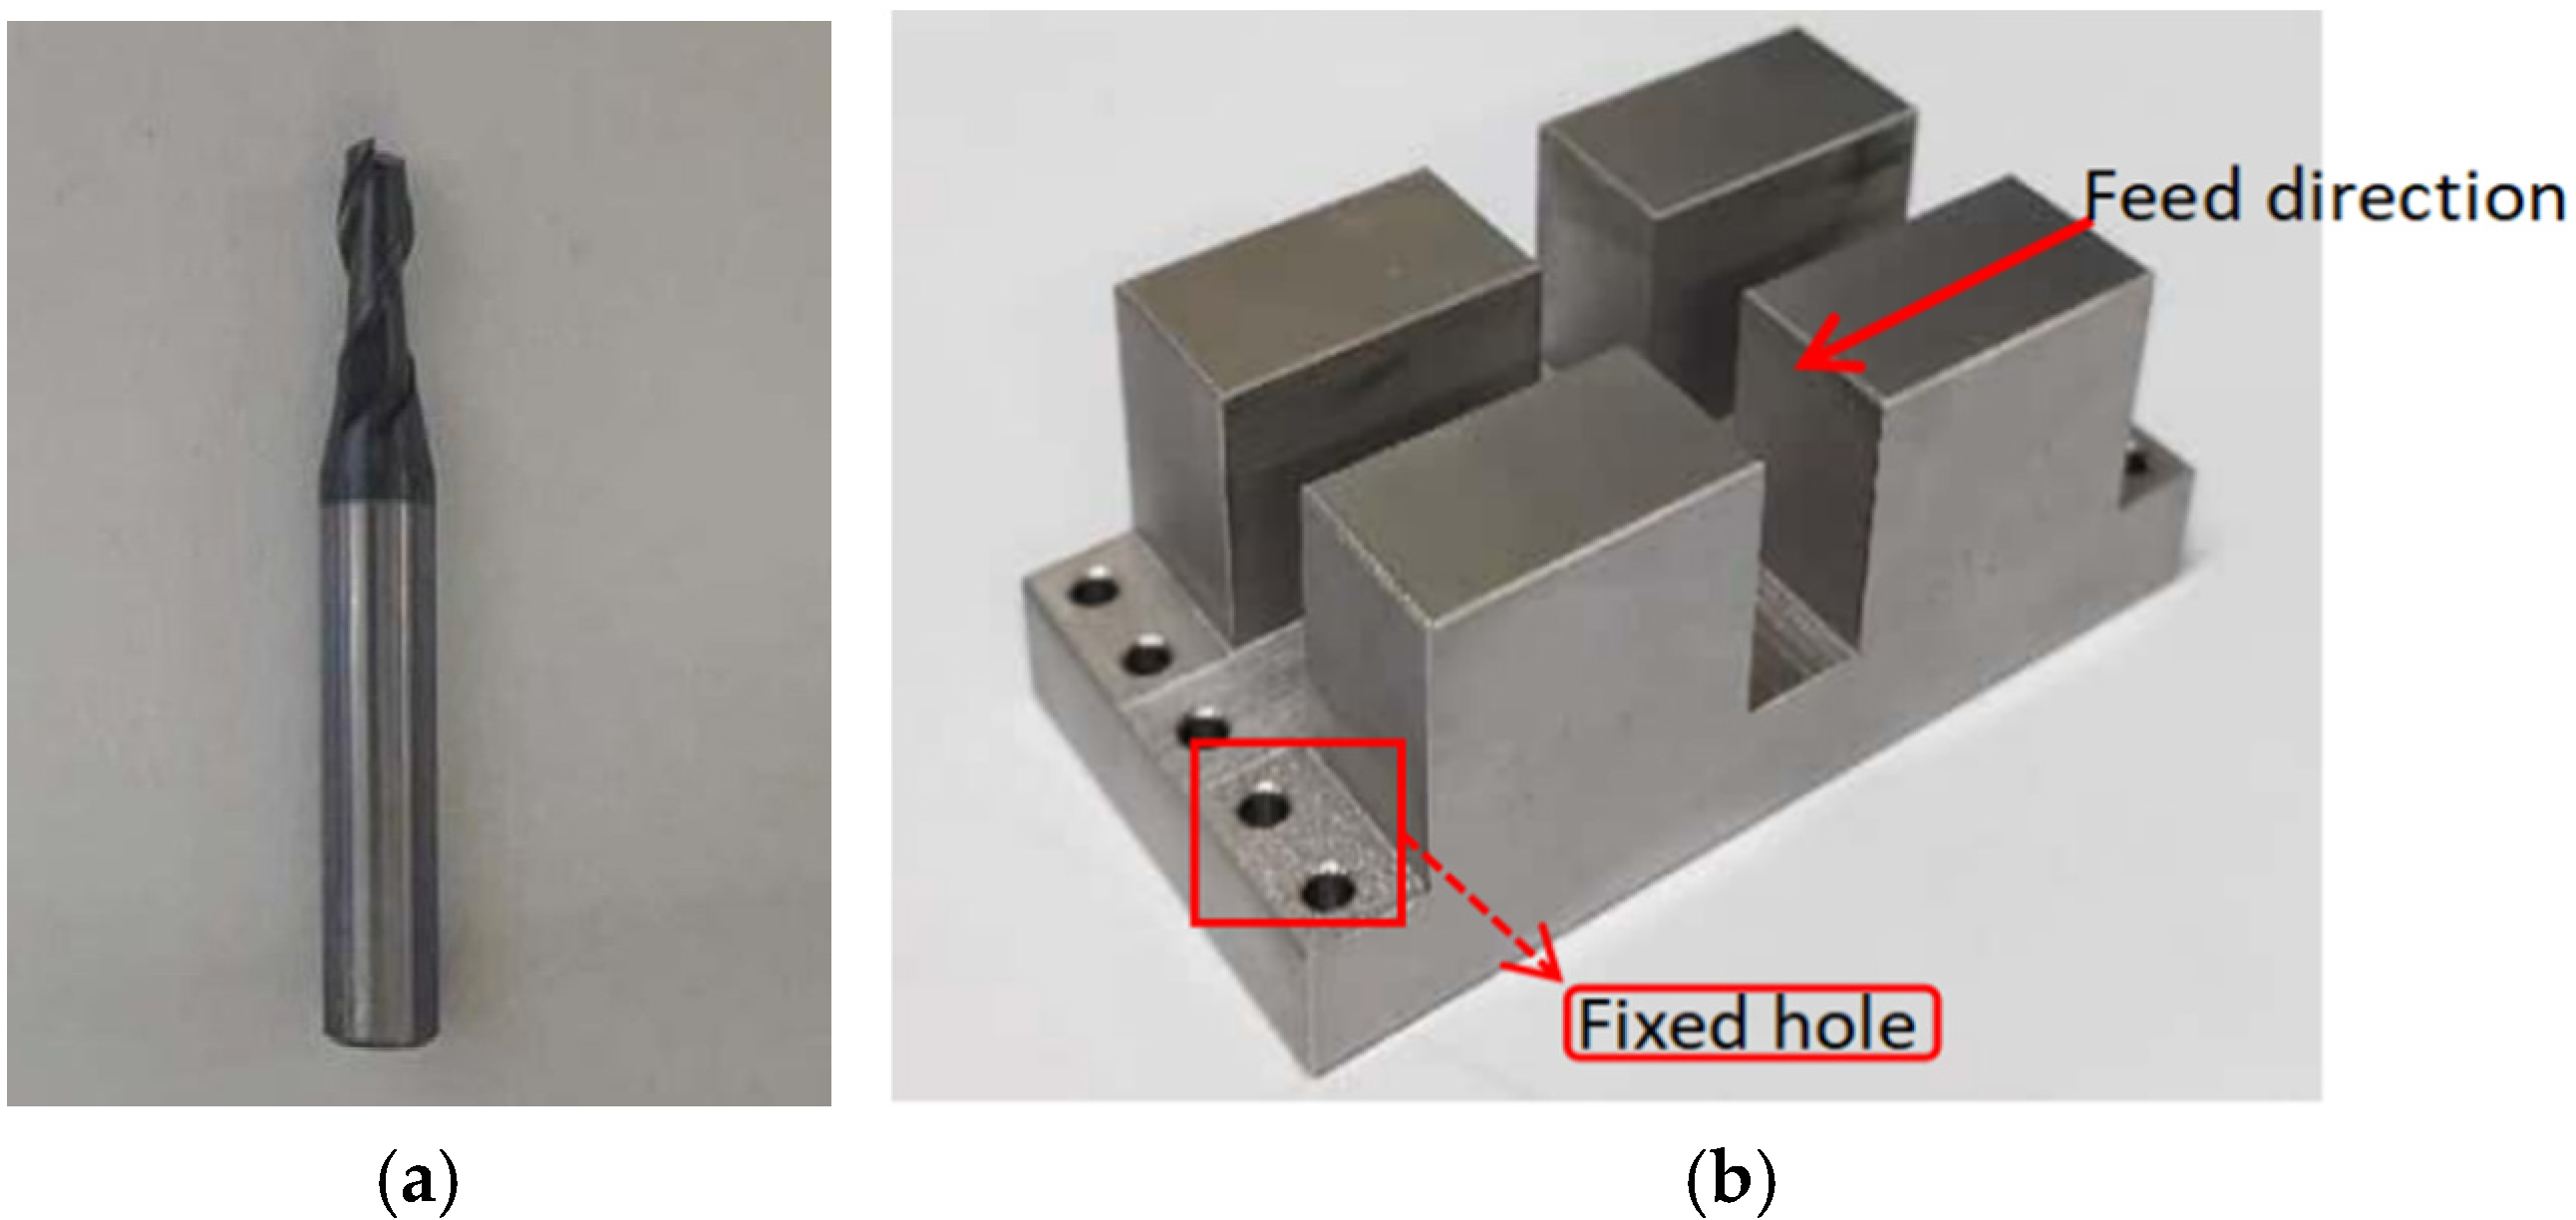
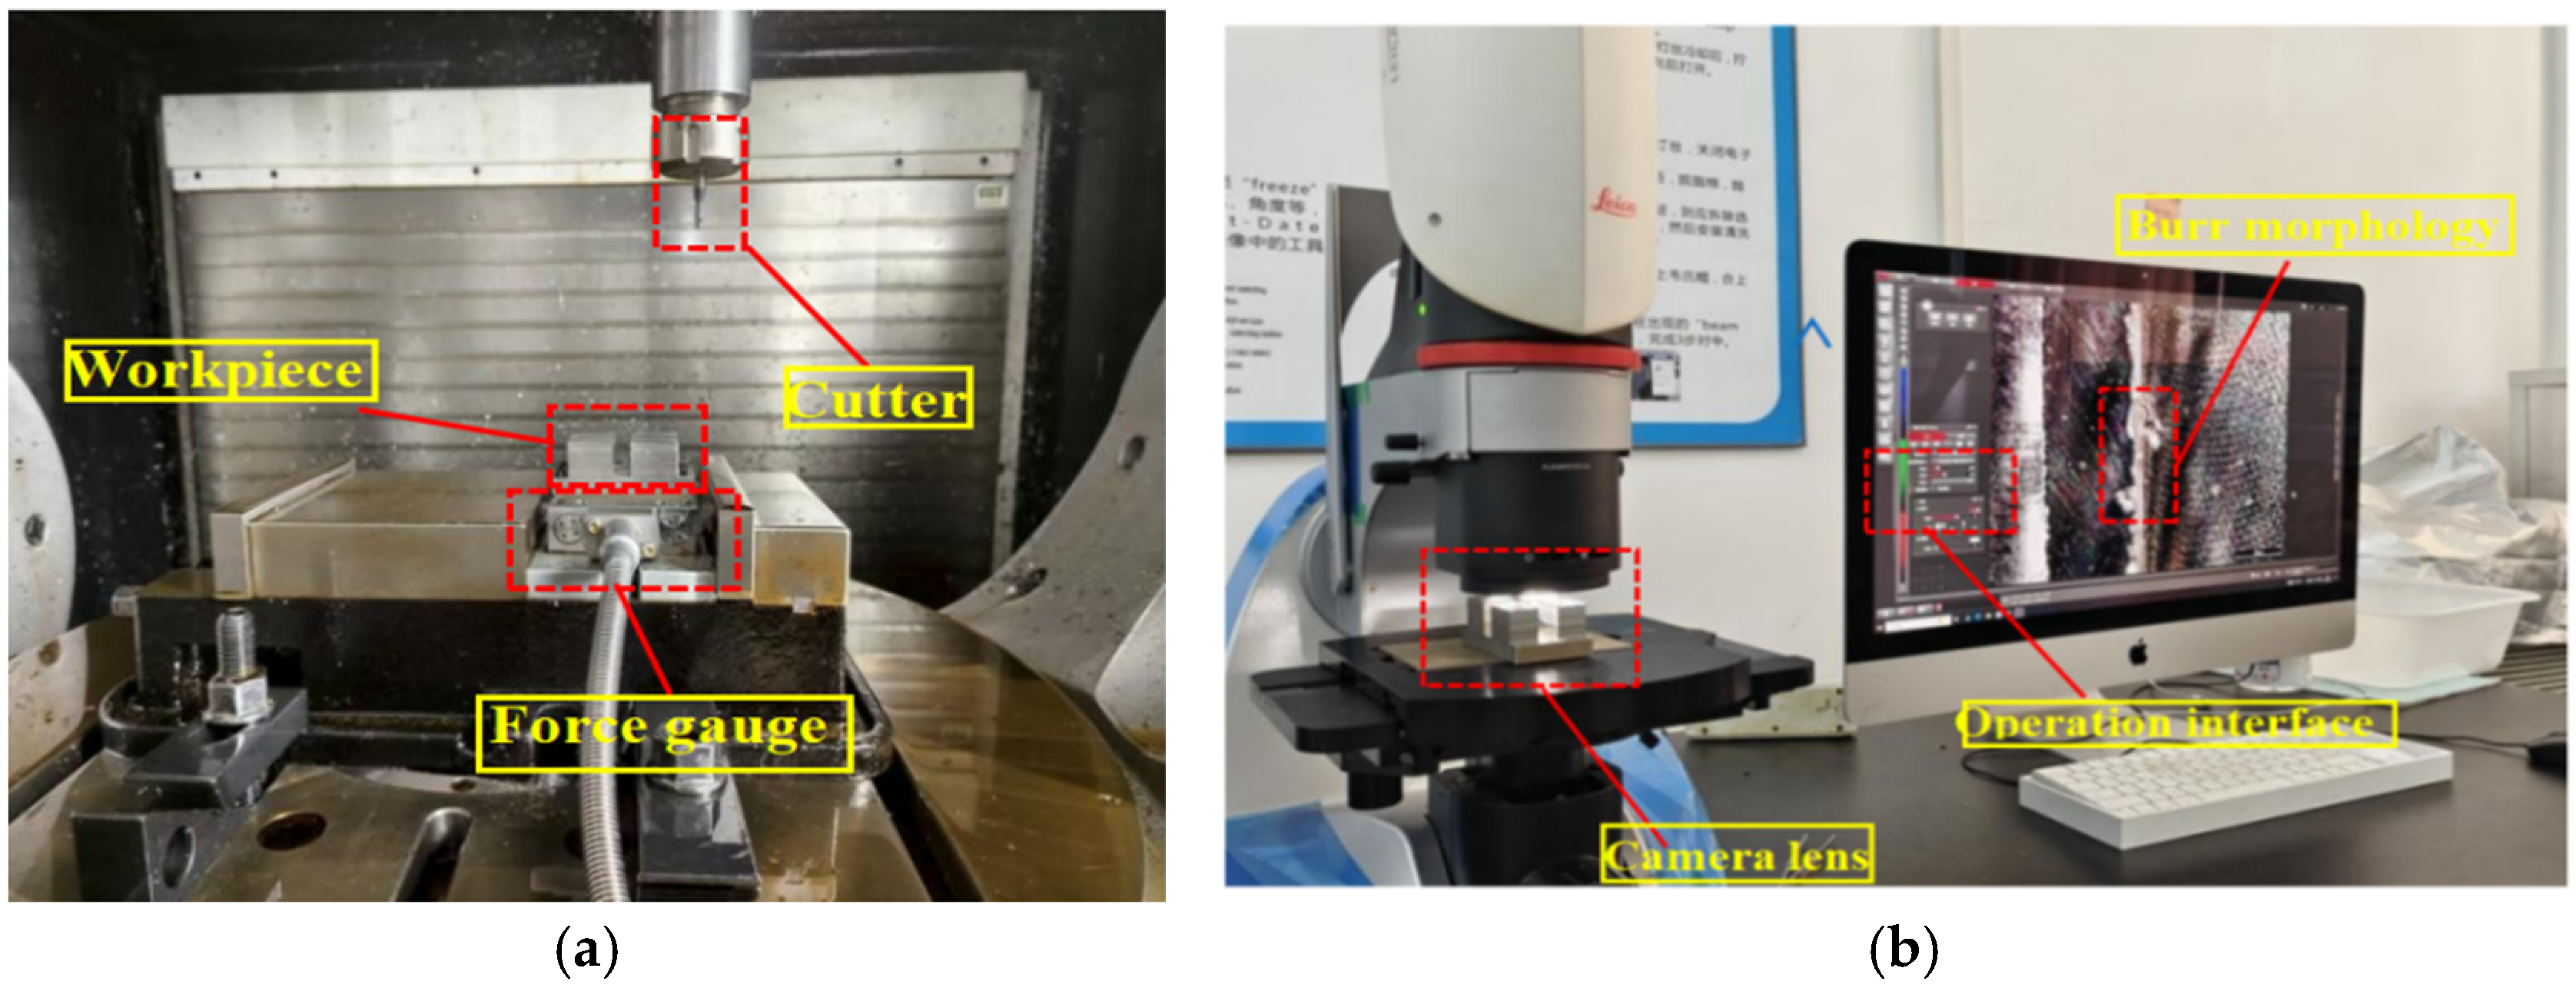
Slot milling represents a fundamental milling operation, as illustrated in
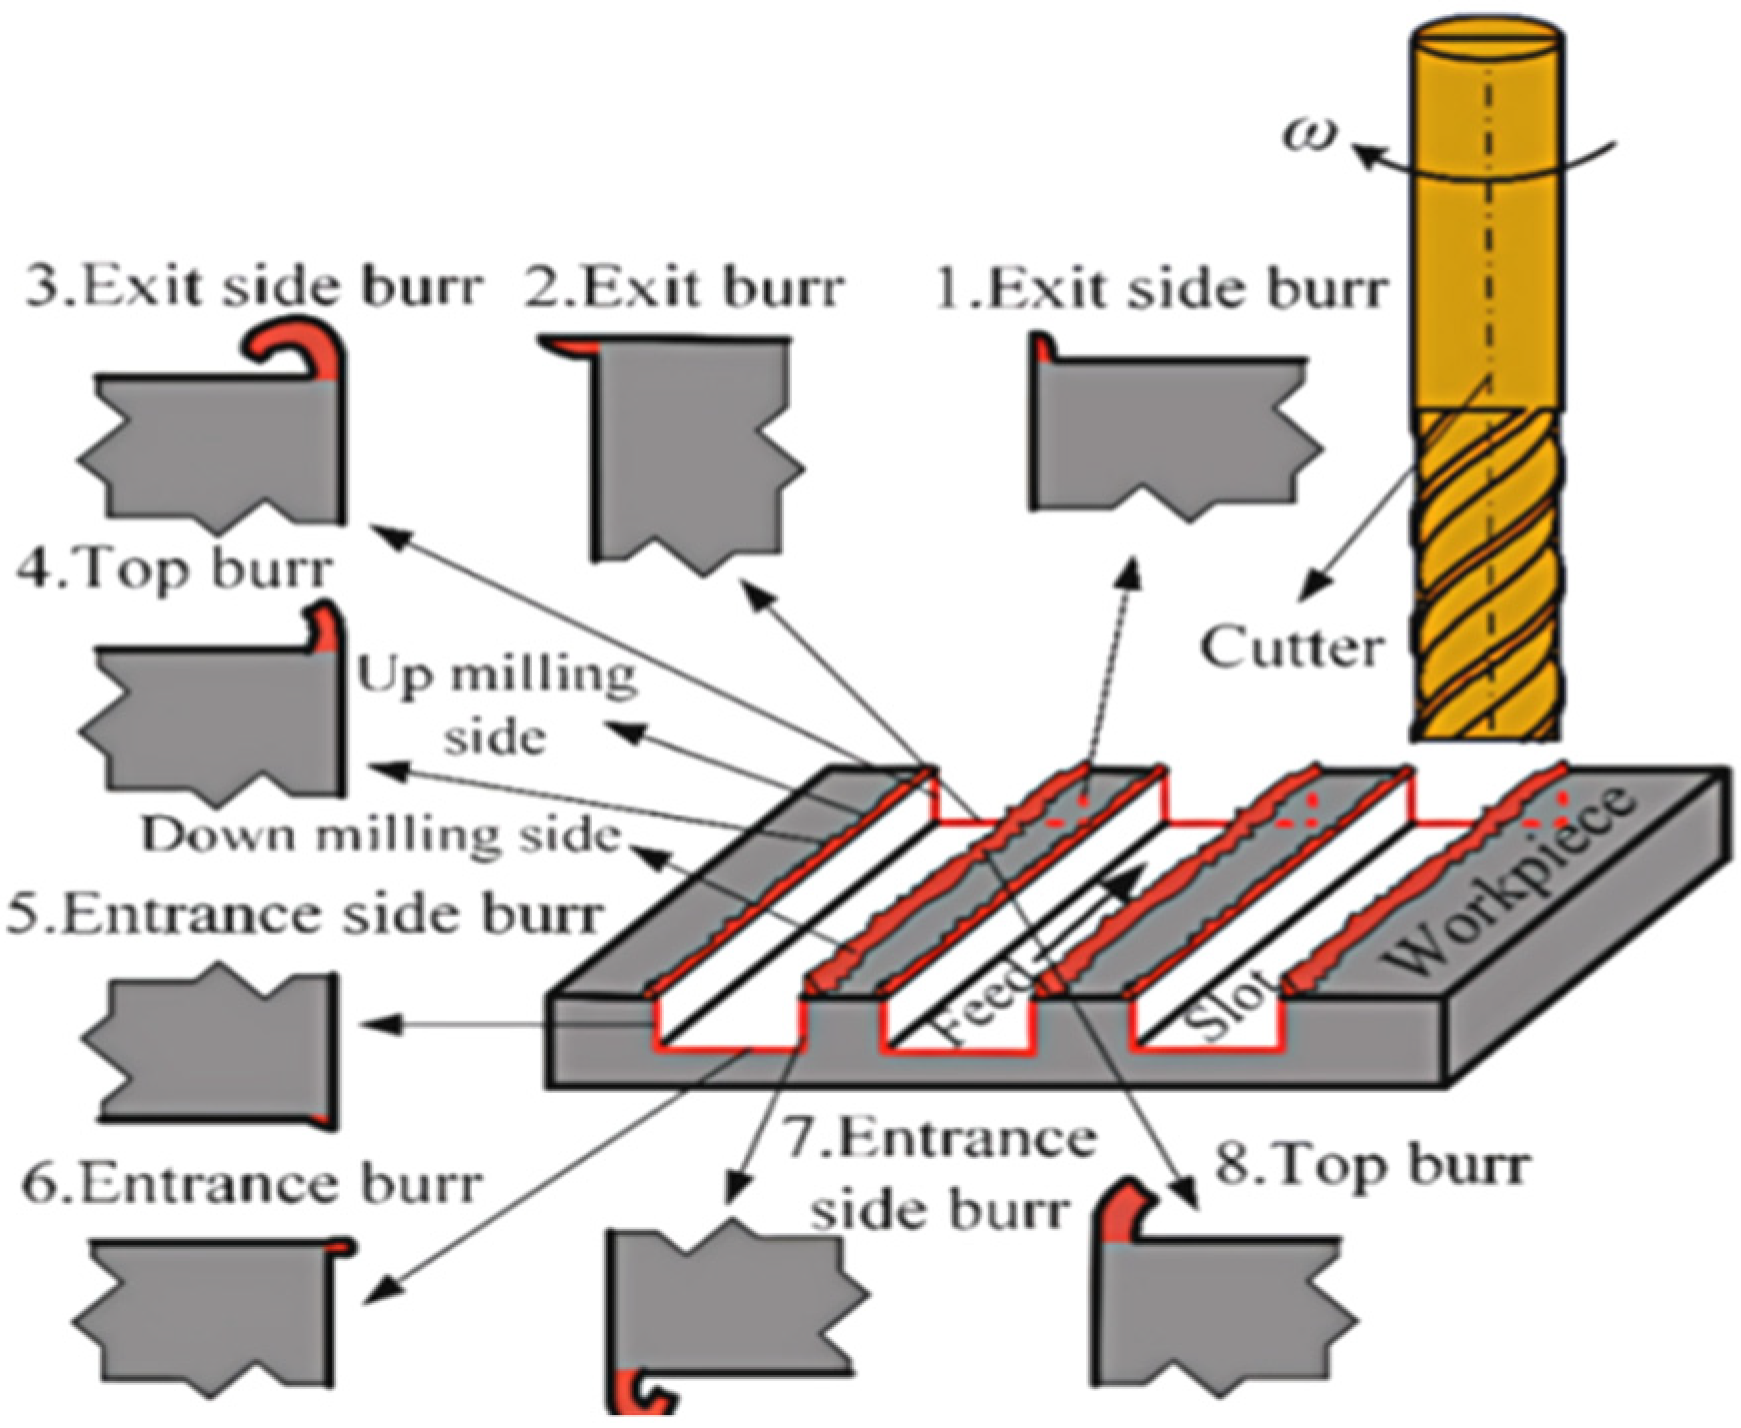
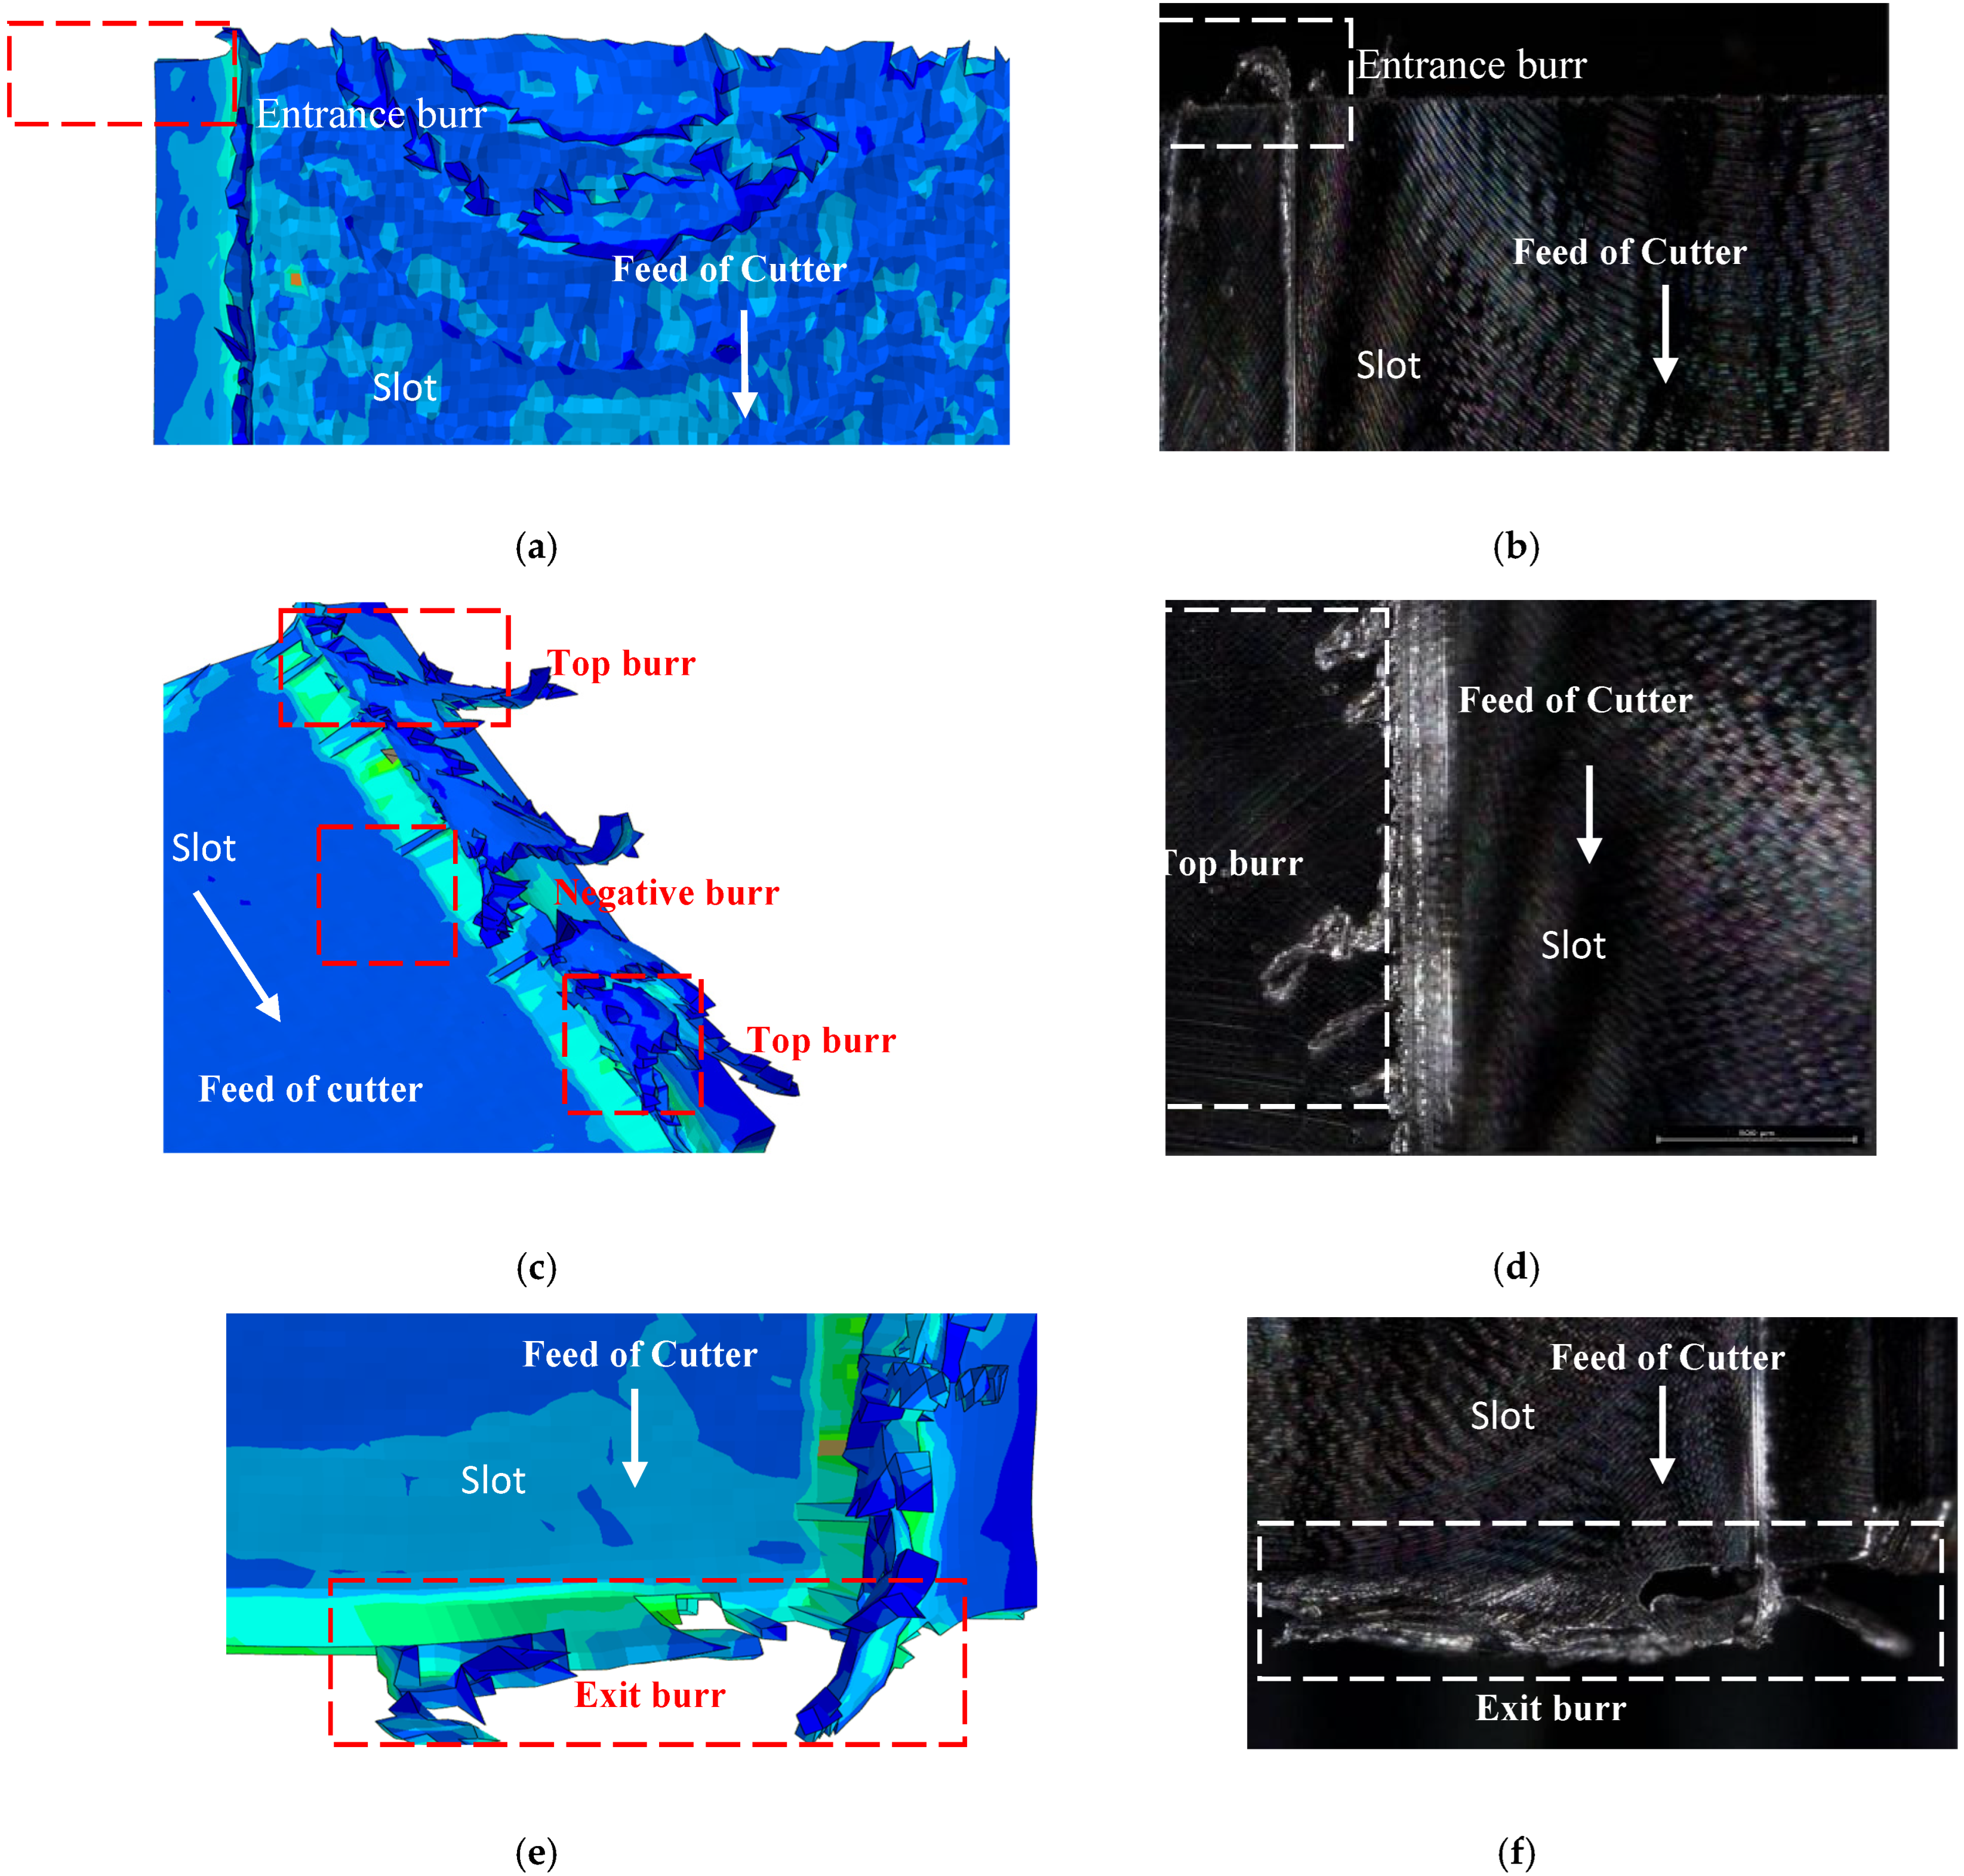
Figure 1. In this process, the generation of burrs at workpiece edges is an inherent by-product of metal cutting. These burrs detrimentally affect surface integrity and dimensional accuracy, potentially leading to component rejection in severe cases. In slot milling operations, the cutting process of the tool can be divided into three distinct phases: tool entry, full cutting, and tool exit. During these phases, three types of burrs are produced: entrance burr, top burr, and exit burr, as shown in
Figure 2 [
1]. Based on their spatial positions, entrance and exit burrs can be further classified into top and bottom burrs. Similarly, top burrs are classified into up-milling side burrs and down-milling side burrs according to different milling techniques.
The formation mechanism of burrs is generally well-understood. Hashimura M, Hassamontr J, and Dornfeld D A [
2] categorized the burr formation process in plastic and brittle materials into eight stages: elastic–plastic deformation in the tool tip region, material extension to the workpiece edge in the elastic region, and expansion of the negative shear zone. During the expansion stage of the negative shear zone, in plastic materials, cracks propagate along the cutting edge trajectory, leading to chip separation and the formation of positive burrs. In contrast, in brittle materials, cracks develop within the negative shear zone, resulting in chip separation and the creation of negative burrs.
Based on the mechanism of burr formation, researchers have explored the influence of cutting parameters, tool geometry, and wear conditions on burr characteristics. Hajiahmadi et al. [
3] carried out a study on 316 stainless-steel workpieces, indicating that spindle speed, feed rate, and cutting depth have an impact on burr thickness. Their research findings showed that burr thickness increases with spindle speed but decreases with feed rate. Notably, when the cutting depth increased from 2 mm to 5 mm, burr thickness initially decreased and then increased. Chen W, Teng X, and Zheng L [
4] proposed a vibration-assisted milling method for burr suppression. This method creates simultaneous forward and reverse milling on one side of the groove during slot milling. Compared with conventional milling, this technique significantly reduces the dimensions of top burrs on the non-milling side. Saha S, Ansary S I, and Deb S [
5] investigated the influence of post-wear groove cutter geometry on chip-like burrs. Their results indicated that wear-induced burrs tend to be larger on the reverse milling side due to restricted flow within the groove. Poka G and Balazs B Z [
6] analyzed the effects of the exit angle in slot milling, demonstrating a strong correlation between the uncut chip thickness at the exit zone and burr formation. Significantly, the uncut chip thickness is mainly determined by the exit angle. Ma J, Wang B, Zhao B, et al. [
7] developed a milling top burr prediction model considering tool deformation, achieving an experimental prediction accuracy of 96.5%. Qu D, Xu Z, Song Y, et al. [
8] established an exit-side burr size prediction model. This was achieved by analyzing tool runout during micro-milling and integrating the burr size prediction theory model developed by Seyed, Ali, Niknam et al. [
9]. Although this model shows acceptable accuracy, its precision decreases as the cutting depth increases, thus requiring further improvement.
Existing research has produced substantial findings concerning the relationship between burrs and diverse factors, which has facilitated their prediction and control. Nevertheless, no research has explored the impact of tool eccentricity on milling burrs. Owing to manufacturing and clamping errors in milling cutters, tool eccentricity is an inherent phenomenon during milling operations. When cutting parameters such as tooth feed rate and depth of cut are relatively small, its influence on the cutting process becomes prominent. Zhang Yu, Duan Xianyin, and Gao Shuaishuai [
10] developed a general cutting force model applicable to micro-milling, systematically integrating key influencing factors such as tool edge radius, flank wear state, and tool runout. Their research indicated that the severity of tool wear is significantly correlated with tool runout characteristics and edge geometry parameters. Tool eccentricity not only expedites the accumulation of tool wear but also induces significant fluctuations in milling forces. Buj—Corral I, Vivancos—Calvet J, and Gonzalez—Rojas H [
11] demonstrated that tool eccentricity results in an uneven distribution of instantaneous cutting thickness on the cutting edge, leading to periodic fluctuations in cutting forces and ultimately causing noticeable variations in surface roughness during machining.
The crucial parameters of milling cutter eccentricity are the eccentric distance and the eccentric direction. Conducting milling experiments with eccentricity as the sole influencing factor poses substantial challenges. In the realm of burr research, numerous studies resort to finite element simulation owing to the difficulties associated with experiments. Muhammad Asad and Hassan Ijaz [
12] optimized cutting parameters, such as cutting speed, feed rate, and tool rake angle, through ABAQUS simulations, effectively reducing the occurrence of exported burrs. The simulation results of chip morphology and cutting forces exhibited a high degree of consistency with experimental data, validating the efficacy of the simulations. Rahul Yadav, Nilanjan Das Chakladar, and Soumitra Paul [
13] addressed burr defects in micro-milling precision components via Abaqus simulations. Their findings indicated that reducing the residual surface stress could lead to a 60% decrease in burr formation and a 7% reduction in cutting temperature. Experimental verification confirmed the simulated burr morphology, chip contact length, cutting forces, and surface residual stress. Ni Chen, Xinlei Zhang, and Yang Wu [
14] confronted the challenges of small burr dimensions and difficulties in observation during slot milling. Through finite element simulations and experimental validation of cutting force error models, they identified the patterns of influence of cutting depth and spindle speed on burr formation. Shi Lanyu, Wang Chenguang, Chen Jie [
15] and other scholars from Shanghai Jiao Tong University employed finite element analysis software to conduct simulation research on the burr morphology during the high-speed milling process of high-temperature alloy honeycomb cores. They discovered certain influence laws of cutting speed, cutting depth, feed rate, and cutting force on burrs.
Finite element simulations have been extensively applied to study milling burrs, with existing research primarily focusing on the effects of milling parameters and tool geometry. However, the influence of tool eccentricity—an inevitable result of manufacturing and clamping errors—on burr formation remains understudied. A significant gap exists in current research; no quantitative analysis has been conducted on how the direction and magnitude of tool eccentricity influence specific burr types, such as top burrs and exit-side burrs. To address this, this study establishes a three-dimensional thermo-mechanical coupled finite element model to systematically evaluate the effects of eccentric distance and direction on burr dimensions during slot milling of AISI 304 stainless steel. The findings aim to provide a theoretical foundation for burr suppression in precision machining.
2. Thermal Coupling Simulation of Slot Milling
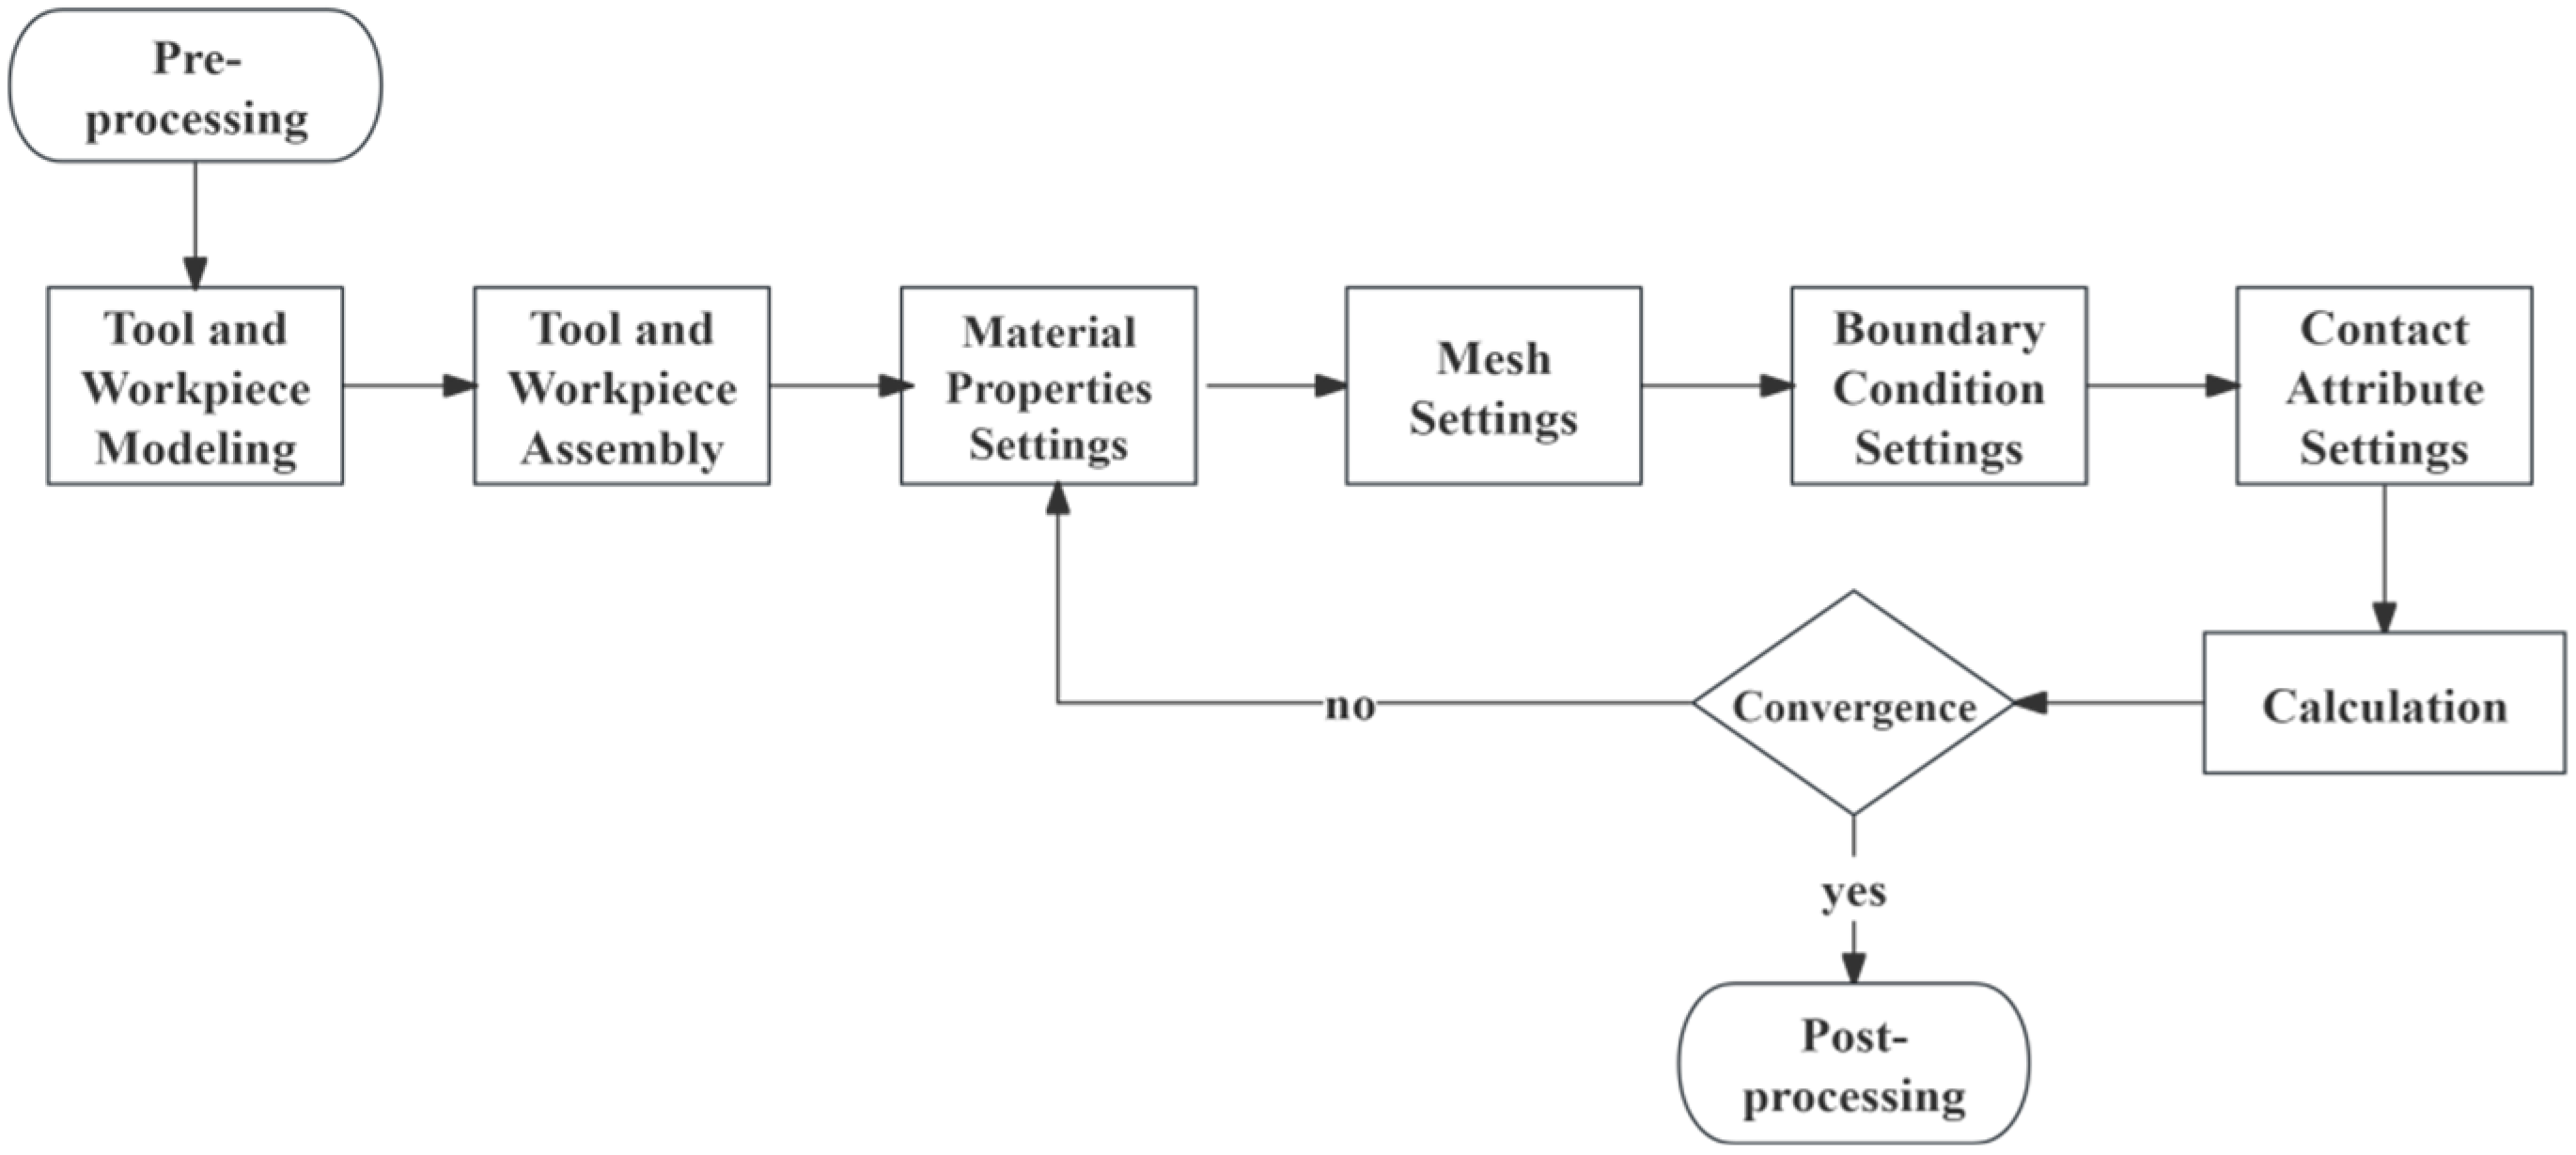
Thermal coupling denotes the phenomenon in which frictional heat and cutting forces are coupled during metal cutting processes, leading to an increase in workpiece temperature and an uneven distribution of stress, which in turn impacts machining quality and efficiency. Finite element software was utilized to simulate slot milling, leveraging the built-in temperature–displacement coupling algorithm to model temperature and stress fields.
Figure 3 depicts the simulation workflow.
2.1. Three-Dimensional Modeling of Tools and Workpieces
A two-tooth cemented carbide milling cutter with a diameter of 4 mm and a helix angle of 38° was utilized, and the specific tool parameters are presented in
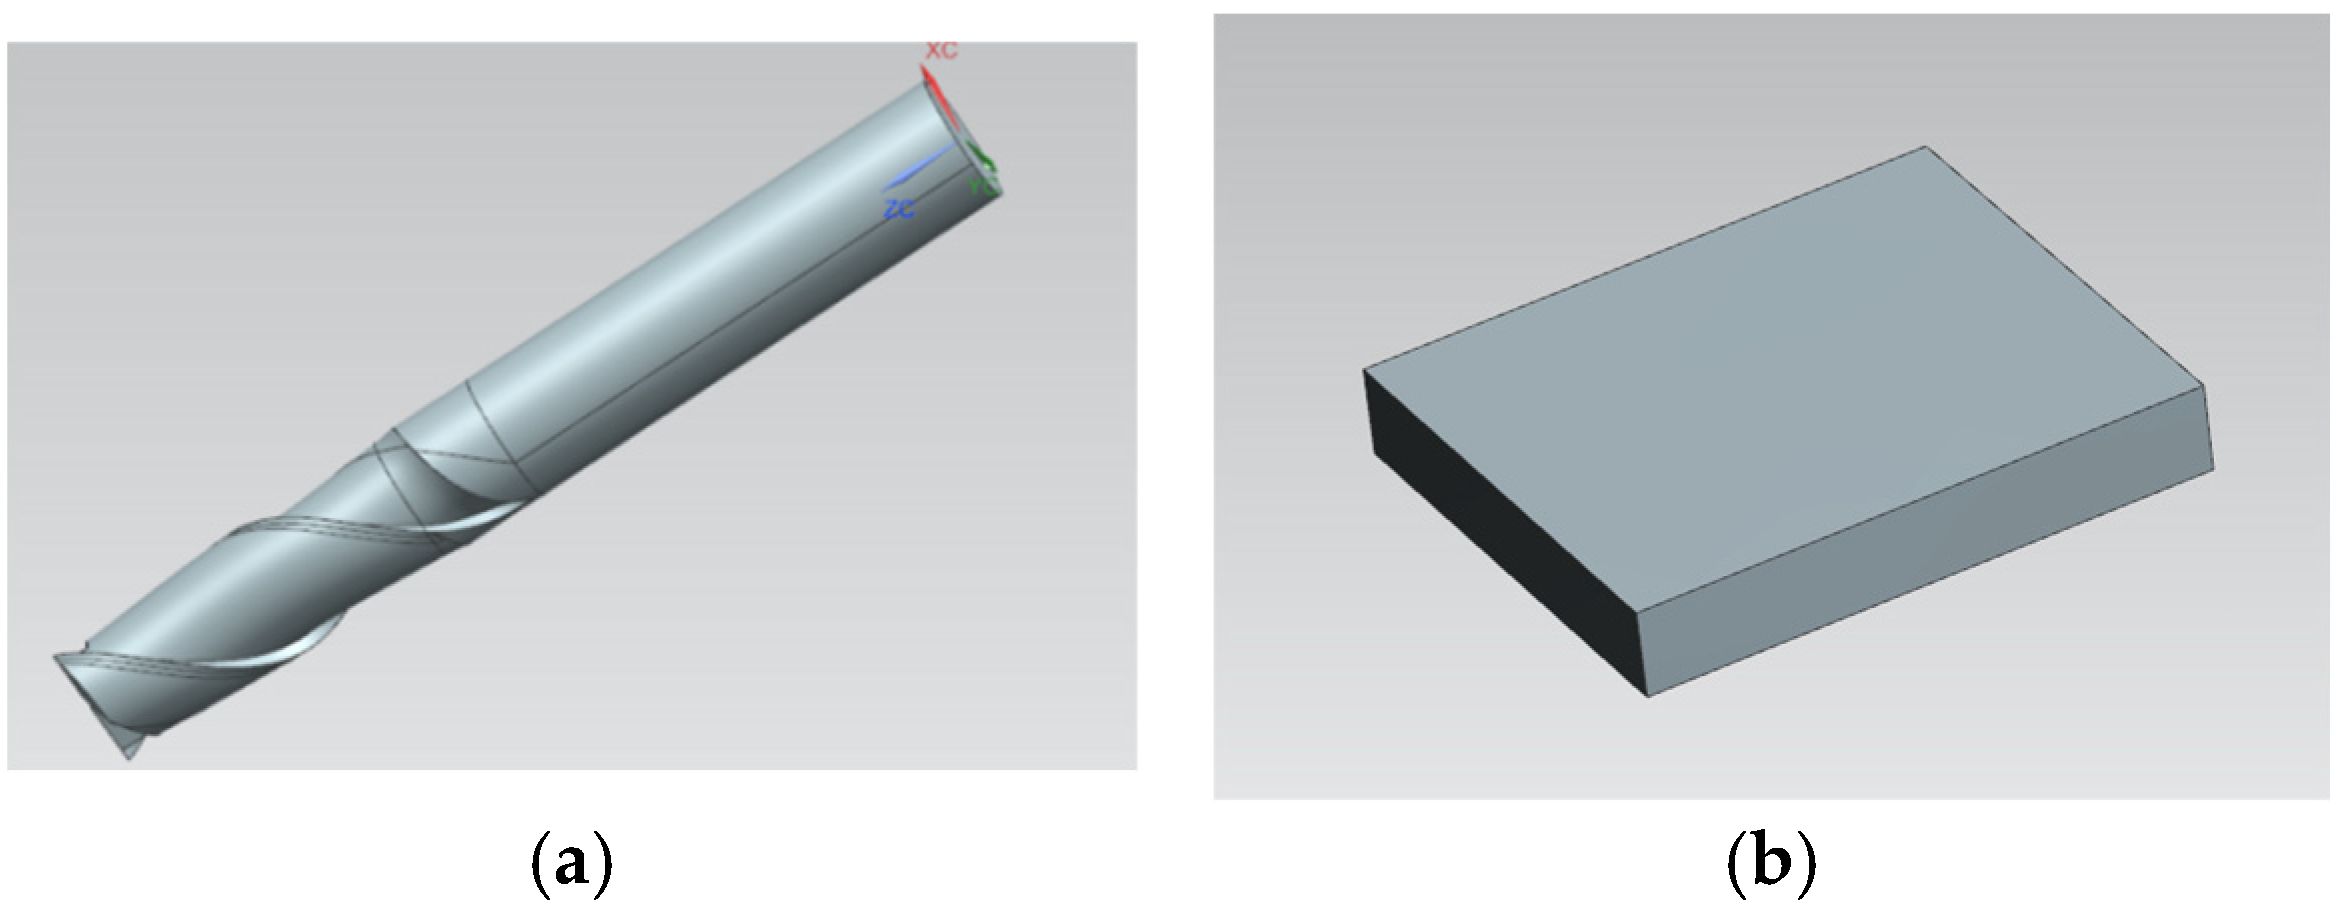
Table 1. The geometric dimensions of the workpiece model were 6 mm × 4.5 mm × 1 mm. To decrease the computational time for time-consuming simulations, the tool and workpiece models were simplified by only retaining the cutting-edge sections of the tool and removing most non-cutting regions of the workpiece. The cutter and workpiece models constructed by 3D modeling software are shown in
Figure 4.
The cutter is designated as a rigid body, and the workpiece is regarded as a viscoelastic deformation body. Both components are imported into the Abaqus assembly module, where operations such as translation and rotation are employed to ensure appropriate relative positioning between the tool and the workpiece. The assembly outcome is presented in
Figure 5, with the workpiece positioned on the left and the milling cutter on the right. During the initialization phase, a specific distance is maintained between the tool and the workpiece to avoid interference resulting from excessive proximity prior to the commencement of the simulation, which may lead to inaccurate definition of the contact relationship [
16].
2.2. Material Properties of Cutting Tools and Workpieces
The material of the tool is cemented carbide, and the material properties are shown in
Table 2.
The material of the workpiece is AlSI304 stainless steel, and the specific material properties are shown in
Table 3.
2.3. Simulation Calculation Model
During the metal cutting process, materials typically experience elastoplastic deformation under conditions of high temperature, high strain, and high strain rate. The Johnson–Cook constitutive model can be employed to more effectively simulate the strain hardening, strain strengthening, and viscoplastic deformation of materials. The specific formulation of the model is:
Among them,
is the equivalent flow stress,
is the equivalent plastic strain,
is the quasi-static strain rate, T is the material temperature of the workpiece,
Tmelt is the melting point of the material, and
Troom is room temperature. Reference [
19] provides the values of
A,
B,
C,
m,
n, as shown in
Table 4.
The chip formation and fracture in the milling process are simulated by using J-C shear failure criterion. The calculation formula is as follows:
In the formula, represents the failure critical plastic strain, denotes the plastic strain rate, is the reference strain rate, indicates the increment in plastic strain, p stands for compressive stress, q is the Mises stress, d1, d2, d3, d4, and d5 are the material’s inherent damage coefficients, is the damage parameter calculated by the software based on the material’s strain conditions.
Within these guidelines, the damage threshold of the material was determined. During the simulation computations, the non-fixed values of
d1–
d5 dynamically adjust to the actual stress states, strain levels, and loading rates. In each computational step, their instantaneous values are updated according to the current mechanical conditions and the accumulated damage quantities from previous steps. When the damage coefficients d1–d5 surpass the threshold, material failure takes place, which terminates the computations of the corresponding material units and leads to the generation of chips. The J-C damage coefficients for AlSI304 stainless steel are presented in
Table 5.
2.4. Grid Division and Boundary Condition Setting
During the finite element simulation of milling, the design and quality of the mesh directly influence the distribution patterns of the stress field and temperature field, as well as the accuracy of burr generation analysis. Meshes characterized by high quality, large quantity, and small size exhibit higher calculation accuracy; however, simultaneously, they significantly augment the calculation time.
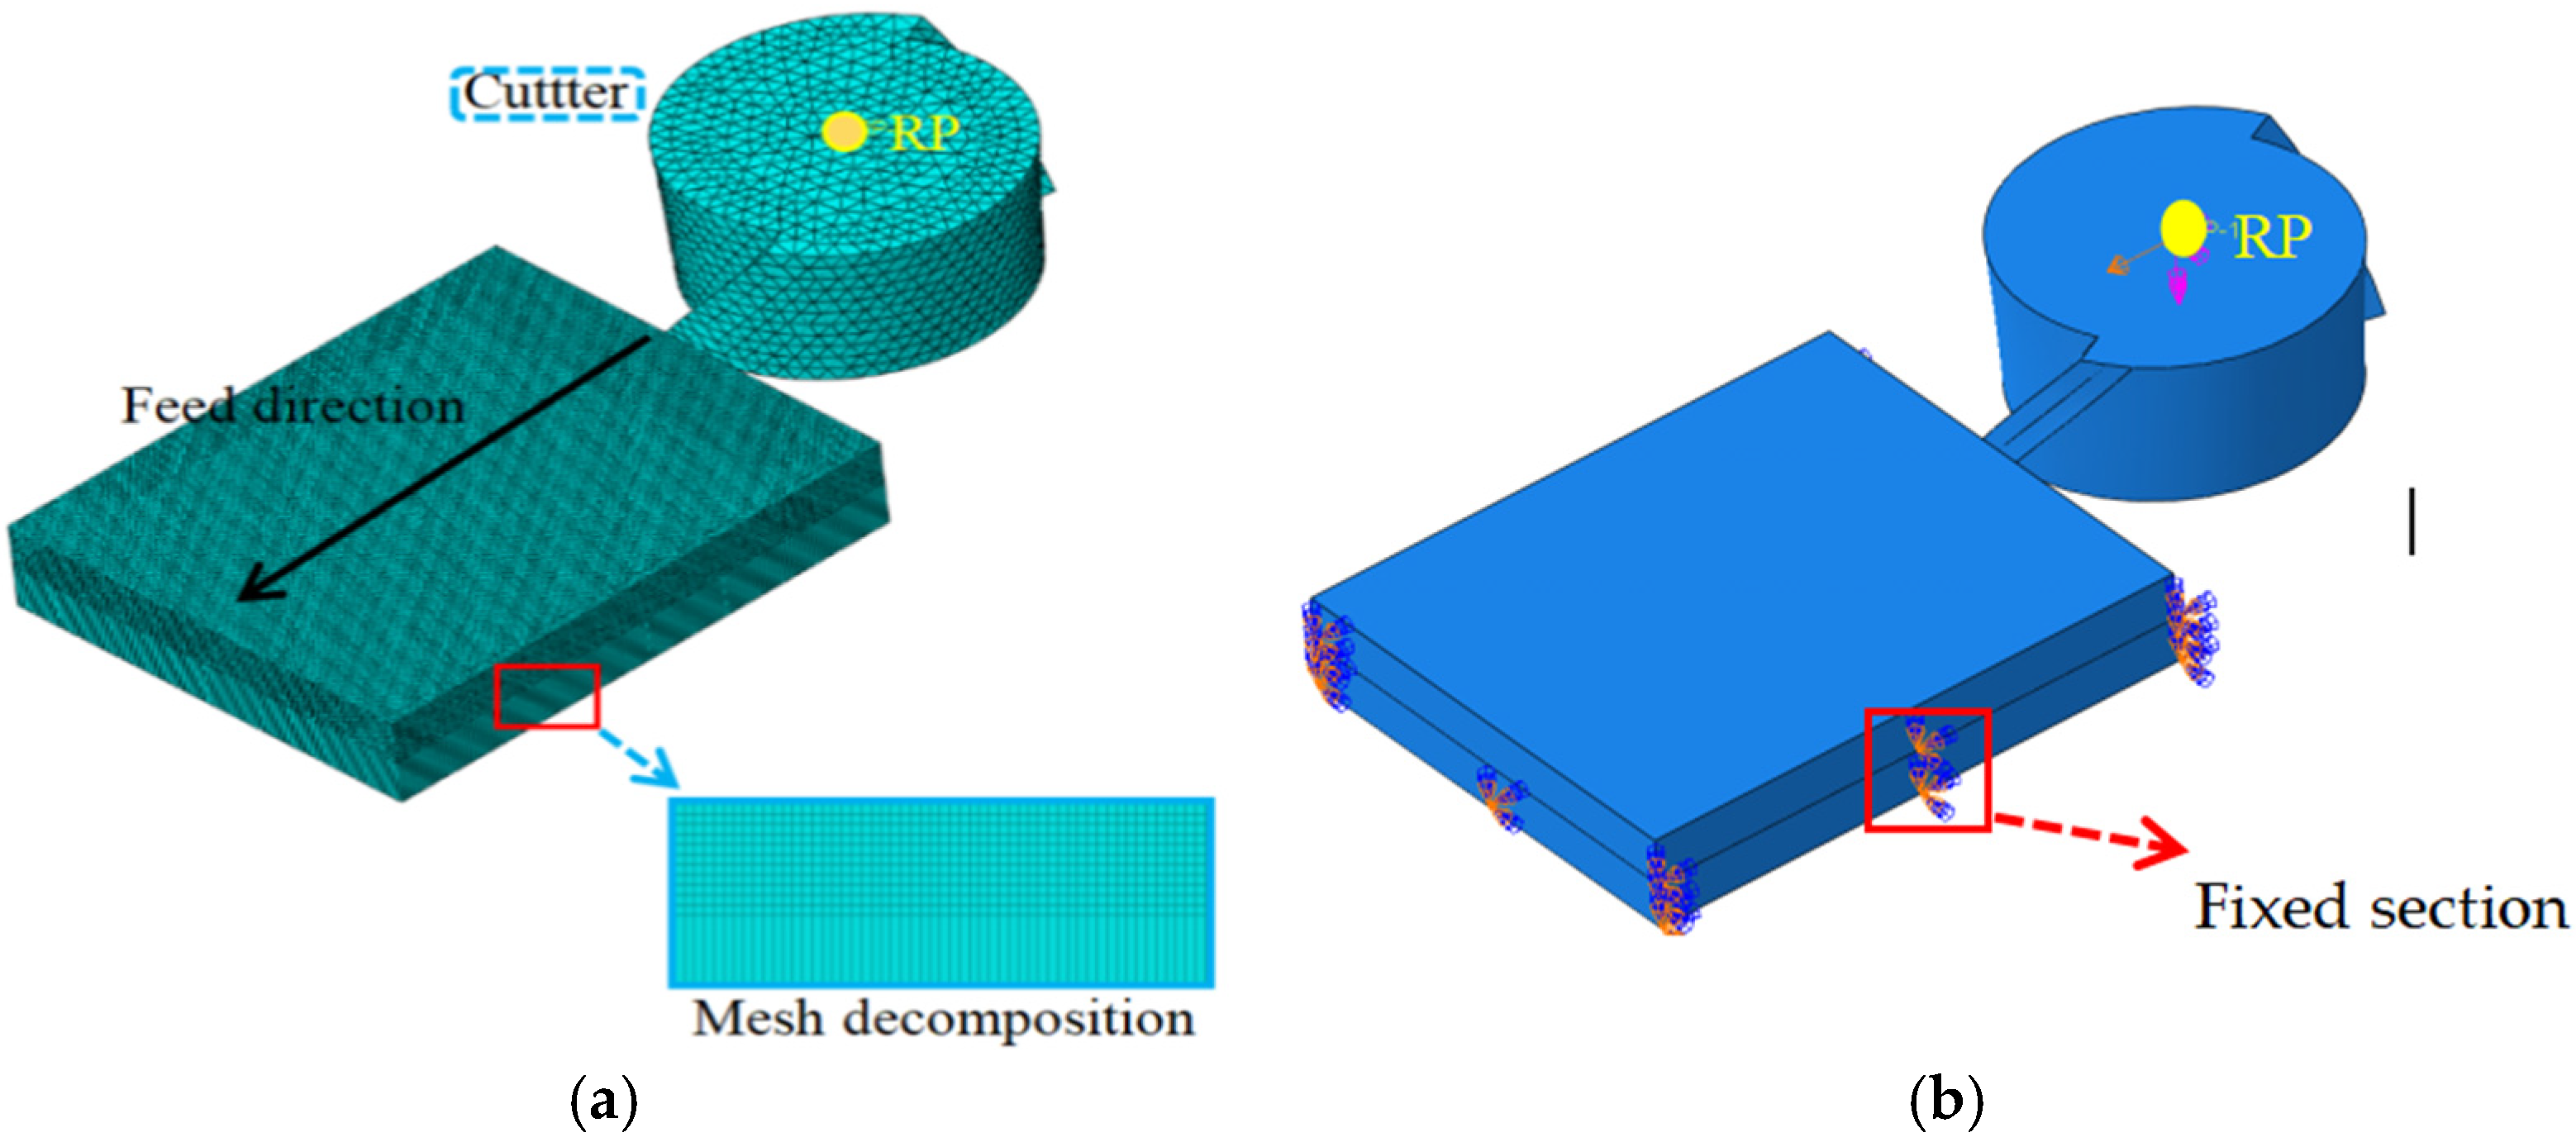
Given the complex structure of the cutting tool, the mesh is divided into adaptive CPE4RT elements with a 0.2 mm size. For the relatively simple workpiece structure, hexahedral elements with 0.03 mm dimensions are employed for the machined sections, while larger elements are used for non-machined areas to reduce computational load. The mesh configuration is illustrated in
Figure 6a, where the mesh decomposition diagram shows distinct differences between machined and non-machined regions. The reference point RP, which serves as the tool’s rotational center, is dynamically synchronized with the tool’s motion.
Both the tool mesh and the workpiece mesh are configured as the temperature–displacement coupling type. Considering that milling simulations entail nonlinear large-deformation effects, abrupt stress spikes during the operation process may result in excessive mesh distortion, which could potentially lead to computational inaccuracies or even cause the computation to terminate. To address this issue, the workpiece mesh in this model is designed in a reduced integral form, and mesh distortion control is set at a length ratio of 0.5. This approach effectively mitigates excessive mesh distortion, as theoretically proven by Equation (4), where
Lmax represents the maximum side length of the element, and
Lmin denotes the minimum side length.
The boundary conditions incorporate the load configuration of the tool and the fixation of the workpiece. As shown in
Figure 6b, a uniform feed displacement is imposed along the feed direction relative to the reference point RP, and the rotational speed of the tool at the RP point is specified. The displacement is regulated by a table-defined amplitude curve that delineates its temporal variation. Through the configuration of appropriate curves, the tools can attain uniform feed. The fixed section guarantees the complete fixation of the side edges and base surfaces of the workpiece, thereby maintaining the structural stability during the machining processes.
2.5. Cutting Edge Friction Model
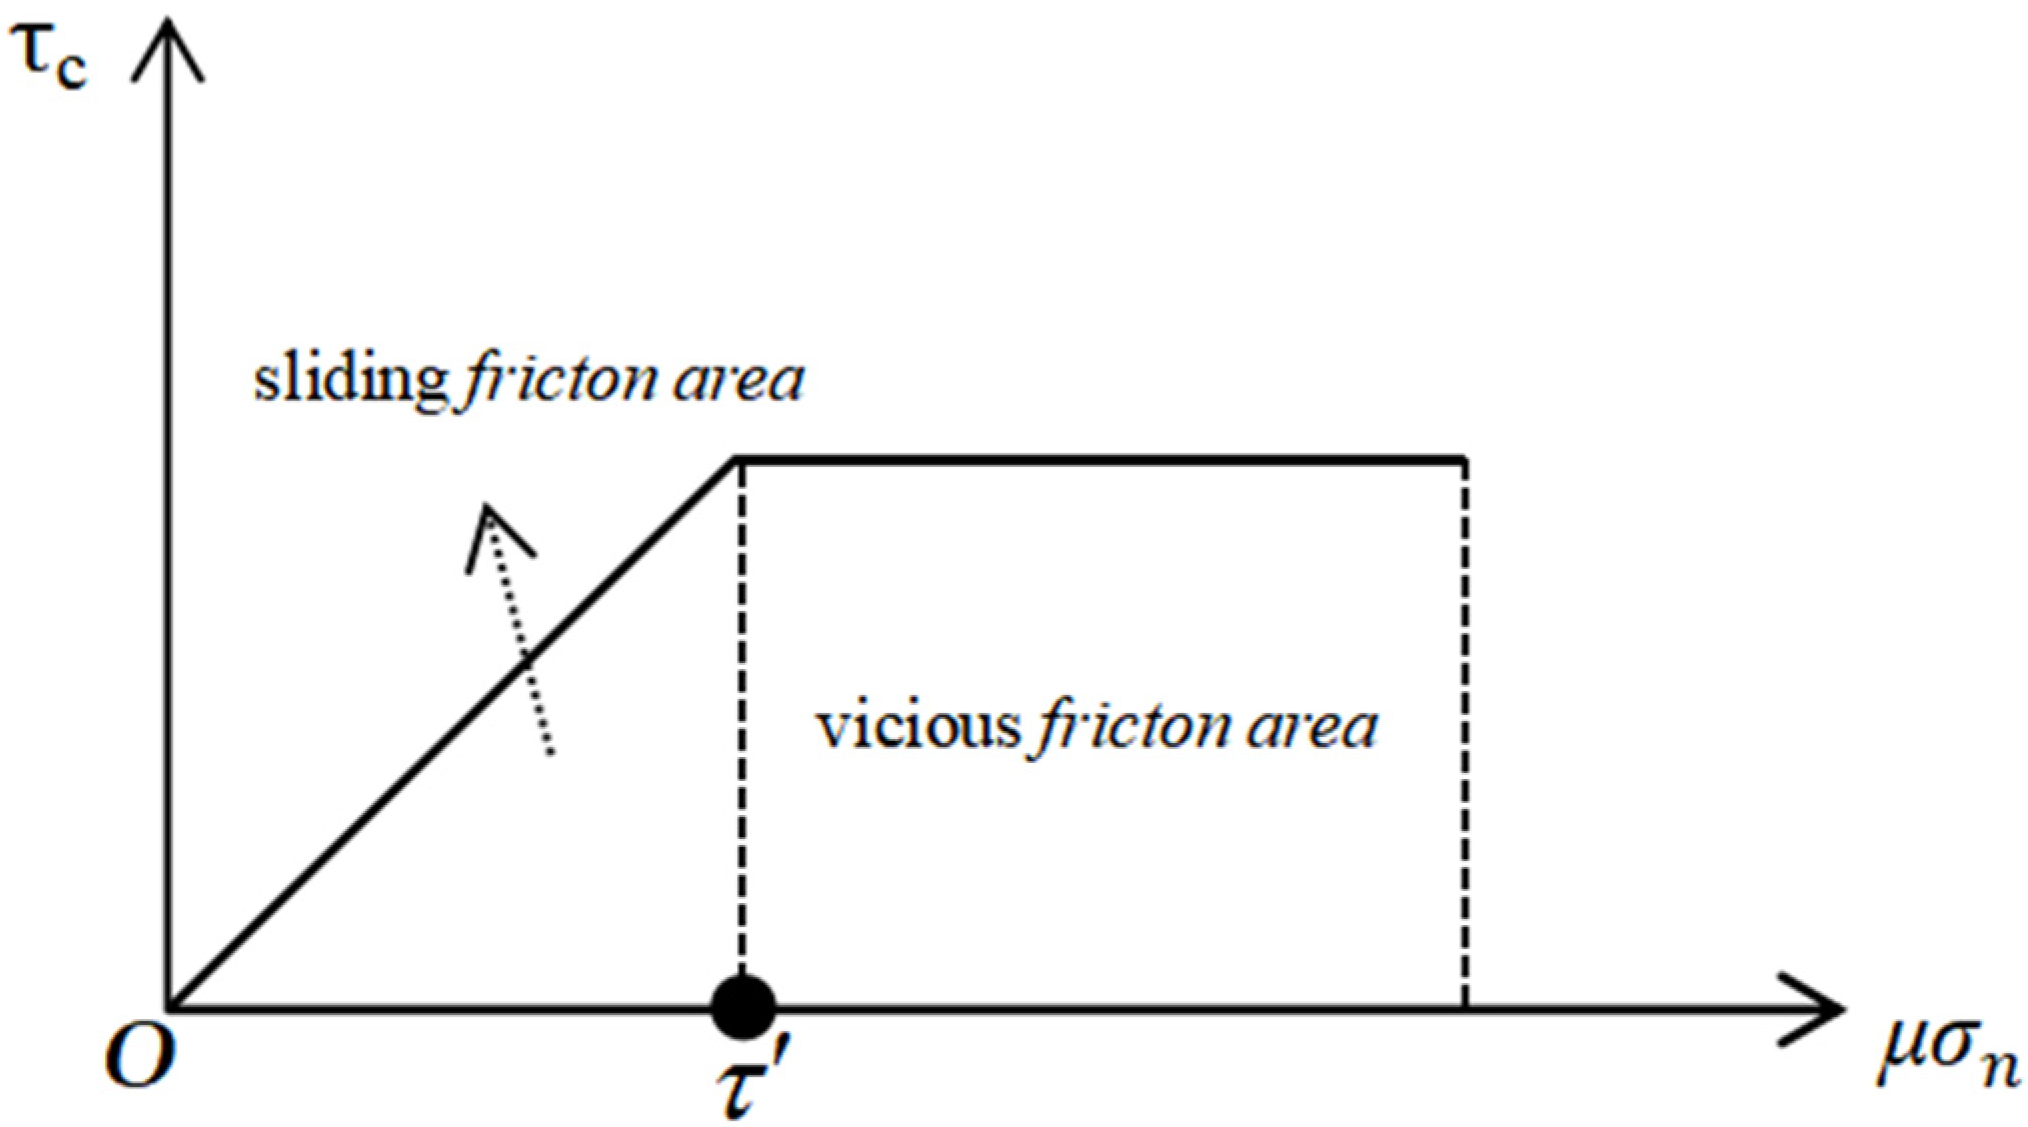
Friction behavior during the cutting process is a coupled effect resulting from the mutual contact between the tool, chips, and workpiece, rather than simple sliding friction. This friction behavior significantly influences the evolution of chip morphology, the dynamic characteristics of cutting forces, and the thermal distribution patterns throughout the cutting process. The tool–chip friction model employed in this study is a hybrid friction model based on Coulomb friction. This model automatically determines the contact state between the tool and chip within user-defined regions. If the product of the normal stress between the tool and chip and the friction coefficient μ is greater than or equal to the shear stress limit τ′, a bonded relationship exists between them, with the shear stress between them being the shear stress limit τ′. Otherwise, the shear stress is
. Its theoretical expression is determined by Equation (5) [
21]:
In the equation, μ represents the coefficient of friction,
denotes the normal compressive stress in the contact zone, and
is the shear stress limit, whose value equals the product of the material’s yield strength k and the friction factor m. In this paper, the coefficient of friction is set to 0.35. The shear stress relationship expressed by Equation (5) can be illustrated as shown in the
Figure 7 below:
2.6. Simulation Programme
Tool eccentricity encompasses two parameters: eccentric orientation and eccentric magnitude. The eccentric orientation denotes the direction along which the actual center of the tool deviates from the theoretical center, while the eccentric magnitude refers to the distance by which the actual center of the tool deviates from the theoretical center.
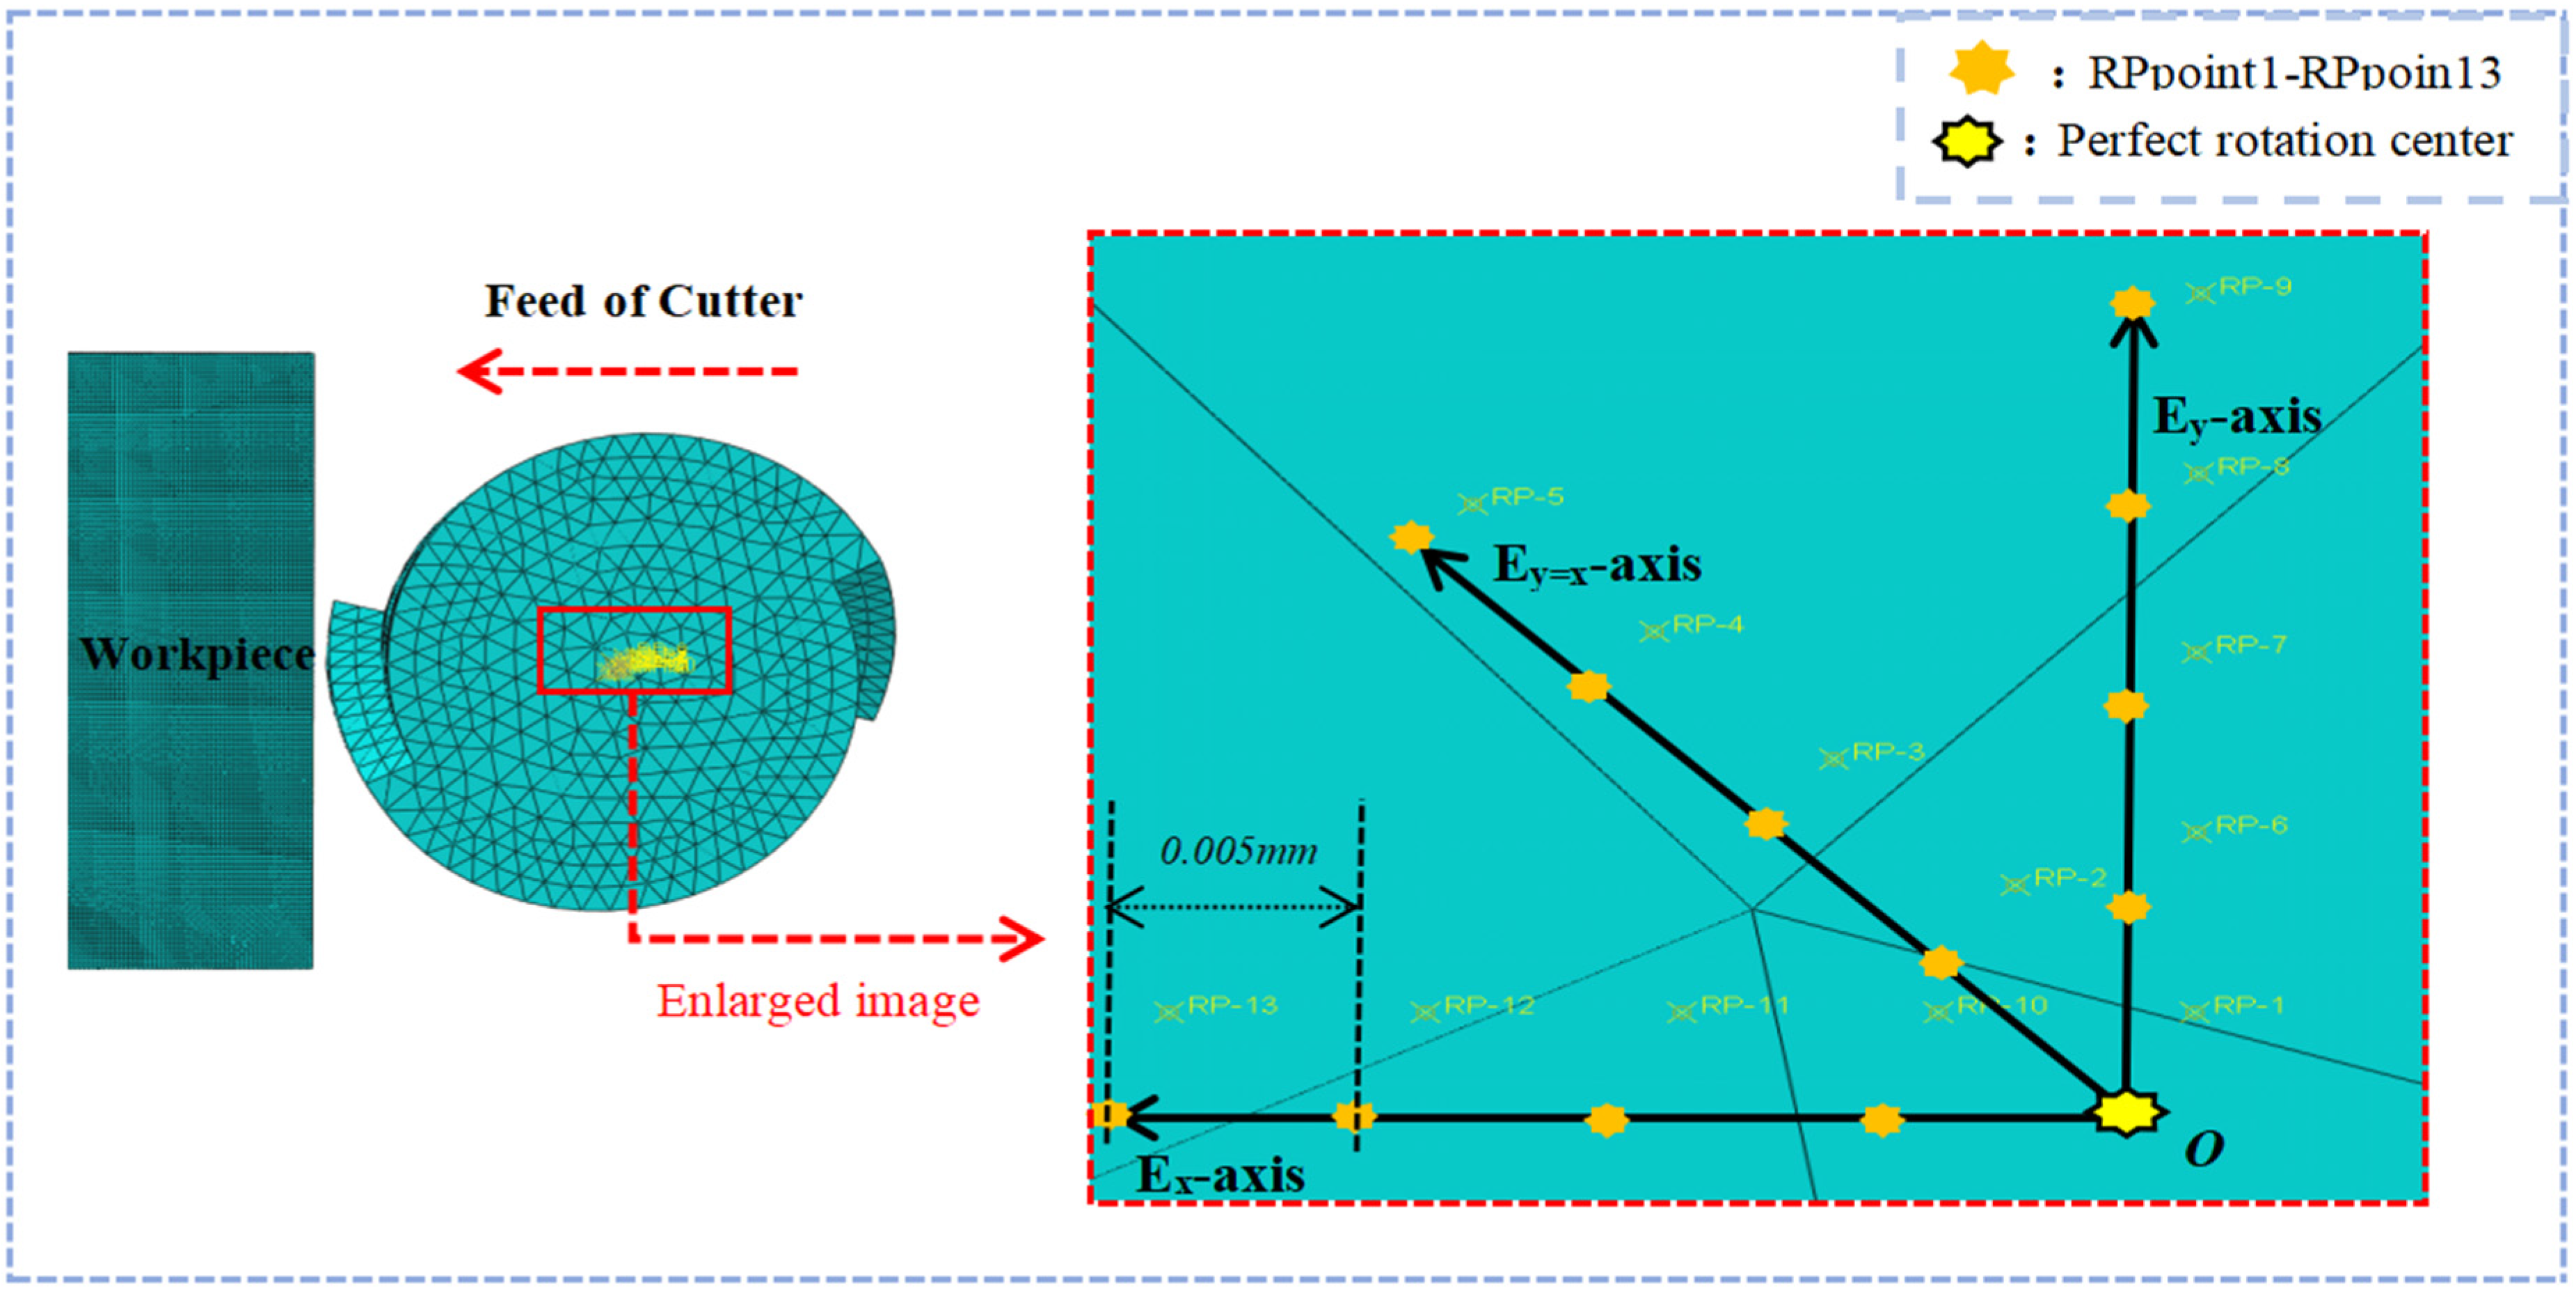
Taking the theoretical rotation center of the tool as the coordinate origin, the feed direction of the tool relative to the workpiece is Ex axis, and the vertical direction of Ex axis is Ey axis. The tool coordinate system Exoy is established as shown in
Figure 8.
Three tool eccentric directions (Ey = Ex, Ey, and Ex) were determined. Previous research [
22,
23,
24] measured the eccentric distance of specific end mills via experiments, and this distance was set as a reference within the range of 0.005–0.017 mm. Subsequently, five eccentric points with a spacing of 0.005 mm were arranged in each eccentric direction, representing the actual center positions of the tool under different eccentric directions and eccentric distances.
The milling width is set at 4 mm, the single feed distance is 6 mm, and the milling depth is 0.2 mm. The spindle speed is maintained at 5600 r/min, and the milling operation is conducted under dry-cutting conditions. The specific simulation scheme is presented in
Table 6.
2.7. Burr Size Definition
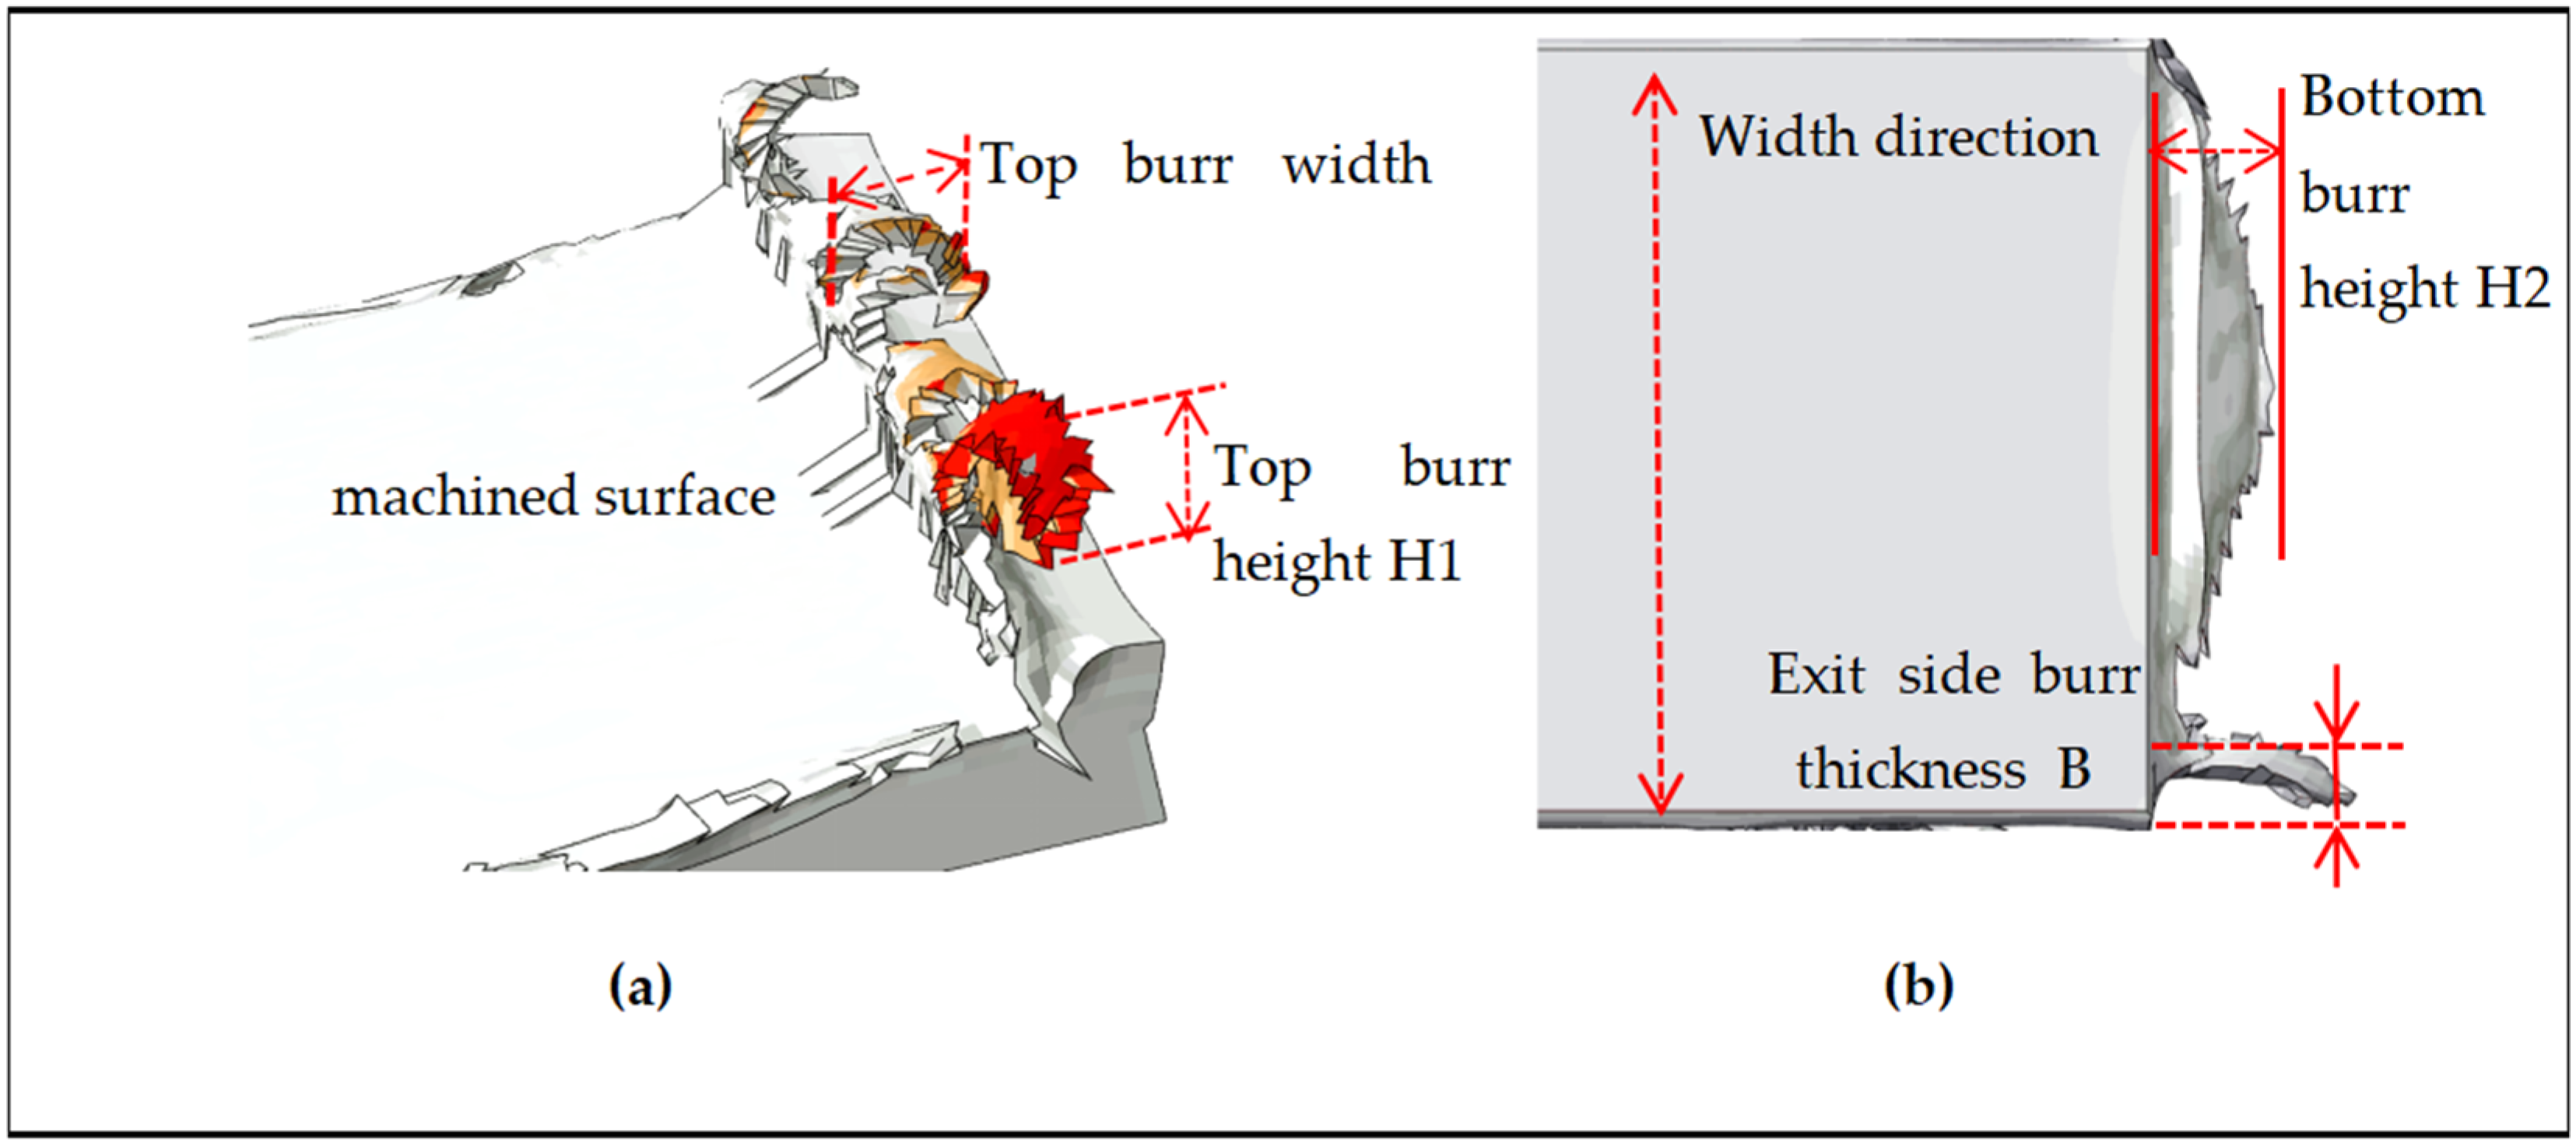
The width and height dimensions of the top burr are defined as shown in
Figure 9a. Here, the width w is defined as the horizontal distance from the farthest horizontal endpoint of the burr to the machined surface of the workpiece. The height H1 is defined as the vertical distance from the farthest vertical endpoint of the burr to the unmachined surface of the workpiece [
25,
26].
The dimensions of exit burrs are defined as shown in
Figure 9b. Burrs extending outward from the groove exit parallel to the groove side face are termed exit side burrs, with thickness B defined as the length of the extended portion in the width direction of the workpiece. Burrs extending outward from the groove exit parallel to the groove bottom face are termed exit bottom burrs, with height H2 defined as the vertical distance of the extended portion in the length direction of the workpiece relative to the unmachined surface.
3. Results and Discussion
Based on the established model parameters and simulation scheme outlined above, this section presents the simulation results and provides a dedicated discussion organized into distinct sections. The analysis is systematically conducted from four key perspectives: the process of burr growth, the morphology and temperature distribution of burrs, the influence of eccentricity distance on burr size, and the effect of eccentricity direction on burr size. In elucidating the underlying mechanisms of milling burr generation, this work further investigates the influence patterns of tool eccentricity parameters on the dimensional features across different burr regions.
3.1. Process of Burr Growth
Figure 10 illustrates the simulated burr formation process, consistent with existing research findings [
25]. As shown in
Figure 10a, when the tool begins cutting into the workpiece, the removed material accumulates at the tool tip, creating stress concentration at the unbroken section of the workpiece and generating an entry burr. As shown in
Figure 10b, upon full tool penetration, significant material bulging occurs in the feed direction. This material is concentrated toward the climb milling side by the tool action, forming the top burr. As depicted in
Figure 10c, when cutting reaches the exit edge of the workpiece, material is squeezed and piled up, generating the exit burr. As the tool exits the workpiece, the accumulated material splits into exit side burrs and exit bottom burrs.
3.2. Burr Morphology and Temperature Distribution
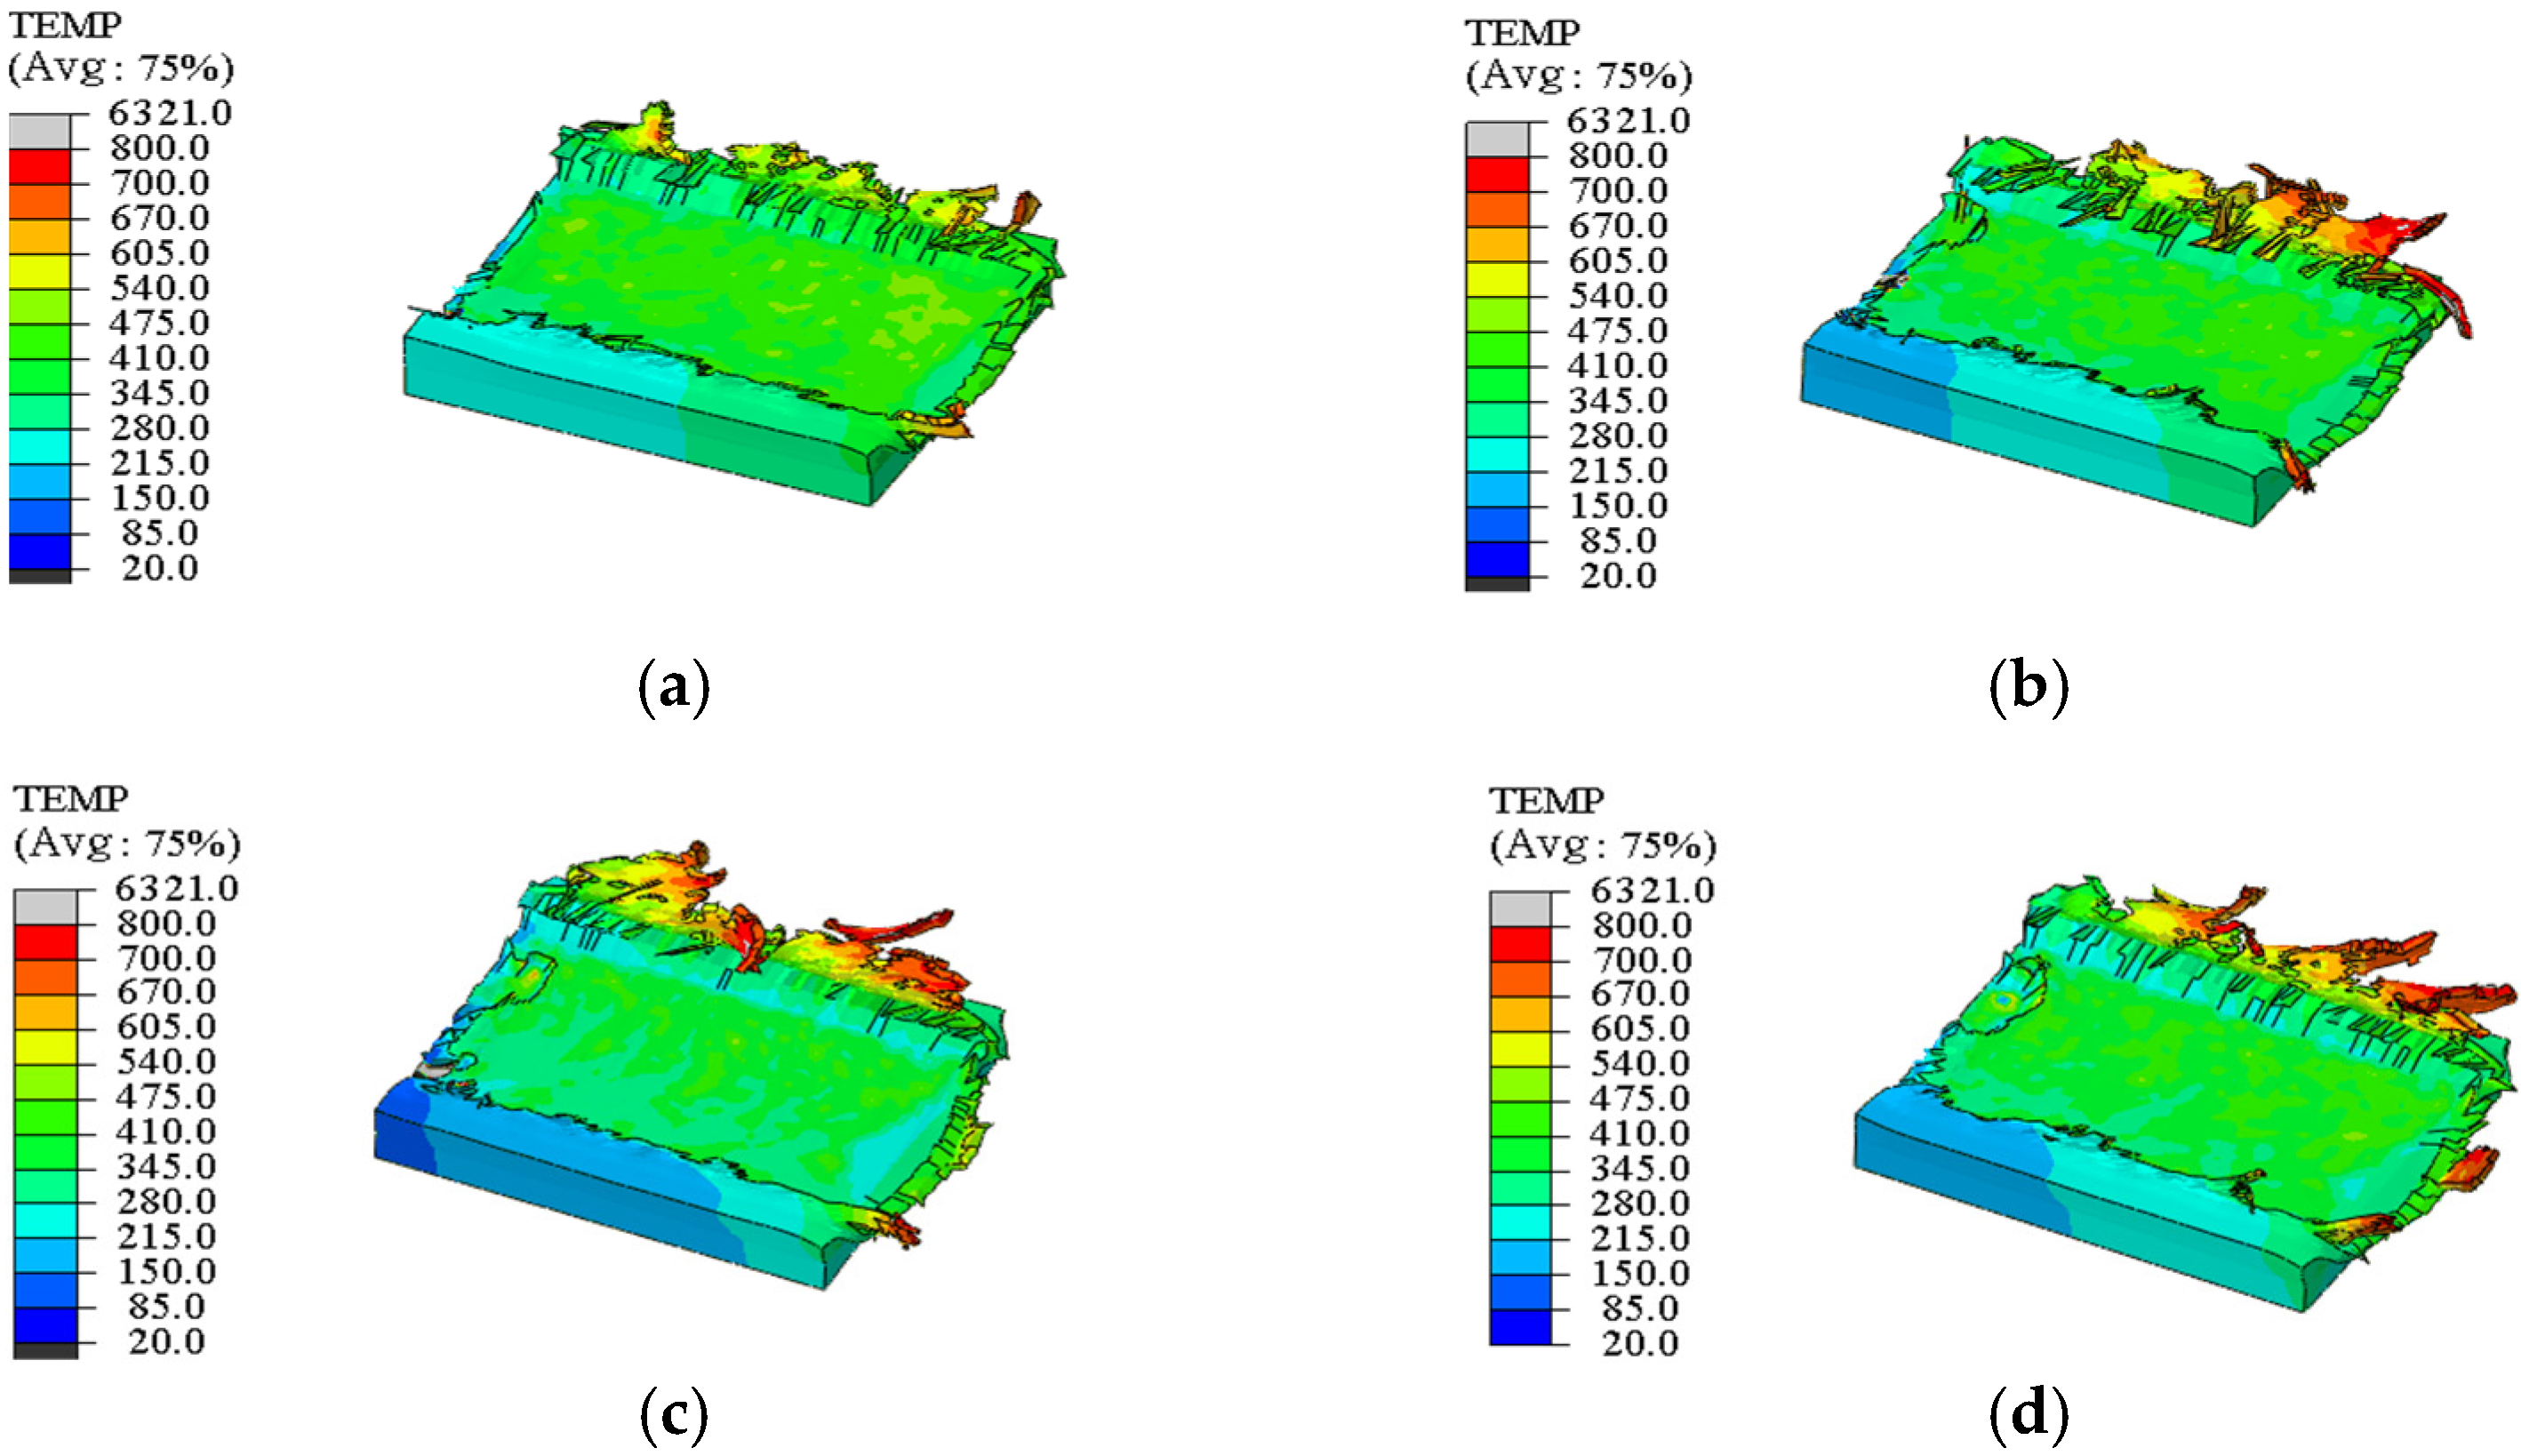
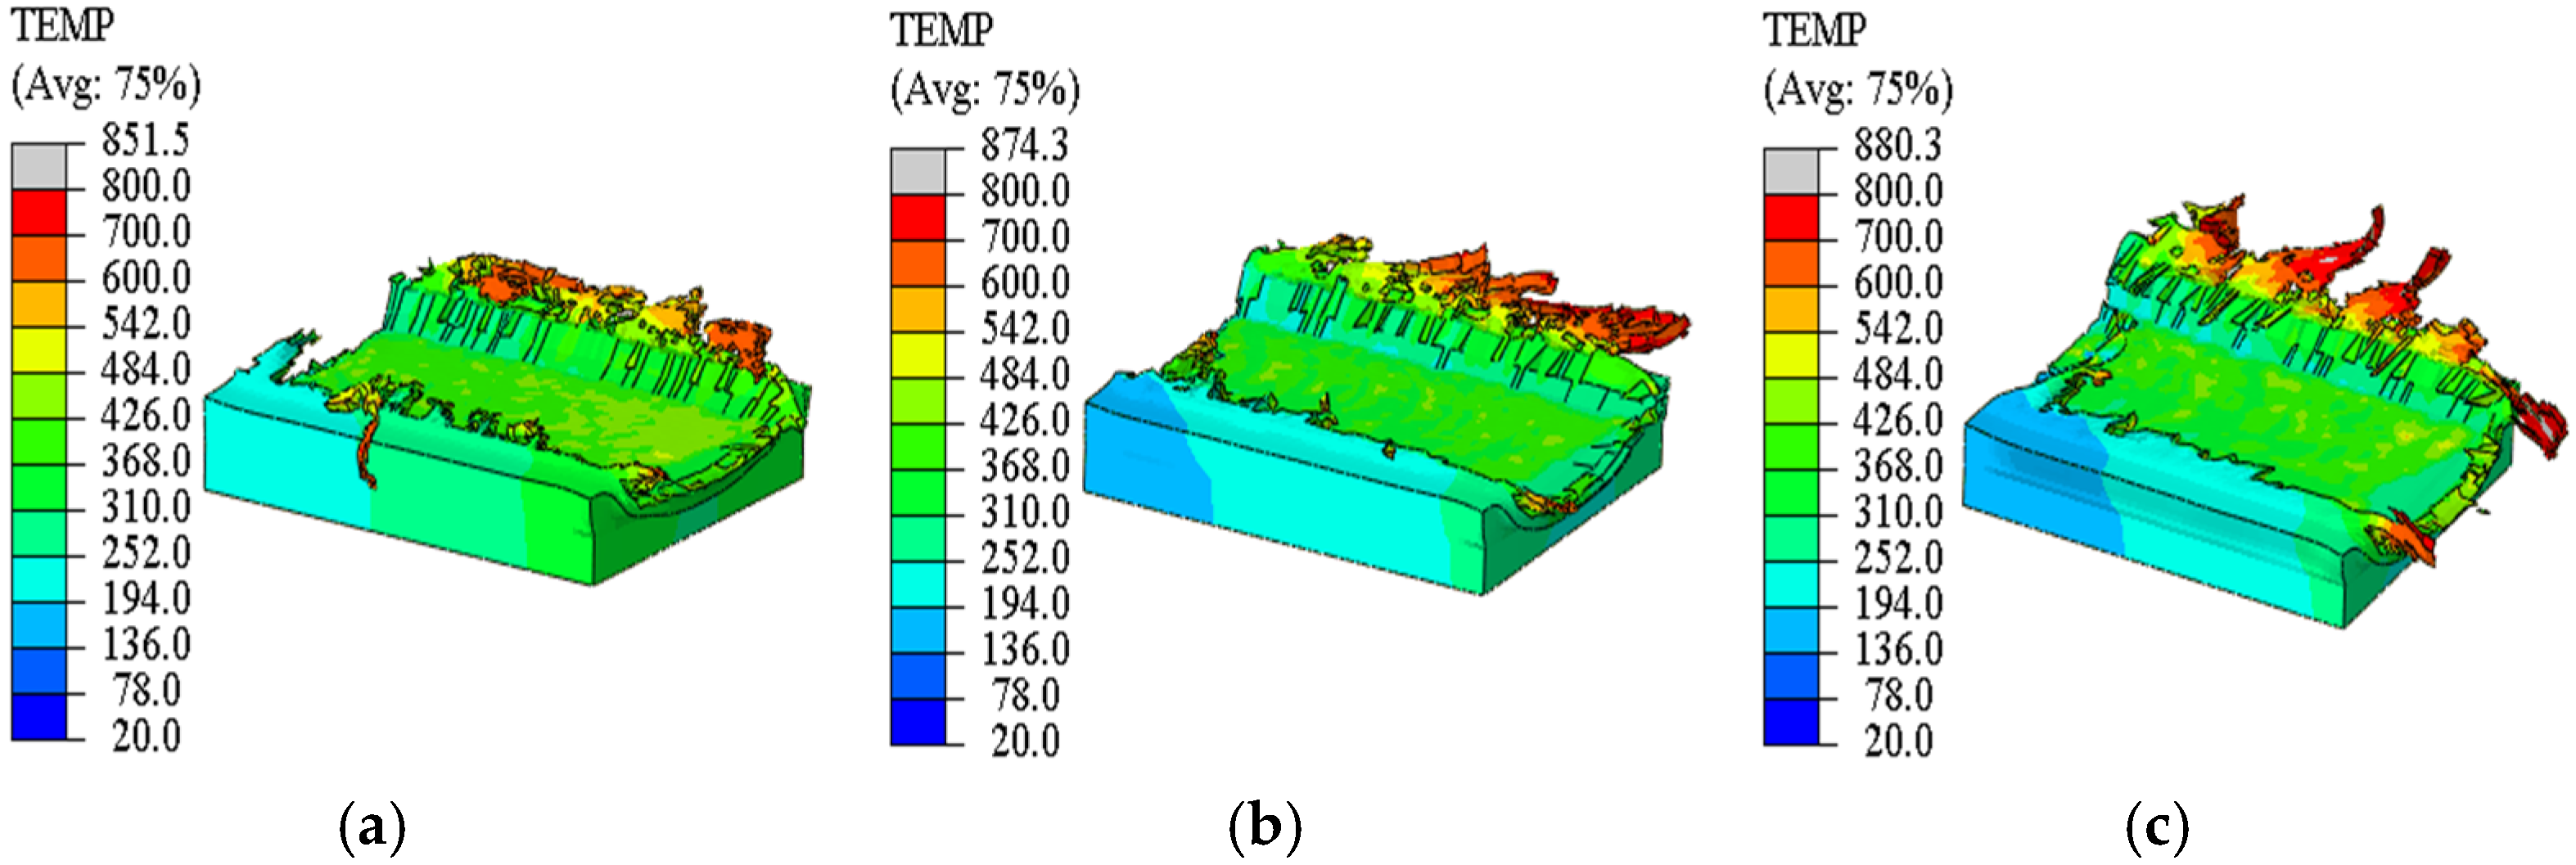
The simulation results shown in
Figure 11,
Figure 12,
Figure 13 and
Figure 14 (where red represents the highest temperature in the color scale) reveal the morphology and temperature distribution characteristics of the burrs; these burrs form irregularly along both sides of the cutting path, exhibiting complex curled and torn shapes. As shown in
Figure 12,
Figure 13 and
Figure 14, the temperature in the top burr region progressively increases with greater tool eccentricity. Furthermore,
Figure 11,
Figure 12,
Figure 13 and
Figure 14 consistently indicate that cutting heat is primarily concentrated in the top burr zone, with the down milling side exhibiting significantly higher temperatures than the up milling side. Beyond thermal effects, variations in process parameters also significantly influence burr morphology. As shown in
Figure 11, increasing the feed per tooth transforms the burr contour from a “short and low” geometry to a “wide and thick” form, accompanied by increased material loss at the groove entrance. Furthermore, as depicted in
Figure 12,
Figure 13 and
Figure 14, a larger tool eccentricity not only widens the burr but also significantly enhances its upward curling tendency.
Based on the simulation results, the distinct influences of feed per tooth and tool eccentricity on burr morphology can be attributed to different underlying material deformation mechanisms. The transition from a “short and low” to a “wide and thick” burr profile with increasing feed per tooth is primarily caused by the overall material pushing effect; a larger uncut chip thickness induces substantially greater cutting forces and plastic deformation energy, leading to massive plastic accumulation and extrusion of workpiece edge material, which consequently forms a wide and thick top burr and aggravates material loss at the groove entrance [
5,
27]. In contrast, the combined effect of increased burr width and upward curling tendency under growing tool eccentricity stems from asymmetric cutting actions. Eccentricity causes uneven instantaneous chip thickness, where the longer cutting edge contributes to burr widening, while the shorter edge—often functioning under a ploughing-dominated regime—induces upward material flow. This asymmetrical ploughing, coupled with elevated localized temperatures that enhance material ductility, stretches and curls the heated material at the exit edge, resulting in a characteristically upward-curved burr morphology.
3.3. Influence of Eccentricity Distance on Burr Size
Using the distance measurement function of the simulation software and based on the burr size definition in
Section 2.7, the simulated burr sizes for various categories are listed in
Table 7.
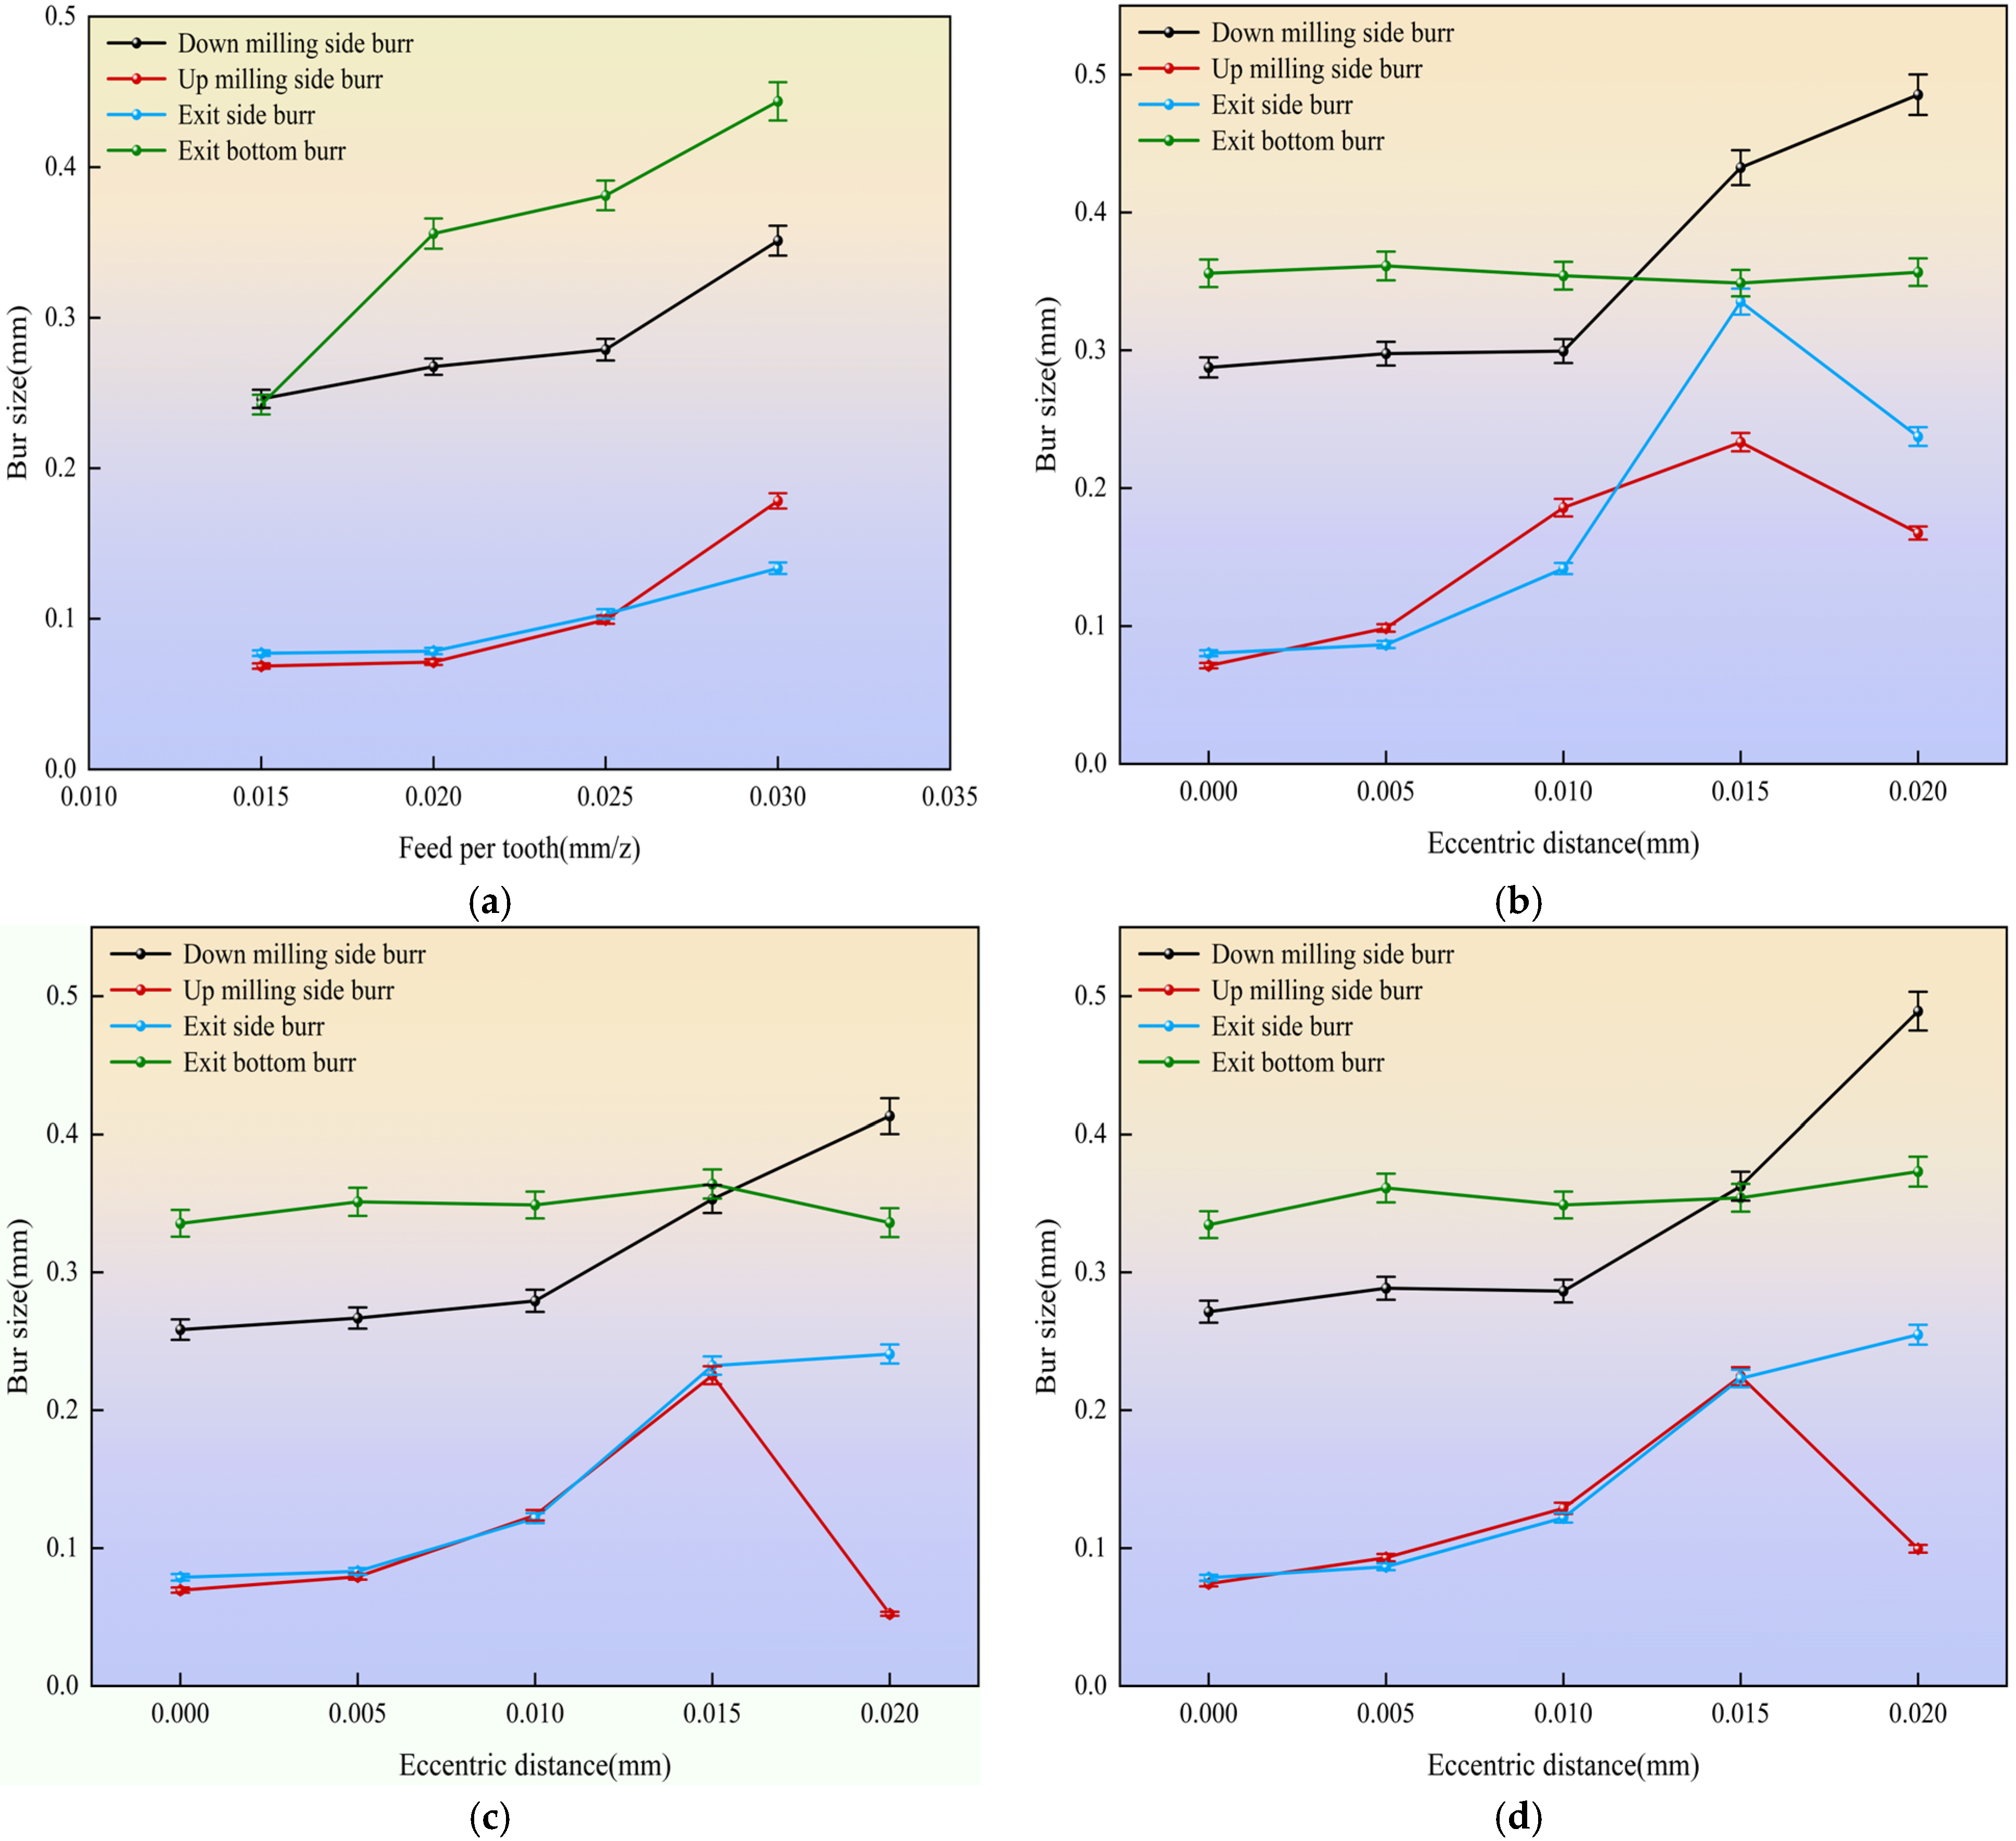
Using the data from
Table 7, we plot the relationship curves between burr size and influencing factors such as feed per tooth and tool eccentricity, as shown in
Figure 15 and
Figure 16.
As illustrated in
Figure 15a, burr dimensions exhibit a clear increasing trend with higher feed per tooth, a finding that aligns with prior research [
27]. Further analysis of
Figure 15b–d and
Table 7 reveals that with increasing tool eccentricity, the dimensions of the top burr grow substantially, whereas the height of the exit bottom burr remains largely stable. Notably, the thickness of the exit side burr initially increases before decreasing rapidly under larger eccentricity. At an eccentricity of 0.02 mm, the top burr width on the down-milling side reaches a maximum average value of 0.4622 mm—approximately 1.7 times that observed under non-eccentric conditions. Similarly, the average top burr width on the up-milling side increases to about 3.3 times the value recorded without eccentricity. Moreover, cross-comparison of
Figure 15a–d and
Table 7 highlights considerable variations in top and exit side burr dimensions across different eccentricity directions. For instance, under the Ey = Ex direction at 0.02 mm eccentricity, the exit side burr thickness attains 0.3353 mm, roughly 1.4 times greater than that in other directional configurations.
The size of burrs influenced by eccentric parameters may stem from changes in instantaneous cutting thickness. According to Reference [
28], when a tool cuts with a single tooth, its unit instantaneous cutting thickness can be expressed as:
In the formula:
and
denote the actual rotational radii (mm) of the (
i − 1)th and
i-th teeth, respectively. As the tool’s eccentricity increases,
grows. This disparity causes inconsistent cutting thicknesses between the two cutting edges, leading to fluctuations in the milling force peaks of the leading and trailing edges. This unhealthy cutting condition, characterized by increased instantaneous cutting thickness, promotes the formation of larger top burrs [
9]. The accompanying temperature rise further softens the material, enhances plastic flow, and accelerates burr growth. In contrast, the exit-bottom burr height remains stable, likely because it is primarily influenced by the milling depth [
7]. Since the milling depth in this study is fixed, fluctuations in exit-bottom burr size are not significant. The non-monotonic variation in exit-side burr thickness may reflect excessive eccentricity’s interference with the effective cutting process. We hypothesize that when eccentricity exceeds a critical threshold, the cutting edge struggles to maintain stable shearing and instead transitions to a contact state dominated by intense extrusion and plowing. Under this mode, material undergoes repeated plastic extrusion rather than effective removal, initially forming thicker burrs. As strain continues to accumulate and potentially exceeds the fracture limit of AISI 304, microscopic tearing may occur at the burr root, causing partial detachment and resulting in reduced thickness.
3.4. Effect of Eccentricity Direction on Burr Size
Observation of
Table 7 and
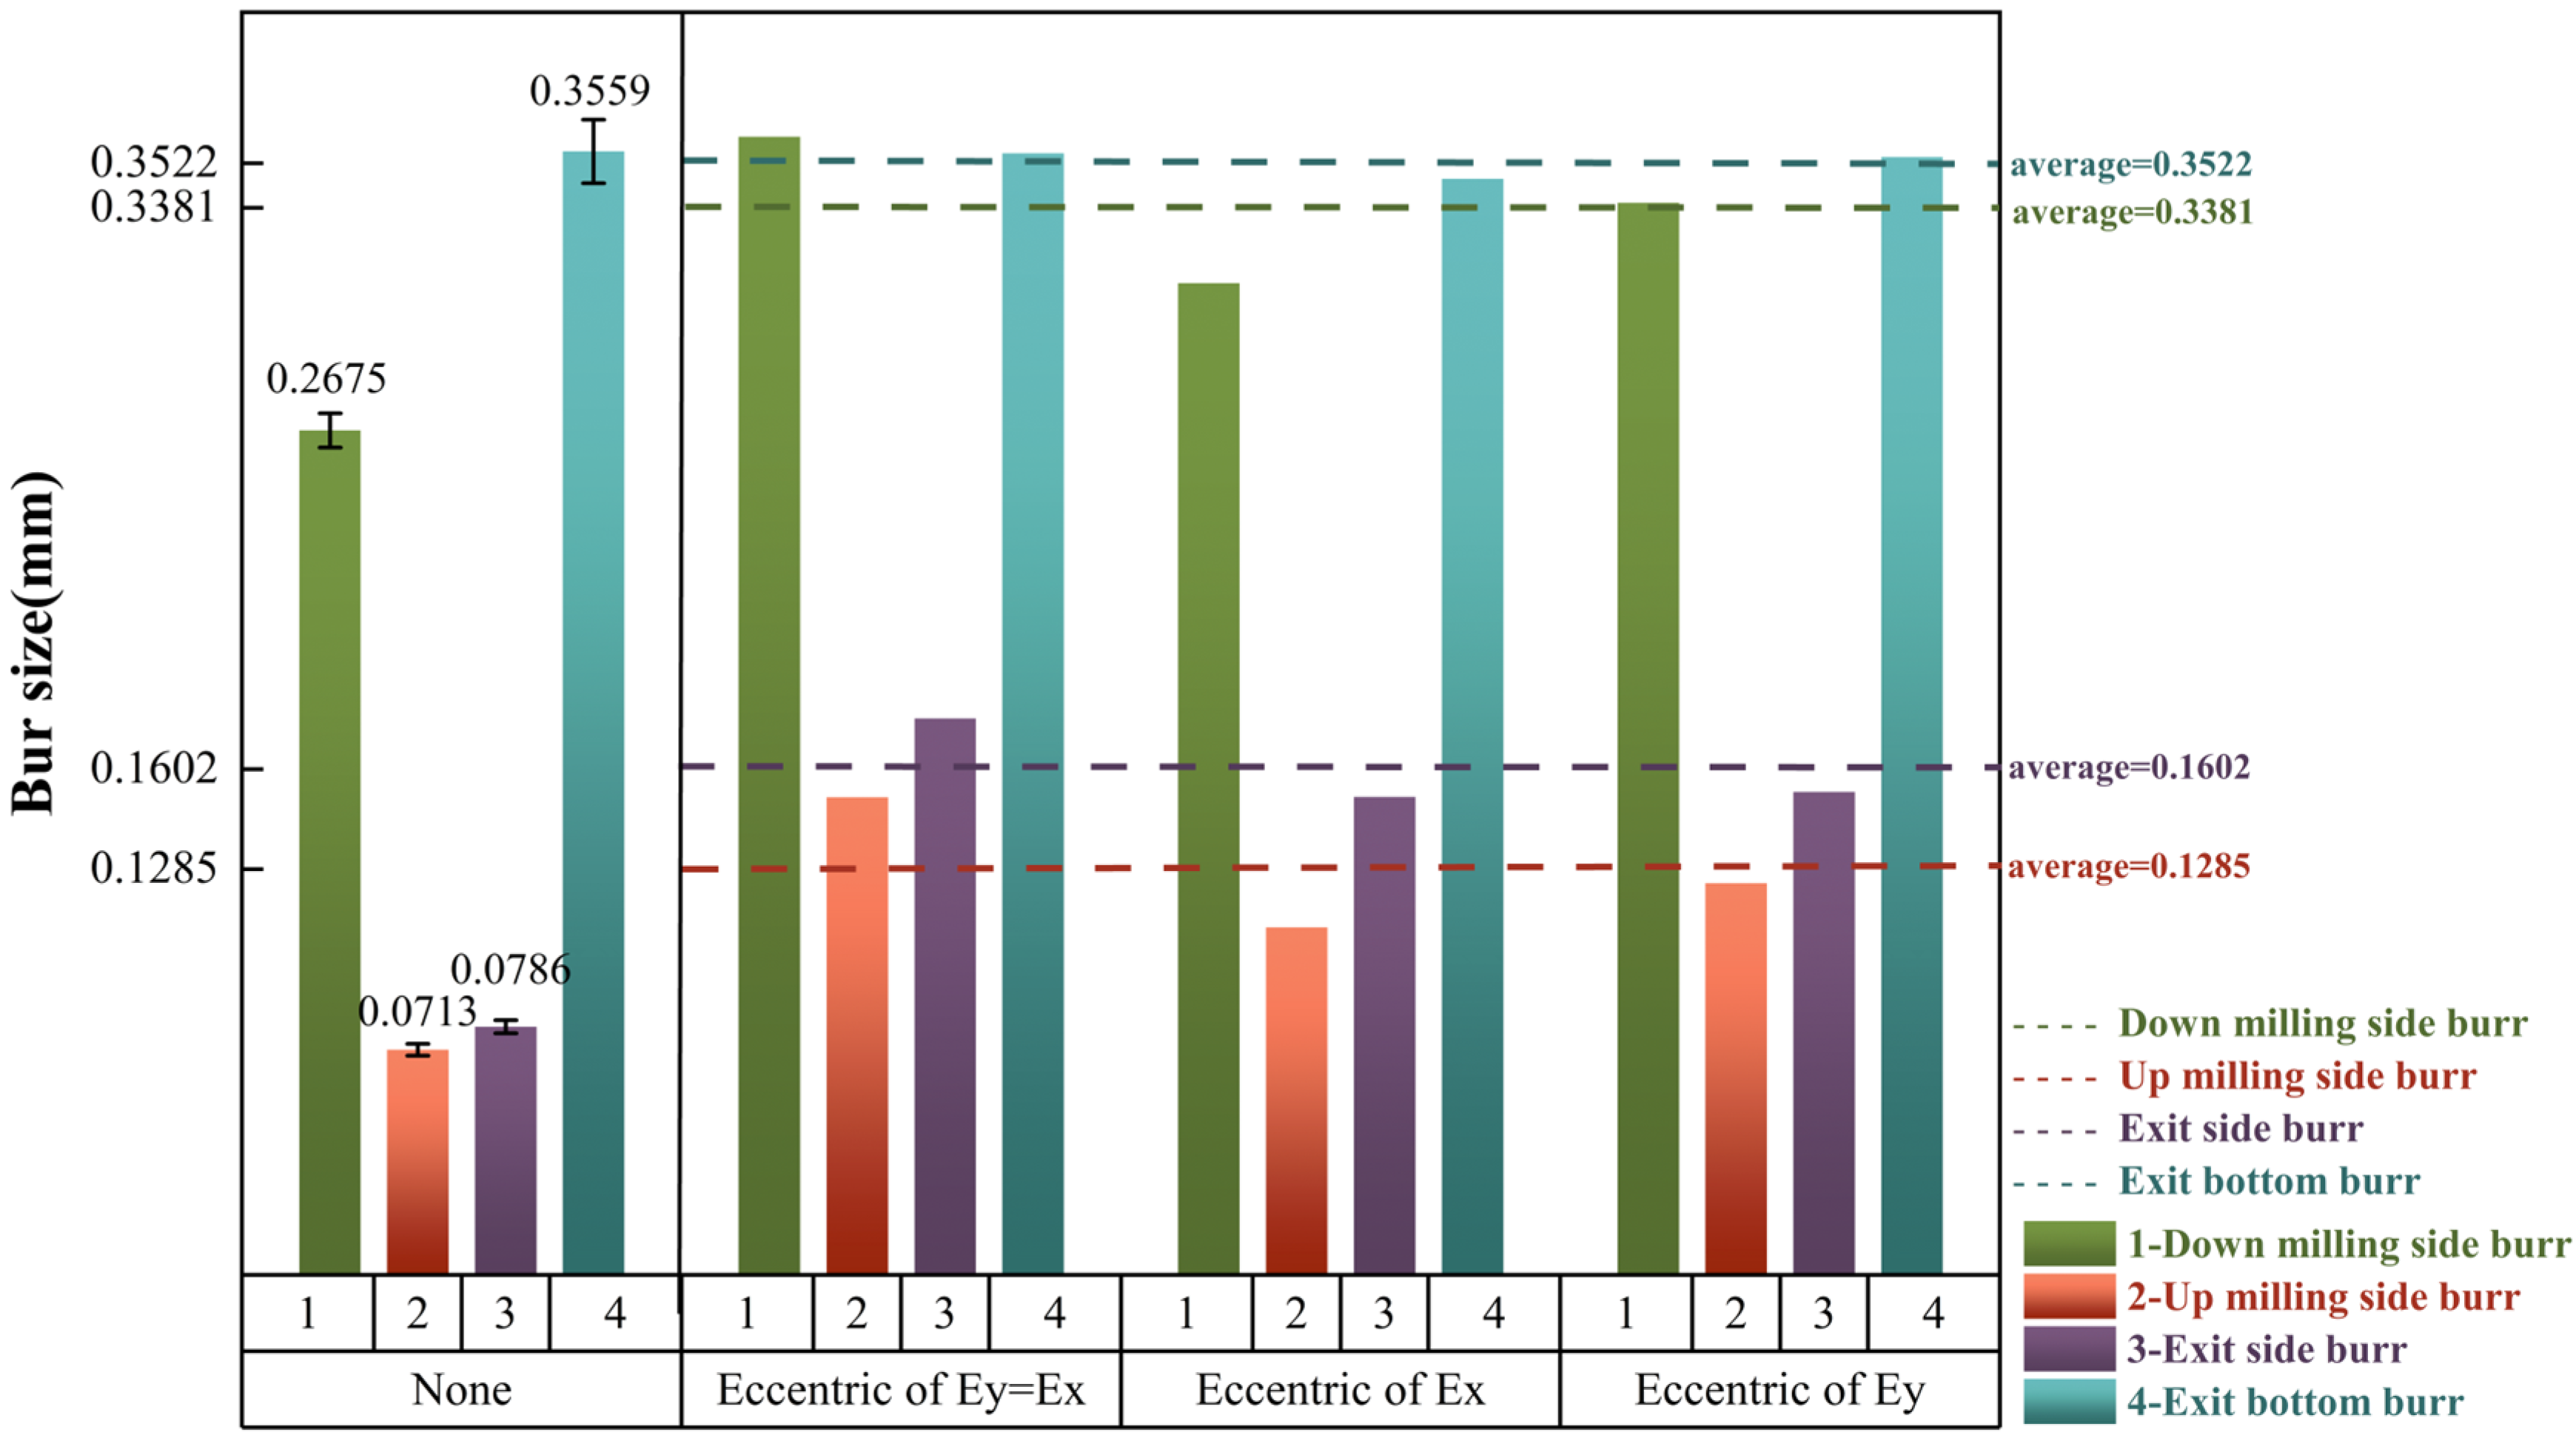
Figure 15 reveals that burr dimensions do not exhibit a monotonic increase with the growth of eccentricity distance. Therefore, the approach of fixing the maximum eccentricity distance to investigate the effect of eccentricity direction is not feasible. In light of this, the average values (*) of burr sizes under the five eccentricity distances were calculated for each burr type; the specific data are presented in
Table 8.
Figure 16 provides a bar chart plotted based on the data from
Table 8.
As illustrated in
Figure 16, the dashed lines represent the average burr sizes across the four burr types under the three eccentricity directions. Comparative analysis reveals that when tool eccentricity is present, different eccentricity directions exert varying influences on burr dimensions relative to the non-eccentric condition. Specifically, when the tool is eccentrically oriented along the Ey = Ex direction, the sizes of all burr types—except for the exit bottom burr—exceed the overall average. This is followed by the Ey direction, while the Ex direction generally results in the smallest burr dimensions among the three. In contrast, the average sizes of the exit bottom burr under all three eccentricity directions remain nearly identical to that under the non-eccentric condition.
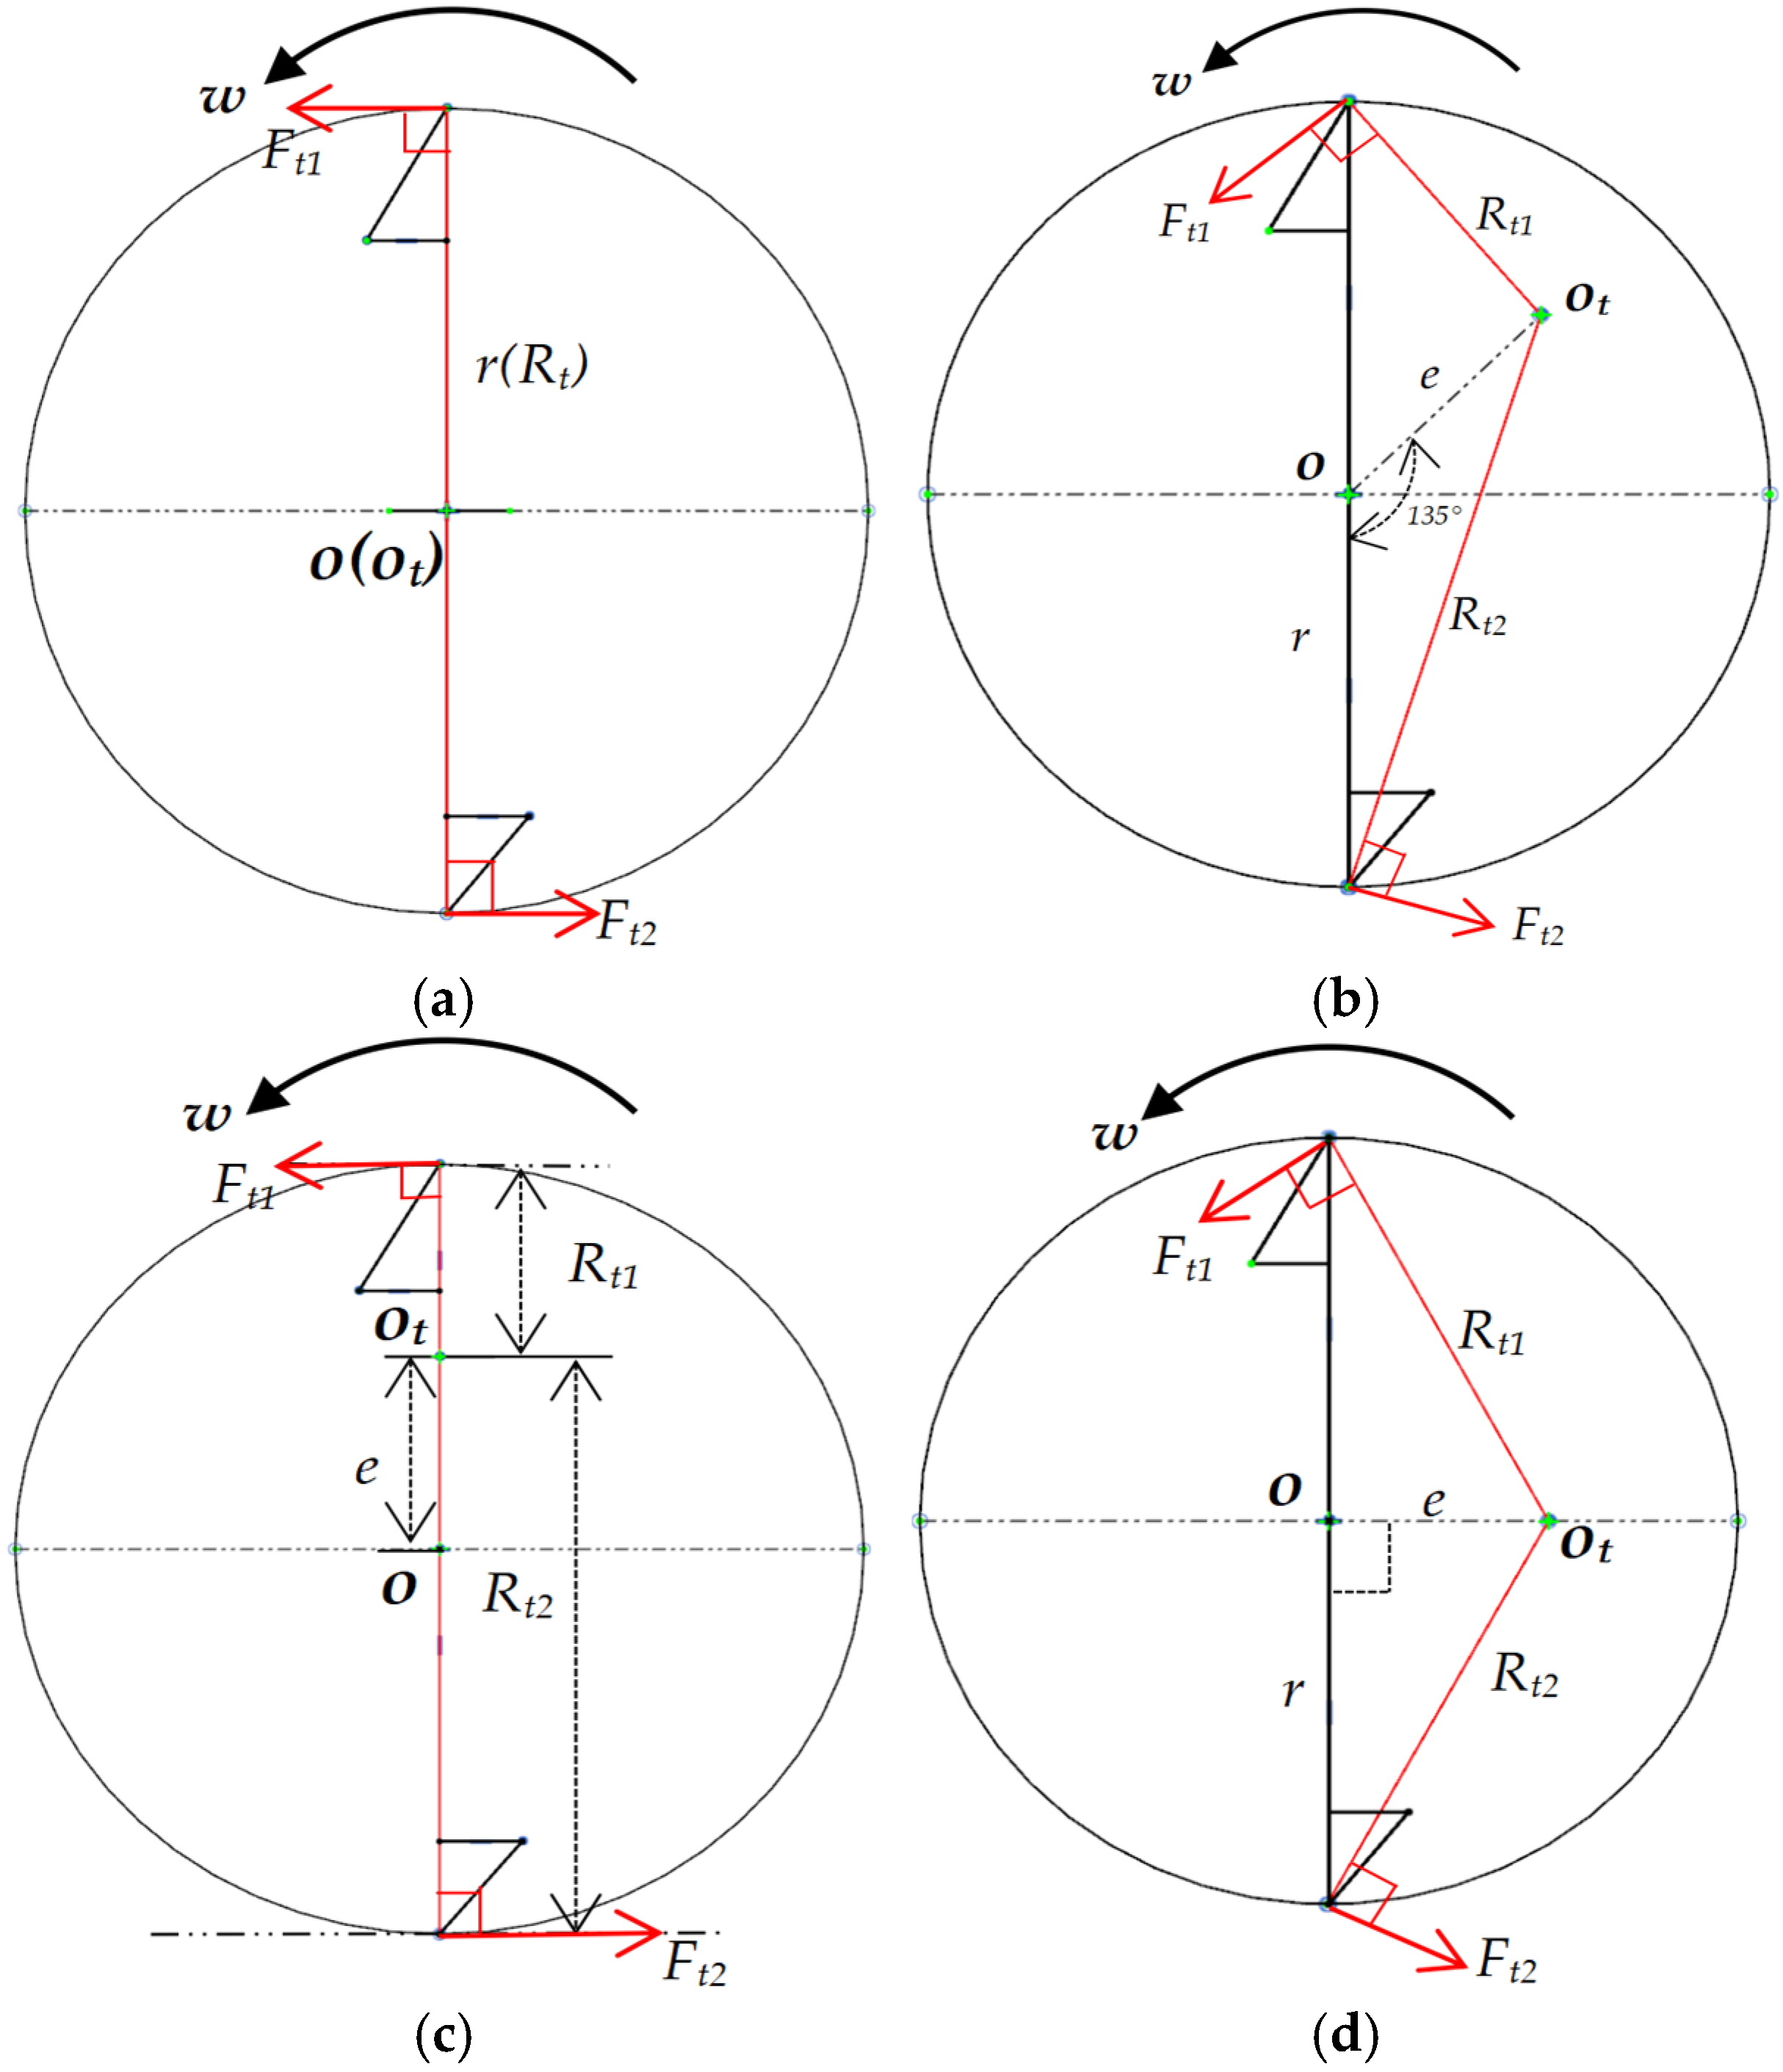
The variation in burr size caused by different eccentric directions is likely attributable to the cutting state of the tool teeth and the effective cutting radius under varying eccentric conditions. When the tool is subjected to no eccentricity, Ex, Ey, and Ey = Ex eccentricity, respectively, as shown in
Figure 17a–d. In the figure, r denotes the cutting radius when the tool is non-eccentric, Rt represents the actual cutting radius of the tool tooth, e is the eccentricity, Ft is the tangential force exerted when the tool tooth cuts the material, and O and Ot are the rotational centers when the tool is non-eccentric and eccentric; the actual cutting radius of the tool is:
Based on theoretical calculations, the relationship between actual cutting radii under various eccentric conditions is R(c) > R(b) > R(d) > R(a). Further analysis of the force direction at the cutting edge reveals that when the tool is only eccentrically offset in the Ex direction, the force directions on both cutting edges are essentially consistent with the non-eccentric state. However, under Ey = Ex and Ey eccentric conditions, the tangential force (Ft) direction significantly deviates from the reference direction observed in the non-eccentric state. Based on this, it is inferred that this change in force direction reduces the tool edge’s material separation capability during cutting, resulting in incomplete cutting phenomena under Ey = Ex and Ey eccentric conditions. Although the maximum cutting radius under Ex eccentricity is larger, the contact pattern between the tool edge and workpiece remains close to the ideal cutting state, allowing relatively smooth chip evacuation and effectively preventing excessive material buildup and significant burr growth. In contrast, under both Ey = Ex and Ey eccentric conditions, both cutting edges operate in non-ideal states. The cutting process exhibits pronounced scraping and plowing behaviors, weakening chip evacuation. Insufficiently separated chips accumulate continuously, accompanied by localized temperature rise, leading to material softening. This process may further impede heat dissipation between the tool and workpiece, forming a vicious cycle of thermal–mechanical coupling. Ultimately, burr size under Ey = Ex and eccentric Ey conditions becomes significantly larger than that under Ex-directional eccentricity.
