Article

Fabrication of Al-Cu Alloy via Additive Friction Stir Deposition

1
State Key Laboratory of Precision Welding and Joining of Materials and Structures, Harbin Institute of Technology, Harbin 150001, China
2
Anhui World Wide Welding Co., Ltd., Hefei 231299, China
*
Author to whom correspondence should be addressed.
J. Manuf. Mater. Process. 2025, 9(12), 387; https://doi.org/10.3390/jmmp9120387
Submission received: 27 October 2025 / Revised: 15 November 2025 / Accepted: 19 November 2025 / Published: 24 November 2025

Abstract

This study fabricated AA2024-T4 aluminum alloy components using Additive Friction Stir Deposition (AFSD) to systematically investigate the effects of tool rotational speed (100–400 rpm) on the macroscopic morphology, microstructure, and mechanical properties of the deposited layers. The results demonstrate that defect-free, fully dense deposits with good surface quality were successfully achieved across the entire speed range under a constant traverse speed. The deposition zone exhibited a homogeneous, fine equiaxed grain structure with an average grain size of 2.01 μm. As the rotational speed decreased from 400 rpm to 200 rpm, the ultimate tensile strength in the longitudinal direction increased from 340 MPa to 390 MPa, indicating that a moderate reduction in rotational speed enhances both the strength and ductility of AFSD-fabricated AA2024. This research provides the first revelation of the bidirectional material flow behavior and the mechanisms underlying regional property variations in AA2024 during AFSD. Furthermore, the contributions of different strengthening mechanisms were quantified using a multi-mechanism strength model. These findings offer a significant foundation and theoretical support for the solid-state additive manufacturing of high-performance Al-Cu alloy components.

1. Introduction

AA2024-T4 aluminum alloys belong to age-hardened aluminum alloys, in which the strengthening phase is precipitated in the aluminum matrix, and the comprehensive mechanical properties of aluminum alloys can be effectively improved based on the dispersion strengthening effect produced by regulating the solidification process, solution-aging temperature and time. Typical Al-Cu alloys such as AA2024 are important lightweight structural materials in the fields of aerospace, automotive industry and shipbuilding due to their high specific strength, specific stiffness, excellent corrosion resistance and fatigue resistance. Traditional AA2024 components are mainly manufactured by forming processes such as casting, extrusion and forging, but there are many challenges in the manufacturing of large-scale integrated structures, such as insufficient strength and toughness of components, low material utilization, long processing cycle and high manufacturing cost. Metal additive manufacturing with laser or wire arc provides a new way to achieve rapid prototyping manufacturing of large-scale integrated lightweight aluminum alloy structures. However, since Al-Cu alloys generally have inherent limitations such as a wide solidification temperature range, easy formation of oxide film and high sensitivity to thermal cracking, it is difficult to obtain additive components without pores and microcracks using additive manufacturing processes based on fusion welding processes [1]. This limits the widespread application of additive manufacturing forming processes such as laser or wire arc in the field of high-strength aluminum alloy structure manufacturing [2].
Given various metallurgical structures and defects in aluminum alloy laser or wire arc additive manufacturing, many researchers have conducted many studies on solid-phase additive manufacturing processes based on the principle of friction welding [3]. Among them, the additive friction stir deposition (AFSD) process proposed by the American MELD company in 2018 has significant advantages [4]. It is based on the principles of friction stir welding and friction surfacing, and employs a printing tool with a central channel to transport solid rods. Through axial forging pressure and high-speed rotation collaborative actions, the feed rod is frictionally extruded to deposit layer by layer on the substrate to form an additive component [5]. Compared with the traditional fusion welding additive processes, the AFSD process does not include the melting and solidification process [6]. Therefore, it will not produce metallurgical defects such as pores and thermal cracks when used in aluminum alloy additive manufacturing, thus it is expected to overcome the limitations of metal additive manufacturing technology based on melting processes. The AFSD process can realize a near-net-shape additive manufacturing process with high additive deposition efficiency and low energy consumption; the additive component has a completely dense structure and low residual stress and deformation, so it has attracted widespread attention from the industry and researchers in the field of high-strength aluminum alloy structure manufacturing [7].
Currently many research institutions have conducted AFSD process experiments on basic issues such as forming mechanism, microstructure and properties regulation [8,9,10]. For example, investigations on AA6061 and AA5083 have shown that the aluminum alloy deposited zone will undergo obvious continuous dynamic recrystallization due to the strong thermal-mechanical coupling shear strain during the AFSD process, and the degree of recrystallization can reach more than 70–80%, forming a fine equiaxed crystal forging microstructure similar to the nugget zone of friction stir welding [11,12,13]. Compared with the coarse microstructure of the original rolled/drawn bar material, its grain size will be significantly reduced to 6–9 μm, and the fine-grain strengthening effect is significant. For precipitation-strengthened aluminum alloys, the deposited zone has a significant softening phenomenon due to the multiple thermal cycles of the deposited layer, so that the tensile strength of the additive component is only 55–70% of the parent material, while the elongation is significantly improved and reached about 200–240% of the parent material. Rivera et al. [14] conducted the first experimental study on the microstructure and properties of AA2219 manufactured by AFSD for Al-Cu alloys. The experiments showed that due to the significant dynamic recrystallization of the deposited layer, the average grain size of the additively manufactured component was significantly refined to 2.5 μm compared with that of the bar material. However, due to the dissolution of the θ′ precipitation strengthening phase in the deposition zone and the coarsening of the equilibrium phase θ, the hardness distribution along the building direction showed an obvious softening phenomenon. The yield stress and tensile strength of AA2219 in the printed state were 143–148 MPa and 355–363 MPa, respectively, which were significantly lower than the yield stress and tensile strength of T851 in the heat-treated state of 350 MPa and 455 MPa. However, the fracture elongation of the printed state was 24–26%, which was significantly higher than the 10% of the heat-treated state. Anderson-Wedge et al. evaluated the fatigue performance of additive components based on the optimization of the AA2219 AFSD process [15]. The grain size of the deposited layer was approximately 5.5 times smaller than that of the bar parent material, and the precipitation strengthening phases of θ′ and θ″ in the deposition zone were completely dissolved, which significantly reduced the tensile strength of the deposited layer. Its symmetrical cyclic strain fatigue performance was lower than that of the forged bar parent material. Mackenzie E.J. Perry et al. [16] conducted a detailed experimental study on the plastic flow, mixing and microstructural feature of the material around the deposition interface of AA2024 during the AFSD process, confirming that the interface of the AFSD deposited layer has a non-planar plastic deformation metallurgical bonding mechanism. The printing tool with protrusions effectively promotes the mixing of materials near the interface and forms uniform continuous dynamic recrystallized grains in the deposited layer, but did not discuss in detail the interaction between the AFSD process parameters and the microstructure and performance of AA2024 deposited materials. The AFSD forming process is strongly dependent on process parameters such as spindle rotational speed, feeding speed, transverse moving speed and the thickness of the single deposited layer, and the process window of AFSD parameters for different aluminum alloy types is significantly different. Since Al-Mg-Si series aluminum alloys have excellent hot plastic extrusion processing characteristics, the deposited components with smooth surfaces and no flash defects can be obtained in the range of rotational speed 300–900 rpm and transverse moving speed 60–200 mm/min; however, there is currently a lack of profound experiments on the interactive influence of AFSD process-structure-performance of Al-Cu series high-strength aluminum alloys, and It is necessary to research the variation range of AFSD process parameters.
In this study, the AFSD process experiment was conducted on AA2024-T4 to explore the variation range of deposited parameters, macroscopic forming features and defect generation mechanism of AA2024-T4 via AFSD, and especially to evaluate the effects of different rotation speeds on the AFSD forming characteristics, deposited layer microstructure and mechanical properties of AA2024. The obtained results may provide important experimental and theoretical basis to fabricate the high performance of AA2024 load-bearing components by AFSD.

2. Materials and Methods

The AA2024-T4 was selected as the material for both the feed rod and the substrate to perform the AFSD experiment. The AA2024 substrate thickness was 10 mm, and the square bars with a size of 16 × 16 mm2 were made for feedstock. The chemical composition and mechanical properties of the bar parent material are shown in Table 1 and Table 2.
The schematic of AFSD processing and the specific directions of specimens is shown in Figure 1, including the shape of the printing tool, the building direction (BD), longitudinal direction (LD), and transverse direction (TD) of the specimen, respectively. The printing tool for AFSD was made from H13 with a diameter of 40.0 mm, and the bottom surface of the tool head was flat. The center of the tool section contains a square channel of the same size as the feedstock. The deposition for additive specimen was carried out at four tools rotational rates of 100, 200, 300, and 400 rpm, respectively, with the constant transverse moving speed of 100 mm/min, and the thickness of single track deposited layer between the tool head and substrate was set to be 2.5 mm with a feed speed of 1.3 mm/min. The feed rod was reciprocally deposited layer by layer continuously eight times with a final deposited height of 20 mm. All AFSD experiments were performed using the friction stir deposition equipment with a constant displacement control mode independently developed by Anhui World Wide Welding Co., Ltd (Hefei, China). The K-type thermocouples were embedded into the interface between the first deposited layer and substrate to measure the variation in the thermal cycle temperature during the AFSD process, and the thermocouples were placed at the center zone (CZ), advancing side (AS), and retreating side (RS) of the deposited layer, respectively. The metallographic and micro-tensile specimens were cut along the LD and BD, respectively, using an electrical discharge cutting machine. After mechanical grinding and polishing, the metallographic specimens were etched with Keller reagent (95% H2O, 2.5% HNO3, 1.5% HCl, 1% HF), and then the macro and micro structures of the specimens were observed with an optical microscope and an ultra-depth vertical microscope. Electron Backscatter Diffraction (EBSD) specimens were prepared by electropolishing. The microstructure was further analyzed by transmission electron microscopy (TEM), and the fracture morphology and fracture mode of the tensile specimens were analyzed by SEM. To evaluate the mechanical properties of different positions in the deposition zone, micro-tensile tests were carried out on the deposition area. The tensile test was carried out, and the tensile speeds was 2 mm/min.

3. Results

3.1. Effects of Rotational Rate on Macroscopic Morphology

Figure 1 shows the formation of 2024 aluminum alloy at different rotational speeds during the AFSD process. As the rotational speed increases, the spacing between surface arc lines decreases. Meanwhile, surface roughness first decreases and then increases. At a rotational speed of 300 rpm, the sample surface is the smoothest. To further analyze surface formation, the height differences on the sample surfaces at different rotational speeds were measured. The measurement results show that the height differences at 200 rpm and 300 rpm are 376.78 and 339.82, respectively, with surface roughness values of Ra 3.4 and Ra 3.7. At 400 rpm, the surface roughness significantly increases, reaching Ra 6, and the side flash becomes extremely rough. This is because, as the rotational speed increases, the shear force applied by the shoulder to the material also increases. The heat beneath the shoulder was calculated using Equations (1)–(3) [17]. According to Equations (1)–(3), the heat generation increases during the AFSD process.
Q ˙   =   Q ˙ f   +   Q ˙ p
where Q ˙ , Q ˙ f and Q ˙ p represents the rate of total heat generation, rate of frictional heat generation, and rate of heat generation due to plastic deformation, respectively. Coulomb’s friction law defines the friction at the contact interface between the Eulerian domain and the Lagrangian body. Therefore, the heat is generated by friction:
Q ˙ f   =   ϕ τ s γ ˙
τ s   =   μ p
where τ s , μ, p, τ s and γ ˙ are frictional shear stress, frictional coefficient, contact pressure, frictional heat factor, and slip rate, respectively. Therefore, at 400 rpm, the heat input is the highest in this experiment. According to the equation [18]:
σ   =   A T m T T m T r m 1   +   B 1 ln ε ¯ ˙ ln D 0 p n 1 ε ¯ p n 0 T m T T m T r m 2 ε ¯ ˙ ε ˙ * c
where the initial yield stress at the reference condition is characterized by parameter A ≈ 265 MPa. Strain hardening is governed by coefficient B ≈ 426 MPa and the strain hardening exponent n0 ≈ 0.34. The model captures the material’s strain rate sensitivity through two key parameters: the primary strain rate exponent C ≈ 0.001 and a secondary constant n1 ≈ −0.015 within the strain hardening term. A defining feature of the model is the upper-bound strain rate constant D 0 p ≈ 1,000,000 s−1. Thermal softening effects are represented by the exponent m ≈ 1.56, which modulates the flow stress based on the homologous temperature. The model is defined with a reference strain rate ε ˙ * = 1.0 s−1, a reference temperature Tr = 298 K (room temperature), and a melting temperature Tm = 775 K for the 2024 aluminum alloy. The material flow stress decreases with increasing heat input. Therefore, at 400 rpm, the material flow stress decreases, making it easier for the material to detach from the shoulder and be flung out, forming a flash. The formation of flash leads to material loss in the shoulder region, resulting in surface depressions on the specimen. As a result, the surface roughness is the highest at 400 rpm.
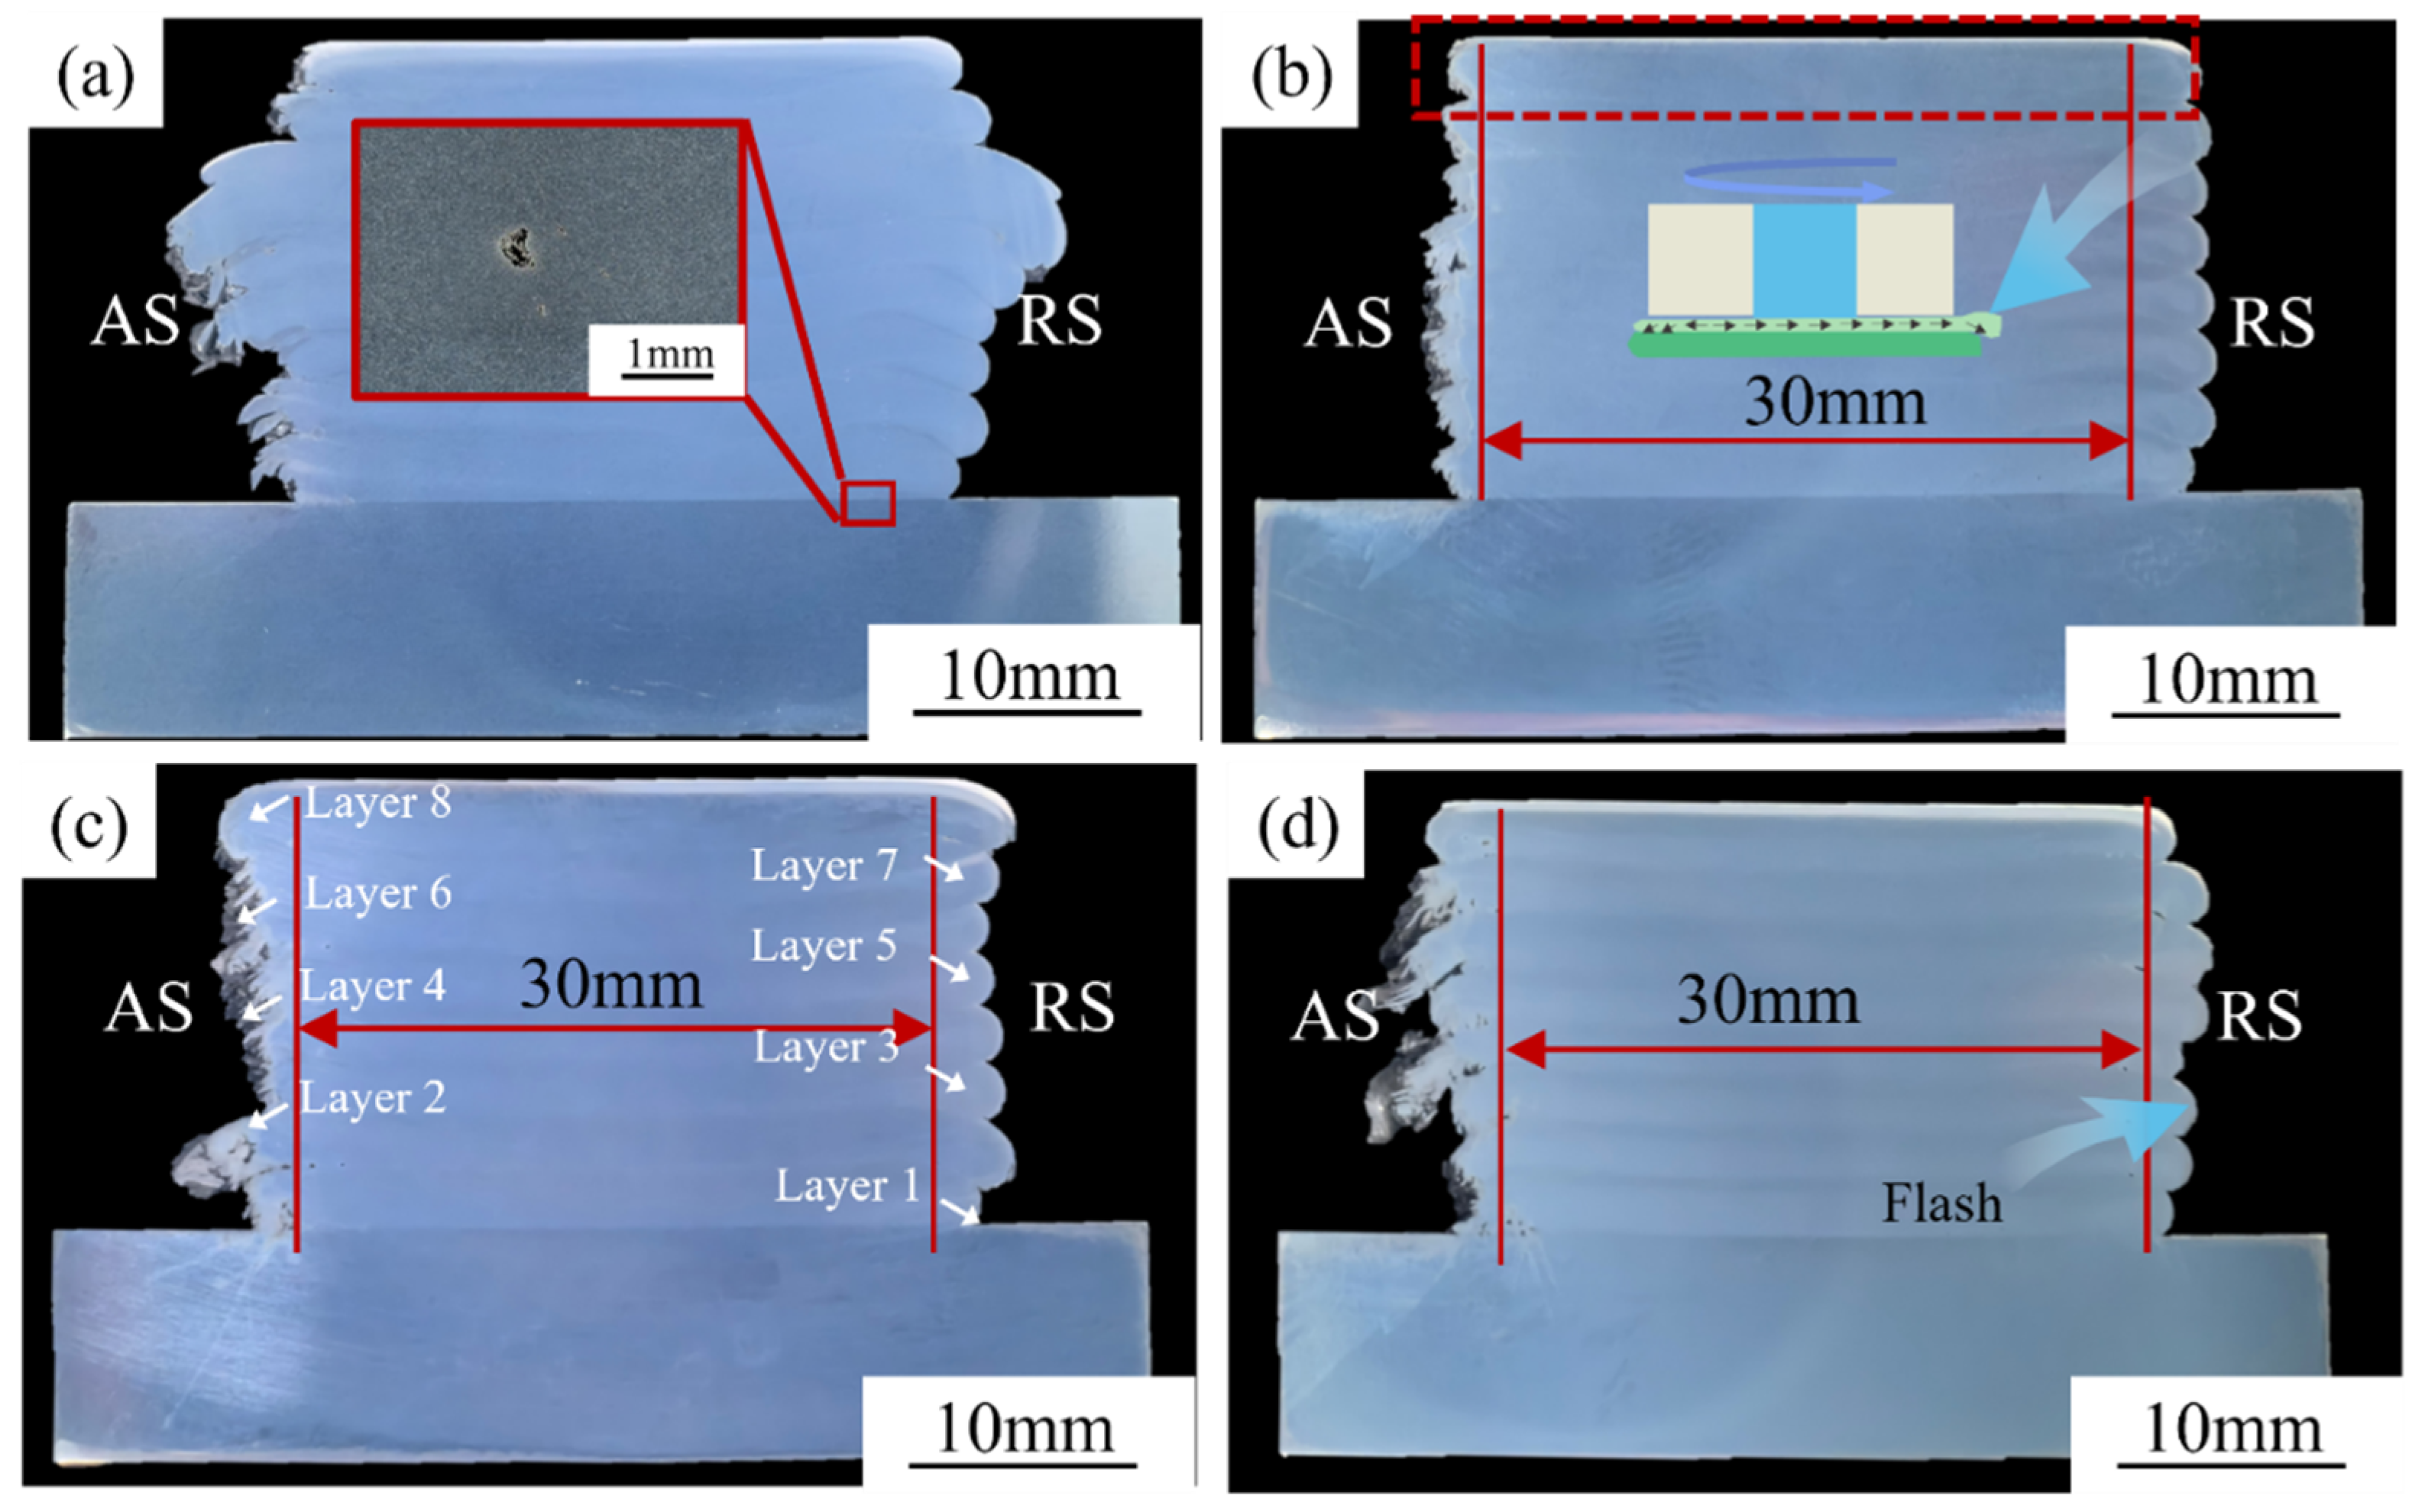
To better study the forming process of AFSD, the cross-sectional morphology of the sample was analyzed (Figure 2). Figure 2 shows that the sample is deposited layer by layer. Additionally, the flash on the RS is smoother than that on the AS. At a rotational speed of 100 rpm, the cross-sectional morphology of the sample shows a trend of being narrower at the bottom and wider at the top. This is because, during the AFSD process, the temperature of the first layer is relatively low. According to Equation (4), the material flow stress is high, preventing the material from fully spreading, and defects are observed between the layers. However, as the number of layers increases, thermal accumulation in the sample also increases. Consequently, the flow stress of the upper deposited layers decreases, making the material easier to spread. When the rotational speed reaches 200 rpm and 300 rpm, the cross-sectional width becomes more uniform. Apart from the flash, no traces between the layers can be observed. At 400 rpm, the flash gradually increases, and the flash on the AS becomes significantly larger than that on the RS. This observation is consistent with the phenomenon observed in Figure 1d. The material formation processes on the AS and RS were observed to investigate the morphological differences in flash formation between AS and RS. The results are presented in attachments 1 and 2. In the AFSD, the deposited layer does not entirely flow in the direction of tool rotation but instead splits into two flow directions. One flow direction follows the tool’s rotation from the AS, moving along the tool’s front edge to the RS. The other flow direction involves material on the AS moving against the tool’s rotation, entering the RS along the tool’s rear edge.
To better study the material flow behavior during the AFSD process, Figure 3 presents a schematic of the material flow process. At the beginning of AFSD, the material beneath the shoulder gradually increases (Figure 3b), and the material on the RS moves from the front edge of the tool to the rear edge following the direction of the shoulder rotation. When the volume of material being fed is greater than or equal to the volume of material deposited beneath the shoulder, the space on the RS under the shoulder is filled, and the excess material moves against the direction of shoulder rotation to fill the AS (Figure 3c). At this point, the material entering the AS and the material entering the RS converge to form a complete deposited layer (Figure 3e). Meanwhile, because the material flow on the AS is opposite to the direction of shoulder rotation, the resistance at the shoulder edge is greater than the material’s plastic deformation force, causing the AS flash to fracture. When the volume of material being fed is less than the volume of material deposited beneath the shoulder, the material can only fill the RS (Figure 3d), resulting in defects on the AS. The width of the deposited layer will be less than the shoulder diameter (Figure 3f).

3.2. Effects of Rotational Rate on Microstructures

The findings above reveal two material flow directions beneath the shoulder in the AFSD process: one along the AS and the other along the RS. Therefore, samples were taken from the AS, CZ, and RS of the specimen at 200 rpm to analyze the microstructural evolution at different locations (Figure 4). In different regions, the grains exhibit elongation along the shear direction. This is because, during the AFSD process, the material moves in the direction of tool rotation due to friction or in the opposite direction under the influence of thrust (Figure 3). The stress exerted on the material elongates the grains, forming elongated grains. Fine equiaxed grains form at the boundaries of these elongated grains, with sizes ranging from 1.2 μm to 2.9 μm. The AS has more equiaxed grains than the RS. Additionally, the AS has the smallest average grain size, at 1.95 μm. This is because the material on the AS moves against the tool rotation direction, experiencing higher stress (Figure 3).
This stress breaks the grains into fine equiaxed grains. The average grain size in the CZ is similar to that in the RS, at 2.01 μm and 2.00 μm, respectively. Additionally, the AS has the lowest geometrically necessary dislocations (GNDs) among the three regions, with a value of 3.06 × 10¹⁴ m−2. The CZ has the highest GNDs, reaching 3.32 × 10¹⁴ m−2. This is because, after dynamic recrystallization on the AS, large grains break into fine equiaxed grains, leading to the disappearance of many dislocations within the grains. However, in the CZ, the lower stress results in fewer instances of dynamic recrystallization, leaving a large number of dislocations within the grains.
When the rotational speed increased to 400 rpm, the average grain size and GNDs trends for AS, CZ, and RS were similar to those at 200 rpm (Figure 5). The average grain sizes for the three regions were 2.71 μm, 2.83 μm, and 2.88 μm, respectively. This is larger than at 200 rpm. This is because, at a rotational speed of 400 rpm, the temperature in the deposition area is higher than at 200 rpm (Equation (2)), thus the grains gain more energy and grow. Similarly, the increased rotational speed intensifies the plastic flow (Equations (5)–(7)) [19], leading to the accumulation of more dislocations in the deposited layer, which results in an increase in GNDs.
σ ij   =   2 3 σ ¯ ε ¯ ˙ ε ˙ i j
ε ¯ ˙   =   3 2 ε ˙ i j ε ˙ i j 1 2
σ ¯   =   3 2 σ ij σ ij 1 2
where σ ij represents the deviatoric stress tensor, σ ¯ represents the equivalent stress, ε ¯ ˙ is the equivalent strain rate, and ε ˙ i j is the strain rate tensor.
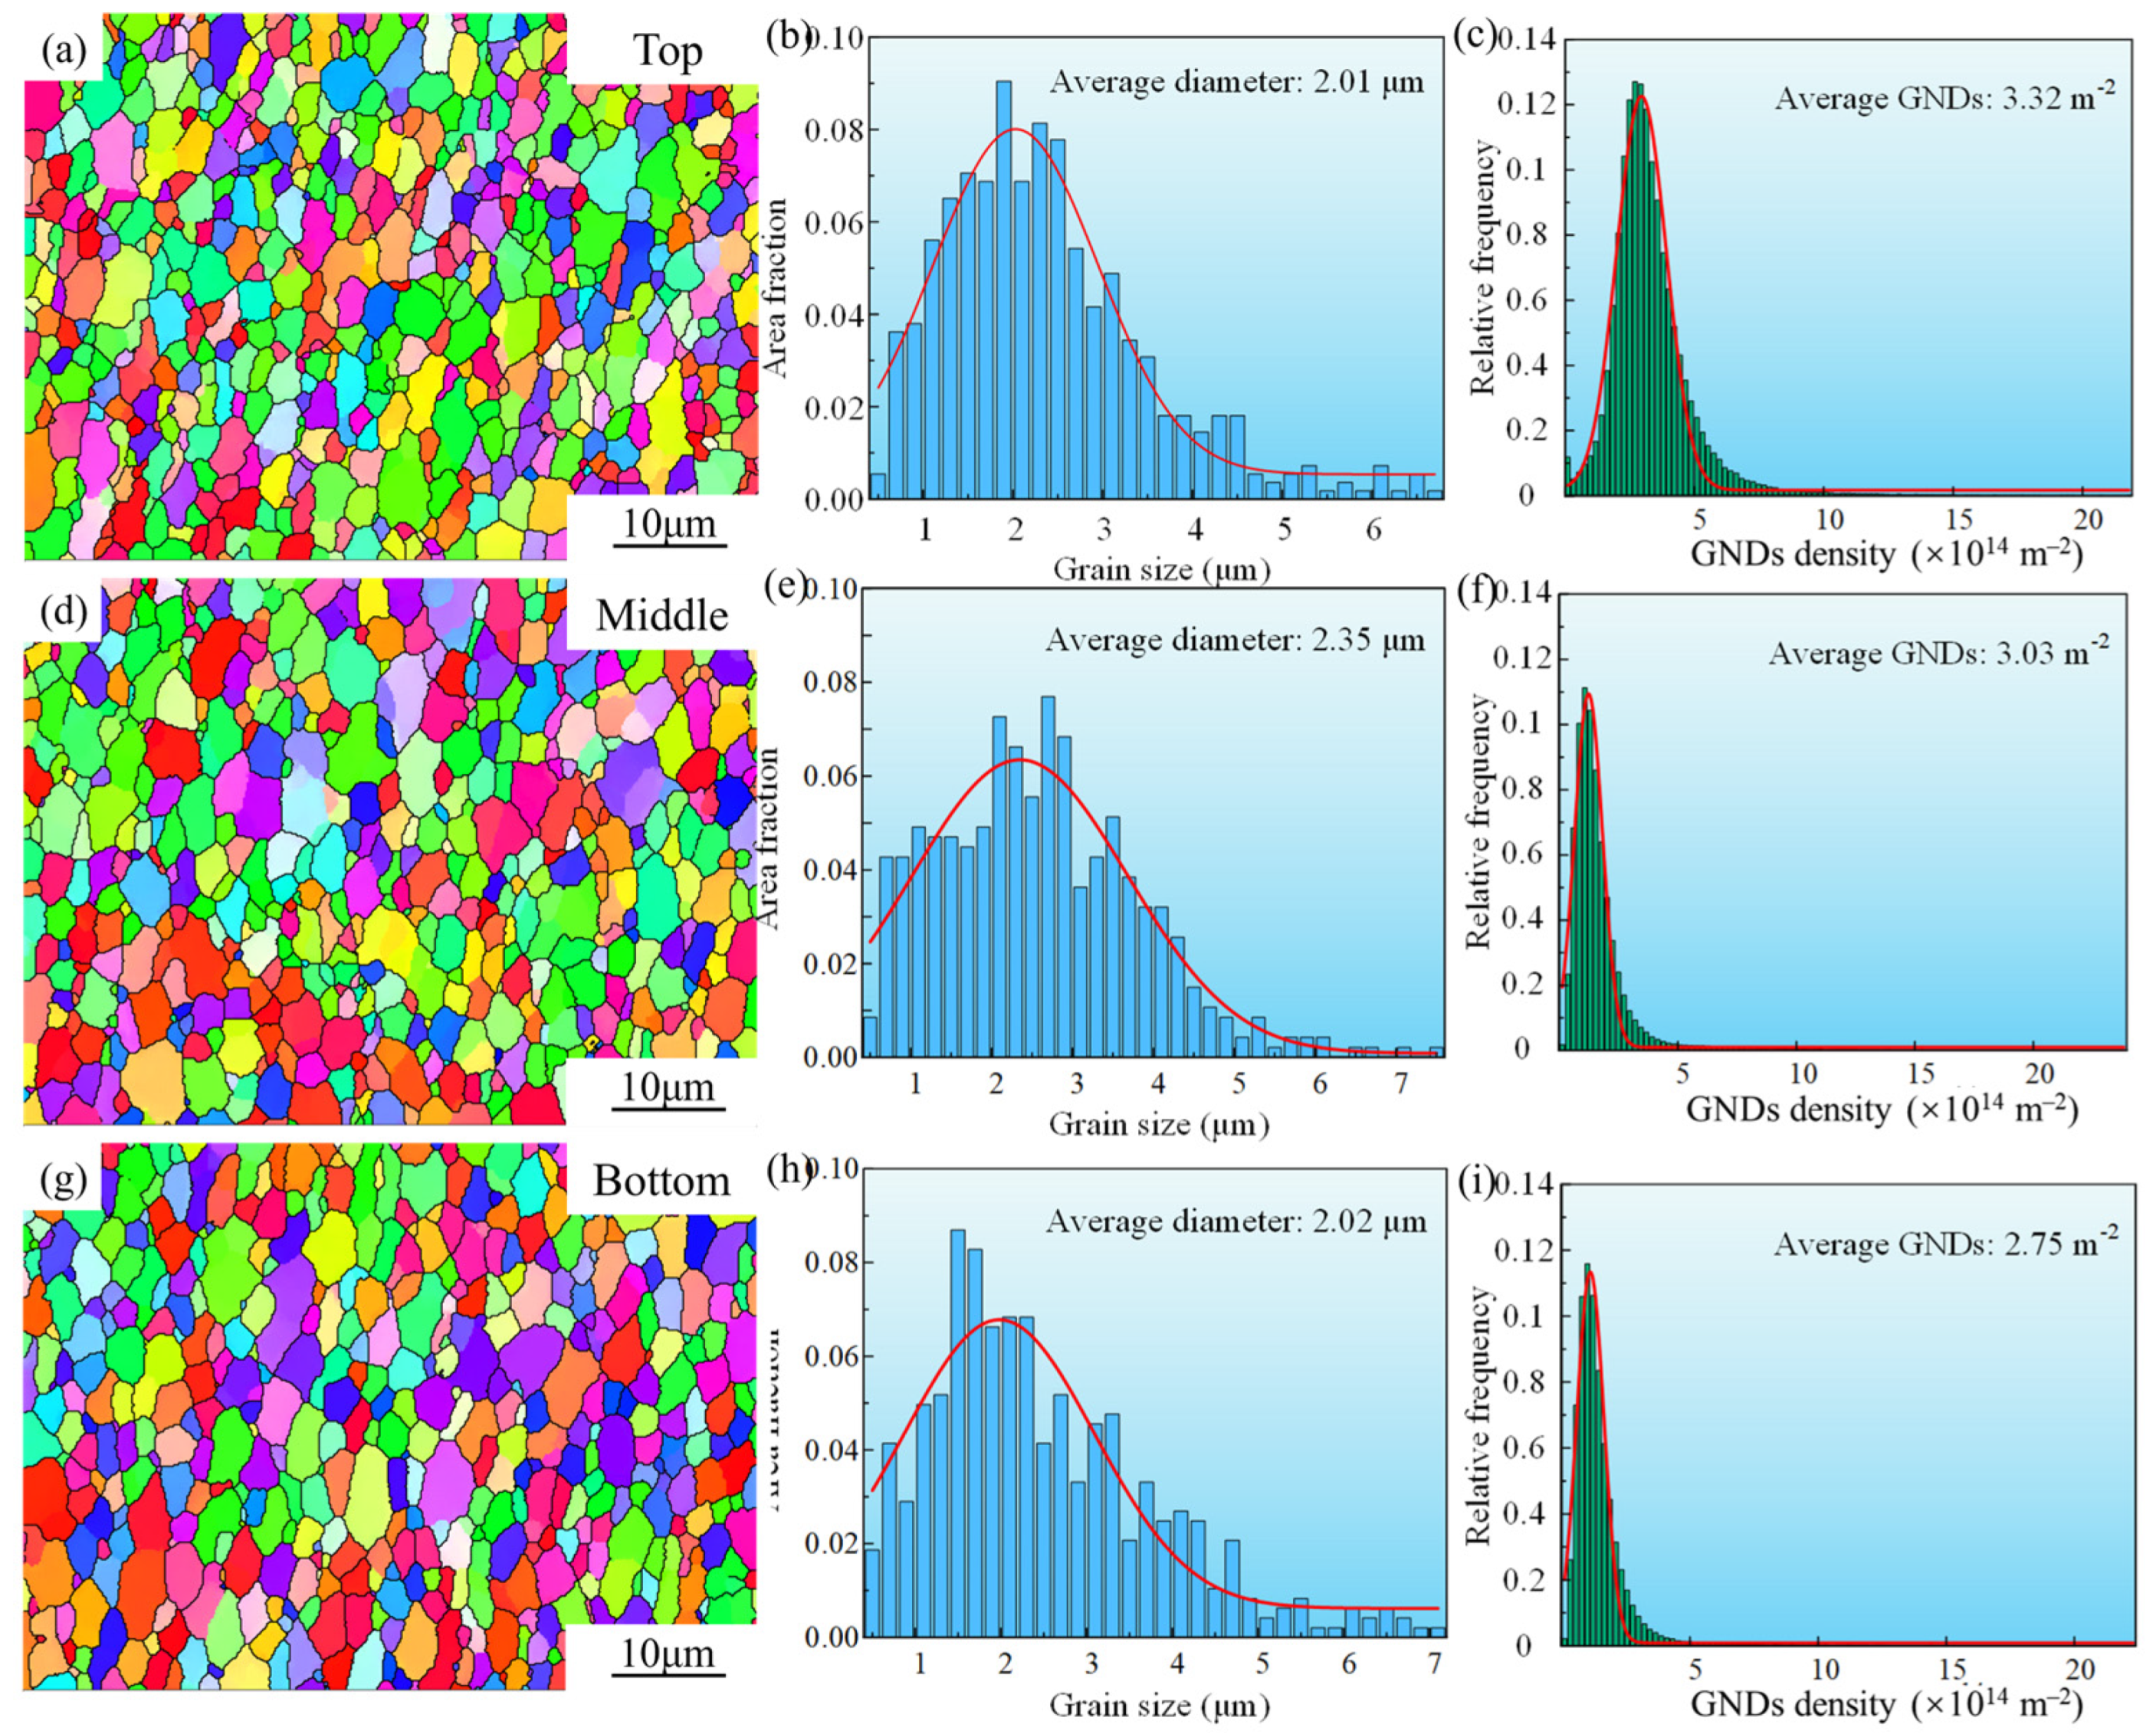
Figure 6 and Figure 7 show the distribution of average grain size and GNDs in the printing direction. The average grain size decreases in the following order: middle region, bottom region, and top region. This is because the material in the top region can exchange heat with the atmosphere, the material in the bottom region exchanges heat with the substrate, while the material in the middle region cannot effectively exchange heat, leading to heat accumulation and grain growth. This is consistent with the phenomenon observed by Williams et al. [20]. The GNDs value decreases from top to bottom. This is because the material in the bottom region is deposited first, so it is exposed to high temperatures for the longest period, while the material in the top region is exposed for the shortest period. Prolonged exposure to high temperatures leads to a reduction in GNDs. With the increase in rotational speed, the average grain size at 400 rpm is larger than at 200 rpm, due to the higher heat input at high rotational speeds, which causes grain growth. Simultaneously, the high strain rate associated with high rotational speeds leads to an increase in dislocations, which in turn increases GNDs.
Figure 8 presents SEM images and the corresponding EDS mappings of the CZ region under different rotation speeds. At a rotation speed of 200 rpm, a large amount of the θ phase and a small amount of the S phase were observed within the deposited layer. As the rotation speed increased, the temperature during deposition rose, leading to the dissolution and eventual disappearance of the S phase. Figure 9 shows a TEM image of the CZ at a rotation speed of 400 rpm. In Figure 9a, numerous dislocations and fine second-phase particles are present inside the grains. Through the analysis of the second-phase particles, the second-phase particles in the grains are identified as nanoscale Al2Cu. After the artificial aging of the 2024 aluminum alloy, a large number of block-shaped Al2Cu particles are present inside the grains. During AFSD, the grains and block-shaped Al2Cu undergo significant stress, refining into fine grains and nanoscale Al2Cu. These Al2Cu particles remain within the grains and are the primary second-phase particles responsible for the second-phase strengthening in the AFSD samples. During the tensile process, grains within the aluminum matrix undergo displacement, but dislocation movement is rapidly hindered by these strengthening phases (e.g., CuAl2 and S phase Al2CuMg) through mechanisms such as pinning. This significantly enhances the material’s yield strength and tensile strength. When localized stress concentration exceeds their bearing capacity, the strengthening phases either fracture or undergo interfacial debonding from the aluminum matrix, initiating microcracks. Particularly under BD tensile conditions, if brittle phases coarsen at grain boundaries and form a continuous network, they greatly facilitate crack propagation along the grain boundaries, leading to a significant reduction in material ductility and fracture toughness.

3.3. Effects of Rotational Rate on Mechanical Properties

Figure 10a shows the tensile strength in various directions under different rotational speeds during the AFSD process. Figure 10b shows that the tensile strength initially increases with increasing rotational speed, then decreases. At a rotational speed of 100 rpm, the tensile strength is the lowest. This is because the material has higher flow stress at low rotational speeds (Equation (4)), resulting in poor flowability. Defects appear at the interfaces between layers (Figure 2a), which act as fracture initiation sites, leading to lower tensile strength in the AFSD samples. However, as the rotational speed increases, the material flow stress decreases, and flowability improves. Consequently, the interface bonding strength increases. At a rotation speed of 200 rpm, the tensile strength reached 288 MPa in the BD, corresponding to 70% of the base material, and 390 MPa in the LD, equivalent to 95%. However, when the rotational speed continues to increase, the second-phase particles in the material dissolve, as described by the equation [21]:
Δ σ SP   =   2 M β G b λ ¯
λ ¯   =   2 r ¯ π 4 f     1
r ¯   =   R 2 3
where β is a constant (β = 0.28), λ ¯ is the center-to-center distance between the particles, f is the volume fraction of second-phase particles, r ¯ is the mean radius of second-phase particles and R is the mean radius of second-phase particles. When the second-phase particle content decreases, second-phase strengthening is reduced, leading to a decrease in the tensile strength of the specimen. Figure 10b shows the variation in Z-direction tensile strength from the AS to the RS at rotational speeds of 200 rpm and 300 rpm. It can be seen that the tensile strength on the AS is lower than that on the RS, while the CZ has the highest tensile strength.
In Figure 10c, a large number of densely packed dimples can be observed in the fracture morphology at a rotational speed of 200 rpm. Therefore, the specimen at 200 rpm exhibits typical ductile fracture. At a rotational speed of 100 rpm, the fracture morphology is smooth and flat (Figure 10d). This is because, at 100 rpm, the lower temperature and higher flow stress prevent effective metallurgical bonding at the interface. Consequently, brittle fracture occurs at the interface during tensile testing, forming cleavage morphology.

4. Discussion

In the above study, dense deposited layers of AA2024 aluminum alloy were successfully obtained at tool rotation speeds ranging from 100 to 400 rpm. This indicates that AA2024 aluminum alloy exhibits good formability during the AFSD process. With increasing rotation speed, the heat input during the AFSD process also increased, resulting in an increase in the average grain size in the CZ from 2.1 μm to 2.83 μm. Meanwhile, the GNDs increased due to the higher strain induced in the material by the increased rotation speed. To better investigate the material flow in AFSD, a numerical simulation was employed.

4.1. Numerical Simulation

During the AFSD process, the feed rod and substrate undergo significant thermo-mechanical coupled plastic deformation, with elastic deformation being negligible. Therefore, a rigid-viscoplastic finite element method was chosen to establish the numerical model. The numerical model was established based on the actual frictional extrusion loading boundary conditions during the additive manufacturing process, where the feed rod and substrate were set as plastic bodies, and the non-consumable shoulder was set as a thermally conductive rigid body. The constitutive relationship of the plastic metal material can be expressed by Equations (5)–(7):
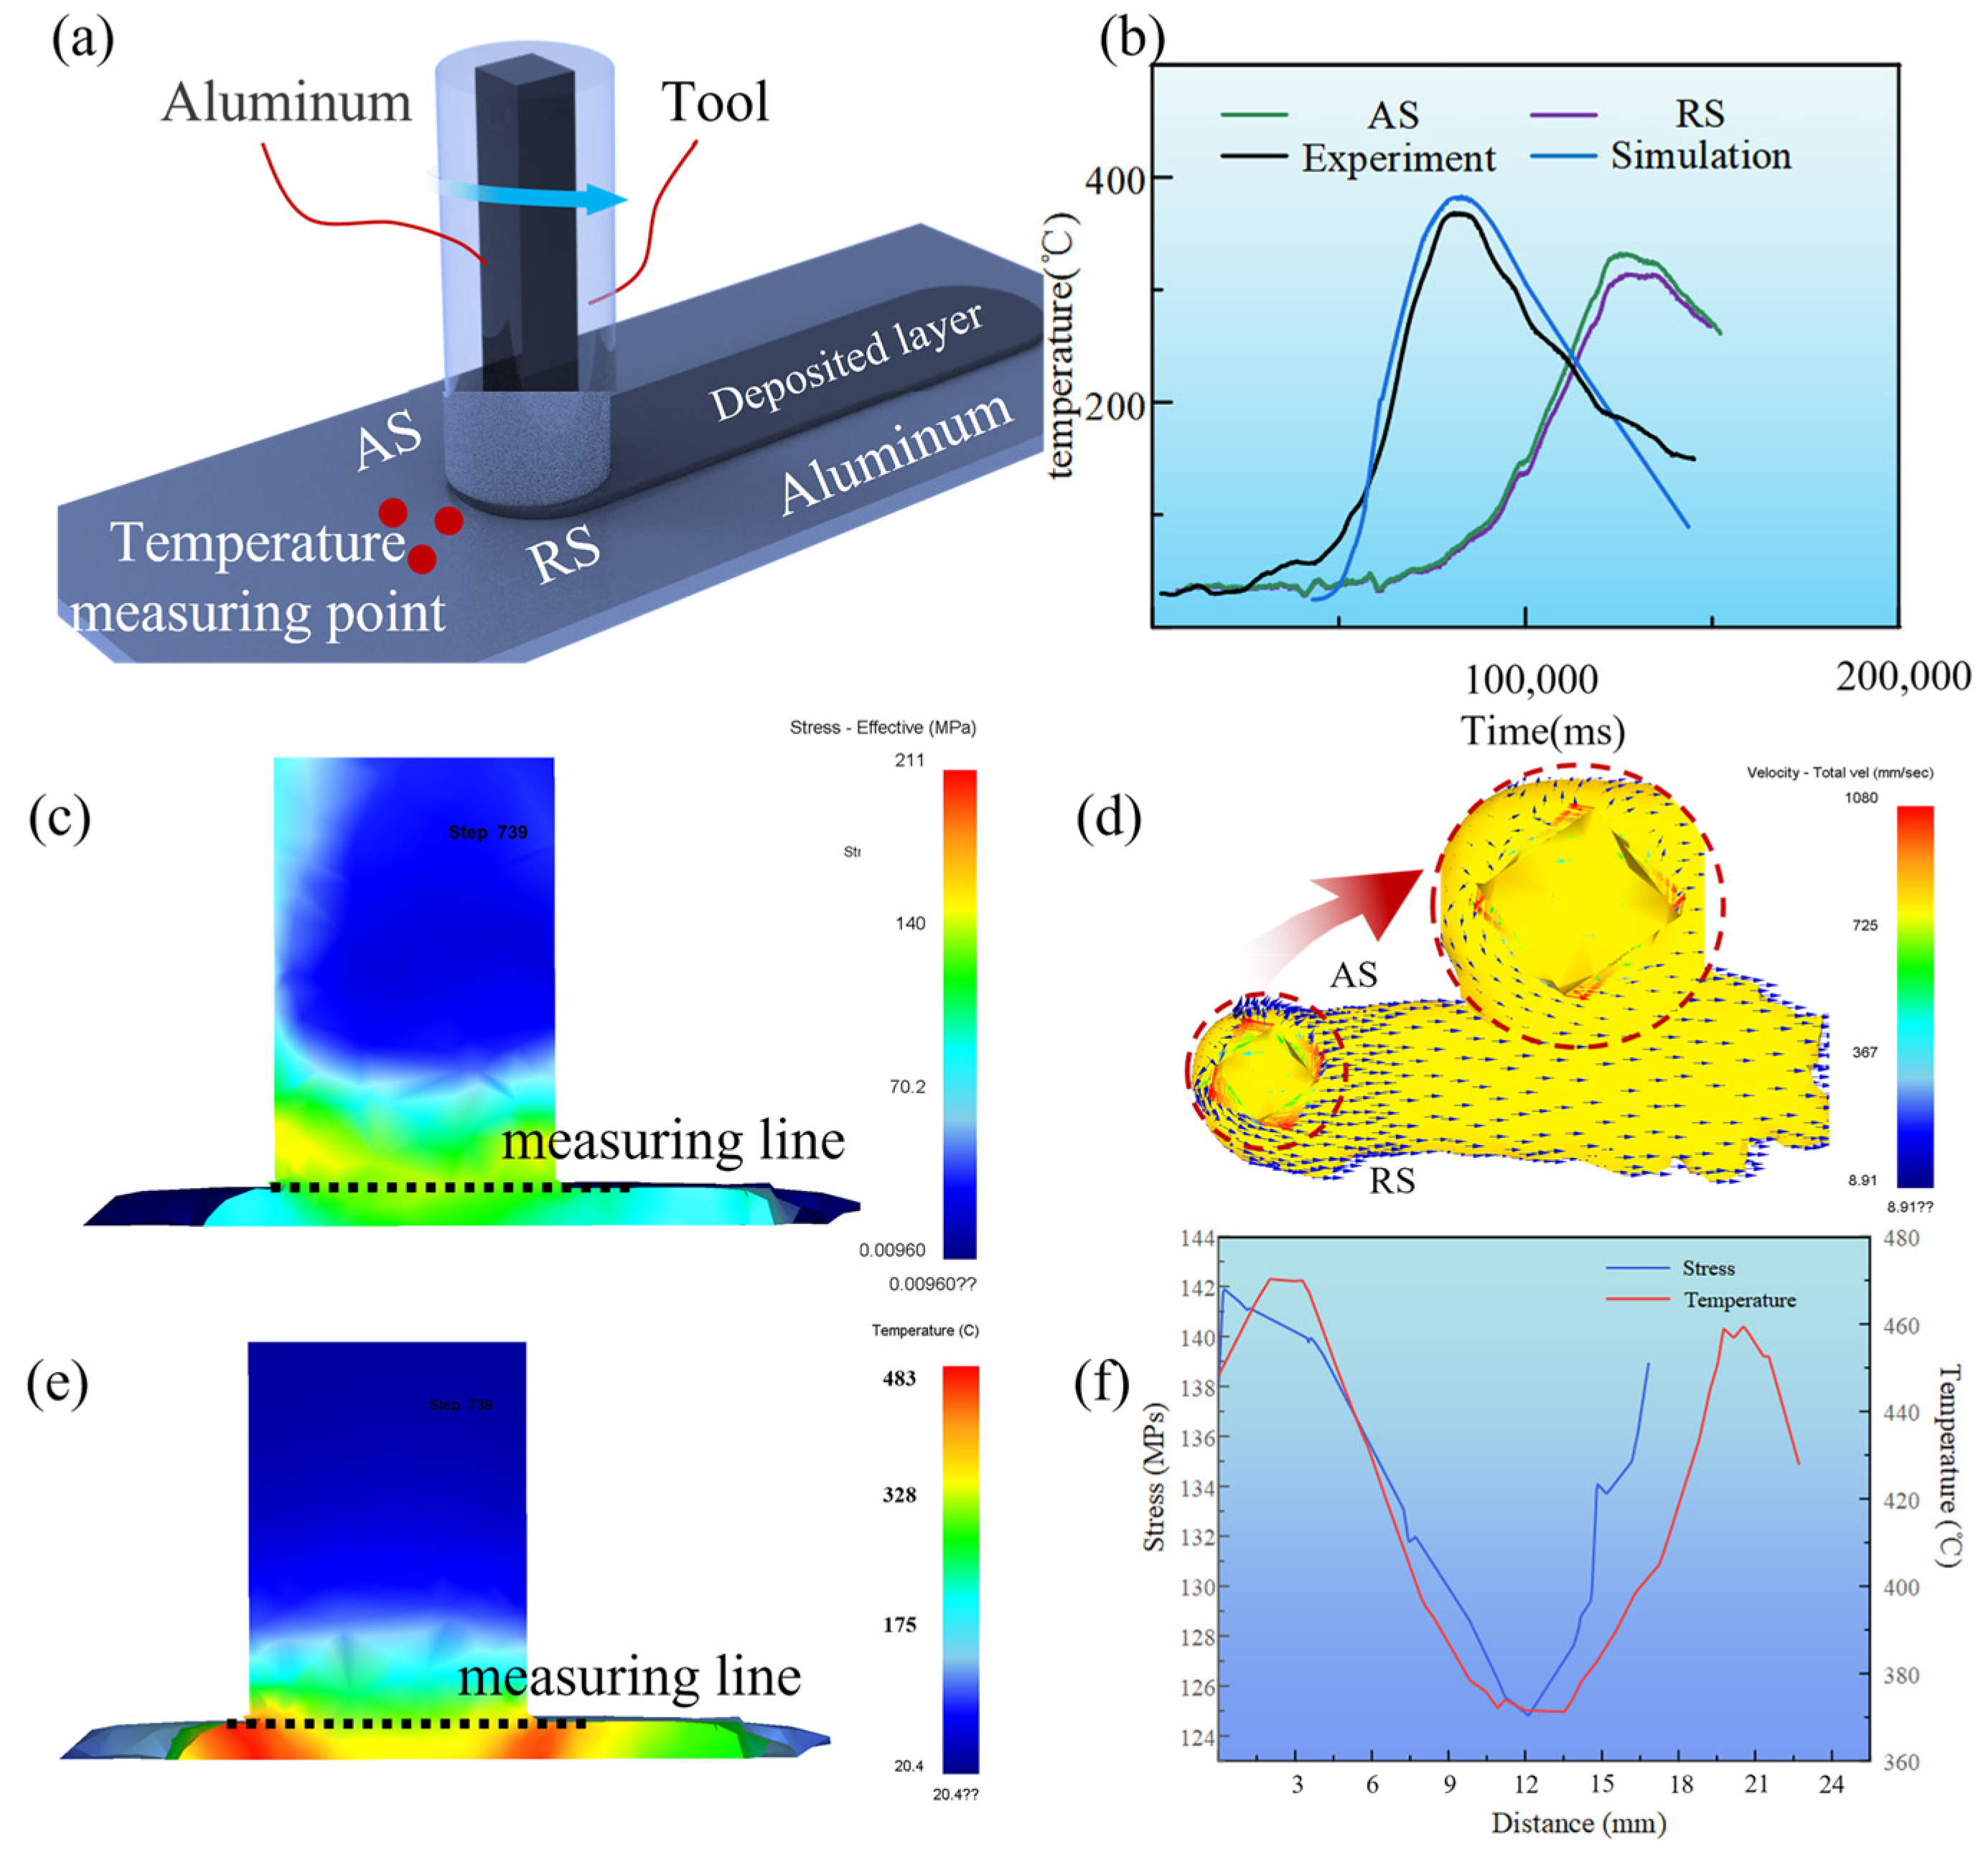
To verify the validity of the simulation results, temperature data from the same locations in the AFSD model were extracted and compared with actual measurements. The calculated heating and cooling rates were consistent with the experimental results, with peak temperatures of 483 °C and 465 °C for the simulation and experiment, respectively (Figure 11b). The error in peak temperature was less than 5%, indicating that the established numerical model has high accuracy. This is consistent with the material flow direction illustrated in Figure 3. Figure 11d shows the material flow during the AFSD process. Due to the tool rotation and the movement of the substrate in the numerical simulation, the material in the deposited layer exhibits a rightward velocity. In the CZ, the deposited layer does not entirely flow in the direction of tool rotation but instead splits into two flow directions. One flow direction follows the tool’s rotation from the AS, moving along the tool’s front edge to the RS. The other flow direction involves material on the AS moving against the tool’s rotation, entering the RS along the tool’s rear edge. Figure 11c,e show the stress and temperature distributions in the AFSD process. In AFSD, both temperature and stress exhibit a “bowl-shaped” distribution, with the maximum temperature and stress occurring at the edges of the feed rod and the minimum values at the sides and center.
Additionally, the temperature and stress on the AS are higher than those on the RS (Figure 11f). The frictional heat is primarily generated by the interaction between the feed rod and the substrate during the AFSD process [22]. Since the linear velocity at the sides of the feed rod is higher than at the center, the frictional heat generated at the sides is greater than in the center. Meanwhile, the increase in material temperature leads to a reduction in flow stress. The material with lower flow stress cannot effectively transmit the feed rod’s thrust to the underlying layer, resulting in the stress distribution being farther from the deposited layer compared to the temperature distribution (Figure 11c). When the material undergoes plastic deformation, the resulting deformation heat is [23]:
Q ˙ p   =   η σ ij ε ij
where η, σ ij and ε ij represent the Taylor-Quinney ratio that measures the fraction of plastic work converted to heat, stress tensor, and plastic strain rate, respectively. Because the material on part of the AS flows in the opposite direction to the tool’s rotation, it experiences greater resistance during flow compared to the material on the RS. This results in the generation of plastic deformation heat, leading to higher temperature and stress on the AS than on the RS (Figure 11b).
The significant differences in microstructure distribution, material properties, and other factors were observed between the AS and the RS during the AFSD process. Therefore, strength calculations of the AS and RS in the deposited layer were performed to analyze the reasons for the performance differences between the two regions.

4.2. Assessing the Various Contributions to Strengthening

In this study, 2024 aluminum alloy underwent significant plastic deformation after AFSD. The material strengthening process was altered. In the specimens, the tensile strength in the AS, RS, and CZ regions increases sequentially. To better analyze the reasons for tensile strength variation in different regions, a simple superposition model was used to calculate the contributions of different strengthening mechanisms during AFSD.
In this study, the grains underwent significant plastic deformation and cyclic heat input. The grain size changed. Due to variations in plastic deformation and heat input at different locations, the grain size changes differently at each location (Figure 11f). Since different grain sizes contribute differently to grain refinement strengthening, the Hall-Petch equation was used to calculate the contribution of grain refinement strengthening at different locations, as shown below [24]:
Δ σ HP   =   k y d 1 2
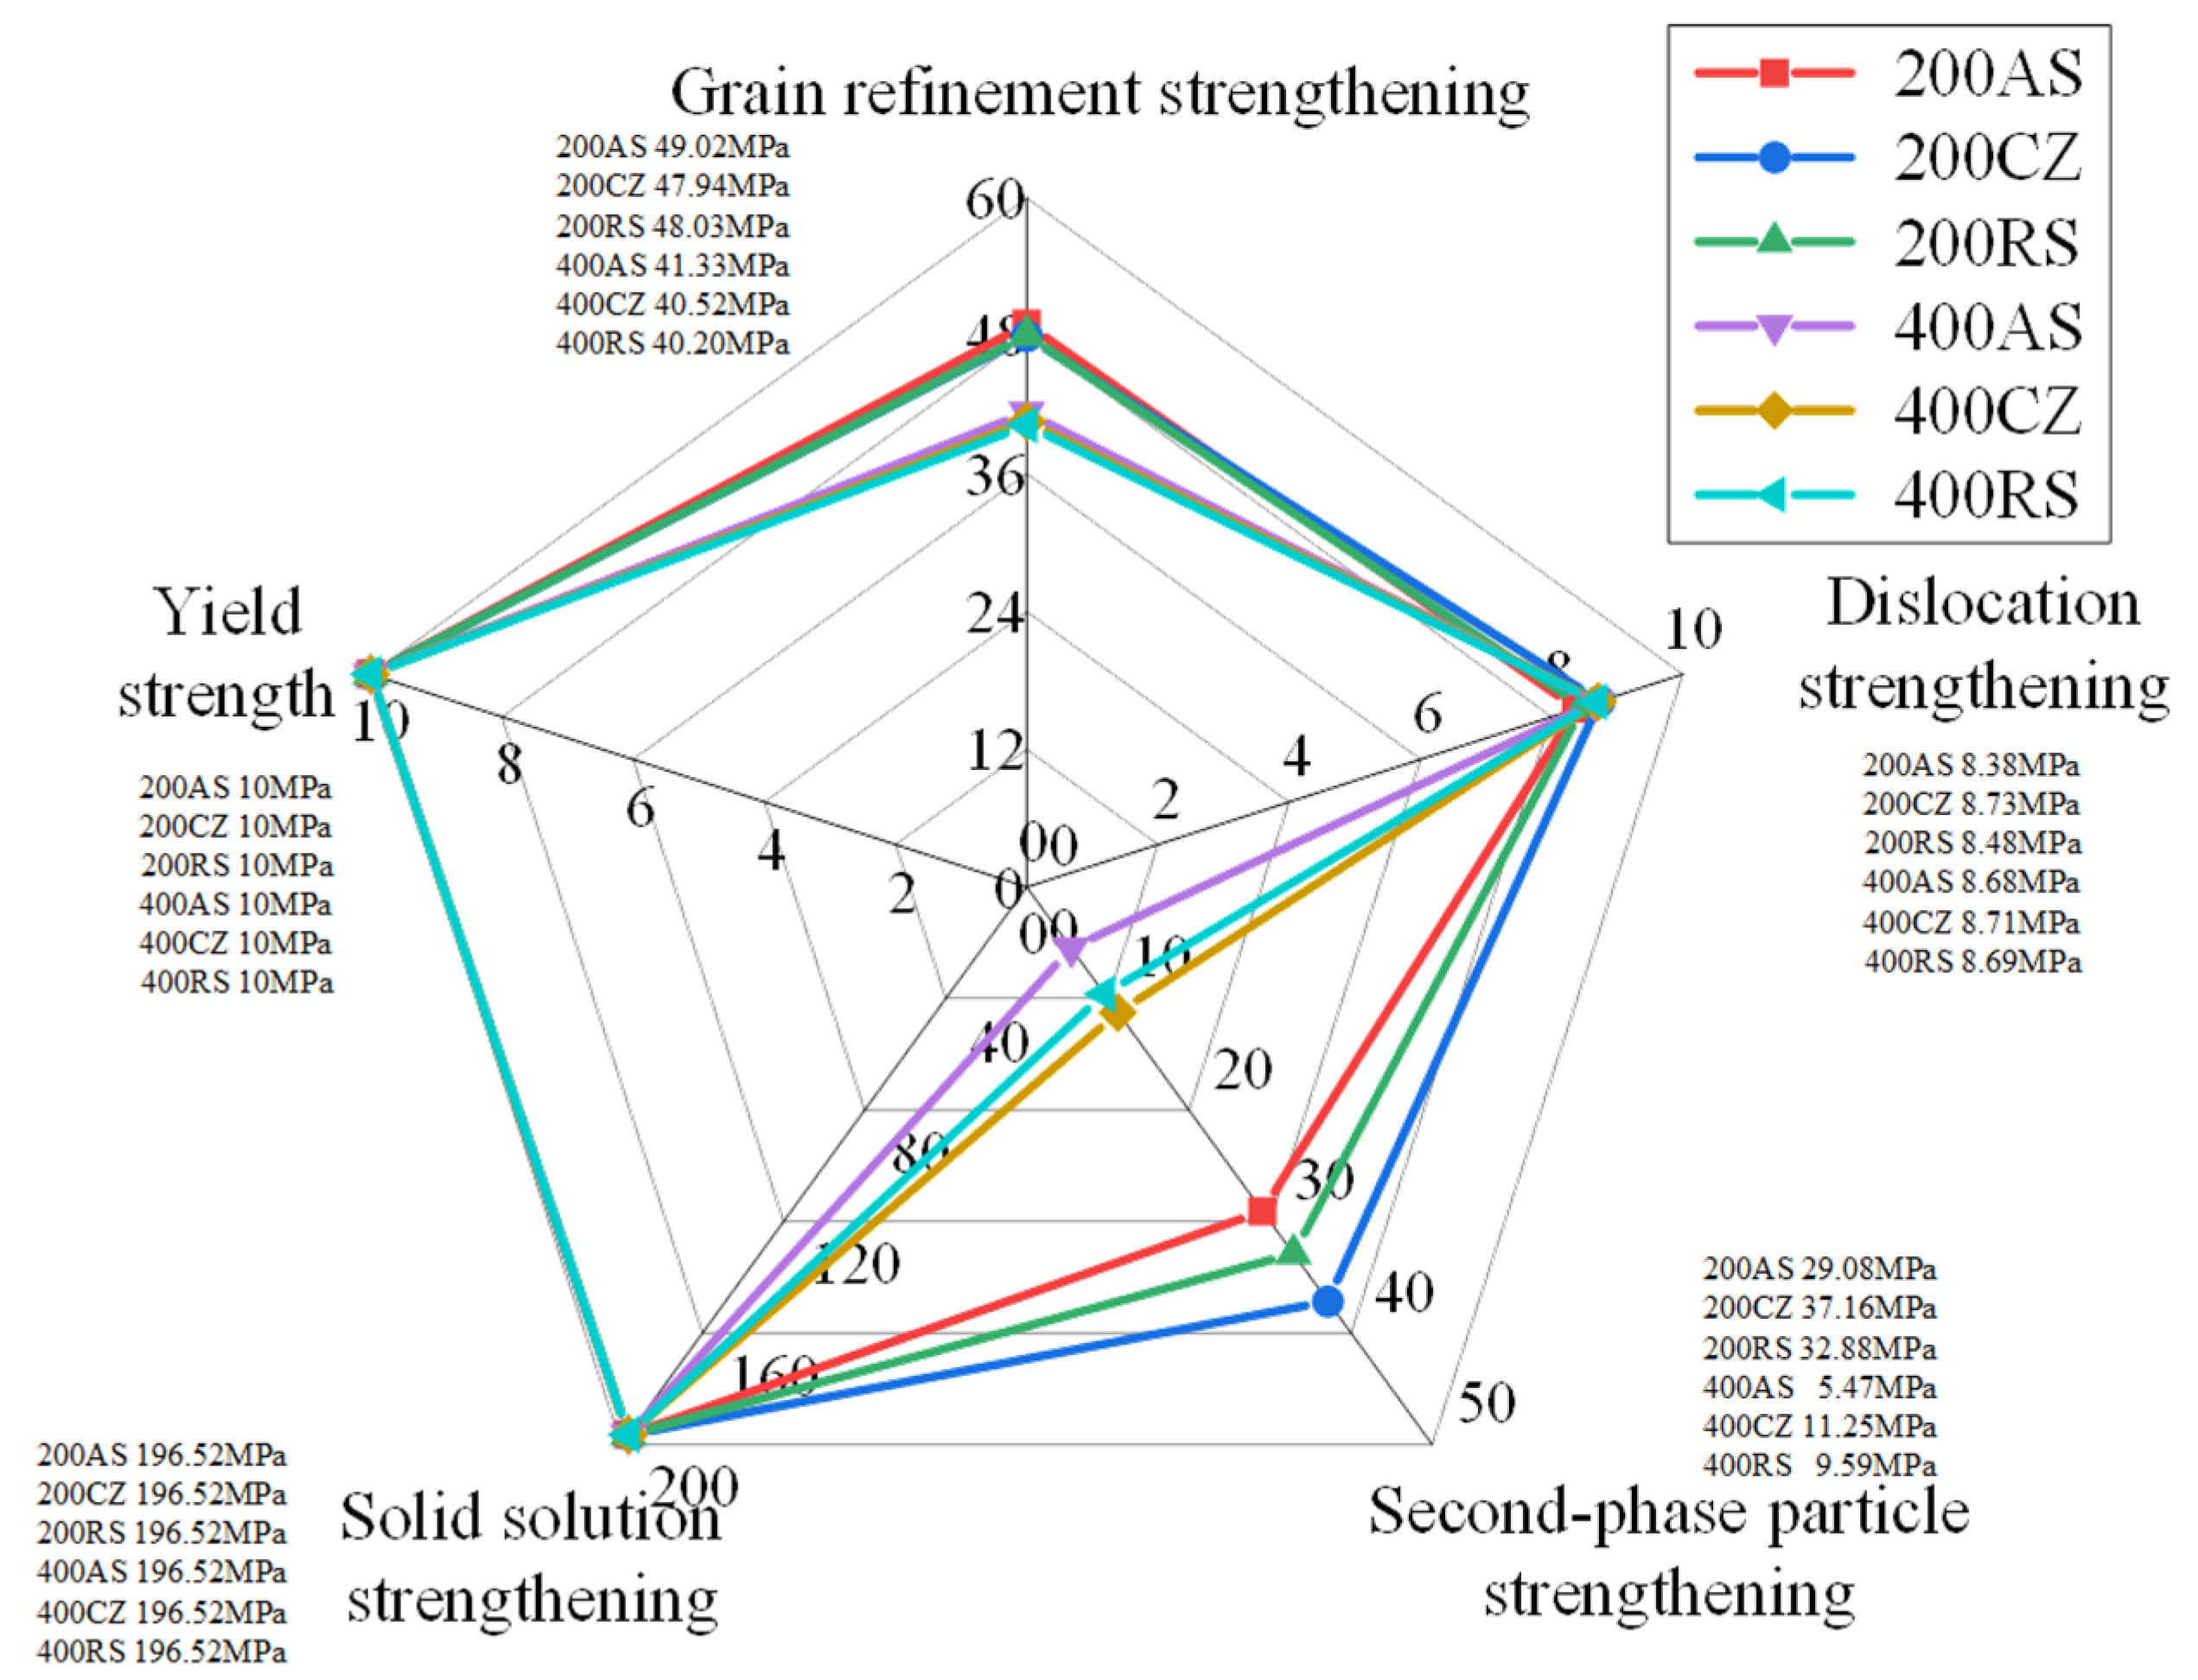
where ky is the Hall–Petch constant, which is generally considered 68 MPa μm1/2 for grain sizes > 1 µm in Al alloys. Therefore, the values for the AS, CZ, and RS regions at rotational speeds of 200 rpm and 400 rpm were 49.02 MPa, 47.94 MPa, and 48.03 MPa, and 41.33 MPa, 40.52 MPa, and 40.20 MPa, respectively. It can be seen that the grains in the AS and RS regions undergo significant plastic deformation, resulting in grain refinement, which leads to higher grain refinement strengthening values.
Figure 5a shows a large number of dislocations present in the grains, thus the contribution of dislocation strengthening is calculated using the following equation:
Δ σ D   =   M α G b ρ 1 2
where M is the mean orientation factor for the aluminum alloy (3.06), α is a constant for FCC metals (0.2), G is the shear modulus of alloy 2024 (27 GPa), b is the Burgers vector (0.29 nm), and ρ is the GND density, as shown in Figure 5 and Figure 6. Therefore, the values for the AS, CZ, and RS regions at rotational speeds of 200 rpm and 400 rpm were 8.38 MPa, 8.73 MPa, and 8.48 MPa, and 8.68 MPa, 8.71 MPa, and 8.69 MPa, respectively. The grains in the AS and RS undergo dynamic recrystallization, forming fine equiaxed grains, which reduces the dislocations within the grains. Therefore, the contribution to strength from dislocation strengthening is lower.
Figure 5a shows the presence of second-phase particles within the grains. In 2024 aluminum alloy, second-phase particle strengthening plays a crucial role. Under different thermal cycles, the dissolution and precipitation of second-phase particles affect the strength of the aluminum alloy. According to Equations (9)–(11), the second-phase particle strengthening values for the AS, CZ, and RS at rotational speeds of 200 rpm and 400 rpm are calculated to be 29.08 MPa, 37.16 MPa, and 32.88 MPa, and 5.47 MPa, 11.25 MPa, and 9.59 MPa, respectively. At high rotational speeds, the elevated temperature causes the dissolution of the second phase, thereby reducing the second-phase strengthening values.
During the AFSD process, the cyclic heat input and output cause the strengthening phase to dissolve into the matrix. These dissolved strengthening phases are in solid solution in the matrix, which is closely related to the increase in material strength. The particular contribution to the strength from the specific types of solute atoms can be estimated using the approach proposed by Leyson et al. as follows:
Δ σ SS   =   j k j C j 2 3
where kj is a constant that depends on the element, and Cj is the percentage by weight of the alloying element. In 2024 aluminum alloy, Cu, Mg, and Mn are the primary strengthening elements. According to the research by Cinkilic et al., the kj values for Cu, Mg, and Mn are 15 MPa/wt.%2/3, 46.4 MPa/wt.%2/3, and 80 MPa/wt.%2/3, respectively [24]. The calculated value is 196.52 MPa.
These strength contributions are considered to increase linearly. Therefore, the total yield strength of 2024 aluminum alloy produced at various locations in this study can be expressed as follows:
σ Y S   =   σ 0   +   Δ σ HP   +   Δ σ D   +   Δ σ SP   +   Δ σ SS
where σ0 is the yield strength of 99.99% pure aluminum, which is 10 MPa. Figure 12 shows the curves of the strengthening results, where grain refinement strengthening is highest on the AS. This is because recrystallization leads to grain refinement, which increases grain refinement strengthening. However, due to the higher temperature on the AS, the dissolution of the strengthening phases leads to a reduction in second-phase particle strengthening. Additionally, greater plastic deformation results in a decrease in dislocations, thereby reducing dislocation strengthening. Although grain refinement strengthening is lower in the CZ region, it retains a large number of dislocations and strengthening phases, resulting in the highest overall strength. In the RS, the lower temperature during AFSD allows the strengthening phases to be retained, resulting in higher second-phase particle strengthening compared to the AS. Additionally, due to the lower stress on the RS, there are more dislocations within the grains, leading to higher dislocation strengthening compared to the AS. Therefore, the strength decreases in the order of CZ, RS, and AS. With the increase in rotational speed, the heat input during the AFSD process increases, leading to grain growth in the deposited layer, dissolution of the second phase, and a reduction in dislocations, which in turn results in a decrease in the strength of the deposited layer. Simultaneously, the increase in rotational speed influences the mechanical properties of the deposited layer by altering the heat input, which reduces both grain refinement strengthening and second-phase particle strengthening. In the LD, strength varies across the top, middle, and bottom regions, with a decreasing trend from top to bottom [8]. As a result, the strength at the middle position is comparable to that in the BD, but the average strength across the three positions is higher.

5. Conclusions

This study successfully fabricated defect-free AA2024-T4 aluminum alloy deposits via AFSD and systematically revealed the influence mechanisms of rotational speed on formability, microstructure, and mechanical properties. The primary conclusions are as follows: Fully dense deposits were achievable within the 100–400 rpm range. A decrease in rotational speed mitigated the dissolution and coarsening of strengthening precipitates within the deposit, which was beneficial for enhancing tensile properties. At 200 rpm, the longitudinal tensile strength reached 390 MPa, equivalent to 95% of the base material’s strength. However, a performance gap remains compared to the original AA2024-T4 base material, necessitating post-deposition heat treatment to fully restore mechanical performance for engineering applications. Microstructural analysis revealed a fine equiaxed grain structure in the deposits, with grain size increasing concomitantly with rotational speed. Furthermore, this study identified, for the first time, a distinct strength distribution within the deposit: CZ > RS > AS. This gradient is attributed to the higher temperatures on the AS leading to more pronounced dissolution of second-phase particles and a reduction in dislocation density due to greater plastic deformation. By establishing a thermo-mechanically coupled numerical model and conducting a multi-mechanism strength contribution analysis, the intrinsic relationship between material flow behavior and performance heterogeneity was clarified. This work provides crucial experimental evidence and theoretical guidance for the application of the AFSD process in the manufacturing of high-strength aluminum alloy components.

Author Contributions

Conceptualization, L.W.; methodology, Q.W.; software, Z.Z.; validation, Q.W.; investigation, Z.Z.; resources, L.W.; data curation, Z.Z.; writing—original draft preparation, Q.W.; writing—review and editing, L.W.; visualization, Q.W. All authors have read and agreed to the published version of the manuscript.

Funding

This work was supported by the National Natural Science Foundation of China (No. 52305345).

Data Availability Statement

No new data were created or analyzed in this study. Data sharing is not applicable to this article.

Conflicts of Interest

All author were employed by the company Anhui World Wide Welding Co., Ltd. The remaining authors declare that the research was conducted in the absence of any commercial or financial relationships that could be construed as a potential conflict of interest.

References

  1. Shafi, S.M.; Fatima, A.; Hendrickson, N.V. Characterizing Surface Waviness of Aluminum Alloy: An Approach to Minimize Post-Processing in Wire Arc Additive Manufacturing (WAAM) Production. J. Manuf. Mater. Process 2025, 9, 347. [Google Scholar] [CrossRef]
  2. Barbosa, A.L.; Mariani, F.E.; Pereira, F.M.; Cintho, O.M.; Coelho, R.T.; Gargarella, P.; Zilnyk, K. Directed Energy Deposition-Laser Beam of Semi-Austenitic Precipitation-Hardening Stainless Steel. J. Manuf. Mater. Process 2025, 9, 114. [Google Scholar] [CrossRef]
  3. Zhang, Z.; Wan, L.; Xie, Y.; Wen, Q.; Mao, D.; Dong, W.; Sun, X.; Tian, H.; Meng, X.; Huang, Y. Achieving high-plasticity pure aluminium from wire-based friction stir additive manufacturing. Mater. Res. Lett. 2024, 166, 936–945. [Google Scholar] [CrossRef]
  4. Griffiths, R.J.; Perry, M.E.J.; Sietins, J.M.; Zhu, Y.; Hardwick, N.; Cox, C.D.; Rauch, H.A.; Yu, H.Z. A Perspective on Solid-State Additive Manufacturing of Aluminum Matrix Composites Using MELD. J. Mater. Eng. Perform. 2018, 28, 648–656. [Google Scholar] [CrossRef]
  5. Yoder, J.K.; Hahn, G.D.; Zhao, N.; Brennan, R.E.; Cho, K.; Yu, H.Z. Additive friction stir deposition-enabled upcycling of automotive cast aluminum chips. Addit. Manuf. Lett. 2023, 4, 100108. [Google Scholar] [CrossRef]
  6. Joey Griffiths, R.; Gotawala, N.; Hahn, G.D.; Garcia, D.; Yu, H.Z. Towards underwater additive manufacturing via additive friction stir deposition. Mater. Des. 2022, 223, 111148. [Google Scholar] [CrossRef]
  7. Yu, H.Z.; Hahn, G.D. Potential and challenges for large-scale near-net-shaping of 7xxx aerospace grade aluminum via additive friction stir deposition. Mater. Lett. X 2023, 19, 100217. [Google Scholar] [CrossRef]
  8. Zhu, N.; Avery, D.Z.; Rutherford, B.A.; Phillips, B.J.; Allison, P.G.; Jordon, J.B.; Brewer, L.N. The Effect of Anodization on the Mechanical Properties of AA6061 Produced by Additive Friction Stir-Deposition. Metals 2021, 11, 1773. [Google Scholar] [CrossRef]
  9. Martin, L.P.; Luccitti, A.; Walluk, M. Evaluation of Additive Friction Stir Deposition of AISI 316L For Repairing Surface Material Loss in AISI 4340. Int. J. Adv. Des. Manuf. Technol. 2022, 121, 2365–2381. [Google Scholar] [CrossRef]
  10. Robinson, T.W.; Williams, M.B.; Rao, H.M.; Kinser, R.P.; Allison, P.G.; Jordon, J.B. Microstructural and Mechanical Properties of a Solid-State Additive Manufactured Magnesium Alloy. J. Manuf. Sci. Eng. 2022, 144, 061013. [Google Scholar] [CrossRef]
  11. Phillips, B.J.; Avery, D.Z.; Liu, T.; Rodriguez, O.L.; Mason, C.J.T.; Jordon, J.B.; Brewer, L.N.; Allison, P.G. Microstructure-deformation relationship of additive friction stir-deposition Al–Mg–Si. Materialia 2019, 7, 100387. [Google Scholar] [CrossRef]
  12. Phillips, B.J.; Williamson, C.J.; Kinser, R.P.; Jordon, J.B.; Doherty, K.J.; Allison, P.G. Microstructural and Mechanical Characterization of Additive Friction Stir-Deposition of Aluminum Alloy 5083 Effect of Lubrication on Material Anisotropy. Materials 2021, 14, 6732. [Google Scholar] [CrossRef]
  13. Li, Y.; Yang, B.; Zhang, M.; Wang, H.; Gong, W.; Lai, R.; Li, Y.; Teng, J. The corrosion behavior and mechanical properties of 5083 Al-Mg alloy manufactured by additive friction stir deposition. Corros. Sci. 2023, 213, 110972. [Google Scholar] [CrossRef]
  14. Rivera, O.G.; Allison, P.G.; Brewer, L.N.; Rodriguez, O.L.; Jordon, J.B.; Liu, T.; Whittington, W.; Martens, R.; McClelland, Z.; Mason, C.; et al. Influence of texture and grain refinement on the mechanical behavior of AA2219 fabricated by high shear solid state material deposition. Mater. Sci. Eng. A 2018, 724, 547–558. [Google Scholar] [CrossRef]
  15. Anderson-Wedge, K.; Avery, D.Z.; Daniewicz, S.R.; Sowards, J.W.; Allison, P.G.; Jordon, J.B.; Amaro, R. Characterization of the fatigue behavior of additive friction stir-deposition AA2219. Int. J. Fatigue 2021, 142, 105951. [Google Scholar] [CrossRef]
  16. Perry, M.E.J.; Griffiths, R.J.; Garcia, D.; Sietins, J.M.; Zhu, Y.; Yu, H.Z. Morphological and microstructural investigation of the non-planar interface formed in solid-state metal additive manufacturing by additive friction stir deposition. Addit. Manuf. 2020, 35, 101293. [Google Scholar] [CrossRef]
  17. Aziz, S.B.; Dewan, M.W.; Huggett, D.J.; Wahab, M.A.; Okeil, A.M.; Warren Liao, T. Impact of Friction Stir Welding (FSW) Process Parameters on Thermal Modeling and Heat Generation of Aluminum Alloy Joints. Acta Met. Sin. Engl. Lett. 2016, 29, 869–883. [Google Scholar] [CrossRef]
  18. Khan, A.S.; Baig, M. Anisotropic responses, constitutive modeling and the effects of strain-rate and temperature on the formability of an aluminum alloy. Int. J. Plast. 2011, 27, 522–538. [Google Scholar] [CrossRef]
  19. Buffa, G.; Hua, J.; Shivpuri, R.; Fratini, L. A continuum based fem model for friction stir welding—Model development. Mater. Sci. Eng. A 2006, 419, 389–396. [Google Scholar] [CrossRef]
  20. Williams, M.B.; Robinson, T.W.; Williamson, C.J.; Kinser, R.P.; Ashmore, N.A.; Allison, P.G.; Jordon, J.B. Elucidating the Effect of Additive Friction Stir Deposition on the Resulting Microstructure and Mechanical Properties of Magnesium Alloy WE43. Metals 2021, 11, 1739. [Google Scholar] [CrossRef]
  21. Tang, W.; Yang, X.; Luo, T.; Wang, R.; Gu, C. Precipitation behavior and strengthening-toughening mechanism of additive friction stir-deposited Al–Mg–Si–Cu alloy. Addit. Manuf. 2023, 76, 103785. [Google Scholar] [CrossRef]
  22. Garcia, D.; Griffiths, R.J.; Yu, H.Z. Additive Friction Stir Deposition for Fabrication of Silicon Carbide Metal Matrix Composites. In Proceedings of the ASME 2020 15th International Manufacturing Science and Engineering Conference, Cincinnati, OH, USA, 22–26 June 2020; Volume 1, p. 84256. [Google Scholar]
  23. Salih, O.S.; Ou, H.; Sun, W. Heat generation, plastic deformation and residual stresses in friction stir welding of aluminium alloy. Int. J. Mech. Sci. 2023, 238, 107827. [Google Scholar] [CrossRef]
  24. Chen, Z.; Ren, J.; Yuan, Z.; Ringer, S.P. Enhanced strength-plasticity combination in an Al–Cu–Mg alloy—Atomic scale microstructure regulation and strengthening mechanisms. Mater. Sci. Eng. A 2020, 787, 139447. [Google Scholar] [CrossRef]
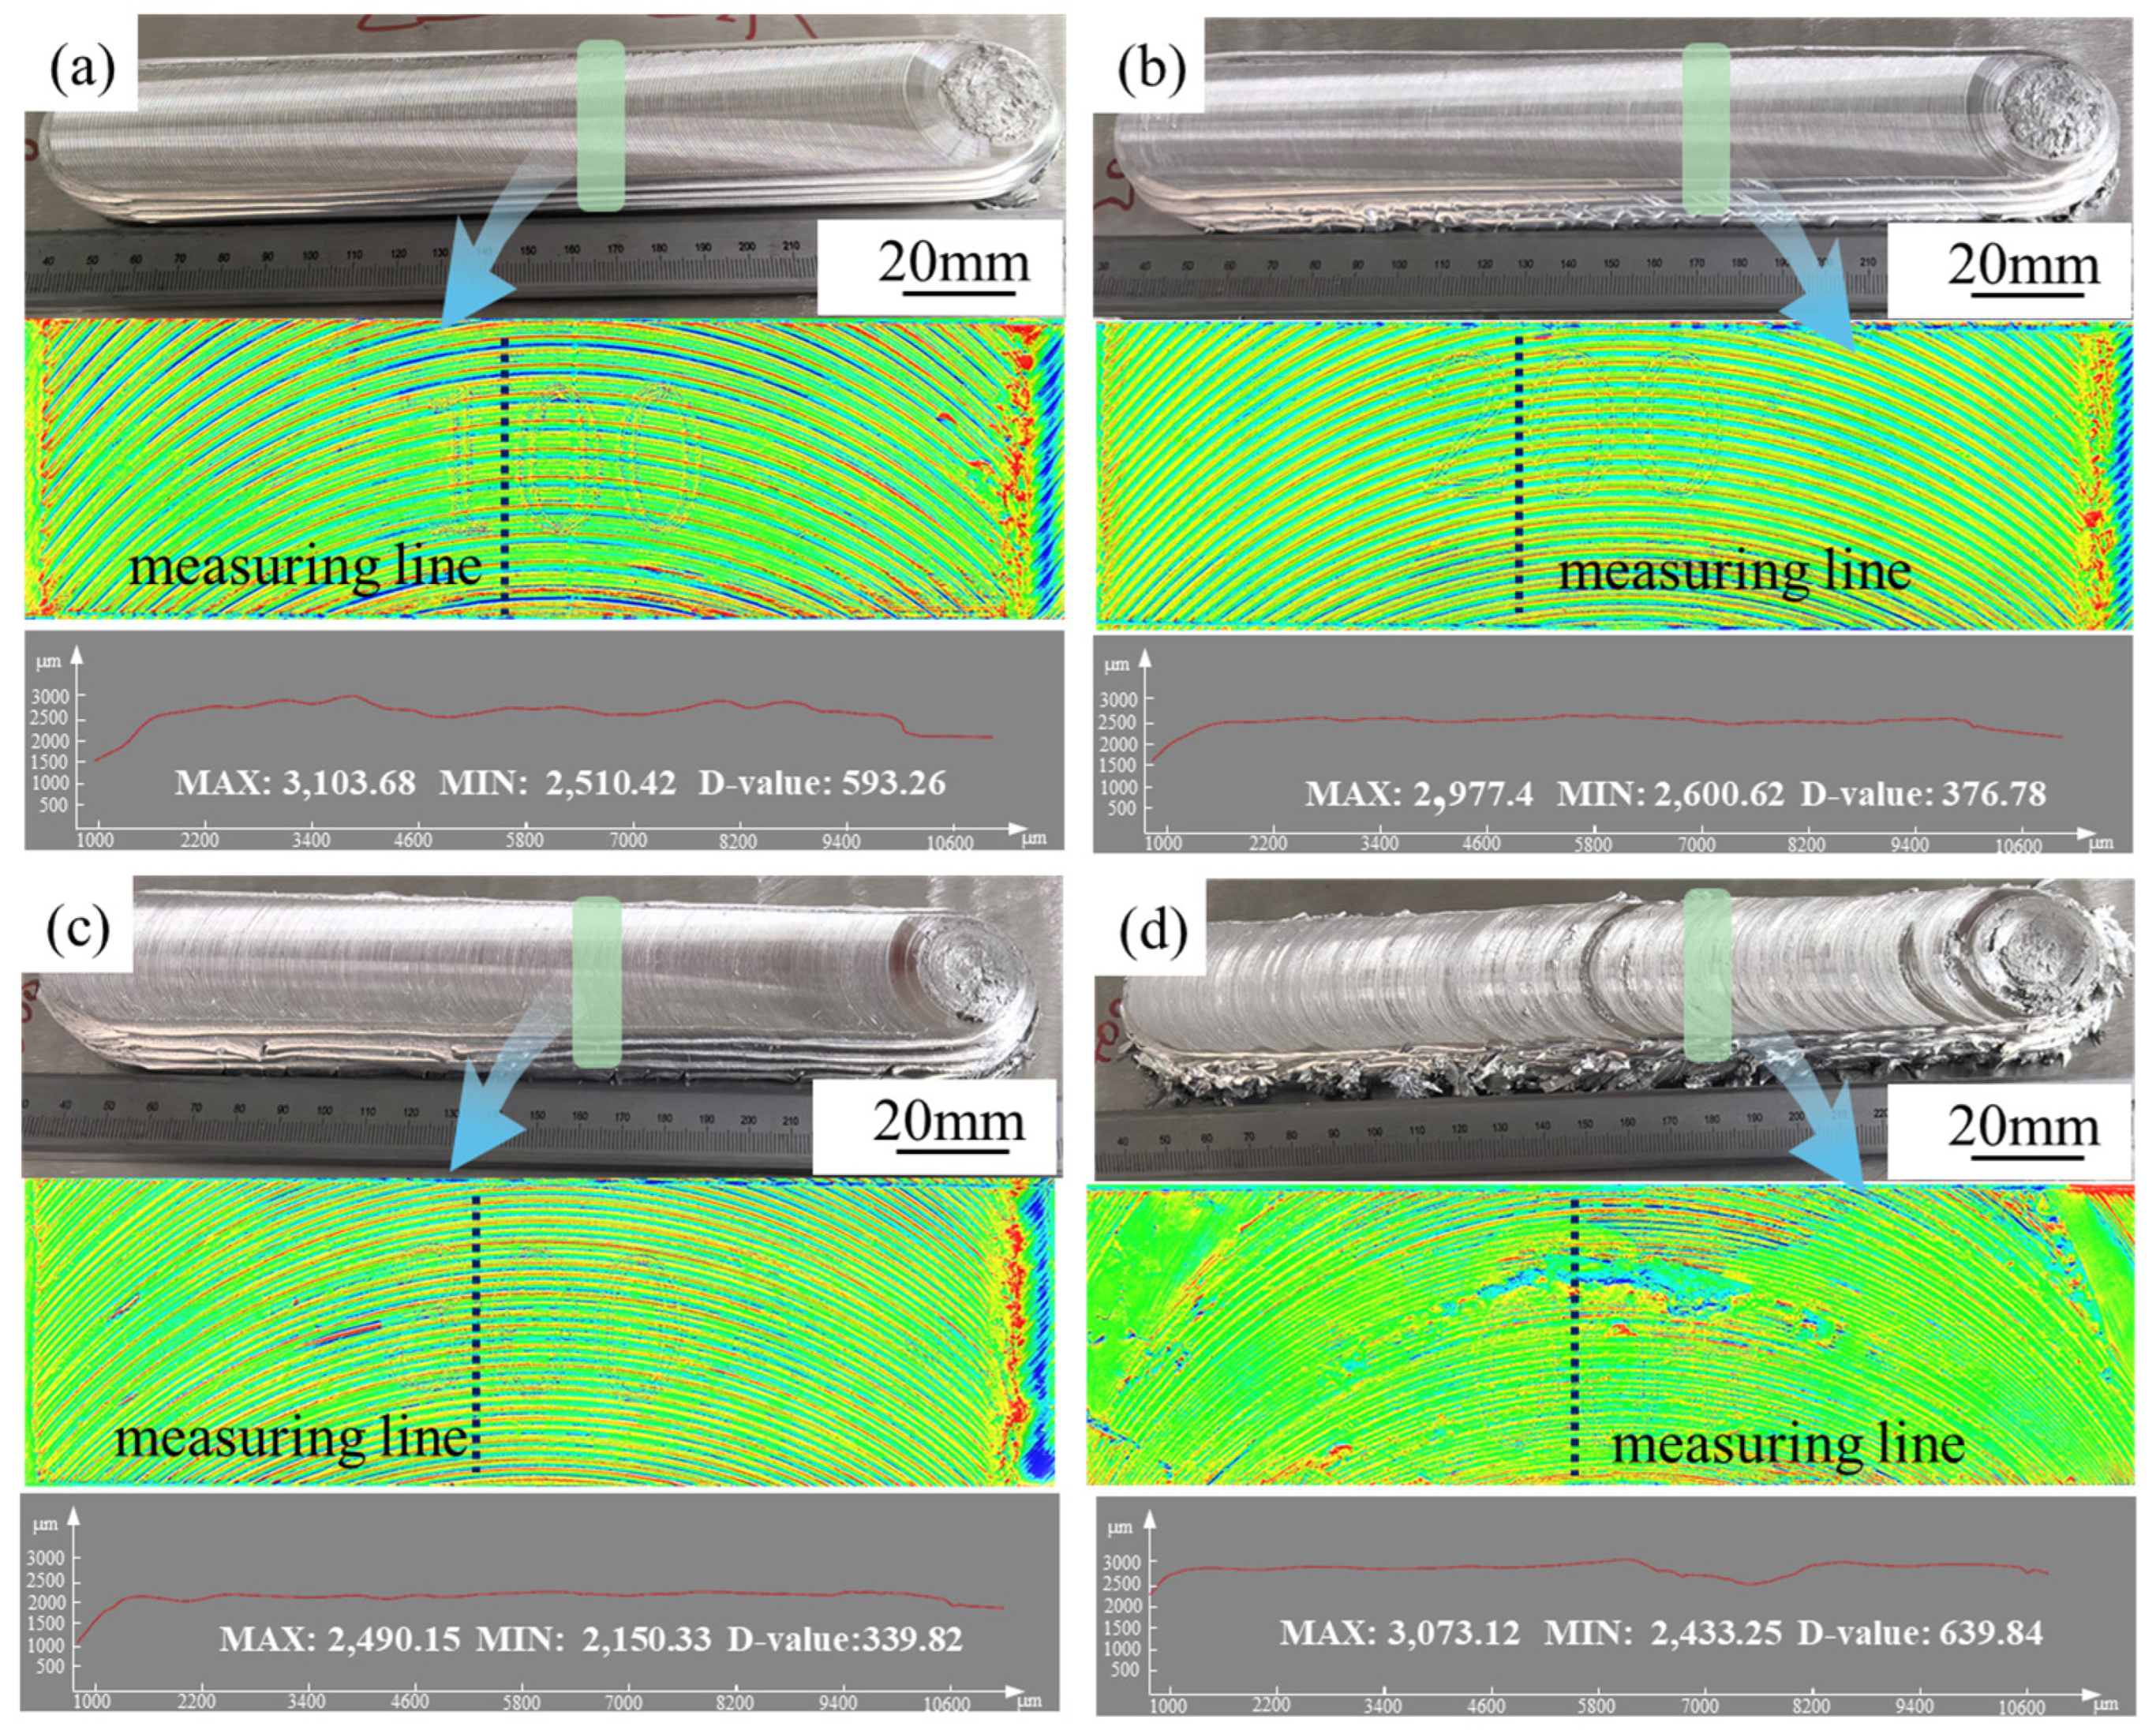
Figure 1. Surface formation of AFSD. (a) 100 rpm, (b) 200 rpm, (c) 300 rpm and (d) 400 rpm.
Jmmp 09 00387 g001
Figure 2. Cross-sectional morphology of AFSD. (a) 100 rpm, (b) 200 rpm, (c) 300 rpm, and (d) 400 rpm.
Jmmp 09 00387 g002
Figure 3. Schematic diagram of the material flow process. (a) Rotation initiated, (b) Material plasticizes and deforms, (c) Material is extruded in reverse, (d) Material follows the tool rotation, (e) A well-formed deposition layer is created, (f) A deposition layer with defects is formed.
Jmmp 09 00387 g003
Figure 4. Microstructure distribution in the travel direction at 200 rpm. (a) IPF of AS, (b) IPF of CZ, (c) IPS of RS, (d) Grain distribution of the AS, (e) Grain distribution of the CZ, (f) Grain distribution of the RS, (g) GNDs map of the AS, (h) GNDs map of the CZ, (i) GNDs map of the RS.
Jmmp 09 00387 g004
Figure 5. Microstructure distribution in the travel direction at 400 rpm. (a) IPF of AS, (b) IPF of CZ, (c) IPS of RS, (d) Grain distribution of the AS, (e) Grain distribution of the CZ, (f) Grain distribution of the RS, (g) GNDs map of the AS, (h) GNDs map of the CZ, (i) GNDs map of the RS.
Jmmp 09 00387 g005
Figure 6. Microstructure distribution in the build direction at 200 rpm. (a) IPF of top, (b) IPF of middle, (c) IPS of bottom, (d) Grain distribution of the top, (e) Grain distribution of the middle, (f) Grain distribution of the bottom, (g) GNDs map of the top, (h) GNDs map of the middle, (i) GNDs map of the bottom.
Jmmp 09 00387 g006
Figure 7. Microstructure distribution in the build direction at 400 rpm. (a) IPF of top, (b) IPF of middle, (c) IPS of bottom, (d) Grain distribution of the top, (e) Grain distribution of the middle, (f) Grain distribution of the bottom, (g) GNDs map of the top, (h) GNDs map of the middle, (i) GNDs map of the bottom.
Jmmp 09 00387 g007
Figure 8. SEM images and the corresponding EDS mappings at different rotation speeds: (ad) 200 rpm, (eh) 400 rpm.
Jmmp 09 00387 g008
Figure 9. HR-STEM images. (a) HRTEM BF image obtained from AS. (b) HRTEM BF image obtained from CZ. (c) HRTEM BF image obtained from RS. (d) Second-phase diffraction patterns.
Jmmp 09 00387 g009
Figure 10. (a) Ultimate tensile properties at different rotational speeds, (b) Ultimate tensile properties curve from AS to RS, (c) Fracture morphology of the 200 rpm, (d) Fracture morphology of the 100 rpm.
Jmmp 09 00387 g010
Figure 11. (a) Schematic and deposition results of the AFSD. (b) AFSD numerical simulation and experimental temperature curves, (c) Stress field of AFSD, (d) Flow field of AFSD, (e) Temperature field of AFSD, and (f) Stress and temperature curves of AFSD.
Jmmp 09 00387 g011
Figure 12. Results of the yield strength.
Jmmp 09 00387 g012
Table 1. Chemical Composition of 2024-T4 Aluminum Alloy (wt.%).
CuMgMnFeSiZnCrTiAl
4.601.550.660.210.090.040.030.02Bal
Table 2. Mechanical properties of 2024-T4 rods.
MaterialMicrohardness (HV)Ultimate Tensile Strength (MPa)Elongation (%)
2024-T412941012
Disclaimer/Publisher’s Note: The statements, opinions and data contained in all publications are solely those of the individual author(s) and contributor(s) and not of MDPI and/or the editor(s). MDPI and/or the editor(s) disclaim responsibility for any injury to people or property resulting from any ideas, methods, instructions or products referred to in the content.