Abstract
This paper presents a methodology for determining manufacturing tolerances of feature lines on automotive outer panels using visual sensory tests. Feature lines—narrow and long curved surfaces on automotive panels—play a critical role in the visual appeal of vehicles. However, achieving precise feature lines in mass production is challenging due to material spring-back during the stamping process. Conventional tolerance determination methods are unsuitable for these esthetic elements. To address this, we employed psychophysical sensory tests to find the visual difference thresholds for feature lines. By creating geometric models and conducting controlled sensory tests, we identified the minimum radius variations perceptible to the human eye. Thirty-four participants were tested using the method of constant stimuli, resulting in psychometric functions for feature lines with radii of 8, 10, and 12 mm. The findings suggest manufacturing tolerances of ±1.2 mm, ±1.3 mm, and ±1.5 mm, respectively. This approach provides a quantitative foundation for setting tolerances that balance visual quality with production feasibility.
1. Introduction
On automotive outer panels there are many lines, such as feature lines, character lines, crease lines, etc., as shown in Figure 1 [1]. Even if car designers define each line differently, the definition of a line is not geometrically clear to engineers. In this paper, we use the term ‘feature line’ for very narrow and long curved surfaces. Feature lines are pressed or folded lines on the automotive outer panels that are visually noticeable on smooth or planar surfaces [2,3]. Though called lines and appearing line-like, they are geometrically defined as curved surfaces. Geometrically, feature lines are created by the blending of two different planes or smooth surfaces.
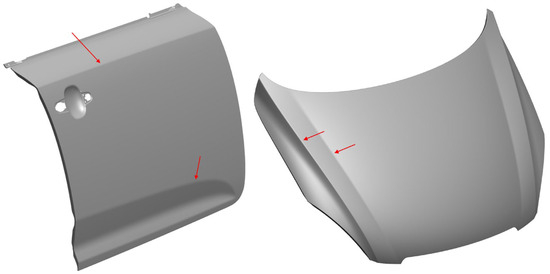
Figure 1.
Feature lines on automotive panels: (left) door panel, (right) bonnet panel.
In mass production, manufacturing tolerances of parts are inevitable. Manufacturing tolerances specify the permissible range of variation in a part’s dimensions or other characteristics. Perfect parts with zero tolerance are impractical; some degree of accuracy is necessary for proper assembly and correct function without additional machining or fitting [1]. Loose tolerances can reduce production costs but may compromise fit and reliability. Conversely, tight tolerances require special manufacturing methods and more inspections, often resulting in higher defect rates and exponentially rising costs. Therefore, selecting appropriate tolerance is essential to balancing functionality, manufacturability, and cost-effectiveness.
It is difficult to make feature lines precise in mass production. Automotive outer panels are manufactured through a stamping process, which involves spring-back of the material [2,3]. Feature lines are narrow and long surfaces are located on smooth and wide surfaces. Due to these characteristics, the spring-back effect is amplified during the stamping process. Consequently, feature lines on panels manufactured on the production line cannot match the design and vary from panel to panel [4]. In most conventional manufacturing processes, feature line tolerances are not established through a logical process. Designers want to specify tighter tolerances for consistent styling, while engineers prefer looser tolerances for higher productivity. Since feature lines are neither assembly components nor functional parts, traditional methods like fit tolerances or runout tolerances cannot be applied to determine their tolerances. This study proposes a method to systematically derive the tolerances, aiming to achieve more consistent quality control and improved esthetic outcomes.
Since feature lines are esthetic elements, determining their manufacturing tolerance requires identifying the perceptional ‘difference threshold’ of the human visual system. Difference threshold (also known as just noticeable difference: JND) is the minimum amount of something by which an observer can perceive a difference. The difference threshold is a concept in psychophysics and quantitatively describes the relationship between physical stimuli and the human senses [5]. Psychophysical testing is used to find the difference thresholds, and the tests utilize human senses to measure and evaluate things that are difficult to quantify, such as preferences of color, taste, scent, or sound; the degree of surface finish; or levels of noise or dirtiness. Sensory testing is a psychophysical method that relies on human senses and is often used to comprehensively assess human preferences. Several testing paradigms have been developed to measure the sensory thresholds: method of limits, method of constant stimuli, and method of adjustment. The method of limits gradually increases and decreases stimulus until perception is achieved, and the method of constant stimuli presents stimuli in a random sequence to gauge response accuracy. The method of adjustment is where participants manually adjust a stimulus to match a reference point. Beyond its foundational role in psychology, psychophysical tests are widely applied in sensory evaluation, clinical diagnostics, and particularly in product and industrial design. Since feature lines are visual quality elements rather than functional components of automotive panels, the visual difference threshold must be determined, and sensory testing can be utilized for this purpose.
Sensory tests can be conducted using computer-generated images instead of physical specimens. Although computer vision provides a robust framework for objective shape analysis, most algorithms quantify geometric deviations without accounting for human perceptual responses. Because feature line tolerances depend on the observer’s visual experiences, exclusive reliance on computer vision metrics may overlook subtle visual clues that influence perceptual sensitivity. In contrast, the psychological method employed in this study utilizes actual physical specimens, thereby ensuring that the derived tolerances are aligned with human visual perception.
This study proposes an experimental methodology for deriving the manufacturing tolerance for the radii of a feature line on automotive outer panels. The approach is grounded in a visual sensory test using the constant stimuli method, a psychological technique widely recognized for quantifying perceptional thresholds. To support the experimental process, key geometric parameters of feature lines were defined, and corresponding physical specimens were fabricated. The methodology was then applied to assess its validity and to establish tolerance values for representative feature line geometries.
2. Related Works
Extensive studies on the esthetic lines or character lines have been carried out from different perspectives. The fundamentals and the importance of esthetic design are well introduced in a book [6]. Design frameworks for the esthetic lines have been developed and presented [7]. The frameworks support extracting semantic data from three-dimensional models, and support concept development in the esthetic design. Computer-aided design (CAD) and modeling systems for the esthetic lines have also been studied [8,9,10]. The systems support shape generation and manipulation in car styling. The way to express the shape of an object through feature lines has been studied [11]. The esthetic quality of automobile bodies has also been studied [12]. This study used digital images, rather than physical solid bodies, to identify user preferences for car body split lines and gaps. The results of the study, conducted using a survey methodology, showed that users preferred smaller gap sizes. However, it is not easy to find a study that connects the esthetic and manufacturing aspects of feature lines.
Although the stamping process for automotive panels has been studied extensively [13,14,15], very limited work has been conducted on esthetic aspects. In the conventional manufacturing process of a body outer panel, the overall shape of a panel is checked by a checking fixture or numerically measured by a three-dimensional scanner. The numerically measured shape is evaluated by comparing it with the designed shape using computer software systems. The curvature of the panel is inspected via the reflection of a zebra pattern. However, small geometries, such as the section profile of a feature line, are not measured. Subtle surface defects in automotive outer panels have been identified and classified quantitatively [16]. In these papers, they measured a pressed panel and estimated the curvature of a sectional curve to quantify the defect of the surface and successfully identified the deflection of tens of micrometers; the defects represent relative curvature changes rather than absolute geometric dimensions.
The authors of this paper have conducted several studies on the measurement and analysis of the section profile of a feature line [17]. They measured the section profile of a feature line using a coordinate measuring machine (CMM) and showed how different the height and the curvature of the section profile of a feature line from the designed shape. The panels manufactured in an actual production line were used in the study, and the minimum radius of curvature of the section profile of the feature line was about 20.8 mm, while the radius was designed as 12.2 mm. In this case, the chord length of the section profile was 2.0 mm. In this paper, they have also introduced a geometric measure to analyze the section profiles and a registration method to align the measured profile and the designed profile.
Engineering tolerance has been studied in a variety of fields and recently, tolerances in additive manufacturing have been studied extensively [18,19]. Tolerance optimization methods, based on manufacturing difficulties, have also been proposed [20]. However, the study of geometric tolerances for esthetic parts, such as automotive outer panels, is not easy to find.
Psychophysical testing helps to define tolerance limits for products. The theoretical foundations of psychophysics were first established in the 1880s by Weber, Fechner, and Wundt [5]. The concept of thresholds and the methods of sensory tests have been employed to verify or evaluate various physical quantities, including the acceleration amplitude of the airplane [21], the stiffness and damping force of a mechanical manipulator [22], the color of acrylic denture base resins [23], and the color of printed images [24]. The difference thresholds can be a suitable criterion for determining the manufacturing tolerance of the feature line.
3. Method for Finding the Difference Threshold
3.1. Test Variable
A feature line is a blend surface that smoothly connects two primary surfaces and is typically a long and narrow surface. In this paper, we focus our study on the shape of the vertical cross-section, which determines the sharpness of a feature line. The vertical section of the feature line surface can be represented by a circular arc. Therefore, the shape parameters of the feature line can be the angle of the two tangent vectors at the ends of the arc and the radius of the arc, as shown in Figure 2. This means that the two parameters, angle and radius, uniquely define the cross-section of the feature line.
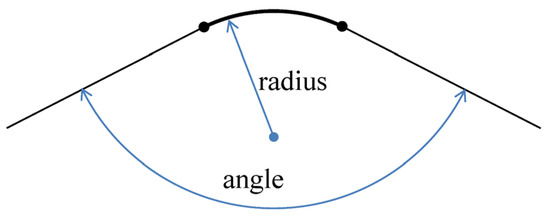
Figure 2.
Cross-section of the feature line surface.
A feature line surface must be connected smoothly with adjacent surfaces, so the angle is determined by the two adjacent surfaces. Therefore, the radius is the only dimensional value of the feature line in design process, and the dimensional tolerance of the radius is crucial for making the surface. The difference threshold of the radius will be used to determine the dimensional tolerance.
3.2. Specimen Design
Sensory tests find the relationship between physical stimuli and human senses. Sensory tests for the difference threshold require physical samples of the feature line. Samples of actual automotive outer panels are too large to use for testing, and it is difficult to manage the radius of the feature lines.
We have created a geometric model as shown in Figure 3. The width and length of the model are both 50 mm and the height of the base is 5 mm. The narrow, long surface in the middle of the top side is the feature line surface, and the surfaces on either side are planes. As a result, the length of the feature line is only 50 mm, and the surrounding surface is at most 50 × 50 mm2. The actual length of the feature line of the car body can be hundreds to thousands of mm, and most of them are located on a very wide surface. It is expected that the length of the feature line and the width of the surrounding surface will affect the human senses and threshold. However, as the sample size increases, it is difficult to make accurately, and the difficulty of the sensory test also increases. Future research on the effect of the size of the specimen is also necessary.
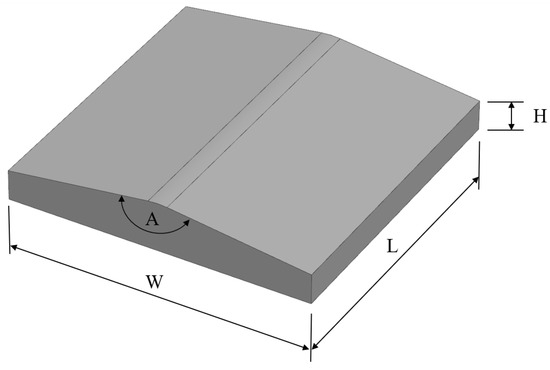
Figure 3.
Geometric model of the specimen: width (W), length (L), height (H), and angle (A).
3.3. Test Environment and Question
In the sensory test, the subject visually observes two specimens (a pair), and answers ‘yes’ or ‘no’ to the question “Is the right one sharper than the left one?”. Cars are generally used outdoors, and users view the car’s exterior in an outdoor environment. Therefore, it is reasonable to test human senses outdoors, but it is not suitable for sensory testing outdoors because the brightness and direction of light cannot be consistently controlled.
In our experiment, the two specimens are placed on a flat white plate on a table in a room, as shown in Figure 4. The angle between the plate and the table is 25 degrees and the illuminance on the plate is approximately 500 lux with indirect lighting. The distance between the two specimens is approximately 150 mm. In a pair of the specimens, one is the reference specimen, and the other is the comparison specimen. The reference specimen is always the same, but the comparison specimen is different. The radius of the feature lines up in the comparison specimen changes. The comparison specimen is randomly selected, and the position of the specimen (left or right) is also randomly selected. The subject is not allowed to touch the specimens.
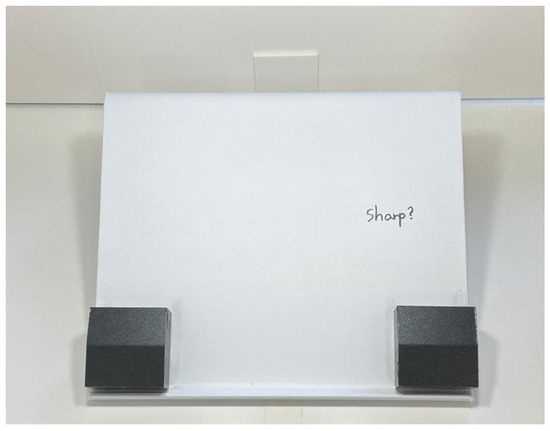
Figure 4.
Test environment.
3.4. Preliminary Test
As a preliminary test, you should first find the radius range of the comparison specimens. You can determine the range of the radius by measuring the percentage of responses that the reference specimen is sharper than the comparison specimen. The larger the radius of the comparison specimen compared to the radius of the reference specimen, the higher the percentage of responses; conversely, the smaller radius of the comparison specimen is compared to the radius of the reference specimen, the lower the percentage of responses. The minimum and maximum values of the radius range correspond to 0% and 100%, respectively, indicating that the reference specimen is perceived as sharper.
3.5. Main Test
In the main test, nine comparison specimens are used, ranging from the minimum to the maximum radius determined in the preliminary test. For the radius of specimen, four are smaller than the reference, one is the same as the reference, and the remaining four are larger than the reference.
The nine specimens are used three times to create a total of 27 test pairs. The order and the left–right position of the 27 test pairs is randomly selected and given to a subject. The question given to the subject is “Is the right one sharper than the left one?”, as mentioned earlier. This test is repeated for all subjects.
The correct answer depends on the specimen and the left–right position. After determining the correctness of the subject’s answers, the percentage of correct responses is collected based on the radius of the comparison specimens. The result is a psychometric function, as shown in Figure 5.
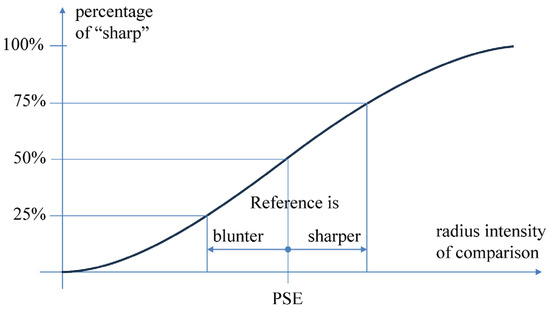
Figure 5.
Psychometric function for difference threshold.
According to psychophysical convention, the intensity at 75% is considered noticeably stronger than the reference, and the intensity at 25% is considered noticeably weaker than the reference. When the observer cannot see a difference, he or she chooses randomly between “stronger” and “weaker”: this corresponds to the intensity at 50% and that intensity is the point of subjective equivalence (PSE). The difference threshold is the average of the two differences in intensity between the PSE and the intensities at 25% and at 75% [5].
4. Case Study and Results
4.1. Test Samples
In this paper, we studied three feature lines with radii of 8, 10, and 12 mm and a constant angle of 165 degrees (radii and angles are shown in Figure 3). The radius range of the comparison specimens for each reference specimen was determined through preliminary tests. The specimens for preliminary tests were made using 3D printing (Objet500 Connex, Stratasys, Eden Prairie, MN, USA), which is an easier way to make specimens than milling. The preliminary tests showed that the lower or upper bound threshold is approximately 4 mm in all cases.
In the main test, we used three sets of specimens because we studied three feature lines with different radii. Each set includes one reference specimen and nine comparison specimens as shown in Table 1. A total of 13 comparison specimens, ranging from 4 to 16 mm with 1 mm intervals, and 3 reference specimens with radii of 8, 10, and 12 mm were made by milling, not 3D printing. The surface finish of the specimens printed on a 3D printer was not suitable for the main test: the print pattern was visible even after being wrapped with film. Figure 6 shows the difference between the printed and milled samples. A 30 mm diameter ball-end mill was used for milling, with a zigzag toolpath perpendicular to the feature line with a pitch step of 0.3 mm. The arithmetic cusp height is less than 1 micrometer (0.00075 mm). All specimens were wrapped with a film (CMF-04002, Tools International, Tokyo, Japan), which is a purpose-engineered colored sheet material utilized in automotive clay modeling process.

Table 1.
The radius size (in millimeters) of the reference and comparison specimens for the three test sets.
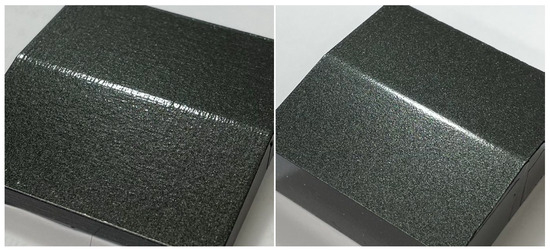
Figure 6.
Sample specimens: (left) additive manufacturing, (right) milling.
4.2. Test Procedure
A total of 34 subjects participated in the main test, of which we were able to record responses from 30 people (14 males and 16 female) between the ages of 20 and 31. Each subject answered the comparison question (is the right one is sharper than the left one?) a total of 91 times: nine pair in one set, three sets at a time, three times. The order of 91 comparison pairs and the position (left or right) of the specimens were randomly generated.
Each comparison test was limited to twenty seconds, and two breaks were taken between tests to prevent physical and psychological fatigue due to simple and repetitive questions. The overall test time for a subject was less than 40 min, including test instructions and two breaks. Only yes/no responses were collected, and no fee was paid for participation. The experiment protocol compiled with the principles of Korea’s Enforcement Decree of Bioethics and Safety Act and was approved by the Institutional Review Board of Seoul National University of Science and Technology (IRB #2025-0002-02). All subjects provided written informed consent before the study.
4.3. Test Results
Figure 7 shows the results of the overall test, and Table 2 shows the noticeably smaller radius and the noticeably larger radius for each reference radius. The threshold radius values in the table are linearly interpolated. The difference thresholds are 1.48, 1.57, and 1.81 mm for the radii of 8, 10, and 12 mm, respectively. The slope of the threshold radius and the PSE (point of subjective equivalence) as the radius increases is shown in Figure 8. The slope of the threshold is almost linear, and the amount of the difference threshold increases as the radius increases.
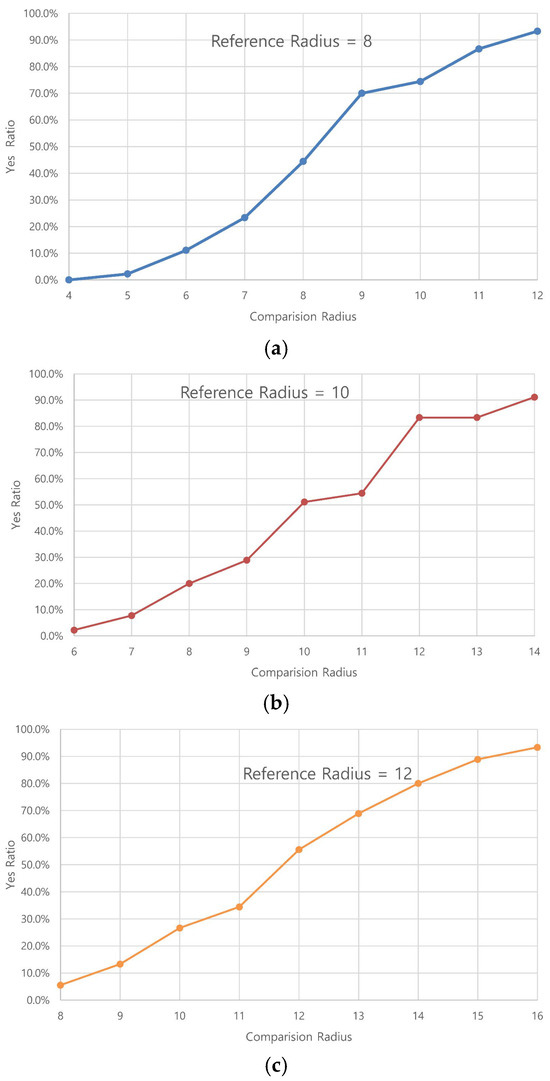
Figure 7.
Psychometric functions for the three feature lines: (a) radius = 8 mm; (b) radius = 10 mm; (c) radius = 12 mm.
Table 2.
Noticeably smaller and larger radii, and difference thresholds (in millimeters).
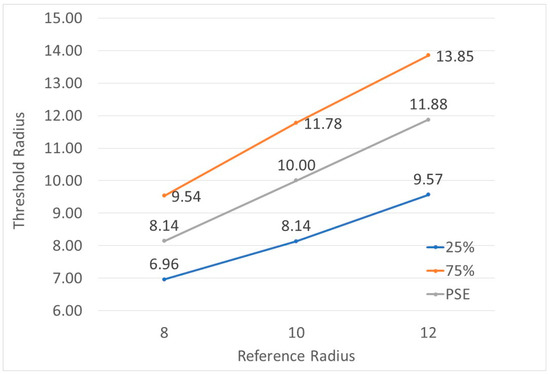
Figure 8.
Thresholds corresponding to each radius.
5. Discussion
First, the resulting psychometric functions were not smooth ogive curves, as shown in Figure 7. In psychophysics, it is assumed that the result of a sensory test is an ogive curve with a normal distribution. An ogive or distribution curve of a normal function has the general shape of an elongated letter S, also known as a sigmoid, as shown in Figure 5. Since we collected 90 responses for one comparison pair, repeated three times for 30 subjects, it should generally follow a normal distribution in practice. The authors speculate that this is due to the geometric accuracy of the specimens, as all three cases have irregularities around a radius of 10–12 mm.
Second, for a sensory test, the response should typically be 0% at the lowest intensity and 100% at the highest intensity, and the comparison pairs should be unambiguous to anyone. In the results shown in Figure 7, the response at the largest radius is less than 100%. For the preliminary test, we used 3D-printed specimens that may not be geometrically accurate. For the main test, a slightly wider range of radius is recommended than the preliminary test result.
Finally, the geometric dimensions of the specimens were not clear. Feature line surfaces have subtle geometric features that are difficult to make accurately, and the specimens were wrapped in a polymer film with adhesive. Making an accurate size specimen and measuring it precisely will be another research challenge.
Therefore, we propose that the machining tolerances for the feature lines be set more conservative than the psychophysical difference threshold. For example, applying a safety factor of 80% to the difference thresholds yields manufacturing tolerances of ±1.2, ±1.3, and ±1.5 mm for radii of 8, 10, and 12 mm, respectively. In manufacturing aspects, the tolerances could be applicable to die machining and panel stamping.
6. Conclusions
This study is the first to present a methodology for determining manufacturing tolerances of feature lines on automotive outer panels using sensory tests. By applying the method of constant stimuli, we have successfully quantified the visual difference thresholds for feature lines with three different radii and a constant angle of 165 degrees. The results demonstrate that the difference thresholds increase as the radius of the feature line increases, with values of 1.48 mm, 1.57 mm, and 1.81 mm for radii of 8 mm, 10 mm, and 12 mm, respectively. In the manufacturing process, for feature lines with radii of 8, 10, and 12 mm, manufacturing tolerances will be ±1.2, ±1.3, and ±1.5 mm, respectively. These findings provide valuable insights for automotive designers and engineers, offering a balance between esthetic consistency and manufacturing feasibility. The methodology presented here can be adapted to other esthetic elements in automotive design, potentially improving quality control processes and optimizing production efficiency. While the study yielded meaningful results, it also revealed areas for further investigation, such as the impact of specimen manufacturing precision on test outcomes and the need for a wider range of test stimuli. Faithfully recreating the size of the feature line and the actual usage environment is also a critical challenge. This study used a simplified small part of a full-scale model and a standardized viewing environment, which may not fully capture all the contextual nuances of the actual vehicle usage conditions. The impact of feature line sample size and the surrounding environment on determining tolerances could also be important areas for future research.
This study provides the tolerances for just three example feature lines—angles of 165 degrees and radii of 8, 10, and 12 mm. An automotive company has classified feature lines with angles greater than 150 degrees and radii less than 48 mm as subtle features that are difficult to manufacture precisely [4]. Determining manufacturing tolerances for the full range of feature lines—spanning angles from 150 to 180 degrees and radii from 0 to 48 mm—is a lot of work. Future work should focus on developing a function that calculates the tolerances of different feature lines using angles and radii as independent variables. Future research could explore these aspects, as well as extend the application of this approach to other automotive design. In conclusion, this psychophysical methodology offers a promising method for establishing data-driven, perception-based manufacturing tolerances for feature lines, contributing to ongoing efforts to enhance both the esthetic quality and production efficiency of automotive outer panels.
Author Contributions
Conceptualization, Y.C. and M.-S.B.; Methodology, Y.C. and M.-S.B.; Experimental design, M.-S.B.; Data analysis, M.-S.B.; Writing—original draft preparation, Y.C.; Writing—review and editing, Y.C.; Supervision, Y.C. All authors have read and agreed to the published version of the manuscript.
Funding
This research received no external funding.
Institutional Review Board Statement
The study was conducted in accordance with the Declaration of Helsinki and approved by the Institutional Review Board of Seoul National University of Science and Technology (Approval Number: 2025-0002-02 on 29 April 2025).
Informed Consent Statement
Not applicable.
Data Availability Statement
The data that support the findings of the study are available from the corresponding author upon request.
Acknowledgments
The authors gratefully acknowledge the support of Sung-Oh Kwon and Sung-Min Jun at GM Korea.
Conflicts of Interest
The authors declare no conflicts of interest.
References
- Müller, R.; Scholer, M.; Schirmer, L.; Blum, A. Tolerance Management in Robot-Based Assembly Optimizes Product, Process and System Deviations. Procedia CIRP 2020, 93, 1103–1108. [Google Scholar] [CrossRef]
- Banu, M.; Takamura, M.; Hama, T.; Naidim, O.; Teodosiu, C.; Makinouchi, A. Simulation of Springback and Wrinkling in Stamping of a Dual Phase Steel Rail-Shaped Part. J. Mater. Process. Technol. 2006, 173, 178–184. [Google Scholar] [CrossRef]
- Wagoner, R.H.; Lim, H.; Lee, M.G. Advanced Issues in Springback. Int. J. Plast. 2013, 45, 3–20. [Google Scholar] [CrossRef]
- Lee, C.W.; Yu, J.; Youn, H.W.; Chung, Y. The Minimum Formable Radius of Subtle Feature Lines in Automotive Outer Panel Stamping. Int. J. Automot. Technol. 2021, 22, 993–1001. [Google Scholar] [CrossRef]
- Gescheider, G.A. Psychophysics, 3rd ed.; Psychology Press: Hove, UK, 2013; ISBN 978-1-134-80122-0. [Google Scholar]
- Lewin, T.; Borroff, R. How to Design Cars like a Pro, New ed.; Motorbooks: Minneapolis, MN, USA, 2010; ISBN 978-0-7603-3695-3. [Google Scholar]
- Cheutet, V.; Catalano, C.E.; Pernot, J.P.; Falcidieno, B.; Giannini, F.; Leon, J.C. 3D Sketching for Aesthetic Design Using Fully Free-Form Deformation Features. Comput. Graph. 2005, 29, 916–930. [Google Scholar] [CrossRef][Green Version]
- Yoshida, N.; Saito, T. Interactive Aesthetic Curve Segments. Vis. Comput. 2006, 22, 896–905. [Google Scholar] [CrossRef]
- Monti, M. Styling Features for Industrial Design. In Innovation in Product Design; Bordegoni, M., Rizzi, C., Eds.; Springer: London, UK, 2011; pp. 79–95. ISBN 978-0-85729-774-7. [Google Scholar]
- Yannou, B.; Cluzel, F.; Dihlmann, M. Evolutionary and Interactive Sketching Tool for Innovative Car Shape Design. Mech. Ind. 2013, 14, 1–22. [Google Scholar] [CrossRef]
- Pernot, J.P.; Guillet, S.; Leon, J.C.; Giannini, F.; Catalano, C.E.; Falcidieno, B. A Shape Deformation Tool to Model Character Lines in the Early Design Phases. In Proceedings of the Proceedings SMI. Shape Modeling International 2002, Banff, AB, Canada, 17–22 May 2002; IEEE: Piscataway, NJ, USA, 2002; pp. 165–276. [Google Scholar]
- Duraiswamy, V.; Campean, F.; Harris, S.; Munive-Hernandez, J.E. Development of a Methodology for Robust Evaluation of Perceived Quality of Vehicle Body Panel Gaps. In Proceedings of the 15th International Design Conference, Dubrovnik, Croatia, 21–24 May 2018; pp. 237–248. [Google Scholar]
- Gunnarsson, L.; Schedin, E. Improving the Properties of Exterior Body Panels in Automobiles Using Variable Blank Holder Force. J. Mater. Process. Technol. 2001, 114, 168–173. [Google Scholar] [CrossRef]
- Keum, Y.T. Simulation of Stamping Process of Automotive Panel Considering Die Deformation. In Proceedings of the AIP Conference Proceedings, Detroit, MI, USA, 15–19 August 2005; AIP: Melville, NY, USA, 2005; Volume 778, pp. 90–95. [Google Scholar]
- Oujebbour, F.Z.; Habbal, A.; Ellaia, R. Optimization of Stamping Process Parameters to Predict and Reduce Springback and Failure Criterion. Struct. Multidiscip. Optim. 2015, 51, 495–514. [Google Scholar] [CrossRef]
- Chung, W.; Chung, Y.; Kim, W. A Robust Prediction Method of Surface Deflection Using Stoning Simulation and Curvature Analysis. Steel Res. Int. 2015, 86, 886–893. [Google Scholar] [CrossRef]
- Chung, Y.; Choe, W.C.; Han, J. Comparison of the Manufactured Shape with the Designed Shape of a Crease Line on the Outer Panel of a Car. In Proceedings of the 11th International Symposium on Tools and Methods of Competitive Engineering (TMCE) 2016 Conference, Aix-en-Provence, France, 9–13 May 2016; pp. 613–622. [Google Scholar]
- Xu, J.; Buswell, R.A.; Kinnell, P.; Biro, I.; Hodgson, J.; Konstantinidis, N.; Ding, L. Inspecting Manufacturing Precision of 3D Printed Concrete Parts Based on Geometric Dimensioning and Tolerancing. Autom. Constr. 2020, 117, 103233. [Google Scholar] [CrossRef]
- Rupal, B.S.; Anwer, N.; Secanell, M.; Qureshi, A.J. Geometric Tolerance and Manufacturing Assemblability Estimation of Metal Additive Manufacturing (AM) Processes. Mater. Des. 2020, 194, 108842. [Google Scholar] [CrossRef]
- Ghali, M.; Elghali, S.; Aifaoui, N. Associated Tolerance Optimization Approach Using Manufacturing Difficulty Coefficients and Genetic Algorithm. Assem. Autom. 2022, 42, 782–795. [Google Scholar] [CrossRef]
- Naseri, A.; Grant, P. Difference Threshold: Measurement and Modeling. In Proceedings of the AIAA Modeling and Simulation Technologies Conference, Portland, OR, USA, 8 August 2011; American Institute of Aeronautics and Astronautics: Reston, VA, USA, 2011. [Google Scholar]
- Fu, W.; Landman, A.; Van Paassen, M.M.; Mulder, M. Modeling Human Difference Threshold in Perceiving Mechanical Properties from Force. IEEE Trans. Hum. Mach. Syst. 2018, 48, 359–368. [Google Scholar] [CrossRef]
- Ren, J.; Lin, H.; Huang, Q.; Liang, Q.; Zheng, G. Color Difference Threshold Determination for Acrylic Denture Base Resins. Biomed. Mater. Eng. 2015, 26, S35–S43. [Google Scholar] [CrossRef] [PubMed]
- Liu, H.X.; Cui, G.H.; Huang, M.; Wu, B.; Liu, Y. Color-Difference Threshold for Printed Images. Appl. Mech. Mater. 2013, 469, 236–239. [Google Scholar] [CrossRef]


Disclaimer/Publisher’s Note: The statements, opinions and data contained in all publications are solely those of the individual author(s) and contributor(s) and not of MDPI and/or the editor(s). MDPI and/or the editor(s) disclaim responsibility for any injury to people or property resulting from any ideas, methods, instructions or products referred to in the content. |
© 2025 by the authors. Licensee MDPI, Basel, Switzerland. This article is an open access article distributed under the terms and conditions of the Creative Commons Attribution (CC BY) license (https://creativecommons.org/licenses/by/4.0/).