Article

Impact of Combined Zr, Ti, and V Additions on the Microstructure, Mechanical Properties, and Thermomechanical Fatigue Behavior of Al-Cu Cast Alloys

1
Department of Applied Science, University of Quebec at Chicoutimi, Saguenay, QC G7H 2B1, Canada
2
Arvida Research and Development Centre, Rio Tinto Aluminum, Saguenay, QC G7S 4K8, Canada
*
Author to whom correspondence should be addressed.
J. Manuf. Mater. Process. 2024, 8(6), 250; https://doi.org/10.3390/jmmp8060250
Submission received: 29 September 2024 / Revised: 2 November 2024 / Accepted: 4 November 2024 / Published: 6 November 2024

Abstract

:
The effects of minor additions of the transition elements Zr, Ti, and V on the microstructure, mechanical properties, and out-of-phase thermomechanical fatigue behavior of 224 Al-Cu alloys were investigated. The results revealed that the introduction of the transition elements led to a refined grain size and a finer and much denser distribution of θ″/θ′ precipitates compared to that of the base alloy, which enhanced the tensile strength but reduced the elongation at both room temperature and 300 °C. Constitutive analyses based on theoretical strength calculations indicated that precipitation strengthening was the primary mechanism contributing to the strength of both tested alloys at room temperature and 300 °C. The out-of-phase thermomechanical fatigue test results showed that the addition of transition elements caused a slight decrease in the fatigue lifetime, which was mainly attributed to the reduced ductility and higher peak tensile stress at low temperatures. During the fatigue process, the transition element-added alloy exhibited a lower coarsening ratio, indicating higher thermal stability, which mitigated the negative impact of the reduced ductility on the fatigue performance to some extent. Considering their various properties, the addition of Zr, Ti, and V is recommended to improve the overall performance of Al-Cu 224 cast alloys.

1. Introduction

Precipitation-strengthened Al-Cu alloys, which are recognized for their light weight and excellent mechanical properties, have extensive applications in the automotive industry, making it possible to meet stringent carbon emission standards [1,2]. However, certain critical applications to engine components such as cylinder heads and engine blocks have limitations owing to their enhanced temperature and workload levels. In particular, to optimize fuel efficiency, car engines are expected to operate at 300–350 °C and a pressure of 200 bar [3]. Overcoming these challenges is imperative for the advancement of new engine design and development.
The first limitation involves the high-temperature strength of an Al-Cu alloy. As a typical precipitation-hardened alloy, its precipitation sequence unfolds as follows: super-saturated solid solution (SSS) → GP I zones → θ″ → θ′ → θ [4,5]. When the service temperature exceeds the aging temperature (approximately 200 °C for Al-Cu alloys), the atomic diffusion rate accelerates and the solid solubility increases. This high diffusion rate and solid solubility accelerate the coarsening of precipitates, and in some cases, result in the transformation of the primary strengthening precipitates (θ″ and θ′) into the equilibrium θ phase or its dissolution in the matrix, leading to a significant strength loss at elevated temperatures [6]. An effective approach to improve the elevated-temperature strength of an Al-Cu alloy involves enhancing the thermal stability of the strengthening precipitates, particularly θ′, through microalloying with transition elements (TEs), which are known for their slow diffusion rates. For example, the individual addition of Mn or Zr provides effective stability for Al-Cu alloys above 200 °C [7,8]. Moreover, the combined effects of Mn and Zr significantly enhance the thermal stability of Al-Cu alloys, giving them an acceptable thermal resistance at temperatures ranging from 300 to 350 °C [9,10,11]. Our recent research has also indicated that the synergistic influence of Mg, Mn, and Zr/Ti/V can further improve the thermal stability and creep resistance of Al-Cu 224 alloys at 300 °C [12,13]. The addition of these TEs improves the thermal resistance of Al-Cu alloys at elevated temperatures through the two following main mechanisms: segregating the interfaces between the precipitates and matrix to stabilize the precipitates [7,9,14] and forming thermally stable coexisting dispersoids such as Al3M (M = Zr, Ti, V) [15,16,17].
Another challenge in the application of Al-Cu alloys is their limited fatigue resistance. During the start–end cycles of an engine, engine components are subjected to cyclic thermal and stress loadings, leading to thermomechanical fatigue (TMF) failure, which is a major factor restricting the service life of an engine [18]. The anticipated increases in temperature and stress levels in future engines will make engine components more susceptible to TMF failure during their service. Because the mechanical strain amplitude reaches its maximum value at the lowest temperature during the start–end cycles of the cylinder head of engine [18], the specific dominant failure mechanism for the cylinder head is out-of-phase thermomechanical fatigue (OP-TMF) [19,20]. Several strategies have been developed to improve the OP-TMF performance, such as reducing the porosity levels [21,22,23], controlling the size of the dendritic microstructure [24], modifying the morphology and/or reducing the content of brittle intermetallic phases [18,25,26], and improving the microstructural stability [27,28,29]. Although numerous studies have been performed to identify the potential factors influencing TMF behavior, limited attention has been paid to the impact of TEs on the OP-TMF performance of Al-Cu alloys.
In this study, we systematically investigated the influence of TEs, particularly a combination of Zr, Ti, and V, on the microstructure, mechanical properties, and OP-TMF performance of Al-Cu 224 cast alloys. The distinctive impact of TEs on the precipitation microstructure was studied using transmission electron microscopy (TEM). Tensile tests were performed at both room temperature (RT) and 300 °C, and a close relationship was established between the microstructure and yield strength. OP-TMF tests were performed with a mechanical strain amplitude of 0.2–0.6% and a temperature span of 60–300 °C. After the fatigue tests, the precipitate evolution and damage characteristics were analyzed.

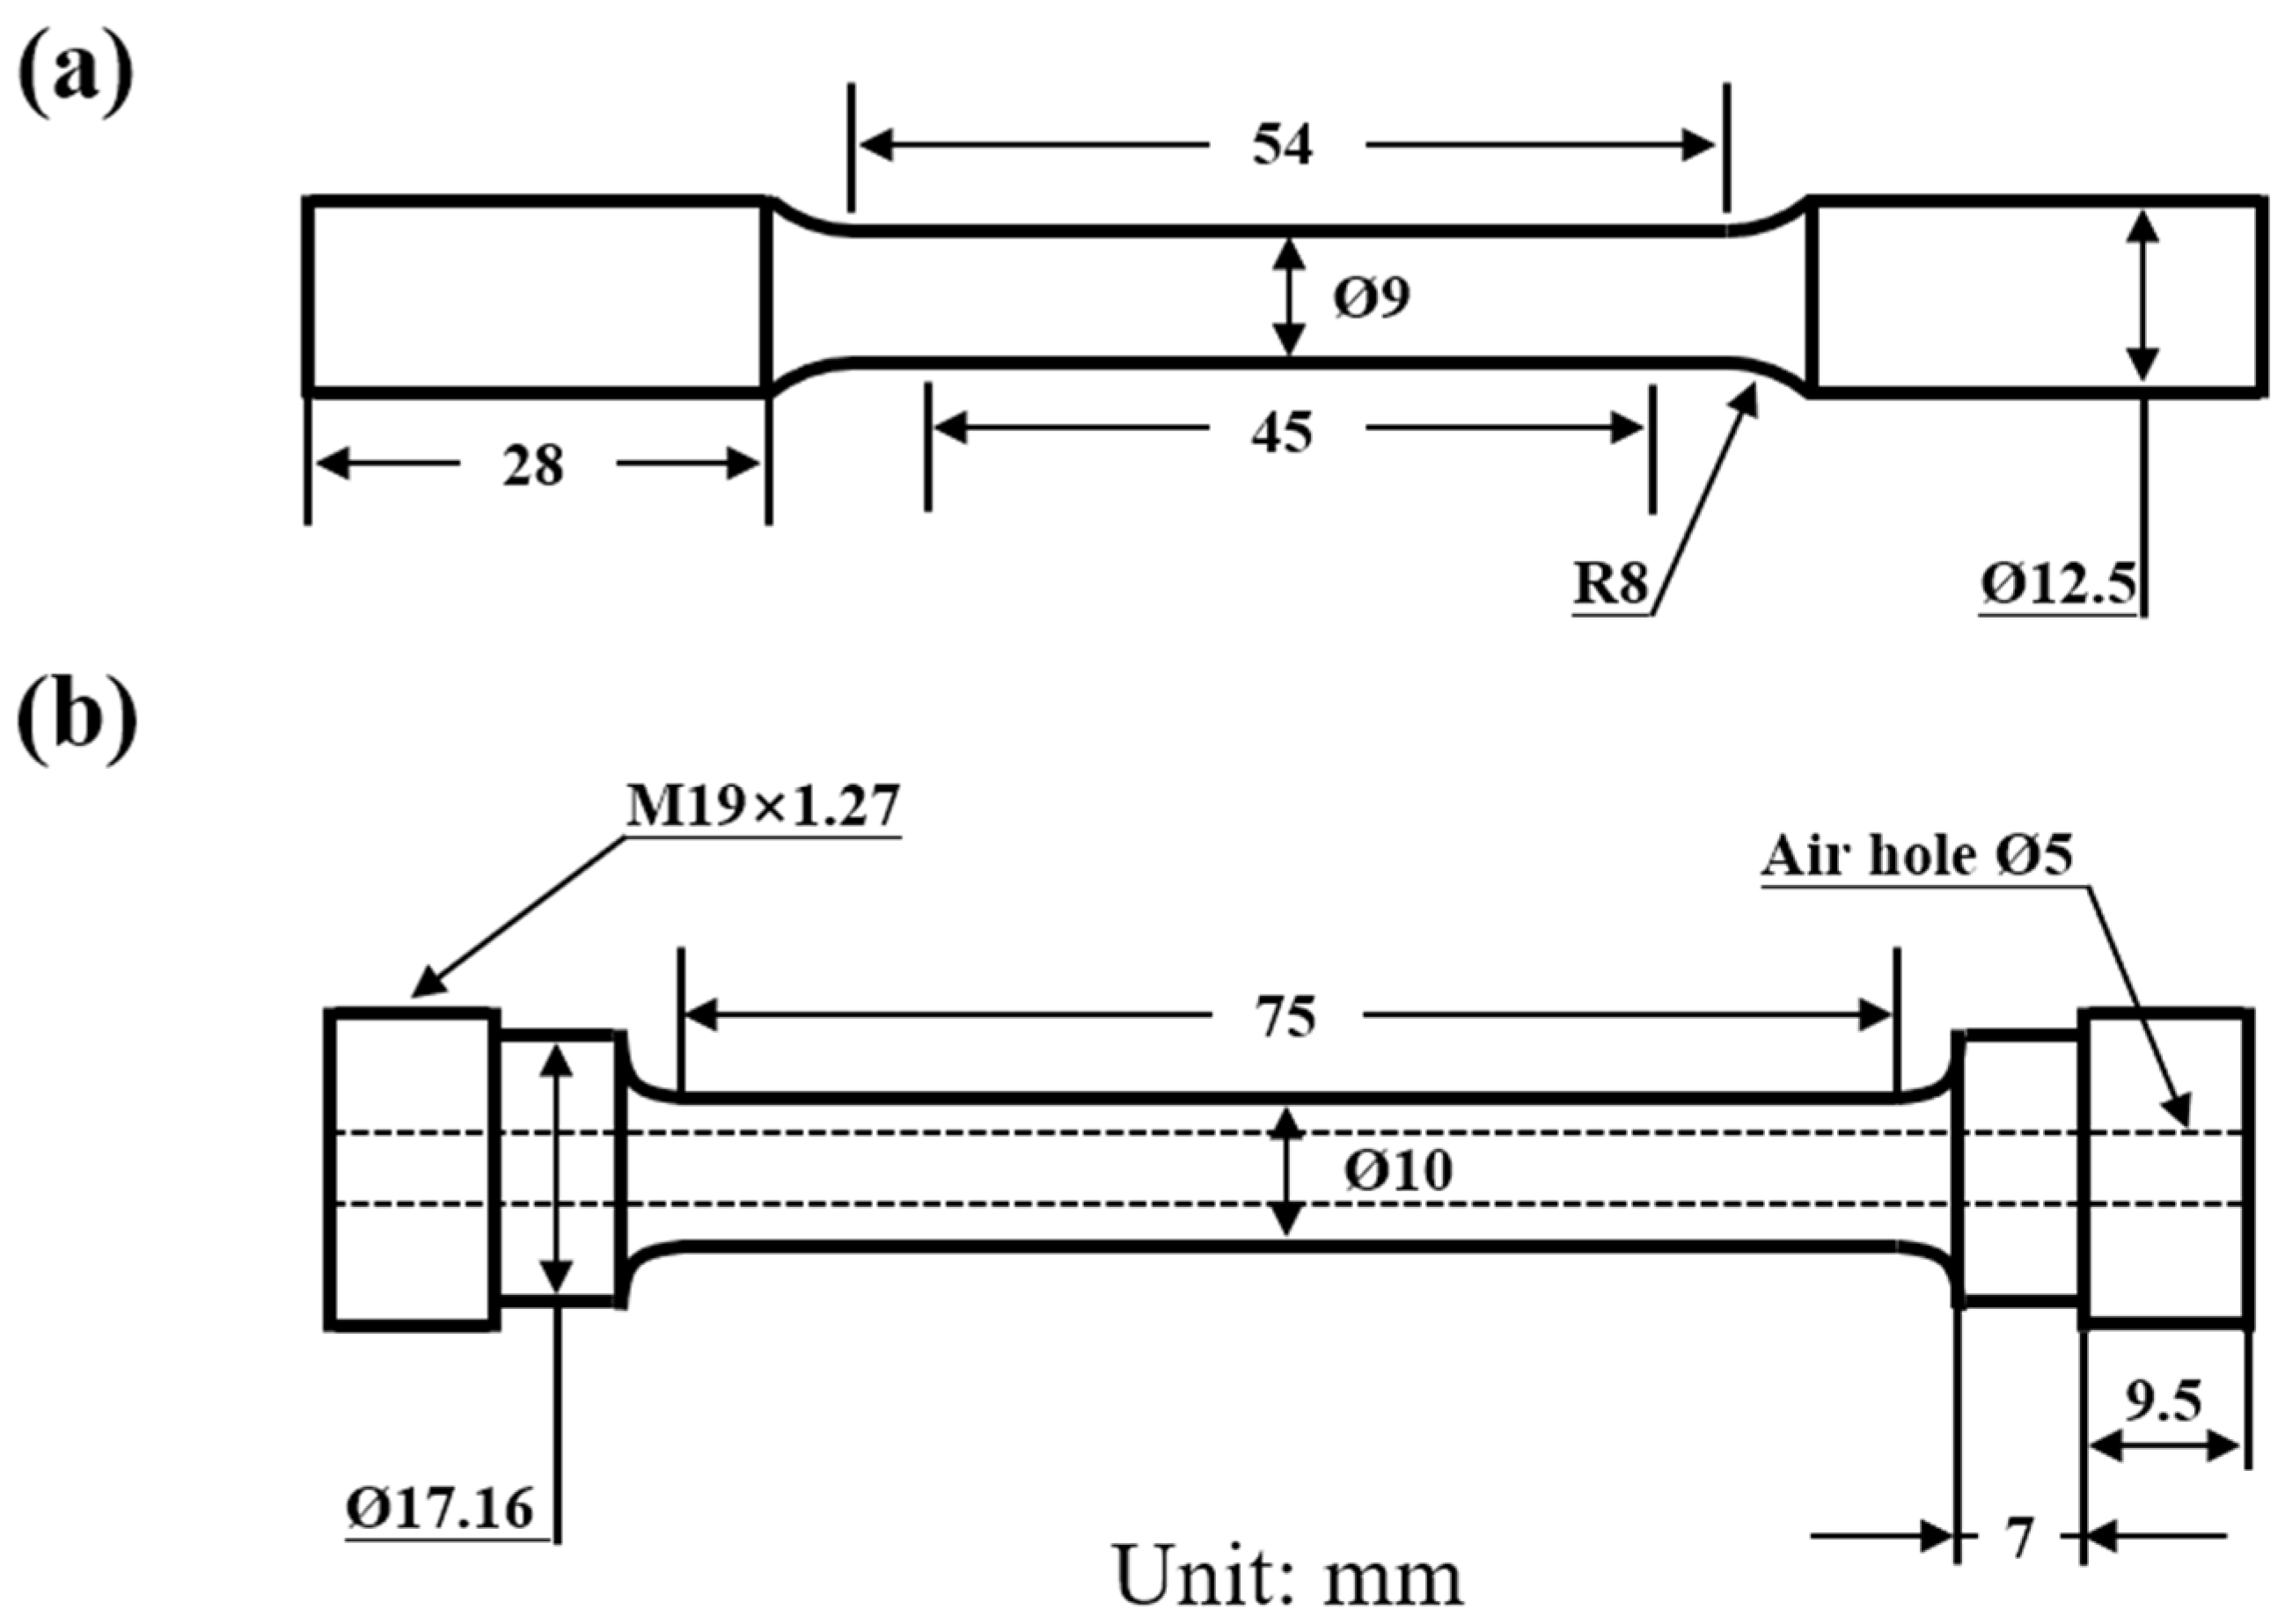
2. Materials and Methods

Two Al-Cu 224 alloys were prepared without or with minor additions of Zr, Ti, and V, and denoted as the “base” and “TEs” alloys, respectively. The materials were from the same batch as that in [13]. The alloys were melted in an electric resistance furnace and cast in a permanent wedge mold. Detailed casting procedures are available in [13]. Optical emission spectroscopy was performed to analyze the chemical compositions of the alloys, and results are listed in Table 1. Following casting, all the samples were subjected to the traditional T7 heat treatment, which involved a two-step solution treatment (495 °C/2 h + 528 °C/10 h) followed by aging at 200 °C for 4 h.
Tensile tests at both RT and 300 °C were performed on the T7-treated samples utilizing a 30 kN Instron machine, following the ASTM B557 [30] and ASTM E21 [31] standards to generate stress–strain curves. The strain rate was 1 × 10⁻³ s−1. The ultimate tensile strength (UTS), 0.2%-offset yield strength (YS), and elongation of the experimental alloys were determined according to ASTM B557 and ASTM E21 standards. The tensile samples were machined in accordance with the ASTM B557 standard, with a gauge length of 45 mm, as shown in Figure 1a. Tensile tests were repeated at least three times for each condition, and the average values of strength and elongation were taken for analysis.
The OP-TMF tests were conducted using a Gleeble 3800 thermomechanical simulator unit (Dynamic Systems Inc., Poestenkill, NY, USA) under a strain-controlled loading mode with the strain ratio of −1 which is the same setup, experimental procedure, and R ratio as in our previous study [32]. The mechanical strain, ε m e c h , was determined using the following equation:
ε t o t a l = ε t h e r m + ε m e c h
The thermal strain, ε t h e r m , as a function of the temperature was determined by performing approximately 10 thermal cycles at zero stress, using the same temperature–time cycle as in the TMF test. Cylindrical fatigue samples were machined, which conformed to the ASTM E606 [33] and ASTM E2368 [34] standards and featured a gauge section 75 mm in length and 10 mm in diameter (Figure 1b). TMF samples were heated using a Joule heating system and cooled using a compressed air jet through the air hole of the hollow tube machined in the center of the fatigue specimen, as shown in Figure 1b. Temperature control was achieved using thermocouples attached to the center of the gauge length. To conform to the relevant operational conditions for engine cylinder alloys, the maximum and minimum temperatures were set at 300 and 60 °C, respectively, with heating and cooling rates of 5 °C/s. During the tests, the target temperature was reliably achieved thanks to the precise temperature control capability of the Gleeble 3800 system [32]. The fatigue tests were performed under various mechanical strains, including 0.2%, 0.3%, 0.4%, 0.5%, and 0.6%. Each fatigue test was terminated when the stress amplitude during testing diminished to approximately 70% of its maximum value or when the fatigue lifetime reached 2000 cycles.
The microstructures of the alloys were characterized using optical microscopy (OM; Nikon Eclipse ME600, Nikon Instruments Inc., Melville, NY, USA), scanning electron microscopy (SEM; JEOL JSM-6480LV, JEOL USA Inc., Peabody, MA, USA), and TEM (JEOL JEM-2100, JEOL USA Inc., Peabody, MA, USA). The grain structure was revealed by etching the polished samples with Keller’s reagent and observing them using OM. Grain size was measured using the liner interception method, based on a minimum of 20 measurements at 50× magnification. SEM and SEM-EDS analyses were used to identify the intermetallic phases and characterize the post-fatigue fracture morphology. The area fraction of the intermetallic phases was quantified using ImageJ software (Version 1.54), analyzing 50 different images at a magnification of 200× for each condition. The distribution and evolution of the precipitates were observed using TEM. The sample preparations for microstructural characterization were traditional metallographic preparation methods and detailed in our previous work [12,13]. Parameters related to the precipitates, including their thickness, length, and number density, were quantified using ImageJ software. To ensure reliable statistical results, a minimum of 1000 precipitates were quantified for each condition, and the average values were determined following the methods established in previous studies [35,36]. For simplification, the θ″/θ′-Al2Cu precipitates are assumed to have a perfect disk shape. The thickness (tt) of the precipitates was determined directly from the quantified mean values, while the true diameter (dt), number density (Nv), and volume fraction (f) of precipitates were calculated using the equations below [35,36]:
d t = 2 l p t + 2 l p t 2 + π l p t π
N v = N p 1 + t + d t 2 A s A s t + d t
f = N ν π t 2 t t 4
where lp is the measured mean length, t is the foil thickness, Np is the number of precipitates along two explicit (001)Al directions in the quantified TEM images, and AS is the area of the TEM image.

3. Results and Discussion

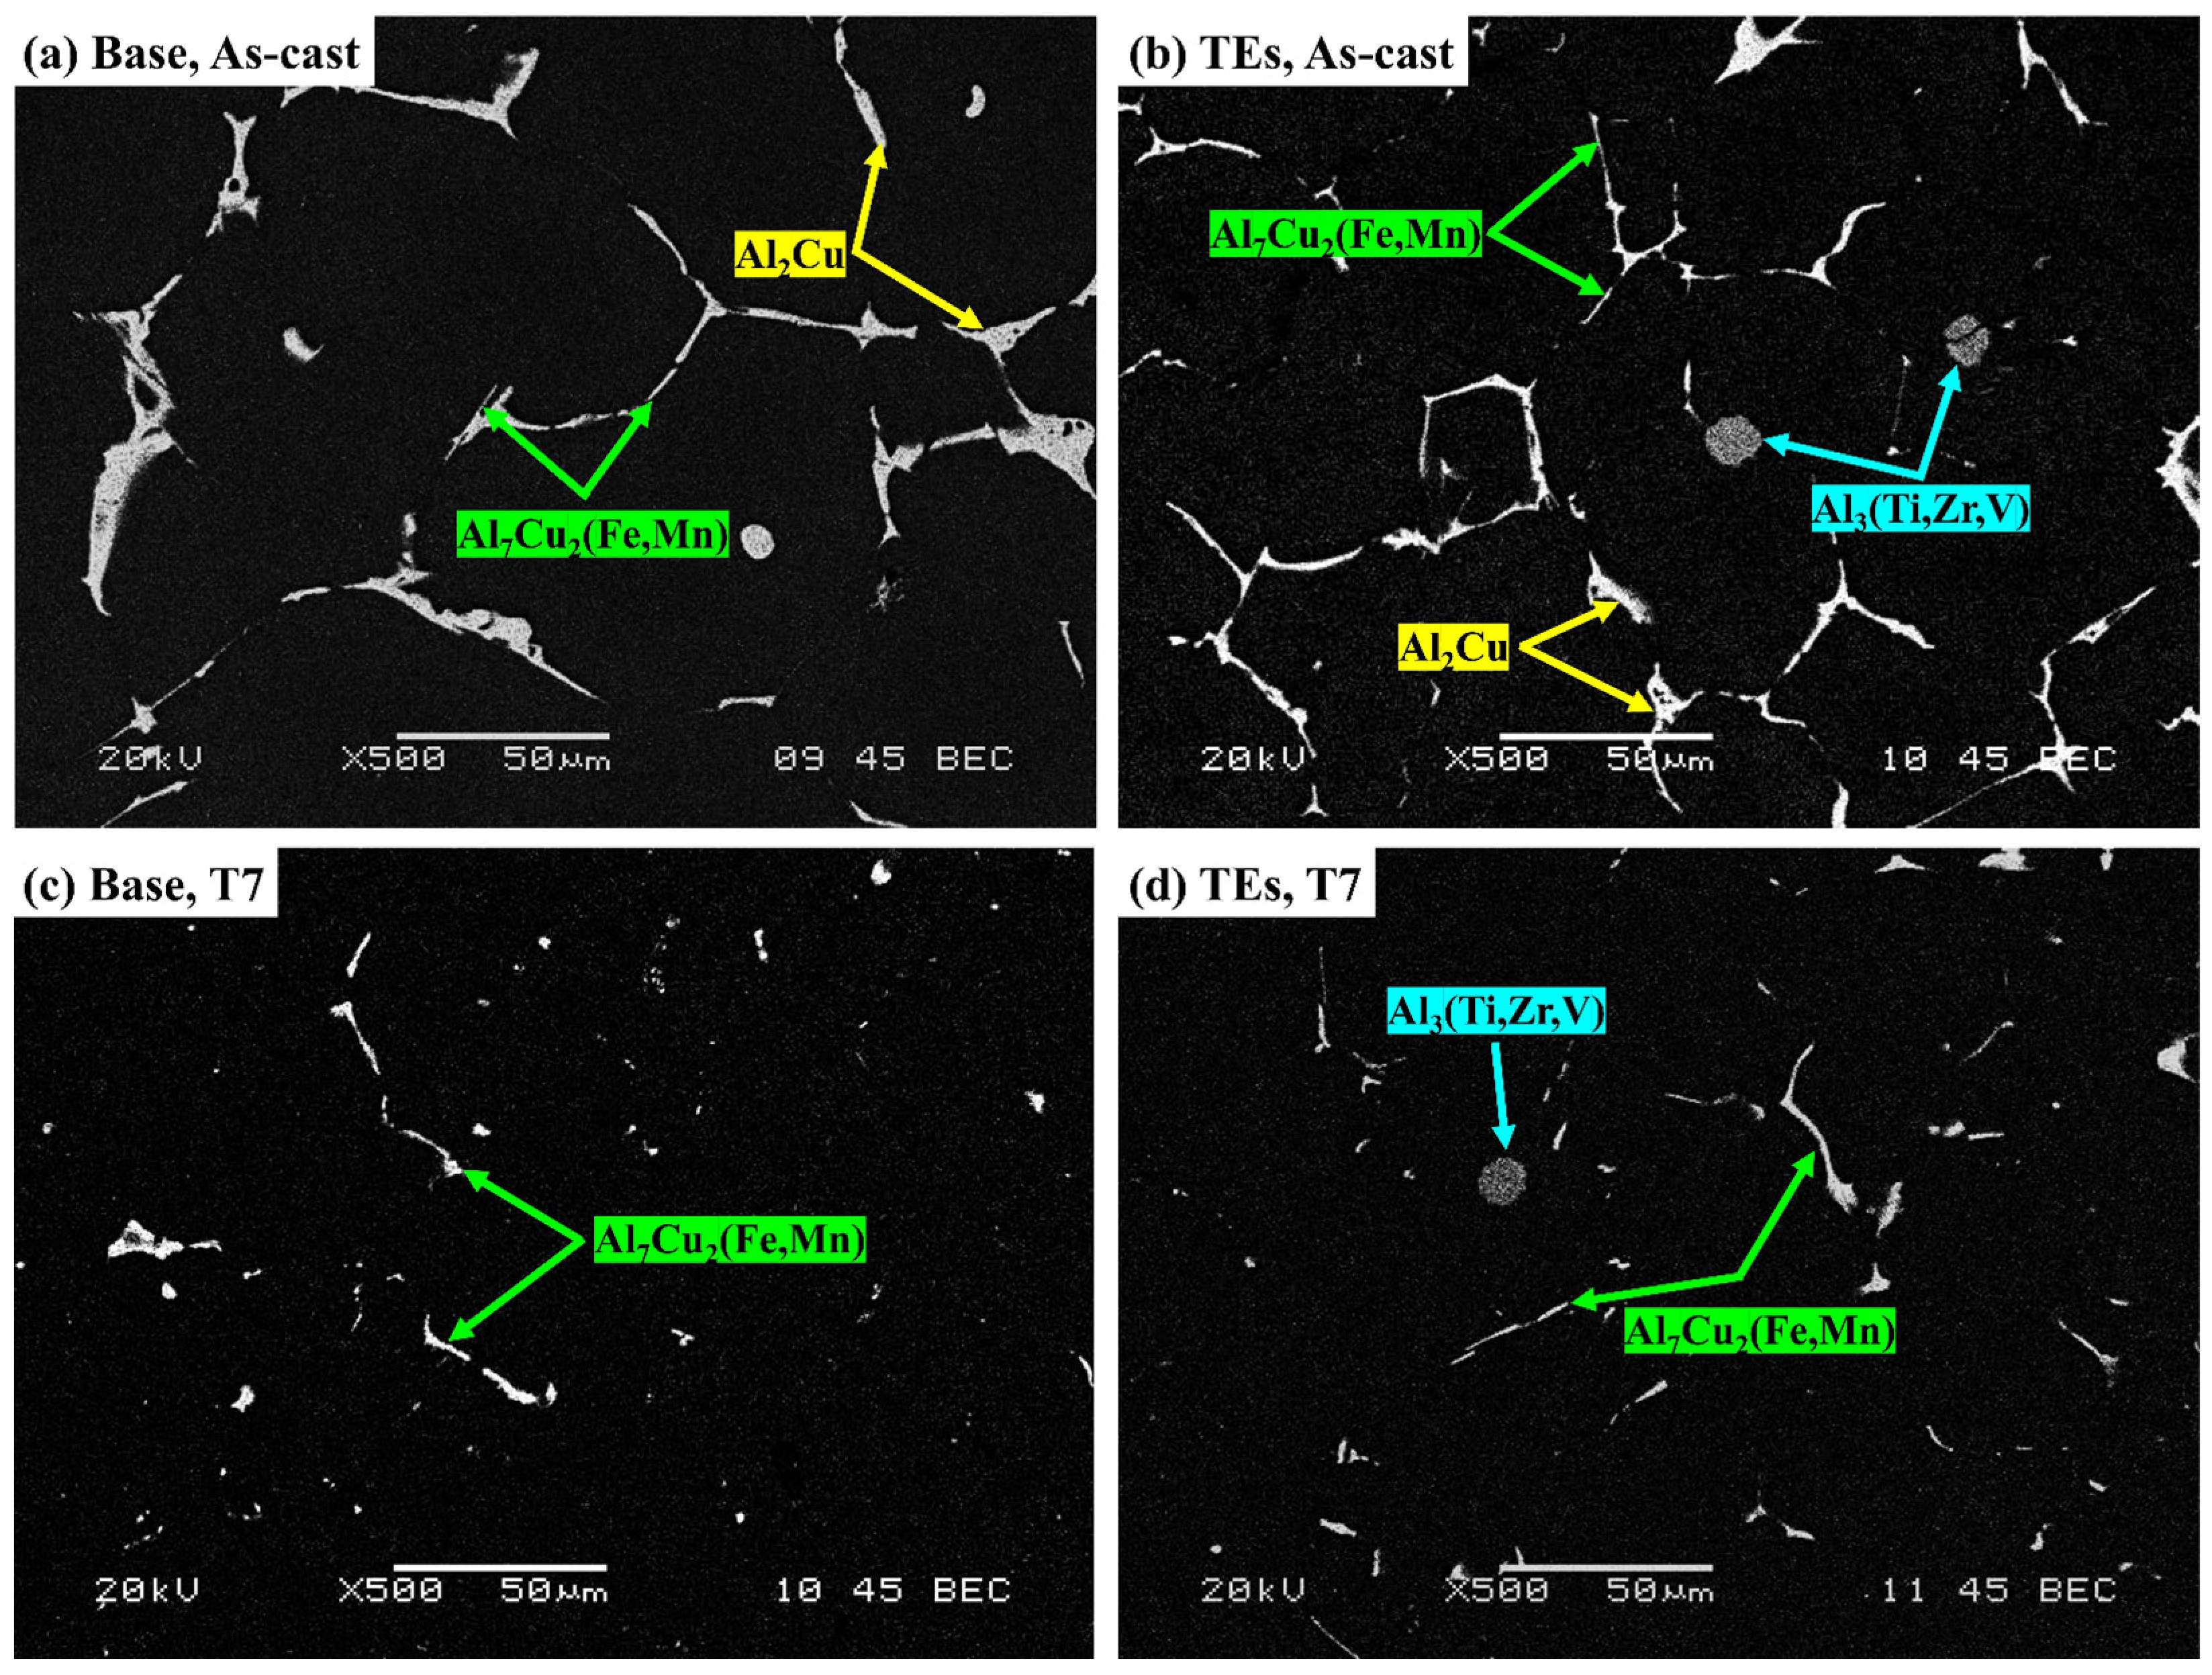
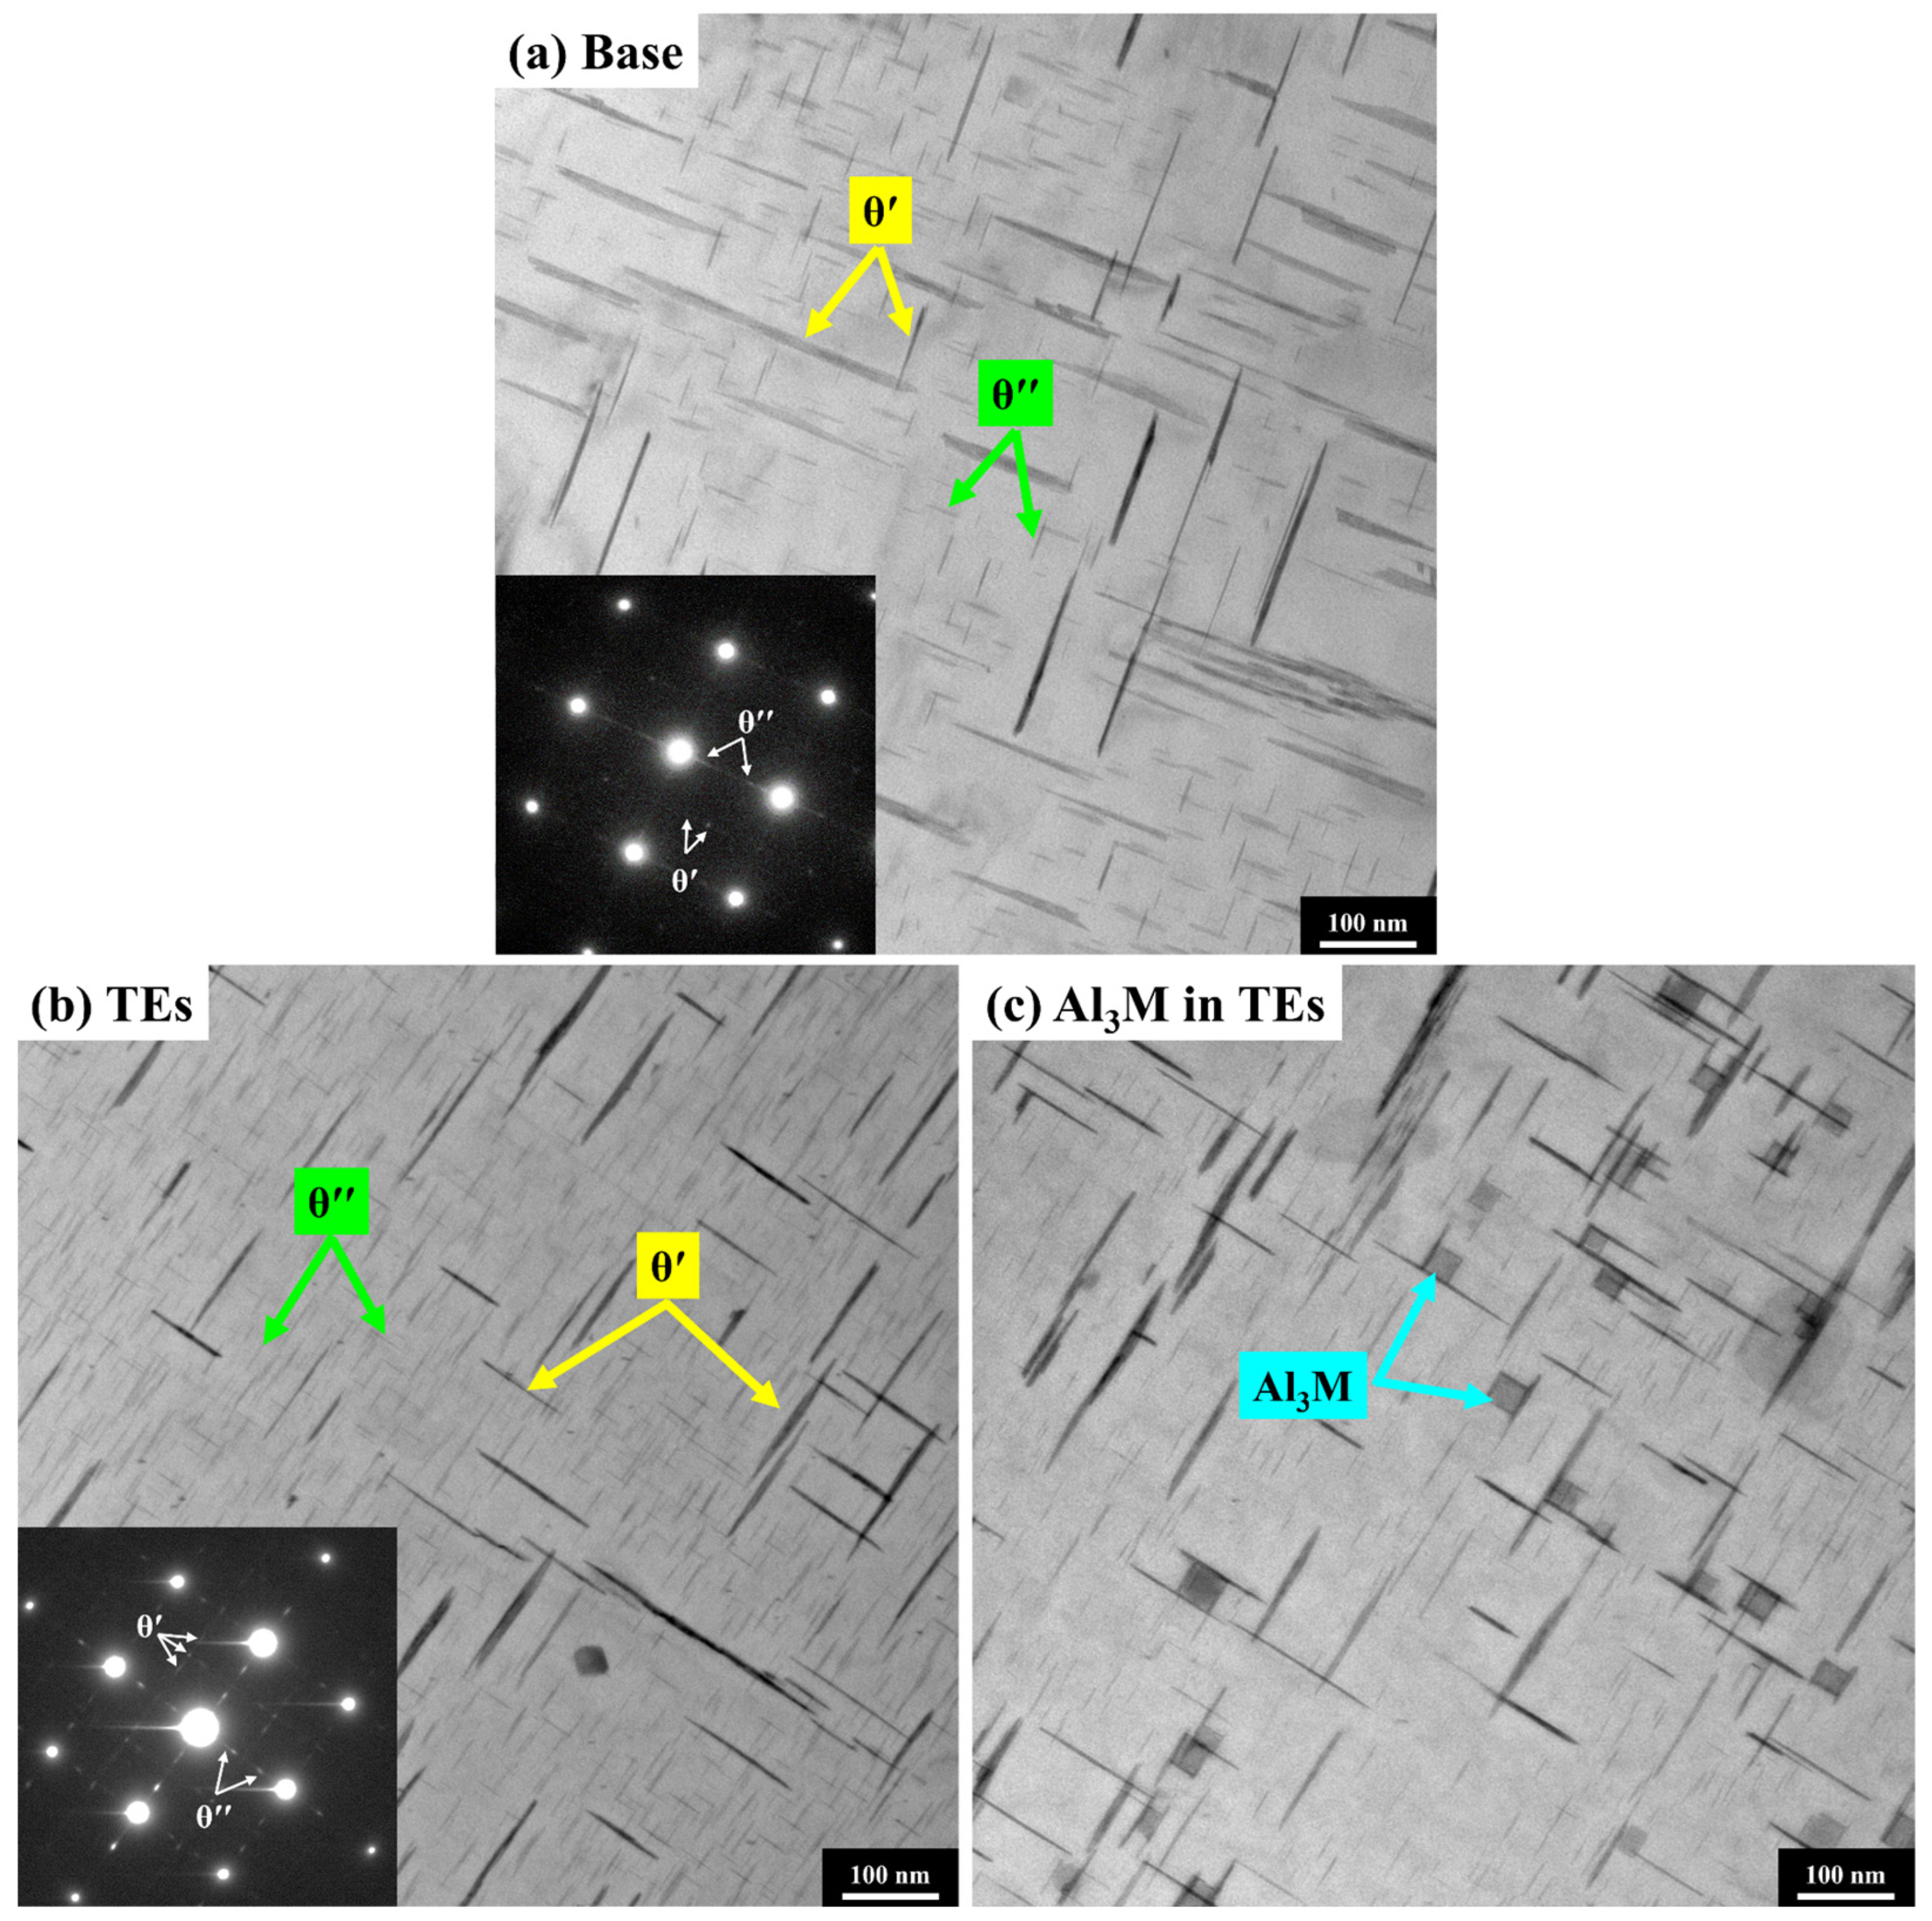
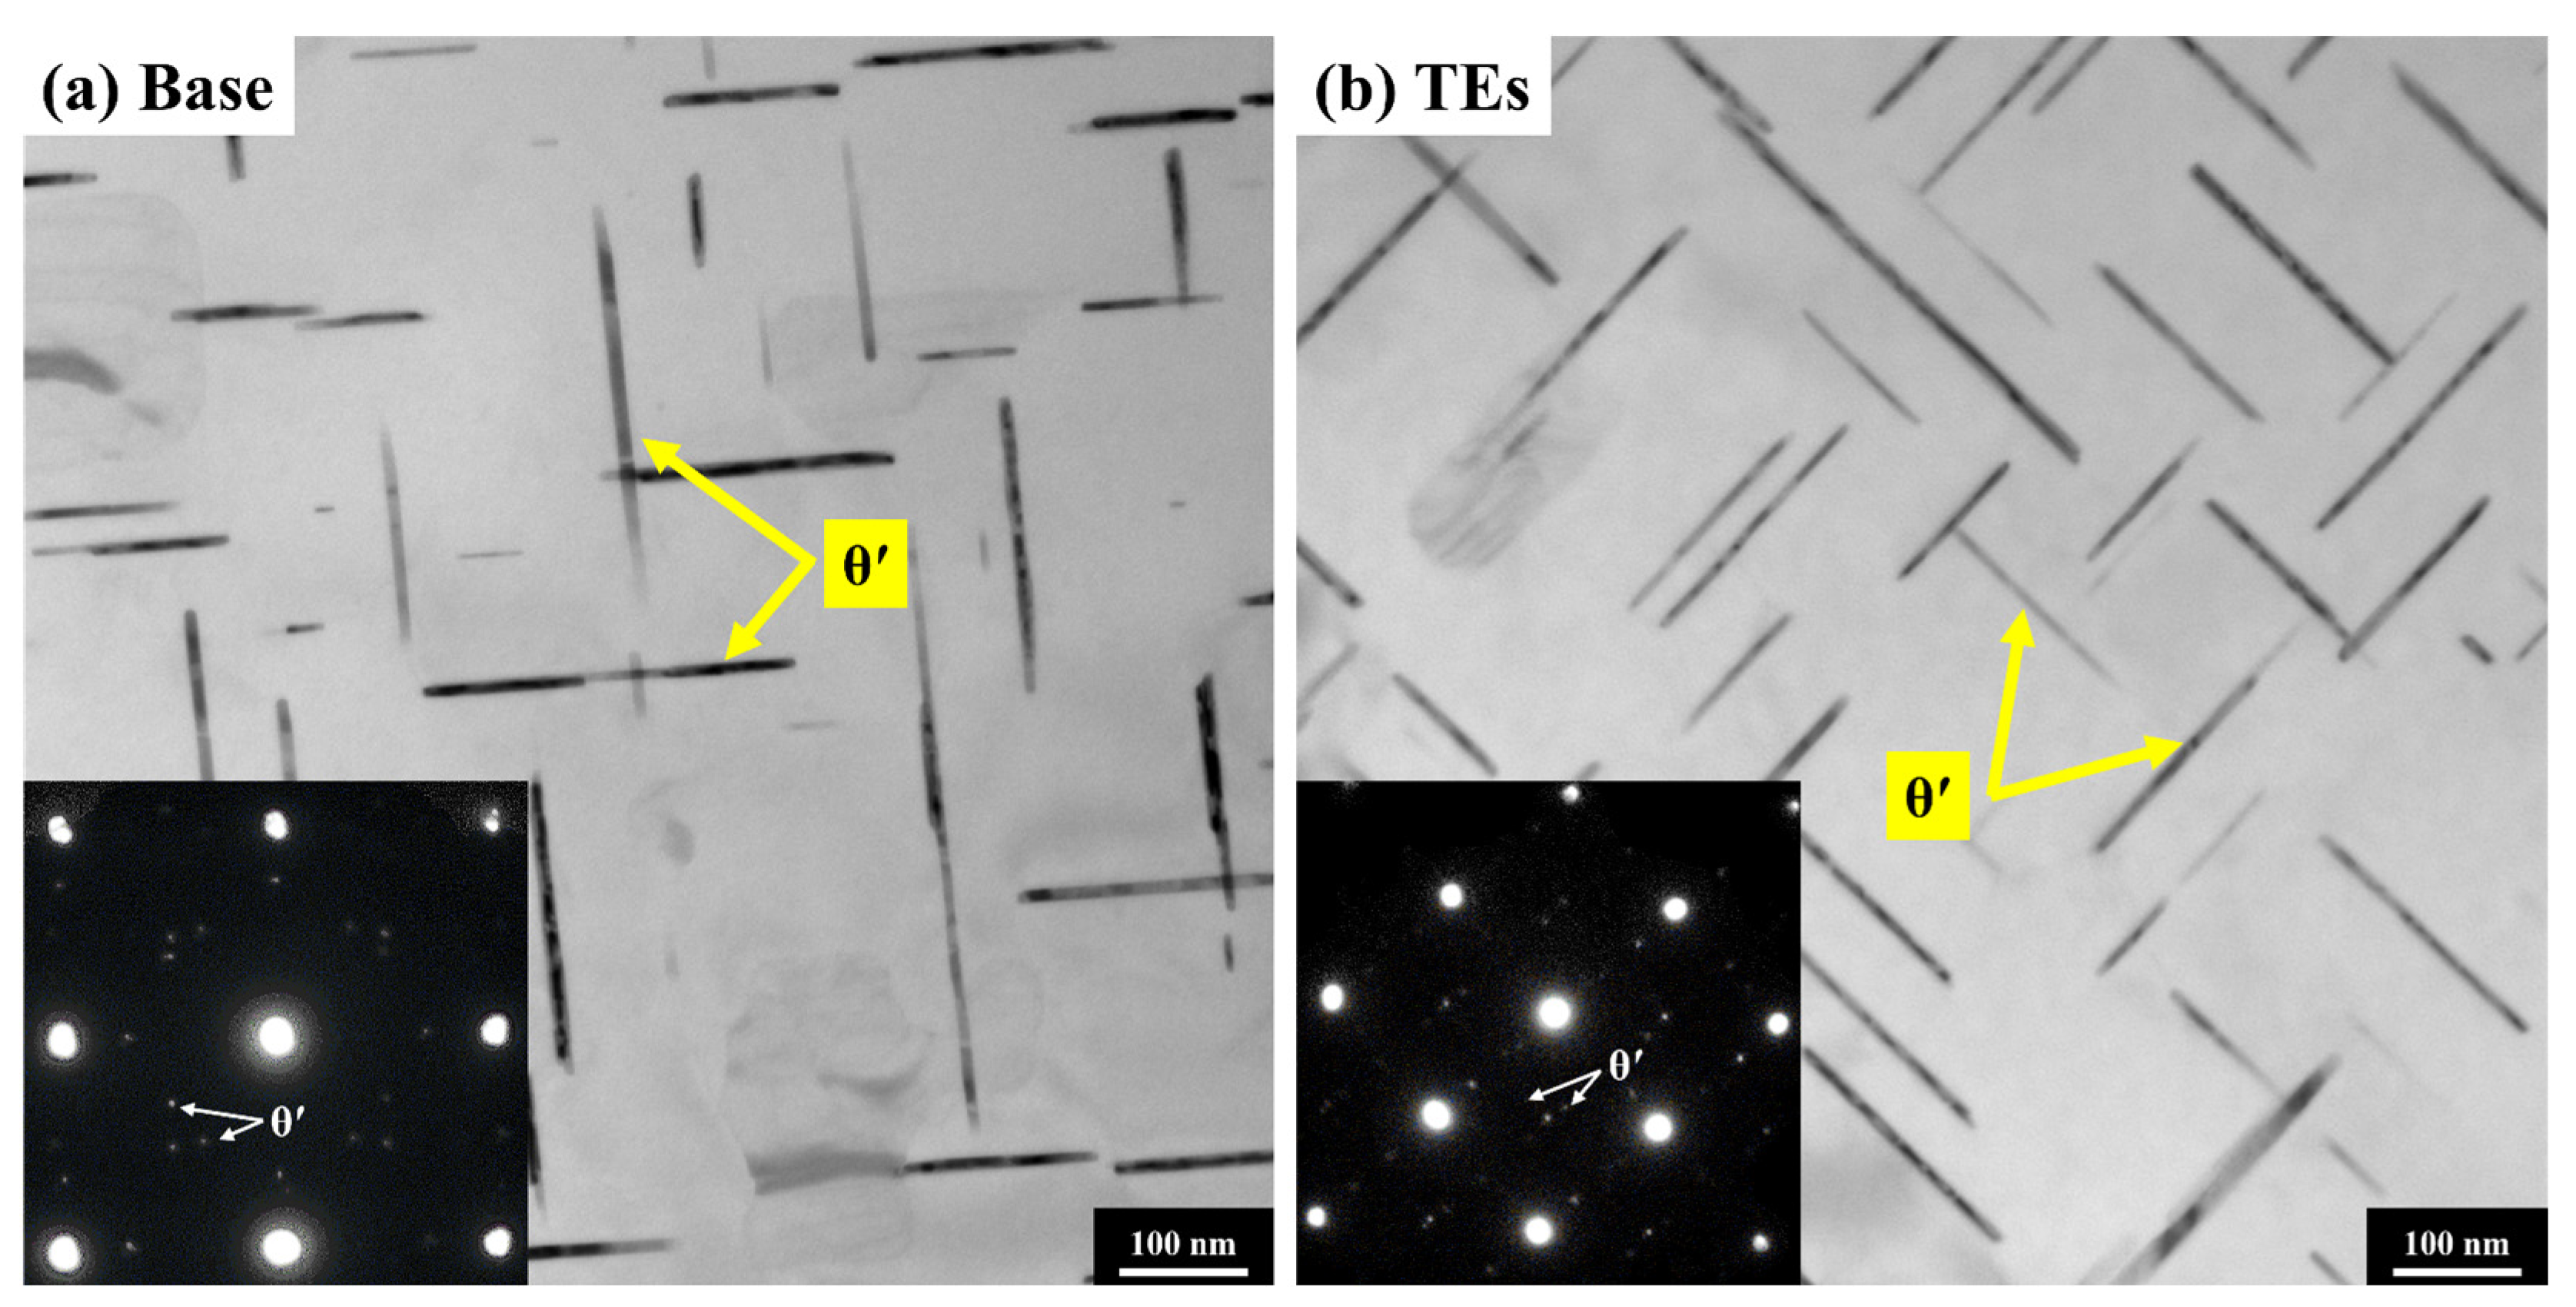
3.1. Microstructures in As-Cast and T7 States

Figure 2 shows the grain structures of the alloys in the as-cast state. The two alloys exhibited equiaxed grain structures. Quantitative analyses revealed average grain sizes of 99 ± 22 and 40 ± 4 μm in the base and TEs alloys, respectively. The grain refinement in the TEs alloy was attributed to the surplus addition of Ti, which can facilitate the heterogeneous nucleation of aluminum and act as an effective growth restrictor [37,38].
Figure 3 shows the typical microstructures in the as-cast and T7 states of the experimental alloys. In the as-cast condition, the alloys exhibited similar microstructures consisting of α-Al and two intermetallics of Al2Cu and Al7Cu2(Fe, Mn). Moreover, the introduction of the TEs led to the formation of a primary Al3(Ti, Zr, V) phase in the TEs alloy, as shown in Figure 3b. The intermetallic phases were identified by SEM-EDS analysis. The quantitative results revealed comparable Al7Cu2(Fe, Mn) contents with area fractions of 0.7% in both tested alloys. In the TEs alloy, the area fraction of Al3(Ti, Zr, V) was 0.2%. After the T7 heat treatment, the majority of the primary Al2Cu phase in both experimental alloys underwent dissolution in the α-Al matrix during the solution treatment. Meanwhile, the other intermetallic phases remained stable, with minimal alteration, maintaining area fractions of approximately 0.7% for Al7Cu2(Fe, Mn) and 0.2% for Al3(Ti, Zr, V), as shown in Figure 3c,d.
The precipitation microstructures of the tested alloys after the T7 heat treatment were investigated using TEM. Typical bright-field TEM images are presented in Figure 4. The characteristics of the precipitates were quantified and are summarized in Table 2. Two types of precipitates were observed in both tested alloys, θ″ and θ′, as indicated by the green and yellow arrows, respectively. The corresponding selected area diffraction (SAD) patterns of θ″ and θ′ are also shown in the inset of Figure 4. The stoichiometric formulas for θ″ and θ′ are Al3Cu and Al2Cu [39], respectively. Hence, θ′ particles exhibited a darker appearance in bright-field TEM images as a result of their higher copper content compared to θ″ particles, as indicated in Figure 4a,b. The tested alloys contained θ″ particles with similar sizes, measuring approximately 32 nm in length and 3 nm in thickness. However, a substantially higher number density was observed for the θ″ in the TEs alloy (7.6 × 10⁻⁶ nm−3) compared to that in the base alloy (3.1 × 10⁻⁶ nm−3). The addition of TEs, with their low diffusivities and high vacancy binding energies [40], decelerated the transformation process of θ″ to θ′, resulting in a higher volume of θ″ in the TEs alloy. The introduction of TEs affected the distribution of the θ′ precipitates in the two following different ways: (1) the transformation of θ″ to θ′ was decelerated by the sluggish effect of the TEs, which resulted in a lower number density for the θ′ [40]; (2) the addition of TEs promoted the formation of Al3M (M = Ti, Zr, V) dispersoids (as indicated by the cyan arrows in Figure 4c), which acted as additional nucleation sites for θ′ and promoted its precipitation [41]. Owing to the uneven distribution and low number density of Al3M, these were not considered primary contributors to strengthening and were thus not quantified in this study. Moreover, the introduced TEs could segregate at the interfaces between α-Al and θ′, which enhanced the thermal stability of θ′ [13,14]. This segregation also contributed to a finer and denser distribution of θ′. Under the combined influences of the TEs, the TEs alloy exhibited a slightly higher number density for θ′ (~2.9 × 10⁻⁷ nm−3), comparable to that of the base alloy (~2.5 × 10⁻⁷ nm−3). However, the average size of the θ′ in the TEs alloy was significantly smaller, particularly in terms of its length, which had an average length of 103 nm in the TEs alloy compared to 160 nm in the base alloy. Consequently, despite the similar number density, the finer size of the θ′ led to a lower volume fraction of θ′ in the TEs alloy.

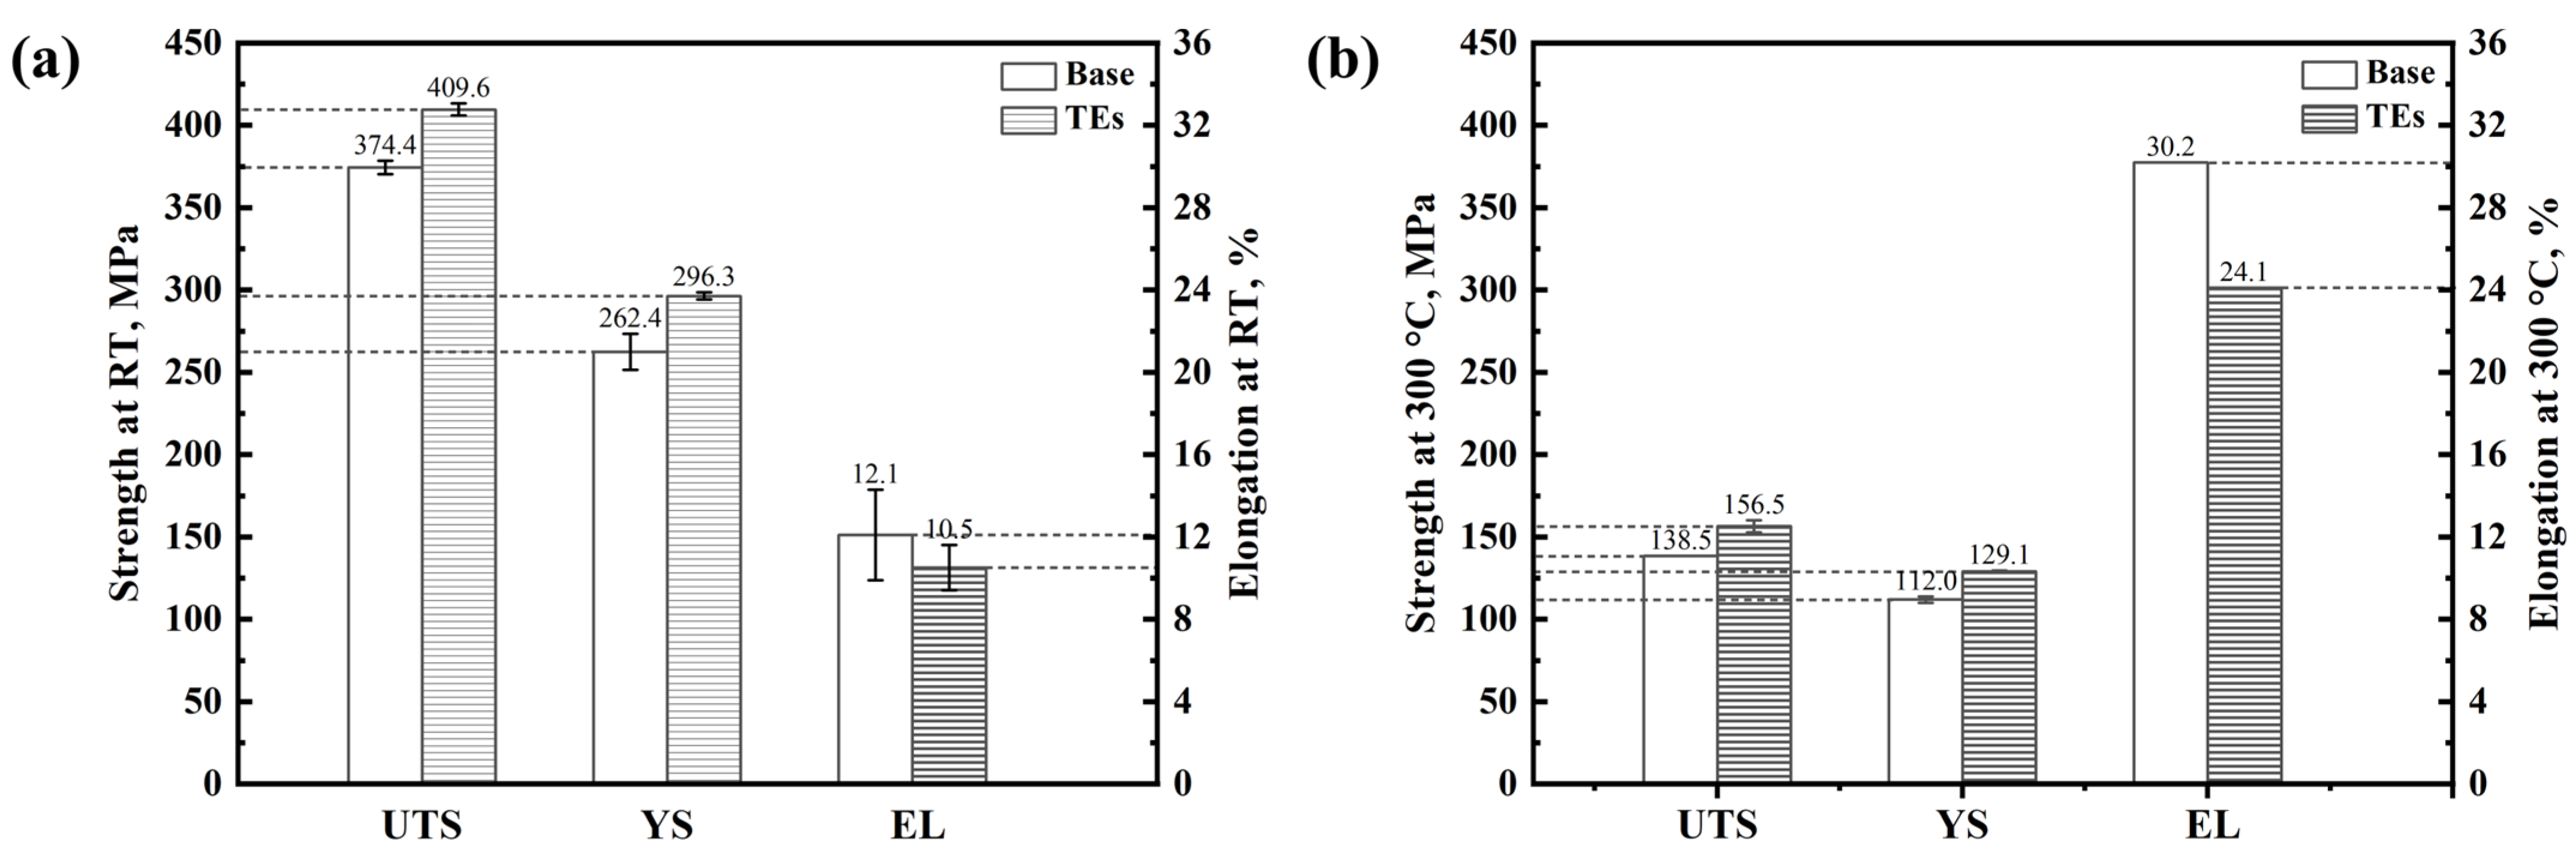
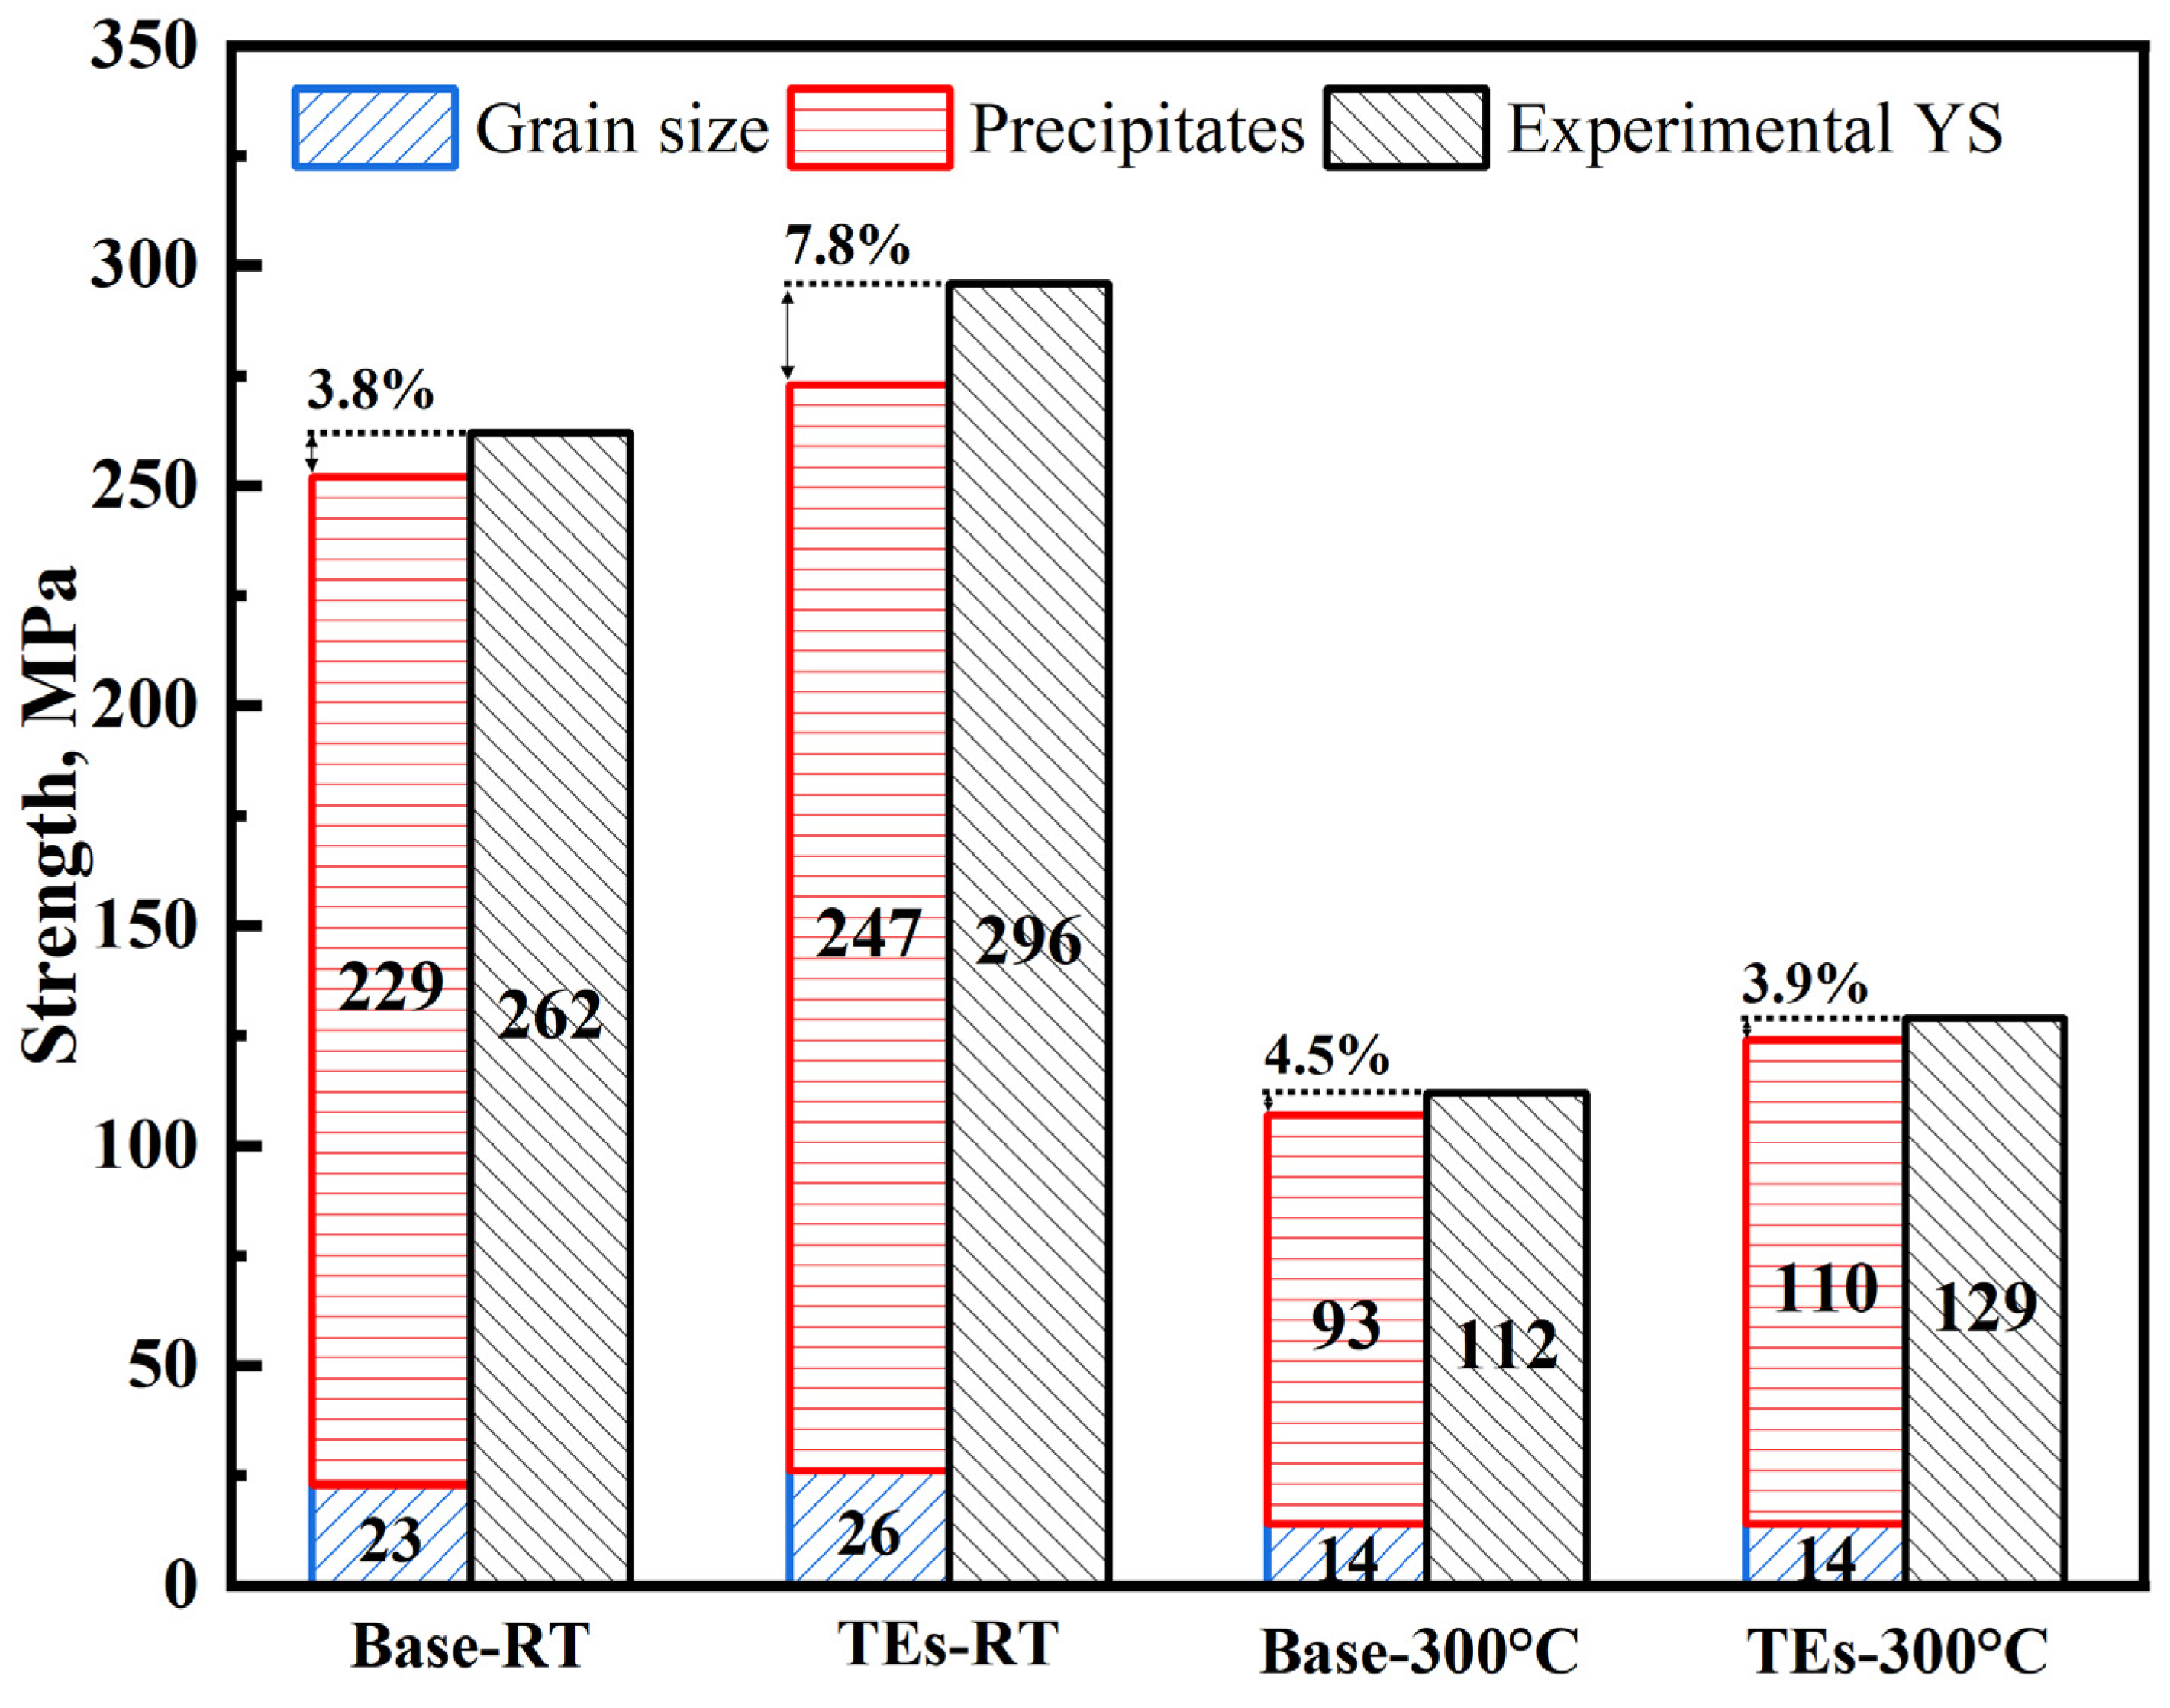
3.2. Mechanical Properties Under Both RT and 300 °C

The tensile properties of the T7-treated alloys at both RT and 300 °C are shown in Figure 5. The introduction of TEs resulted in an increase in tensile strength at both RT and 300 °C. At RT, the UTS and YS increased from 374 and 262 MPa in the base alloy to 410 and 296 MPa in the TEs alloy, respectively. However, the improvement in strength was accompanied by a reduction in elongation, with the value dropping from 12.1% in the base alloy to 10.5% in the TEs alloy (Figure 5a). When the test temperature increased to 300 °C, the two alloys showed significant decreases in both UTS and YS (see Figure 5b), owing to the softening of the Al matrix and coarsening of the precipitates. In the TEs alloy, the UTS and YS decreased from 410 and 296 MPa at RT to 157 and 129 MPa at 300 °C, respectively, but these values were still higher than the values of 139 and 112 MPa found for the base alloy, respectively. Conversely, the elongation of both tested alloys significantly improved at 300 °C, exceeding 20%.
When the test temperature increased to 300 °C, the θ″ and θ′ precipitates were both coarsened and transferred during the testing. Therefore, the sizes and distributions of the precipitates of the two alloys after tensile tests at 300 °C were investigated using TEM, and the results are shown in Figure 6. Their values are summarized in Table 3. After tensile tests at 300 °C, no θ″ precipitates were observed in either alloy, indicating that the θ″ phase had either dissolved in the Al matrix or transformed into θ′ during heating and testing. The predominant precipitates in both alloys were θ′, as confirmed by the SAD patterns (see the insets of Figure 6). Additionally, the θ′ precipitates underwent coarsening during testing in both alloys. In the TEs alloy, the length and thickness of θ′ increased from 103 and 5 nm in the T7 state to 170 and 11 nm after testing, respectively, while the number density decreased from 2.9 × 10⁻⁷ to 1.6 × 10⁻⁷ nm−3. This coarsening of precipitates was one of the key factors in the significant strength reduction at 300 °C, as shown in Figure 5b. Compared to the base alloy, the TEs alloy displayed a finer and denser distribution of θ′ precipitates after testing at 300 °C, indicating that the TEs enhanced the thermal stability [7,9,14], which in turn led to a higher tensile strength at elevated temperature.
To better understand the impact of the TE additions on the mechanical performance of Al-Cu alloys, the correlation between the microstructure characteristics and strength was explored at both RT and 300 °C. In the T7-treated Al-Cu alloys, most supersaturated solute Cu atoms were precipitated out from the matrix to form θ″ and θ′ during aging. Owing to the marginal solid solubility of Cu and other alloying elements (Mn and Mg) after aging, the solid solution strengthening was insignificant. Therefore, the precipitates made the primary contributions to the strengths of the T7-treated Al-Cu alloys. In the current study, the predominant precipitates in the T7 state were θ″ and θ′, and their contributions to the strength can be estimated using the following equations [11,36,42]:
σ p p t = M τ θ 1.4 + τ θ 1.4 1.4
τ θ = 4.1 G ε 3 / 2 f d t 2 b 0.5
τ θ = G b 2 π 1 ν 1 1.23 1.03 N v d t π d t 8 1.061 t t ln 0.981 d t t t b
In addition to precipitation strengthening, grain boundaries can also make a supplementary contribution to the YS. The increase in strength provided by the grain boundaries can be calculated using the Hall–Petch equation [42,43], as expressed below:
σ g b = σ i + k i d m  
All of the symbols, constants, and their corresponding values in the above equations are listed in Table 4. Here, σ g b includes the strengthening of an Al matrix with a corresponding grain size.
After assessing the strength contributions from both the precipitates and grain boundaries, the total theoretical YS at RT, σtotal, can be calculated as follows:
σ t o t a l = σ p p t + σ g b
Notably, a few adjustments were made for the calculations at 300 °C. First, the σgb value at 300 °C was assumed to be 14 MPa, based on the YS of AA1100-O at 315 °C, because of the lack of specific data for the σi and ki values of Al at 300 °C [17]. Additionally, the value of shear modulus G was adjusted from 28 to 21.2 GPa to calculate the σppt value at 300 °C [17]. Moreover, the characteristics of the precipitates after the tensile tests (Table 2 and Table 3) were used when calculating the theoretical strengths at both RT and 300 °C.
The theoretical YS values at both RT and 300 °C, along with the experimental data, are shown in Figure 7. At RT, the theoretical YS values of the base and TEs alloys were 252 and 273 MPa, respectively. Notably, the precipitates made the primary contributions to the strengths of both alloys, with the strengths provided by the precipitates being almost 10 times higher than that of the Al matrix with a corresponding grain size (grain boundary strengthening). The refined grain size contributed to the slightly higher strength (26 MPa) of the TEs alloy compared to that of the base alloy (23 MPa), although this difference was marginal. The deviations between the calculated and experimental YS values were 3.8% and 7.8% for the base and TEs alloys, respectively, indicating a good agreement between the theoretical calculations and experimental values. However, the TEs alloy displayed a higher deviation than the base alloy. This difference may be attributed to neglecting the strength contribution provided by the uneven distribution of Al3M precipitates in the TEs alloy (Figure 4c). When the temperature was increased to 300 °C, the theoretical strengths also showed good agreement with the experimental data, with deviations of 4.5% and 3.9% for the base and TEs alloys, respectively. Compared to the RT values, the contributions from the precipitates decreased significantly from 229 and 247 MPa to 93 and 110 MPa in the base and TEs alloys, respectively. This was a result of the dissolution and transformation of θ″ and coarsening of θ′, as confirmed by Figure 6 and Table 3. Because of the higher thermal stability of the θ′ phase in the TEs alloy, the contribution of the precipitates to the strength was higher than that in the base alloy, leading to a higher YS at 300 °C.

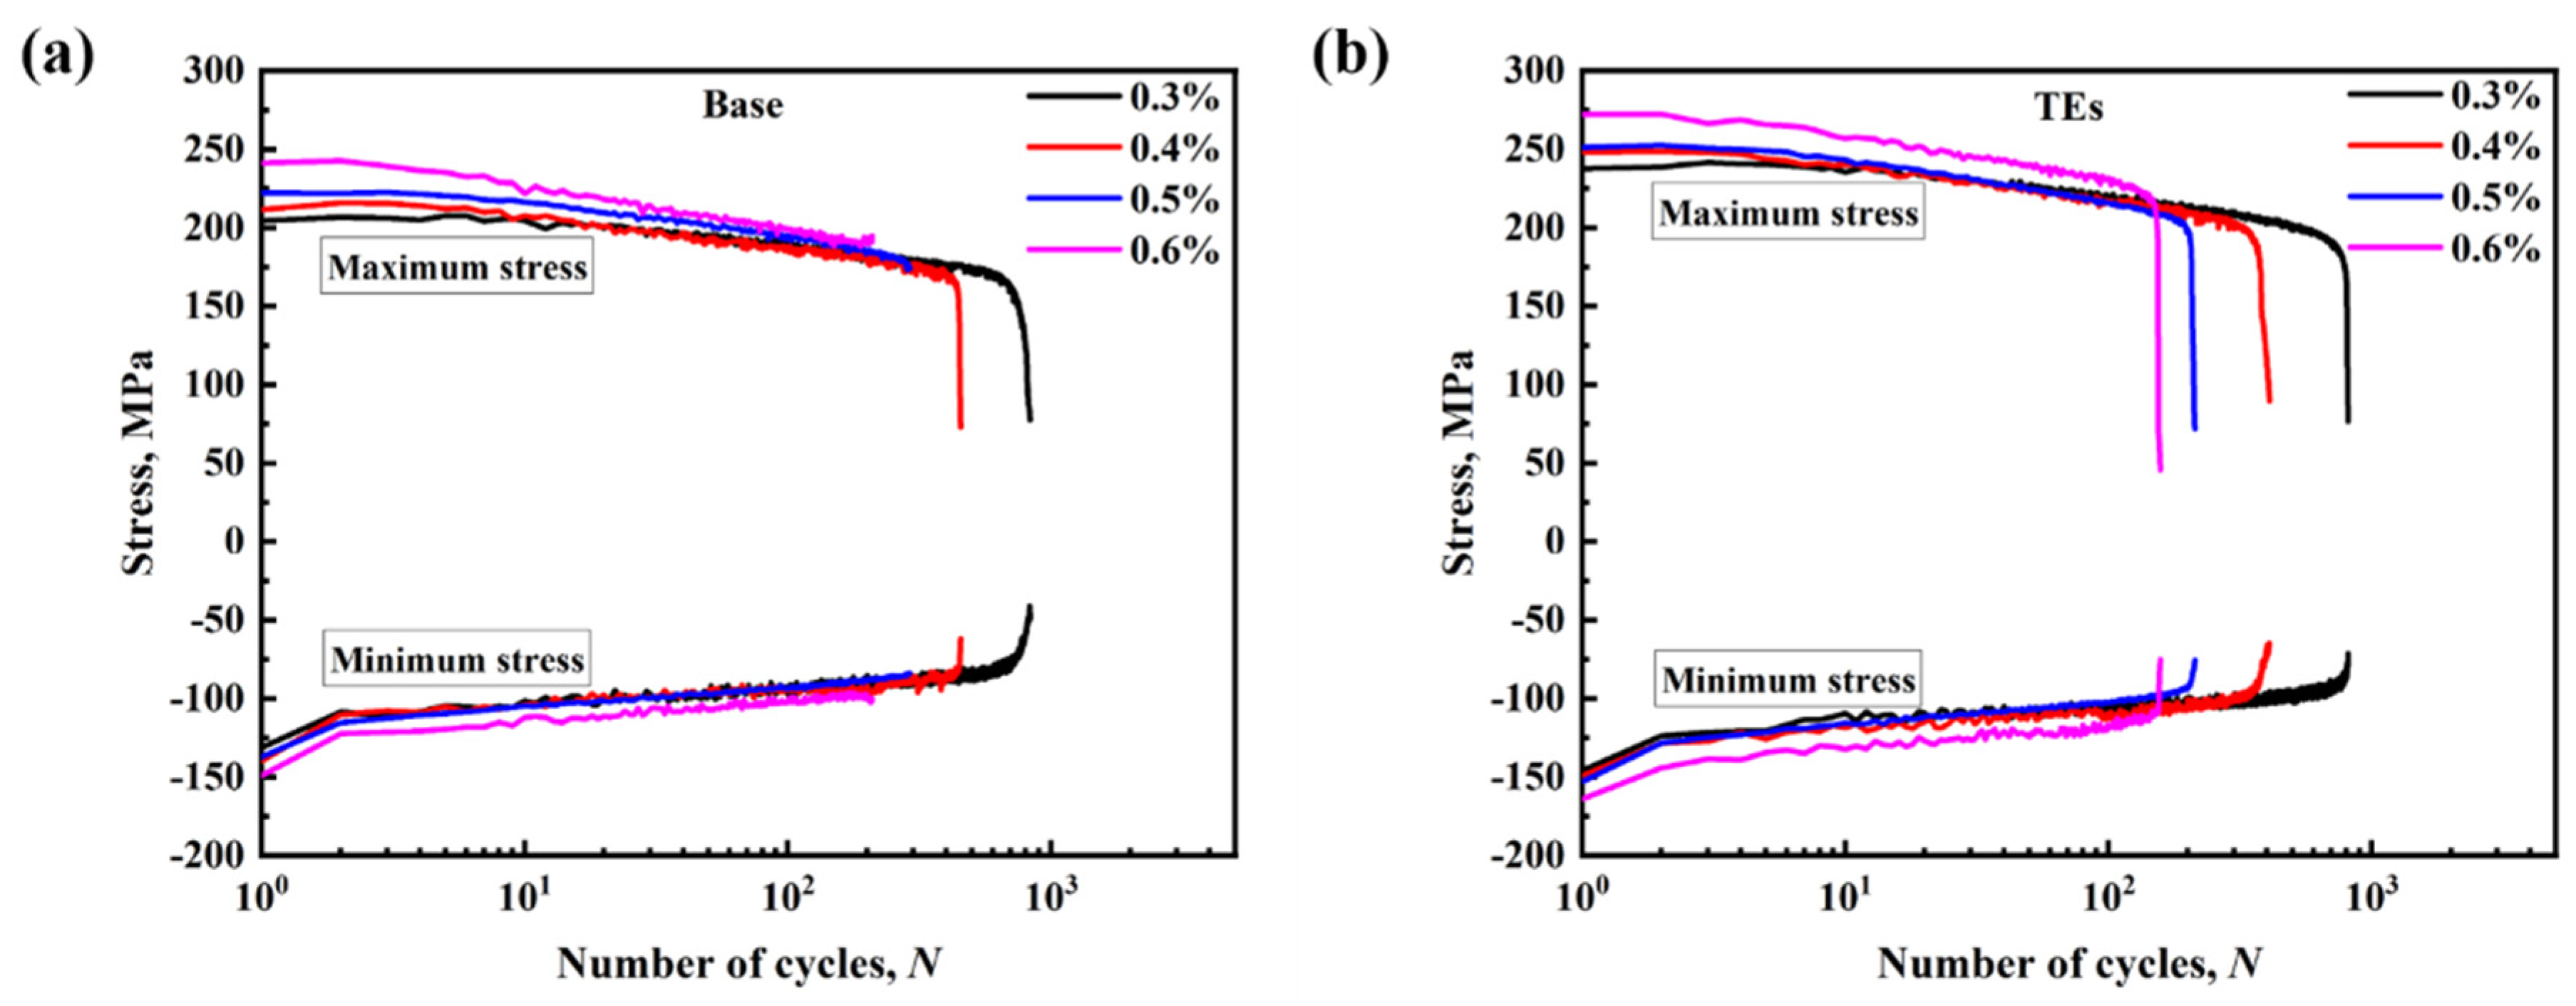
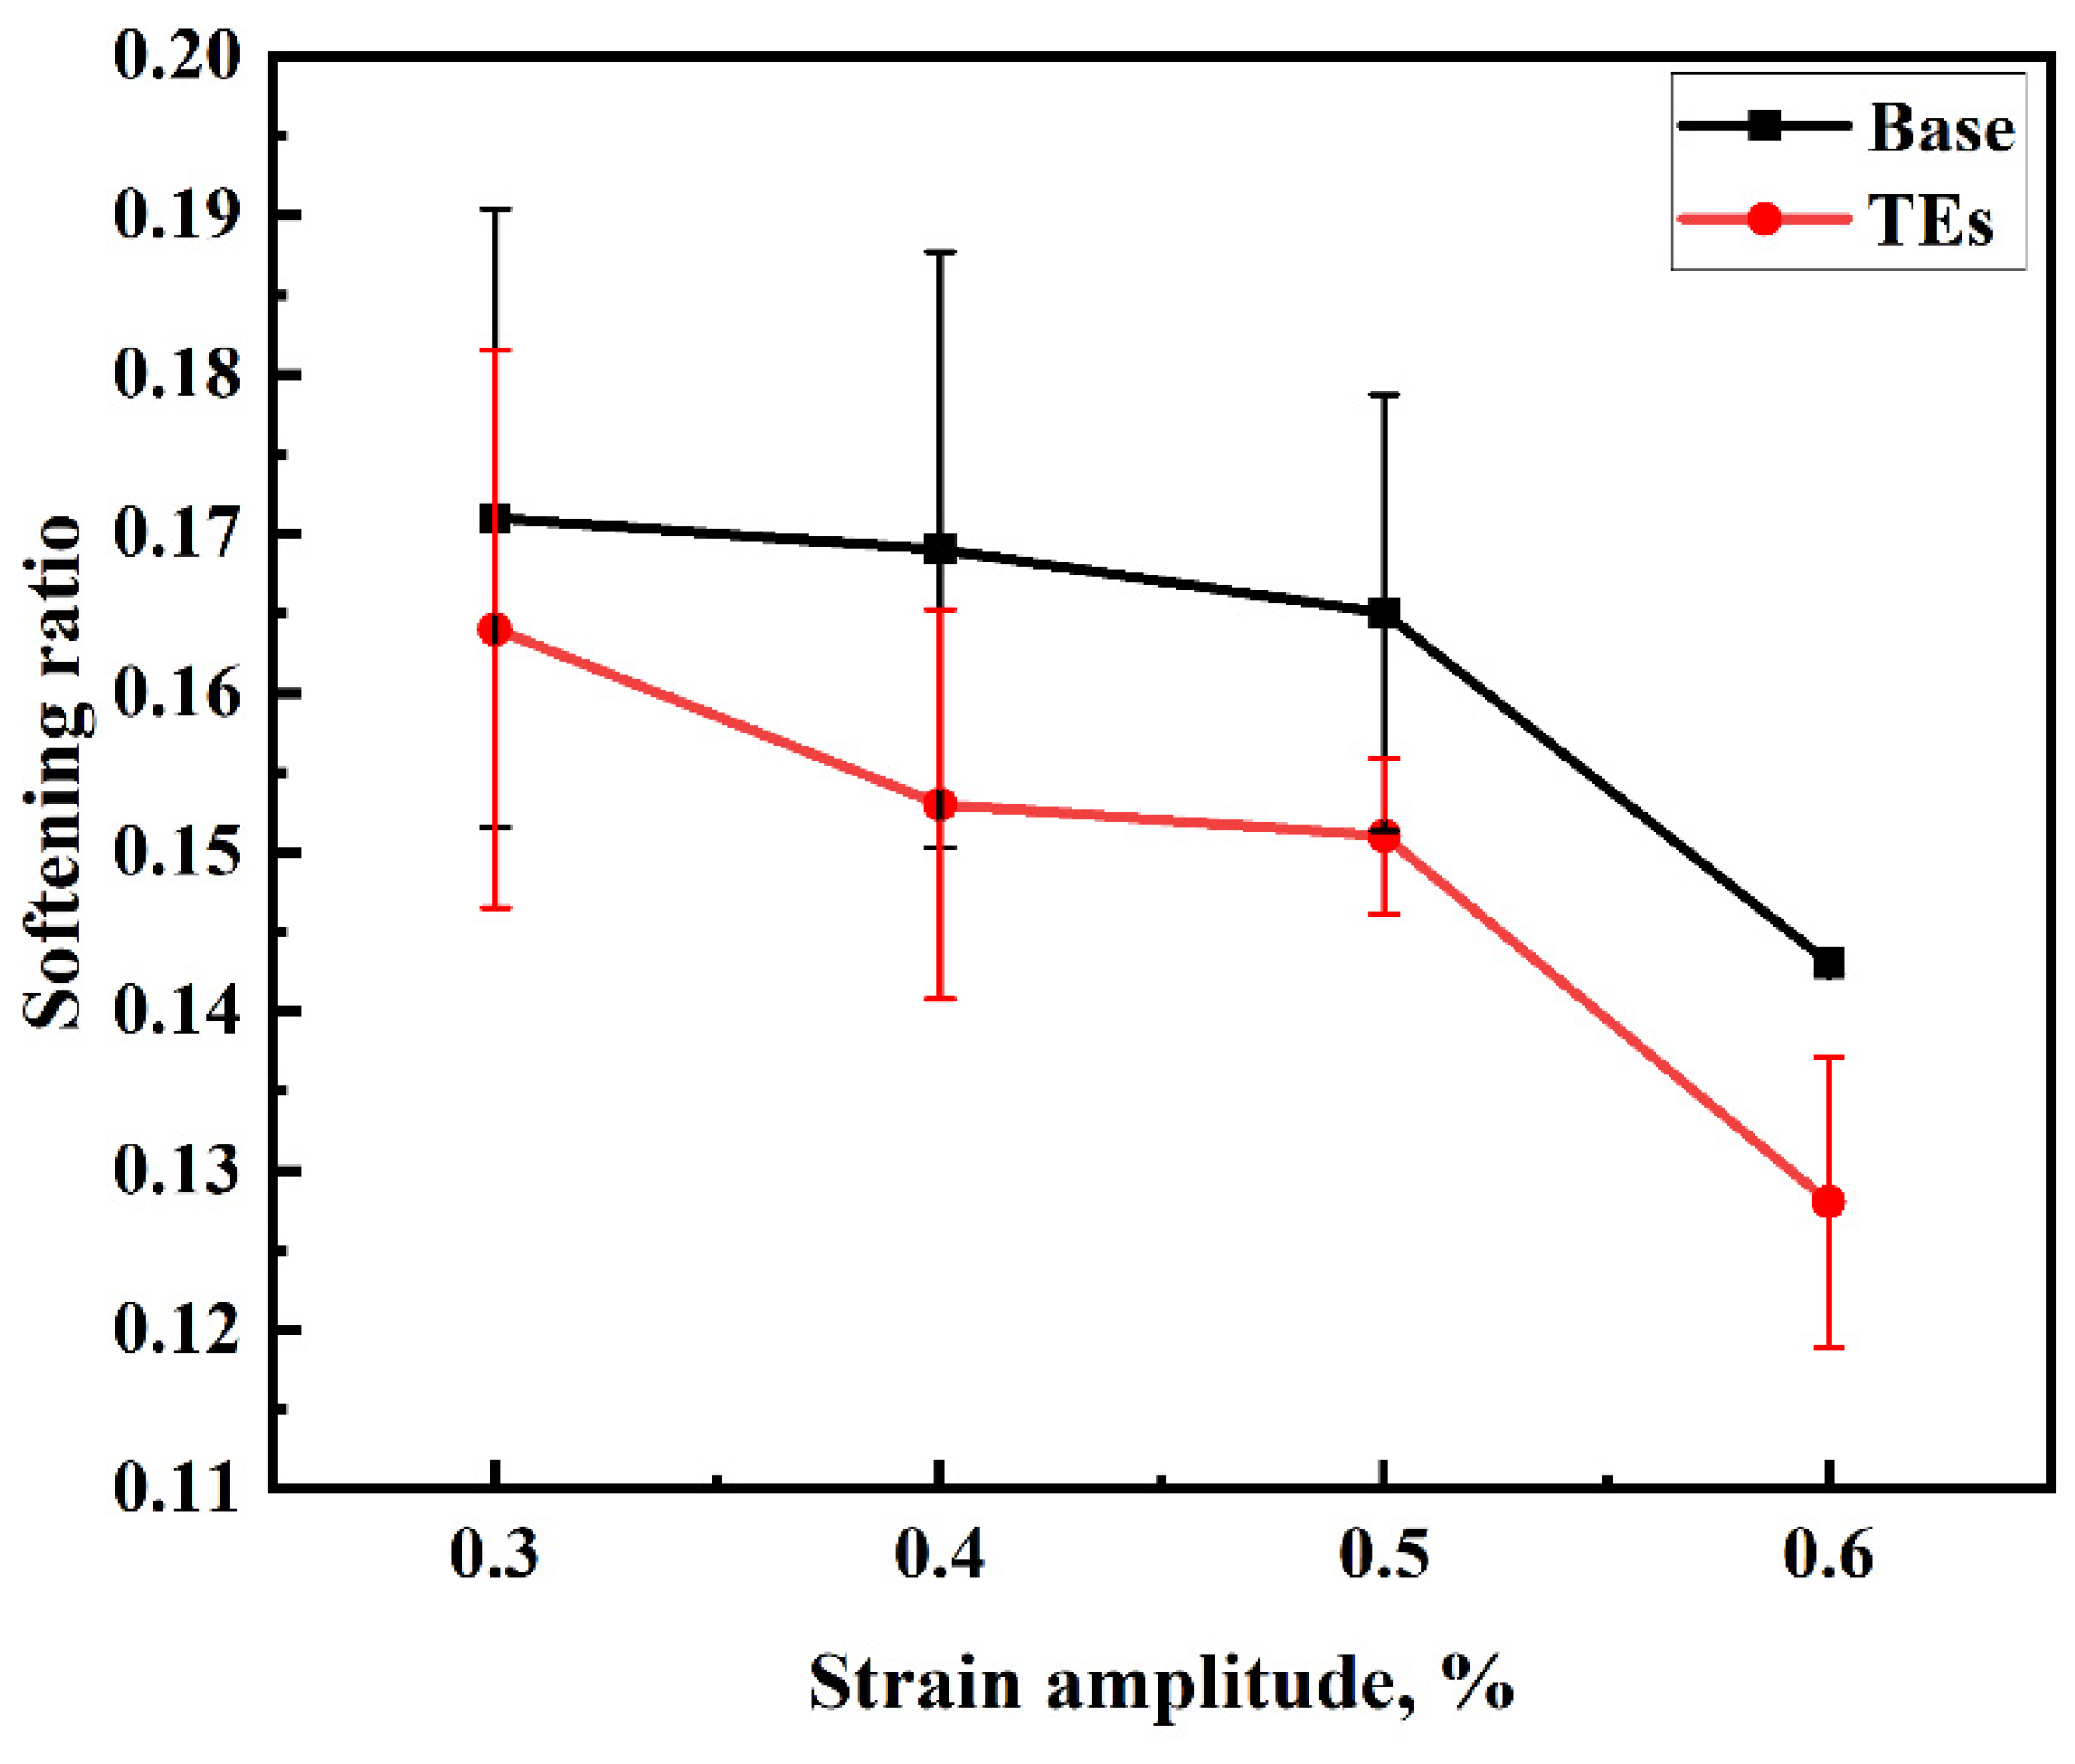
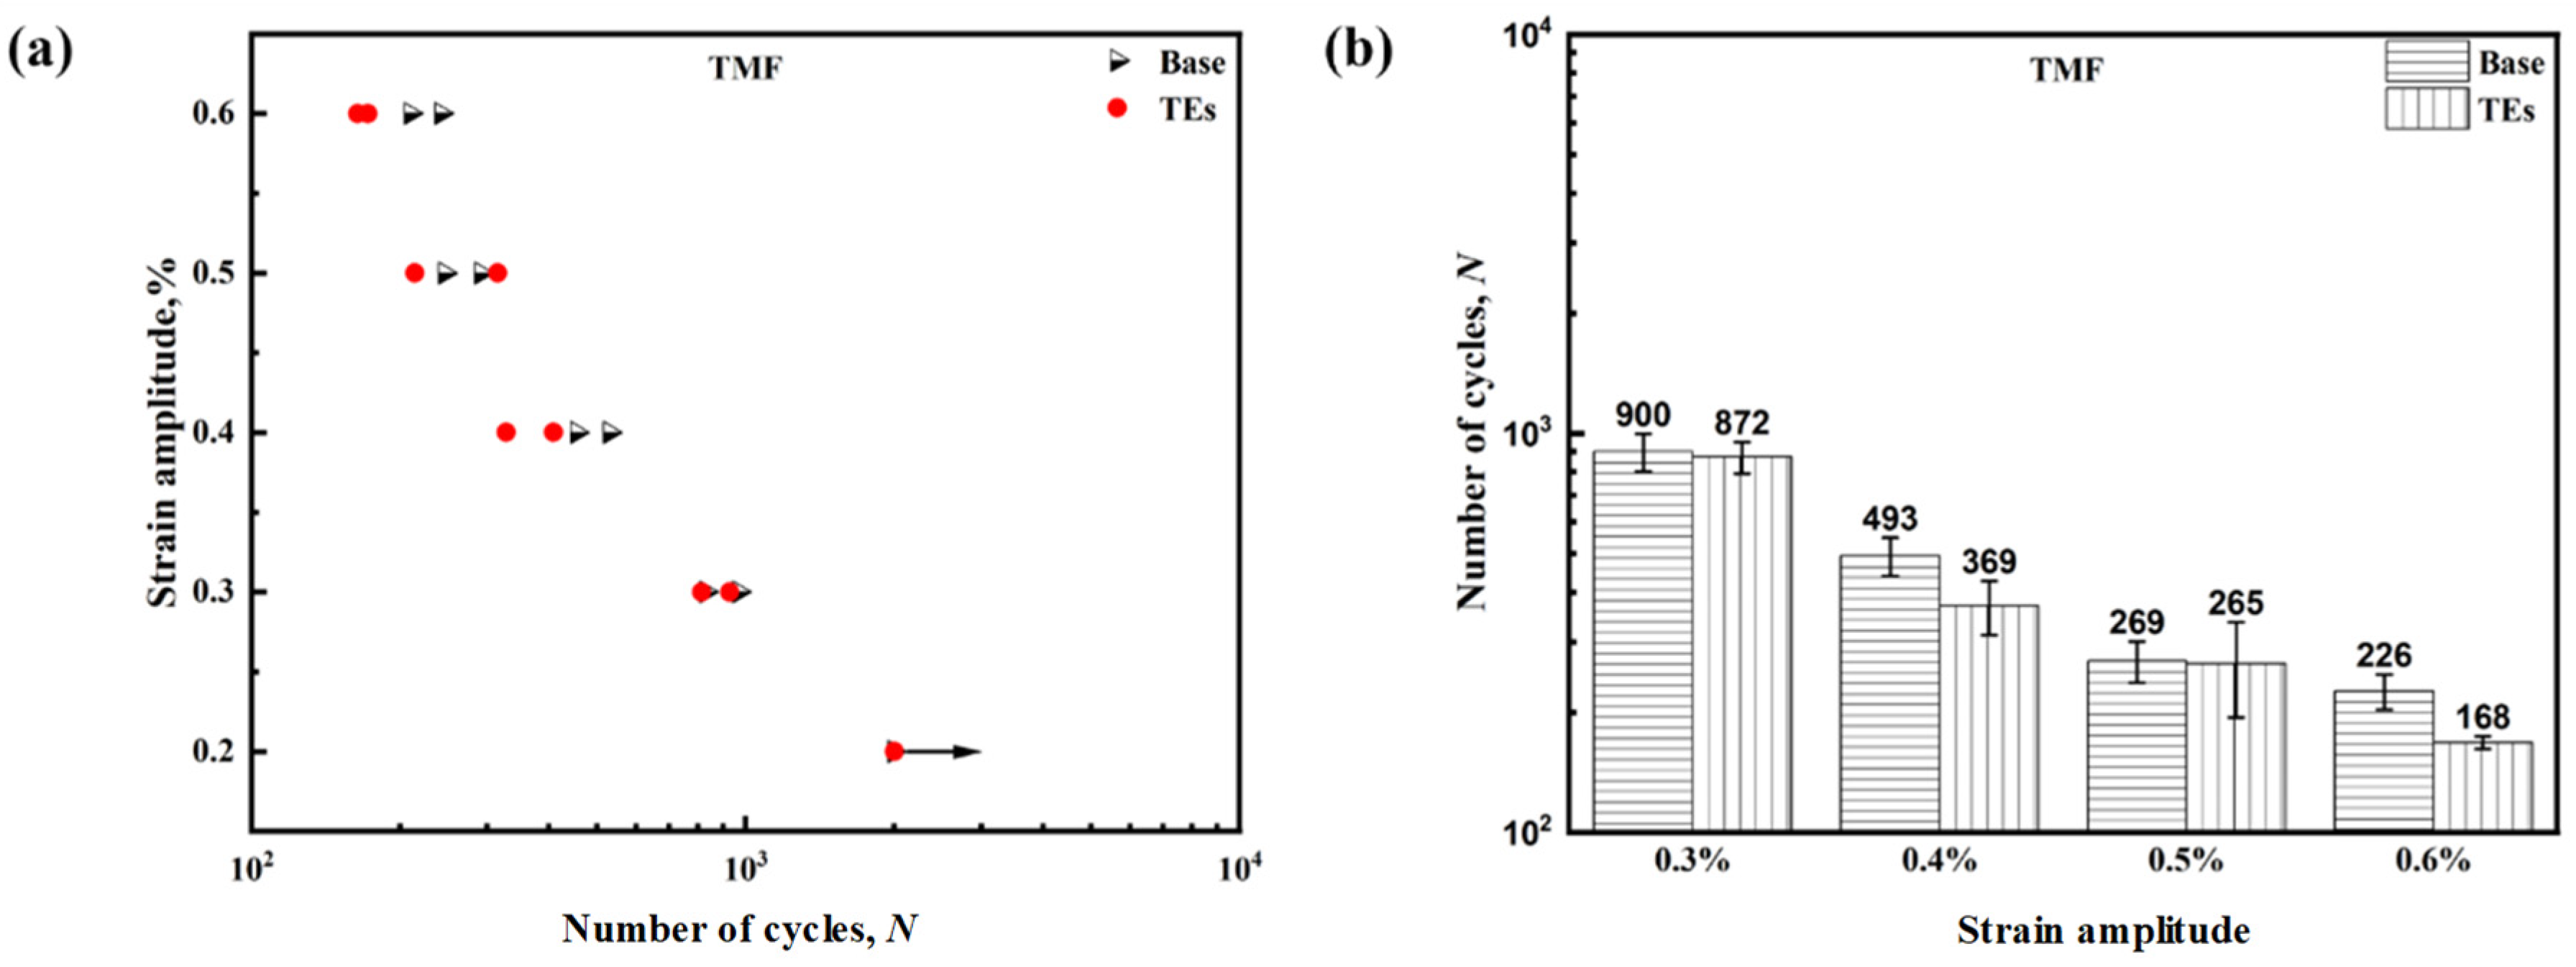
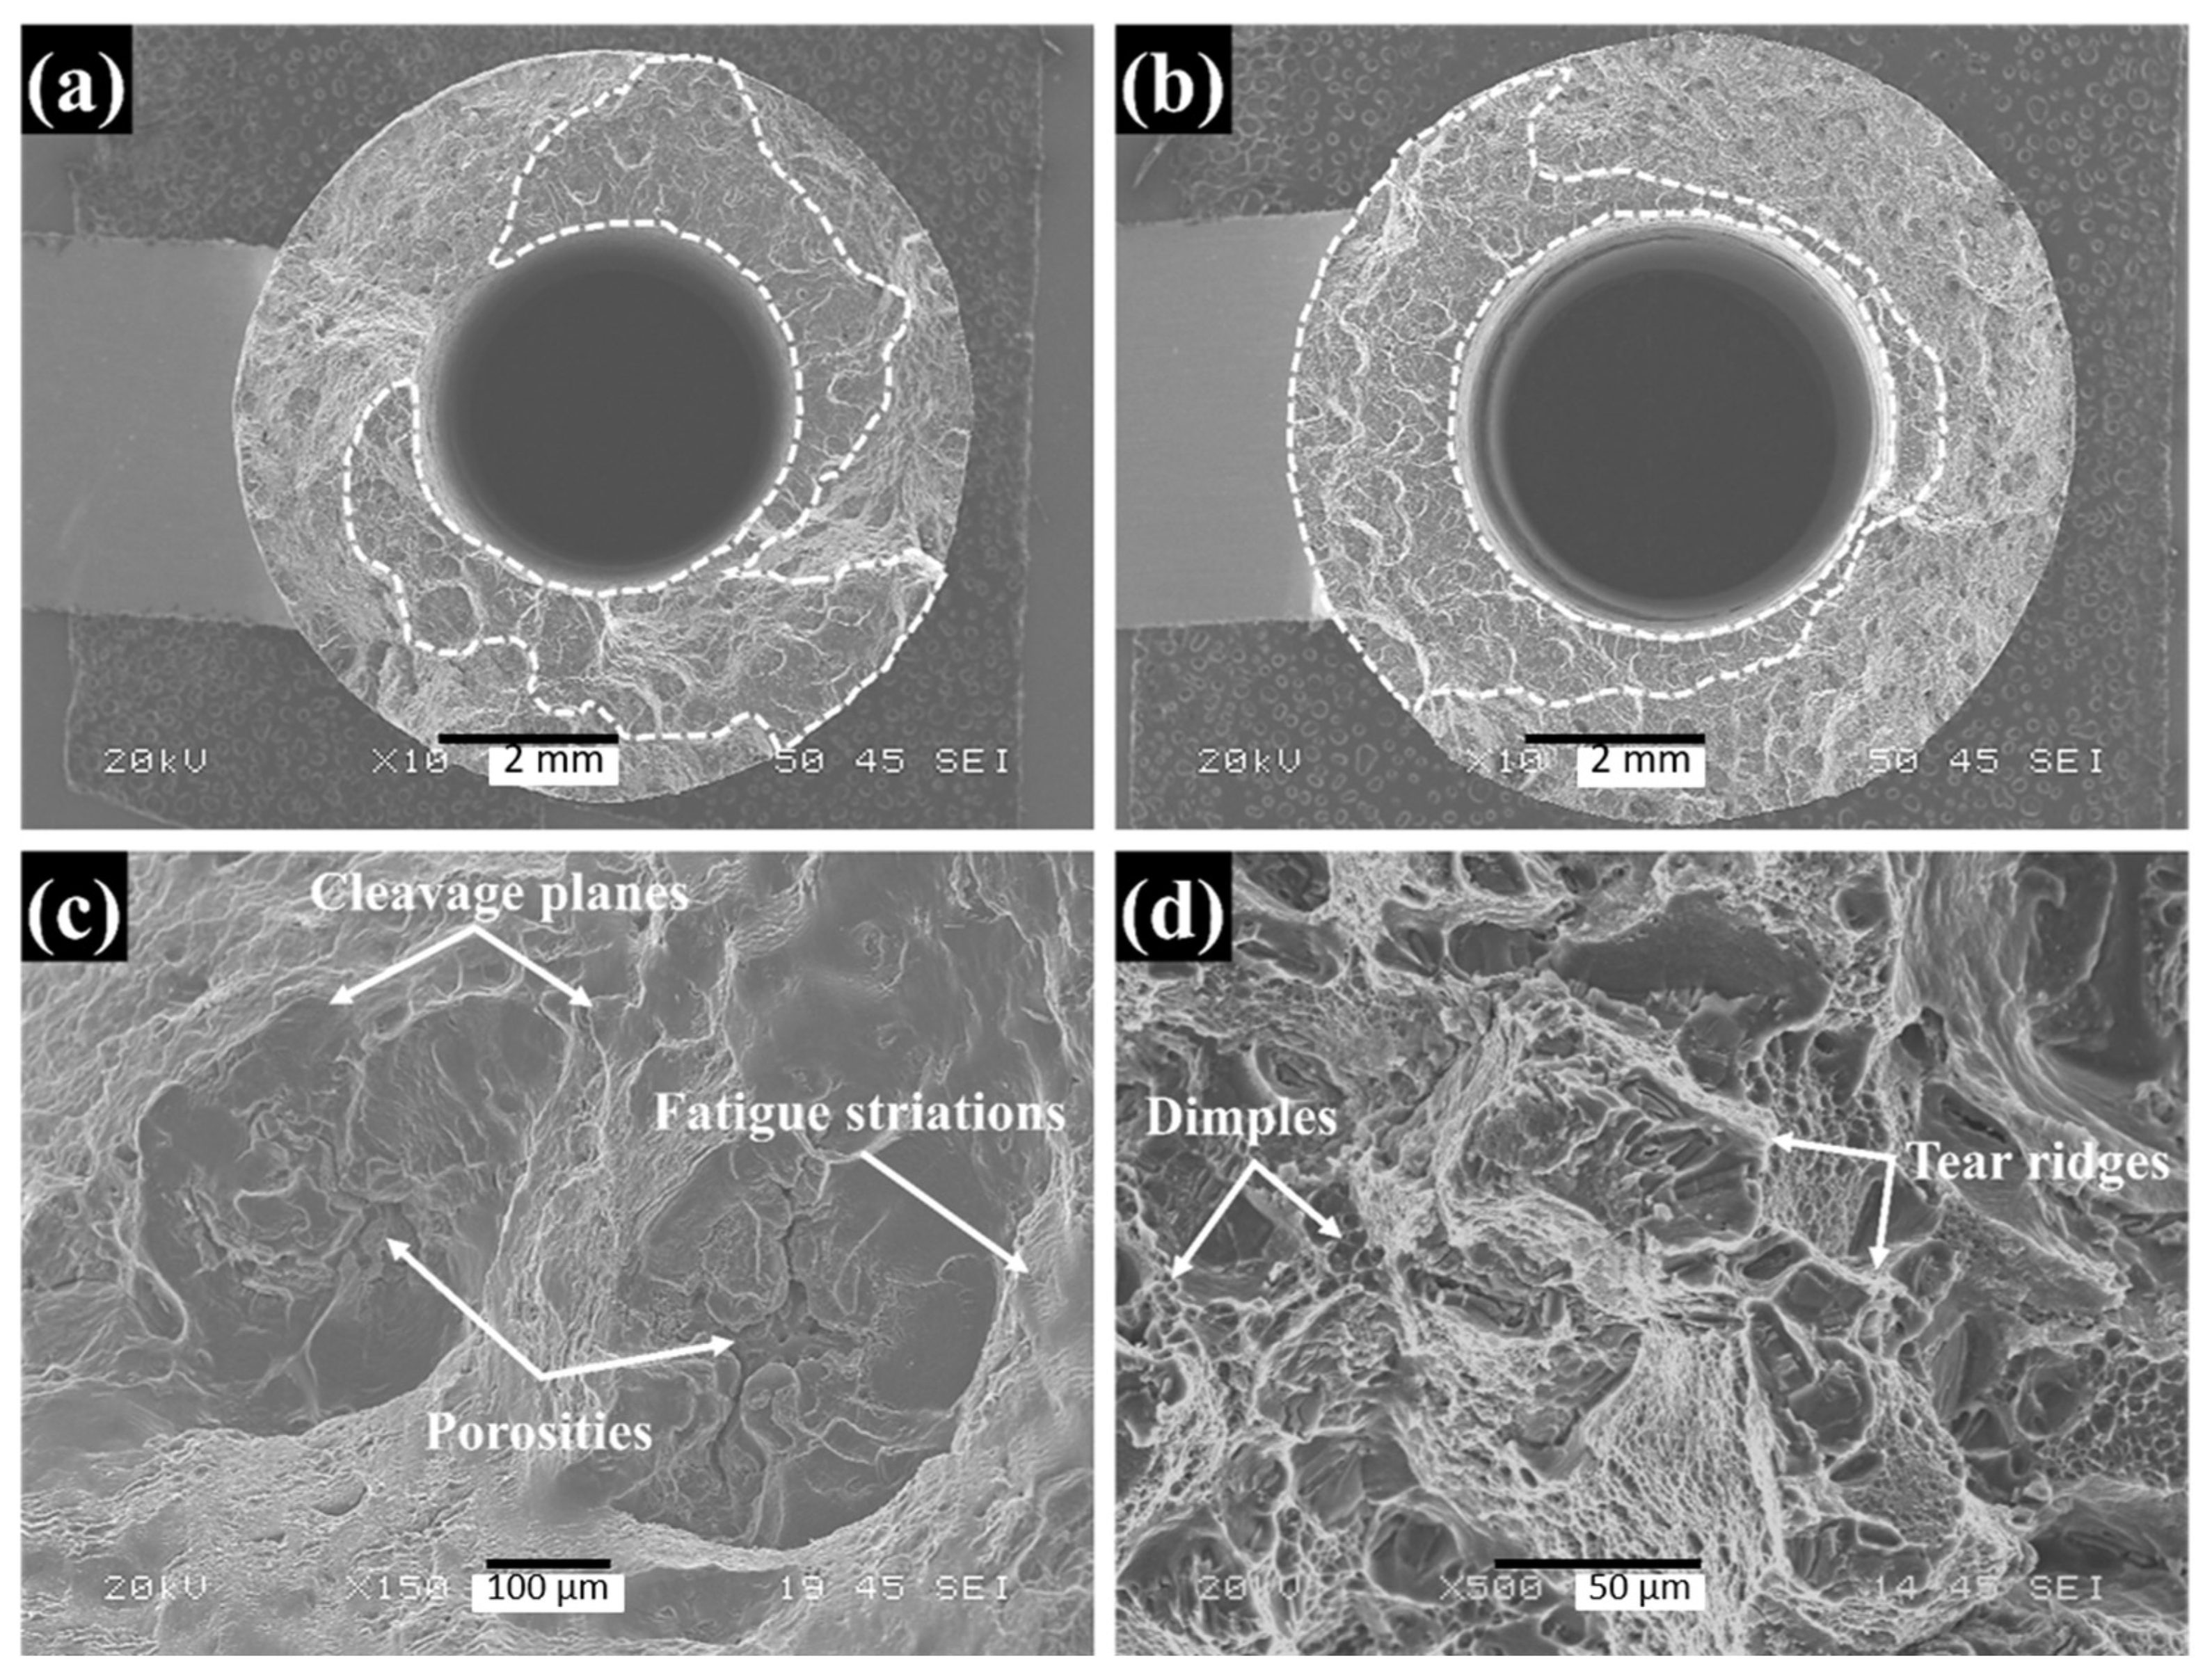
3.3. OP-TMF Behavior

The cyclic stress–strain responses of the tested alloys under OP-TMF loading at various strain amplitudes were comprehensively analyzed. As illustrated in Figure 8, the half-life hysteresis loops of the two alloys displayed an unsystematic pattern, characterized by a tensile zone (above the green dashed line) that was larger than the compression zone (below the green dashed line). During a single cycle of the OP-TMF test, the highest tensile stress occurred at the maximum strain, corresponding to the lowest temperature of 60 °C. By contrast, the highest compressive stress was observed at the highest temperature of 300 °C. As the temperature increased, especially above 250 °C, the precipitation-strengthened aluminum alloys experienced a considerable reduction in strength, resulting in a much lower value of peak compressive stress compared to the peak tensile stress under the OP-TMF loadings. The TEs alloy exhibited higher values for both the tensile and compression peak stresses than the base alloy. For example, at a 0.6% mechanical strain amplitude, the TEs alloy displayed a peak tensile stress of 234 MPa and peak compressive stress of 118 MPa, surpassing the values of 198 and 102 MPa, respectively, for the base alloy. Furthermore, owing to the higher tensile stress at low temperatures and the combined effect of cyclic stress and temperature under OP-TMF loadings, the OP-TMF generally has a shorter lifetime than the in-phase TMF or isothermal fatigue loadings [27,44,45]. Therefore, OP-TMF is generally considered the most detrimental damage mechanism for engine component applications and should be considered an important factor when designing a new engine.
Figure 9 shows the evolution of the maximum and minimum stresses of the tested alloys under different strain amplitudes. The peak stress values for both alloys progressively decreased as the OP-TMF process progressed, indicating that both alloys underwent cyclic softening. This softening phenomenon was attributed to the coarsening of the precipitates (θ″ and θ′), which was influenced by both the temperature and applied stress. To quantitatively evaluate the softening behavior of the tested alloys during OP-TMF, a softening ratio was introduced, which is expressed as follows [27,46]:
S o f t e n i n g   r a t i o = σ m a x σ h a l f σ m a x
where σmax and σhalf represent the maximum tensile stress and the tensile stress at half the lifetime, respectively. A higher softening ratio indicated more severe cyclic softening in the tested alloy. The results are summarized in Figure 10. Notably, the TEs alloy exhibited a smaller softening ratio than the base alloy at the same strain amplitude, indicating higher thermal stability in the TEs alloy relative to the base alloy. Additionally, as the strain amplitude increased from 0.3% to 0.6%, the softening ratio values for the base and TEs alloys decreased from 0.171 and 0.164 to 0.143 and 0.128, respectively. Under OP-TMF loading, the extent of the coarsening is affected by the applied stress and exposure time at high temperatures. Although increased stress at higher strain amplitudes can accelerate the coarsening process, the reduced exposure duration (short fatigue lifetime) resulting from the increasing strain amplitudes was the primary factor limiting the extent of softening in this case.
Figure 11 shows the fatigue lives of the tested alloys under various strain amplitudes. The relationship between the strain amplitude and fatigue lifetime is shown in Figure 11a. Significant scattering was observed in the fatigue results, particularly at relatively high strain amplitudes. At a strain amplitude of 0.2%, neither alloy was found to experience fatigue failure when the cycles reached 2000 cycles (Figure 11a). Additionally, a noticeable decrease in the OP-TMF lifetime from approximately 900 cycles to approximately 200 cycles was observed in both tested alloys as the strain amplitude increased from 0.3% to 0.6%. To compare the OP-TMF performances, the average fatigue lifetimes at different strain amplitudes were calculated, and the results are shown in Figure 11b. The TEs alloy showed a slightly shorter lifetime than the base alloy; however, the difference was relatively small. For instance, the average fatigue lifetimes at a 0.3% strain amplitude for the base and TEs alloys were 900 and 872 cycles, respectively. Thus, the difference in the mean fatigue lifetimes was only 28 cycles. However, if the stresses were the same for both alloys, the TEs alloy showed a similar fatigue behavior or even better performance than the base alloy. For example, the stress levels in the TEs alloy at a 0.5% strain amplitude were similar to those in the base alloy at a 0.6% strain amplitude, as shown in Figure 8 and Figure 9, but the TEs alloy exhibited an average fatigue lifetime of 265 cycles, which was higher than the 226 cycles observed in the base alloy.
Bright-field TEM images after the OP-TMF test at a 0.4% strain amplitude were used to reveal the coarsening behavior of the precipitates in both tested alloys (Figure 12). Two TEM images were obtained at similar foil thicknesses, allowing a direct comparison of the characteristics of the precipitates based on the TEM images. As revealed in Figure 12, all of the θ″ was found to either dissolve in the matrix or transform into θ′ after the OP-TMF tests, and the predominant precipitates in both tested alloys after experiencing the cyclic thermal and stress loadings were θ′. Compared to the base alloy, the θ′ precipitates in the TEs alloy exhibited a finer size and higher number density even under cyclic loads, indicating the higher thermal stability of the precipitates. As revealed in previous studies, the stabilization of the θ′ precipitates could be achieved by the segregation of the TEs into the Al/θ′ interfaces [7,9,14].
The damage characteristics under OP-TMF loadings were analyzed using SEM. Figure 13 shows the typical fracture morphology after 0.4% strain amplitude OP-TMF tests for both tested alloys. The experimental alloys showed similar fracture morphologies, consisting of two distinct zones, the fatigue crack growth zone (from the sample surface to the white dashed line in Figure 13a,b) and the fatigue crack rupture zone. Their typical characteristics are shown in Figure 13c,d. Fatigue striations and cleavage planes are observed in the crack growth zone, indicating a typical quasi-cleavage morphology. By contrast, the crack-rupture zone exhibited a ductile tearing morphology characterized by a combination of dimples and tear ridges. For both alloys, the pores located at or near the surface of the samples were always the main crack-initiation sites, as shown in Figure 13c. Because the TMF lifetimes of the two tested alloys were not significantly different, their damage mechanisms were very similar.
Figure 14 shows the fracture damage characteristics observed in longitudinal sections of the OP-TMF specimens using SEM in the backscattered mode. All of the fractured surfaces were observed to be perpendicular to the direction of the applied stress. The primary crack-initiation sites were identified as casting defects, particularly, porosity defects, as shown in Figure 14a. In our study, the pores primarily exhibited irregular shapes associated with shrinkage, which created stress concentration points susceptible to crack initiation. Additionally, surface defects on the specimen were noted as favorable conditions for the initiation of fatigue cracks because of the lower restraint at the free surface. Furthermore, brittle intermetallic phases broken under cyclic stress could also serve as potential crack-initiation points, particularly for Al7Cu2(Fe, Mn) in both tested alloys (Figure 14b) and Al3M in the TEs alloy (Figure 14c). Intriguingly, the broken intermetallic phases within the matrix were found to either facilitate crack growth or act as obstacles, depending on their alignment with the main crack direction. The crack deflection phenomenon illustrated in Figure 14b,c indicates the obstacle effect of the intermetallic phases.
The TEs alloy had a slightly weaker OP-TMF performance than the base alloy at the same strain amplitude, as shown in Figure 11b. This could have occurred because the higher peak tensile stress (Figure 8 and Figure 9) and lower ductility (Figure 5) of the TEs alloy at lower temperatures made local plastic deformation more likely to occur compared with the base alloy under OP-TMF loadings. This resulted in the earlier crack initiation in the TEs alloy. In addition, the brittle primary Al3M phase in the TEs alloy acted as a potential crack-initiation site, further accelerating the crack-initiation process relative to the base alloy. After the initiation of the fatigue cracks, the compressive stress at high temperatures did not facilitate crack propagation. By contrast, the tensile stress at low temperatures played a crucial role in the propagation of fatigue cracks. Therefore, the higher peak tensile stress in the TEs alloy at lower temperatures facilitated crack propagation and accelerated fatigue failure. It should be noted that the higher peak tensile stress and low ductility of the TEs alloy accelerated the fatigue process, leading to a shorter OP-TMF lifetime compared to that of the base alloy. However, the enhanced thermal stability of the precipitates in the TEs alloy, as shown in Figure 12, resulted in a strong interaction between the dislocations and precipitates, creating a higher back force that impeded the movement of the dislocations and promoted resistance to crack propagation. Therefore, the enhanced thermal stability acted as a compensating factor and improved the fatigue performance of the TEs alloy to some extent, leading to only a slight difference in the fatigue lifetimes of the TEs and base alloys.
In summary, the incorporation of Zr, Ti, and V into the 224 Al-Cu alloy led to the formation of finer and denser co-existing strengthening precipitates (θ″ and θ′), along with the precipitation of Al3M particles during solidification. This resulted in augmented UTS and YS with a slight reduction in ductility. Despite a minor reduction in the OP-TMF lifetime under the equivalent strain amplitudes relative to the base alloy, the TEs alloy may outperform the base alloy when subjected to the same stress. Thus, incorporating transition elements into the 224 alloy is recommended to achieve enhanced mechanical properties at both room and elevated temperatures, along with a favorable OP-TMF behavior.

4. Conclusions

The impact of TEs (Zr, Ti and V) on the microstructure, mechanical properties, and OP-TMF performance of the Al-Cu 224 cast alloy was investigated in this study, and the main conclusions drawn from the results are as follows:
  • The introduction of TEs into the Al-Cu 224 alloy resulted in a refinement of the grain structure and yielded finer and denser coexisting θ″ and θ′ precipitates.
  • The UTS and YS at both RT and 300 °C were enhanced by the addition of the TEs. The theoretical analyses of the YS contribution indicated that precipitation strengthening of θ″ and θ′ was the primary strengthening mechanism for the tested alloys, and the calculated YS values were in good agreement with experimentally measured data.
  • The addition of TEs caused a slight reduction in the OP-TMF lifetime under the same strain amplitudes as the base alloy. However, during the fatigue process, the TE-added alloy exhibited a lower coarsening ratio, indicating the higher thermal stability of the precipitates, which compensated for the negative impact on the fatigue performance to some extent.
  • Despite the minor reduction in the OP-TMF performance, the incorporation of small amounts of Zr, Ti, and V is recommended to achieve a refined grain structure, enhanced mechanical properties, and improved thermal stability in Al-Cu 224 cast alloys.

Author Contributions

P.H.: methodology, investigation, formal analysis, writing—original draft preparation; K.L.: conceptualization, validation, review and editing; L.P.: validation, review and editing; X.-G.C.: conceptualization, validation, review and editing, supervision, funding acquisition. All authors have read and agreed to the published version of the manuscript.

Funding

This research was funded by the Natural Sciences and Engineering Research Council of Canada (NSERC) under Grant No. CRDPJ 514651-17.

Data Availability Statement

The data that support the findings of this study are available from the corresponding author upon reasonable request.

Acknowledgments

The authors would like to acknowledge the financial support of the Natural Sciences and Engineering Research Council of Canada and that of Rio Tinto Aluminum through the Research Chair in the Metallurgy of Aluminum Transformation at the University of Quebec in Chicoutimi.

Conflicts of Interest

The authors declare no conflicts of interest.

References

  1. Gao, Y.H.; Yang, C.; Zhang, J.Y.; Cao, L.F.; Liu, G.; Sun, J.; Ma, E. Stabilizing Nanoprecipitates in Al-Cu Alloys for Creep Resistance at 300 °C. Mater. Res. Lett. 2018, 7, 18–25. [Google Scholar] [CrossRef]
  2. Kenevisi, M.S.; Yu, Y.; Lin, F. A Review on Additive Manufacturing of Al–Cu (2xxx) Aluminium Alloys: Processes and Defects. Mater. Sci. Technol. 2021, 37, 805–829. [Google Scholar] [CrossRef]
  3. The Aluminium Automotive Manual, Version 2015; European Aluminium Association: Brussels, Belgium, 2015.
  4. Guinier, A. Heterogeneities in Solid Solutions. In Solid State Physics; Academic Press: Cambridge, MA, USA, 1959; Volume 9, pp. 293–398. [Google Scholar] [CrossRef]
  5. Phillips, V.A. High Resolution Electron Microscope Observations on Precipitation in Al-3.0% Cu Alloy. Acta Metall. 1975, 23, 751–767. [Google Scholar] [CrossRef]
  6. Bahl, S.; Xiong, L.; Allard, L.F.; Michi, R.A.; Poplawsky, J.D.; Chuang, A.C.; Singh, D.; Watkins, T.R.; Shin, D.; Haynes, J.A.; et al. Aging Behavior and Strengthening Mechanisms of Coarsening Resistant Metastable θ’ Precipitates in an Al–Cu Alloy. Mater. Des. 2021, 198, 109378. [Google Scholar] [CrossRef]
  7. Shin, D.; Shyam, A.; Lee, S.; Yamamoto, Y.; Haynes, J.A. Solute Segregation at the Al/θ′-Al2Cu Interface in Al-Cu Alloys. Acta Mater. 2017, 141, 327–340. [Google Scholar] [CrossRef]
  8. Shyam, A.; Roy, S.; Shin, D.; Poplawsky, J.D.; Allard, L.F.; Yamamoto, Y.; Morris, J.R.; Mazumder, B.; Idrobo, J.C.; Rodriguez, A.; et al. Elevated Temperature Microstructural Stability in Cast AlCuMnZr Alloys Through Solute Segregation. Mater. Sci. Eng. A 2019, 765, 138279. [Google Scholar] [CrossRef]
  9. Poplawsky, J.D.; Milligan, B.K.; Allard, L.F.; Shin, D.; Shower, P.; Chisholm, M.F.; Shyam, A. The Synergistic Role of Mn and Zr/Ti in Producing θ′/L12 Co-Precipitates in Al-Cu Alloys. Acta Mater. 2020, 194, 577–586. [Google Scholar] [CrossRef]
  10. Rakhmonov, J.U.; Bahl, S.; Shyam, A.; Dunand, D.C. Cavitation-Resistant Intergranular Precipitates Enhance Creep Performance of θ′-Strengthened Al-Cu Based Alloys. Acta Mater. 2022, 228, 117788. [Google Scholar] [CrossRef]
  11. Sun, T.T.; Geng, J.W.; Bian, Z.Y.; Wu, Y.; Wang, M.L.; Chen, D.; Ma, N.H.; Wang, H.W. Enhanced Thermal Stability and Mechanical Properties of High-Temperature Resistant Al–Cu Alloy with Zr and Mn Micro-Alloying. Trans. Nonferrous Met. Soc. China 2022, 32, 64–78. [Google Scholar] [CrossRef]
  12. Hu, P.; Liu, K.; Pan, L.; Chen, X.G. Effect of Mg Microalloying on Elevated-Temperature Creep Resistance of Al–Cu 224 Cast Alloys. Mater. Sci. Eng. A 2022, 851, 143649. [Google Scholar] [CrossRef]
  13. Hu, P.; Liu, K.; Pan, L.; Chen, X.G. Effects of Individual and Combined Additions of Transition Elements (Zr, Ti, and V) on the Microstructure Stability and Elevated-Temperature Properties of Al–Cu 224 Cast Alloys. Mater. Sci. Eng. A 2023, 867, 144718. [Google Scholar] [CrossRef]
  14. Knipling, K.E.; Dunand, D.C.; Seidman, D.N. Criteria for Developing Castable, Creep-Resistant Aluminum-Based Alloys—A Review. Int. J. Mater. Res. 2006, 97, 246–265. [Google Scholar] [CrossRef]
  15. Rouxel, B.; Ramajayam, M.; Langan, T.J.; Lamb, J.; Sanders, P.G.; Dorin, T. Effect of Dislocations, Al3(Sc, Zr) Distribution and Ageing Temperature on θ′ Precipitation in Al-Cu-(Sc)-(Zr) Alloys. Mater. 2020, 9, 100610. [Google Scholar] [CrossRef]
  16. Mondol, S.; Kashyap, S.; Kumar, S.; Chattopadhyay, K. Improvement of High Temperature Strength of 2219 Alloy by Sc and Zr Addition Through a Novel Three-Stage Heat Treatment Route. Mater. Sci. Eng. A 2018, 732, 157–166. [Google Scholar] [CrossRef]
  17. Cui, L.; Liu, K.; Zhang, Z.; Chen, X.G. Enhanced Elevated-Temperature Mechanical Properties of Hot-Rolled Al–Cu Alloys: Effect of Zirconium Addition and Homogenization. J. Mater. Sci. 2023, 58, 11424–11439. [Google Scholar] [CrossRef]
  18. Javidani, M.; Larouche, D. Application of Cast Al-Si Alloys in Internal Combustion Engine Components. Int. Mater. Rev. 2014, 59, 132–158. [Google Scholar] [CrossRef]
  19. Riedler, M.; Leitner, H.; Prillhofer, B.; Winter, G.; Eichlseder, W. Lifetime Simulation of Thermo-Mechanically Loaded Components. Meccanica 2007, 42, 47–59. [Google Scholar] [CrossRef]
  20. Minichmayr, R.; Riedler, M.; Winter, G.; Leitner, H.; Eichlseder, W. Thermo-Mechanical Fatigue Life Assessment of Aluminium Components Using the Damage Rate Model of Sehitoglu. Int. J. Fatigue 2008, 30, 298–304. [Google Scholar] [CrossRef]
  21. Wang, Q.G.; Apelian, D.; Lados, D.A. Fatigue Behavior of A356-T6 Aluminum Cast Alloys. Part I. Effect of Casting Defects. J. Light Met. 2001, 1, 73–84. [Google Scholar] [CrossRef]
  22. Couper, M.J.; Neeson, A.E.; Griffiths, J.R. Casting Defects and the Fatigue Behaviour of an Aluminium Casting Alloy. Fatigue Fract. Eng. Mater. Struct. 1990, 13, 213–227. [Google Scholar] [CrossRef]
  23. Humbertjean, A.; Beck, T. Effect of the Casting Process on Microstructure and Lifetime of the Al-Piston-Alloy AlSi12Cu4Ni3 Under Thermo-Mechanical Fatigue with Superimposed High-Cycle Fatigue Loading. Int. J. Fatigue 2013, 53, 67–74. [Google Scholar] [CrossRef]
  24. Wang, Q.G.; Apelian, D.; Lados, D.A. Fatigue Behavior of A356/357 Aluminum Cast Alloys. Part II–Effect of Microstructural Constituents. J. Light Met. 2001, 1, 85–97. [Google Scholar] [CrossRef]
  25. Huter, P.; Oberfrank, S.; Grün, F.; Stauder, B. Thermo-Mechanical Fatigue Influence of Copper and Silicon on Hypo-Eutectic Al–Si–Cu and Al–Si–Mg Cast Alloys Used in Cylinder Heads. Int. J. Fatigue 2016, 88, 142–155. [Google Scholar] [CrossRef]
  26. Kim, H.Y.; Park, T.Y.; Han, S.W.; Lee, H.M. Effects of Mn on the Crystal Structure of α-Al (Mn, Fe) Si Particles in A356 Alloys. J. Cryst. Growth 2006, 291, 207–211. [Google Scholar] [CrossRef]
  27. Hu, P.; Liu, K.; Pan, L.; Chen, X.G. Effect of Mg on Elevated-Temperature Low Cycle Fatigue and Thermo-Mechanical Fatigue Behaviors of Al-Cu Cast Alloys. Mater. Sci. Eng. A 2023, 885, 145588. [Google Scholar] [CrossRef]
  28. Hu, P.; Liu, K.; Pan, L.; Chen, X.G. Thermomechanical Fatigue Behavior and Its Life Prediction of AlSi9Cu3.5 Cast Alloy. J. Mater. Sci. 2024, 59, 8022–8039. [Google Scholar] [CrossRef]
  29. Karayaka, M.; Sehitoglu, H. Thermomechanical fatigue of particulate-reinforced aluminum 2xxx-T4. Metall. Trans. A 1991, 22, 697–707. [Google Scholar] [CrossRef]
  30. ASTM B557-15; Standard Test Methods for Tension Testing Wrought and Cast Aluminum- and Magnesium-Alloy Products. ASTM International: West Conshohocken, PA, USA, 2023.
  31. ASTM E21; Standard Test Methods for Elevated Temperature Tension Tests of Metallic Materials. ASTM International: West Conshohocken, PA, USA, 2021.
  32. Qin, J.; Racine, D.; Liu, K.; Chen, X.G. Strain-controlled thermo-mechanical fatigue testing of aluminum alloys using the Gleeble 3800 system. In Proceedings of the 16th International Aluminum Alloys Conference (ICAA 16), Montreal, QC, Canada, 17–21 June 2018. [Google Scholar]
  33. ASTM E606; Standard Test Method for Strain-Controlled Fatigue Testing. ASTM International: West Conshohocken, PA, USA, 2021.
  34. ASTM E2368; Standard Practice for Strain Controlled Thermomechanical Fatigue Testing. ASTM International: West Conshohocken, PA, USA, 2024.
  35. Roy, S.; Allard, L.F.; Rodriguez, A.; Porter, W.D.; Shyam, A. Comparative Evaluation of Cast Aluminum Alloys for Automotive Cylinder Heads: Part II: Mechanical and Thermal Properties. Metall. Mater. Trans. A 2017, 48, 2543–2562. [Google Scholar] [CrossRef]
  36. Nie, J.F.; Muddle, B.C. Strengthening of an Al–Cu–Sn Alloy by Deformation-Resistant Precipitate Plates. Acta Mater. 2008, 56, 3490–3501. [Google Scholar] [CrossRef]
  37. Li, J.; Hage, F.S.; Ramasse, Q.M.; Schumacher, P. The Nucleation Sequence of α-Al on TiB₂ Particles in Al-Cu Alloys. Acta Mater. 2021, 206, 116652. [Google Scholar] [CrossRef]
  38. Men, H.; Fan, Z. Effects of Solute Content on Grain Refinement in an Isothermal Melt. Acta Mater. 2011, 59, 2704–2712. [Google Scholar] [CrossRef]
  39. Shen, Z.; Ding, Q.; Liu, C.; Wang, J.; Tian, H.; Li, J.; Zhang, Z. Atomic-Scale Mechanism of the θ″ → θ′ Phase Transformation in Al-Cu Alloys. J. Mater. Sci. Technol. 2017, 33, 1159–1164. [Google Scholar] [CrossRef]
  40. Wolverton, C. Solute–Vacancy Binding in Aluminum. Acta Mater. 2007, 55, 5867–5872. [Google Scholar] [CrossRef]
  41. Makineni, S.K.; Sugathan, S.; Meher, S.; Banerjee, R.; Bhattacharya, S.; Kumar, S.; Chattopadhyay, K. Enhancing Elevated Temperature Strength of Copper Containing Aluminium Alloys by Forming L12 Al3Zr Precipitates and Nucleating θ″ Precipitates on Them. Sci. Rep. 2017, 7, 11154. [Google Scholar] [CrossRef] [PubMed]
  42. Mondol, S.; Makineni, S.K.; Kumar, S.; Chattopadhyay, K. Enhancement of High Temperature Strength of 2219 Alloys Through Small Additions of Nb and Zr and a Novel Heat Treatment. Metall. Mater. Trans. A 2018, 49, 3047–3057. [Google Scholar] [CrossRef]
  43. Dieter, G.E.; Bacon, D. Mechanical Metallurgy; McGraw-Hill: New York, NY, USA, 1976; Volume 3, pp. 43–53. [Google Scholar]
  44. Azadi, M.; Farrahi, G.H.; Winter, G.; Eichlseder, W. Fatigue Lifetime of AZ91 Magnesium Alloy Subjected to Cyclic Thermal and Mechanical Loadings. Mater. Des. 2014, 53, 639–644. [Google Scholar] [CrossRef]
  45. Azadi, M.; Farrahi, G.H.; Winter, G.; Eichlseder, W. Thermo-Mechanical Behaviours of Light Alloys in Comparison to High Temperature Isothermal Behaviours. Mater. High Temp. 2014, 31, 12–17. [Google Scholar] [CrossRef]
  46. Hong, S.G.; Lee, S.B.; Byun, T.S. Temperature Effect on the Low-Cycle Fatigue Behavior of Type 316L Stainless Steel: Cyclic Non-Stabilization and an Invariable Fatigue Parameter. Mater. Sci. Eng. A 2007, 457, 139–147. [Google Scholar] [CrossRef]
Figure 1. Geometry and dimensions of (a) tensile sample and (b) OP-TMF sample.
Jmmp 08 00250 g001
Figure 2. As-cast grain structures of (a) base and (b) TEs alloys.
Jmmp 08 00250 g002
Figure 3. Backscatter SEM images showing the typical microstructures of the two alloys: (a,b) as-cast and (c,d) T7 states.
Jmmp 08 00250 g003
Figure 4. Bright-field TEM images showing the typical distributions of precipitates in the T7-treated (a) base alloy and (b) TEs alloy. (c) Uneven distribution of Al3M in the TEs alloy.
Jmmp 08 00250 g004
Figure 5. Tensile properties of T7-treated alloys at both (a) RT and (b) 300 °C.
Jmmp 08 00250 g005
Figure 6. Bright-field TEM images showing the precipitate distributions after the tensile tests at 300 °C: (a) base and (b) TEs alloys.
Jmmp 08 00250 g006
Figure 7. Theoretically calculated and experimentally measured YS values at RT and 300 °C.
Jmmp 08 00250 g007
Figure 8. Half-life hysteresis loops of two tested alloys under OP-TMF loading with various strain amplitudes: (a) base and (b) TEs alloys.
Jmmp 08 00250 g008
Figure 9. Evolution of peak stress of tested alloys under various strain amplitudes: (a) base and (b) TEs alloys.
Jmmp 08 00250 g009
Figure 10. Softening ratios of experimental alloys at various strain amplitudes.
Jmmp 08 00250 g010
Figure 11. (a) Fatigue lifetimes of the tested alloys and (b) the average number of cycles as a function of the strain amplitude.
Jmmp 08 00250 g011
Figure 12. Bright-field TEM images showing the post-fatigue precipitate distributions: (a) base and (b) TEs alloys.
Jmmp 08 00250 g012
Figure 13. Fatigue fracture morphologies of (a) base and (b) TEs alloys after fatigue tests at a 0.4% strain amplitude, and the typical characteristics of the (c) crack-growth zone and (d) crack-rupture zone.
Jmmp 08 00250 g013
Figure 14. Typical OP-TMF damage characteristics observed in longitudinal sections using SEM backscattered mode, where (a,b) show the porosity and broken iron-rich intermetallic observed in both tested alloys and (c) shows the broken Al3M found only in the TEs alloy.
Jmmp 08 00250 g014
Table 1. Chemical composition of experimental Al-Cu 224 alloys (wt.%).
IDCuMnMgZrTiVSiFeAl
base4.700.350.140.010.050.010.060.12Bal.
TEs4.690.340.120.150.170.210.040.11Bal.
Table 2. Quantitative results of θ″ and θ′ including the standard deviation for T7-treated alloys.
AlloyPrecipitatesLength (dt),
nm
Thickness (tt),
nm
Number Density (Nv), nm−3Volume Fraction (f), %
baseθ′159.5 ± 50.45.6 ± 2.02.5 × 10−72.8
θ″32.4 ± 10.73.2 ± 0.83.1 × 10−60.8
TEsθ′102.7 ± 43.35.3 ± 1.82.9 × 10−71.3
θ″32.2 ± 13.02.9 ± 0.87.6 × 10−62.3
Table 3. Quantitative results of θ′ in two alloys after the tensile tests at 300 °C.
AlloyLength (dt), nmThickness (tt), nmNumber Density (Nv), nm−3Volume Fraction (f), %
base173.9 ± 87.512.4 ± 4.71.2 × 10−73.2
TEs170.3 ± 84.011.1 ± 3.81.6 × 10−73.9
Table 4. The description and values of the symbols mentioned in the equations.
SymbolDescriptionValue
σpptYS provided by precipitates--
σgbYS due to the grain boundaries--
MTaylor factor3.06 [36]
GShear modulus of α–Al matrix28 GPa at RT [42];
21.2 GPa at 300 °C [17]
εLattice strain0.006 [42]
bMagnitude of Burgers vector for Al0.286 nm [36]
νPoison’s ratio1/3 [36]
dtEffective length precipitatesRefer to Table 2 and Table 3
ttEffective thickness of precipitatesRefer to Table 2 and Table 3
NvNumber density of precipitatesRefer to Table 2 and Table 3
fVolume fraction of precipitatesRefer to Table 2 and Table 3
σiYS for pure Al with infinite grain size16 MPa at RT [36]
kiHall-Petch constant0.065 MPa·m1/2 [36]
DAverage grain size99 µm (Base); 40 µm (TEs)
MExponent for grain boundary strengthening0.5 [36]
Disclaimer/Publisher’s Note: The statements, opinions and data contained in all publications are solely those of the individual author(s) and contributor(s) and not of MDPI and/or the editor(s). MDPI and/or the editor(s) disclaim responsibility for any injury to people or property resulting from any ideas, methods, instructions or products referred to in the content.

