Abstract
Composite materials, such as aluminum alloy FGMs, provide advantageous weight reduction properties compared to homogenous pure structures while still preserving sufficient stiffness for diverse applications. Despite various research on drilling simulation concepts and ideas for these materials, there still needs to be an agreement on the process modeling. Researchers have looked into a lot of different numerical methods, including Lagrangian, Eulerian, arbitrary Lagrangian–Eulerian (ALE), and coupled Eulerian–Lagrangian (CEL), to find solutions to problems like divergence issues and too much mesh distribution, which become more of a problem at higher speeds. This research provides a global analysis of bottom-up meshing for eleven 1 mm layers using ABAQUS® software. It combines the internal surface contact approach with the Lagrangian domain’s kinematic framework. The model uses the Johnson–Cook constitutive equation to precisely predict cutting forces, stress, and strain distributions, optimizing cutting parameters to improve drilling performance. According to Taguchi analysis, the most favorable parameters for reducing cutting force and improving performance are a rotational speed of 700 rpm, a feed rate of 1 mm/s, and a depth of cut of 3 mm. The findings suggest that increasing the feed rate and depth of cut substantially affects the cutting force, while the rotational speed has a comparatively little effect. These ideal settings serve as a foundation for improving FGM drilling efficiency.
1. Introduction
FGMs are composites where the material structure gradually changes in a given direction according to the required properties. Thanks to continuous evolution in their microstructures, FGMs differ from traditional composites in high-temperature surface-wear resistance, higher adhesion at the ceramic–metal interface, and fracture resistance, coupled with lower interfacial and thermal stress [1,2,3]. It provides special characteristics, including low weight, superior strength, high elasticity modulus, and significant resistance to fatigue and corrosion. These qualities render them competitive compared to conventional materials [4,5]. The excellent qualities allow the graded material to be selected for military and defense applications. They are utilized not only in aircraft manufacturing but also in producing rocket motor casings and rocket launchers. However, there has been a significant rise in the utilization of FGMs in automotive, bio, civil, marine engineering, and sports goods [6,7].
Determining the machinability characteristics of materials is a challenging issue. Multi-response optimization methods play a significant role in defining optimum process parameters for diverse machining operations. One notable technique, Gray relational analysis (GRA), investigates the effects of components and their relative significance, offering suitable response input parameters with varied weights [8,9]. This technique ranks process parameters by assessing all parameter responses [10,11]. Due to the lack of cumbersome formulas and computations, its simplicity and versatility have inspired numerous researchers to use GRA. Using GRA and ANOVA, Haq et al. [12] evaluated the impact of machining factors such as cutting speed, feed rate, and point angle on cutting force, torque, and surface roughness in Al/SiC metal matrix composites. Their results suggested contributions of 43.2% for point angle, 28.64% for cutting speed, and 26.21% for feed rate. Similarly, using GRA, Babu et al. [13,14] studied optimum drilling parameters for SiC-reinforced aluminum FGM composites. They observed that feed rate and drilling zone were major factors, contributing 56.67% and 32.95%, respectively. Drilling is necessary for assembly procedures, such as drilling holes for rivets or bolts. For example, a small aircraft can need up to 100,000 holes, with bigger aircraft requiring even more [5,15]. Drilling may produce several forms of damage, including cracking and delamination, the latter being most important as it impacts load-carrying capacity, fatigue strength, and service life [16,17]. These flaws may impair drilling performance, rejecting roughly 60% of machined components [18].
Therefore, these faults need to be reduced as much as possible. Many research works focus on optimizing cutting parameters and predicting cutting forces, surface roughness, and damage factors during drilling in metals [19,20,21] and composites [22,23,24]. In this regard, Kilickap [23] investigated the effect of cutting parameters on delamination during drilling, and based on Taguchi methods and analysis of variance, he found that feed rate and cutting speed significantly affect delamination. Arul et al. [17] optimized the cutting conditions regarding material removal rate, tool life, and delamination, using the group approach data processing algorithm for the optimum parameter determination. Tsao and Hocheng [24] researched the delamination when drilling with various tools and found out that drill diameter and feed rate were the most influential parameters for high-efficiency drilling. Krishnaraj et al. [25] optimized the cutting conditions using a K-20 carbide drill and various parameters like transmittance through the technique of a genetic algorithm in search of optimal settings. They found that optimal cutting conditions rarely impacted tool wear until 150 holes were drilled, and besides, delamination was not significant until 30 holes. Singh et al. [26] developed a model to optimize thrust force during the drilling of GFRP, identifying a threshold thrust force at which delamination did not occur. Experiments showed that it was possible to drill delamination-free holes using this concept. Yazdi et al. [27] developed a model to predict the thrust force during the drilling of PA6–nano clay nanocomposite materials, based on a neural network using particle swarm optimization. It has a higher training capacity compared to a traditional neural network.
Zhang et al. [28] studied the performance of polycrystalline diamond (PCD) tools with varied point and clearance angles in drilling operations on Cf/SiC composites under various machining parameters. They observed that a PCD tool with a 140° point angle and 20° clearance angle gave the highest cutting performance for machining Cf/SiC ceramic matrix composites compared to other tools. High spindle speed and low feed rate were connected to rapid tool wear and chipping around the chisel edge while cutting these materials. Zhong et al. [29] created a model to evaluate TiAlN-coated and uncoated tools for the quality and accuracy of drilling CFRP/Al/CFRP co-cured materials. They devised a three-dimensional drilling framework to examine a drilling procedure, including the inhomogeneous behavior of the materials. Saravanakumar et al. [30] reinforced the AA2219 alloy with graphite (Gr) and molybdenum disulfide (MoS2) to manufacture composites using traditional casting procedures. They tested the drilling behavior of these composites on a CNC machining machine, assessing the surface roughness of the holes. The trials, developed using the complete factorial technique, demonstrated that Gr-reinforced composites exhibited improved drilling performance compared to MoS2-reinforced AA2219 composites. The exterior roughness of the drilled holes rose with feed rate but reduced with higher speed, indicating that higher speed with low feed generated a more desirable finish.
Giasin et al. [31] developed a 3D finite element model to investigate the machinability of thin GLARE laminate (2.5 mm). It was reported that drilling tests were conducted to determine the effects of feed rate and spindle speed on cutting forces and hole quality. The quality of the drilled holes was evaluated by entry and exit burr formations, surface roughness, divergence of hole size, circularity error, and delamination caused by CT scans and SEM methods. The importance of these FE models lies in their nature of being virtual tools to simulate the reaction of GLARE machining; therefore, they are helpful during the selection of optimal cutting settings. Further improvements involve thermo-mechanical coupling effects arising between the cutting tool and the workpiece. To simulate the drilling process, Li and Xu [32] constructed a simplified simulation of the cutting process according to the actual cutting process and coupled this with the Johnson–Cook material constitutive equation. They researched the effect of tool diameter, drilling speed, feed rate, and tooltip angle on the axial force and moment of twist drill by orthogonal experiment analysis. Comparison was made of results from empirical formulae with the simulations, thus verifying that the empirical formula was correct; hence, forming a basis for real processing.
In the current study, a cutting model based on the material model of the Johnson–Cook constitutive equation is constructed, and a 3D FE model with a Lagrangian kinematic frame is used to simulate the actual drilling process to predict the cutting forces, the distribution of stresses, energy consumption, and strain distributions. The primary contribution of this study is the establishment of the drilling model of FGM using the ABAQUS software package to show some drilling parameters, such as rotating speed and feed rate. The simulation results can be used to optimize drilling parameters and improve the efficiency of FGM drilling. This study provides a valuable tool for further research on FGM drilling and its applications in various industries.
2. The Workpiece Mesh and the Solving Method
The whole tool is modeled as a rigid Lagrangian body of a total length of 100 mm and 20 mm in diameter. The drill rotates with another range of angular speed and feed rate. The tool was modeled using element type C3D8TR. The graded material geometries are modeled as the deformable method in the Lagrangian part and meshed with element types C3D8RT to enable material flow and mesh removal. Hexagonal elements are available in the workpiece and drill that can minimize the time-cost and obtain accurate results. The total number of elements and nodes of the workpiece are dependent on workpiece geometry as shown in Table 1. The graded material mesh is generated by the bottom-up mesh method with 11 layers and a total 11 mm thickness as shown in Figure 1. The thermal boundary condition assumes 90% of the friction is converted into heat from which 80% flows into the graded material, and the ambient temperature is set at 20 °C. The present work considers thermal exchange among the drill, workpiece, and backing plate with air. The workpiece has been fixed from the bottom layer; loads are applied at the reference point representing the tool. The model would be solved by an explicit dynamic-temperature solver while adopting the conventional wall function with a no-slip shear condition. It sets the convergence index to a proportional residual value of 1 × 10⁻⁸. To obtain good convergence efficiency, it is necessary to use shorter time intervals. However, it is vital to ensure that the computational power required for the simulation is kept within acceptable boundaries. A time step of 1 × 10⁻⁴ s will be defined, which meets the Courant–Friedrichs-–Lewy condition and the capillary time step limit . Where ∆t is the time step [33], ∆x signifies the computing grid size, and ∆vmax represents the maximum speed velocity in the domain.

Table 1.
The number of elements and nodes dependent on the depth of cut.
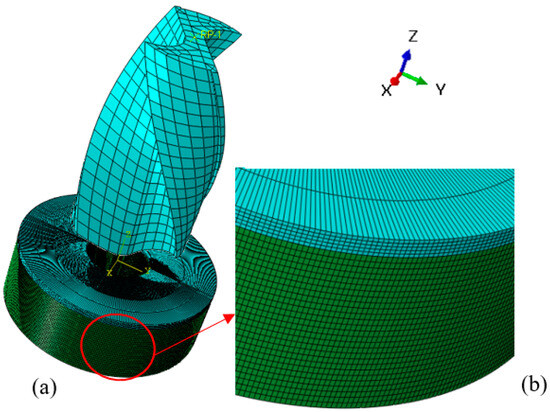
Figure 1.
The 3D mesh: (a) function graded material and drill, (b) hexagonal mesh of workpiece (cross-sectional view).
Furthermore, the analysis included the consideration of mass scaling. This is significant because when the equations are integrated in time using the explicit central difference method, the mass matrix used for the equilibrium equations plays an essential part in both the accuracy and computational efficiency of the model. In addition, due to the dynamic properties of the drilling process and the significance of the natural time scale, it is necessary to consider the rate-dependent properties of the material being worked on.
2.1. Mesh Study
The provided Table 2 illustrates a mesh dependency study focusing on how the number of nodes and elements in a finite element analysis (FEA) model influences the calculated stress values (in MPa). As the number of nodes and components rises, the stress results show a gradual shift, illustrating the mesh refinement’s influence on the stress calculations’ accuracy.

Table 2.
The number of elements and nodes dependent on the 2 mm depth of cut.
For instance, with 704,828 nodes and 340,497 elements, the stress equals 1090 MPa. As the mesh grows finer, with 960,254 nodes and 463,891 elements, the stress climbs to 1112 MPa. Further refinements to 1,037,009 nodes and 500,971 elements resulted in a stress of 1118 MPa. Finally, with the finest mesh of 2,341,620 nodes and 537,600 elements, the stress value approaches 1121 MPa. This progressive rise in stress levels with smaller meshes demonstrates that the solution converges towards a more accurate result, eliminating numerical errors and increasing the simulation’s dependability. This research highlights the need for a mesh dependency analysis to guarantee that the results of an FEA are not considerably impacted by the discretization of the model but rather represent the genuine physical behavior of the structure under examination.
2.2. Basic Assumptions
In the normal metal drilling process, the quality of the drilled hole is affected by many factors. Therefore, the drilling model needs to be simplified based on actual processing. Therefore, we will construct orthogonal drilling, and the dynamically displayed finite element model makes the following assumptions:
- (1)
- The influence of the bending, chattering, and vibration of the machine body on the drilling process during the drilling simulation process can be neglected;
- (2)
- There is a good alignment between the drill bit and the workpiece, and there will be no offset;
- (3)
- The drill bit is regarded as a rigid body, and the wear of the drill bit is not considered.
2.3. Constitutive Model and Physical Parameters of Workpiece Material
The aluminum–steel alloy has been selected in this article because of its advantages including high strength, easy processing, good wear, corrosion, and oxidation resistance. Johnson–Cook model (1) [34] is one of the most popular models that can be used to represent the deformation in a wide range of ductile materials. The equation of Johnson and Cook was deduced in the nineteen-eighties, and it is very simple. It consists of three different parts. The first describes the strain and stress relationship; the second represents the relationship between strain rate and stress; and the last one connects the temperature effect on stress during the plastic process.
where is the equivalent stress, and B is the equivalent plastic strain. The material constants are A, B, n, C, and m. A is the yield stress of the material under standard conditions, B is the strain hardening constant, n is the strain hardening coefficient, C is the strengthening coefficient of strain rate, and m is the thermal exponent effect on stress. The mechanical and thermal properties of AA6061-T6 and steel AISI 1045 are shown in Table 3 and Table 4, respectively, and the Johnson–Cook parameters are shown in Table 5.

Table 3.
Temperature-dependent material properties of Al 6061-T6 [35].

Table 4.
Temperature-dependent material properties of AISI 1045 [36].

Table 5.
Johnson–Cook constants for Al 6061-T6 and AISI 1045 [37,38].
The contact between the workpiece and tool is represented by Coulomb’s law of friction with µ = 0.3. The contact of the model was defined with “ALL* with self” which allows automatic contact detection for every single node. To show the deformation in the mesh, a nodal-to-surface contact has been implied and both normal and tangential force are considered.
3. E-FGM Model
In the E-FGM model, the variations of material characteristics such as density, elasticity, thermal conductivity, or other mechanical or physical properties are characterized by an exponential formula. Similar to other functionally graded material models, the E-FGM model shows a gradual change in material properties. However, in this specific model, the rate of change reduces exponentially with increasing distance from a reference point. One notable advantage of using E-FGMs with exponential property changes is their capacity to reduce thermal stressors. By smoothly transitioning material characteristics, temperature gradients across the material can be minimized, minimizing the possibility of thermal stress-induced failures. Methods such as additive manufacturing, powder metallurgy, or chemical vapor deposition may be applied to create components exhibiting exponential property variations. Despite the potential advantages, challenges remain in effectively describing, predicting, and producing E-FGMs based on exponential property variations, as shown in Figure 2. Future research intends to solve these problems and investigate new applications and material combinations to improve performance. Many researchers have described the FGM using the exponential function equation as follows [39]:
where , are the Young’s modulus of aluminum and steel, respectively, and h is the plate’s total thickness.
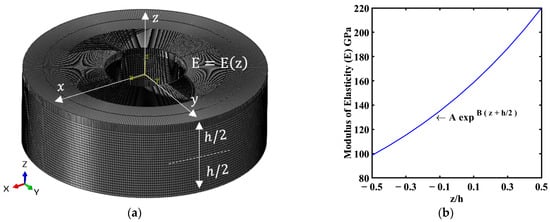
Figure 2.
FGM using the exponential function equation. (a) FGM orientation. (b) Exponential distribution for Young’s modulus.
4. Cutting Parameters
The quality of surface finish has a considerable impact on the performance, durability, and quality of machined parts in many industries, including graded materials. To achieve the desired surface finish characteristics, it is necessary to optimize cutting parameters such as cutting speed, feed rate, and depth of cut. This study shows a scenario where the Taguchi approach is utilized to optimize cutting parameters in a machining process to enhance the quality of the surface finish. The Taguchi array is employed for experimental design, considering three parameters, each with four levels, as shown in Table 6.

Table 6.
Cutting parameters by Taguchi approach.
5. Results and Discussion
This section reports the results obtained for the drilling of function-graded material followed by a statistical analysis of the experimental results to discuss the interaction effect of the examined parameters on both responses.
5.1. Cutting Forces
In Figure 3, the cutting forces are shown at various feed rates (f) and depths of cut (t) in detail. This shows how these factors have a big impact on the machining process. Each subplot (a, b, c, d) depicts various combinations of feed rates and depths of cut, demonstrating the usual pattern of the cutting force: a quick increase at the beginning of the cutting process, followed by a peak, and then a slow decrease. In subplot (a), the cutting force reaches its maximum value of around 4500 N when the greatest feed rate and depth of cut are used (f = 4 mm·s−1, t = 5 mm). Conversely, the smallest peak force is recorded when the smallest feed rate and depth of cut are used (f = 1 mm·s−1, t = 3 mm). Subplot (b) exhibits a similar pattern, whereby the maximum peak force (~4000 N) is seen at f = 4 mm·s−1 and t = 4 mm, while the minimum force is observed at f = 1 mm·s−1 and t = 3 mm. In subplot (c), the peak force reaches its maximum value of around 3500 N when the values of f and t are 2 mm·s−1 and 5 mm, respectively. Conversely, the lowest peak force is recorded when f = 1 mm·s−1 and t = 4 mm. In subplot (d), it is seen that the maximum force peak, reaching about 3000 N, is obtained when the values of f and t are 1 mm·s−1 and 5 mm, respectively. Conversely, the lowest force is observed when f and t are 4 mm·s−1 and 2 mm, respectively.
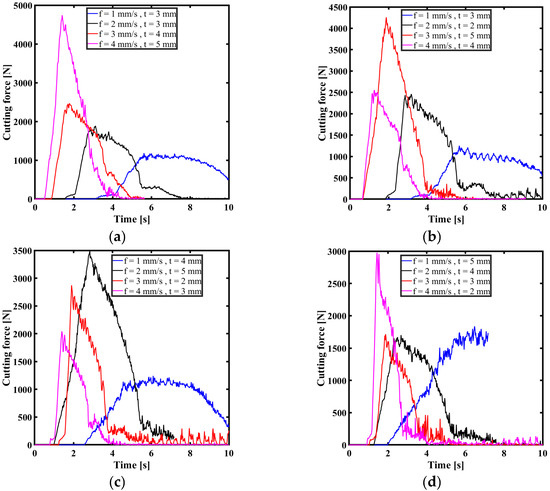
Figure 3.
The effect of rotating speed on cutting force: (a) 400 rpm ; (b) 500 rpm; (c) 600 rpm; (d) 700 rpm.
This research highlights that the interaction between cutting parameters significantly impacts cutting forces, indicating the need for accurate management of these parameters to achieve a balance between efficiency and heat generation in drilling operations. The results indicate that changes in feed rate, cutting speed, and material thickness can result in significant disparities in cutting forces, which subsequently impact tool deterioration, surface quality, and thermal conditions. Optimizing these parameters is essential for improving the efficiency of the machining process and reducing excessive heat generation. The initial increase in force results from the tool’s interaction with the material, followed by a period of stability when the force decreases, indicating a consistent cutting process. Understanding this behavior is critical when evaluating tool life and workpiece quality, as elevated and unpredictable forces may result in tool failure and inferior surface polish. The research underlines the need to choose the right feed rate and depth of cut to achieve maximum machining performance, which is vital for expanders who want to improve productivity and minimize costs. By evaluating these cutting force profiles, it becomes obvious that careful optimization of cutting parameters may greatly increase tool performance and workpiece quality, offering useful insights for improving the machining operations of FGM alloy.
5.2. Strain Energy
Figure 4 depicts the variance of strain energy over the drilling period under a range of feed rates (f) and depths of cut (t), revealing insights into the mechanical behavior of the material under varied cutting scenarios. Each subplot (a, b, c, d) displays how the strain energy grows over time for distinct pairings of feed rates and depths of cut, illustrating the influence of these factors on the energy absorbed by the material during the cutting process. In subplot (a), the strain energy rises sharply at the start of the cutting process, reaching a peak before gradually decreasing. The largest strain energy (~9 J) is obtained for the highest feed rate and depth of cut (f = 4 mm·s−1, t = 5 mm), suggesting considerable material deformation and energy absorption, while the least energy was found for f = 1 mm·s−1 and t = 3 mm, reflecting less deformation and lower energy absorption. In subplot (b), similar tendencies are observed with a quick rise and peak in strain energy followed by a fall. The largest strain energy (~8 J) is recorded for f = 3 mm·s−1 and t = 5 mm, while the lowest is for f = 1 mm·s−1 and t = 3 mm. The largest strain energy (~8 J) is recorded for f = 3 mm·s−1 and t = 5 mm, while the lowest is for f = 1 mm·s−1 and t = 3 mm, underscoring the impact of the interaction between cutting parameters to determining the strain energy. Subplot (c) indicates a peak strain energy (~7 J) for f = 2 mm·s−1 and t = 5 mm, with a subsequent fall. The lowest strain energy is found at f = 1 mm and t = 4 mm, further. In subplot (d), the largest strain energy (~7 J) is seen for f = 1 mm·s−1 and t = 5 mm, with the lowest strain energy for f = 4 mm·s−1 and t = 2 mm.
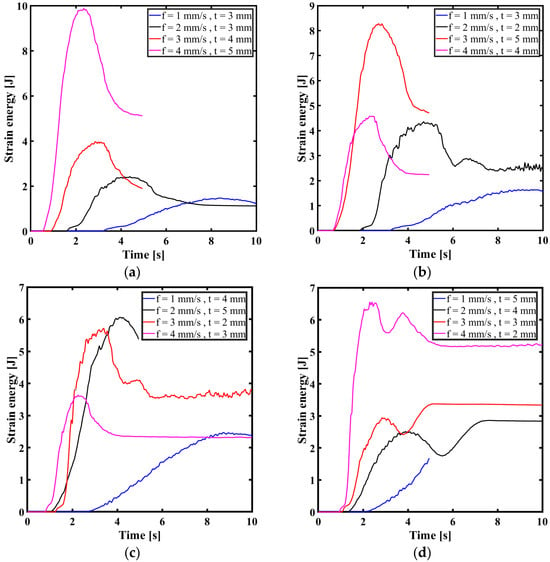
Figure 4.
Values of strain energy at different cutting parameters at (a) 400 rpm; (b) 500 rpm; (c) 600 rpm; and (d) 700 rpm.
The examination across the subplots demonstrates that the feed rates and depths of cut often lead to significant variations in strain energy. This strain energy may be attributed to the mechanical effort necessary to remove more material and the greater resistance experienced by the cutting tool. The stability of strain energy after reaching a peak, generally observed throughout the subplots, demonstrates the material’s reaction to the cutting operation, going from an early period of high deformation energy to a steady condition as the tool passes through the material. This stabilization phase is critical for understanding the steady-state behavior of the material and the tool’s performance, offering insights into improving cutting settings to balance efficiency and tool wear. High strain energy levels correspond to increased tool wear and possible damage, necessitating adjusted cutting settings to strike a balance between machining efficiency and tool life. Lower strain energy levels signify lower resistance and smoother cutting conditions, which is important for keeping tool life and maintaining high-quality surface finishes. Understanding strain energy changes is critical for improving machining operations because it directly affects tool wear, material behavior, and energy efficiency. Manufacturers can use these data to determine optimum feed rates and depths of cut to increase productivity while reducing tool wear and energy consumption, thus increasing total machining efficiency. The comparative examination of strain energy under various machining settings provides useful information for manufacturers looking to improve their machining operations, gain better tool performance, and increase the quality of their machined products. By optimizing the feed rate and depth of cut, it is possible to greatly enhance the efficiency and cost-effectiveness of machining processes.
5.3. Frictional Dissipation Energy
Figure 5 shows the impact of machining variables on frictional dissipation energy during the drilling of the proposed FGM. Frictional dissipation energy, frictional energy, or frictional heat refers to the energy converted into heat because of frictional forces acting between two surfaces in contact and sliding relative to each other. When two surfaces move against each other during machining or any other mechanical process, the interaction between them generates friction, which opposes the motion and converts mechanical energy into thermal energy. In particular, as shown the frictional dissipation energy increases with increasing depth of cut at different values of rotating speed. At low rotating speeds, feed has a greater impact on frictional dissipation energy at high speeds. Frictional dissipation energy increases with increasing depth of cut and rotating speed due to several factors such as increased contact area; as the depth of cut increases, more material is in contact with the cutting tool. This larger contact area results in increased frictional forces between the tool and the workpiece, leading to higher frictional dissipation energy. The greater the depth of cut, the more material is being sheared, which increases the overall frictional heat generated. Also, increasing the depth of cut typically results in higher cutting forces.
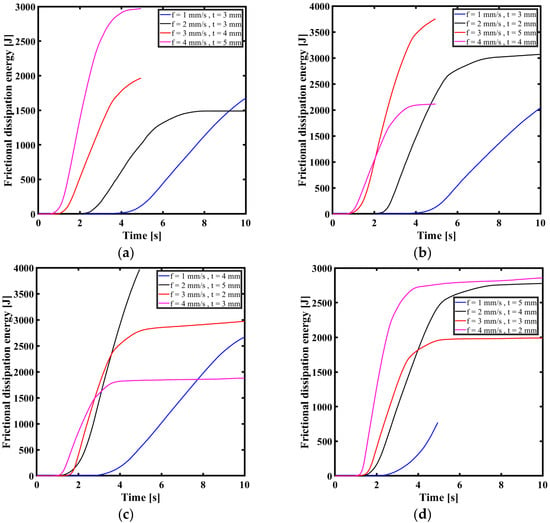
Figure 5.
Frictional dissipation energy: (a) 400 rpm ; (b) 500 rpm; (c) 600 rpm; (d) 700 rpm.
These increased forces require more energy to overcome friction and shear the material, leading to higher frictional dissipation energy. Additionally, higher rotating speeds can exacerbate this effect, as more material is removed per unit of time, requiring greater energy to overcome the increased frictional forces. At higher rotating speeds, there is less time for heat to dissipate away from the cutting zone. This results in more heat being generated due to friction, contributing to increased frictional dissipation energy.
5.4. Taguchi Analysis
The combination of higher depth of cut and rotating speed results in a more intense cutting action, leading to greater heat generation. Regarding the impact of feed rate at different rotating speeds, at low rotating speeds, feed rate has a greater impact on frictional dissipation energy. This is because lower rotating speeds result in longer contact times between the cutting tool and the workpiece. As a result, the feed rate, which determines the relative velocity between the tool and the workpiece, plays a more significant role in determining the frictional dissipation energy. At high rotating speeds, however, the impact of feed rate on frictional dissipation energy diminishes compared to the impact of rotating speed. This is because at higher speeds, the cutting action is more rapid, and the time spent in contact between the tool and the workpiece is shorter. As a result, the rotating speed becomes the dominant factor influencing frictional dissipation energy. In summary, frictional dissipation energy increases with increasing depth of cut and rotating speed due to increased contact area, cutting forces, and heat generation. The impact of feed rate on frictional dissipation energy is more significant at low rotating speeds, while the rotating speed becomes the dominant factor at higher speeds. The interaction plots for the machining parameters of drilling FGMs are given in Figure 6.
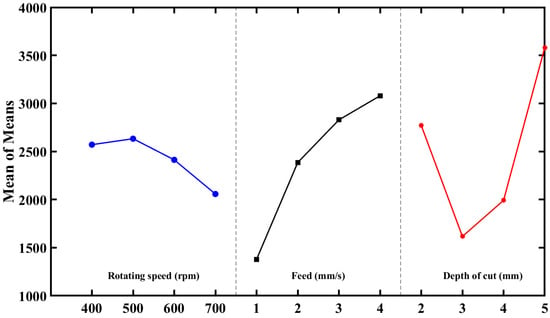
Figure 6.
Effect of rotating speed, feed rate, and depth of cut on mean cutting force in the drilling process.
The average cutting force decreases from 2600 to 2000 with the increase in rotating speed from 400 to 700 rpm. This is often seen in machining processes where higher speeds can result in smoother finishes. When the feed (f) increases from 1 to 4 mm/rev, the average out-of-cutting force decreases from 3100 to 1400 N. This suggests that a lower feed rate results in slightly better cutting force. The depth of cut (d) decreases in cutting force from 3600 to 1400 N when it decreases from 5 to 3 mm·s−1. In the Taguchi analysis, the smaller-the-better signal-to-noise ratio was chosen to measure the performance characteristics levels against parameter factors and then determine the best machining parameters value. The signal-to-noise ratio (S/N ratio) is a measure of the desirable signal compared to the undesired random noise, and it indicates the quality of the experimental data.
Typically, an investigation of the S/N ratio involves three groups of performance characteristics: those that are better when they are lower, those that are better when they are higher, and those that are better when they are at a nominal level. This study aimed to minimize the cutting force, i.e., the lower the better is applied [40]. The signal-to-noise (S/N) ratios of the cutting force are derived from the simulation results. These ratios are used to determine the optimal level of each variable. Figure 7 depicts the graphs of the signal-to-noise ratios and displays the signal-to-noise ratios of the factors at each level. With various values of the signal-to-noise ratio (S/N) ranging from the highest to the lowest, it was determined that the most favorable cutting circumstances to minimize cutting forces were achieved at a cutting speed of 400 rpm, a feed rate of 1 mm·s−1, and a depth of cut of 3 mm.
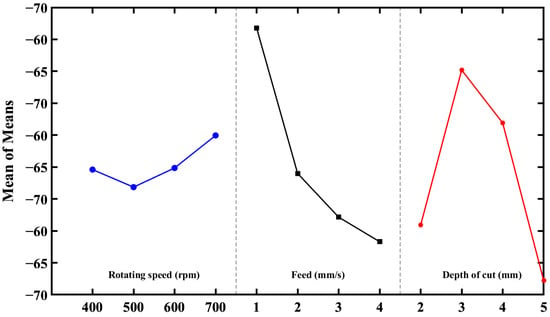
Figure 7.
Analysis of signal-to-noise (S/N) ratio of cutting force in drilling of FGM: Effects of rotating speed, feed rate, and depth of cut.
The improvement in the drilling process with increasing cutting speed is significant. This suggests that higher cutting speeds result in smoother and more precise machined surfaces. The depth of cut shows a clear significant correlation with cutting force in this data set. The interaction graphic for force depicts the relationship between rotation speed (rpm), feed (mm), depth of cut (mm), and the cutting forces during drilling. The figure is split into nine panels, each displaying the interaction between two of the variables, while the third is maintained constant. In the top row, the panels illustrate the influence of rotating speed at varied feed rates and depth of cut as shown in Figure 8. It is noticed that the cutting force rises with an increase in rotation speed, especially at higher feed rates (3 and 4 mm). In the center row, the panels demonstrate the influence of feed rate at various rotating speeds (400, 500, 600, and 700 rpm), revealing that the cutting force typically rises with feed rate, with a more apparent effect at higher rotating speeds.
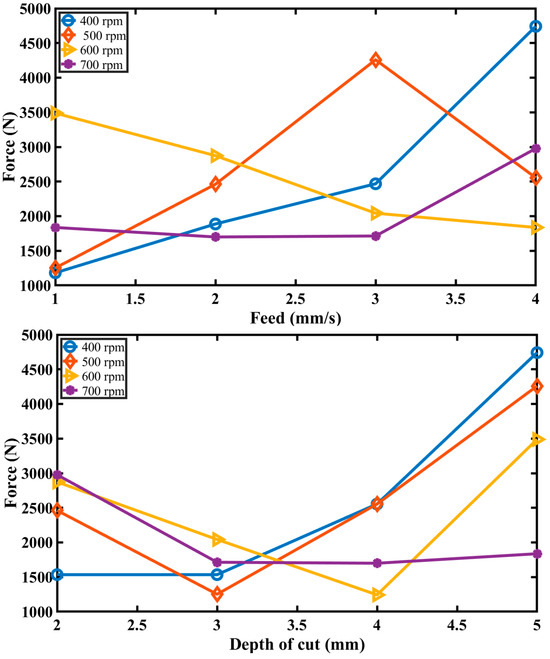
Figure 8.
Interaction plot for cutting forces: Influence of feed rate and depth of cut at various rotating speeds in drilling process.
The bottom row demonstrates the impact of cut depth at different feed rates. Here, the cutting force rises dramatically with the depth of cut, particularly at higher feed rates (3 and 4 mm·s−1), and this tendency is continuous across various rotation speeds. The interaction figure underlines the complex relationship between rotation speed, feed rate, and depth of cut, demonstrating that higher values of these parameters often lead to larger cutting pressures, which may affect tool wear and machining efficiency. This study is critical for optimizing machining settings to balance productivity and tool life, guaranteeing effective and efficient machining operations.
5.5. Stress Distributions
Figure 9, Figure 10, Figure 11 and Figure 12 collectively present a detailed comparative analysis of the stress distribution and chip formation with different combinations of feed rate, thickness, and rotational speed, using the von Mises stress criterion to predict material yield. Figure 9 shows that the core portion of the workpiece has a higher stress concentration, with peak stress values indicating possible zones of material failure. The stress is extremely localized, implying that under these conditions, the material would incur severe strain, leading to collapse and removal. By raising the feed rate to 2 mm/s while keeping the thickness at 5 mm and rotating the speed to 500 rpm, the results reveal a more uniformly distributed stress distribution, as shown in Figure 10. The peak stress values are lower, and the stress concentration zones are less apparent. This shows that raising the feed rate helps to disperse the stresses more evenly over the component, potentially reducing the chance of localized failure. After lowering the thickness to 3 mm, the feed rate remains constant at 2 mm·s−1. The stress distribution becomes more localized again, as shown in Figure 11, although the total maximum stress levels are lower than in the previous configurations. This illustrates that changing the thickness alters the mechanical behavior of the component, resulting in variable stress concentration patterns. Thinner components tend to exhibit greater localized stresses due to the limited material volume required to absorb the applied pressures.
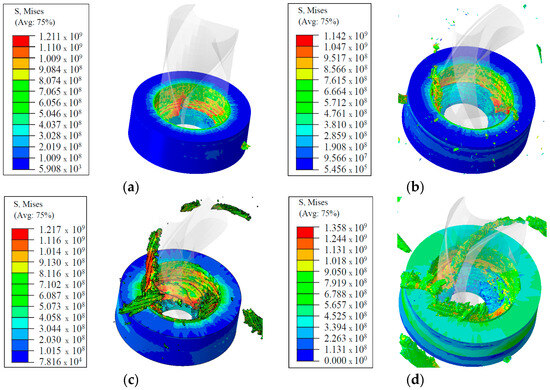
Figure 9.
The stress distribtion with rotating speed 400 rpm: (a) f = 1 mm·s−1, t = 2 mm; (b) f = 2 mm·s−1, t = 3 mm; (c) f = 3 mm·s−1, t = 4 mm; (d) f = 4 mm·s−1, t = 5 mm.
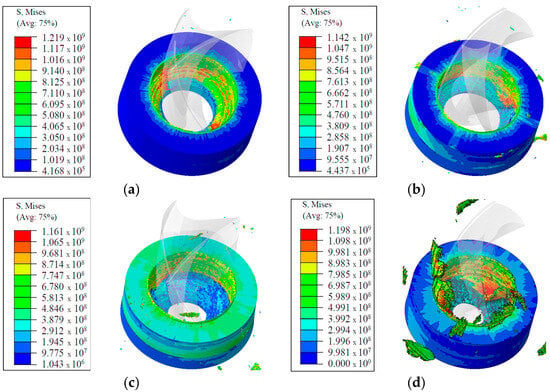
Figure 10.
The stress distribution with rotating speed 500 rpm: (a) f = 1 mm·s−1, t = 3 mm; (b) f = 2 mm·s−1, t = 2 mm; (c) f = 3 mm·s−1, t = 5 mm; (d) f = 4 mm·s−1, t = 4 mm.
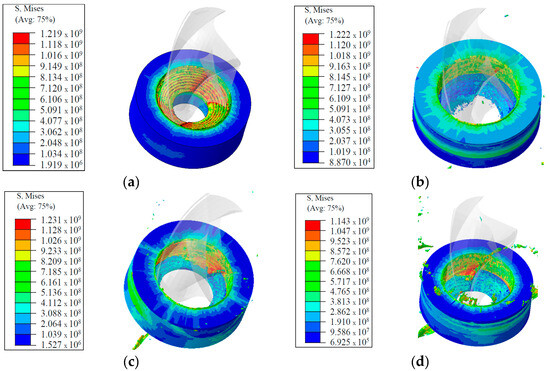
Figure 11.
The stress distribution with rotating speed 600 rpm: (a) f = 1 mm·s−1, t = 4 mm; (b) f =2 mm·s−1, t = 5 mm; (c) f = 3 mm·s−1, t = 2 mm; (d) f = 4 mm·s−1, t = 3 mm.
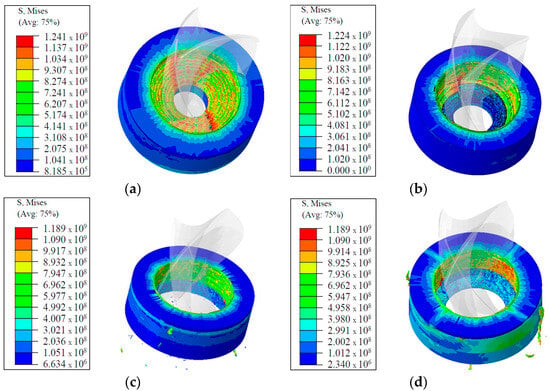
Figure 12.
The stress distribution with rotating speed 700 rpm: (a) f = 1 mm·s−1, t = 5 mm; (b) f =2 mm·s−1, t = 4 mm; (c) f = 3 mm·s−1, t = 3 mm; (d) f = 4 mm·s−1, t = 2 mm.
The comparative analysis of these statistics offers numerous crucial insights into the link between feed rate, thickness, and stress distribution. As the feed rate rises from 1 mm/s to 4 mm/s and the thickness drops from 5 mm to 2 mm, the stress distribution inside the rotating component becomes increasingly uniform, and the maximum stress values fall. This tendency shows that greater feed rates and thinner materials may increase the component’s capacity to transfer stress more uniformly, thereby enhancing its overall durability and minimizing the chance of localized material failure. By understanding how varying feed rates and thicknesses affect stress distribution, engineers may make educated judgments to balance material utilization and mechanical performance. Higher feed rates may be advantageous for minimizing peak stress values, while suitable thickness selection can help regulate the overall stress distribution. These results show the need for parameter optimization in mechanical design to obtain desired performance outcomes and assure the dependability and lifetime of equipment.
6. Conclusions
Manufacturers aspire to provide high-value, efficient products at affordable prices. This research evaluated the influence of cutting parameters in turning operations using a global-level analysis of eleven 1 mm layers. Utilizing ABAQUS 2023® software, the model includes the Lagrangian domain’s kinematic framework and Johnson–Cook constitutive equation to estimate cutting forces, stress, and strain distributions. The algorithm properly estimates these characteristics and may improve cutting settings for better efficiency. However, additional study is required to verify the model with actual aluminum FGMs, since findings may differ depending on material qualities, machine tools, and measuring methodologies. Optimizing machining settings for each application is critical to reaching specified standards. The results of the current research can be summarized as follows:
1. Strain energies with time at different feed rates and depths of cut when the rotating speeds are 400, 500, 600, and 700 rpm. It can be also noticed that the higher feed rate and depth of cut have always given higher strain energies; these are in the region of about 10 J when the rotating speed is 400 rpm and fall to about 7 J when the rotating speed is 700 rpm. In most cases, increased rotational speed will decrease the strain energy. That means the adjustable cutting parameters require tuning to keep a proper balance between reduced strain energy and improved tool performance if effective drilling operations are to be conducted.
2. The frictional dissipation energy with time for different feed rates and depths of cut at rotating speeds of 400, 500, 600, and 700 rpm. Increased feed rates and cut depths result in more frictional dissipation energy. At 400 rpm, the energy peaks at about 3000 J, whereas at 500 rpm, it reaches roughly 4000 J. The maxima at 600 and 700 rpm are roughly 3500 J and 3000 J, respectively. Increasing rotational speed often increases frictional dissipation energy, underscoring the importance of adjusting these parameters to optimize drilling operations.
3. The Taguchi analysis indicates that, for turning EN31 steel, the optimal conditions for minimizing cutting force and maximizing performance concerning considered cutting parameters are the conditions produced by a rotational speed of 700 rpm with a feed rate of 1 mm/s and a depth of cut of 3 mm. It is seen that the increased values of cutting force depend highly on the variation in feed rate and depth of cut, but only marginally on rotation speed. For example, for a feed rate of 4 mm/s and a depth of cut of 5 mm, the cutting force has a peak of around 4500 N, while at a feed rate of 1 mm/s and a depth of cut of 3 mm, this force peaks at about 1000 N. These data show that feed rate and depth of cut are the most critical factors for drilling success, thus validating the ideal parameters developed.
Author Contributions
A.M.G.: Conceptualization, Data curation, Funding acquisition, Methodology, Project administration, Resources, Supervision, Writing—review and editing, A.A.E.: Formal analysis, Software, Validation, Visualization, Writing—original draft, Writing—review and editing, Data curation. M.A.A.: Conceptualization, Writing—review and editing, Formal analysis, Investigation. All authors have read and agreed to the published version of the manuscript.
Funding
This research was funded by [Prince Sattam bin Abdulaziz University] grant number [PSAU/2023/01/25889] and The APC was funded by [Prince Sattam bin Abdulaziz University].
Data Availability Statement
Data will be made available upon reasonable request.
Acknowledgments
The authors extend their appreciation to Prince Sattam bin Abdulaziz University for funding this research work under grant number (PSAU/2023/01/25889).
Conflicts of Interest
The authors declare that they have no known competing financial interests or personal relationships that could have appeared to influence the work reported in this paper.
References
- Gupta, A.; Talha, M. Recent development in modeling and analysis of functionally graded materials and structures. Prog. Aerosp. Sci. 2015, 79, 1–14. [Google Scholar] [CrossRef]
- Mahdavinejad, R.A.; Khajeafzali, M. Fabrication and experimental investigation of arc erosion behavior in W/Cu functionally graded composites. Proc. Inst. Mech. Eng. Part B 2021, 235, 394–405. [Google Scholar] [CrossRef]
- Choy, S.Y.; Sun, C.-N.; Leong, K.F.; Wei, J. Compressive properties of functionally graded lattice structures manufactured by selective laser melting. Mater. Des. 2017, 131, 112–120. [Google Scholar] [CrossRef]
- Dandekar, C.R.; Shin, Y.C. Modeling of machining of composite materials: A review. Int. J. Mach. Tools Manuf. 2012, 57, 102–121. [Google Scholar] [CrossRef]
- Karataş, M.A.; Gökkaya, H. A review on machinability of carbon fiber reinforced polymer (CFRP) and glass fiber reinforced polymer (GFRP) composite materials. Def. Technol. 2018, 14, 318–326. [Google Scholar] [CrossRef]
- Harris, B. Engineering Composite Materials; The Institute of Materials: London, UK, 1999. [Google Scholar]
- Baker, A.A. Composite Materials for Aircraft Structures; AIAA: Reston, VA, USA, 2004. [Google Scholar]
- Prakash, K.S.; Gopal, P.; Karthik, S. Multi-objective optimization using Taguchi based grey relational analysis in turning of Rock dust reinforced Aluminum MMC. Measurement 2020, 157, 107664. [Google Scholar] [CrossRef]
- Zheng, P.; Liu, D.; Guo, J.; Zhi, Z. A new method for optimizing process parameters of active measurement grinding based on grey target decision making. Proc. Inst. Mech. Eng. Part C 2020, 234, 4645–4658. [Google Scholar] [CrossRef]
- Sahu, A.; Pattanayak, S.; Panda, S. WEDM microdrilling of 316 L stainless steel orthopedic implant. Proc. Inst. Mech. Eng. Part C 2020, 234, 3416–3435. [Google Scholar] [CrossRef]
- Bose, S.; Nandi, T. Statistical and experimental investigation using a novel multi-objective optimization algorithm on a novel titanium hybrid composite developed by lens process. Proc. Inst. Mech. Eng. Part C 2021, 235, 2911–2933. [Google Scholar] [CrossRef]
- Haq, A.N.; Marimuthu, P.; Jeyapaul, R. Multi response optimization of machining parameters of drilling Al/SiC metal matrix composite using grey relational analysis in the Taguchi method. Int. J. Adv. Manuf. Technol. 2008, 37, 250–255. [Google Scholar] [CrossRef]
- Babu, K.V.; Marichamy, S.; Ganesan, P.; Madan, D.; Uthayakumar, M.; Rajan, T. Processing of functionally graded aluminum composite brake disc and machining parameters optimization. Mater. Today Proc. 2020, 21, 563–567. [Google Scholar] [CrossRef]
- Isbilir, O.; Ghassemieh, E. Delamination and wear in drilling of carbon-fiber reinforced plastic composites using multilayer TiAlN/TiN PVD-coated tungsten carbide tools. J. Reinf. Plast. Compos. 2012, 31, 717–727. [Google Scholar] [CrossRef]
- Khashaba, U.; El-Sonbaty, I.; Selmy, A.; Megahed, A. Machinability analysis in drilling woven GFR/epoxy composites: Part I–Effect of machining parameters. Compos. Part A 2010, 41, 391–400. [Google Scholar] [CrossRef]
- Ismail, S.O.; Dhakal, H.N.; Dimla, E.; Popov, I. Recent advances in twist drill design for composite machining: A critical review. Proc. Inst. Mech. Eng. Part B 2017, 231, 2527–2542. [Google Scholar] [CrossRef]
- Basmaci, G.; Yoruk, A.S.; Koklu, U.; Morkavuk, S. Impact of cryogenic condition and drill diameter on drilling performance of CFRP. Appl. Sci. 2017, 7, 667. [Google Scholar] [CrossRef]
- Starost, K.; Njuguna, J. A review on the effect of mechanical drilling on polymer nanocomposites. IOP Conf. Ser. Mater. Sci. Eng. 2014, 64, 012031. [Google Scholar] [CrossRef]
- Kara, F.; Aslantas, K.; Çiçek, A. ANN and multiple regression method-based modelling of cutting forces in orthogonal machining of AISI 316L stainless steel. Neural Comput. Appl. 2015, 26, 237–250. [Google Scholar] [CrossRef]
- Kara, F. Taguchi optimization of surface roughness and flank wear during the turning of DIN 1.2344 tool steel. Mater. Test. 2017, 59, 903–908. [Google Scholar] [CrossRef]
- Kara, F.; Öztürk, B. Comparison and optimization of PVD and CVD method on surface roughness and flank wear in hard-machining of DIN 1.2738 mold steel. Sens. Rev. 2019, 39, 24–33. [Google Scholar] [CrossRef]
- Erkan, Ö.; Işık, B.; Çiçek, A.; Kara, F. Prediction of damage factor in end milling of glass fibre reinforced plastic composites using artificial neural network. Appl. Compos. Mater. 2013, 20, 517–536. [Google Scholar] [CrossRef]
- Kilickap, E. Optimization of cutting parameters on delamination based on Taguchi method during drilling of GFRP composite. Expert Syst. Appl. 2010, 37, 6116–6122. [Google Scholar] [CrossRef]
- Tsao, C.; Hocheng, H. Taguchi analysis of delamination associated with various drill bits in drilling of composite material. Int. J. Mach. Tools Manuf. 2004, 44, 1085–1090. [Google Scholar] [CrossRef]
- Krishnaraj, V.; Prabukarthi, A.; Ramanathan, A.; Elanghovan, N.; Kumar, M.S.; Zitoune, R.; Davim, J. Optimization of machining parameters at high speed drilling of carbon fiber reinforced plastic (CFRP) laminates. Compos. Part B 2012, 43, 1791–1799. [Google Scholar] [CrossRef]
- Singh, A.P.; Sharma, M.; Singh, I. Optimal control of thrust force for delamination-free drilling in glass-fiber-reinforced plastic laminates. Proc. Inst. Mech. Eng. Part B 2017, 231, 2396–2407. [Google Scholar] [CrossRef]
- Soleymani Yazdi, M.; Razfar, M.; Asadnia, M. Modelling of the thrust force of the drilling operation on PA6–nanoclay nanocomposites using particle swarm optimization. Proc. Inst. Mech. Eng. Part B 2011, 225, 1757–1771. [Google Scholar] [CrossRef]
- Zhang, B.; Sui, T.; Lin, B.; Zheng, W.; Li, S.; Fang, S.; Huang, Y.; Feng, Y. Drilling process of Cf/SiC ceramic matrix composites: Cutting force modeling, machining quality and PCD tool wear analysis. J. Mater. Process. Technol. 2022, 304, 117566. [Google Scholar] [CrossRef]
- Zhong, B.; Zou, F.; An, Q.; Chen, M.; Zhang, H.; Xie, C. Experimental study on drilling process of a newly developed CFRP/Al/CFRP co-cured material. J. Manuf. Process. 2022, 75, 476–484. [Google Scholar] [CrossRef]
- Saravanakumar, A.; Sreenivas, P.; Vijaya Kumar, S.; Pradeep Kumar, U.; Rajeshkumar, L. Optimization of drilling process parameters for self-lubricants reinforced aluminium metal matrix composites. Mater. Today Proc. 2022, 52, 1461–1465. [Google Scholar] [CrossRef]
- Giasin, K.; Ayvar-Soberanis, S.; French, T.; Phadnis, V. 3D Finite Element Modelling of Cutting Forces in Drilling Fibre Metal Laminates and Experimental Hole Quality Analysis. Appl. Compos. Mater. 2016, 24, 113–137. [Google Scholar] [CrossRef]
- Li, S.; Xu, K. Parameter optimization of 7050 aluminum alloy drilling based on ABAQUS. J. Phys. Conf. Ser. 2021, 1965, 012094. [Google Scholar] [CrossRef]
- Chen, H.; Qiu, D.; Ren, J.; Wei, H.; Khan, I.U.; Mohamed, A.A.; Yu, Y. Application of CFD to study the flow in a molten salt chlorination furnace. Chem. Eng. Res. Des. 2023, 196, 354–376. [Google Scholar] [CrossRef]
- Hoßfeld, M. A fully coupled thermomechanical 3D model for all phases of friction stir welding. In Proceedings of the 11th International Symposium on Friction Stir Welding, Cambridge, UK, 17–19 May 2016. [Google Scholar]
- Elsherbiny, A.A.; Enab, T.A.; Galal, A.M.; Ghattas, M.S. Effect of Tool Geometry on Friction Stir butt-Welding of AA6061-T6 Alloy: Part 1-Numerical Study. MEJ-Mansoura Eng. J. 2019, 44, 10–15. [Google Scholar] [CrossRef]
- Özel, T.; Zeren, E. Finite element method simulation of machining of AISI 1045 steel with a round edge cutting tool. In Proceedings of the 8th CIRP International Workshop on Modeling of Machining Operations, Chemnitz, Germany, 10–11 May 2005; pp. 533–542. [Google Scholar]
- Chauhan, P.; Jain, R.; Pal, S.K.; Singh, S.B. Modeling of defects in friction stir welding using coupled Eulerian and Lagrangian method. J. Manuf. Process. 2018, 34, 158–166. [Google Scholar] [CrossRef]
- Priest, J.; Ghadbeigi, H.; Avar-Soberanis, S.; Gerardis, S. 3D finite element modelling of drilling: The effect of modelling method. CIRP J. Manuf. Sci. Technol. 2021, 35, 158–168. [Google Scholar] [CrossRef]
- Chi, S.H.; Chung, Y.L. Mechanical behavior of functionally graded material plates under transverse load-Part I: Analysis. Int. J. Solids Struct. 2006, 43, 3657–3674. [Google Scholar] [CrossRef]
- Boy, M.; Ciftci, I.; Gunay, M.; Ozhan, F. Application of the Taguchi method to optimize the cutting conditions in hard turning of a ring bore. Mater. Tehnol. 2015, 49, 765–772. [Google Scholar] [CrossRef]
Disclaimer/Publisher’s Note: The statements, opinions and data contained in all publications are solely those of the individual author(s) and contributor(s) and not of MDPI and/or the editor(s). MDPI and/or the editor(s) disclaim responsibility for any injury to people or property resulting from any ideas, methods, instructions or products referred to in the content. |
© 2024 by the authors. Licensee MDPI, Basel, Switzerland. This article is an open access article distributed under the terms and conditions of the Creative Commons Attribution (CC BY) license (https://creativecommons.org/licenses/by/4.0/).