Article

Tool Wear Monitoring in Micro-Milling Based on Digital Twin Technology with an Extended Kalman Filter

1
Mechanical Engineering Department, Universitas Indonesia, Depok 16424, Jawa Barat, Indonesia
2
School of Mechanical Engineering, Yeungnam University, Gyeongsan 38541, Gyeongbuk, Republic of Korea
*
Author to whom correspondence should be addressed.
Current address: Kampus Baru UI, Depok 16424, Jawa Barat, Indonesia.
J. Manuf. Mater. Process. 2024, 8(3), 108; https://doi.org/10.3390/jmmp8030108
Submission received: 2 April 2024 / Revised: 25 April 2024 / Accepted: 8 May 2024 / Published: 23 May 2024

Abstract

:
In order to avoid catastrophic events that degrade the quality of machined products, such as tool breakage, it is vital to have a prognostic system for monitoring tool wear during the micro-milling process. Despite the long history of the tool wear monitoring field, creating such a system to track, monitor, and foresee the rapid progression of tool wear still needs to be improved in the application of micro-milling. On the other hand, digital twin technology has recently become widely recognized as significant in manufacturing and, notably, within the Industry 4.0 ecosystem. Digital twin technology is considered a potential breakthrough in developing a prognostic tool wear monitoring system, as it enables the tracking, monitoring, and prediction of the dynamics of a twinned object, e.g., a CNC machine tool. However, few works have explored the digital twin technology for tool wear monitoring, particularly in the micro-milling field. This paper presents a novel tool wear monitoring system for micro-milling machining based on digital twin technology and an extended Kalman filter framework. The proposed system provides wear progression notifications to assist the user in making decisions related to the machining process. In an evaluation using four machining datasets of slot micro-milling, the proposed system achieved a maximum error mean of 0.038 mm from the actual wear value. The proposed system brings a promising opportunity to widen the utilization of digital twin technology with the extended Kalman filter framework for seamless data integration for wear monitoring service.

1. Introduction

A steady increase is observed in the demand for sophisticated products that integrate tangible micro-features, including micro-channels, micro-reactors, micro-molds, and micro-nozzles. Micro-machining processes, such as micro-turning, micro-grinding, and micro-milling, are among the options for creating micrometer-sized micro-product features. The products are utilized extensively in microelectromechanical systems (MEMSs), biomedical devices, and surgical instrumentation [1]. Micro-milling is considered the most favorable micro-machining technique for creating micro-products. The technique delivers high precision, notably, when working with high-strength materials [2], and it gives flexibility for an efficient machining process [3]. Micro-milling is a machining technique that involves the removal of material using a downsized milling tool with a diameter of less than 1 mm [4] and a cutting-edge radius of approximately 2 μ m [5]. Micro-milling can produce complex 3D geometries in various materials. However, micro-milling requires tight machining monitoring due to some specific problems. Rapid tool wear [6], premature tool breakage [7], tool deflection [8], tool run-out [9], and plowing [10] are the primary specific problems in micro-milling, and they have a negligible effect on macro-milling as a counterpart. The presence of tool wear has been identified as a significant factor leading to poor results in micro-milling, namely, in terms of low accuracy and surface integrity [11]. Thus, an integral tool condition or wear monitoring (TCM or TWM) system is required to guarantee that the micro-milling operates within the specified permissible conditions. A TWM system is a system that provides information on tool wear progression during the machining process. The wear progression information can be used to notify the machining operator (user), automatic process control, quality control, and other services. The term TCM (tool condition monitoring) is used interchangeably with TWM (tool wear monitoring) in the literature.
On the other hand, digital twin (DT) technology has recently become widely recognized as significant in manufacturing, particularly within the Industry 4.0 ecosystem. DT was defined as “a set of virtual information constructs that fully describes a potential or actual physical manufactured product from the micro atomic level to the macro geometrical level” [12]. The initial idea of the DT is to be able to design, test, manufacture, and use a virtual version of systems. A DT reduces physical system failures, costs, time, and user damage when deployed and in use. For the TWM field, DT technology is considered a potential breakthrough in developing a prognostic TWM system, as it enables the tracking, monitoring, and prediction of tool condition dynamics through the execution of digital twin processes in real time. As a result, the machining operator can identify tool abnormalities using the anticipated tool condition provided by the TWM system. This preventive approach enables the operator to mitigate the likelihood of catastrophic events that could compromise the final micro-product’s quality. Until recently, very limited studies have applied digital twin technology for monitoring tool wear in the micro-milling field.
A TWM-DT system is a system that uses DT technology as the basis to provide information on tool wear progression during the machining process. Several prior studies in the literature specifically discuss the use of DT technology to address the TWM problem, primarily in general machining [13,14,15]. Qiao et al. developed a TWM-DT system using Deep Stacked GRU to simulate the underlying tool wear growth [13]. Xie et al. explored a proposed TWM-DT model based on a Long Short-Term Memory (LSTM)–Recurrent Neural Network (RNN) [14]. Xie et al. also presented TWM-DT development focused on modeling, application, and service strategies for a cutting tool [15]. These TWM-DT systems relied heavily on data-driven methods to provide TWM service within a DT application. “Black-box” models that depicted the correlation between sensor data and wear values constituted the model of the physical object. The fundamental concept of a DT, which involves a realistic model and real-time data on physical entities, has been only loosely implemented. These systems are more comparable to general data-driven TWM systems, e.g., the systems proposed by Twardowski et al. [16] and Shen et al. [17], than a DT-based TWM system.
On the other hand, a TWM-DT system has an alternative of making a virtual model of the targeted physical entities by employing long-studied physical laws, e.g., the mechanistic law (model) governing the macro-/micro-milling process. Only a limited number of works have taken advantage of the mechanistic law in developing a model of a DT in the context of TWM-DT development in the micro-milling field. Our prior research works were regarded as an initiative in developing a real physics-driven TWM-DT system for micro-milling. The works contain a formulation of a DT model based on the mechanistic law of micro-milling [18]. The proposed system also used open-source CAD software to visualize the micro-tool motion and compute the material removal rate based on the tool–workpiece immersion volume [19]. More research is required to demonstrate the benefits of DT technology for the TWM issue, particularly in the micro-milling domain.
This paper introduces a tool wear monitoring (TWM) system designed for the micro-milling process, and it utilizes digital twin (DT) technology in conjunction with the Extended Kalman Filter (EKF). This paper also describes the DT model employed in the real-time DT process and the approach to incorporating the EKF-based TWM to provide wear information throughout the machining process. The TWM method was developed based on the EKF, a nonlinear estimation framework with a “predict–update” style appropriate for real-time DT processes. Details of process pipelines are also explained to create a realistic DT for the micro-milling process. Eventually, this paper explains the TWM service that can be delivered using the wear estimate from the EKF-based TWM and standard/normal wear categorization provided by the user. The presentation of this paper is structured in the following manner. Section 1 addresses the importance of TWM, particularly in a micro-milling process. This section also elaborates on the systems proposed in the past related to TWM with future opportunities and new strategies using digital twin technology. Section 2 presents a literature review of DT technology and explains the relation to the needs of TWM. Section 3 presents our formulation for developing the DT model for the micro-milling process. Section 4 shows the details of the EKF-based TWM. This section describes how the EKF seamlessly integrates the data from sensor measurements and virtual micro-milling resources within a DT to produce the wear estimates. Section 5 illustrates an experimental setup for an actual micro-milling process. Section 6 discusses the validation of the DT model and the performance of the proposed EKF-based TWM. The concluding remarks of this research are provided in Section 8.

2. Literature Review

2.1. Digital Twin

In 2002, Michael Grieves introduced the DT concept at the University of Michigan within the context of product lifecycle management (PLM) for the first time. In his later work, DT was defined as “a set of virtual information constructs that fully describes a potential or actual physical manufactured product from the micro atomic level to the macro geometrical level” [12]. The concept model of DT contains three main parts, i.e., physical products, virtual products, and data communication between the virtual and real products [20]. Virtual products comprise comprehensive representations of physical goods that are almost indistinguishable. Historical data of physical products update the state of virtual products through real-time sensor measurements facilitated by data communication. Further, the analysis and simulation of virtual products can be used for various purposes, such as optimization, prediction, and monitoring. The DT concept has been adopted by the National Aeronautics and Space Administration (NASA) in their technology roadmap [21]. In one of their research focuses, NASA used DT models of a component specimen and its microstructure to predict the occurrence of a crack path. These models simulate and reflect the entities’ states and behaviors via modeling and simulation analysis. Additionally, DT provides feedback to predict and control future states and behaviors of the imitated entities [22]. The applications of DTs span aerospace [23], manufacturing [24], and organization operation [25]. Table 1 shows the developments of DTs with a focus on modeling and the targeted applications.

2.2. Digital Twin Modeling

As reviewed by Tao et al. [28], various proposed DT models are sparse across the literature. A digital twin with five dimensions was proposed by Qiao et al. using different data mappings from the physical entity [13]. The Deep Stacked GRU model was utilized as a digital twin model to simulate the underlying tool wear growth. Xie et al. developed a TWM method to calculate prognostic decisions for a physical model based on the twin data uploaded to the cloud [14]. The model was based on a Long Short-Term Memory (LSTM)–Recurrent Neural Network (RNN). Other work related to TWM-DT focused on modeling, application, and service strategies has been reported by Xie et al. [15]. Their work provided a comprehensive life cycle description of the digitalization of cutting tools for the digital twin paradigm. The status of tool wear was determined by integrating cyber models with the digital twin model. More variants of DT modeling can be seen in Table 1.

2.3. Framework of a Tool Wear Monitoring System Based on a Digital Twin

A physics-driven TWM-DT system requires a framework to deliver the targeted information, e.g., the wear value of the tool, by fusing any available information from the DT process and the real-time sensor data acquisition. Sensor fusion techniques developed in the past are the potential framework employed within the TWM-DT system. The Extended Kalman Filter (EKF) from the Bayesian state-estimation family provides a “predict-and-update” style of workflow that is suitable for a physics-driven TWM-DT. Within the EKF workflow, information on the virtual DT resources is used in the estimation and prediction step, while the real-time sensor data contribute to the update step afterward. Several authors have proposed EKF-based TWM methods in the past. Notably, Niaki et al. reported a series of research works in the development of a stochastic TWM system where the KF and EKF were the frameworks for the tool wear monitoring in macro-milling machining [29,30]. However, their works did not consider the implementation of a digital twin for the systems. Their wear (state) propagation used an empirical third-order polynomial function of material removed ( M R ) without simulating the dynamics of machining resources [30]. Research works towards the utilization of the EKF framework in DT applications have recently appeared in several engineering fields, such as those of machine tool monitoring [31], electric drives [32], and vehicle fault diagnosis [33]. Yuan et al. constructed a milling force model to simulate the force signal in a model-driven cyber–physical system (MDCPS). The tool wear monitoring was performed by passing the force estimates from the EKF to a wear model. In their implementation, the EKF-based wear monitoring was loosely integrated. The wear itself was not part of the EKF state space. Furthermore, adding a force sensor is considered an expensive solution for manufacturers. It is unsuitable for micro-milling applications since the force sensor for micro-scale specifications is still highly priced.

3. Digital Twin Modeling of Micro-Milling

DT modeling is a crucial step in clearly defining the core parts required by DT technology before the implementation step in the development of DT applications. As stated earlier, the basic concept of the DT model contains three core parts, i.e., physical products, virtual products, and data communication between the virtual and physical products [20]. Figure 1 depicts the description of the DT model in our work. Physical resources are the physical products inside the micro-milling environment that have a direct relation to the mechanistic aspect of the micro-milling, e.g., micro-milling machine, cutting tool, jig, and workpiece. Virtual resources are the twin, counterpart, or one-to-one mapping of the physical resources in the form of virtual products. In virtual space, each virtual resource is modeled according to its information dimension: geometry, physics, and behavior, as similarly proposed by Tao et al. [34]. Geometry represents the shapes and dimensions of a real physical resource. It is mainly acquired and already available from our virtual environment’s CAD (computer-aided design) files. Physics describes the physical characteristics and properties of the physical resource. Behavior models the dynamic response of the physical resource under external and internal mechanisms. In this work, we focus mainly on the behavior model of the virtual resource. Later, this behavior model is simply called the model. The further presentation of virtual resources discusses only a set of mathematical models representing the dynamics of physical resources.

3.1. Physical Resources

In order to provide prediction and control over the future states and behaviors of physical resources, the digital twin imitates all of the resources in the target application. Most digital-twin-oriented research works in the milling machining domain focus on creating the virtual resources of a CNC (computerized numerical control) machine [27] or a cutting tool [26]. Additionally, some works define the cutting tool as an integral component of the CNC machine model as one entity [35]. The model boundary has been defined to cover only the micro-milling resources directly related to micro-milling’s mechanistic aspect. The model boundary reduces the complexity of the developed DT model.
Modern CNC milling machines are capable of generating five-axis tool motion. Generally, the spindle rotation speed for micro-milling is higher than 20,000 rpm. The spindle motor and axis actuators are connected to the main CNC controller through separate drivers and controllers. The relative motion between the rotating tool and the workpiece during the cutting process creates the dynamics of the micro-milling process, which significantly correlates with the progression of tool wear. The motion is regulated by the machine sub-resources, i.e., spindle motor, spindle controller, and feed-drive controller. The sub-resource dynamics serve as the foundation for developing the model for the micro-milling process. For this work, the workpiece and cutting tool are assumed to have only a geometry model without a physical and behavior model. Their contribution to the micro-milling dynamics is mainly related to triggering the machining events, e.g., initial tool–workpiece contact during material removal. The physical resources of our proposed DT are shown in the upper part of Figure 1.

3.2. Virtual Resources

The material removal is the central event in the micro-milling process. The mechanistic model, a physics-based approach, gives a significant focus on the fundamental mechanics of the cutting process, along with the variables that are linked to it, including the cutting force [36] and torque [37]. Cutting torque refers to the force exerted on the spindle motor shaft. The cutting torque derived from the mechanistic model is further extended when constructing the model of the spindle motor. The relation between the virtual resources describes the DT’s dynamics in the micro-milling process. The DT will have greater information if there are additional sub-models of the spindle motor, but the whole DT model will become more complex due to this effort. The trade-off may be assessed depending on the available resources and the intended applications. Figure 2 describes the interactions between physical–virtual resources and the pipeline of calculating the micro-milling dynamics.

3.2.1. Model of the Spindle Motor

Cutting Torque

According to Altintas et al. [38], the instantaneous cutting force d F t , j ϕ refers to the tangential cutting force, which can be determined by considering the uncut chip thickness u ϕ of the j-th cutting edge, along with the feed per tooth f T and the instantaneous angular position ϕ , as represented by Equations (1) and (2). The cutting torque model is constructed based on Altintas’s cutting force model considering the tool radius r as indicated in Equation (3). Through a series of cutting experiments, the model coefficients (tangential cutting K t c and edge K t e ) are calculated empirically [39].
d F t j ϕ = K t c u ϕ + K t e
u ϕ = f T sin ϕ
d T m j ϕ = K t c f T sin ϕ + K t e c ϕ r
The effective cutting region for slot micro-milling is located on the half-side of the tool cross-section circle, as indicated by Equation (5). The function c ( ϕ ) dictates that the computation is conducted within the practical boundaries of the material removal area. Hence, the average cutting torque per unit depth of cut a for a single cutting tooth may be determined using Equation (6). Equation (7) summarizes the calculation for the total cutting torque T m in slot micro-milling with the number of teeth Z and the depth of the cut a.
d T ¯ m j ϕ = r 2 π 0 2 π c ϕ K t c f T sin ϕ + K t e
c ϕ = 1 f o r 0 < ϕ π 0 f o r π < ϕ 2 π
T ¯ m = r K t c π f T + K t e 2
T m = Z · a · r K t c π f T + K t e 2

Wear Torque

The total average cutting torque is assumed to remain constant throughout the material removal, as expressed in Equation (7). The formulation is a suitable approximation for short-distance machining. Nevertheless, our prior experiments showed a positive correlation between the rise of the total average cutting torque and the machining distance [18]. During the machining operation, the total average cutting torque increases due to a progressive increase in the cutting radius of the worn tool. Therefore, the wear contribution should be addressed in the development of mechanistic models.
Several researchers have considered the tool wear variable in their mechanistic models. Niaki et al. suggested that the wear cutting force can be added to the existing cutting torque formulation by proportionally multiplying a constant C 2 with the tool wear value [40]. Tansel et al. improved the mechanistic models by introducing a multiplier K w to the equation of the cutting force. The multiplier K w is above 1 if the tool is worn [41]. Nevertheless, their models were different from the results of our previous experiments. In our work, the tool wear contribution in the mechanistic model is represented by the wear torque T w , as shown in Equation (8), where T c is the total cutting torque applied to remove the material. The wear torque forms an S-shaped profile as the tool wear progresses during the machining. In the DT’s run time, the wear torque T w is applied only during the material removal. The wear torque coefficients p 0 , p 1 , p 2 , p 3 , p 4 will be decided depending on the experimental data before the digital twin runs.
T c = T m + T w
T w = p 0 ln p 1 V B p 2 p 3 V B + p 4

Motor Dynamics

The mechanical work at the output shaft of the spindle motor is produced by the electromagnetic work exerted by the armature, Equations (10) and (11). The magnetic flux of the spindle armature generates a certain rotational speed ω = d θ / d t in response to the supplied input voltage V. The electrical dynamics of the armature are represented by an RL circuit model based on the armature resistance R and inductance L. Armature rotation also induces a back-EMF (electro-motive force) voltage V e m f in the circuit, resulting in a negative voltage opposite to the supplied voltage. The back-EMF voltage is proportional to the angular speed of the armature (rotor) multiplied by the back-EMF constant K e . The torque exerted at the spindle shaft’s end is proportional to the torque parameter K T multiplied by the armature current i (Equation (12)). During the material removal in the machining process, the effective torque is the difference between the torque T and the cutting torque T c . The parameters J and B represent the armature’s inertia and friction coefficient, respectively.
J d 2 θ d t 2 + B d θ d t = T T c
L d i d t + R i = V K e d θ d t
T = K T i

3.2.2. Model of the Spindle Controller

During the material removal, the cutting torque T c exists as an external disturbance for the spindle motor that eventually reduces the spindle speed. The spindle controller implements a specific speed-control strategy to keep the targeted spindle speed steady under various disturbances. The control strategy uses feedback to compensate for the speed error (discrepancy). The construction of a micro-milling DT model must consider the interaction between the spindle motor and its controller with the existence of cutting torque in a closed-loop system. In this work, the spindle controller uses the PID control strategy to achieve the targeted spindle speed ω r e f . PID control is the most implemented control strategy for various industrial applications, as stated in a review by Borase et al. [42].
The model of the spindle controller is developed based on PID control. The cutting torque T c is compensated based on the amount of speed error e t multiplied by the PID parameters (proportional K p , integral K i , and derivative K d ) to maintain the targeted spindle speed ω r e f . The regulated voltage V triggers the spindle dynamics electrically to adjust the armature current i so that the appropriate spindle torque T is produced. The PID control law is shown in Equations (13) and (14).
V t = K p e t + K i 0 τ e τ d τ + K d d e t d t
e t = ω r e f t ω t

3.3. Machining Events of the Micro-Milling Process

The DT process takes the machining parameters as the inputs to calculate the spindle torque T and current i through the models defined in Equations (1)–(15). In this work, the machining parameters are the feed per tooth f T and the spindle speed ω . The DT process also requires real-time signals from physical resources to process the realistic sequence of actual events. The definition of events follows the standard events in a slot micro-milling process that can be considered as a piecewise unit of more complex micro-milling. In slot micro-milling, a cutting event happens when the rotating tool moves toward the fed workpiece and vice versa, causing the material to be removed. Before and after the full cutting event, the micro-milling experiences starting and ending contact events for a very short time, resulting in a transient profile in the cutting torque. The other non-cutting events include spindle motor on–off events, spindle torque rise–idle events, and feeding on–off events. Figure 3 shows the profile of the torque T experienced by the spindle motor. The torque value fluctuates during the machining process depending on the ongoing event. The interaction between the available signals from the spindle controller, the feed-drive controller, and the physical contact detector are taken into account in Equation (10), resulting in a more realistic formalism, as shown in Equation (15). The spindle φ , feeding ψ , and contact κ signals are defined in Equations (16)–(18), respectively.
J d 2 θ d t 2 + B d θ d t = T T c κ ψ φ
φ = 1 for an on-state spindle 0 for an off-state spindle
ψ = 1 for on-state feeding 0 for off-state feeding
κ = 1 for in-collision   or   V c > 1   μ m 3 0 for else
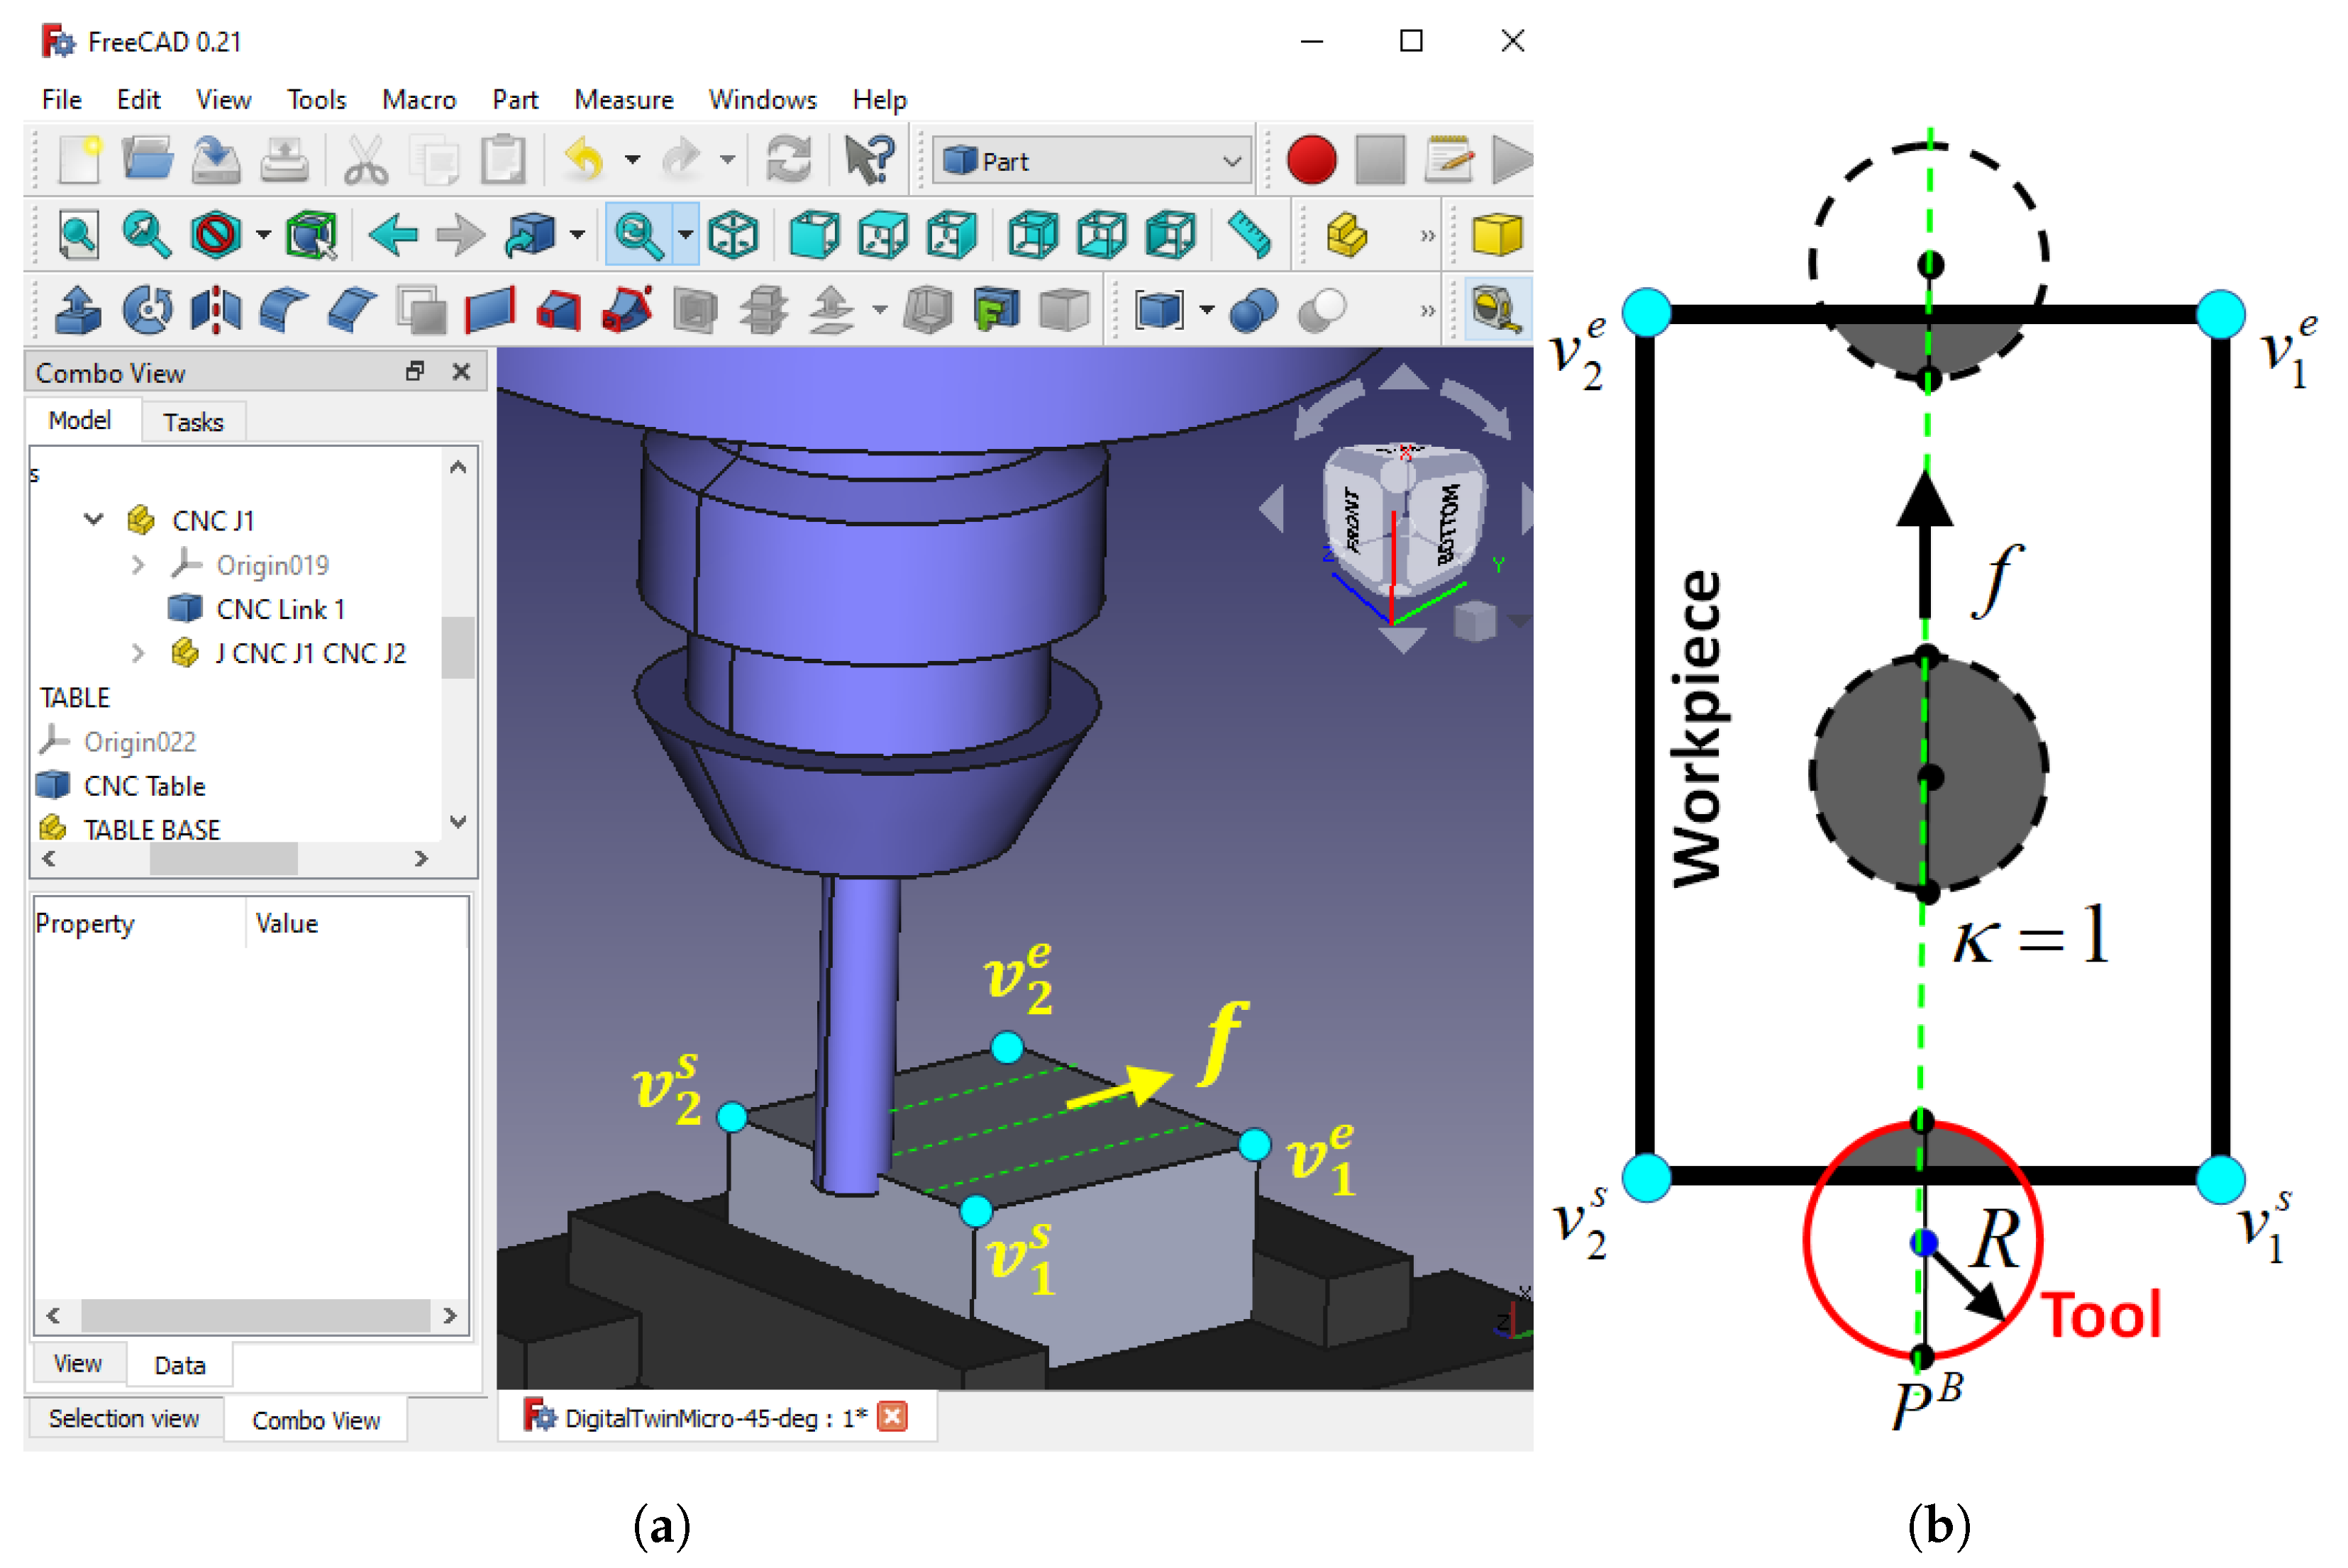
The physical contact detector generates the contact signal κ by monitoring the collision between the 3D virtual models of the tool and workpiece inside an open-source CAD system called FreeCAD [43]. The position of the virtual model inside the FreeCAD virtual environment is updated regularly following the real-time position from the feed-drive controller [19]. The collision volume V c reported by the collision detection module of FreeCAD becomes information for judging whether tool–workpiece contact occurs; see Equation (18) and Figure 4a. For machining with simple workpiece geometry (see Figure 4b), the physical contact detector may use the information of machined surface vertexes (cyan dots) together with the feeding motion direction f . A contact event can be detected by checking whether the tool perimeter (red circle) is inside or outside the machined surface; see Equations (19) and (20). The contact signal κ is generated by evaluating the six cases in Equation (21).
P F = P + r f
P B = P r f
κ = 1 for θ s B > 0.5 π θ s F 0.5 π 1 for θ e B > 0.5 π θ e F 0.5 π 0 for θ s B > 0.5 π θ s F > 0.5 π 0 for θ e B 0.5 π θ e F 0.5 π 1 for θ s B 0.5 π θ s F 0.5 π θ e B > 0.5 π θ e F > 0.5 π 0 for else

4. Tool Wear Monitoring Based on the Extended Kalman Filter

4.1. Framework

The Extended Kalman Filter (EKF) is a nonlinear state estimation technique based on the “predict and update” workflow. EKF-based tool wear monitoring (TWM) aims to estimate the wear state V B at a particular sampling time t. In the prediction step, a nonlinear function g V B t 1 ,   Δ M R t propagates the prior wear state V B t 1 to the predicted wear state V B ^ t based on the increment in the material removed Δ M R t as the driving input. This propagation process has uncertainty v t , which is modeled as a zero-mean normal Gaussian distribution N ( 0 , ϵ p ) with variance ϵ p . The model of the predicted wear state V B ^ t and its uncertainty Σ ^ t at time t are shown in Equation (22) and Equation (23), respectively.
V B ^ t = g V B t 1 , Δ M R t + v t , v t N ( 0 , ϵ p )
Σ ^ t = g V B t 1 Σ t 1 g V B t 1 T + ϵ p
Later, the update step of the EKF performs a corrective action by considering the real-time data of the spindle motor torque T t R e a l . A function h ( V B ^ t ) , as shown in Equation (24), represents the model of the torque measurement (likelihood) T ^ t based on the knowledge on the predicted wear V B ^ t . The uncertainty w t of the measurement model is modeled as a zero-mean normal Gaussian distribution N ( 0 , ϵ u ) with variance ϵ u . Eventually, the final estimate of the wear value V B t is calculated by introducing the innovation ( T t T ^ t ) to the predicted wear state V B ^ t with the Kalman gain K t in Equation (25) as the multiplier. The updated wear state V B t and its uncertainty Σ t are formulated in Equation (26) and Equation (27), respectively. The prediction and update steps are sequentially and recursively executed during the process of tool wear monitoring.
T ^ t = h V B ^ t + w t , w t N ( 0 , ϵ u )
K t = Σ ^ t h V ^ B t T h V ^ B t Σ ^ t h V ^ B t T + ϵ u 1
V B t = V B ^ t + K t T t R e a l T ^ t
Σ t = I K t h V ^ B t Σ ^ t

4.2. Calculation of the Material Removed

The wear state propagation in Equation (22) is driven by the increment in material removed during the machining process. Therefore, the material removed M R at time t is calculated by taking into account the UCT u ϕ information from Equation (2) and the increase in the number of spindle rotations Δ n t from Equation (29), where n t is the number of spindle rotations since the tool rotated for the first time. The volume of accumulated material removed M R t can be calculated by following Equations (28)–(31) with the cutting depth a. The calculation flow can be seen in Figure 2.
h ¯ = 0 π h ϕ = 2 f T
Δ n t = n t n t 1
Δ M R t = 2 f T Δ n t a
M R t = M R t 1 + Δ M R t

4.3. Prediction Step

The propagation of tool wear g V B t 1 ,   Δ M R t takes the form of an s-shaped curve that is segmented into four wear stages, i.e., I. slow initial wear, II. rapid initial wear, III. steady-state wear, and IV. rapid tool wear before failure, as Alhadeff et al. [44] suggested. The discrete logistic function in Equation (32) fits the wear propagation curve based on the material removed Δ M R t as the driving factor (input). q is a tuned parameter representing a fast transition from rapid initial wear to rapid tool wear before failure. V B m a x is the largest possible value of tool wear in the region of rapid tool wear before failure (stage IV). The V B m a x value can be set empirically from the prior experiments or 80% of the tool radius. In order to calculate the uncertainty of prediction step Σ ^ t from Equation (23), the Jacobian g / V B t 1 is calculated in Equation (33).
V B ^ t = V B t 1 + q Δ M R t 1 V B t 1 V B m a x V B t 1
g V B t 1 = 1 + q Δ M R t 1 2 V B t 1 V B m a x

4.4. Update Step

The important role of the update step is to refine the predicted wear value V B ^ t by calculating the innovation based on the real-time data of the spindle motor torque T t R e a l and the torque measurement likelihood T ^ t information, as mentioned in Equation (26). The measurement likelihood T ^ t is acquired from the dynamics of the micro-milling process within virtual DT resources. Among the variables, the motor torque T calculated in Equation (15) becomes the measurement likelihood T ^ t . Then, the Jacobian of the measurement likelihood function h / V ^ B t is calculated based on the Logit function of the wear torque T w , since the dynamics of the motor torque T during the material removal depend greatly on the wear torque T w function. The Jacobian of the measurement likelihood is presented in Equation (34). Eventually, the updated wear value V B t and its covariance Σ t can be calculated by introducing the Kalman gain K t into the innovation. The update step follows Equations (25)–(27).
h V ^ B t = p 0 p 2 V B ^ t p 2 p 3 V B ^ t

5. Experiment

5.1. Experimental Plan

Slot micro-milling was chosen as a representative of more complex micro-milling processes. One session of the experiment consisted of 40 consecutive slot machinings without changing tools. One machining layer consisted of 5 slots. Thus, there were 8 different machining layers with a gap distance of 0.01 mm between layers. The slot design was 1 mm in width, 14 mm in length, and 0.01 mm in depth, as shown in Figure 5c. During the machining process, all of the data from the controllers (real time) and DT process (calculated) were saved in a file using a data acquisition module and desktop computer (PC). At the end of every slot machining, a USB microscope with 220× magnification captured images of the cutting edge of the worn tool. Then, the tool wear progression in one experimental session was quantified by analyzing the 40 consecutive images of the worn tool. Four experimental sessions provided 160 tool images representing the tool progression. The spindle speed ω r e f and feed rate f of three experimental sessions were set to 20,000 RPM and 4 mm/s respectively. Another experimental session used a higher feed rate ( f = 10 mm/s) to obtain a dataset with a faster tool progression. Table 2 summarizes the experimental resources. Figure 5a shows the wear analysis and tool image acquisition.

5.2. Workpiece and Tool

A box made of stainless steel (SUS304) was the workpiece for slot micro-milling. The box dimensions were 18 mm × 18 mm × 3.25 mm. The material composition of the workpiece (Table 3) was examined according to the ASTM A751 and ASTM E415 standards using optical emission spectroscopy. The hardness of the workpiece was measured according to the ASTM E384 standard by applying a 0.1 kgf indenter load for 10 s to the 11 test points on the workpiece. Figure 5b shows the locations of the test points. It was confirmed in the test that the workpiece had average hardness (HV) values of 384 HV in the axial direction and 375 HV in the direction perpendicular to feeding. Figure 5d shows a two-flute uncoated carbide micro-tool made by Dixy Polytools that was used in the experiment ( Z = 2 ). The tool had a cutting diameter of 1 mm with a shank diameter of 3 mm and a total length of 38 mm. The clamping position was set to two-thirds of the tool’s total length.

5.3. Five-Axis Micro-Milling Machine

The experiment used a custom-built five-axis micro-milling machine. A stepper-motor controller controlled each axis motion. The actuator resolution was 1 μ m for the linear axis and up to 0 . 0025 for the rotary axis. The spindle controller could run the spindle motor up to 80,000 RPM. Both the axis and spindle controllers provided an application programming interface (API) to control and communicate with the actuator. The machining plan was processed by passing the cutter location points to our software, which was built based on the provided API (application programming interface). Table 4 summarizes the specifications of a micro-milling machine.

6. Results

6.1. DT Validation

A validation step was necessary to evaluate the performance of the DT in imitating the dynamics of the twinned micro-milling process before the DT process worked in parallel with real-time data from the sensors to provide the TWM service. The optimal parameters of the model were learned from the dataset of the first two experimental sessions. The calculated variables of the micro-milling process (torque, current, and speed of the spindle) were compared to their actual values from the sensor data. Figure 6 shows the results of the DT for one experimental session. Forty consecutive slot machining events were considered as one continuous machining session. The DT successfully mimicked the data of actual micro-milling dynamics. Thanks to the definition of machining events presented in Section 3.3, the continuity of the process could be maintained across the cycle of slot machining events. The profile of variables in one cycle of slot machining is shown in Figure 6a,c,e. Regions a and b in Figure 6d are those where the spindle had just experienced torque overshoot after the motor spindle was turned on. Torque overshoot happens when a spindle motor overcomes its rotor inertia to rotate the spindle shaft. The idle region (b,c and f,g) is the region where the spindle achieved the targeted spindle speed ω r e f and produced a “no-load” torque. Regions c-d and e-f are “rising” and “falling” regions where the tool started or ended physical contact with the workpiece. The material removal happened in the “cutting” region, which is indicated by d-e. The DT used the optimal model parameters from Table 5. It was confirmed that the DT could mimic the dynamics of micro-milling in all four datasets.

6.2. Extended Kalman Filter–Tool Wear Monitoring

EKF-based TWM was tested on all of the experimental datasets. The TWM service ran concurrently with the DT process. The TWM service continuously estimated the tool wear values across all events during the machining process. The performance of EKF-based TWM with the parameters from Table 6 is presented in Figure 7. During the continuous machining of 40 slots, EKF-based TWM followed the S-shaped tool wear profile in all datasets. The EKF covariance increased notably in the region of rapid initial wear (stage II region), starting at the first inflection point of the S-shaped curve. The increment was expected since the EKF covariance Σ t was based on the change in the predicted wear value V B ^ t over the previous wear estimate V B t 1 . The stage II region was where the change rate was relatively more significant than at other locations on the curve. The wear only progressed when the workpiece material was removed ( Δ M R > 0 ). Consequently, the predicted wear value V B ^ t remained constant during the non-cutting events ( Δ M R = 0 ); see the red dots in Figure 7e “Zoom D”. After receiving the real-time torque data T t R e a l , the update step compensated the predicted wear by adding the innovation based on the discrepancy between the real-time torque data T t R e a l and torque likelihood T ^ t ; see Equation (26). The effect of the update step can be seen in Figure 7f “Zoom E”. The EKF innovation corrected the predicted wear value V B ^ t upward or downward depending on the Kalman gain K t , the torque discrepancy ( T t R e a l T ^ t ) , and the prediction covariance Σ ^ t . The blue dots indicate the wear estimate V B t . It can be seen in the figure that some predicted wear values received more correction than others. The trajectory of the Kalman gain in Figure 7g shows the correction trend during the machining. The higher Kalman gain during the stage II region means that the EKF gave more effort to bring the estimate V B t to the optimal value by trusting more to the torque information T t R e a l from the sensor measurements. The deviation of the EKF’s wear estimate from the actual wear value (the so-called “EKF error ( ϵ E K F )”) is presented in Figure 7h, and its mean ϵ ¯ E K F and standard deviation δ E K F are provided in Table 7. EKF-based TWM achieved a maximum mean of 0.038 mm and standard deviation of the EKF error of 0.031 mm.
The performance of EKF-based TWM can also be analyzed using the torque of the spindle motor. Figure 8 depicts a comparison between the actual T t R e a l and likelihood T ^ t torque values at the update step. The recursive predict–update steps of the EKF successfully tracked the profile of the actual torque under the influence of model noises. This result confirmed that the prior wear estimate V ^ B t 1 at each sampling time t was good enough to produce the likelihood torque T ^ t , which followed the profile of the actual torque T t R e a l . The estimation process ran effectively and was bounded. Additionally, the well-followed profile of the actual measurement showed a good agreement between the actual phenomena that happened in the micro-milling process (in terms of motor torque) and the process of wear estimation within the EKF.

6.3. Usage of EKF-Based TWM for Corrective and Preventive Action during the Micro-Milling Process

The TWM system assists its user in achieving a specified quality of a machined workpiece. Specifically, a TWM system uses information on tool wear progression to notify the user about wear-related events that will degrade the quality of the machined workpiece. Generally, the user is concerned with tool breakage, rapid wear progression, and wear stage events. The EKF-based TWM system delivers notifications for such events by using the wear estimate V B t information and the standard profile of wear categorizations provided by the user. Figure 9 shows the design of a software GUI (graphical user interface) for delivering the TWM service with a running DT. The graph on the left side of Figure 9 shows the real-time wear progression estimated in EKF-based TWM. The real-time and calculated machining process variables are shown in the graph on the right side of Figure 9. The area of the TWM graph is segmented horizontally into the wear stages (I. slow initial wear, II. rapid initial wear, III. steady-state wear, and IV. rapid tool wear before failure) according to the standard protocol of micro-milling wear [44]. When the wear estimate V B t hits the entry line of a particular wear stage, a notification is displayed, e.g., “Warning 1”. The notification warns the user that the wear progression has entered a higher wear stage. Furthermore, the user may also obtain insight into process abnormalities by comparing the notification time ( t n o t i f I I , t n o t i f I I I , t n o t i f I V ) to the standard/normal entry time for each wear stage ( t e n t r y I I , t e n t r y I I I , t e n t r y I V ) . Early notification ( t n o t i f < t e n t r y ) indicates that the wear progression is faster than the normal one. The user evaluates this sign of process abnormality to prepare corrective and preventive actions. The process of decision making can also involve the statistics of the standard profile since it may be less optimal to make decisions in a deterministic way. Both the wear estimate V B t and the t e n t r y information contain uncertainty to some extent, e.g., in the form of covariance Σ t and the distribution of t e n t r y from experimental data. The scope of the work in this article does not include the presentation of more advanced decision-making methods and the corrective and preventive actions needed.

7. Discussion

7.1. Performance Evaluation of TWM-DT

Table 8 shows the performance of several TWM systems. A comprehensive comparison of our proposed TWM-DT with other TWM systems is somewhat tricky due to differences in several aspects of the systems, such as the machining domain, cutting tool specification, experimental design, and quantitative performance measures. However, Table 8 can still give a benchmarking overview of the systems. In the TWM-DT category, our TWM-DT system can be compared to the systems developed by Qiao et al. [13] and Yuan et al. [31]. However, in the EKF category, the system by Niaki et al. [30] is an apt object for comparison. With an error of 0.019 mm in wear estimation for a single cutting tooth, our proposed TWM-DT is slightly on par with those systems. The achieved maximum error is below 2% in the sub-millimeter region. Within the TWM-DT category, our proposed system offers a more straightforward framework using the EKF rather than exhaustively training with data-driven methods. Within the EKF category, incorporating a DT and machining sequence definition makes our system more realistic than that with only steady-state wear monitoring by Niaki et al. [30].

7.2. Alternative Methods to the EKF Framework

A TWM-DT system may employ methods other than the EKF to perform wear estimation. Particle filtering (PF) is the closest method to the EKF within the Bayesian parameter estimation method family. PF also works based on the “predict–update” style of workflow. The system developed by Luo et al. shows the implementation of PF in a TWM-DT system [35]. The EKF and PF maintain probability density functions (PDF) of the wear estimate at every sampling time. PF uses a set of weighted particles as a copy of PF states to represent the PDF, whereas the EKF uses a Gaussian distribution function as the PDF. As a result, PF can maintain a multi-modal PDF of the wear, whereas the EKF can only hold a unimodal PDF. However, it should be further clarified and tested whether a multi-modal PDF is advantageous for the case of tool wear estimation. Multi-modality is beneficial for applications such as mobile robot localization, which must maintain multiple hypotheses during estimation or at the beginning of the application run. When a robot is turned on for the first time, it does not know its initial location in an environmental map. Based on sensor readings, the robot initially maintains multiple hypotheses on being at some locations. The location estimation will eventually converge to a particular location as the sensor readings progress. However, such a multiple-hypothesis scenario seems overly assumptive in tool wear estimation. A fresh cutting tool has only zero wear value at the beginning of the machining process. It is also counterintuitive if the wear value is assumed to fluctuate backward and forward during the machining process since the wear progression ideally follows a monotonic function. Furthermore, it should also be noted that the computation cost in PF is much higher than in that in the EKF, and it depends on the number of particles and the resampling routines. According to Jouin et al., the particle number should be between 30 and 10,000 [45]. Within the context of DTs, the method should be implemented with attention to the computation cost since it may create a bottleneck for dynamic linking between physical and virtual resources.

7.3. Toward Sustainability and Resilience with Industry 4.0 and Industry 5.0

The realistic concept of Industry 4.0 has nine pillars of technologies, i.e., big data, autonomous robots, simulation, system integration, industrial Internet of things (IoT), cyber–physical systems (CPSs), cloud services, additive manufacturing, and augmented reality [46]. Industry 4.0 aims to enhance production and efficiency through a smart manufacturing environment where interconnected machinery can make intelligent decisions. After a decade, Industry 5.0 was also introduced to the field of research, signifying the upcoming industrial revolution. Nevertheless, a systematic revolution not only affects economic manufacturing consequences but also impacts civil society, governance, structures, and human identity. According to an article from Aheleroff et al. [47], “Industry 5.0 enhances Industry 4.0 for higher resilience and sustainability by a human-centric approach. Industry 5.0 aspires to create reliable human-centric collaboration with autonomous robots, preferably at the same time, in the same workspace, in contrast to “automatio,” which uses technologies with restricted human intervention in processes”. In summary, the role of humans is expected to take a bigger portion in collaboration with the spirit of digitalization and automation in Industry 4.0. The premise is that it is better to “do right things” than to “do things right.” The development of the TWM-DT system aligns with the topic of higher resilience and sustainability with Industry 5.0. The ultimate goal of many TWM developments is to build a monitoring system that can inform users about the wear progression so that the necessary decisions can be made for the ongoing machining sessions to achieve the required quality of the machined product. The proposed TWM-DT system assists humans (machining operators) in making appropriate decisions during machining sessions. Even though many developments have also pushed TWM systems to make automatic decisions, the effort should deal with many complexities. Eventually, this effort achieved only an ad hoc solution. On the other hand, human-based decision making seems to be a wiser approach than fully automatic decision making. Humans are far more adaptable to the various settings of machining. Contextual decisions may still be a challenge for an automatic system. The developed TWM-DT system can align with the proposed concept of Industry 5.0 by helping in decision making.

8. Conclusions

A novel tool wear monitoring (TWM) system for micro-milling machining based on digital twin (DT) technology has been presented. A DT model of the micro-milling process was constructed to imitate the micro-milling dynamics. The Extended Kalman Filter (EKF) was selected as the framework to create seamless data integration for tool wear monitoring. The EKF-based TWM continuously used the micro-milling DT variables and the real-time data from sensor measurements to provide wear progression information on the cutting tool. The TWM service ran concurrently with a DT of the process of micro-milling. The TWM service notified about wear-related events based on wear estimates from EKF-based TWM and the standard/normal wear categorization from the user. The notifications from the TWM system str expected to assist users in making decisions related to machining processes. Further, corrective and preventive actions can be planned by users to control ongoing machining processes and to achieve the specified quality of the machined workpiece.
The performance of EKF-based TWM was tested by using four datasets of slot micro-milling machining. The EKF-based TWM system successfully produced good information on the wear estimates with a maximum error mean ϵ E K F of 0.038 mm (for two teeth of the cutting tool) with respect to the actual wear value. The EKF wear estimates in all datasets adhered to an S-shaped profile of tool wear progression. In addition, the EKF-based TWM adapted to the machining parameters, e.g., the feed rate f. In the fourth dataset, the EKF-based TWM system consistently showed good wear estimates even though the feed rate f was set higher than the feed rate in other datasets. According to this result, retraining of the model parameters was not needed if the machining parameters changed. The contributions and novelties of our work in this paper can be summarized as follows:
  • Development of an architecture for a micro-milling DT that imitates micro-milling dynamics.
  • Development of a DT model of micro-milling by using the physical laws of a spindle motor, a spindle controller, and the cutting torque.
  • Implementation of a realistic virtual machining process by defining micro-milling events to enable a continuous DT process and TWM service across machining events.
  • Implementation of seamless data integration between DT variables and real-time data by using an EKF framework.
  • Development of a TWM service to notify users about wear-related events so that they can plan preventive and corrective actions to control the machining process and to achieve the specified machining quality.
  • Experimentation, validation, and evaluation of the proposed TWM system through actual slot micro-milling sessions.

Author Contributions

Conceptualization, C., G.K. and A.S.B.; methodology, C. and G.K.; software, C. and G.K.; validation, C., G.K. and A.S.B.; formal analysis, C. and G.K.; investigation, C.; resources, Z.H. and T.J.K.; data curation, C.; writing—original draft preparation, C. and G.K.; writing—review and editing, C., G.K. and A.S.B.; visualization, C.; supervision, G.K.; project administration, G.K.; funding acquisition, G.K. All authors have read and agreed to the published version of the manuscript.

Funding

This work was supported by PUTI Q1 (batch 1) Research Grant 2022 from Universitas Indonesia with grant number NKB-504/UN2.RST/HKP.05.00/2022 and by Beasiswa Pendidikan Indonesia (BPI) from the Indonesia Endowment Fund for Education (LPDP) for author Christiand.

Institutional Review Board Statement

Not applicable.

Informed Consent Statement

Not applicable.

Data Availability Statement

Restrictions apply to the datasets.

Conflicts of Interest

The authors declare no conflicts of interest.

Abbreviations

The following abbreviations are used in this manuscript:
TWMTool Wear Monitoring
DTDigital Twin
EKFExtended Kalman Filter
UCTUncut Chip Thickness
PIDProportional Integral Derivative
APIApplication Programming Interface
GUIGraphical User Interface
Nomenclature
F T j tangential cutting force on j-th cutting tooth
K t c tangential cutting force coefficient
K t e tangential edge force coefficient
u · UCT
f T feed per tooth
c · effective cutting function
ϕ angular position of cutting edge
rtool radius
Znumber of cutting tooth
aaxial depth of cutting
T m material torque
T c cutting torque
T w wear torque
K e back-EMF voltage constant
V B t wear value estimate at time t
p 0 , p 1 , p 2 , p 3 , p 4 wear torque coefficients
θ angular position of spindle rotation
Jrotor mass of inertia
Brotor friction coefficient
Lrotor electrical inductance
Rrotor electrical resistance
Trotor torque
ielectrical current
Vvoltage given to rotor
ω spindle speed
ω r e f spindle speed reference
e · spindle speed error
K p PID proportional constant
K i PID integral constant
K d PID derivative constant
K T torque constant
φ spindle state
ψ feed-drive state
κ contact state
Pcenter point of tool cross-section
f feeding vector
qfast transition parameter
g · wear propagation model
v t EKF prediction noise
ϵ p variance of EKF prediction noise
Δ M R increment in material removed
M R material removed
V B m a x maximum possible wear value
V B t ^ wear value after EKF prediction step
Σ t ^ EKF covariance after EKF prediction step
h · torque measurement model
T t ^ predicted (likelihood) torque
K t Kalman gain at time t
T t r e a l real-time torque measurement at time t
w t EKF update noise
ϵ u variance of EKF update noise
V c collision volume
nnumber of spindle rotations
Δ n increment in the spindle rotation number

References

  1. Chircov, C.; Grumezescu, A.M. Microelectromechanical systems (MEMS) for biomedical applications. Micromachines 2022, 13, 164. [Google Scholar] [CrossRef]
  2. Colpani, A.; Fiorentino, A.; Ceretti, E.; Attanasio, A. Tool wear analysis in micromilling of titanium alloy. Precis. Eng. 2019, 57, 83–94. [Google Scholar] [CrossRef]
  3. O’Toole, L.; Kang, C.W.; Fang, F.Z. Precision micro-milling process: State of the art. Adv. Manuf. 2021, 9, 173–205. [Google Scholar] [CrossRef] [PubMed]
  4. Chen, N.; Li, H.N.; Wu, J.; Li, Z.; Li, L.; Liu, G.; He, N. Advances in micro milling: From tool fabrication to process outcomes. Int. J. Mach. Tools Manuf. 2021, 160, 103670. [Google Scholar] [CrossRef]
  5. Zhang, X.; Shi, Y.; Zhang, B.; Si, C. A study of on-machine micro milling cutter condition inspection based on machine vision. J. Micro- Nano-Manuf. 2018, 6, 031007. [Google Scholar] [CrossRef]
  6. Dadgari, A.; Huo, D.; Swailes, D. Investigation on tool wear and tool life prediction in micro-milling of Ti-6Al-4V. Nanotechnol. Precis. Eng. 2018, 1, 218–225. [Google Scholar] [CrossRef]
  7. Lu, X.; Zhang, H.; Jia, Z.; Feng, Y.; Liang, S.Y. A new method for the prediction of micro-milling tool breakage. In Proceedings of the International Manufacturing Science and Engineering Conference. American Society of Mechanical Engineers, Los Angeles, CA, USA, 4–8 June 2017; Volume 50725, p. V001T02A037. [Google Scholar]
  8. Kuram, E.; Ozcelik, B. Micro milling. In Modern Mechanical Engineering: Research, Development and Education; Springer: Berlin/Heidelberg, Germany, 2014; pp. 325–365. [Google Scholar]
  9. Zhang, X.; Yu, T.; Wang, W. Prediction of cutting forces and instantaneous tool deflection in micro end milling by considering tool run-out. Int. J. Mech. Sci. 2018, 136, 124–133. [Google Scholar] [CrossRef]
  10. Zhang, X.; Yu, T.; Zhao, J. Surface generation modeling of micro milling process with stochastic tool wear. Precis. Eng. 2020, 61, 170–181. [Google Scholar] [CrossRef]
  11. Teng, X.; Huo, D.; Shyha, I.; Chen, W.; Wong, E. An experimental study on tool wear behaviour in micro milling of nano Mg/Ti metal matrix composites. Int. J. Adv. Manuf. Technol. 2018, 96, 2127–2140. [Google Scholar] [CrossRef]
  12. Grieves, M.; Vickers, J. Digital twin: Mitigating unpredictable, undesirable emergent behavior in complex systems. In Transdisciplinary Perspectives on Complex Systems: New Findings and Approaches; Springer: Cham, Switzerland, 2017; pp. 85–113. [Google Scholar]
  13. Qiao, Q.; Wang, J.; Ye, L.; Gao, R.X. Digital Twin for machining tool condition prediction. Procedia CIRP 2019, 81, 1388–1393. [Google Scholar] [CrossRef]
  14. Xie, N.; Kou, R.; Yao, Y. Tool Condition Prognostic Model Based on Digital Twin System. Procedia CIRP 2020, 93, 1502–1507. [Google Scholar] [CrossRef]
  15. Xie, Y.; Lian, K.; Liu, Q.; Zhang, C.; Liu, H. Digital twin for cutting tool: Modeling, application and service strategy. J. Manuf. Syst. 2021, 58, 305–312. [Google Scholar] [CrossRef]
  16. Twardowski, P.; Tabaszewski, M.; Wiciak-Pikuła, M.; Felusiak-Czyryca, A. Identification of tool wear using acoustic emission signal and machine learning methods. Precis. Eng. 2021, 72, 738–744. [Google Scholar] [CrossRef]
  17. Shen, Y.; Yang, F.; Habibullah, M.S.; Ahmed, J.; Das, A.K.; Zhou, Y.; Ho, C.L. Predicting tool wear size across multi-cutting conditions using advanced machine learning techniques. J. Intell. Manuf. 2021, 32, 1753–1766. [Google Scholar] [CrossRef]
  18. Kiswanto, G. Digital twin approach for tool wear monitoring of micro-milling. Procedia CIRP 2020, 93, 1532–1537. [Google Scholar]
  19. Christiand; Kiswanto, G.; Baskoro, A. The digital twin application for micro-tool wear monitoring with open-source cad system. In Proceedings of the IFIP International Conference on Advances in Production Management Systems, Gyeongju, Repubic of Korea, 25–29 September 2022; Springer: Berlin/Heidelberg, Germany, 2022; pp. 11–18. [Google Scholar]
  20. Grieves, M. Digital twin: Manufacturing excellence through virtual factory replication. White Pap. 2014, 1, 1–7. [Google Scholar]
  21. Shafto, M.; Conroy, M.; Doyle, R.; Glaessgen, E.; Kemp, C.; LeMoigne, J.; Wang, L. Modeling, simulation, information technology & processing roadmap. Natl. Aeronaut. Space Adm. 2012, 32, 1–38. [Google Scholar]
  22. Hochhalter, J.; Leser, W.P.; Newman, J.A.; Gupta, V.K.; Yamakov, V.; Cornell, S.R.; Willard, S.A.; Heber, G. Coupling Damage-Sensing Particles to the Digitial Twin Concept; Technical Report; National Aeronautics and Space Administration (NASA): Washington, DC, USA, 2014.
  23. Tuegel, E.J.; Ingraffea, A.R.; Eason, T.G.; Spottswood, S.M. Reengineering aircraft structural life prediction using a digital twin. Int. J. Aerosp. Eng. 2011, 2011, 154798. [Google Scholar] [CrossRef]
  24. Kannan, K.; Arunachalam, N. A digital twin for grinding wheel: An information sharing platform for sustainable grinding process. J. Manuf. Sci. Eng. 2019, 141, 021015. [Google Scholar] [CrossRef]
  25. Zhang, C.; Ji, W. Digital twin-driven carbon emission prediction and low-carbon control of intelligent manufacturing job-shop. Procedia CIRP 2019, 83, 624–629. [Google Scholar] [CrossRef]
  26. Botkina, D.; Hedlind, M.; Olsson, B.; Henser, J.; Lundholm, T. Digital twin of a cutting tool. Procedia CIRP 2018, 72, 215–218. [Google Scholar] [CrossRef]
  27. Luo, W.; Hu, T.; Zhang, C.; Wei, Y. Digital twin for CNC machine tool: Modeling and using strategy. J. Ambient. Intell. Humaniz. Comput. 2019, 10, 1129–1140. [Google Scholar] [CrossRef]
  28. Tao, F.; Xiao, B.; Qi, Q.; Cheng, J.; Ji, P. Digital twin modeling. J. Manuf. Syst. 2022, 64, 372–389. [Google Scholar] [CrossRef]
  29. Niaki, F.A.; Ulutan, D.; Mears, L. In-process tool flank wear estimation in machining gamma-prime strengthened alloys using kalman filter. Procedia Manuf. 2015, 1, 696–707. [Google Scholar] [CrossRef]
  30. Niaki, F.A.; Michel, M.; Mears, L. State of health monitoring in machining: Extended Kalman filter for tool wear assessment in turning of IN718 hard-to-machine alloy. J. Manuf. Process. 2016, 24, 361–369. [Google Scholar] [CrossRef]
  31. Yuan, D.; Luo, T.; Gu, C.; Zhu, K. The Cyber-Physical System of Machine Tool Monitoring: A Model-driven Approach with Extended Kalman Filter Implementation. IEEE Trans. Ind. Inform. 2022, 19, 9576–9585. [Google Scholar] [CrossRef]
  32. Ebadpour, M.; Jamshidi, M.; Talla, J.; Hashemi-Dezaki, H.; Peroutka, Z. Digital Twin Model of Electric Drives Empowered by EKF. Sensors 2023, 23, 2006. [Google Scholar] [CrossRef]
  33. Bhagavathi, R.; Kufoalor, D.K.M.; Hasan, A. Digital Twin-Driven Fault Diagnosis for Autonomous Surface Vehicles. IEEE Access 2023, 11, 41096–41104. [Google Scholar] [CrossRef]
  34. Tao, F.; Liu, W.; Zhang, M.; Hu, T.l.; Qi, Q.; Zhang, H.; Sui, F.; Wang, T.; Xu, H.; Huang, Z.; et al. Five-dimension digital twin model and its ten applications. Comput. Integr. Manuf. Syst 2019, 25, 1–18. [Google Scholar]
  35. Luo, W.; Hu, T.; Ye, Y.; Zhang, C.; Wei, Y. A hybrid predictive maintenance approach for CNC machine tool driven by Digital Twin. Robot. Comput. -Integr. Manuf. 2020, 65, 101974. [Google Scholar] [CrossRef]
  36. Park, S.; Malekian, M. Mechanistic modeling and accurate measurement of micro end milling forces. CIRP Ann. 2009, 58, 49–52. [Google Scholar] [CrossRef]
  37. Altintas, Y. Prediction of cutting forces and tool breakage in milling from feed drive current measurements. Trans. ASME 1992, 114, 386–392. [Google Scholar] [CrossRef]
  38. Altintas, Y.; Ber, A. Manufacturing automation: Metal cutting mechanics, machine tool vibrations, and CNC design. Appl. Mech. Rev. 2001, 54, B84. [Google Scholar] [CrossRef]
  39. Altintas, Y.; Eynian, M.; Onozuka, H. Identification of dynamic cutting force coefficients and chatter stability with process damping. CIRP Ann. 2008, 57, 371–374. [Google Scholar] [CrossRef]
  40. Niaki, F.A.; Ulutan, D.; Mears, L. Stochastic tool wear assessment in milling difficult to machine alloys. Int. J. Mechatronics Manuf. Syst. 2015, 8, 134–159. [Google Scholar] [CrossRef]
  41. Tansel, I.; Arkan, T.; Bao, W.; Mahendrakar, N.; Shisler, B.; Smith, D.; McCool, M. Tool wear estimation in micro-machining: Part I: Tool usage–cutting force relationship. Int. J. Mach. Tools Manuf. 2000, 40, 599–608. [Google Scholar] [CrossRef]
  42. Borase, R.P.; Maghade, D.; Sondkar, S.; Pawar, S. A review of PID control, tuning methods and applications. Int. J. Dyn. Control 2021, 9, 818–827. [Google Scholar] [CrossRef]
  43. FreeCAD. Your Own 3D Parametric Modeler. 2024. Available online: https://www.freecadweb.org/ (accessed on 27 March 2024).
  44. Alhadeff, L.; Marshall, M.; Curtis, D.; Slatter, T. Protocol for tool wear measurement in micro-milling. Wear 2019, 420, 54–67. [Google Scholar] [CrossRef]
  45. Jouin, M.; Gouriveau, R.; Hissel, D.; Péra, M.C.; Zerhouni, N. Particle filter-based prognostics: Review, discussion and perspectives. Mech. Syst. Signal Process. 2016, 72, 2–31. [Google Scholar] [CrossRef]
  46. Vaidya, S.; Ambad, P.; Bhosle, S. Industry 4.0–a glimpse. Procedia Manuf. 2018, 20, 233–238. [Google Scholar] [CrossRef]
  47. Aheleroff, S.; Huang, H.; Xu, X.; Zhong, R.Y. Toward sustainability and resilience with Industry 4.0 and Industry 5.0. Front. Manuf. Technol. 2022, 2, 951643. [Google Scholar] [CrossRef]
Figure 1. DT model for micro-milling applications.
Jmmp 08 00108 g001
Figure 2. The interactions between physical–virtual resources and the pipeline of calculating the micro-milling dynamics.
Jmmp 08 00108 g002
Figure 3. Timing diagram of micro-milling machining events showing the profile of DT variables.
Jmmp 08 00108 g003
Figure 4. The method of detecting a collision between the tool and the workpiece: (a) FreeCAD module; (b) simple geometry.
Jmmp 08 00108 g004
Figure 5. (a) Acquisition and analysis of tool wear images during the machining process; (b) hardness test points; (c) slot machining paths; (d) micro-cutting tool.
Jmmp 08 00108 g005
Figure 6. The process variables for the validation step: (a) machining speed ω r e f , (b) zoomed region of A, (c) motor torque T, (d) zoomed region of B, (e) motor current i, and (f) zoomed region of C.
Jmmp 08 00108 g006
Figure 7. The performance of EKF-based TWM in all experimental datasets: (a) first dataset, (b) second dataset, (c) third dataset, and (d) fourth dataset; (e) zoomed region of D, (f) zoomed region of E, (g) Kalman gain calculated during EKF-based TWM, and (h) error of the EKF estimate measured with real wear measurements.
Jmmp 08 00108 g007
Figure 8. Motor torque based on the wear value: calculated T ^ t vs . V ^ B t and actual T t R e a l vs . V B t R e a l : (a) first dataset, (b) second dataset, (c) third dataset, and (d) fourth dataset.
Jmmp 08 00108 g008
Figure 9. Graphical user interface (GUI) of the TWM service with a DT running in parallel.
Jmmp 08 00108 g009
Table 1. Digital twin systems and applications.
AuthorModelingFieldApplication
Kannan et al. [24]Product knowledge (specification, process info, material properties)ManufacturingRemaining useful life (RUL) of a grinding wheel
Qiao et al. [13]Deep learning technique—Deep Stacked GRU modelManufacturingTool wear monitoring
Xie et al. [15]Basic data (design, physical, mission, simulation) and extended data (process, monitoring, prediction, evolution)ManufacturingTool wear monitoring
Xie et al. [14]Recurrent Neural Network (RNN)–Long Short-Term Memory (LSTM)ManufacturingTool wear classification
Botkina et al. [26]Annotated CAD with cutting tool data from ISO 13399ManufacturingProductivity analysis and machining optimization
Luo et al. [27]Descriptive model of a machine tool inside Modelica MWorksManufacturingProductivity analysis and machining optimization
Zhang et al. [25]Virtual workshop model containing job-shop environments and resources (3D geometry and process)Organization operationCarbon emission prediction and low-carbon control
Tuegel et al. [23]Multi-physics damage model with FEMAerospaceAssessment of aircraft structural life
Hochhalter et al. [22]Computed tomography with 3D geometry with FEMAerospaceCrack detection
Table 2. Experimental resources.
ResourceComponentSpecification
ComputerProcessorIntel, Core I9-10900K
MotherboardGigabyte, Z490 Vision D
VGANVIDIA, RTX 3060 TI PALIT 8 GB
RAMCorsair, DDR4 (2 × 16 GB)
Hard diskWDC, Blue SSD NVME 1 TB
DAqWear ImagingDinolite, AM4917MZT, 220×, 1.3 MP
ModuleLabJack, U6 14 Analog inputs, USB comm.
Table 3. Chemical composition of the workpiece.
ElementCSiMnSPNiCrFe
% Weight0.0170.441.8660.010.0378.32918.06Balance
Table 4. Micro-milling machine’s specifications.
ResourceComponentSpecification
Feed-DriveXY-AxisSuruga, KXC06020, 1 μ m resolution
Z-AxisSuruga, KZL060XX, 1 μ m resolution
C-AxisSuruga, KS402-75, 0.0025 0.0025 resolution
A-AxisSuruga, KRW06360, 0.004 0.004 resolution
ControllerSuruga, DS-102, USB Serial Comm.
SpindleMotorNakanishi, HES860, Max 80,000 RPM
ControllerNakanishi, E3000, 25 I/O, DB25 port
Table 5. Optimal parameters of the DT model.
Motor Controller Cutting Torque
Par.ValueUnit Par.Value Par.ValueUnit
J 6.06 × 10 6 kg m s 2 K p 5.00 × 10 6 K t c 1.04 × 10 4 N m 2
B 6.00 × 10 7 N m s K i 1.7 × 10 2 K t e 1.04 × 10 4 N m 1
R 1.40 Ω K d 1.00 × 10 11 p 0 1.27 × 10 4
L 7.20 × 10 2 H p 1 8 × 10 5
K T 1.80 × 10 2 N m A 1 p 2 2.44 × 10 1
K e 6.00 × 10 3 V rad 1 s p 3 3.66 × 10 1
p 4 9.58 × 10 4
Table 6. EKF parameters.
ParameterValue
ϵ p (prediction noise) 4.34 × 10 2
ϵ u (update noise) 1.60 × 10 5
q 1.43
V B m a x 6.63 × 10 1
Table 7. Statistics of the EKF-based TWM error.
Dataset ϵ ¯ EKF σ EKF
10.0220.019
20.0380.026
30.0380.031
40.0340.028
Table 8. Performance of various TWM systems.
AuthorSystemApplicationResult
Xie et al. [14]TWM-DT based on the Long Short-Term Memory (LSTM) algorithmWear classification in turning99% accuracy in classifying the wear into three categories
Qiao et al. [13]TWM-DT based on Deep Stacked GRU (DGRU)Wear estimation in millingMaximum error of 10.16 in RMSE and 7.84 in MAE
Yuan et al. [31]TWM-DT based on a model-driven cyber–physical system (MDCPS) with the EKFWear estimation in millingMaximum error of 6.4986 μ m in RMSE
Twardowski et al. [16]Acoustic emission (AE) sensorWear classification in millingMaximum of 6% of classification error
Shen et al. [17]Force, vibration, and acoustic emission (AE) sensors with a predictive modelWear estimation in turningMaximum of 0.00834 mm in RSME
Niaki et al. [30]Spindle power sensor with an EKF frameworkWear area estimation in millingMaximum error of 0.04 mm 2 in RMSE
Disclaimer/Publisher’s Note: The statements, opinions and data contained in all publications are solely those of the individual author(s) and contributor(s) and not of MDPI and/or the editor(s). MDPI and/or the editor(s) disclaim responsibility for any injury to people or property resulting from any ideas, methods, instructions or products referred to in the content.

