Article

Parametric Optimization of Selective Laser Melted 13Ni400 Maraging Steel by Taguchi Method

by
Viraj Vishwas Patil
1,
Chinmaya P. Mohanty
1 and
K. G. Prashanth
2,3,*
1
School of Mechanical Engineering, Vellore Institute of Technology, Vellore 632014, India
2
Centre for Biomaterials, Cellular and Molecular Theranostics, School of Mechanical Engineering, Vellore Institute of Technology, Vellore 632014, India
3
Department of Mechanical and Industrial Engineering, Tallinn University of Technology, Ehitajate tee 5, 19806 Tallinn, Estonia
*
Author to whom correspondence should be addressed.
J. Manuf. Mater. Process. 2024, 8(2), 52; https://doi.org/10.3390/jmmp8020052
Submission received: 28 January 2024 / Revised: 20 February 2024 / Accepted: 21 February 2024 / Published: 2 March 2024

Abstract

:
This study’s novel 13Ni400 maraging steel parts are additively manufactured through a selective laser melting process. The Taguchi approach is adopted to evaluate the combined influence of process variables (energy density), viz., laser power, layer thickness, hatch spacing, and scan speed, on responses like relative density, microhardness, surface roughness, and tensile strength. The powder and material characterization studies are conducted in terms of an optical microscope, scanning electron microscope (SEM), electron backscatter diffraction (EBSD), X-ray diffraction (XRD), and fractography analysis to explore the pre- and post-fabrication scenarios of the build parts. The consequences of energy density and process variables are studied through meticulous parametric studies. Finally, the optimum level of built parameters is identified and validated by a confirmative test predicting an average error of ~1.80%. This work is proficient in producing defect-free parts with maximum densification and improved mechanical properties for newly developed 13Ni-400 maraging steel by the selective laser melting (SLM) technique.

1. Introduction

Additive manufacturing (AM) is a revolutionary innovation that has gained worldwide attention. It works by building parts layer by layer instead of cutting material away like traditional methods. This approach allows for the production of near-net-shaped parts that are very close to the final shape, reducing the need for further processing [1,2]. Additive manufacturing technology allows the production of components with exceedingly complex forms and geometry that would be difficult or impossible to create using traditional manufacturing procedures [3]. In this manufacturing technique, process planning is not required because the product can be made directly using CAD data [4,5]. Selective laser melting (SLM) stands as a prominent additive manufacturing (AM) technique, garnering considerable attention from researchers due to its rapid evolution and growing implementation [6,7,8]. SLM is normally recognized by means of the laser-based powder bed fusion (LPBF) technique, and this technique was used to manufacture various types of materials, including titanium, steel, iron, nickel, aluminum, and copper-based alloys [9,10,11,12,13,14,15]. The investigation of novel metallic materials for SLM has been ongoing in recent years. As steel has good mechanical properties like hardness, tensile strength, and machinability, it has a wide range of applications in aerospace as well as in the tool industry [16,17,18]. In the additive manufacturing sector, maraging steel was used to replace several grades of austenitic steel, which has good strength, thermal stability, and fatigue life [19,20].
The most commonly used maraging steels on the market today are 18Ni300. Until now, many researchers have studied different aspects of various grades of maraging steel in SLM, such as the effect of process parameters and heat treatments on the mechanical and microstructural properties of the maraging steel. Several studies are mentioned in this context below. Mao et al. [21] studied the mechanical properties and nanoprecipitation behavior of 18Ni-300 grade maraging steel. Additionally, response surface methodology and analysis of variance were used to optimize the process parameters. Wang, Q. et al. [22] studied the microstructure and mechanical behavior of 24CrNiMo steel manufactured by LPBF. Tang et al. [23] attempted to optimize the energy density and scan strategy to form a good quality of 24CrNiMo low alloy steel by SLM. Cheng et al. [24] studied the microstructural evolution and mechanical properties of FeCo15Cr14Ni4Mo3 maraging steel by a selective laser melting process. Vishwakarma et al. [25] studied different build strategies for 18Ni300 and their effect on the mechanical properties. Suryawanshi et al. [18] studied the fatigue, tensile, and fracture properties of selectively laser-melted maraging steel. Bai et al. [26] studied the mechanical properties and microstructure of multimaterial parts prepared by the AM technique. Gao et al. [27] studied the influence of various heat treatment conditions on the mechanical properties and microstructure of Fe-11Cr-9Ni-6Co-3Mo maraging steel. Contuzzi et al. [28] studied the mechanical and microstructural changes in the maraging steel after heat treatment.
Furthermore, a few studies are also reported on the effect of alloying elements on the phase transformation and mechanical behavior of maraging steel. In this context, a few studies are reported below. Fel’dgandler and Savkina [29] studied the phase transformation of martensitic steel after the addition of alloys. Maraging steels can reach exceptional strength levels through a synergistic combination of three techniques: optimization of chemical composition, preventing the conversion of martensite to austenite, and intermetallic phase precipitation. Michaud et al. [30] investigated the consequences of different alloying elements like Ni, Cr, and Co on carbide precipitation and the mechanical properties of martensitic steel. Schnitzer et al. [31] investigated copper’s influence on precipitation in maraging steel. Zeisl et al. [32] have studied the precipitation behavior of cobalt-free maraging steel. Tan, C. et al. [33] studied the nanoparticle precipitation behavior and microstructure of selectively laser-melted 18Ni300 maraging steel. de Souza et al. [34] investigated the effects of component position, layer thickness, and laser speed on the 18Ni300 maraging steel. Patil et al. enhanced the mechanical properties of maraging steel through surface modifications [35].
Along with these alloying element studies, several studies reported on the optimization of process parameters by using different techniques. Some studies are mentioned in this context below. Tan, C. et al. [36] studied the effect of different build directions on the microstructure and mechanical properties of selectively laser-melted maraging steel. Conde et al. [37] studied the influence of microstructure on the martensite to austenite transition of 18Ni300 maraging steel. Ferreira et al. [38] studied predictive models for optimization of 18Ni300 maraging steel. Wang, Y. et al. [39] studied the parameters used for turning maraging steel. Casalino et al. [40] have attempted to statistically optimize the process parameters of selectively laser-melted 18Ni300 maraging steel. Mutua et al. [41] optimized the process parameters and studied the effect of different heat treatment conditions on mechanical properties and microstructure on selectively laser-melted 18Ni300 maraging steel. Yao et al. [42] studied the laser-based directed energy deposition method to find the best possible process parameter after heat treatment to achieve a good mechanical property of 18Ni300. da Fonseca et al. [43] studied the synergistic molybdenum-cobalt effect, which enhances the hardening. Mehmood et al. [44,45] studied the RSM technique to easily identify the influence of variables and levels, resulting in a robust design that saves time and money in the lab. Sun et al. optimized the selective laser melting parameters for Ti6Al4V by the Taguchi method [46].
After a critical review of past literature on the various grades of selectively laser-melted maraging steel, it is evident that many researchers have studied different aspects of maraging steel in selective laser melting, such as the consequences of process parameters and heat treatments on the mechanical and microstructural investigations of the build parts. However, it is observed that a novel material like 13Ni400 maraging steel is yet to be studied and thus remains an area for exploration for the researchers. The material finds extensive applications in fabricating numerous aerospace parts, viz., landing gear, undercarriage, and rocket motor cases. Due to the presence of elements like nickel, cobalt, molybdenum, and titanium, the material is appropriate for high-strength, hardness, and good machinability applications. It is important to know the ideal percentage of nickel and molybdenum present in maraging steel, as the price of nickel has continuously risen over the last two decades. The extraction of nickel from ore affects greenhouse gas emissions, which pollute the atmospheric air. After studying the phase diagram of Fe-Ni-Mo, it was noticed that lowering the weight percentage of nickel and increasing the weight percentage of molybdenum can enhance the strength of the material. Thus, in 13Ni400 maraging steel, the weight percentage of nickel is considerably reduced with the objective of achieving the highest possible mechanical property, cost economy, and reduced air pollution. It is also observed that the process optimization of the SLM process is not properly addressed in the literature. Considering the ever-increasing demand and widespread applications of the novel grade of maraging steel in the aerospace and tooling industries, parametric optimization of the novel 13Ni400 Maraging steel for product development holds immense importance. However, among various optimization approaches, the Taguchi method stands out for its exceptional efficiency and cost-effectiveness. It excels through its smart utilization of methods like orthogonal arrays and its emphasis on ensuring optimal performance while keeping expenses in check. When compared with other methods, it emerges as a first choice for achieving maximum results with minimal resources [46,47,48,49].
In line with the above concerns, the primary aim of this study is to investigate the printability of 13Ni400 maraging steel using the selective laser melting process. A comprehensive examination is undertaken to assess the consequences of critical process parameters, including laser power, layer thickness, hatch spacing, and scan speed, on critical outcomes such as relative density, surface roughness, hardness, and tensile strength. Furthermore, the research incorporates powder and material characterization through X-ray diffraction (XRD), scanning electron microscopy (SEM), electron backscatter diffraction (EBSD), and fractography analysis to evaluate the pre- and post-fabrication scenarios. To facilitate the systematic exploration of this multifaceted investigation, a Taguchi L9 (3^4) orthogonal array is employed as a statistical tool for experiment planning and process optimization. The results derived from this statistical approach are subsequently validated through confirmatory experiments, thus underscoring the significance of this research in advancing our understanding of selective laser melting for 13Ni-400 maraging steel, with broader implications for additive manufacturing.

2. Materials and Methods

2.1. Materials

In this work, novel 13Ni-400 grade maraging steel alloy powders are used for experimentation and are brought from Indo-MIM, India. The gas atomization technique is used to prepare the powders, and the average size of the powder particle is in the range of 10–48 μm. Powder morphology is studied using scanning electron microscopy (SEM) micrographs, as shown in Figure 1. It is observed that granular powder particles are spherical in shape with three different magnitudes, viz., small, medium, and large. Research manuscripts reporting large datasets that are deposited in a publicly available database should specify where the data have been deposited and provide the relevant accession numbers. If the accession numbers have not yet been obtained at the time of submission, please state that they will be provided during review. They must be provided prior to publication. For the SLM process, a broader packing density of the powder bed is recommended, which results in decreased surface roughness and porosity in the produced part. This particle size distribution is supposed to result in a densely constructed component because these results of powder particle size distribution are in line with previous studies [50]. An optical emission spectrometer and an energy dispersive X-ray spectroscopy were used to evaluate the chemical composition of this gas-atomized powder, and the findings reveal the precise proportions of key elements in 13Ni400 maraging steel. In weight percent (wt.%), the composition comprises 12.99% nickel (Ni), 13.34% cobalt (Co), 9.86% molybdenum (Mo), 0.23% titanium (Ti), 0.17% aluminum (Al), and a nominal carbon (C) content of 0.01%. Iron (Fe) predominates as the balance of the composition. A similar chemical composition can be found elsewhere [51].

2.2. Selective Laser Melting Process

In this study, an iFusion SF1 selective laser melting machine is used to fabricate parts. This machine has a 500 W Yb:YAG fiber laser with a wavelength of 1064 nm and a laser focus beam of 80 µm. The building platform of this machine is circular, and the size of the building platform of this machine is 150 mm in diameter and 180 mm in height. In the current investigation, the scan rotation between consecutive layers is 67°. During the process of building the specimen, nitrogen gas is used as a shielding gas to achieve low levels of oxygen and avoid oxidation of the parts.

2.3. Experimental Design and Planning

Experimental tests were conducted utilizing the Taguchi method. Taguchi’s approach involved designing experiments with orthogonal arrays, allowing for the exploration of different combinations of parameters and their associated levels in each experiment. An L9 orthogonal array was employed to investigate the effect of energy density and independent variables, including laser power, scanning speed, layer thickness, and hatch spacing, on four responses: relative density, tensile strength, microhardness, and surface roughness of additively manufactured parts. Table 1 shows the values of the ranges and levels of the independent variables.
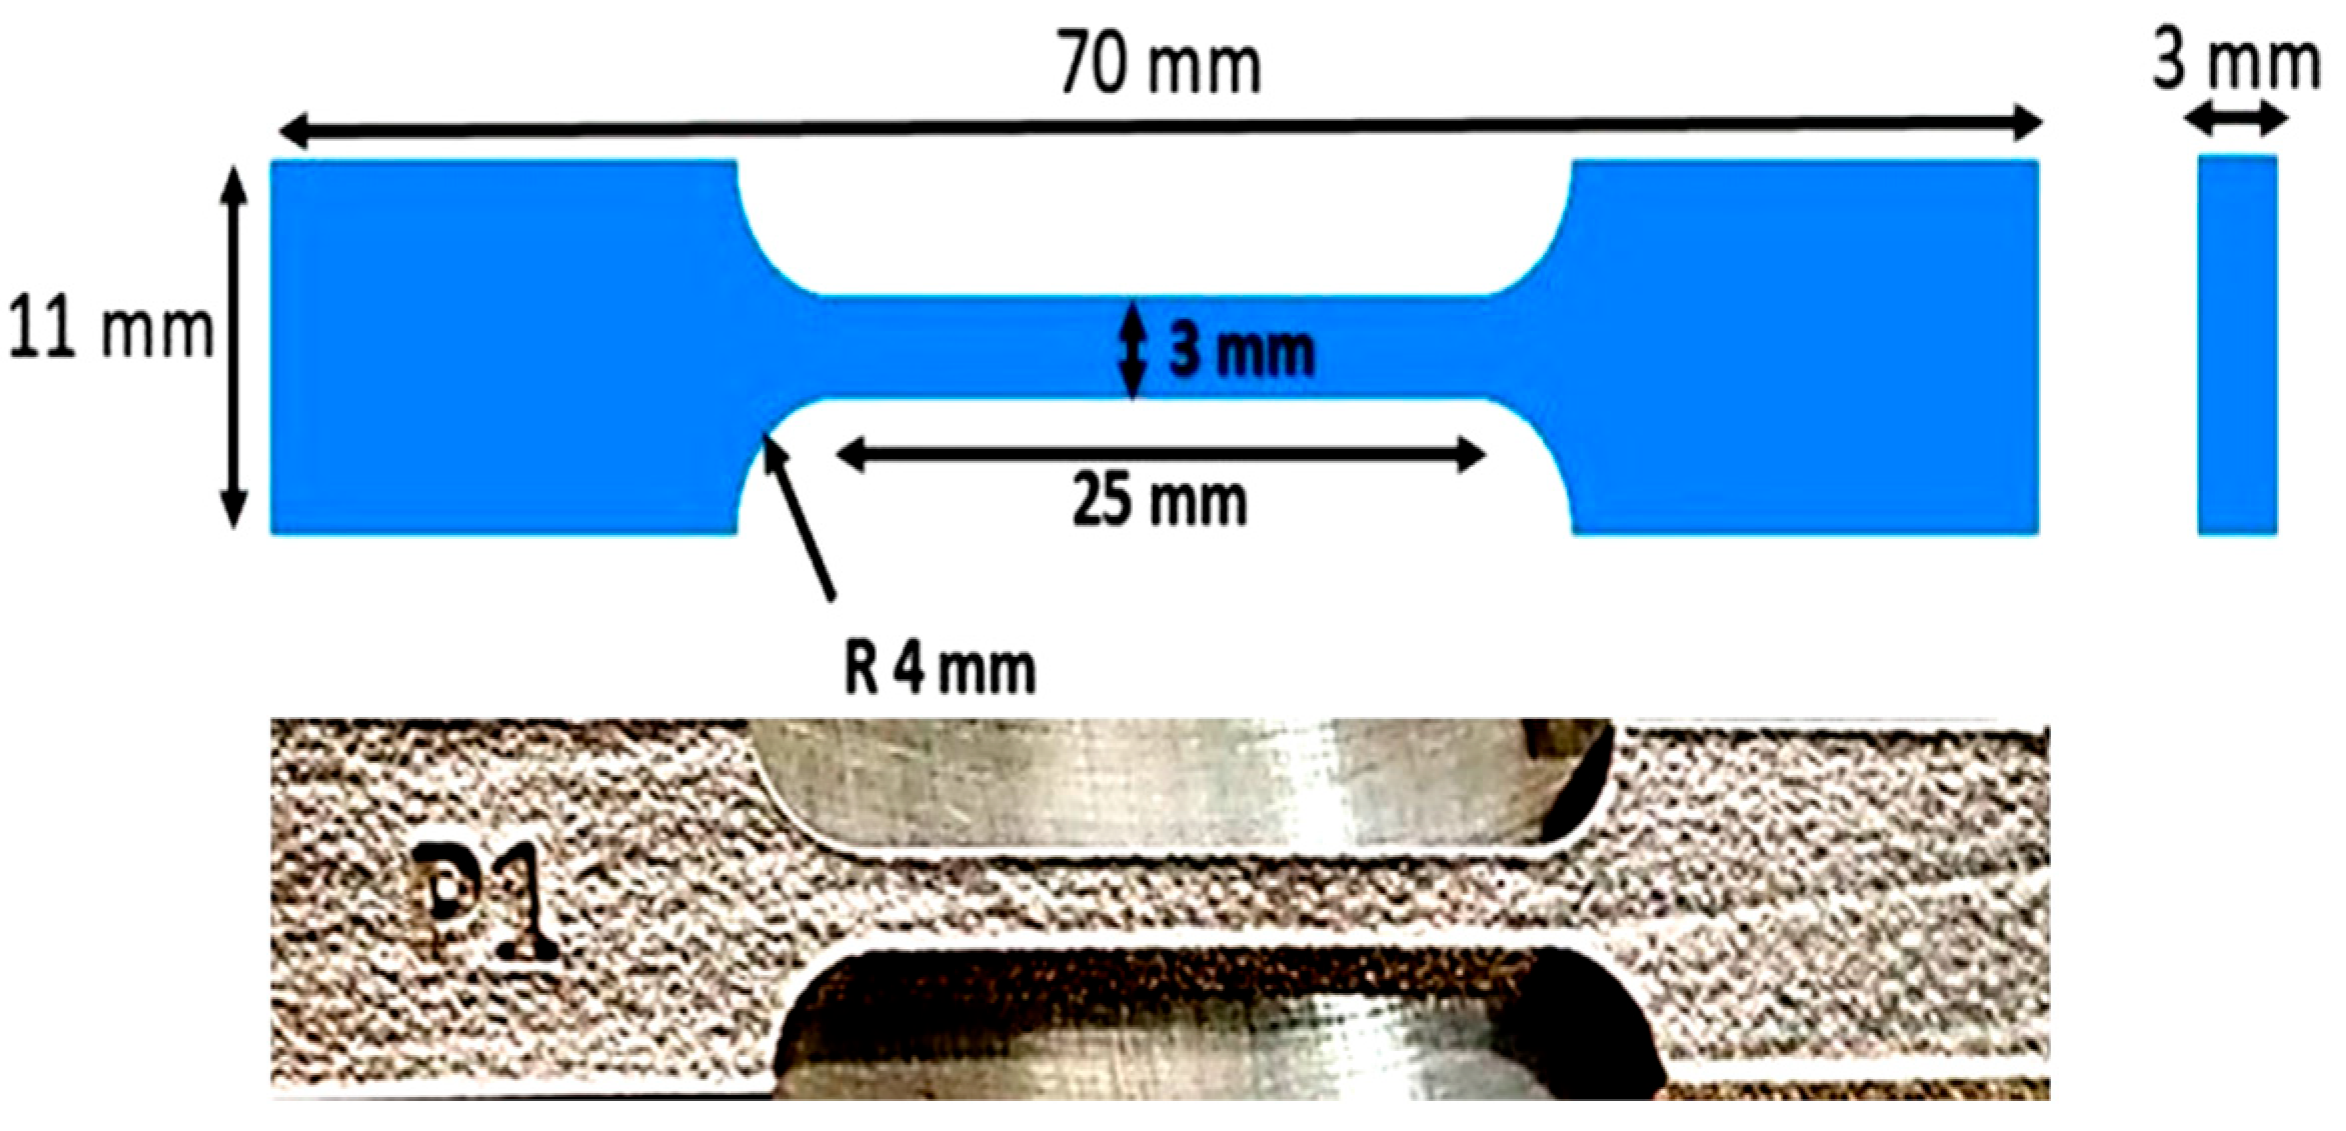
A series of tensile specimens are built to analyze the influence of SLM parameters on the tensile strength, microhardness, microstructure, surface roughness, phase, and relative density. Specimens were designed and printed as per the ASTM E8 standard (as shown in Figure 2). This study includes several input parameters, such as laser power, layer thickness, hatch spacing, and scan speed. To study the effect of input parameters on response variables, energy density as a common factor is used, and all response results are plotted against energy density.

2.4. Calculation of Performance Measures

2.4.1. Calculation of Energy Density (Ed)

The factor for process optimization is the energy density, which is estimated by Equation (1)
E d = P v × h × d
where E d represents the energy density (J/mm3), P represents the laser power (W), v represents the laser scan speed (mm/s), h represents the hatch distance (mm), and d represents the powder bed layer thickness (mm).

2.4.2. Calculation of Relative Density (RD)

Archimedes principle is used for calculating the relative density of additively manufactured specimens. The additively manufactured samples are mounted on a METTLER TODELO analytical precision balance (METTLER TOLEDO Solutions: Giessen, Germany) to conduct the experiment. The relative density (RD) is calculated using Equation (2) below.
R e l a t i v e   d e n s i t y = W e i g h t   o f   t h e   s a m p l e   i n   a i r   ( W 1 ) W e i g h t   o f   t h e   s a m p l e   i n   a i r   W 1 W e i g h t   o f   t h e   s a m p l e   i n   w a t e r   ( W 2 )

2.4.3. Calculation of Surface Roughness (Ra)

The surface roughness of as-built samples is examined with the MarSurf XR20 equipment (SWISS Instruments Limited: Mississauga, ON, Canada). For each specimen, surface roughness is measured five times, and after recording the results, the average value of all five results is calculated, and that value is considered a final measurement. This process is repeated for all twenty-nine runs.

2.4.4. Calculation of Microhardness

For measuring the hardness of the as-built parts, ZHR Rockwell hardness tester (ZHR8150CLK) is used. ASTM E18 standard is used while performing experiments. Rockwell hardness is measured under a load of 150 kgf. The microhardness test is conducted ten times on the top surface of the as-built parts. After recording the hardness values, the average of ten values is considered the final measurement.

2.4.5. Calculation of Tensile Strength

To analyze the mechanical properties of 13Ni400, tensile tests were performed according to the ASTM E8 standard by using a universal testing machine. The INSTRON 8516 tensile testing machine was used to perform experiments and is equipped with a 25 mm elongation extensometer. A SEM analysis revealed the fractography of the tensile specimens. Table 2 shows the experimental design matrix for the parameters created using Taguchi method, as well as the obtained performance measures.

3. Results and Discussion

3.1. Relative Density

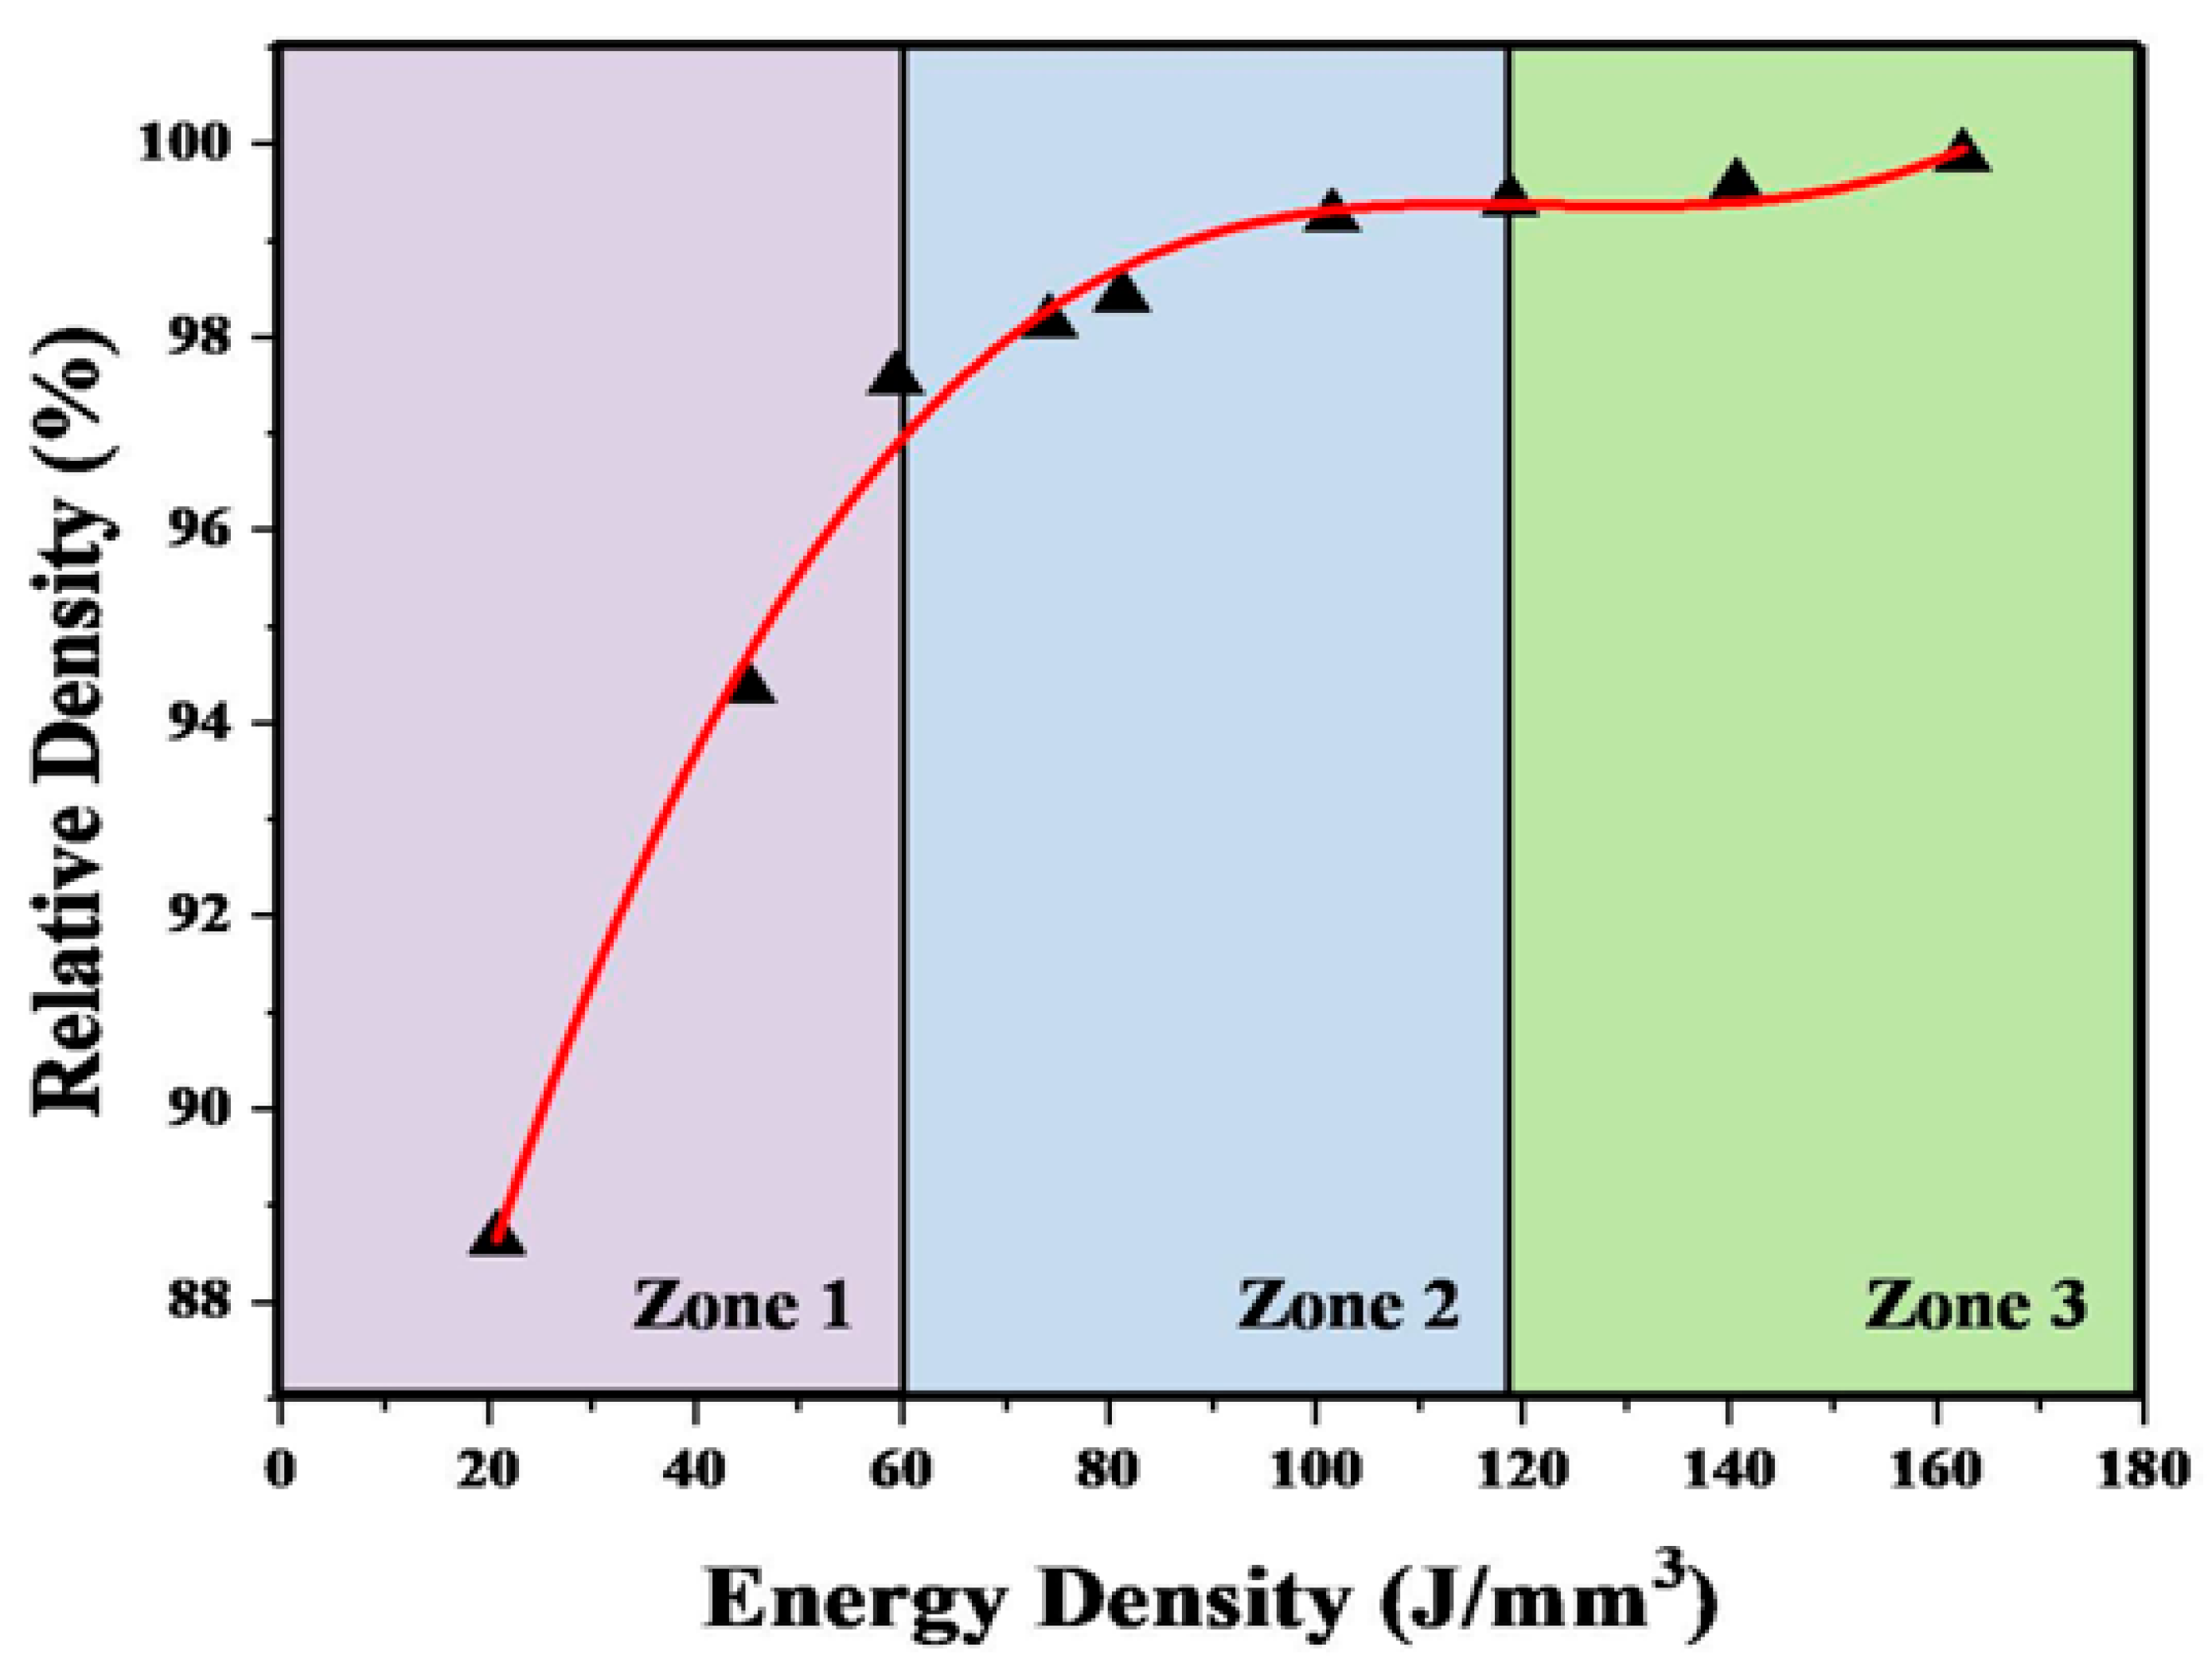
Relative density is one important parameter of the design matrix used in this study and was measured by the Archimedes principle, which is represented in Equation (2). Figure 3 represents the relationship between energy density (Ed) and relative density. Relative density is measured in terms of percentage.
It is seen from Figure 3 that relative density increases as energy density increases. The energy density (Ed) varies from 20.83 to 162.50 J/mm3. There is a sharp rise in the value of relative density in zone 1. The minimum value of relative density is found at Ed = 20.83 J/mm3. As Ed increases, the density of the build specimen increases, with typical values between 88 and 97%. In zone 2, it is observed that relative density is relatively constant with respect to energy density. The maximum value of relative density is found in zone 3 when Ed = 162.50 J/mm3. The theoretical density of this material is 8.15 g/cm3, indicating that the relative density of fabricated parts varies between 88.65 and 99.87%, attaining virtually full density. It is observed that using intermediate values of laser power, scan speed, and hatch spacing results in the highest density. It is also clear that if the layer thickness is too large, the relative density will suffer. Whenever the laser power exceeds a specific threshold, the metal molten pool experiences severe evaporation and dispersion, resulting in a shortage of liquid metal to fill the molten track and many gaps, causing the relative density to drop.

3.2. Surface Roughness

Figure 4 represents the variation of surface roughness (Ra) with respect to energy density. For all nine samples, the surface roughness value is measured for a 5 mm travel length, and values are recorded at three different spots. The mean of all Ra values is considered while plotting the graph.
As illustrated in Figure 4, the surface roughness (Ra) value decreases as energy density increases. There is a brisk drop in the value of surface roughness in zone 1. In this zone, the surface roughness (Ra) value decreases from 8.37 μm to 5 μm. In zone 2, it is observed that the rate of drop in the value of surface roughness is relatively slower as compared with zone 1. In this zone, surface roughness is between 4.97 μm and 2.64 μm. The minimum value of surface roughness of 2.31 μm is found in zone 3 when Ed is between 140 J/mm3 and 165 J/mm3. It is observed that samples prepared with lower laser power support produce defects in fabricated parts, which create hills and valleys on the surface of additively manufactured parts. Thus, laser power plays an important role in achieving a good surface finish because, because of the higher value of laser power, effective melting of the powder is observed.

3.3. Microstructure

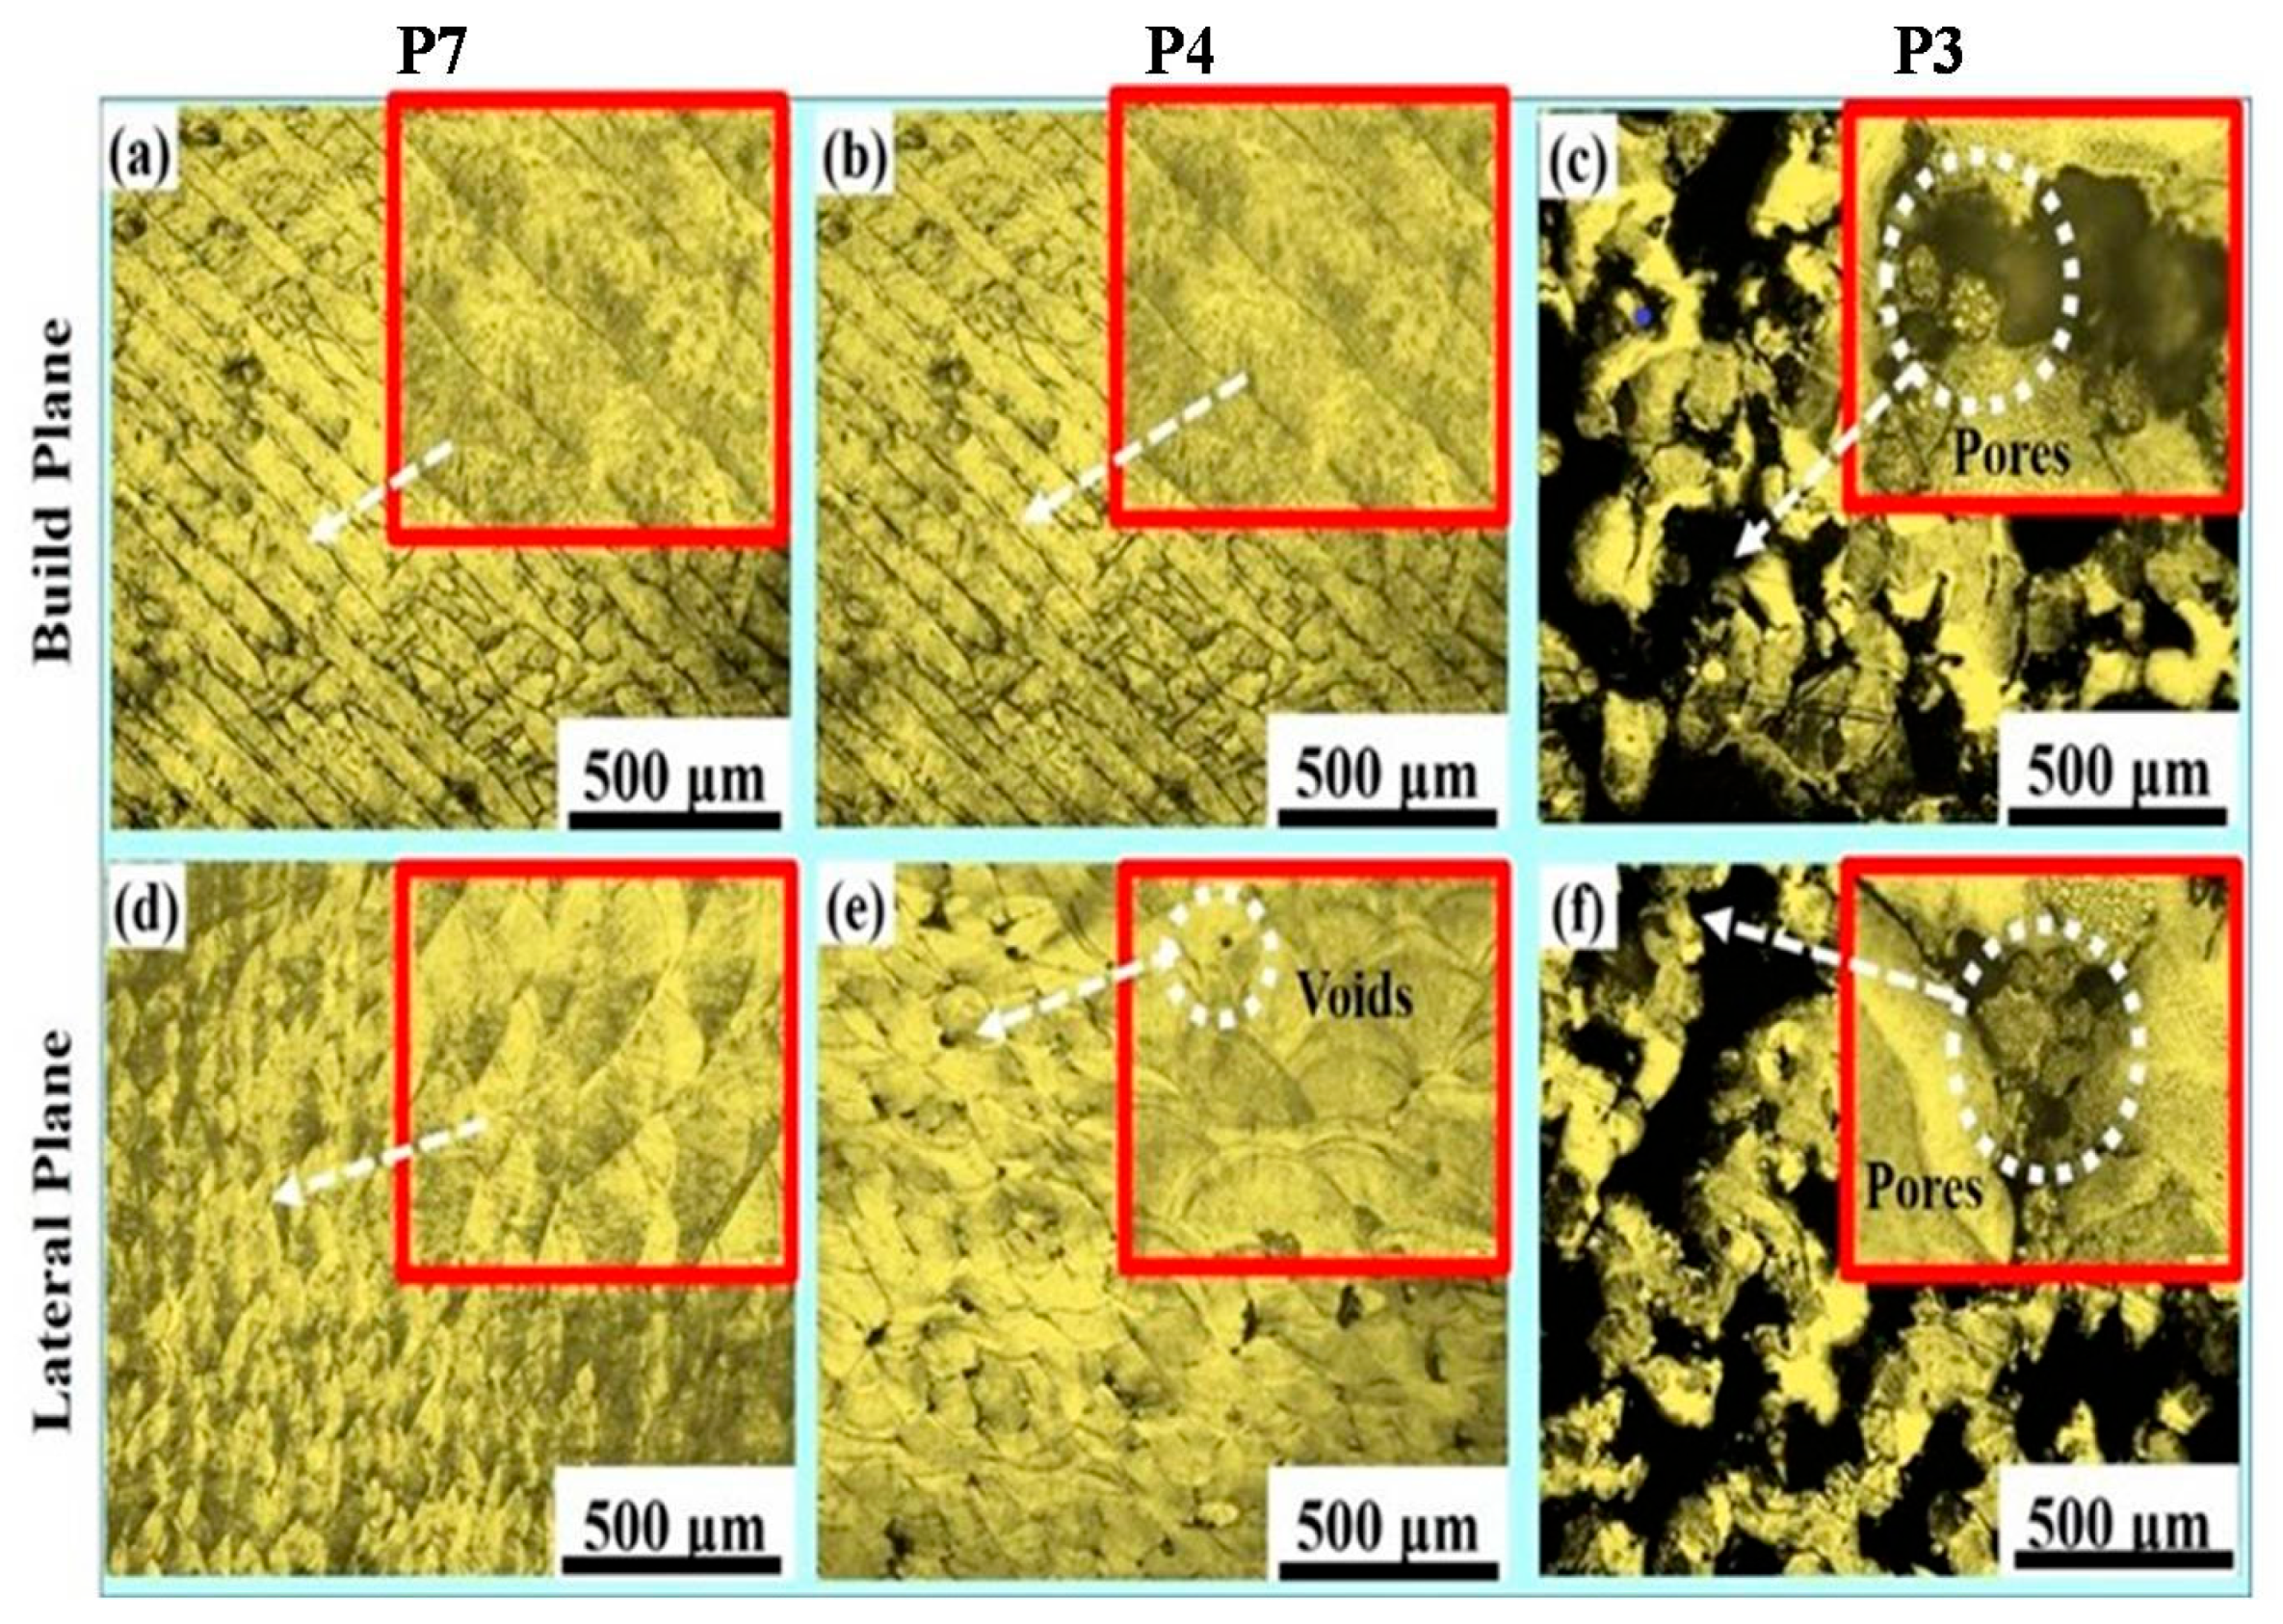
Under the action of a laser, metal powder transforms from a solid state to a liquid state, and the crystal grains grow and rearrange to form a component. Figure 5a–f depicts optical microscope (OM) pictures of completed specimens in build plane (horizontal) and lateral plane (vertical) cross sections for varied relative densities. It is observed that relative density is the most important factor that affects the mechanical properties of the parts. Therefore, the samples with lower, medium, and higher values of tensile strength are examined by optical microscopy. Figure 5a,b shows the clear laser scan tracks on the build plane at lower magnification of the optical microscope. It is found that for specimens P7 and P4, the powder of maraging steel 13Ni400 is completely melted, and the crystallization structure of the melted areas has a semi-elliptical shape. Figure 5c shows improper melting of the powder for sample number P3. Figure 5d shows that on the lateral plane, metal powders are fused together and a semi-elliptical pattern is formed, whereas in Figure 5e, along with that same pattern of grains, some voids are observed. Partial melting causes significant porosity at lower energy densities. As a result, irregular scanning traces with large spheres and pores are formed, as revealed in Figure 5f.
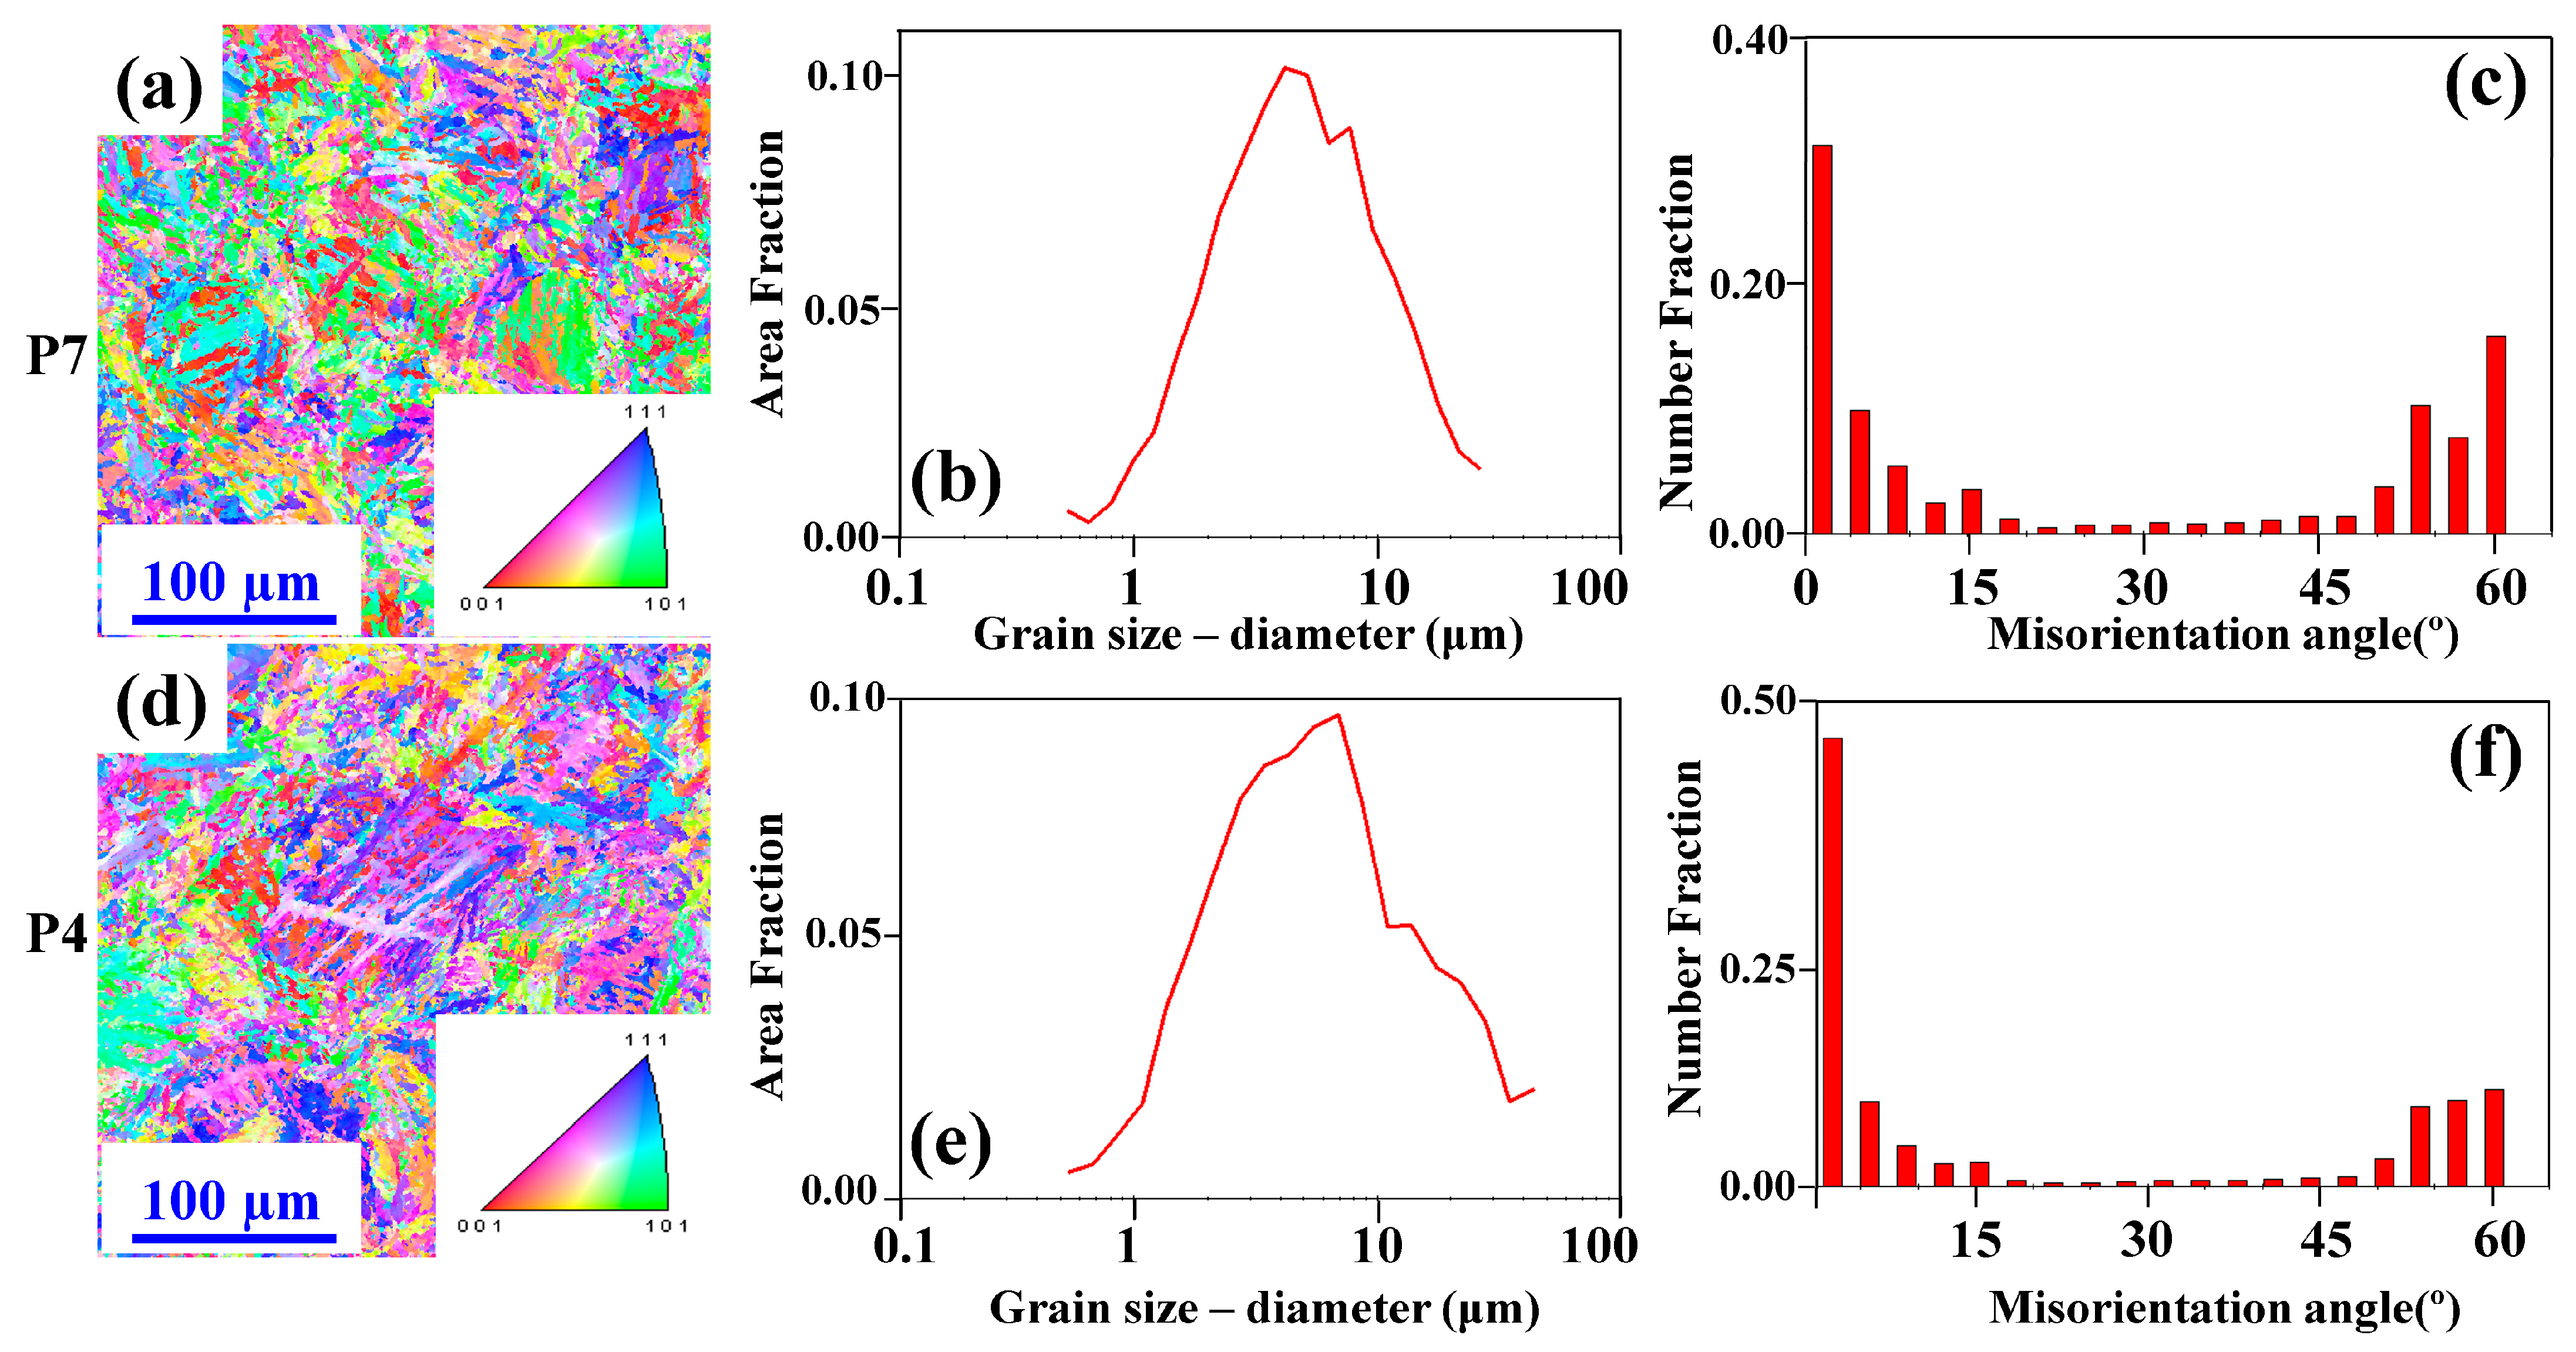
Figure 6a–i shows scanning electron microscopic images for various build conditions. From Figure 6, it is observed that in samples P7 and P4, grain boundaries are visible at higher magnification with columnar and cellular (equiaxed) crystal morphology. It is observed that the length and width of the columnar crystals are between 35.24–71.19 μm and 0.61–0.74 μm, respectively. For the equiaxed crystals, the size is between 0.35 and 0.82 μm. Moreover, in parts P7 and P4, the same crystal grains are observed. Again, in part number P3, a greater number of voids and irregular balls are formed. A smaller energy density results in improper melting, hence the balling effect observed. Less laser power and low scanning speed can be the reasons for the balling effect. This negative impact might cause the liquid scan track to break apart during SLM, resulting in spherical-shaped particles. Hence, it can be concluded that limited liquid formation results in balling occurrences, while sufficient liquid formation generates continuous tracks. A higher cooling rate slowed crystal grain development, resulting in smaller crystal grains. It is observed in Part P7 that the maximum number of equiaxed crystals is present, whereas in Part P4, columnar crystals are more prevalent. Similar observations were also reported by previous researchers [21]. Figure 7 shows the image quality (IQ), average grain size, and misorientation angle of grains for samples P7 and P4.
Figure 7a shows the microstructural image of sample P7, indicating a prevalence of fine grains and a limited number of columnar grains. The dominant grain orientations are observed along the (111) and (101) planes. Moving on to Figure 7b, the average grain size of sample P7 is quantified as 5.18 ± 0.05 µm. This sample exhibits a higher percentage of equiaxed grains, leading to a more uniform distribution of stresses and improved mechanical performance. Sample P7 has smaller grain sizes, which make the material stronger and harder. This is because smaller grain sizes increase the grain boundary area, leading to better mechanical properties. Figure 7c displays the high-angle (HAGB) and low-angle grain boundaries (LAGB) in the microstructure of sample P7. It is found that approximately 51% of the grain boundaries fall into the high-angle category. Such high-angle grain boundaries impede grain growth during processing and contribute to strengthening the material.
Figure 7d illustrates the microstructural image of sample P4, where a relatively high grain orientation is observed along the (111) and (101) planes, suggesting a random orientation of grains. Figure 7e shows that the average grain size of sample P4 is measured at 9.74 ± 0.10 µm, which is higher compared with sample P7. The analysis further reveals that sample P4 exhibits a considerably higher proportion (61.48%) of low-angle grain boundaries in Figure 7f compared with the percentage of HAGB. The superior performance of sample P7 over sample P4 can be attributed to several key factors observed during the experimental analysis. Notably, sample P7 possesses a smaller average grain size diameter (5.28 μm) compared with sample P4 (9.74 μm). The combination of a smaller average grain size, a higher proportion of equiaxed grains, and a greater fraction of high-angle grain boundaries in sample P7 results in its superior mechanical properties and overall strength compared with sample P4 under the given conditions.

3.4. XRD Analysis

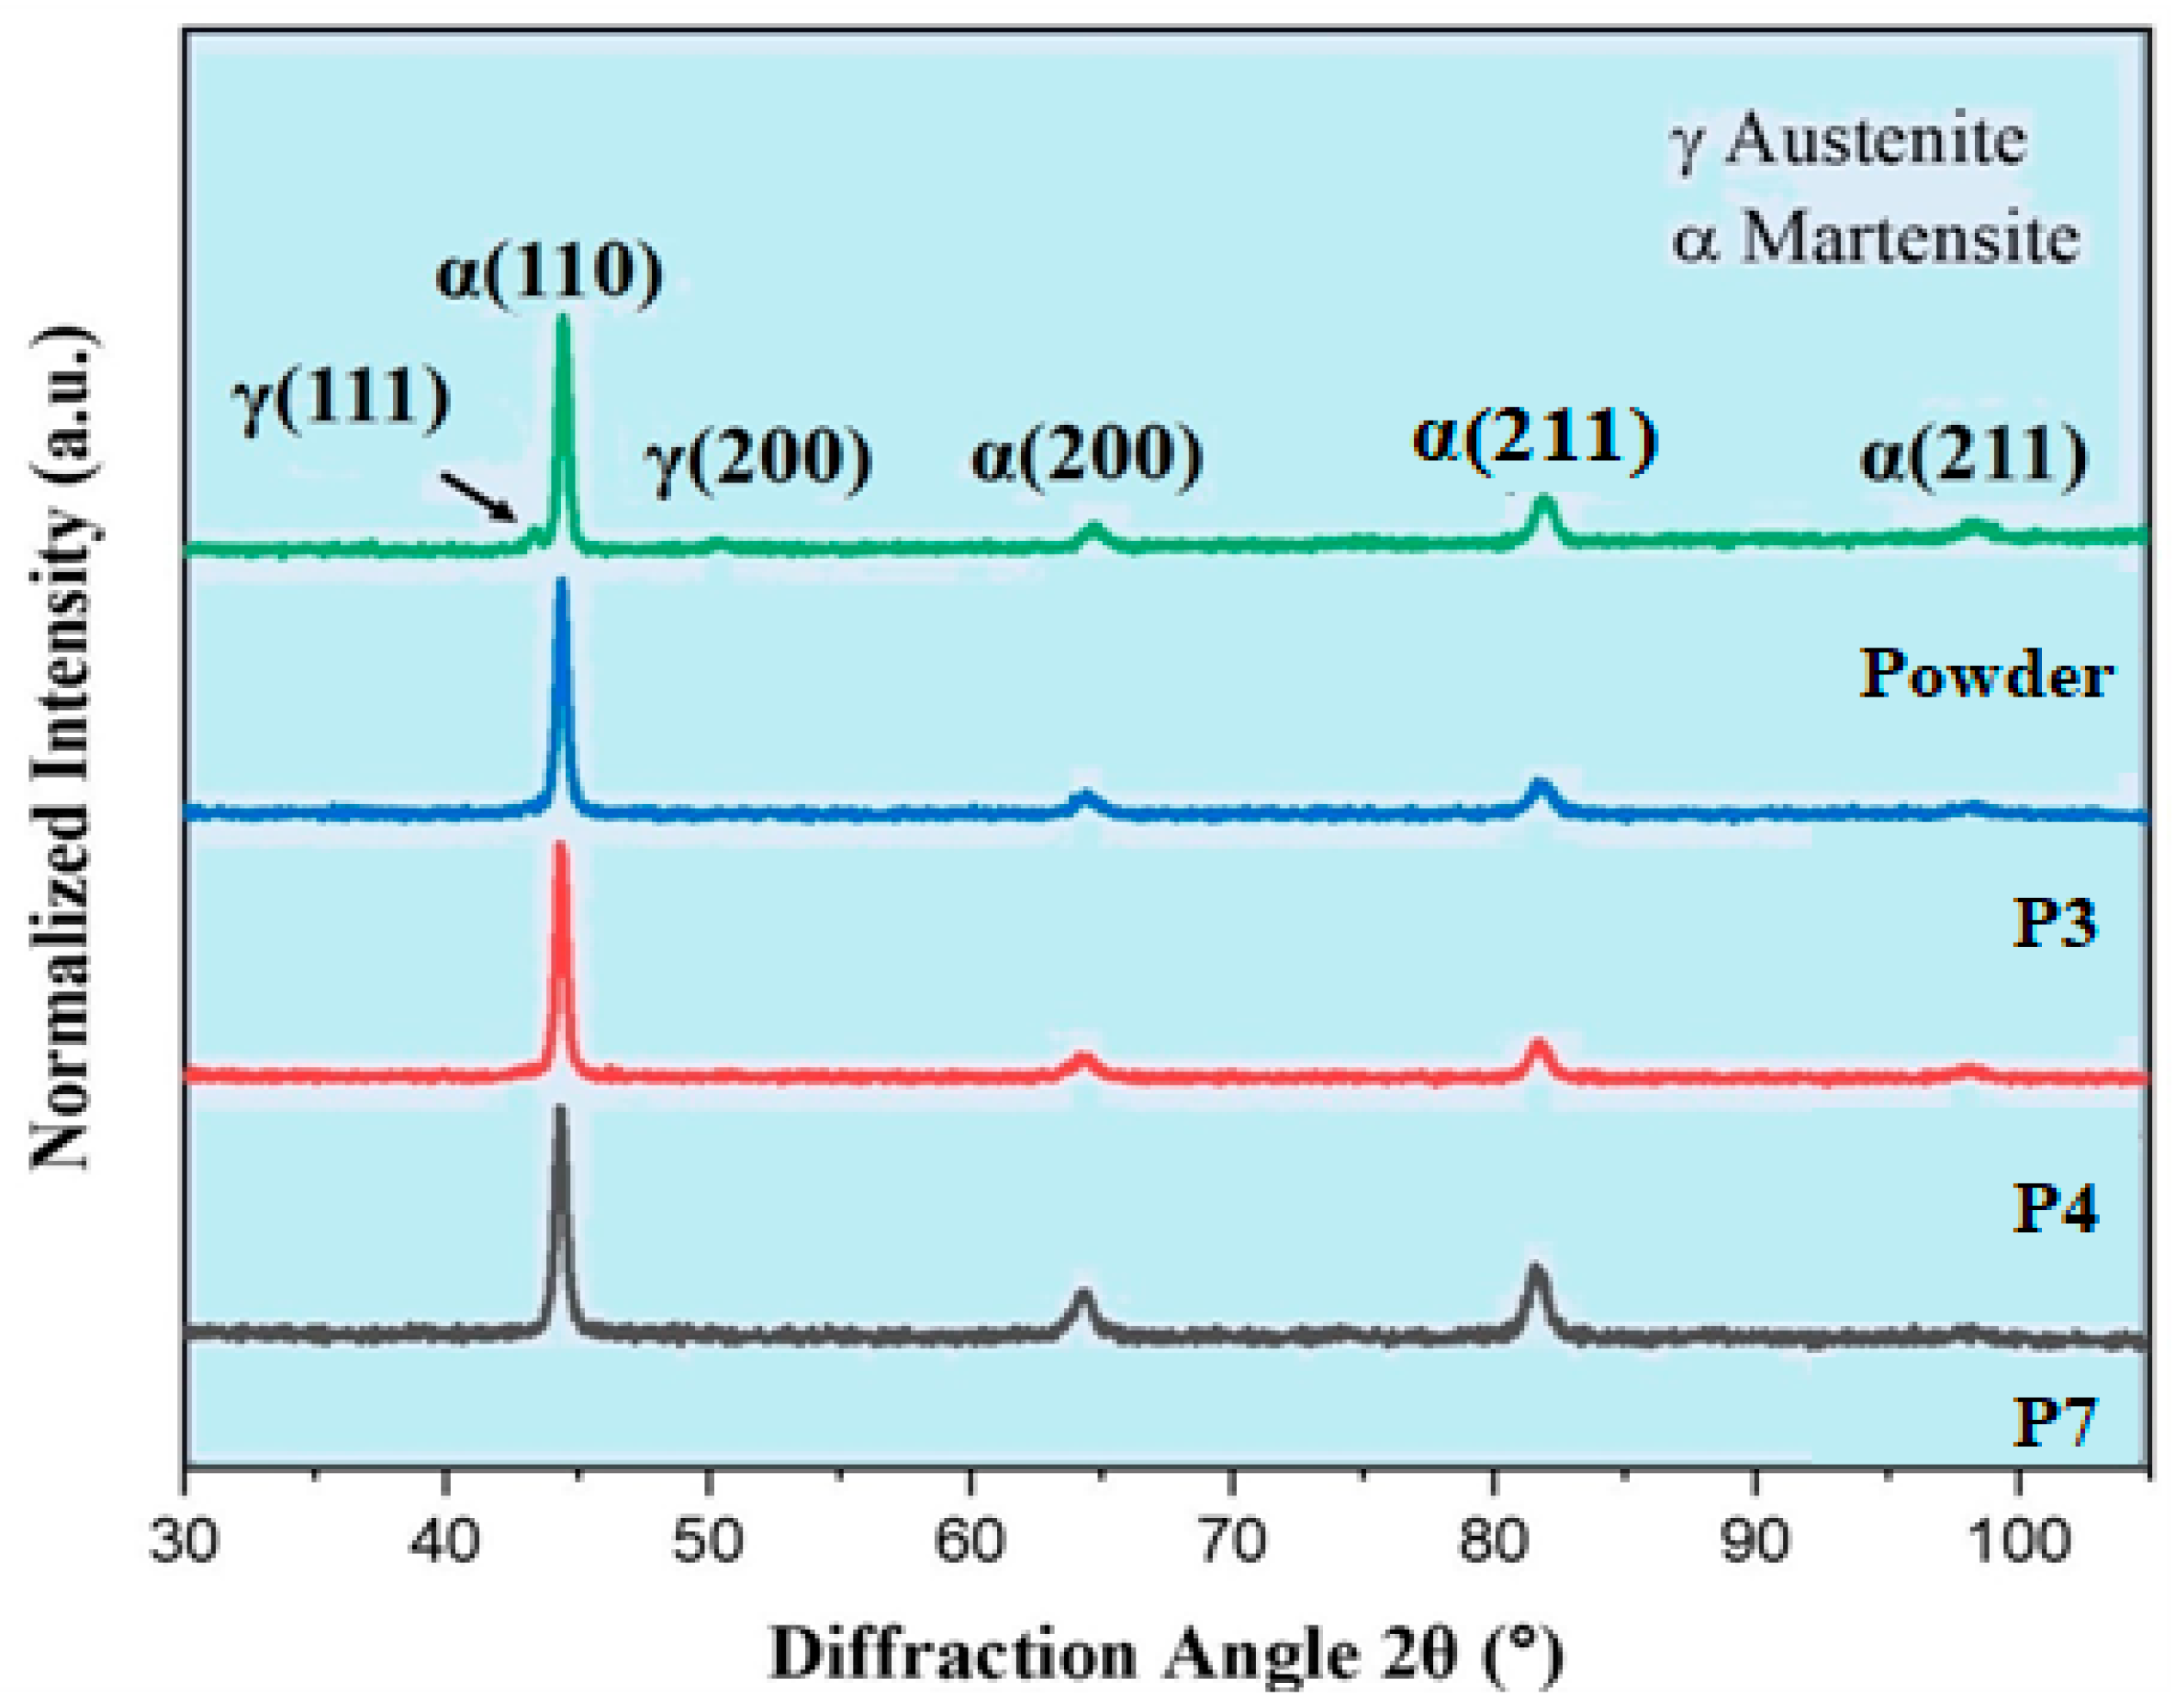
Figure 8 shows the comparison of XRD patterns for raw powder along with built parts at various process parameter combinations. Raw powder includes predominantly martensite (α) and very few traces of the austenite (γ) phase, as can be seen in the XRD pattern of fabricated parts P7, P4, and P3.
The phase composition of the as-built parts (P7, P4, and P3) formed by SLM is nearly identical to that of raw powder, while the austenite (γ) phase in the raw powder pattern (111) is unseen after part formation by SLM. The α phase diffraction peaks in the as-built sample change to small diffraction angles, indicating an increase in lattice parameters (a = 0.2886 nm) over the raw powder (0.2879 nm), which may be interpreted as the solute entrapment phenomenon in SLM caused by non-equilibrium rapid solidification. It is observed that the intensity of the austenite (γ) phase in raw powder (200) and (220) is reduced in the as-built samples.

3.5. Microhardness

Figure 9 depicts the relationship between microhardness and energy density. For each sintered item, hardness is measured at five spots with a load of 10 kgf, followed by 150 kgf for a 10 s dwell time, and the mean microhardness value is considered while plotting the graph.
It is noticed that, as the energy density changes from 20.83 J/mm3 to 162.50 J/mm3, the hardness value increases from 25 to 44 HRC. The increase in hardness was particularly prominent in “zone 1” of the sample, which refers to a specific region or area within the material that underwent the laser processing. In this zone, the microhardness (localized hardness on a small scale) showed a substantial rise with changing energy density. On the other hand, “zone 2” of the sample displayed only minor variations in microhardness when the energy density changed between 60 and 120 J/mm3. This suggests that the effect of energy density on the microhardness in this zone was not as pronounced as in zone 1. This study found that the highest microhardness value of 44 HRC was achieved in “zone 3” when the energy density was 162.50 J/mm3. The reason behind this observation is related to the laser power used during the processing. Higher laser power translates to increased energy input, which results in a more rapid rate of melting and deposition during the building process. This, in turn, causes a greater degree of material transformation and solidification, leading to higher microhardness in zone 3. Similar observations are also reported elsewhere [23].
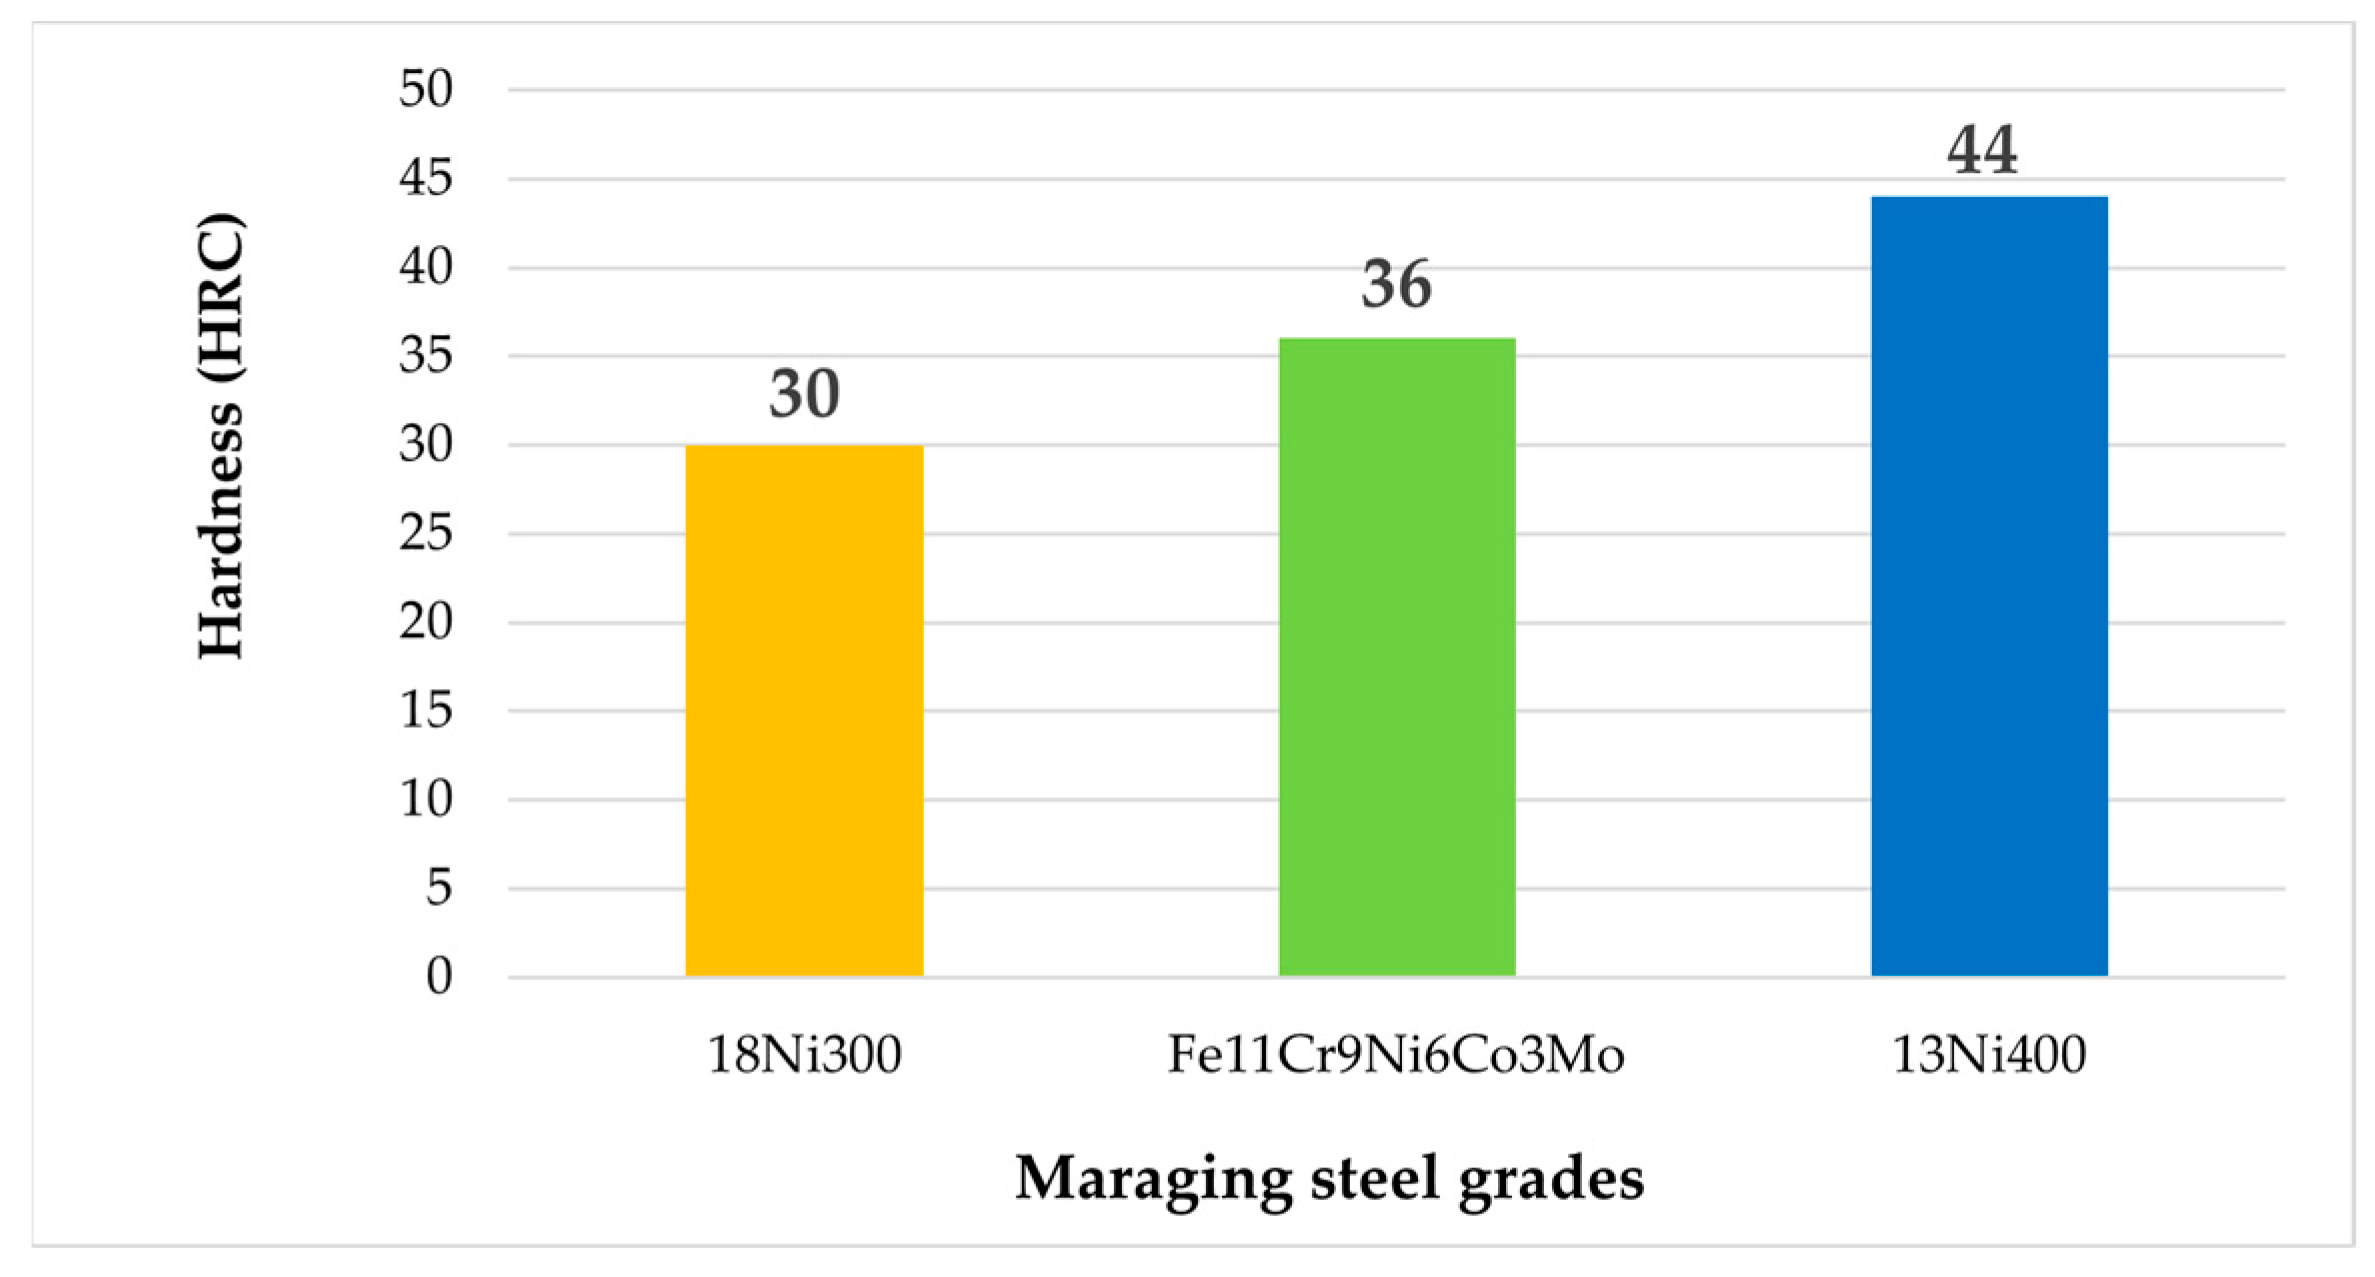
Figure 10 shows the comparison of microhardness values obtained for various grades of maraging steel with 13Ni400 grade. The findings from the comparison indicate that the 13Ni400 grade of maraging steel exhibits a higher level of hardness when compared with two other grades, namely 18Ni300 and Fe11Cr9Ni6Co3Mo [27]. The reason behind the higher hardness of the 13Ni400 grade can be attributed to the presence of a higher weight percentage of cobalt (Co) in its composition. Cobalt plays a crucial role in enhancing the material’s strength through two processes: solid solution hardening and ordering during precipitation. Solid solution hardening refers to the strengthening effect that occurs when atoms of different elements are incorporated into the crystal lattice of the base material. In this case, cobalt atoms are introduced into the structure of the maraging steel, which increases its hardness. Moreover, during the precipitation process, which involves the formation of new phases within the material, the presence of cobalt further reinforces the steel’s structure, contributing to its hardness. Although cobalt itself does not directly participate in any precipitation reactions, its presence facilitates the formation of stronger precipitates, leading to improved hardness characteristics [29]. In the Fe-Ni-Mo (Iron-Nickel-Molybdenum) alloy system, cobalt has a remarkable impact on enhancing age hardness, even though it does not directly participate in the precipitation reactions. This means that cobalt plays a crucial role in improving the alloy’s mechanical properties, making it stronger and more durable over time.

3.6. Tensile Test

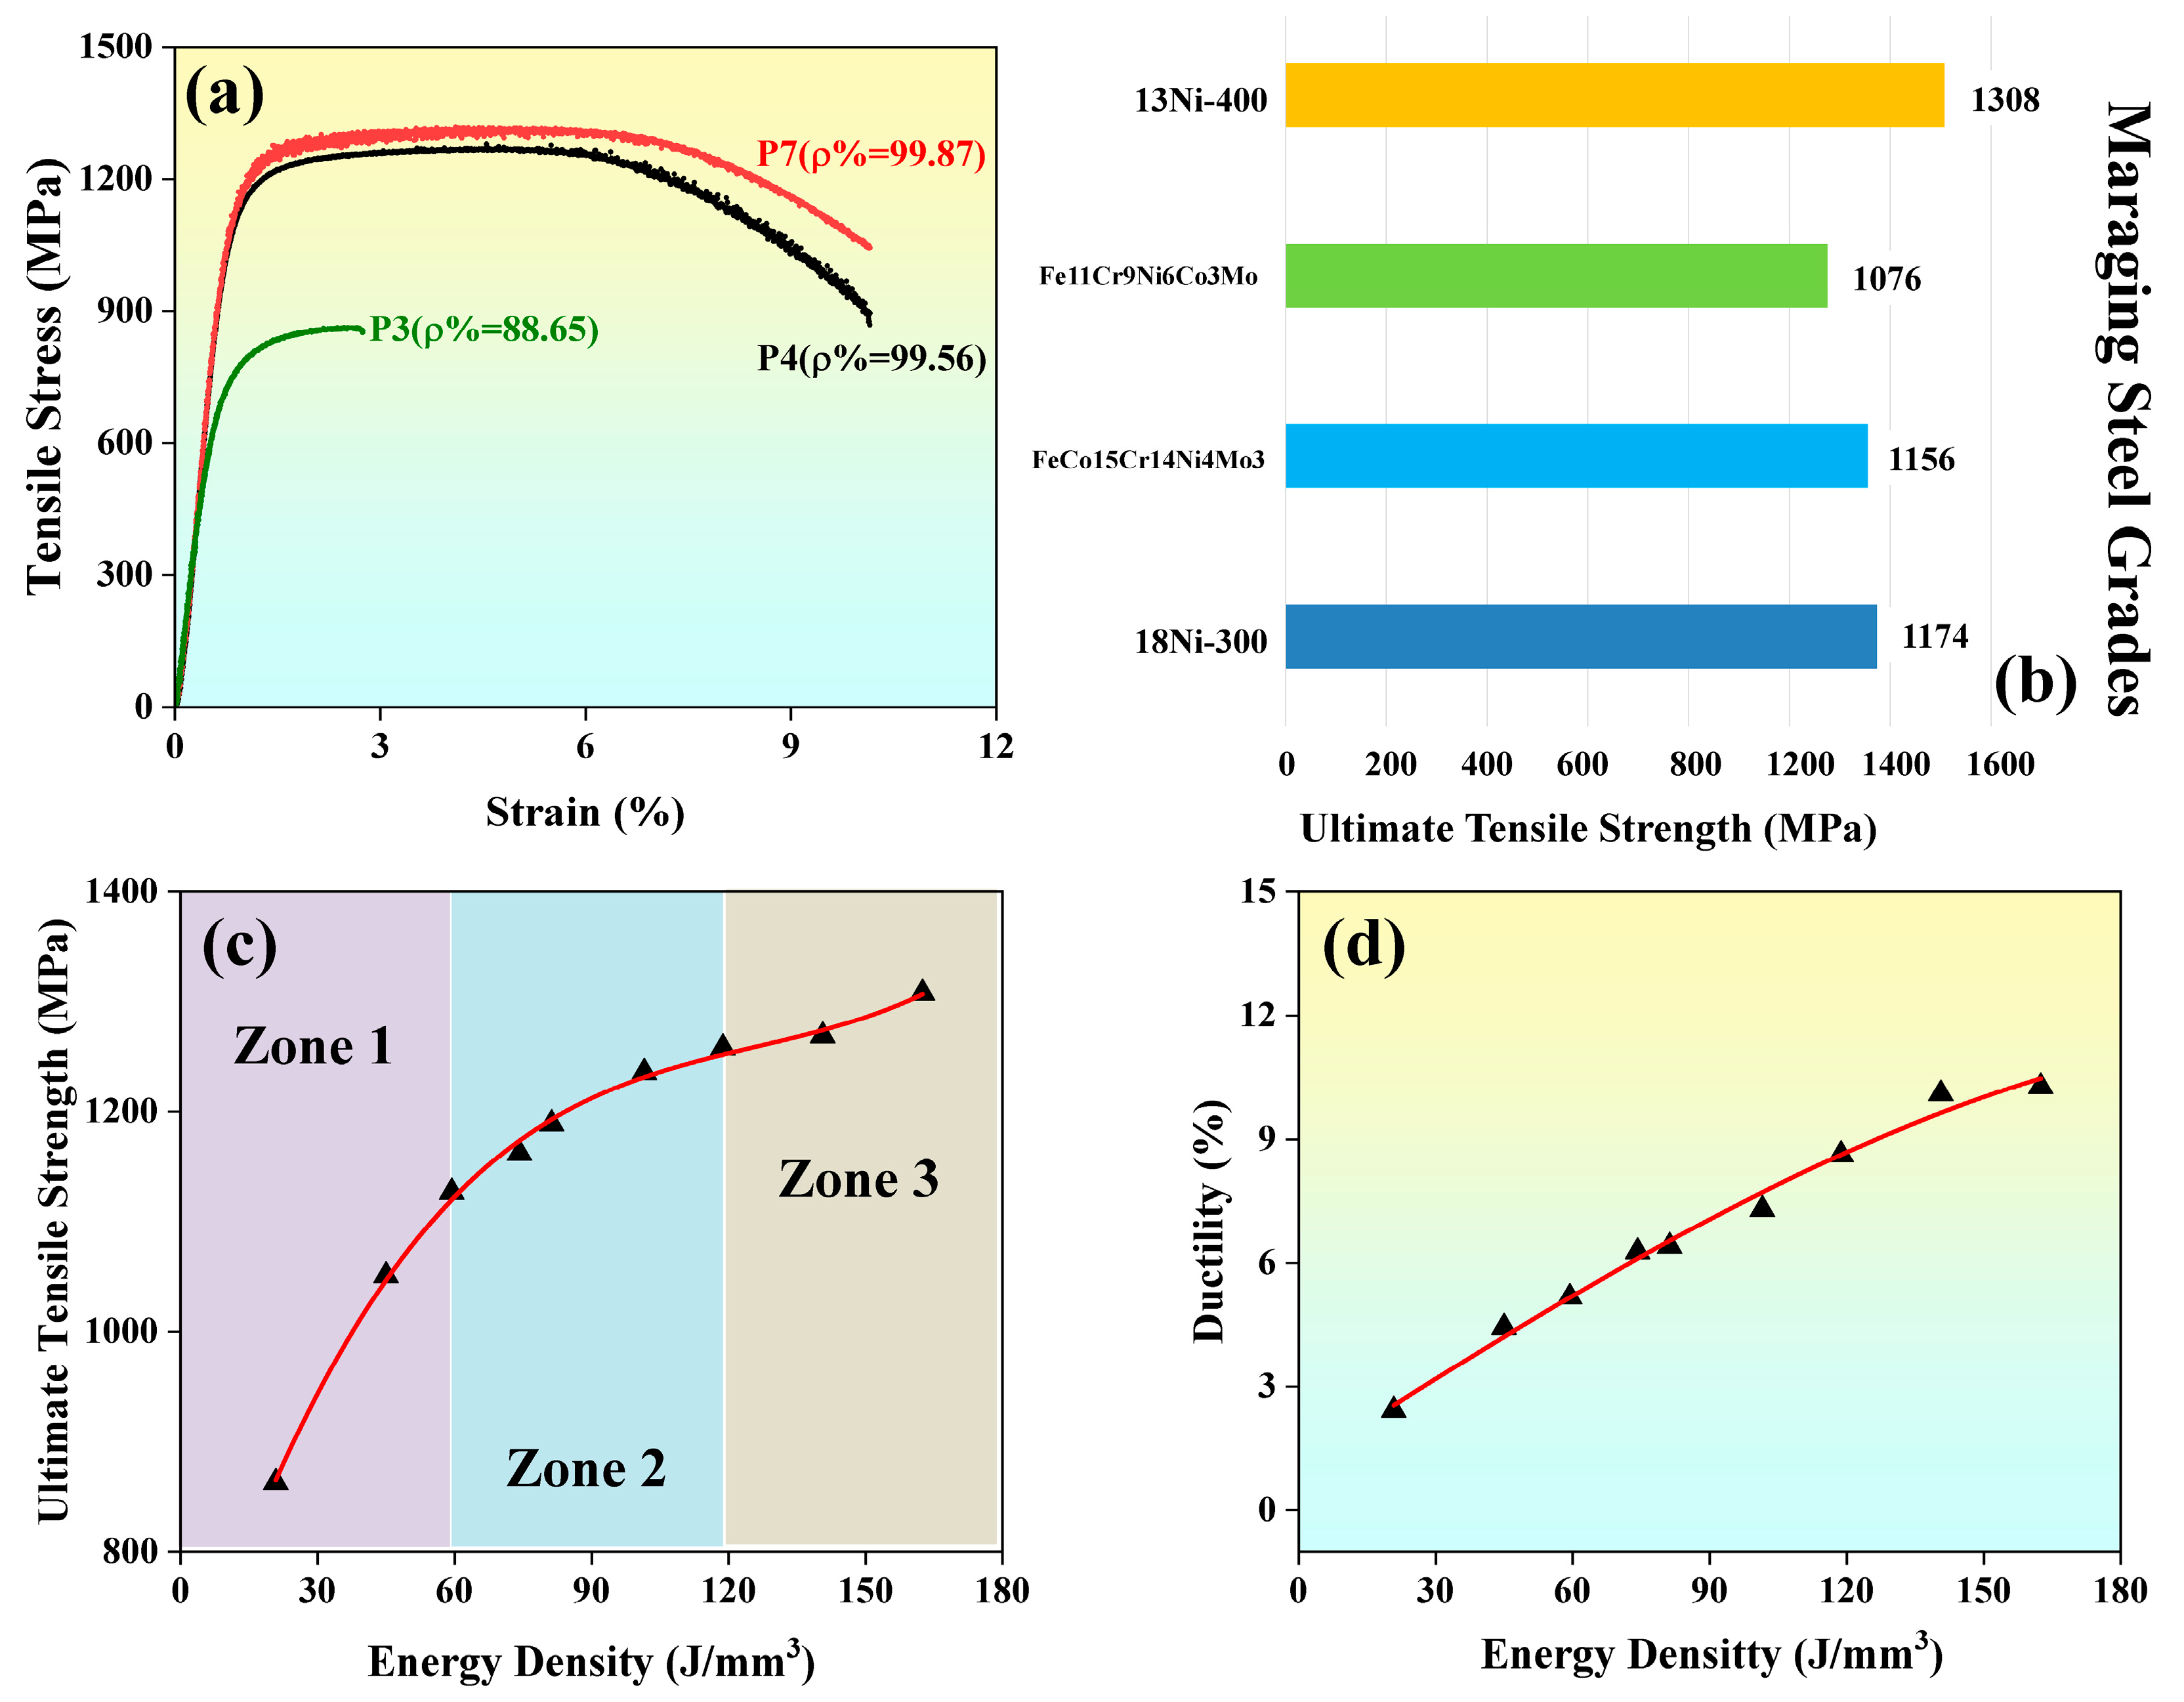
Figure 11a–d shows the stress strain curve, comparisons of ultimate tensile strength values for different grades of maraging steel, a graph of energy density vs. yield strength, and a graph of energy density vs. ductility, respectively. The stress strain curves for the parts P7, P4, and P3 are shown in Figure 11a. After the successful completion of nine experimental runs for the manufactured parts, it was noticed that the ultimate tensile strength of the samples varied from 863 MPa to 1308 MPa. The specimen with relative densities between 88.65% and 97.56% exhibits poor tensile behavior, whereas the specimen with a relative density between 97.56% and 99.87% retains superior strength as well as elongation. For all specimens, fracture elongation ranges from 2.43% to 10.27%.
Figure 11b shows the comparison of ultimate tensile strength values obtained for various grades of maraging steel with 13Ni400 grade. According to Figure 11b, 13Ni400 grade has a higher ultimate tensile strength than 18Ni300, FeCo15Cr14Ni4Mo3, and Fe-11Cr-9Ni-6Co-3Mo grade of maraging steels [18,19]. This is due to the higher percentage of molybdenum (Mo) in the 13Ni400 maraging steel as compared with other grades. In maraging steel, molybdenum acts as a relatively strong precipitation-hardening element. Molybdenum gradually improves the strength of the Fe-Ni matrix through solid solution hardening and aging when added in lower concentrations [29]. Figure 11c depicts the variance in yield strength with respect to energy density for the nine built parts, and the ultimate tensile strength of the samples varies from 1308 MPa to 863 MPa. The yield strength values show a brisk rise with an increase in energy density from 20–60 J/mm3, and this is because the increase in laser power improves the rate of melting of powder. There is a steady rise in the value of yield strength while energy density increases by 60–160 J/mm3. Increasing laser power generates more heat, and that is the reason for proper melting and the production of impermissible bonds between two layers, which results in an increase in the ultimate tensile strength of the as-built parts. Figure 11d shows the variation of ductility with respect to energy density. As energy density increases, the ductility of the built parts also improves, from 2.5% to 10.2%. The parts with lower energy densities show lesser ductility as improper melting is observed because of less laser power. A higher value of laser power increases the rate of melting and deposition in the built parts, which in turn causes a rise in the value of ductility.
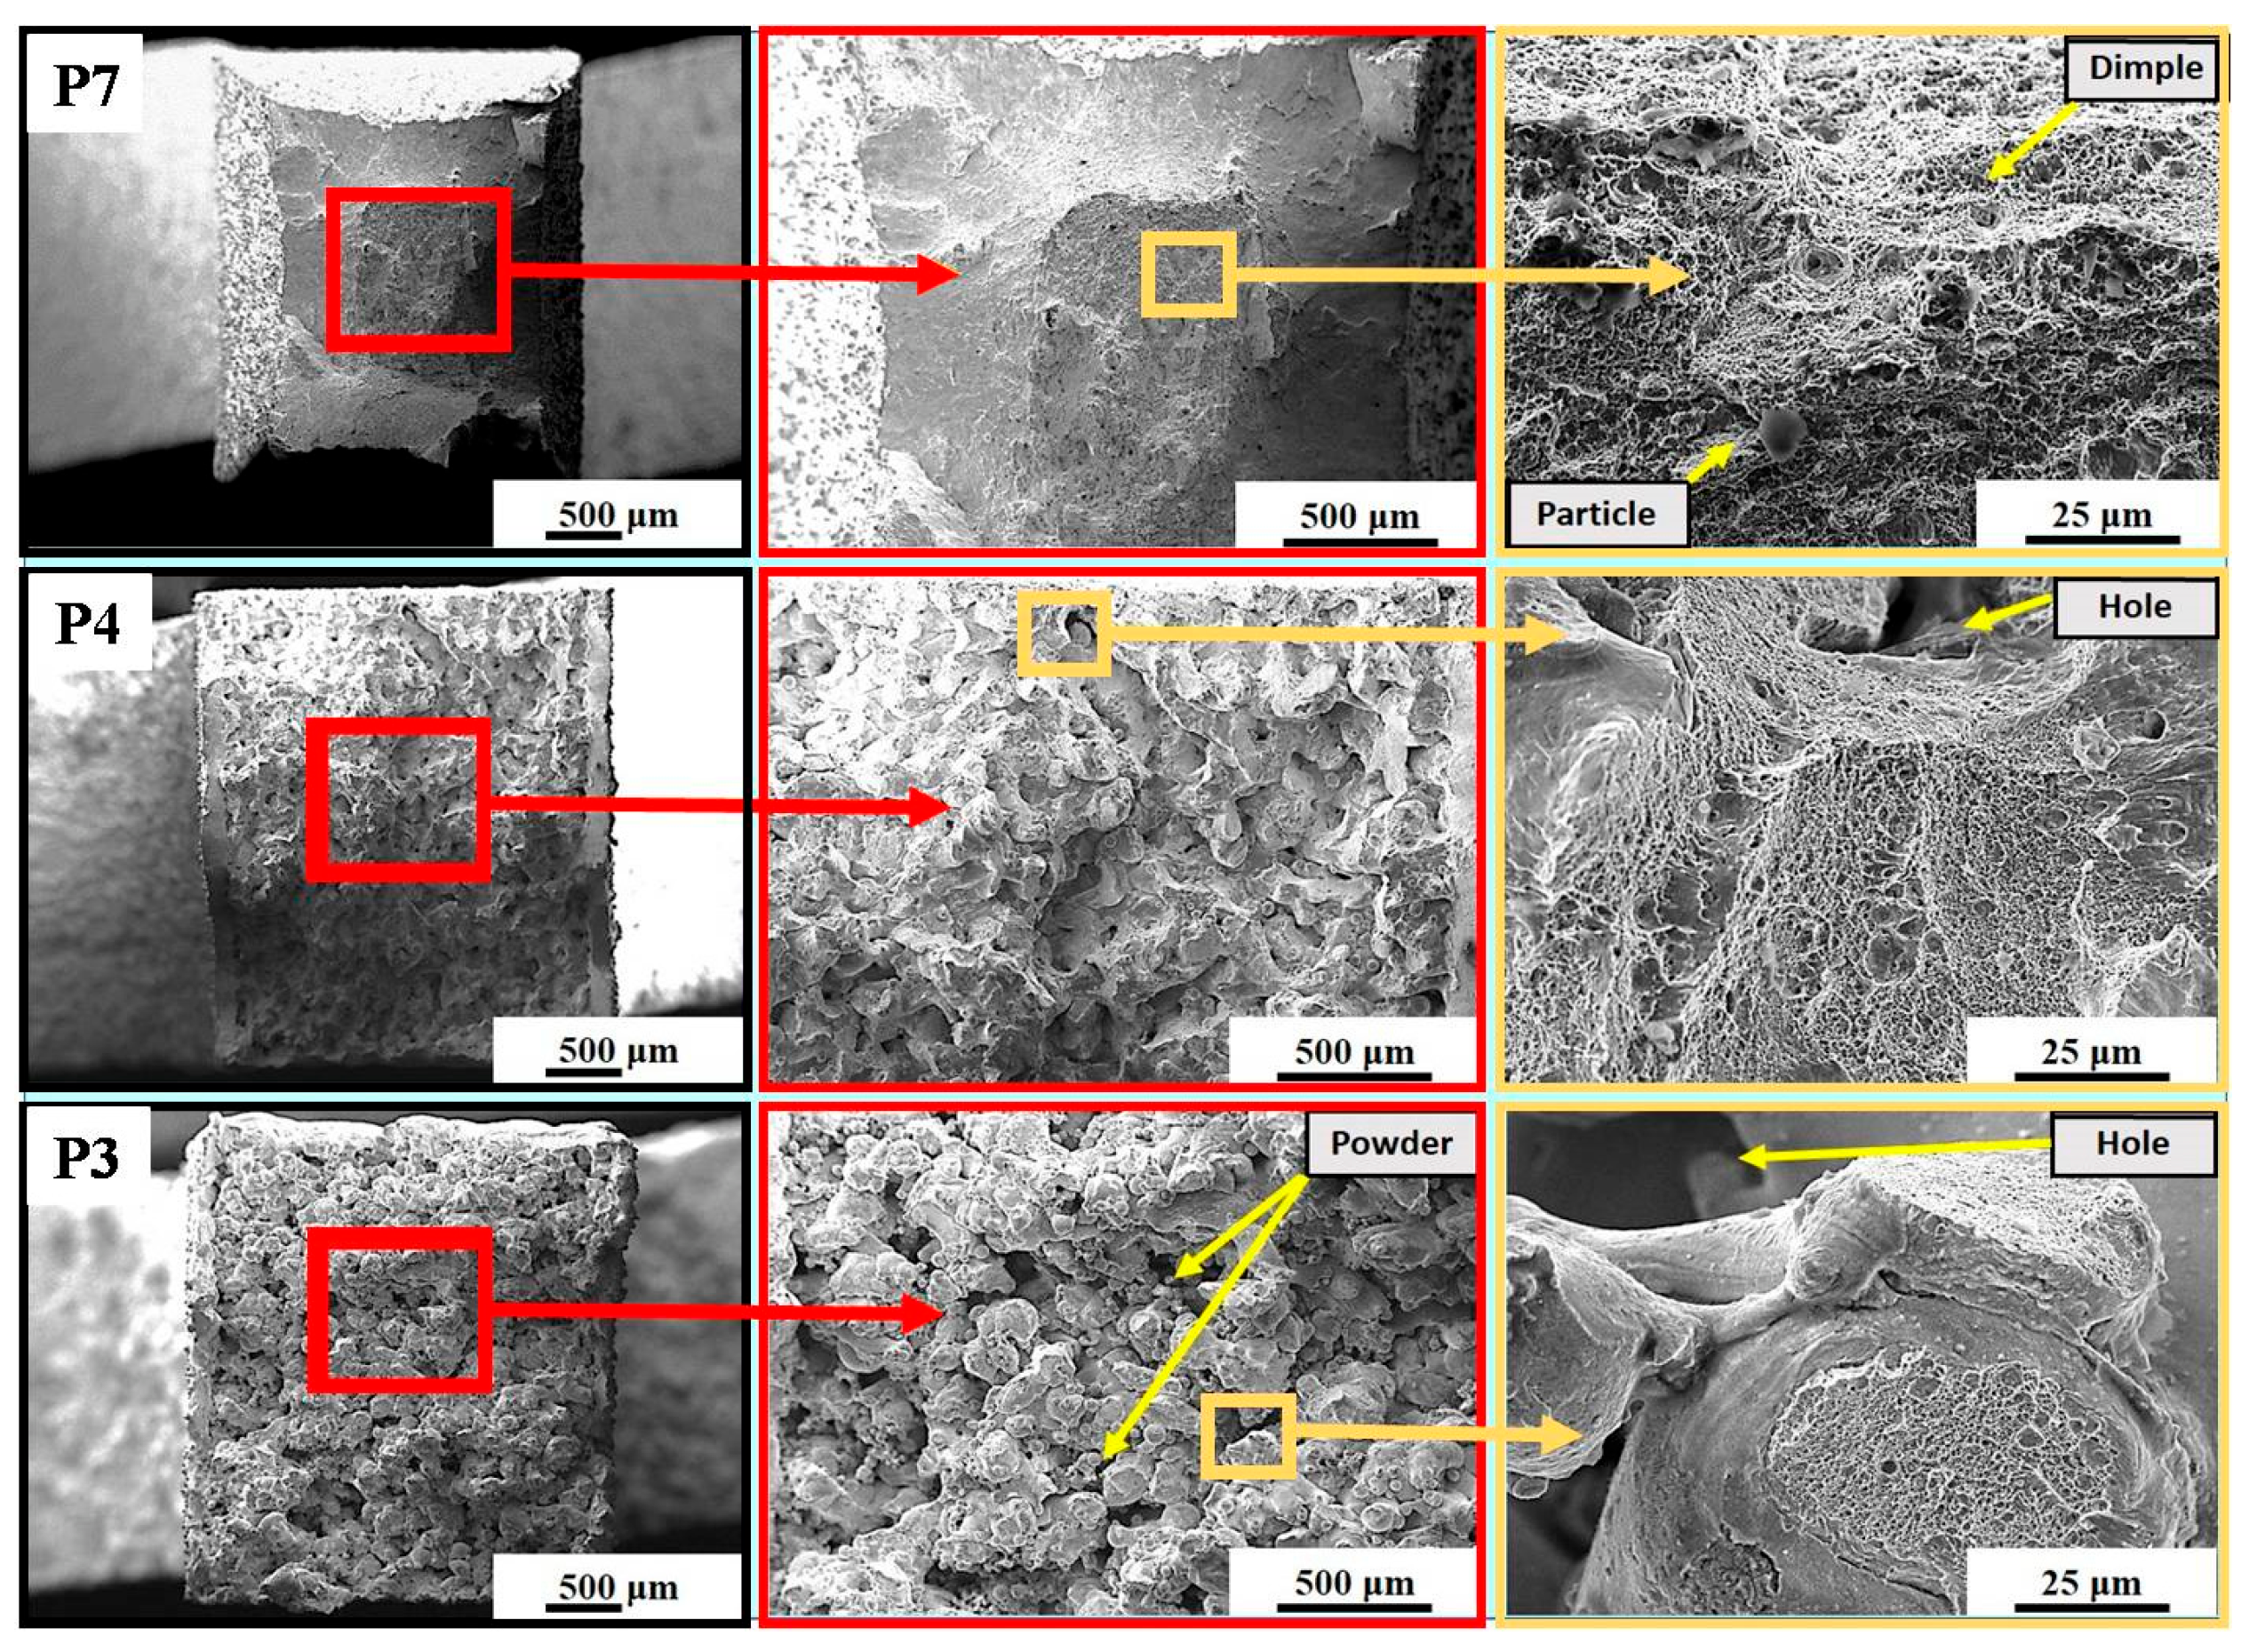
Figure 12 presents the fracture morphology of a specimen after a tensile test. In sample P7, characterized by a relative density of 99.87%, the observation reveals uniformly-sized dimples and particles that resulted in ductile fracture behavior. During the tensile test, the specimen experienced substantial plastic deformation, with micro-cavities present at the precipitates. Subsequently, these voids coalesced, leading to a fracture formation facilitated by rapidly increasing tears. Moreover, sample P4 exhibits the presence of microholes, which cause premature fractures compared with sample P7. The fracture morphology illustrates that the use of lower laser power did not completely melt the material, resulting in weak bonding and a brittle fracture. In sample P3, the presence of a balling effect and holes is evident, attributed to the brittle fracture characteristics. The visual examination indicates that all samples fractured at locations where defects were present. The occurrence of fragile fractures can be attributed to macro-voids generated during the low-energy density sintering process. Consequently, enhancing relative density and minimizing defects can significantly improve the tensile properties of fabricated components.

3.7. Optimization of Independent Variables and Validation of the Proposed Work

Numerical optimizations of the SLM fabrication process of 13Ni400 maraging steel were carried out through Design Expert software (version 13) by setting different goals. The desirability function is used in the software to complete numerical optimization. The process parameters of additively manufactured 13Ni400 maraging steel developed by the SLM process are optimized for achieving the minimum attainable surface roughness, maximum relative density, microhardness, and ultimate tensile strength. Thirty alternative solutions were predicted by design expert software, each with a different degree of independent variables. The approach with the highest desire value is selected as the ideal selective laser melting parameter condition [51]. The optimal conditions of input parameters along with the coded level are represented in Table 3.
From the table, the optimum parameters to build a specimen of 13Ni400 maraging steel grade by selective laser melting technique are found to be a scanning speed of 920 mm/s, hatch spacing of 0.09 mm, laser power of 311 W, and layer thickness of 0.02 mm. Once the optimized process conditions are identified, it is mandatory to validate them by conducting a confirmative test. Therefore, experiments are conducted again under optimized process parameters to authenticate the proposed work. When the predicted and experimental results are compared, only ~1.80% of the error exists. This validation encompassed critical material properties, including relative density, surface roughness, microhardness, and tensile strength. The predicted relative density of 99.95% closely aligned with the experimental value of 99.90%, resulting in a negligible percentage error of ~0.05% and an average error of ~1.80%. While surface roughness exhibited a slightly higher percentage error of ~3.51%, both microhardness and tensile strength displayed errors of ~2.27% and ~1.36%, respectively, indicating minor deviations from predicted values. Despite these variations, the overall agreement between predicted and experimental results underscores the efficacy of the optimization process. The high relative density achieved suggests robust material consolidation under the optimized SLM parameters, reinforcing the study’s credibility. A similar type of validation was reported by previous researchers [51].
The research explores the selective laser melting (SLM) process for 13Ni400 maraging steel, revealing insights into process parameter optimization and resulting material properties. Findings indicate that higher energy density and smaller layer thickness enhance relative density and microhardness, while increasing hatch spacing negatively impacts relative density. Optimal tensile strength is achieved at specific energy densities, underscoring the importance of parameter balance. Moreover, the microstructural analysis highlights the influence of cooling rate on crystal grain growth, with higher cooling rates resulting in smaller equiaxed crystals and enhanced material strength. The phase composition of the specimens remained consistent with the raw powder, with the martensite phase dominating and minimal traces of austenite. The comparison of experimental and predicted results validates the efficiency of the optimization process, reaffirming the study’s credibility. Overall, these findings contribute to the understanding and optimization of SLM parameters for producing high-performance metal components with superior material properties.

4. Conclusions

This research study investigated the additive manufacturing of 13Ni400 maraging steel using the selective laser melting (SLM) process. A newly developed gas-atomized powder was used for building specimens, and the process parameters were optimized using the Taguchi approach. The influence of laser power, scanning speed, layer thickness, and hatch spacing on relative density, surface roughness, microhardness, and tensile strength was analyzed. This work is helpful in selecting optimum process conditions to build defect-free SLM parts with maximum densification. The optimum input conditions for achieving parts with maximum densification and the highest attainable property while printing SLM of 13Ni400 are found to be scan speed 920 mm/s, hatch spacing of 0.09 mm, laser power of 311 W, and layer thickness of 0.02 mm. The optimum process conditions are verified by conducting a confirmative test with an average error of ~2.09%. The following are the important findings of the study:
  • It is observed that relative density and microhardness initially increase rapidly as energy density increases from 19 to 60 J/mm3 and then tend to remain constant when energy densities increase from 60 to 120 J/mm3. The ANOVA results revealed that the energy density, layer thickness, and hatch spacing significantly influence the relative density of additively manufactured 13Ni400 maraging steel parts. It was found that higher energy density and smaller layer thickness positively contribute to achieving higher relative density. Additionally, increasing hatch spacing negatively affects relative density. This finding is crucial for achieving denser and defect-free components using SLM, which is essential for applications requiring high material integrity.
  • The parts produced with an energy density greater than 162.50 J/mm3 have a relative density closer to 100% and a microhardness of 44 HRC. The ANOVA results demonstrated the significance of laser power and scan speed in determining the microhardness of the additively manufactured parts. Increasing laser power elevated the microhardness, whereas higher scan speeds had the opposite effect. Properly balancing these parameters is vital to achieving optimal microhardness and ensuring the components exhibit superior mechanical strength and wear resistance.
  • The phase compositions of the specimen and powder are nearly identical. The martensite phase largely dominates the phase compositions of selectively laser-melted 13Ni400 samples, with very few traces of austenite. The austenite (γ) phase in the powder pattern (111) is unseen after forming in SLM. SLM produces components with a fine cellular structure and coarse granules. The crystal grain growth is reduced by the higher cooling rate, resulting in smaller crystal grains. The samples that possess a higher cooling rate result in a higher number of equiaxed crystals.
  • The EBSD study of 13Ni400-grade maraging steel reveals significant differences in microstructure and grain boundaries between samples P7 and P4. Sample P7 exhibits a prevalence of fine grains with dominant orientations along the (111) and (101) planes, contributing to a more uniform stress distribution and improved mechanical performance. The smaller grain size and higher percentage of equiaxed grains in sample P7 result in enhanced material strength and hardness. Additionally, the presence of a higher fraction of high-angle grain boundaries in sample P7 impedes grain growth during processing and further strengthens the material.
Further experimental research in selective laser melting (SLM) for 13Ni400 maraging steel could delve into exploring additional process parameters like post-processing methods for enhancing properties, assessing scalability for industrial use, and exploring potential applications in the aerospace, automotive, and medical industries. Addressing these aspects can advance understanding and utilization of SLM for producing high-performance metal components.

Author Contributions

V.V.P.: Conceptualization, Investigation, Methodology, Writing—original draft. C.P.M.: Methodology, Resources, Funding acquisition. K.G.P.: Conceptualization, Methodology, Resources, Writing—review and editing, Supervision. All authors have read and agreed to the published version of the manuscript.

Funding

The authors thank Vellore Institute of Technology, Vellore, for providing a SEED grant under file number SG20210144 to carry out this research work.

Data Availability Statement

Data supporting this study are included within the article.

Acknowledgments

The authors are thankful to the Vellore Institute of Technology, Vellore, India, for providing financial support to carry out this research work. The authors are also thankful to TALTECH University, Tallinn, Estonia, for allowing us to perform experiments at their laboratories.

Conflicts of Interest

The authors declare no conflicts of interest.

References

  1. Floreen, S. The physical metallurgy of maraging steels. Metall. Rev. 1968, 13, 115–128. [Google Scholar] [CrossRef]
  2. Prashanth, K.G.; Scudino, S.; Klauss, H.J.; Surreddi, K.B.; Löber, L.; Wang, Z.; Chaubey, A.K.; Kühn, U.; Eckert, J. Microstructure and Mechanical Properties of Al-12Si Produced by Selective Laser Melting: Effect of Heat Treatment. Mater. Sci. Eng. A 2014, 590, 153–160. [Google Scholar] [CrossRef]
  3. Jiménez, M.; Romero, L.; Domínguez, I.A.; Espinosa, M.D.M.; Domínguez, M. Additive Manufacturing Technologies: An Overview about 3D Printing Methods and Future Prospects. Complexity 2019, 2019, 9656938. [Google Scholar] [CrossRef]
  4. Habiby, F.; ul Haq, A.; Khan, A.Q. The Properties and Applications of 18% Nickel Maragi Ng Steels. Mater. Technol. 1994, 9, 246–252. [Google Scholar] [CrossRef]
  5. Lang, F.H.; Kenyon, N. Welding of Maraging Steels. Weld. Res. Counc. Bull. 1971, 11, 216–268. [Google Scholar]
  6. Zhao, C.; Wang, Z.; Li, D.; Kollo, L.; Luo, Z.; Zhang, W.; Prashanth, K.G. Cu-Ni-Sn Alloy Fabricated by Melt Spinning and Selective Laser Melting: A Comparative Study on the Microstructure and Formation Kinetics. J. Mater. Res. Technol. 2020, 9, 13097–13105. [Google Scholar] [CrossRef]
  7. Prashanth, K.; Scudino, S.; Chatterjee, R.; Salman, O.; Eckert, J. Additive Manufacturing: Reproducibility of Metallic Parts. Technologies 2017, 5, 8. [Google Scholar] [CrossRef]
  8. Salman, O.O.; Gammer, C.; Eckert, J.; Salih, M.Z.; Abdulsalam, E.H.; Prashanth, K.G.; Scudino, S. Selective Laser Melting of 316L Stainless Steel: Influence of TiB2 Addition on Microstructure and Mechanical Properties. Mater Today Commun. 2019, 21, 100615. [Google Scholar] [CrossRef]
  9. Shin, W.S.; Son, B.; Song, W.; Sohn, H.; Jang, H.; Kim, Y.J.; Park, C. Heat Treatment Effect on the Microstructure, Mechanical Properties, and Wear Behaviors of Stainless Steel 316L Prepared via Selective Laser Melting. Mater. Sci. Eng. A 2021, 806, 140805. [Google Scholar] [CrossRef]
  10. Liang, L.; Xu, M.; Chen, Y.; Zhang, T.; Tong, W.; Liu, H.; Wang, H.; Li, H. Effect of Welding Thermal Treatment on the Microstructure and Mechanical Properties of Nickel-Based Superalloy Fabricated by Selective Laser Melting. Mater. Sci. Eng. A 2021, 819, 141507. [Google Scholar] [CrossRef]
  11. Xu, G.G.; Jiang, W.G.; Sun, Y.Y.; Qin, Q.H.; Li, Q. Particle-Scale Computational Fluid Dynamics Simulation on Selective Parallel Dual-Laser Melting of Nickel-Based Superalloy. J. Manuf. Process 2022, 73, 197–206. [Google Scholar] [CrossRef]
  12. Prashanth, K.G.; Damodaram, R.; Maity, T.; Wang, P.; Eckert, J. Friction Welding of Selective Laser Melted Ti6Al4V Parts. Mater. Sci. Eng. A 2017, 704, 66–71. [Google Scholar] [CrossRef]
  13. Kumar, D.; Shankar, G.; Prashanth, K.G.; Suwas, S. Control of Texture and Microstructure in Additive Manufacturing of Stainless Steel 316 L. J. Alloys Compd. 2023, 976, 173040. [Google Scholar] [CrossRef]
  14. Chen, H.; Kosiba, K.; Suryanarayana, C.; Lu, T.; Liu, Y.; Wang, Y.; Prashanth, K.G. Feedstock Preparation, Microstructures and Mechanical Properties for Laser-Based Additive Manufacturing of Steel Matrix Composites. Int. Mater. Rev. 2023, 68, 1192–1244. [Google Scholar] [CrossRef]
  15. Jagadeesh, B.; Duraiselvam, M.; Prashanth, K.G. Deformation Behavior of Metallic Lattice Structures with Symmetrical Gradients of Porosity Manufactured by Metal Additive Manufacturing. Vacuum 2023, 211, 111955. [Google Scholar] [CrossRef]
  16. DebRoy, T.; Wei, H.L.; Zuback, J.S.; Mukherjee, T.; Elmer, J.W.; Milewski, J.O.; Beese, A.M.; Wilson-Heid, A.; De, A.; Zhang, W. Additive Manufacturing of Metallic Components—Process, Structure and Properties. Prog. Mater. Sci. 2018, 92, 112–224. [Google Scholar] [CrossRef]
  17. Suryawanshi, J.; Prashanth, K.G.; Ramamurty, U. Mechanical Behavior of Selective Laser Melted 316L Stainless Steel. Mater. Sci. Eng. A 2017, 696, 113–121. [Google Scholar] [CrossRef]
  18. Suryawanshi, J.; Prashanth, K.G.; Ramamurty, U. Tensile, Fracture, and Fatigue Crack Growth Properties of a 3D Printed Maraging Steel through Selective Laser Melting. J. Alloys Compd. 2017, 725, 355–364. [Google Scholar] [CrossRef]
  19. Sun, Z.; Tan, X.; Tor, S.B.; Yeong, W.Y. Corrigendum: “Selective Laser Melting of Stainless Steel 316L with Low Porosity and High Build Rates” (Materials and Design (2016) 104 (197–204) (S0264127516306372) (10.1016/j.Matdes.2016.05.035)). Mater. Des. 2017, 126, 359. [Google Scholar] [CrossRef]
  20. Alsalla, H.; Hao, L.; Smith, C. Fracture Toughness and Tensile Strength of 316L Stainless Steel Cellular Lattice Structures Manufactured Using the Selective Laser Melting Technique. Mater. Sci. Eng. A 2016, 669, 1–6. [Google Scholar] [CrossRef]
  21. Mao, Z.; Lu, X.; Yang, H.; Niu, X.; Zhang, L.; Xie, X. Processing Optimization, Microstructure, Mechanical Properties and Nanoprecipitation Behavior of 18Ni300 Maraging Steel in Selective Laser Melting. Mater. Sci. Eng. A 2022, 830, 142334. [Google Scholar] [CrossRef]
  22. Wang, Q.; Zhang, Z.; Tong, X.; Dong, S.; Cui, Z.; Wang, X.; Ren, L. Effects of Process Parameters on the Microstructure and Mechanical Properties of 24CrNiMo Steel Fabricated by Selective Laser Melting. Opt. Laser Technol. 2020, 128, 106262. [Google Scholar] [CrossRef]
  23. Tang, X.; Zhang, S.; Zhang, C.; Chen, J.; Zhang, J.; Liu, Y. Optimization of Laser Energy Density and Scanning Strategy on the Forming Quality of 24CrNiMo Low Alloy Steel Manufactured by SLM. Mater. Charact. 2020, 170, 110718. [Google Scholar] [CrossRef]
  24. Cheng, Z.; Sun, S.; Du, X.; Tang, Q.; Shi, J.; Liu, X.; Jianrong, Q. Microstructural Evolution of a FeCo15Cr14Ni4Mo3 Maraging Steel with High Ductility Prepared by Selective Laser Melting. Mater. Today Commun. 2022, 31, 103243. [Google Scholar] [CrossRef]
  25. Vishwakarma, J.; Chattopadhyay, K.; Santhi Srinivas, N.C. Effect of Build Orientation on Microstructure and Tensile Behaviour of Selectively Laser Melted M300 Maraging Steel. Mater. Sci. Eng. A 2020, 798, 140130. [Google Scholar] [CrossRef]
  26. Bai, Y.; Zhao, C.; Zhang, Y.; Wang, H. Microstructure and Mechanical Properties of Additively Manufactured Multi-Material Component with Maraging Steel on CrMn Steel. Mater. Sci. Eng. A 2021, 802, 140630. [Google Scholar] [CrossRef]
  27. Gao, P.; Jing, G.; Lan, X.; Li, S.; Zhou, Y.; Wang, Y.; Yang, H.; Wei, K.; Wang, Z. Effect of Heat Treatment on Microstructure and Mechanical Properties of Fe–Cr–Ni–Co–Mo Maraging Stainless Steel Produced by Selective Laser Melting. Mater. Sci. Eng. A 2021, 814, 141149. [Google Scholar] [CrossRef]
  28. Contuzzi, N.; Campanelli, S.; Casalino, G.; Ludovico, A.D. Effect of Heat Treatment on Selective Laser Melted Steel Parts. In Proceedings of the 21st International DAAAM Symposium, Zadar, Croatia, 20–23 October 2010; Volume 21, pp. 1451–1452. [Google Scholar]
  29. Fel’dgandler, E.G.; Savkina, L.Y. Effect of Alloying on Hardening of Martensitic Stainless Steels of the Fe-Cr-Ni and Fe-Cr-Co Systems. Met. Sci. Heat Treat. 1975, 17, 758–762. [Google Scholar] [CrossRef]
  30. Michaud, P.; Delagnes, D.; Lamesle, P.; Mathon, M.H.; Levaillant, C. The Effect of the Addition of Alloying Elements on Carbide Precipitation and Mechanical Properties in 5% Chromium Martensitic Steels. Acta Mater. 2007, 55, 4877–4889. [Google Scholar] [CrossRef]
  31. Schnitzer, R.; Schober, M.; Zinner, S.; Leitner, H. Effect of Cu on the Evolution of Precipitation in an Fe-Cr-Ni-Al-Ti Maraging Steel. Acta Mater. 2010, 58, 3733–3741. [Google Scholar] [CrossRef]
  32. Zeisl, S.; Lassnig, A.; Hohenwarter, A.; Mendez-Martin, F. Precipitation Behavior of a Co-Free Fe-Ni-Cr-Mo-Ti-Al Maraging Steel after Severe Plastic Deformation. Mater. Sci. Eng. A 2022, 833, 142416. [Google Scholar] [CrossRef]
  33. Tan, C.; Zhou, K.; Ma, W.; Zhang, P.; Liu, M.; Kuang, T. Microstructural Evolution, Nanoprecipitation Behavior and Mechanical Properties of Selective Laser Melted High-Performance Grade 300 Maraging Steel. Mater. Des. 2017, 134, 23–34. [Google Scholar] [CrossRef]
  34. de Souza, A.F.; Al-Rubaie, K.S.; Marques, S.; Zluhan, B.; Santos, E.C. Effect of Laser Speed, Layer Thickness, and Part Position on the Mechanical Properties of Maraging 300 Parts Manufactured by Selective Laser Melting. Mater. Sci. Eng. A 2019, 767, 138425. [Google Scholar] [CrossRef]
  35. Patil, V.V.; Prashanth, K.G.; Mohanty, C.P. Spark Plasma Sintering of 13Ni-400 Maraging Steel: Enhancement of Mechanical Properties through Surface Modification. J. Alloys Compd. 2023, 960, 170734. [Google Scholar] [CrossRef]
  36. Tan, C.; Zhou, K.; Kuang, M.; Ma, W.; Kuang, T. Microstructural Characterization and Properties of Selective Laser Melted Maraging Steel with Different Build Directions. Sci. Technol. Adv. Mater. 2018, 19, 746–758. [Google Scholar] [CrossRef]
  37. Conde, F.F.; Avila, J.A.; Oliveira, J.P.; Schell, N.; Oliveira, M.F.; Escobar, J.D. Effect of the As-Built Microstructure on the Martensite to Austenite Transformation in a 18Ni Maraging Steel after Laser-Based Powder Bed Fusion. Addit. Manuf. 2021, 46, 102122. [Google Scholar] [CrossRef]
  38. Ferreira, D.F.S.; Miranda, G.; Oliveira, F.J.; Oliveira, J.M. Predictive Models for an Optimized Fabrication of 18Ni300 Maraging Steel for Moulding and Tooling by Selective Laser Melting. J. Manuf. Process 2021, 70, 46–54. [Google Scholar] [CrossRef]
  39. Wang, Y.; Luo, L.; Liu, T.; Wang, B.; Luo, L.; Zhao, J.; Wang, L.; Su, Y.; Guo, J.; Fu, H. Tuning Process Parameters to Optimize Microstructure and Mechanical Properties of Novel Maraging Steel Fabricated by Selective Laser Melting. Mater. Sci. Eng. A 2021, 823, 141740. [Google Scholar] [CrossRef]
  40. Casalino, G.; Campanelli, S.L.; Contuzzi, N.; Ludovico, A.D. Experimental Investigation and Statistical Optimisation of the Selective Laser Melting Process of a Maraging Steel. Opt. Laser Technol. 2015, 65, 151–158. [Google Scholar] [CrossRef]
  41. Mutua, J.; Nakata, S.; Onda, T.; Chen, Z.C. Optimization of Selective Laser Melting Parameters and Influence of Post Heat Treatment on Microstructure and Mechanical Properties of Maraging Steel. Mater. Des. 2018, 139, 486–497. [Google Scholar] [CrossRef]
  42. Yao, Y.; Huang, Y.; Chen, B.; Tan, C.; Su, Y.; Feng, J. Influence of Processing Parameters and Heat Treatment on the Mechanical Properties of 18Ni300 Manufactured by Laser Based Directed Energy Deposition. Opt. Laser Technol. 2018, 105, 171–179. [Google Scholar] [CrossRef]
  43. da Fonseca, D.P.M.; Melo Feitosa, A.L.; de Carvalho, L.G.; Plaut, R.L.; Padilha, A.F. A Short Review on Ultra-High-Strength Maraging Steels and Future Perspectives. Mater. Res. 2021, 24. [Google Scholar] [CrossRef]
  44. Mehmood, T.; Ahmed, A.; Ahmad, A.; Ahmad, M.S.; Sandhu, M.A. Optimization of Mixed Surfactants-Based β-Carotene Nanoemulsions Using Response Surface Methodology: An Ultrasonic Homogenization Approach. Food Chem. 2018, 253, 179–184. [Google Scholar] [CrossRef]
  45. Mehmood, T. Optimization of the Canola Oil Based Vitamin E Nanoemulsions Stabilized by Food Grade Mixed Surfactants Using Response Surface Methodology. Food Chem. 2015, 183, 1–7. [Google Scholar] [CrossRef]
  46. Sun, J.; Yang, Y.; Wang, D. Parametric Optimization of Selective Laser Melting for Forming Ti6Al4V Samples by Taguchi Method. Opt. Laser Technol. 2013, 49, 118–124. [Google Scholar] [CrossRef]
  47. Yang, D.; Li, X.; He, D.; Nie, Z.; Huang, H. Optimization of Weld Bead Geometry in Laser Welding with Filler Wire Process Using Taguchi’s Approach. Opt. Laser Technol. 2012, 44, 2020–2025. [Google Scholar] [CrossRef]
  48. Benyounis, K.Y.; Olabi, A.G.; Hashmi, M.S.J. Multi-Response Optimization of CO2 Laser-Welding Process of Austenitic Stainless Steel. Opt. Laser Technol. 2008, 40, 76–87. [Google Scholar] [CrossRef]
  49. Li, C.H.; Tsai, M.J.; Yang, C.D. Study of Optimal Laser Parameters for Cutting QFN Packages by Taguchi’s Matrix Method. Opt. Laser Technol. 2007, 39, 786–795. [Google Scholar] [CrossRef]
  50. Averardi, A.; Cola, C.; Zeltmann, S.E.; Gupta, N. Effect of Particle Size Distribution on the Packing of Powder Beds: A Critical Discussion Relevant to Additive Manufacturing. Mater. Today Commun. 2020, 24, 100964. [Google Scholar] [CrossRef]
  51. Patil, V.V.; Mohanty, C.P.; Prashanth, K.G. Selective Laser Melting of a Novel 13Ni400 Maraging Steel: Material Characterization and Process Optimization. J. Mater. Res. Technol. 2023, 27, 3979–3995. [Google Scholar] [CrossRef]
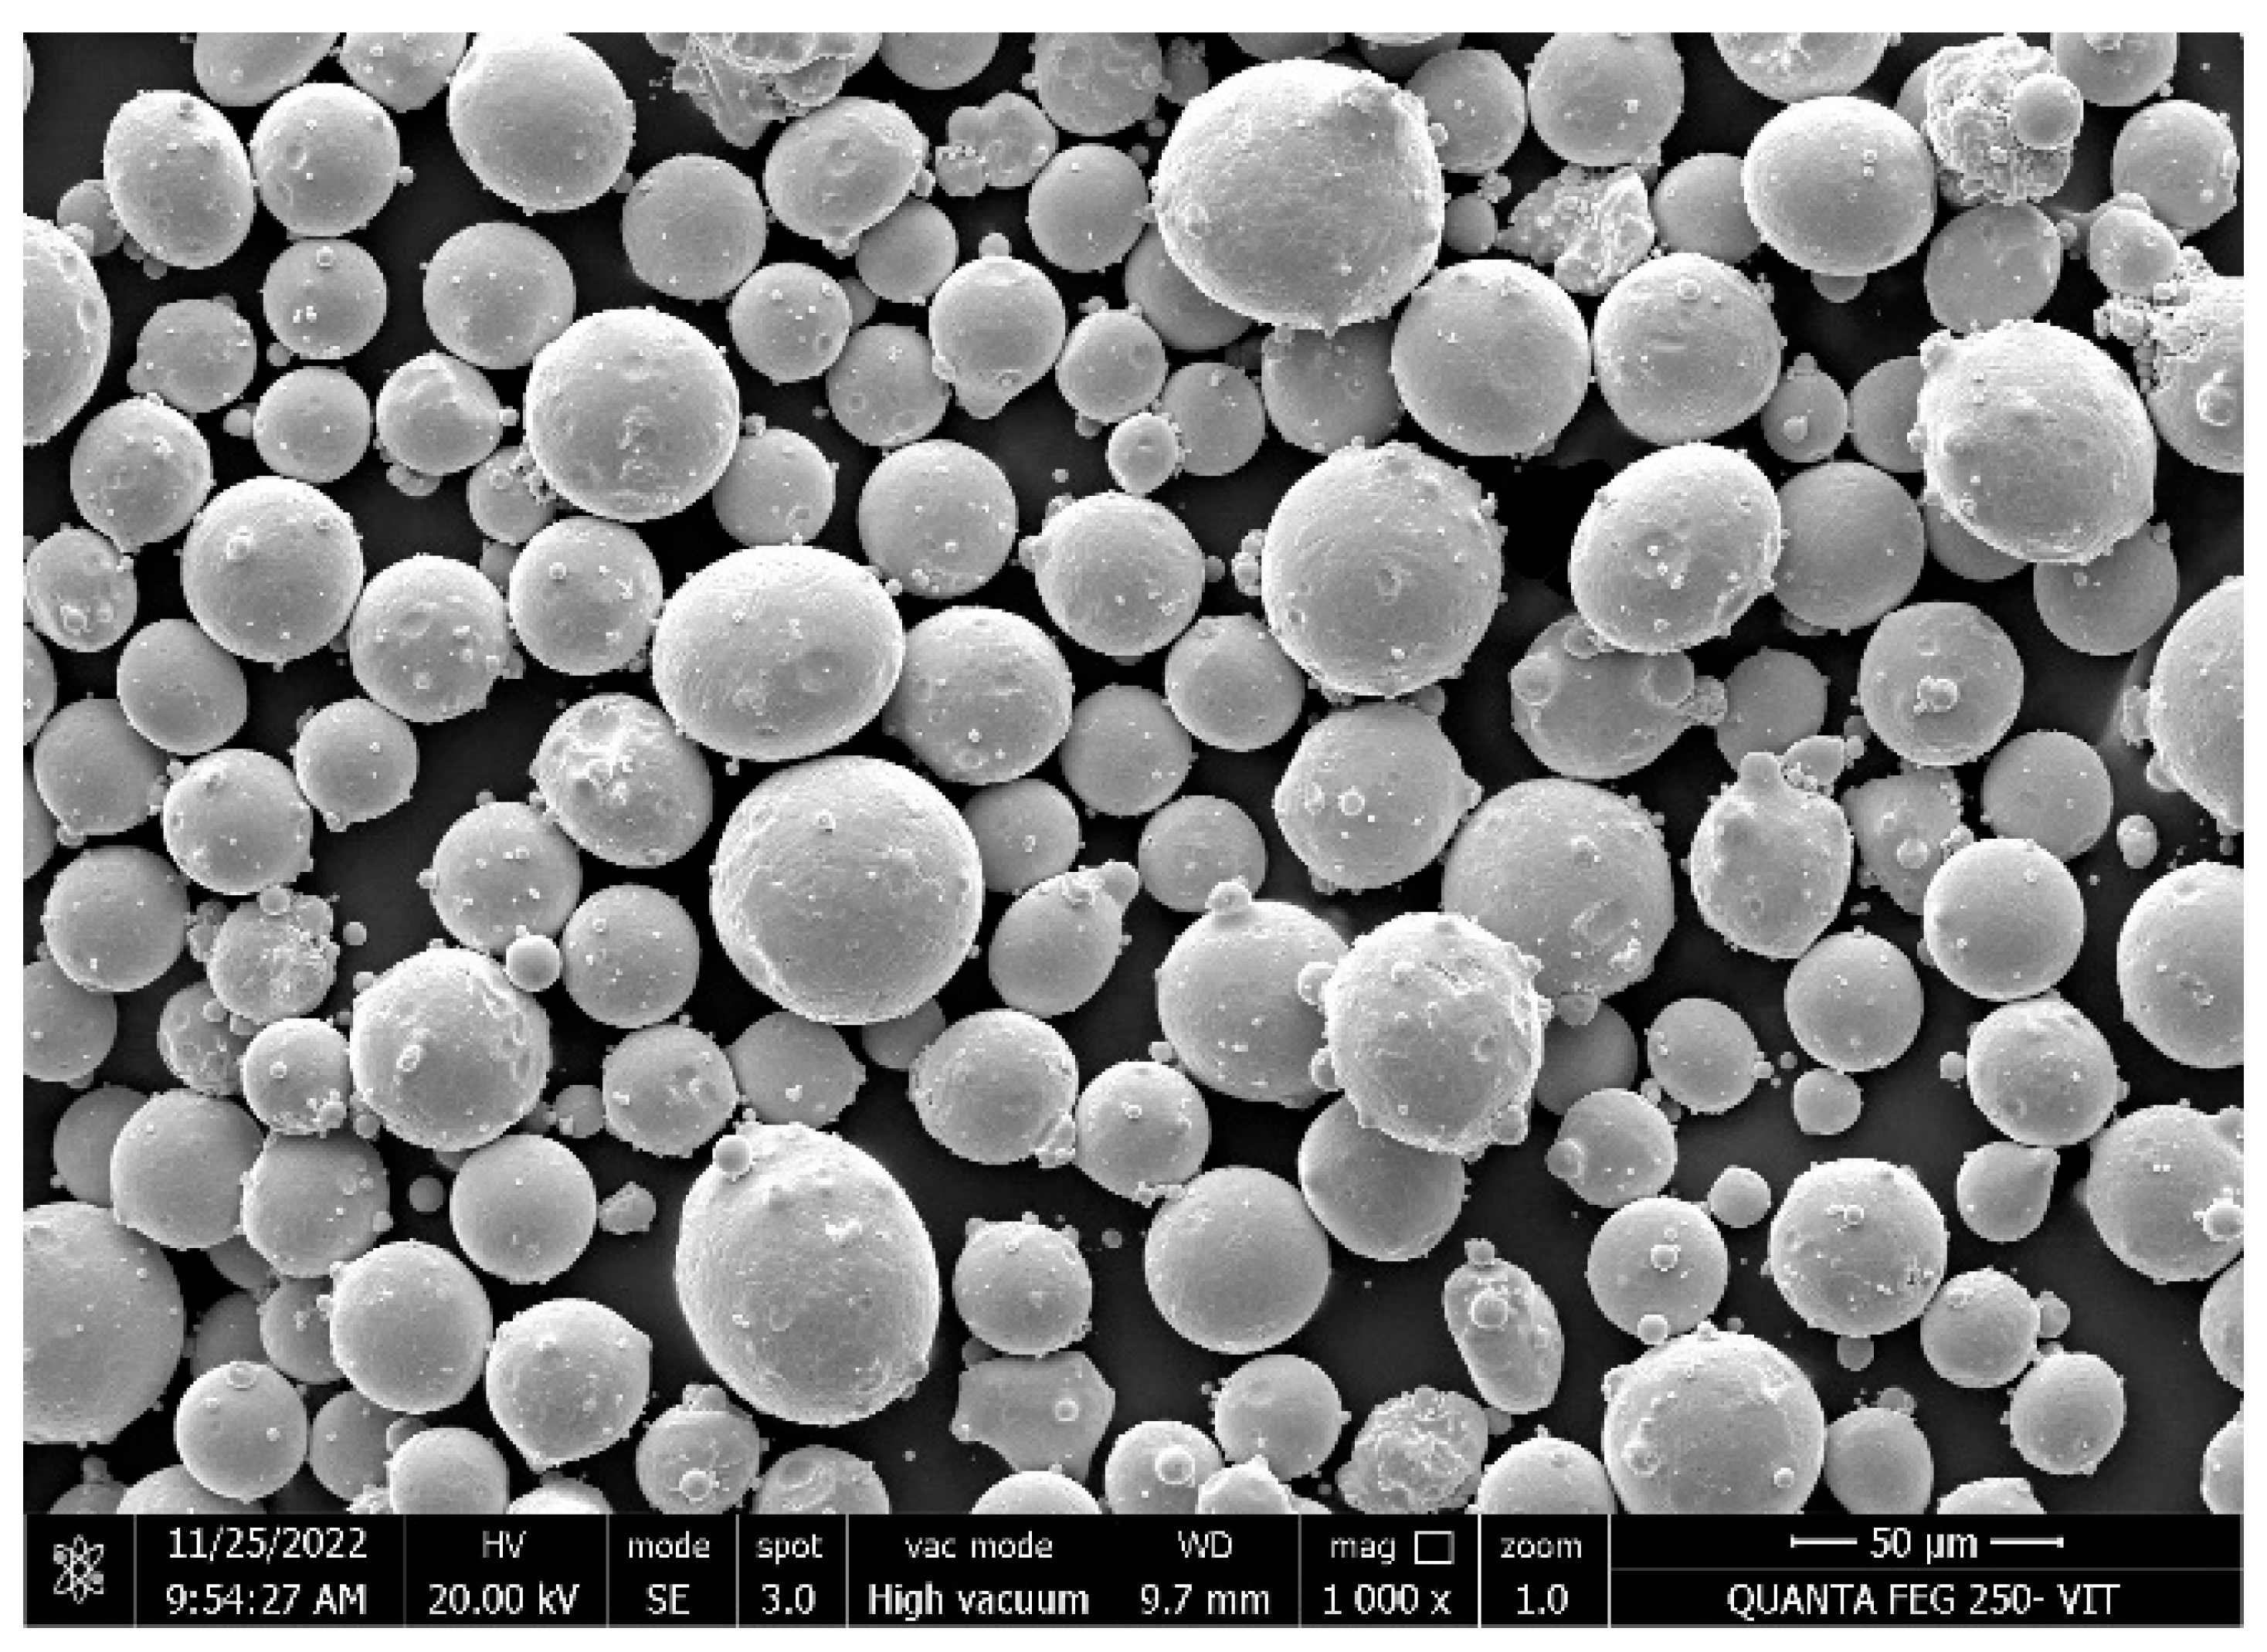
Figure 1. SEM image of 13Ni-400 maraging steel.
Jmmp 08 00052 g001
Figure 2. Schematics and photo of the tensile specimen fabricated using the SLM process and used in the present study.
Jmmp 08 00052 g002
Figure 3. Plot showing relative density variation with respect to energy density for 13Ni400 fabricated by SLM.
Jmmp 08 00052 g003
Figure 4. Plot showing surface roughness variation with respect to energy density for 13Ni400 fabricated by SLM.
Jmmp 08 00052 g004
Figure 5. Optical microscopic images of samples for different relative densities with different cross section planes (ac) build plane for samples P7, P4, and P3, respectively, and (df) lateral plane for samples P7, P4, and P3, respectively.
Jmmp 08 00052 g005
Figure 6. SEM micrographs of samples for different relative densities at different magnifications (ac) for samples P7, (df) for sample P4, and (gi) for sample P3, respectively.
Jmmp 08 00052 g006
Figure 7. Electron back scattered diffraction analysis (Image quality, Grain size and Misorientation) for (ac) as built sample P7 and (df) as built sample P4.
Jmmp 08 00052 g007
Figure 8. XRD patterns of the 13Ni400 powder and as-built samples with combinations of different process parameters.
Jmmp 08 00052 g008
Figure 9. Plot showing microhardness variation with respect to energy density for 13Ni400 fabricated by SLM.
Jmmp 08 00052 g009
Figure 10. Comparative chart of microhardness of additively manufactured different grades of maraging steel.
Jmmp 08 00052 g010
Figure 11. (a) Stress-strain curves for different densities; (b) a comparative chart of ultimate tensile strength of additively manufactured different grades of maraging steel; (c) a plot showing variation of yield strength with respect to energy density; and (d) a plot showing variation of ductility with respect to energy density.
Jmmp 08 00052 g011
Figure 12. Fracture morphologies of tensile specimens for different relative densities.
Jmmp 08 00052 g012
Table 1. Range of process parameters used for optimization using Taguchi method.
ParametersLevels
−101
Laser Power (W)180285390
Layer Thickness (mm)0.020.040.06
Hatch Spacing (mm)0.080.100.12
Scanning Speed (mm/s)80010001200
Table 2. Experimental design matrix of the parameters designed by Taguchi methodology with obtained performance measures.
Run Input ParametersEnergy
Density
(J/mm3)
Response Values
Part
No.
Laser Power (W)Layer Thickness (mm)Hatch Spacing (mm)Scan Speed (mm/s)Relative Density (%)Ultimate Tensile Strength (MPa)Microhardness (HRC)Surface Roughness (μm)
1P11800.020.08800140.6399.561269 ± 15412.41
2P21800.040.1100045.0094.371051 ± 21296.03
3P31800.060.12120020.8388.65863 ± 22258.37
4P42850.020.11200118.7599.411258 ± 30402.64
5P52850.040.1280074.2298.151162 ± 27374.23
6P62850.060.08100059.3897.561127 ± 14344.97
7P73900.020.121000162.5099.871308 ± 18442.31
8P83900.040.081200101.5699.251236 ± 22393.29
9P93900.060.180081.2598.421189 ± 12363.64
Table 3. At optimum circumstances, the experimental and anticipated values of response.
Optimum CircumstancesCoded LevelActual Level
Scan speed (mm/s)0.6920
Hatch spacing (mm)10.09
Laser power (W)0.1333311
Layer thickness (mm)−10.02
ResponsePredicted ValuesExperimental Values% ErrorAverage Error (%)
Relative density (%)99.9599.900.05001.7983
Surface roughness (mm)2.202.283.5088
Microhardness (HRC)45442.2728
Tensile strength (MPa)134013221.3616
Disclaimer/Publisher’s Note: The statements, opinions and data contained in all publications are solely those of the individual author(s) and contributor(s) and not of MDPI and/or the editor(s). MDPI and/or the editor(s) disclaim responsibility for any injury to people or property resulting from any ideas, methods, instructions or products referred to in the content.